north carolina energy policy council · nucor corporation july 15, 2015 cape hatteras clt triad rdu...
TRANSCRIPT
NORTH CAROLINA
ENERGY POLICY COUNCIL
July 15, 2015
John Evans Deputy Secretary
NCDENR
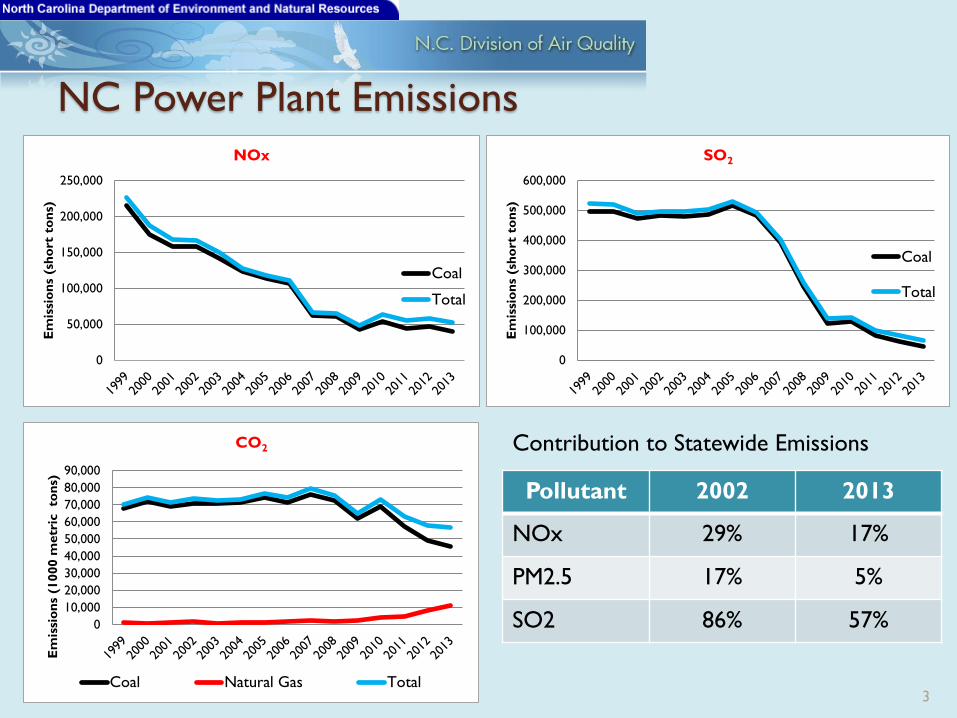
NC Power Plant Emissions
3
0
100,000
200,000
300,000
400,000
500,000
600,000
Em
issi
on
s (s
ho
rt t
on
s)
SO2
Coal
Total
0
50,000
100,000
150,000
200,000
250,000
Em
issi
on
s (s
ho
rt t
on
s)
NOx
Coal
Total
0
10,000
20,000
30,000
40,000
50,000
60,000
70,000
80,000
90,000
Em
issi
on
s (1
000 m
etr
ic to
ns)
CO2
Coal Natural Gas Total
Pollutant 2002 2013
NOx 29% 17%
PM2.5 17% 5%
SO2 86% 57%
Contribution to Statewide Emissions
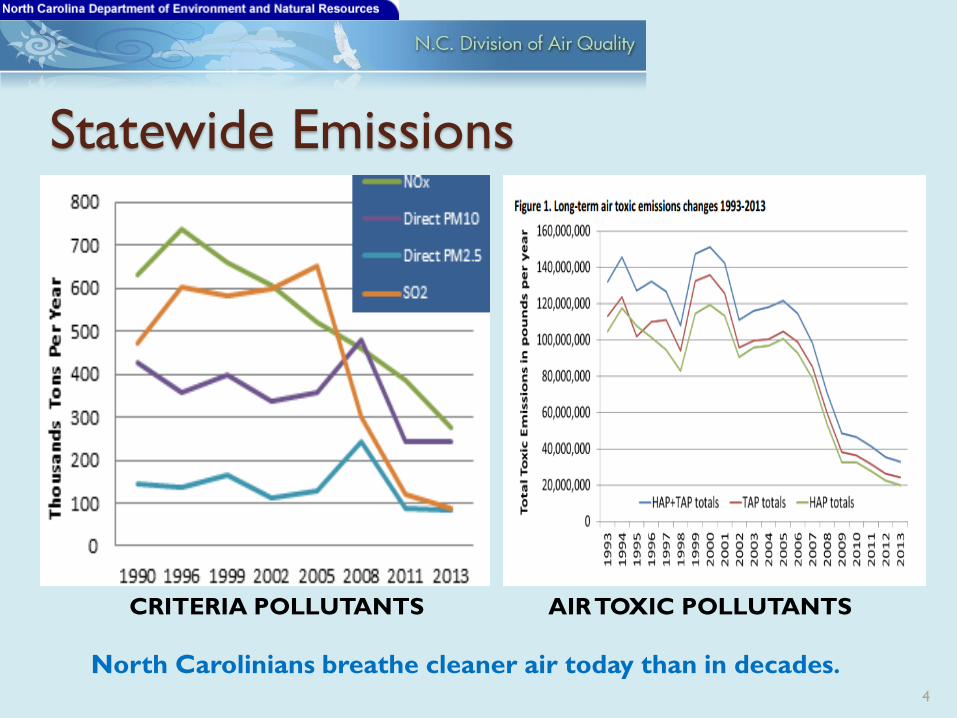
Statewide Emissions
4
CRITERIA POLLUTANTS AIR TOXIC POLLUTANTS
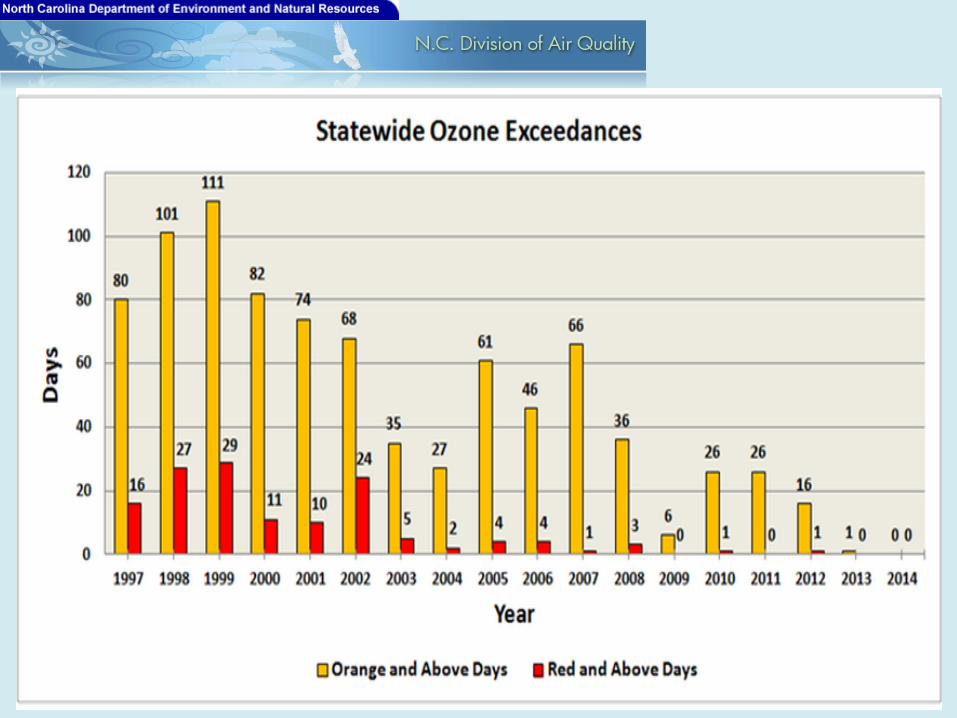
North Carolinians breathe cleaner air today than in decades.
5
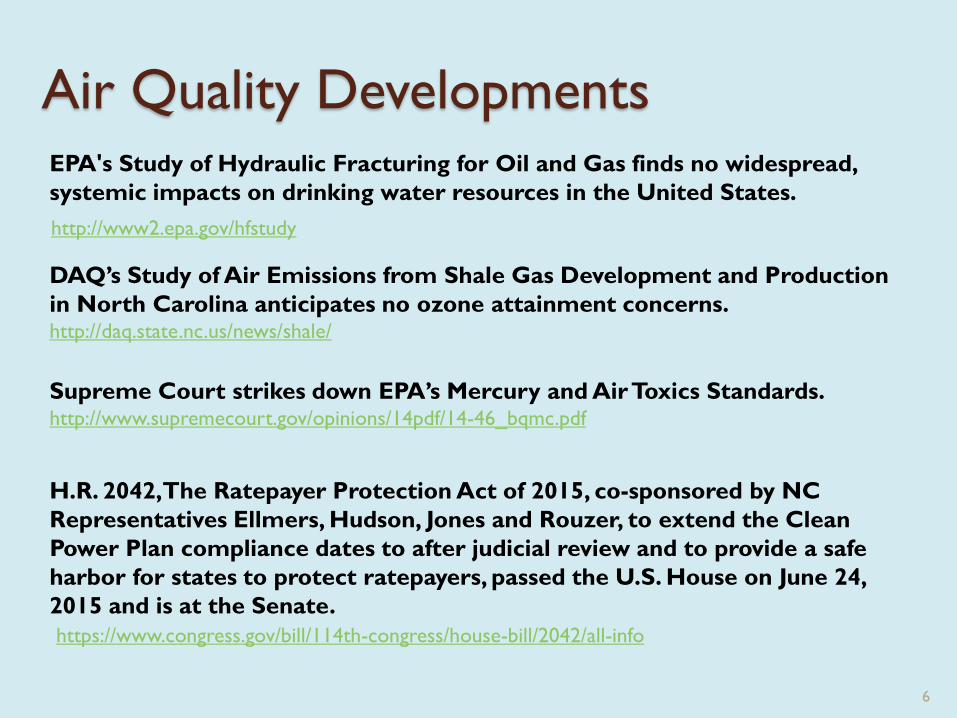
Air Quality Developments
6
http://www2.epa.gov/hfstudy
EPA's Study of Hydraulic Fracturing for Oil and Gas finds no widespread,
systemic impacts on drinking water resources in the United States.
DAQ’s Study of Air Emissions from Shale Gas Development and Production
in North Carolina anticipates no ozone attainment concerns. http://daq.state.nc.us/news/shale/
Supreme Court strikes down EPA’s Mercury and Air Toxics Standards. http://www.supremecourt.gov/opinions/14pdf/14-46_bqmc.pdf
H.R. 2042, The Ratepayer Protection Act of 2015, co-sponsored by NC
Representatives Ellmers, Hudson, Jones and Rouzer, to extend the Clean
Power Plan compliance dates to after judicial review and to provide a safe
harbor for states to protect ratepayers, passed the U.S. House on June 24,
2015 and is at the Senate.
https://www.congress.gov/bill/114th-congress/house-bill/2042/all-info

Jennifer Diggins Public Affairs Director
NUCOR

8
Keeping the Lights On Why North Carolina’s Future Depends on Affordable and Reliable Energy
Jennifer Diggins Director of Public Affairs
Nucor Corporation July 15, 2015
Cape Hatteras
CLT
Triad
RDU
Fayetteville
Wilmington
Hertford
County
9
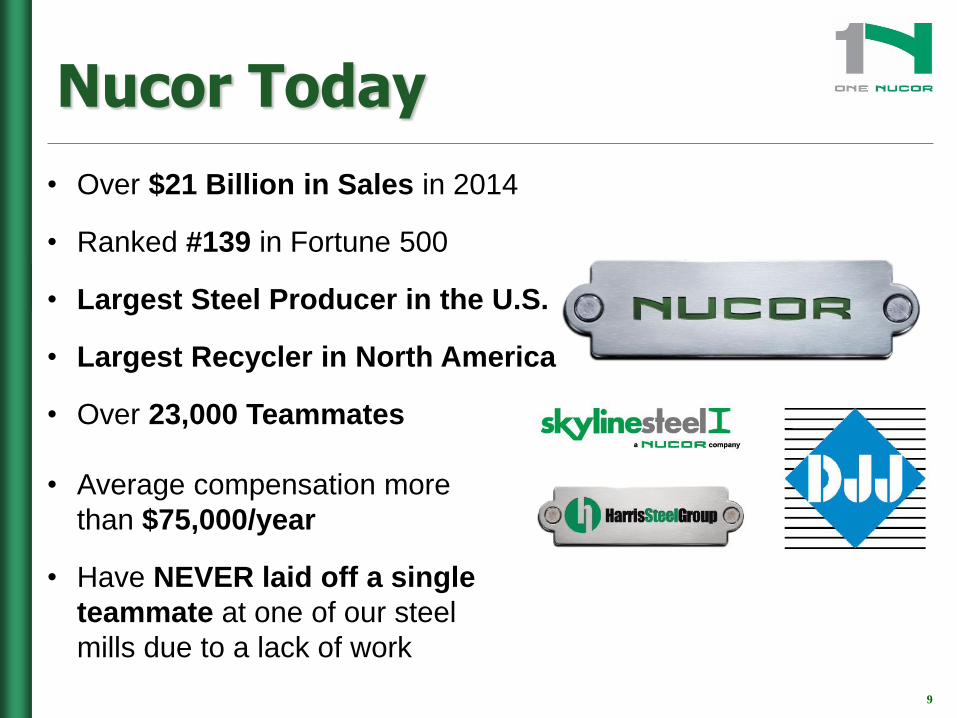
Nucor Today
• Over $21 Billion in Sales in 2014
• Ranked #139 in Fortune 500
• Largest Steel Producer in the U.S.
• Largest Recycler in North America
• Over 23,000 Teammates
• Average compensation more
than $75,000/year
• Have NEVER laid off a single
teammate at one of our steel
mills due to a lack of work
10
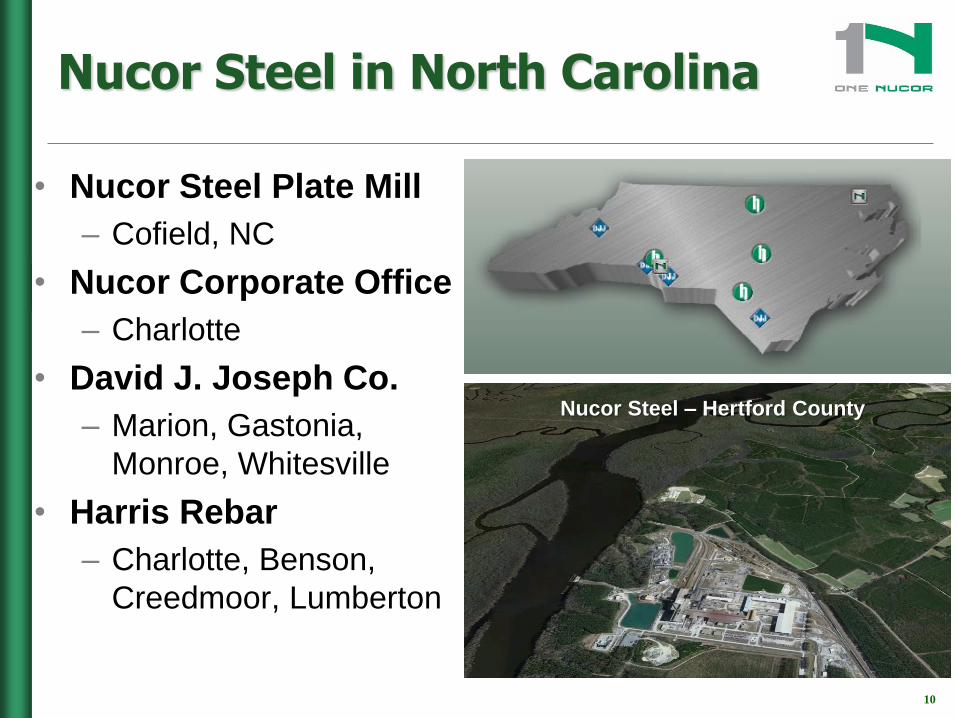
Nucor Steel in North Carolina
• Nucor Steel Plate Mill
– Cofield, NC
• Nucor Corporate Office
– Charlotte
• David J. Joseph Co.
– Marion, Gastonia,
Monroe, Whitesville
• Harris Rebar
– Charlotte, Benson,
Creedmoor, Lumberton
Nucor Steel – Hertford County

11
Perception of Steel Steel mills of the early 20th Century

12
Today’s Steel Mill

13
Processes Used to Manufacture Steel
• Electric Arc Furnace (EAF)
• Accounts for about 60% of
Steel made in U.S.
• Uses 75%-100% scrap steel
to make new steel
• Nucor operates 24 scrap-
based steel mills
• EAFs use one-quarter the
energy of blast furnaces to
produce a ton of steel
• Blast Furnace
• Accounts for about 40%
of Steel made in the U.S.
• Uses 25%-35% scrap

14
• Nationwide, Nucor uses
billions of kWh annually
• Company-wide electric demand
and use equal to the entire
customer base of a small utility
• A single EAF can use 50 to 150
MW of power by itself
– Equivalent to switching
on a million or more light
bulbs in the same instant
• In many states where we
operate, Nucor is the largest
single electric customer
Energy Use By Nucor Steel Mills
15
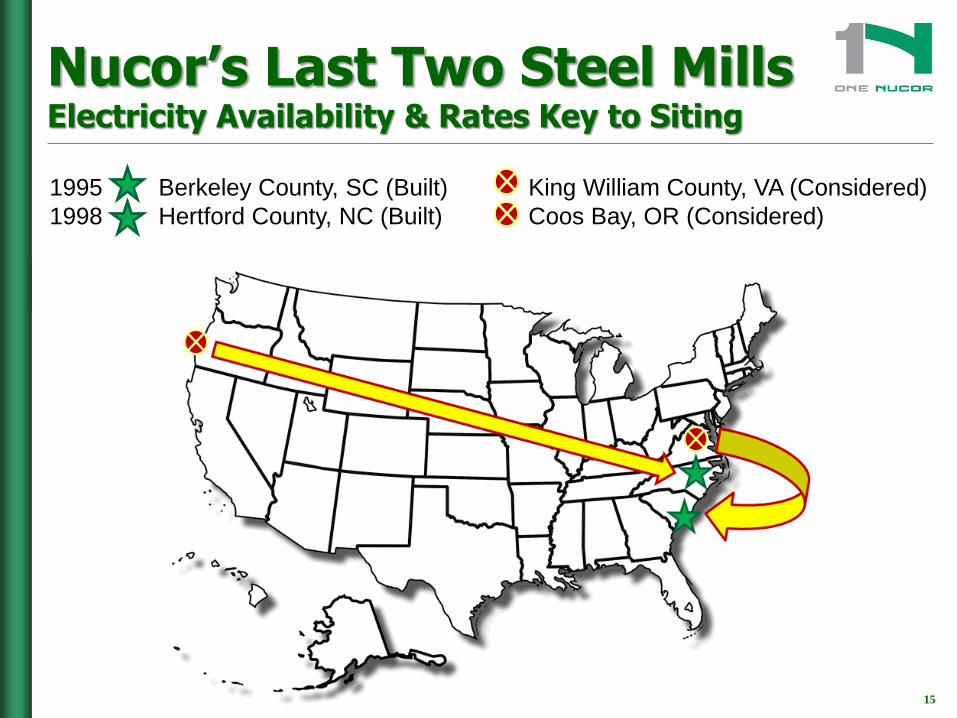
Nucor’s Last Two Steel Mills Electricity Availability & Rates Key to Siting
1995 Berkeley County, SC (Built) King William County, VA (Considered)
1998 Hertford County, NC (Built) Coos Bay, OR (Considered)

16
Nucor Steel – Hertford County
Impact on State/Local Economy
• Every steel job supports seven additional jobs in
other sectors of the economy
• Investment in a rural section of state where poverty
rate was twice the state average
– In 1990s, Hertford County had been 4th poorest county in NC
• Per capita income in Hertford County rose 27.8% as
mill was built and became operational (1997-2002)
• Mill represents 450+ North Carolina manufacturing
jobs averaging $90,000/year
• No one has ever been laid off due to a lack of work
AP--10/28/00
17
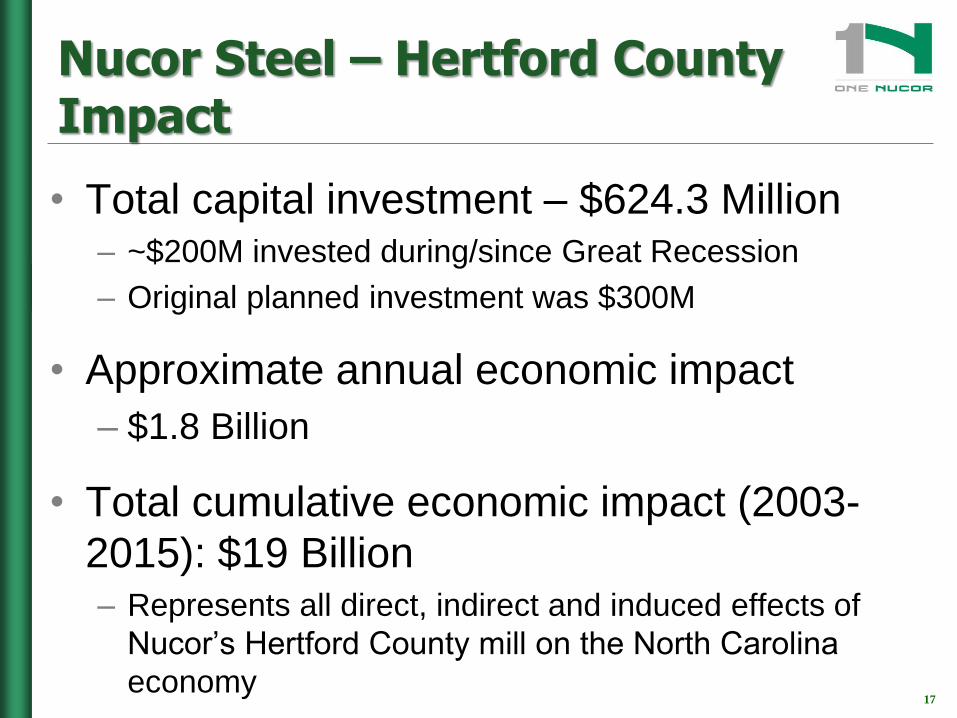
Nucor Steel – Hertford County Impact
• Total capital investment – $624.3 Million – ~$200M invested during/since Great Recession
– Original planned investment was $300M
• Approximate annual economic impact
– $1.8 Billion
• Total cumulative economic impact (2003-
2015): $19 Billion – Represents all direct, indirect and induced effects of
Nucor’s Hertford County mill on the North Carolina
economy
18
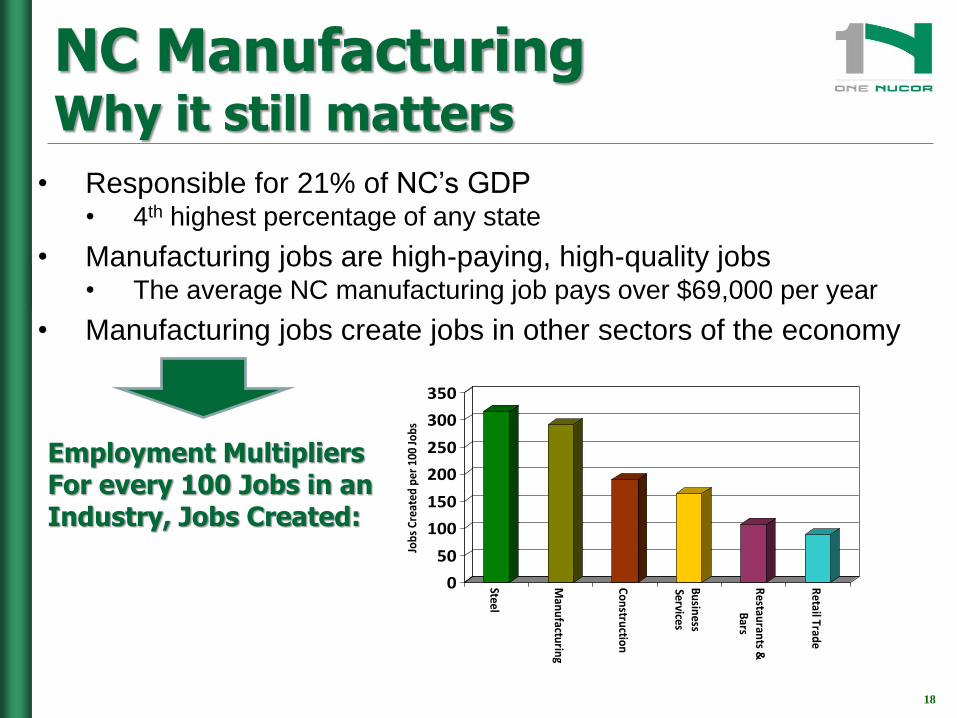
• Responsible for 21% of NC’s GDP • 4th highest percentage of any state
• Manufacturing jobs are high-paying, high-quality jobs • The average NC manufacturing job pays over $69,000 per year
• Manufacturing jobs create jobs in other sectors of the economy
NC Manufacturing Why it still matters
0
50
100
150
200
250
300
350Jo
bs
Cre
ated
per
100
Jo
bs
Steel
Man
ufactu
ring
Con
struction
Bu
siness
Services
Restau
rants &
Bars
Retail Trad
e
Employment Multipliers For every 100 Jobs in an Industry, Jobs Created:
19
400.00
450.00
500.00
550.00
600.00
650.00
700.00
750.00
800.00
850.00
1995
1996
1997
1998
1999
2000
2001
2002
2003
2004
2005
2006
2007
2008
2009
2010
2011
2012
2013
2014
2015
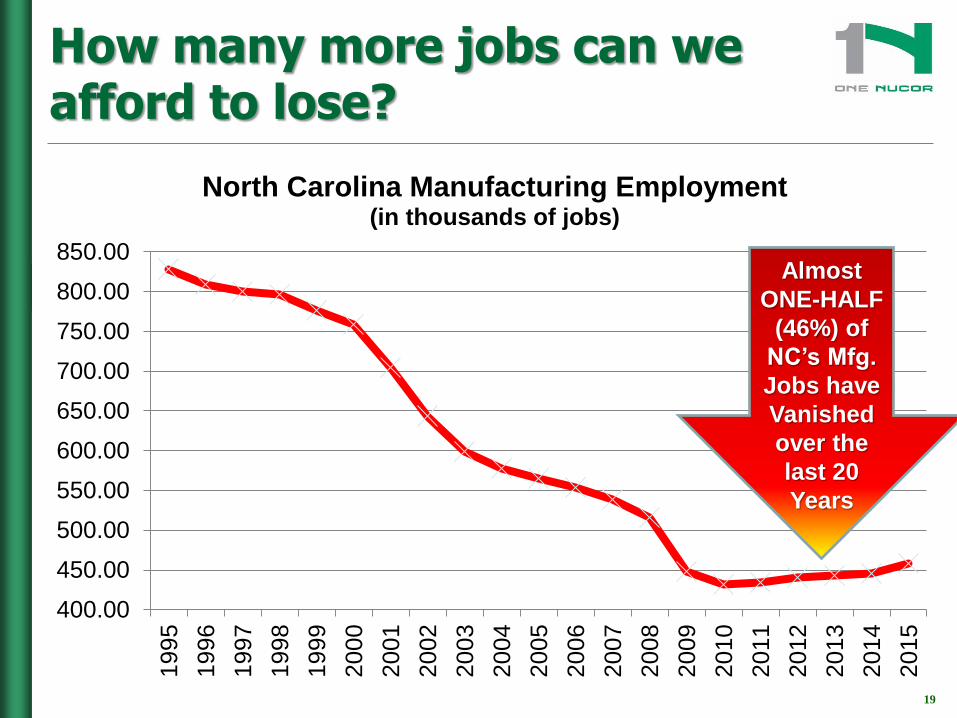
North Carolina Manufacturing Employment (in thousands of jobs)
How many more jobs can we afford to lose?
Almost
Almost
ONE-HALF
(46%) of
NC’s Mfg.
Jobs have
Vanished
over the
last 20
Years
20
4.00
4.50
5.00
5.50
6.00
6.50
7.00
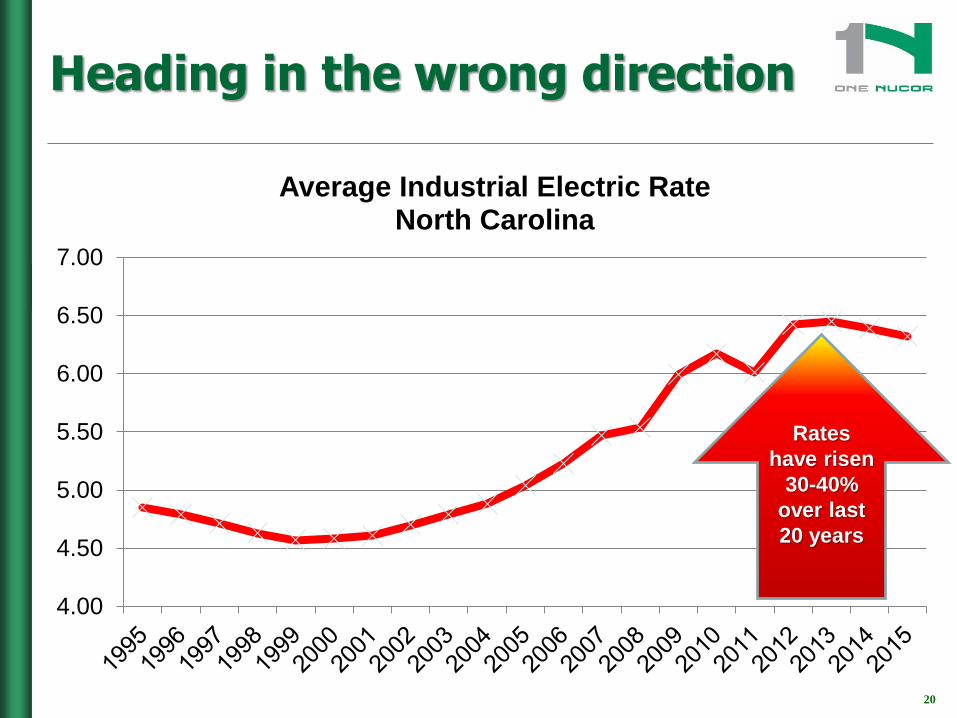
Average Industrial Electric Rate North Carolina
Heading in the wrong direction
Rates
have risen
30-40%
over last
20 years
21
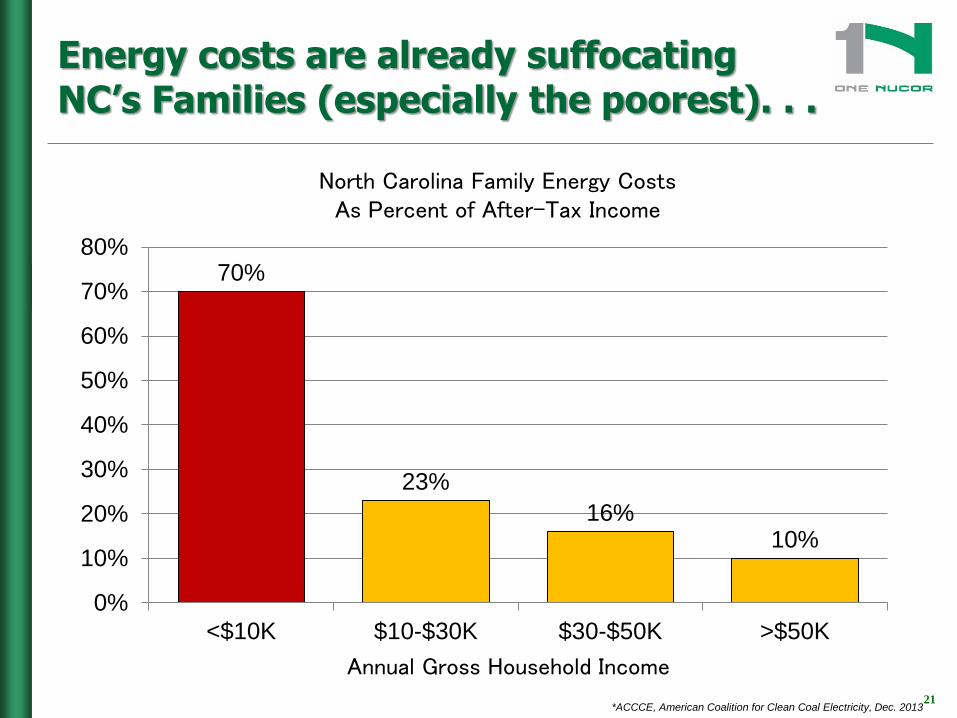
Energy costs are already suffocating NC’s Families (especially the poorest). . .
70%
23%
16% 10%
0%
10%
20%
30%
40%
50%
60%
70%
80%
<$10K $10-$30K $30-$50K >$50K
North Carolina Family Energy Costs As Percent of After-Tax Income
Annual Gross Household Income
*ACCCE, American Coalition for Clean Coal Electricity, Dec. 2013

22
. . .and new federal rules will make a bad situation worse
• The economic costs of effectively eliminating coal-based
electric generation in 5 short years are staggering
• NC Power Generation still Coal Heavy
• 44 % Coal
• 34 % Nuclear
• 17 % Natural Gas
• 3 % Hydro
• 2 % Biomass
• EPA picking WINNERS & LOSERS
in North Carolina’s energy mix
23
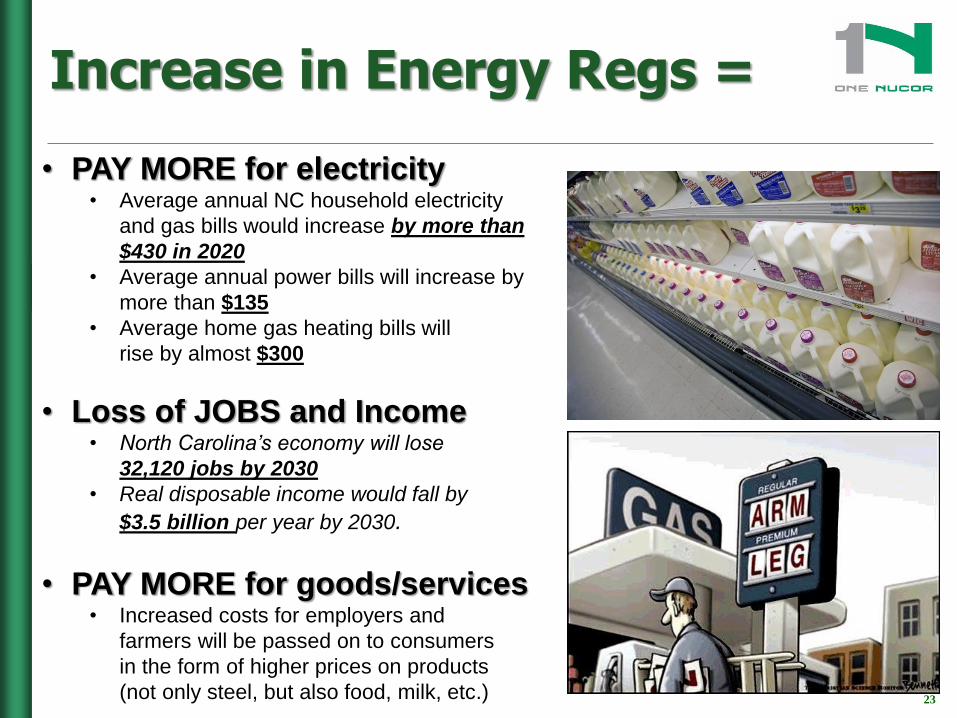
Increase in Energy Regs =
• PAY MORE for electricity • Average annual NC household electricity
and gas bills would increase by more than
$430 in 2020
• Average annual power bills will increase by
more than $135
• Average home gas heating bills will
rise by almost $300
• Loss of JOBS and Income • North Carolina’s economy will lose
32,120 jobs by 2030
• Real disposable income would fall by
$3.5 billion per year by 2030.
• PAY MORE for goods/services • Increased costs for employers and
farmers will be passed on to consumers
in the form of higher prices on products
(not only steel, but also food, milk, etc.)

24
WHAT CAN YOU DO?
24
25
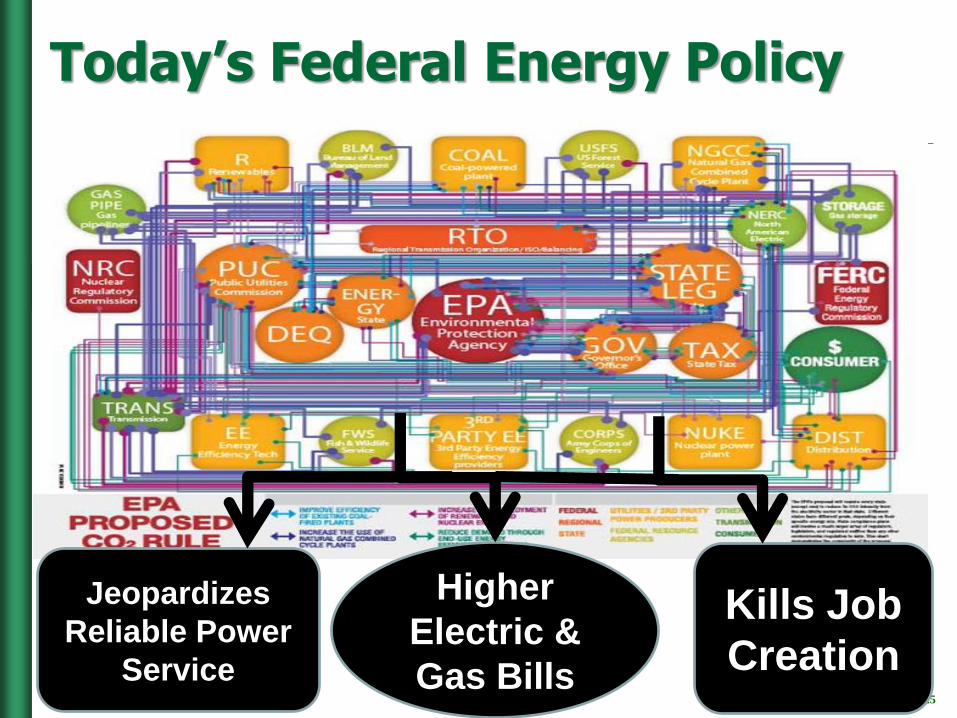
Today’s Federal Energy Policy
Jeopardizes
Reliable Power
Service
Higher
Electric &
Gas Bills
Kills Job
Creation

26
North Carolina’s Best Years are Ahead of Us!

27
Let’s Keep the Lights On
Cape Hatteras
CLT
Triad
RDU
Fayetteville
Wilmington
Hertford
County

Andrew Ott Executive Vice President, Markets
PJM
PJM©2015 www.pjm.com 29
PJM Interconnection
Regional Transmission Organization
(RTO) Andy Ott
Executive Vice President, Markets
Mike Kormos
Executive Vice President, Operations
NC Energy Policy Council
July 15, 2015
PJM©2015 www.pjm.com 30 30
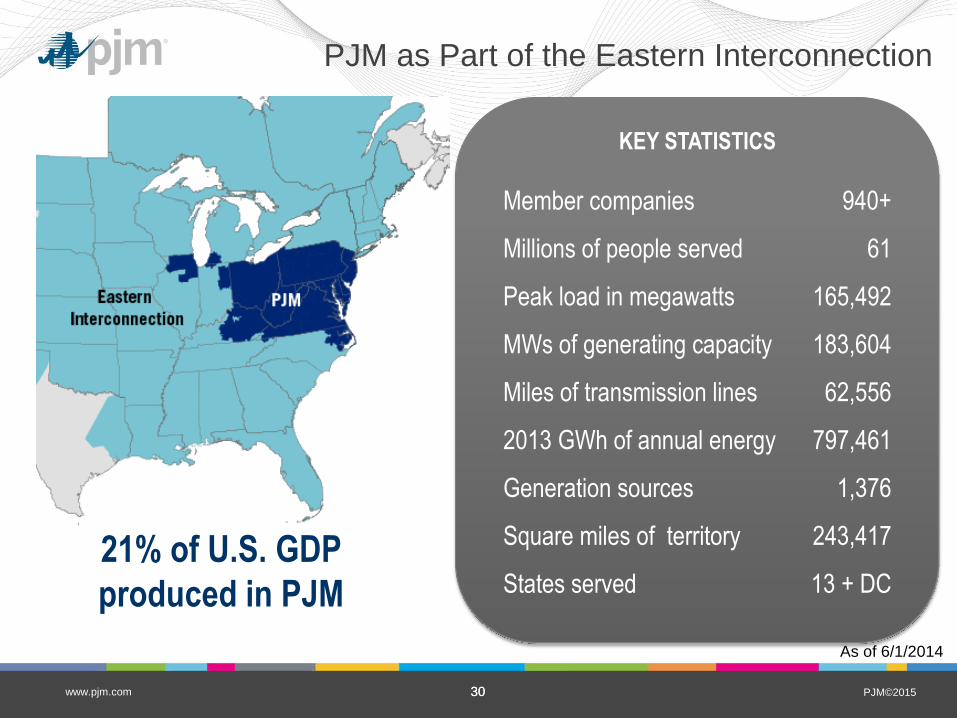
PJM as Part of the Eastern Interconnection
KEY STATISTICS
Member companies 940+
Millions of people served 61
Peak load in megawatts 165,492
MWs of generating capacity 183,604
Miles of transmission lines 62,556
2013 GWh of annual energy 797,461
Generation sources 1,376
Square miles of territory 243,417
States served 13 + DC 21% of U.S. GDP
produced in PJM
As of 6/1/2014
PJM©2015 www.pjm.com 31 31
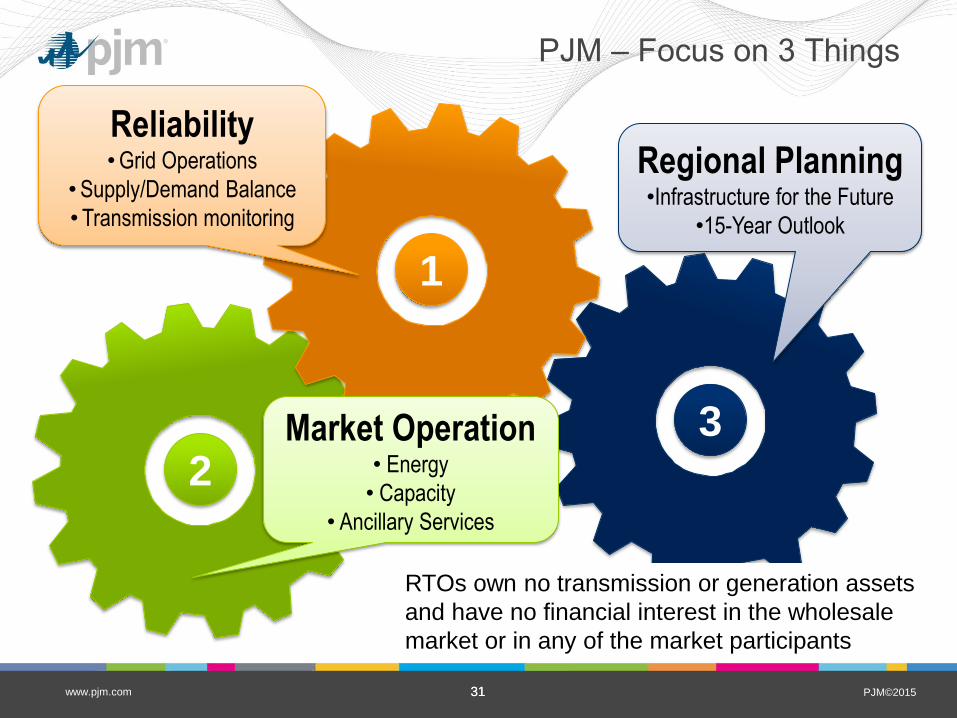
PJM ‒ Focus on 3 Things
Market Operation • Energy
• Capacity
• Ancillary Services
Regional Planning •Infrastructure for the Future
•15-Year Outlook
Reliability • Grid Operations
• Supply/Demand Balance
• Transmission monitoring
2
1
3
RTOs own no transmission or generation assets
and have no financial interest in the wholesale
market or in any of the market participants
PJM©2015 www.pjm.com 32 32
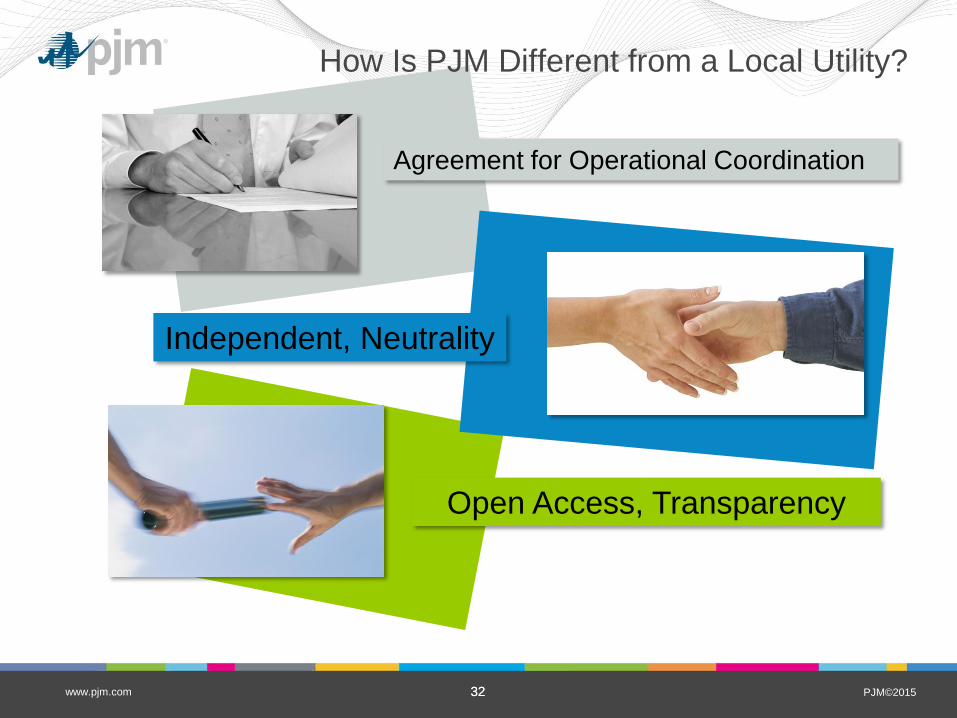
How Is PJM Different from a Local Utility?
Agreement for Operational Coordination
Independent, Neutrality
Open Access, Transparency
PJM©2015 www.pjm.com 33 33
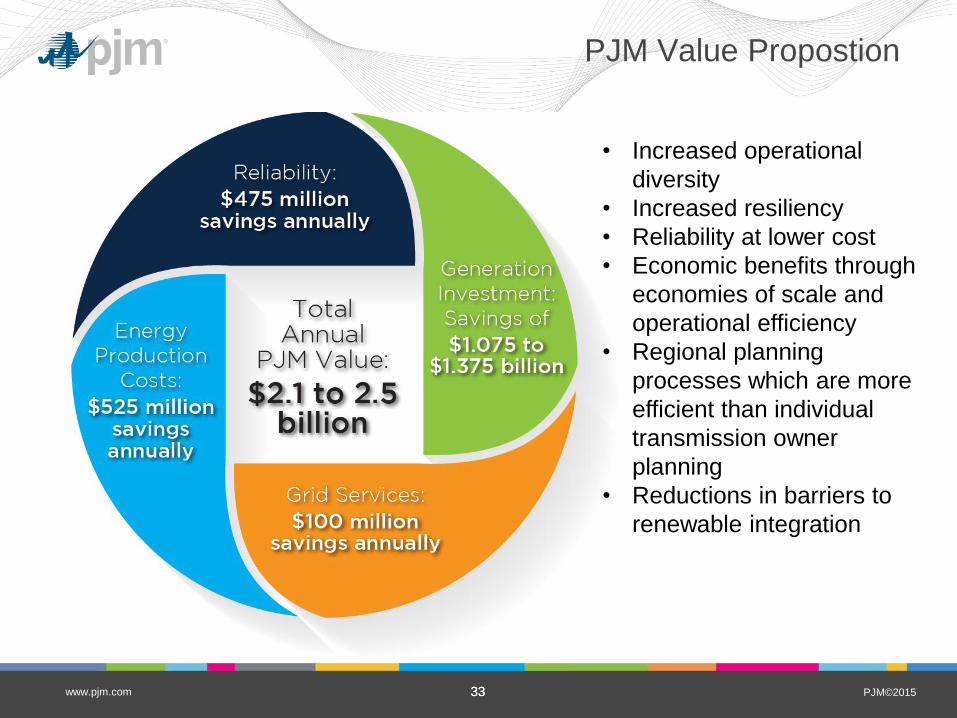
PJM Value Propostion
• Increased operational
diversity
• Increased resiliency
• Reliability at lower cost
• Economic benefits through
economies of scale and
operational efficiency
• Regional planning
processes which are more
efficient than individual
transmission owner
planning
• Reductions in barriers to
renewable integration
PJM©2015 www.pjm.com 34 34
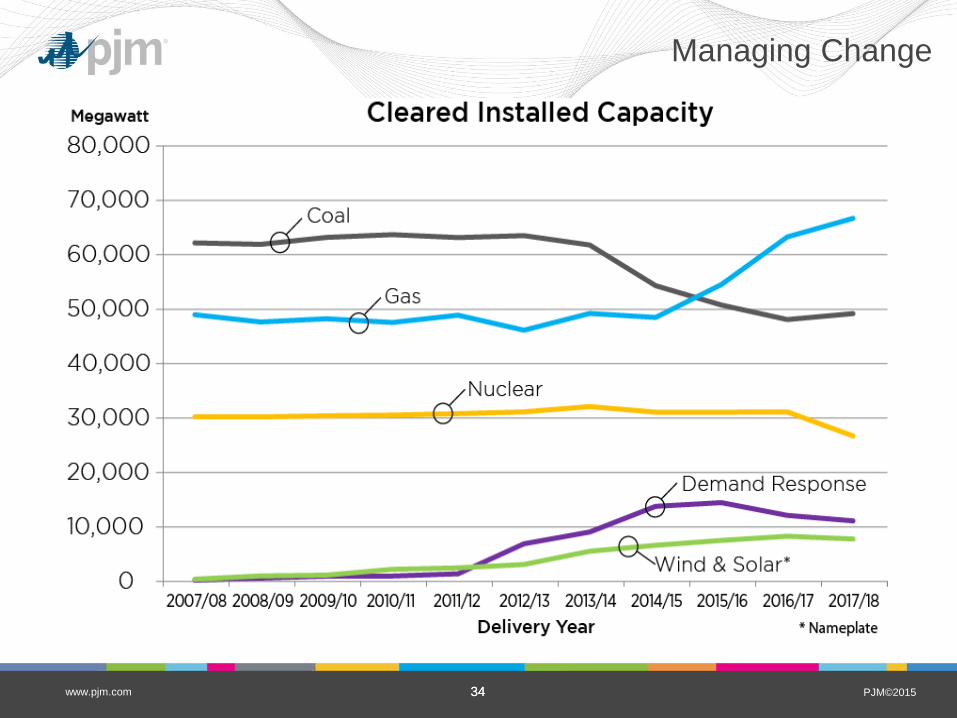
Managing Change
PJM©2015 www.pjm.com 35 35
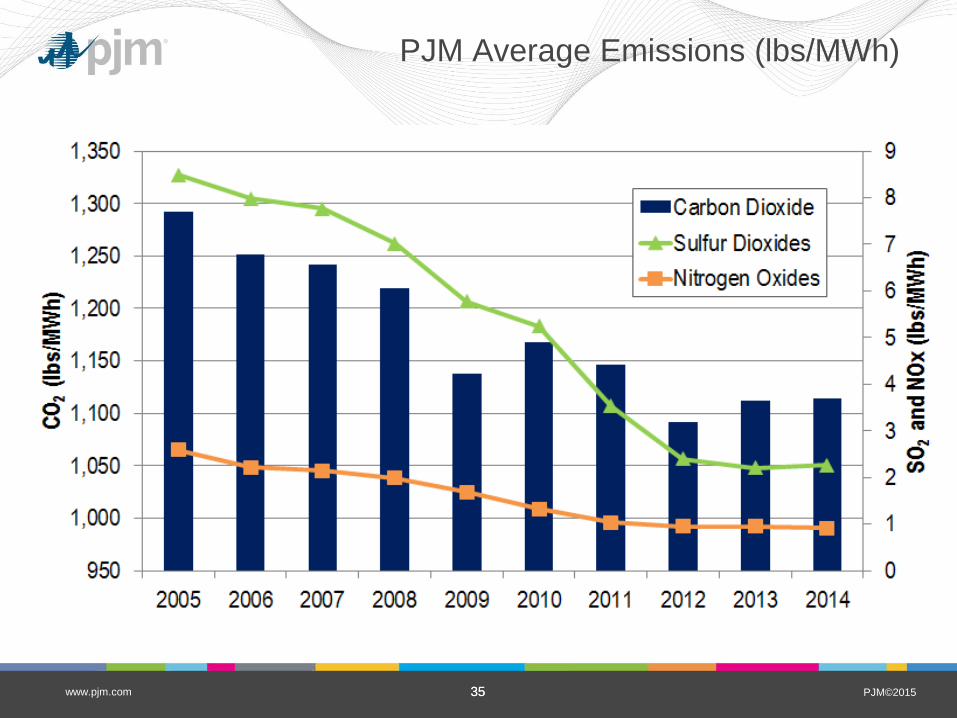
PJM Average Emissions (lbs/MWh)
PJM©2015 www.pjm.com 36 36
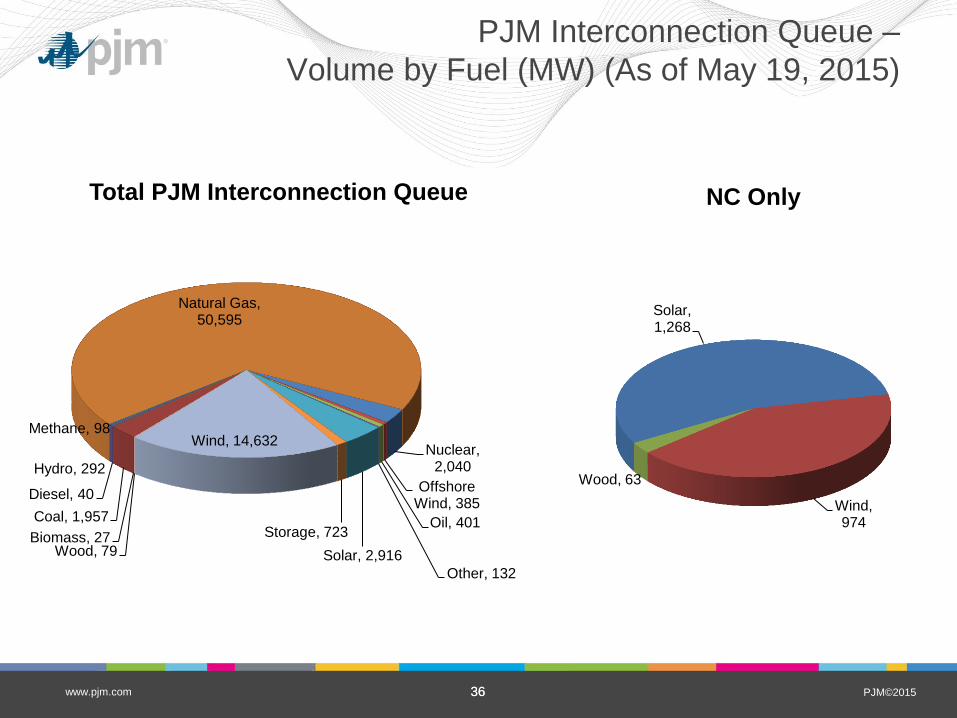
Biomass, 27
Coal, 1,957
Diesel, 40
Hydro, 292
Methane, 98
Natural Gas, 50,595
Nuclear, 2,040
Offshore Wind, 385
Oil, 401
Other, 132
Solar, 2,916
Storage, 723
Wind, 14,632
Wood, 79
Total PJM Interconnection Queue
PJM Interconnection Queue –
Volume by Fuel (MW) (As of May 19, 2015)
Solar, 1,268
Wind, 974
Wood, 63
NC Only
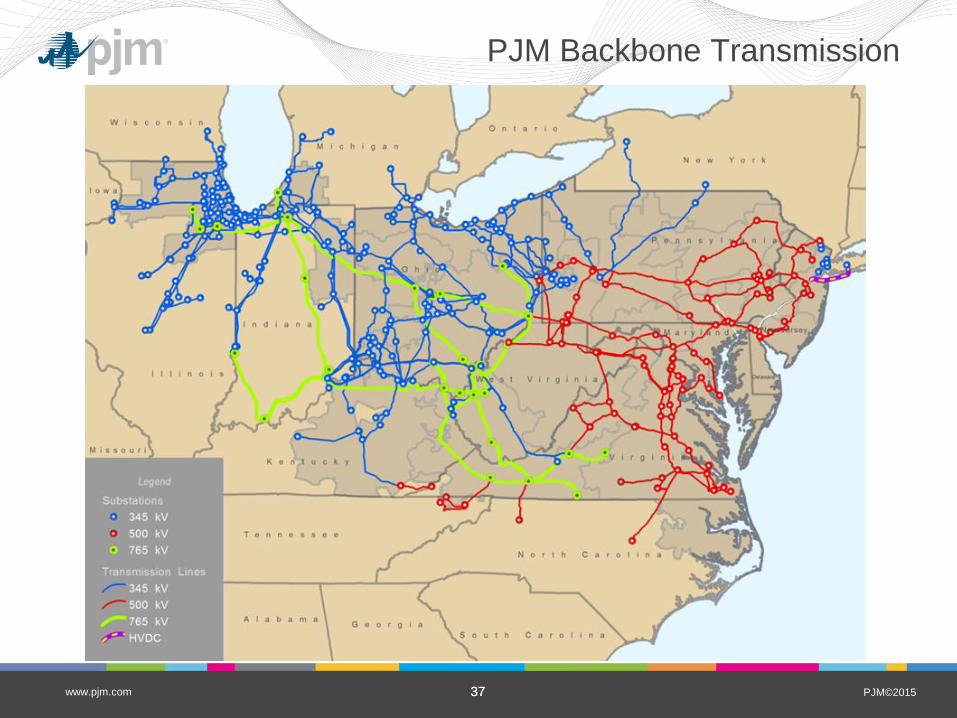
PJM©2015 www.pjm.com 37 37
PJM Backbone Transmission
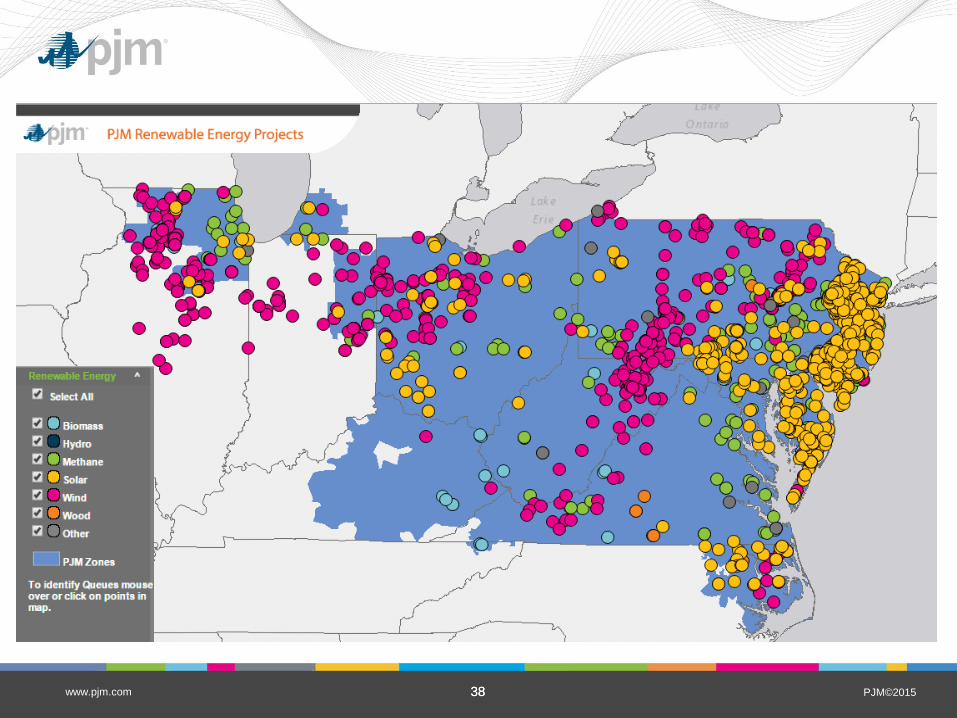
PJM©2015 www.pjm.com 38 38
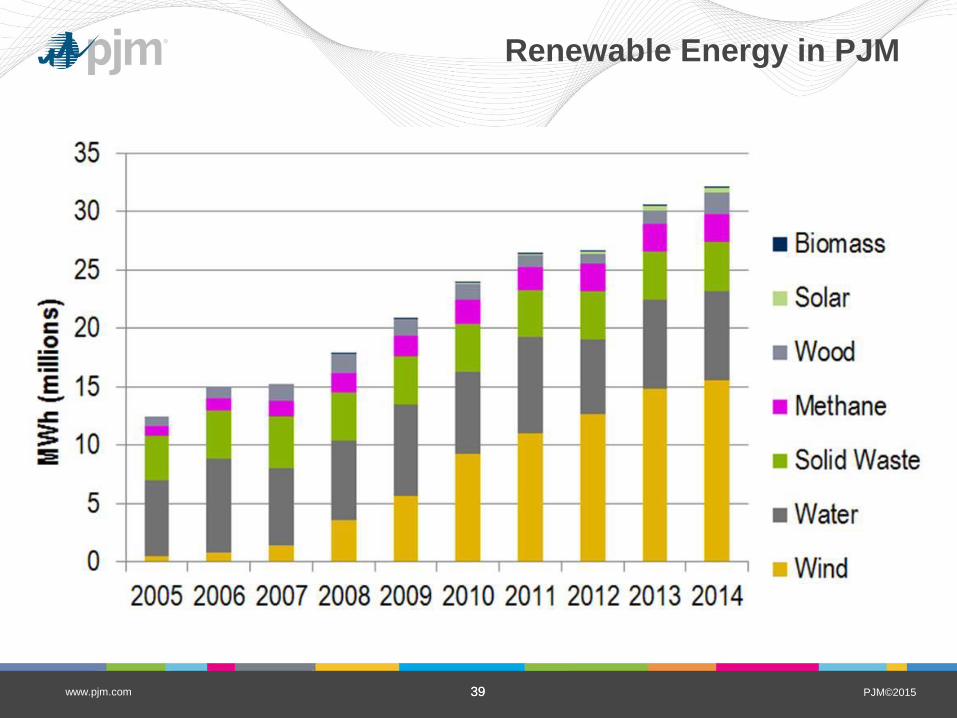
PJM©2015 www.pjm.com 39 39
Renewable Energy in PJM
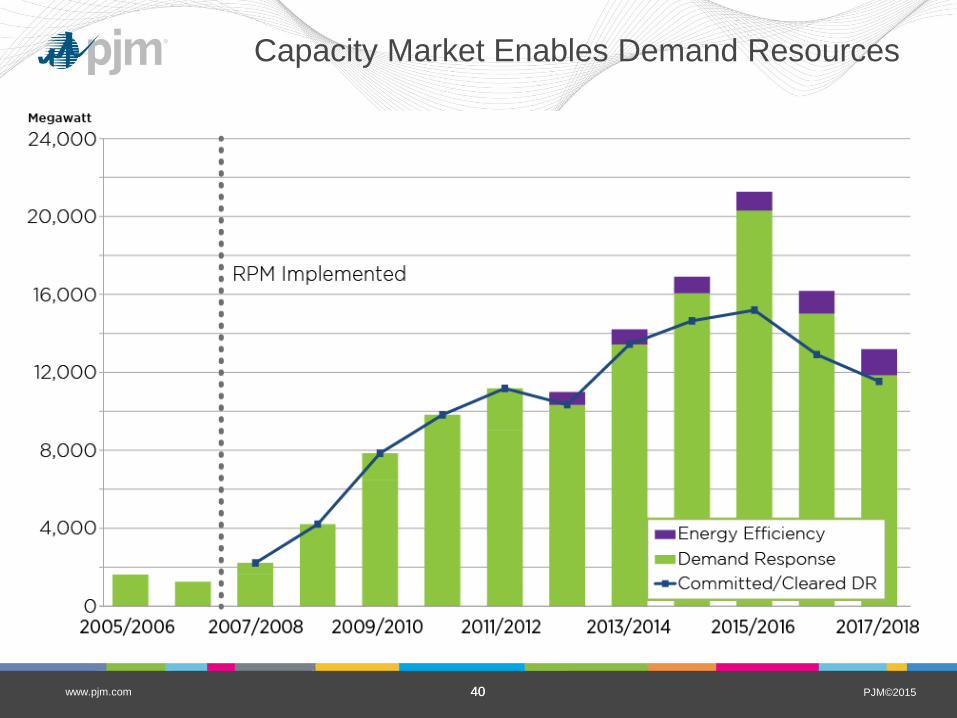
PJM©2015 www.pjm.com 40 40
Capacity Market Enables Demand Resources
PJM©2015 www.pjm.com 41 41
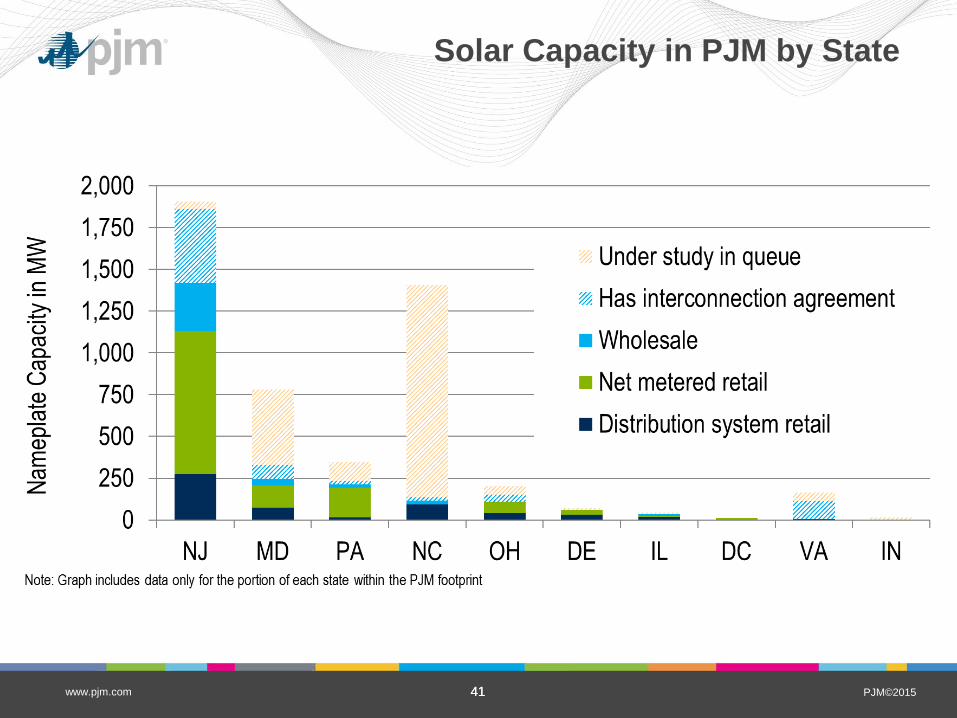
Solar Capacity in PJM by State
PJM©2015 www.pjm.com 42 42
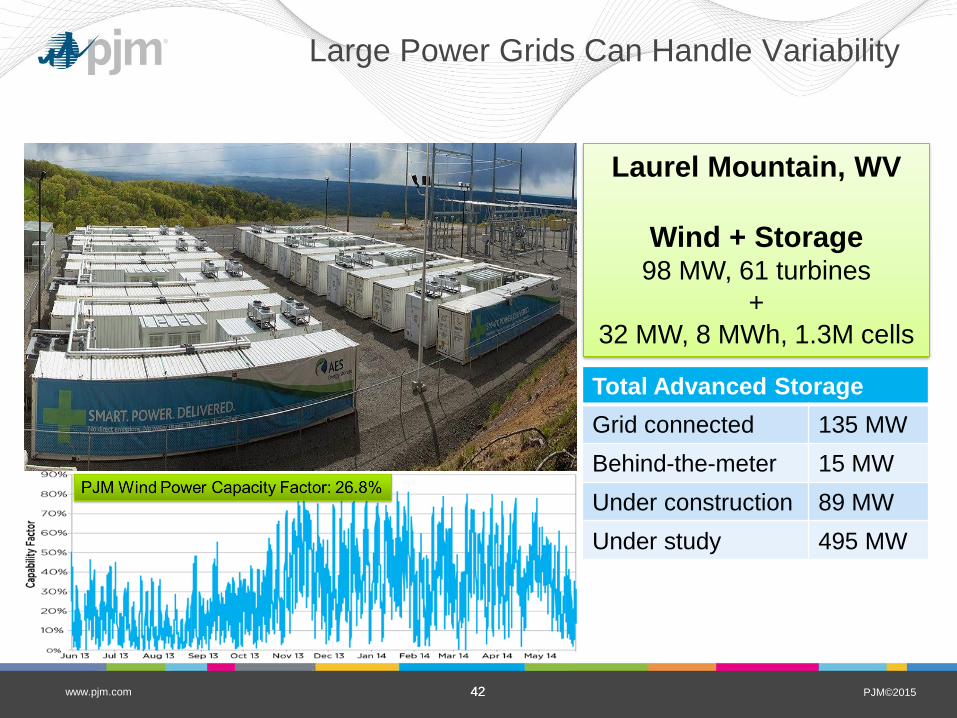
Large Power Grids Can Handle Variability
Laurel Mountain, WV
Wind + Storage 98 MW, 61 turbines
+
32 MW, 8 MWh, 1.3M cells
Total Advanced Storage
Grid connected 135 MW
Behind-the-meter 15 MW
Under construction 89 MW
Under study 495 MW
PJM©2015 www.pjm.com 43 43
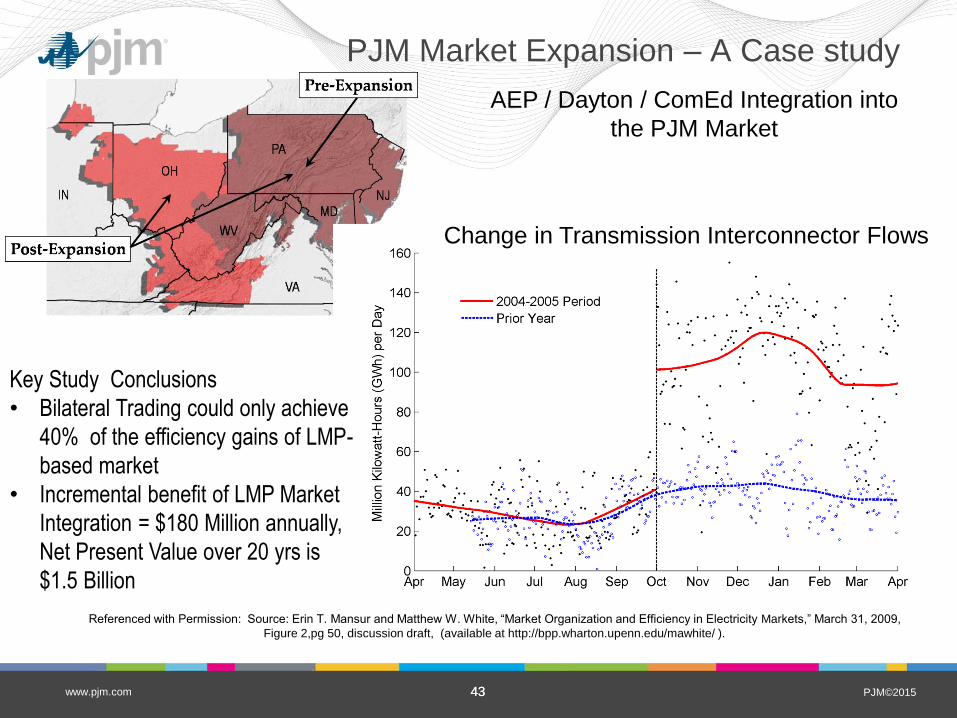
PJM Market Expansion – A Case study
AEP / Dayton / ComEd Integration into
the PJM Market
Change in Transmission Interconnector Flows
Referenced with Permission: Source: Erin T. Mansur and Matthew W. White, “Market Organization and Efficiency in Electricity Markets,” March 31, 2009,
Figure 2,pg 50, discussion draft, (available at http://bpp.wharton.upenn.edu/mawhite/ ).
Key Study Conclusions
• Bilateral Trading could only achieve
40% of the efficiency gains of LMP-
based market
• Incremental benefit of LMP Market
Integration = $180 Million annually,
Net Present Value over 20 yrs is
$1.5 Billion
PJM©2015 www.pjm.com 44 44
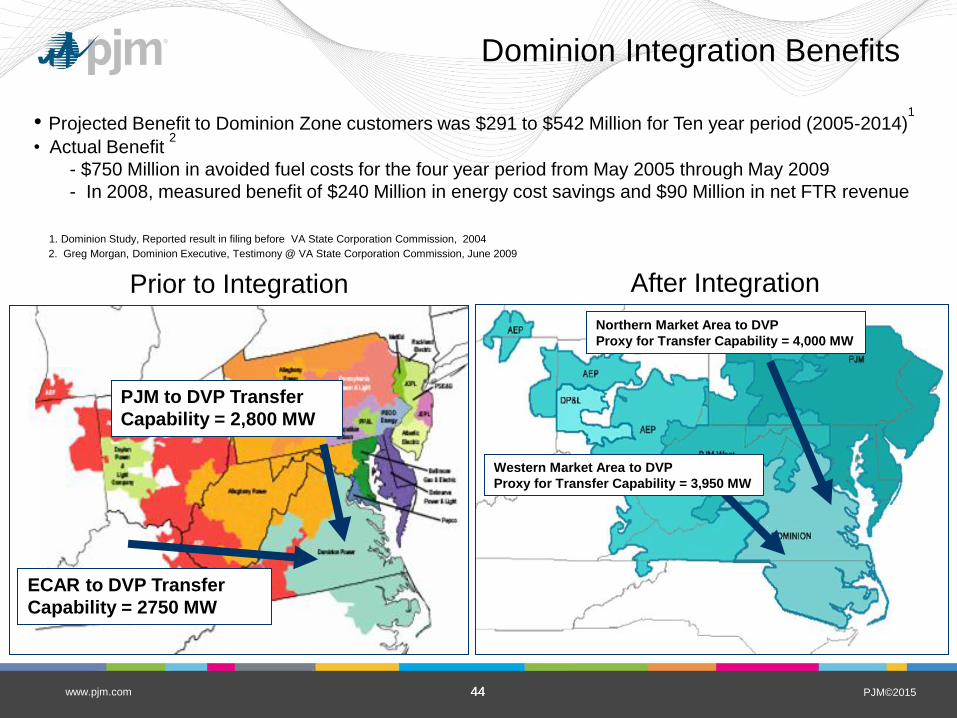
Dominion Integration Benefits
ECAR to DVP Transfer
Capability = 2750 MW
PJM to DVP Transfer
Capability = 2,800 MW
Western Market Area to DVP
Proxy for Transfer Capability = 3,950 MW
Northern Market Area to DVP
Proxy for Transfer Capability = 4,000 MW
Prior to Integration After Integration
• Projected Benefit to Dominion Zone customers was $291 to $542 Million for Ten year period (2005-2014)1
• Actual Benefit 2
- $750 Million in avoided fuel costs for the four year period from May 2005 through May 2009
- In 2008, measured benefit of $240 Million in energy cost savings and $90 Million in net FTR revenue
1. Dominion Study, Reported result in filing before VA State Corporation Commission, 2004
2. Greg Morgan, Dominion Executive, Testimony @ VA State Corporation Commission, June 2009
PJM©2015 www.pjm.com 45 45
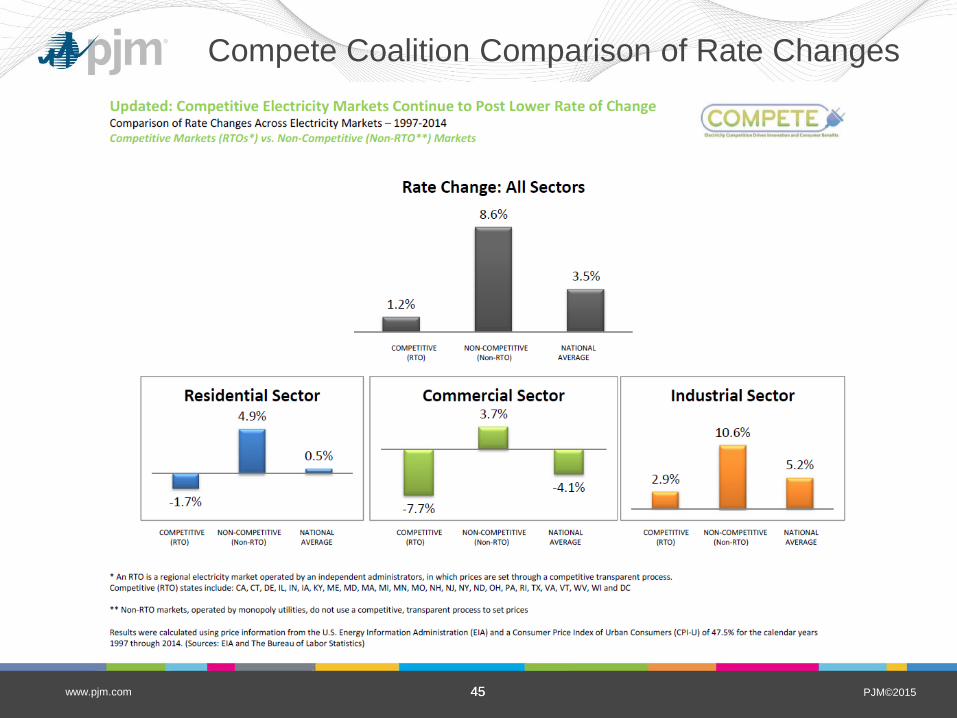
Compete Coalition Comparison of Rate Changes
PJM©2015 www.pjm.com 46 46
Benefits of Regional Markets
• Larger regional markets provide increased operational diversity,
more resiliency, and reliability at lower cost
• Larger regional markets provide economic benefits through
economies of scale and operational efficiency
• Large diverse markets reduce barriers to renewable integration
• Regional planning processes are more efficient than individual
transmission owner planning
Michael Kormos Executive Vice President, Operations
PJM

PJM©2015
Cyber and Physical Security
for the Power Grid
Michael J. Kormos
Executive Vice President,
Operations
PJM Interconnection
NC Energy Policy Council
July 15, 2015
www.pjm.com
PJM©2015 49
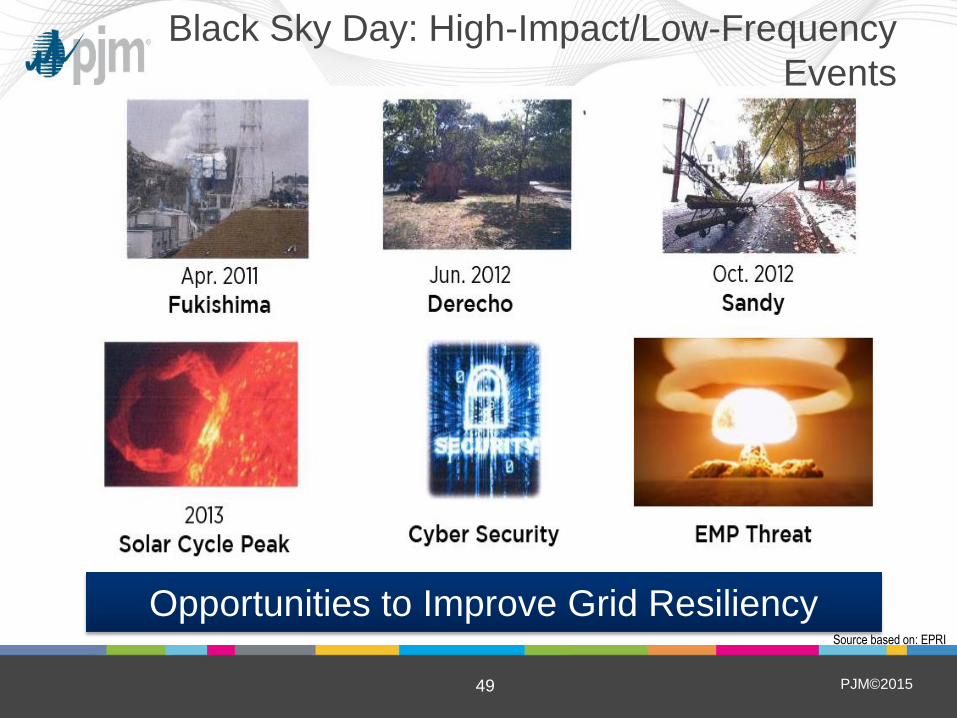
Black Sky Day: High-Impact/Low-Frequency
Events
Opportunities to Improve Grid Resiliency Source based on: EPRI

PJM©2015 50
Learning from the Past
www.pjm.com
PJM©2015 51
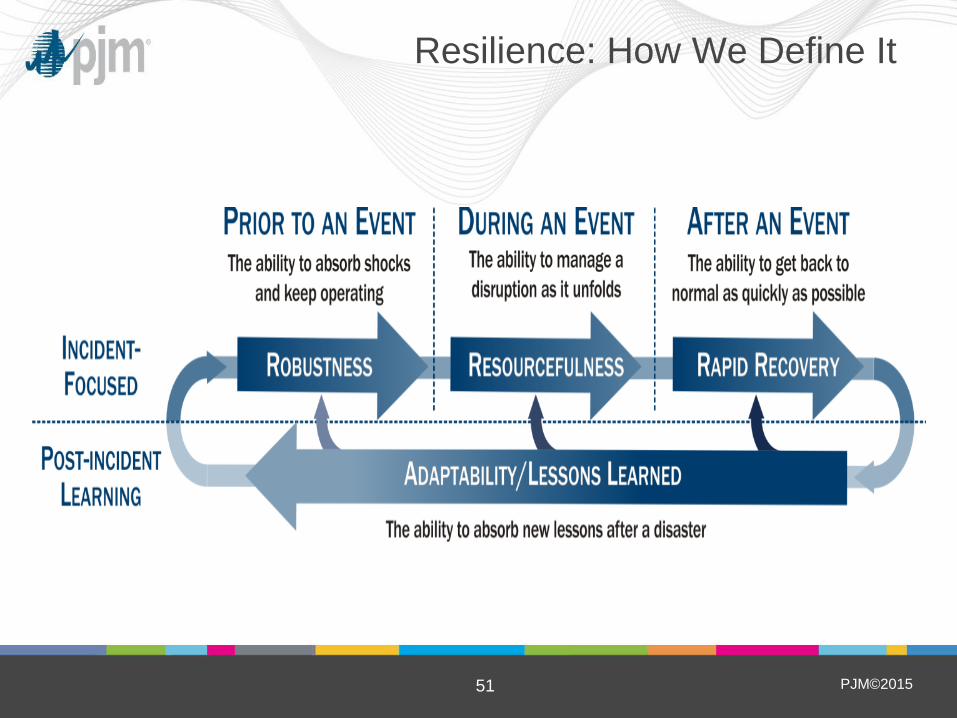
Resilience: How We Define It
PJM©2015 52
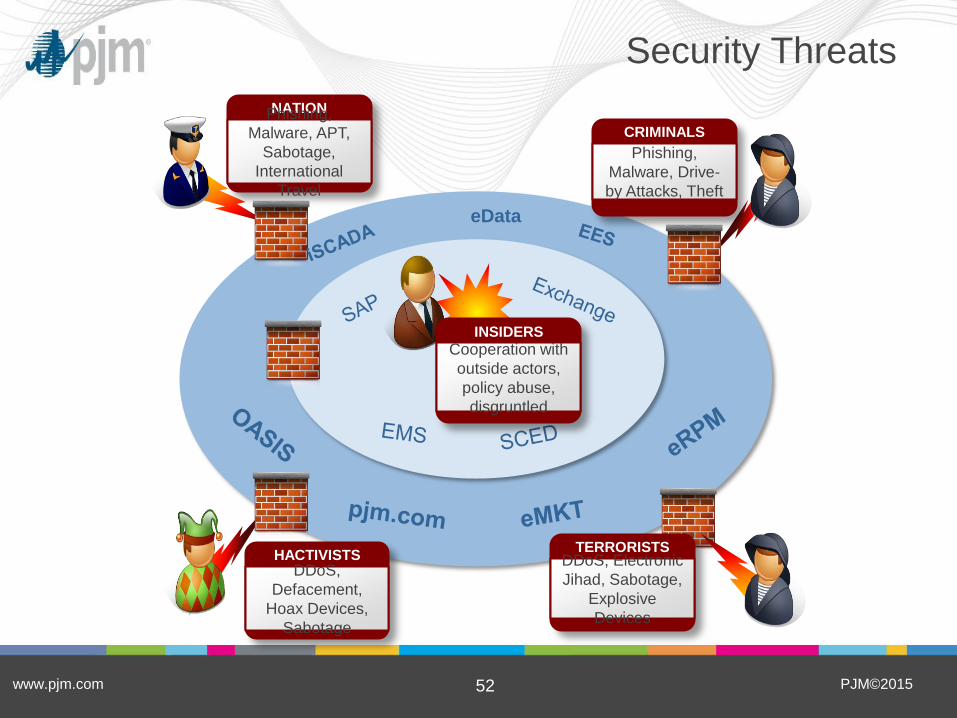
Security Threats
www.pjm.com
eData
NATION
STATES Phishing,
Malware, APT,
Sabotage,
International
Travel
CRIMINALS
Phishing,
Malware, Drive-
by Attacks, Theft
HACTIVISTS DDoS,
Defacement,
Hoax Devices,
Sabotage
INSIDERS
Cooperation with
outside actors,
policy abuse,
disgruntled
TERRORISTS DDoS, Electronic
Jihad, Sabotage,
Explosive
Devices
PJM©2015 53
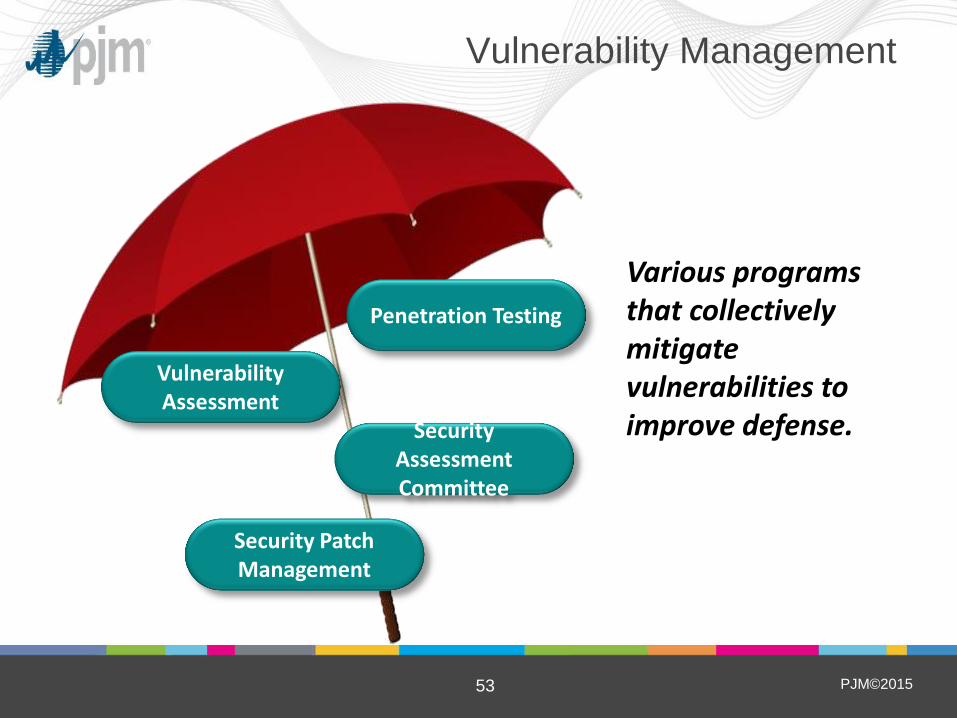
Vulnerability Management
Vulnerability Assessment
Security Patch Management
Penetration Testing
Security Assessment Committee
Various programs that collectively mitigate vulnerabilities to improve defense.
PJM©2015 54
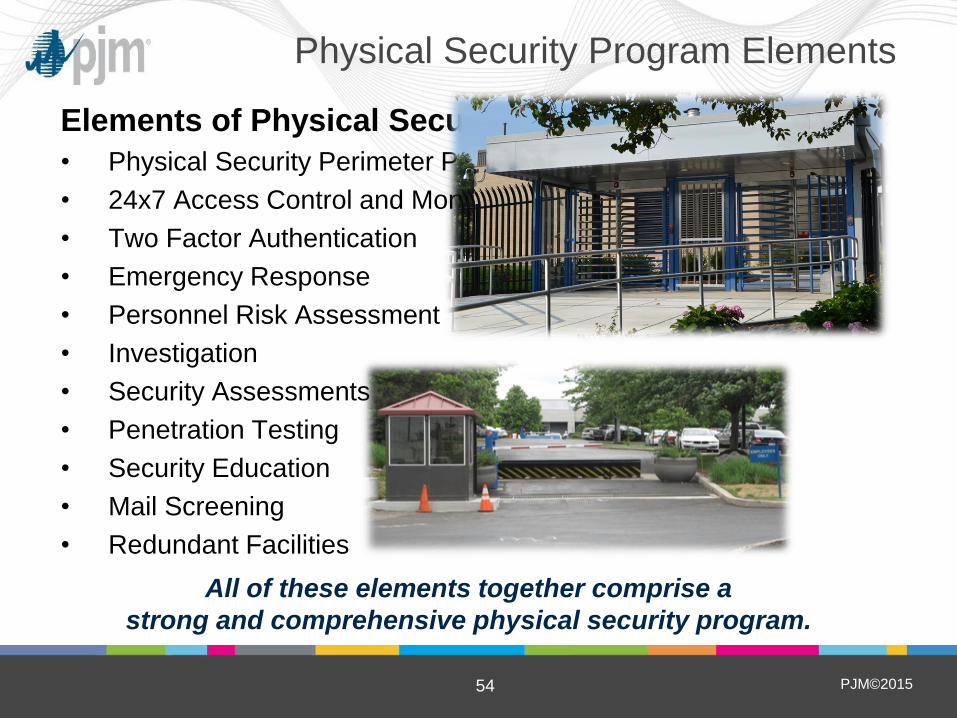
Elements of Physical Security
• Physical Security Perimeter Protection
• 24x7 Access Control and Monitoring
• Two Factor Authentication
• Emergency Response
• Personnel Risk Assessment
• Investigation
• Security Assessments
• Penetration Testing
• Security Education
• Mail Screening
• Redundant Facilities
All of these elements together comprise a
strong and comprehensive physical security program.
Physical Security Program Elements
PJM©2015 55
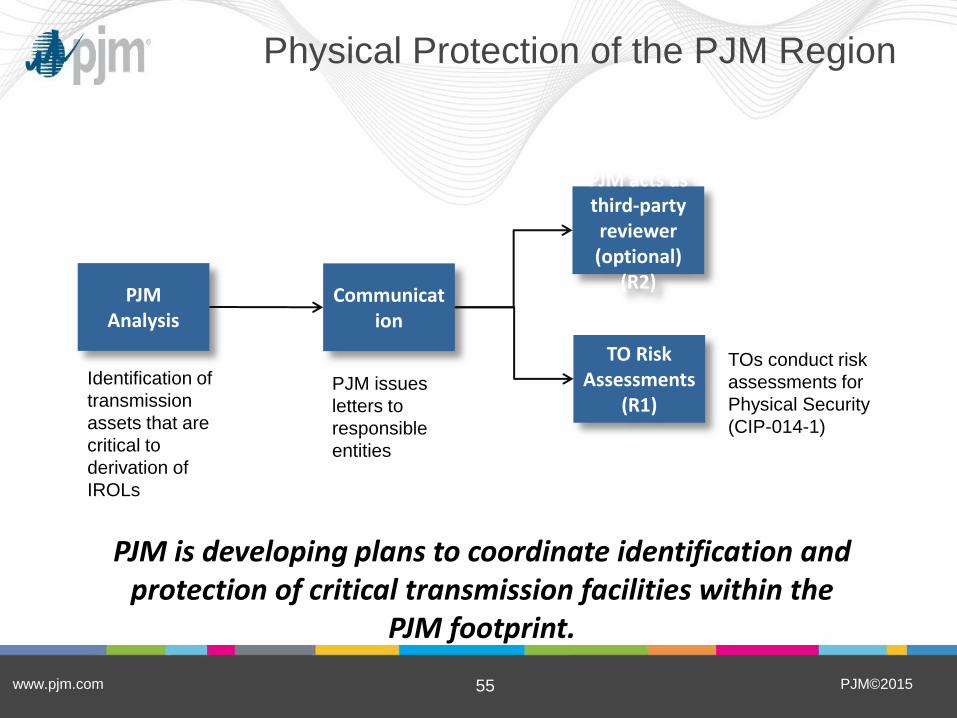
Physical Protection of the PJM Region
www.pjm.com
PJM Analysis
Communication
PJM acts as third-party reviewer (optional)
(R2)
TO Risk Assessments
(R1)
Identification of
transmission
assets that are
critical to
derivation of
IROLs
PJM issues
letters to
responsible
entities
TOs conduct risk
assessments for
Physical Security
(CIP-014-1)
PJM is developing plans to coordinate identification and protection of critical transmission facilities within the
PJM footprint.
PJM©2015 56
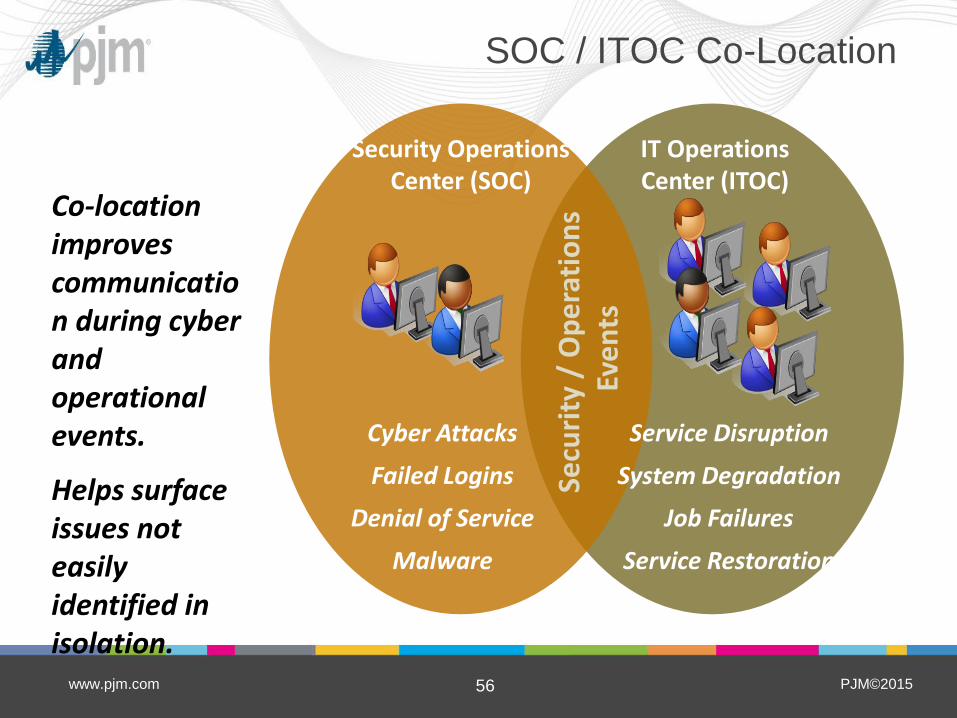
SOC / ITOC Co-Location
www.pjm.com
Security Operations Center (SOC)
IT Operations Center (ITOC)
Cyber Attacks
Failed Logins
Denial of Service
Malware Se
curi
ty /
Op
era
tio
ns
Ev
en
ts
Service Disruption
System Degradation
Job Failures
Service Restoration
Co-location improves communication during cyber and operational events.
Helps surface issues not easily identified in isolation.
PJM©2015 57
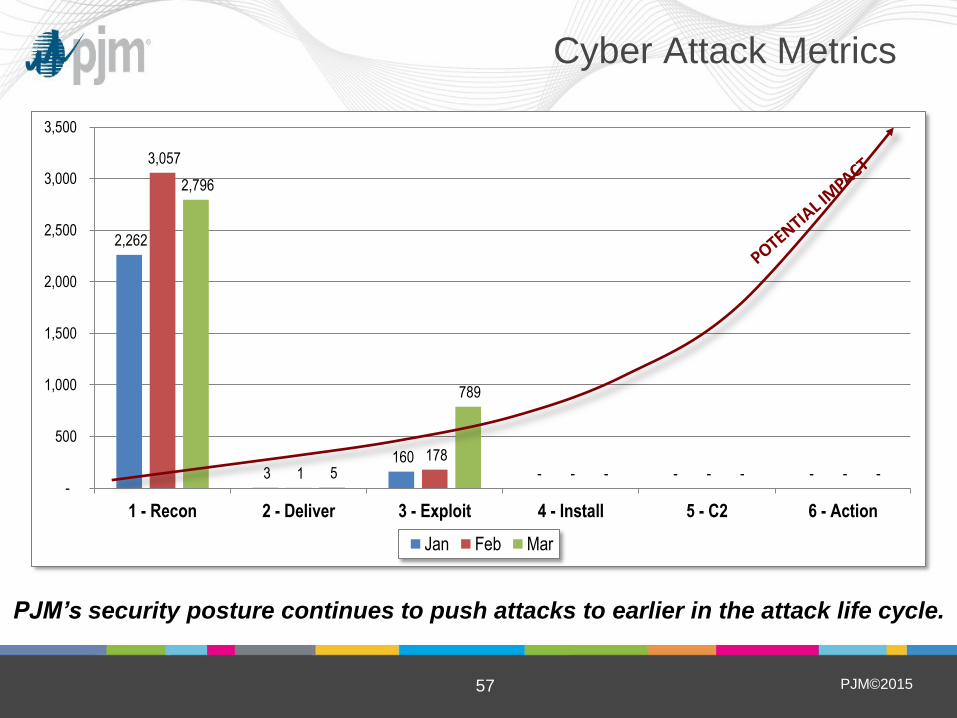
Cyber Attack Metrics
2,262
3 160
- - -
3,057
1 178
- - -
2,796
5
789
- - - -
500
1,000
1,500
2,000
2,500
3,000
3,500
1 - Recon 2 - Deliver 3 - Exploit 4 - Install 5 - C2 6 - Action
Jan Feb Mar
PJM’s security posture continues to push attacks to earlier in the attack life cycle.
PJM©2015 58
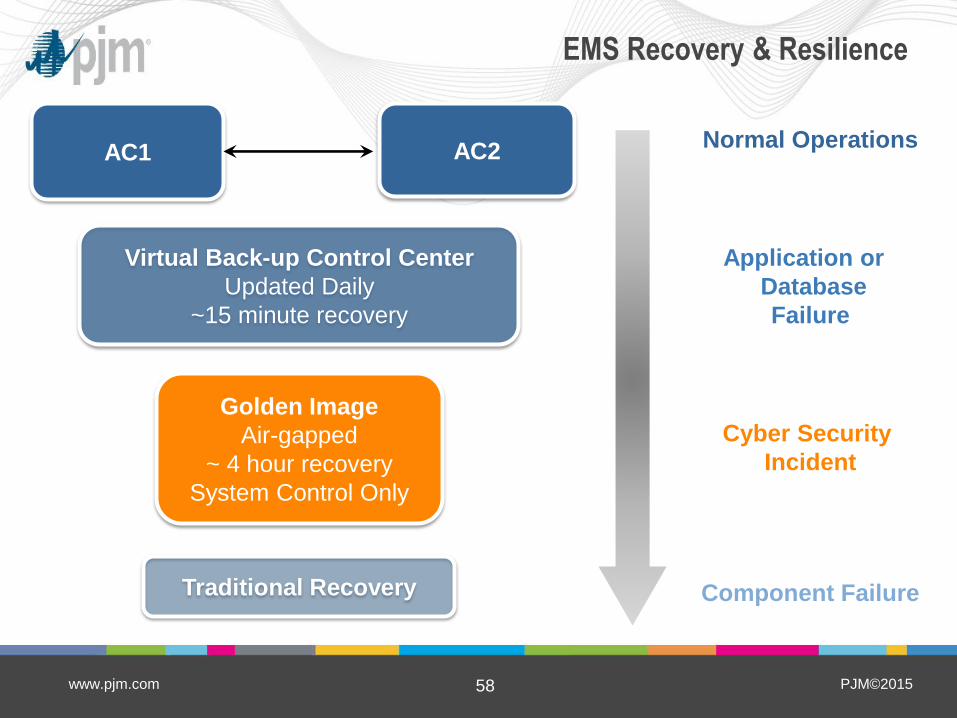
EMS Recovery & Resilience
Virtual Back-up Control Center
Updated Daily
~15 minute recovery
Golden Image
Air-gapped
~ 4 hour recovery
System Control Only
AC1 AC2
Traditional Recovery
Normal Operations
Application or
Database
Failure
Cyber Security
Incident
Component Failure
www.pjm.com
PJM©2015 59
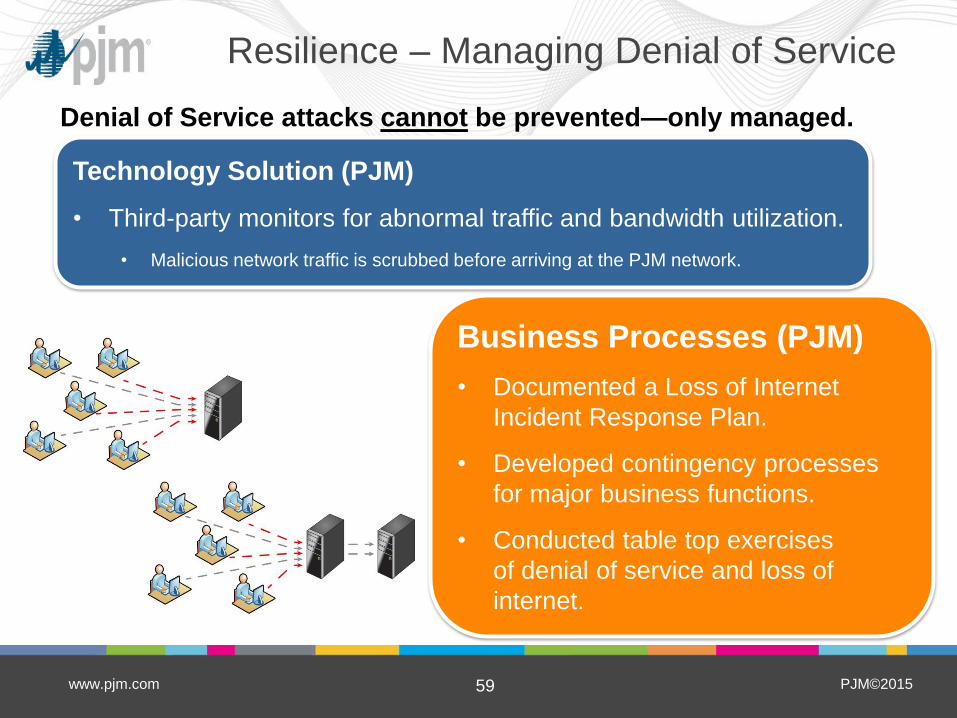
Resilience – Managing Denial of Service
Denial of Service attacks cannot be prevented—only managed.
Technology Solution (PJM)
• Third-party monitors for abnormal traffic and bandwidth utilization.
• Malicious network traffic is scrubbed before arriving at the PJM network.
Business Processes (PJM)
• Documented a Loss of Internet
Incident Response Plan.
• Developed contingency processes
for major business functions.
• Conducted table top exercises
of denial of service and loss of
internet.
www.pjm.com
PJM©2015 60
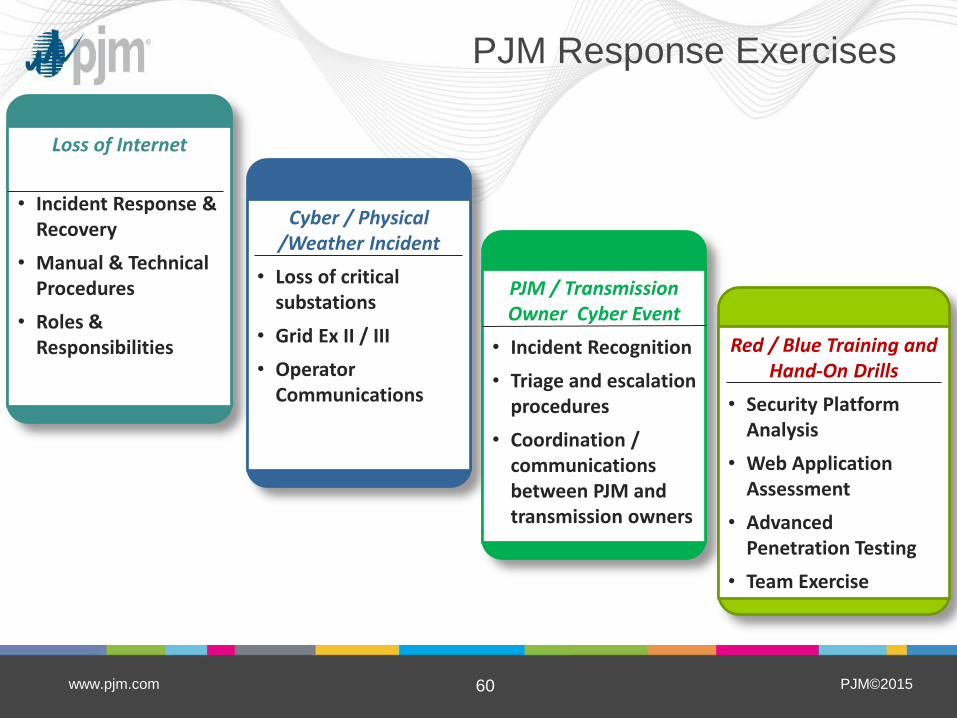
PJM Response Exercises
Loss of Internet
• Incident Response & Recovery
• Manual & Technical Procedures
• Roles & Responsibilities
Cyber / Physical /Weather Incident
• Loss of critical substations
• Grid Ex II / III
• Operator Communications
PJM / Transmission Owner Cyber Event
• Incident Recognition
• Triage and escalation procedures
• Coordination / communications between PJM and transmission owners
Red / Blue Training and Hand-On Drills
• Security Platform Analysis
• Web Application Assessment
• Advanced Penetration Testing
• Team Exercise
www.pjm.com
PJM©2015 61
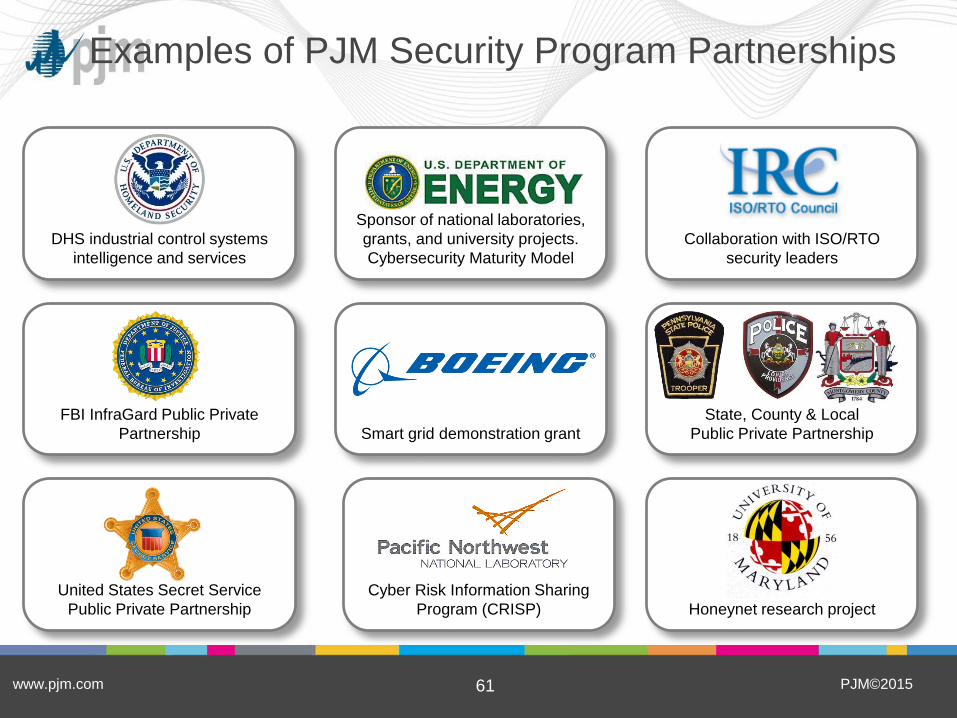
Examples of PJM Security Program Partnerships
www.pjm.com
Sponsor of national laboratories,
grants, and university projects.
Cybersecurity Maturity Model
Honeynet research project
Collaboration with ISO/RTO
security leaders
Smart grid demonstration grant
Cyber Risk Information Sharing
Program (CRISP)
DHS industrial control systems
intelligence and services
FBI InfraGard Public Private
Partnership
State, County & Local
Public Private Partnership
United States Secret Service
Public Private Partnership

The next Energy Policy Council meeting
is tentatively scheduled for
Wednesday, Sept. 16, 2015
at 10 a.m. in the N.C. Nature Research Center Environmental Conference Center