nonprofit executive leadership and transitions …leadertransitions.com/resources/survey...
TRANSCRIPT

R E S E A R C H B Y M A N A G A N C E C O N S U LT I N G I N C O L L A B O R AT I O N W I T H T R A N S I T I O N G U I D E S
F U N D E D B Y T H E A N N I E E . C A S E Y F O U N D AT I O N
R E S E A R C H B Y M A N A G A N C E C O N S U LT I N G I N C O L L A B O R AT I O N W I T H T R A N S I T I O N G U I D E S
F U N D E D I N PA R T B Y T H E A N N I E E . C A S E Y F O U N D AT I O N
NONPROFIT EXECUTIVE LEADERSHIP AND TRANSITIONS SURVEY 2004

Project SupporterThe Annie E. Casey Foundation is aprivate charitable organizationdedicated to helping build betterfutures for disadvantaged children inthe United States. The primarymission of the Foundation is tofoster public policies, human servicereforms, and community supportsthat more effectively meet the needsof today’s vulnerable children andfamilies. In pursuit of this goal, theFoundation makes grants that helpstates, cities, and neighborhoodsfashion more innovative, cost-effective responses to these needs.
Project PartnersThe following organizations were invalu-able partners in this survey. Alliance for Children and FamiliesBig Brothers Big Sisters of AmericaThe Bayer Center for Nonprofit Manage-
ment at Robert Morris UniversityBoys and Girls Clubs of AmericaCamp Fire U.S.A.Family Support AmericaGeorgia Center for NonprofitsGirls Inc.Goodwill Industries InternationalGreater Milwaukee Foundation, Donors
Forum of Wisconsin; Helen BaderInstitute for Nonprofit Management atUniversity of Wisconsin – Milwaukee
Nonprofit Center of Northeast FloridaPoints of Light Foundation and Volunteer
Center National NetworkThe Support Center for Nonprofit Man-
agementUnited Way of AmericaUnited Way Services of Greater Cleve-
land in collaboration with The Cleve-land Foundation
Volunteers of America
by Paige Hull TeegardenProject ManagerManagance Consulting1708 Chester Mill RoadSilver Spring, MD 20906Office Phone: (301) 260-9503Cell Phone: (301) 641-1466Fax: (240) 371-0089www.managance.com
About the AuthorPaige Hull Teegarden is the Vice-President for Research and Client Servicesat Managance Consulting. She has over 12 years of experience working inand with nonprofit organizations. At Managance, Paige is responsible fordesigning evaluation and performance measurement systems, analyzingqualitative and quantitative data, designing and conducting a range of surveyresearch, and conducting research on the coming wave of executive transi-tions in the nonprofit sector. In addition to her research capacity, she is aslead consultant on a variety of firm projects including strategic planningprocesses. Paige earned her Masters in Public Policy at Johns HopkinsUniversity.
Managance Consulting was formed in 2000 by Denice Rothman Hinden,President, to provide a range of custom designed consulting services thatstrengthen organizations that serve communities. The fusion of managementand performance permeates all of Managance Consulting’s services, becausewe believe that strengthening management enables socially responsibleorganizations to achieve results that make a real difference for their clientsand customers. Our core business services are: Strategic Thinking andPlanning, Business Planning, Leadership Transition Planning, and ResultsMeasurement Planning. You can learn more about what we do at ourwebsite, www.managance.com.

Nonprofit Executive Leadership and Transition Survey 2004 2
Introduction
Nonprofit organizations are the social workhorses ofour communities—meeting the needs of the young, theold, and the disadvantaged, feeding the hungry, hous-ing the homeless, and providing us with arts andrecreation. Many people rely on their local nonprofitorganizations, whether as a staff member, volunteer,participant, or recipient of services. Nonprofits arevital to the social, civil, and economic fabric of ourcommunities.
Because nonprofits have a social welfare mandate asopposed to a profit mandate, often a higher percentageof their resources are allocated to providing servicesthan are allocated to building infrastructure or support-ing management functions. This can leave nonprofitsparticularly vulnerable in turbulent times of change.In addition, the thin management structure of manynonprofits means that those nonprofits rely even moreheavily on a single individual—the chief executiveofficer of the organization—for success in accomplish-ing their missions. This tendency is accentuated whenthe chief executive officer is also the founder of theorganization, the person whose passion and commit-ment have made the organization a reality.
Given the thin management structures, the lack ofresources dedicated to infrastructure systems, and thepassion and commitment often found in executives, itisn’t surprising that the period of time between thedeparture of a current executive and the hiring of anew executive director or chief staff officer is fraughtwith risks.
At the same time, this period of executive transitionalso provides a unique moment for organizations tolook at their vision for the future strategically and toseek an executive who will help move them towardthis vision. Transitions offer opportunities for buildingnew capacity, strengthening the vision for the future,adding diversity to the organization’s leadership, andaddressing other organization challenges. The oppor-tunity to diversify the leadership of nonprofits isparticularly salient given that 84% of executives areCaucasian only 42% of the nonprofits that they leadserve primarily white communities, and US communi-ties are becoming more diverse.
Further, research has shown that an “era” of transitionis looming as baby-boomers (who lead many of oursuccessful nonprofits) are reaching retirement age.
Approximately 72 million baby-boomers make up overhalf of the current work force. In comparison, thereare only about 38 million “Generation Xers” to taketheir place.1
Prior Research
Since 2000 the Annie E. Casey Foundation has sup-ported pioneering research to understand the potentialscope of executive leadership transitions in the non-profit sector and to identify and develop practices forassisting nonprofits to successfully manage thesetransitions. The emerging practices resulting from thiswork are becoming commonly referred to as ExecutiveTransition Management (ETM). The Foundation isalso exploring its role in assisting its grant recipientsto move successfully through the organizationalchallenges posed by leadership transitions.
In addition there is a growing body of knowledgeabout executive transitions in nonprofits developed bythe Neighborhood Reinvestment Corporation,CompassPoint Nonprofit Services, and the MarylandAssociation of Nonprofit Organizations and supportedin part by the Annie E. Casey Foundation. Conductedduring the last decade, this research highlights therisks of failed or unsuccessful transitions, noting thatpoorly managed executive transitions incur high coststo organizations and communities. For example,repeated executive turnover often leads to extendedperiods of under-performance. In extreme circum-stances, otherwise healthy organizations playing a vitalrole in their community may go out of business,leaving broken commitments and a lack of communityservices.
This research also indicates that most transitions (asmany as 60%) are non-routine and occur due to anorganizational crisis or the departure of a founder orvisionary leader. It identifies other critical issuesassociated with executive transitions. For example,Daring to Lead, a research report by CompassPoint in2001, discovered that 35% of executives plan to leavetheir jobs within two years and that nearly two-thirdsof executives are in the top position for the first time.Most disturbingly, the study found that fewer than halfplan to take on another executive director position.The existing research and direct work byTransitionGuides and others with more than 200nonprofits during executive transitions over the last
Nonprofit Executive Leadership and Transition Survey 2004 3
three years confirms that a growing number of execu-tive transitions are inevitable, and that there are manypitfalls as well as opportunities ahead.
Method and Response Rate
This survey provides baseline data about the rate oftransitions in nonprofits and the career paths of currentexecutives. It was conducted primarily through a web-based survey instrument. However, paper surveys wereavailable upon request. Some respondents requestedhard copies and completed the paper surveys. Thesurvey was self-administered.
The survey was promoted by The Annie E. CaseyFoundation, 11 of its national partners in the Neighbor-hood Transformation/Family Development NationalCampaign, and 7 local partners. (For the complete listof partners see Appendix B.) In all, 9,000 nonprofitorganizations were invited to respond to the survey.More than 2,200 responded to the survey. The re-sponse rate was 25%.
Finally, survey respondents come from every state inthe United States and every region represented in thisreport had over 130 respondents. Specifically, 38% ofrespondents are from the Midwest, 31% are from theNortheast, 19% are from the Southeast, and 6% eachare from the West Coast and Rocky Mountain/South-west regions. (See appendix for which states areincluded in which regions.)
Method and Response Rate
Sections of Report
• Executive Director Stability & Transitions pg.4• Characteristics of Executives pg.5• Career Paths of Executives pg.6• Management Capacity &
Salary and Benefits pg.6• Transition Support & Succession Plans pg.8• Organization Characteristics pg.8• Highlights & Conclusions pg.9• Recommendations pg.10• Appendix A: Local/Regional Comparisons pg.12• Appendix B: Survey Method & Questions pg.14
Notes about Findings
Where there are statistically significant differencesamong regions of the country, regional comparisonsare shown among the Southeast, Northeast, Mid-west, Rocky Mountains/Southwest, and West Coast.There is a list of states included in each region in theAppendix.More comparison data is available inAppendix A including comparisons of responses inspecific cities to all respondents. Other statisticallysignificant differences by the size of the organiza-tion are also noted. Where percentages do not addto 100%, the missing percentage did not respond tothe question. N represents the number of respon-dents to each question.

Nonprofit Executive Leadership and Transition Survey 2004 4
Executive Director Stability & Transitions
A majority of nonprofit organizations have had rela-tively stable leadership over the last 10 years, with75% having had only one or two executives. Thisrelative stability is somewhat diminished by the 25%of organizations which have had three or more execu-tives in the last 10 years.
In comparing nonprofits by region, there are a fewsignificant differences. Nonprofits in the Northeasthad only one executive in the last 10 years more oftenthan other regions; 47% in the Northeast compared toan average in all regions of 37%. Nonprofits in theSoutheast, West, and Rocky Mountain/Southwest hadmore than one executive in the last 10 years more oftenthan other regions, with between 61% and 63% havinghad 2 or more executives in the past 10 years incomparison to 57% across all regions.
There will be more transitions in the next 5 years thanthere have been in the previous 10 years, indicating anincreasing rate of transitions.2 Twenty-three percent
of executive directors indicate they plan to leave theircurrent jobs in the next 2 years (2004 to 2006) and65% plan to leave by 2009. In comparison, 57% ofnonprofits had experienced an executive transitionbetween 1994 and 2004. This is consistent with otherresearch, which shows a transition rate of 10% per yearin the near term. The rate then increases through 2020.The rate of transition also varies by size of the organi-zation with small organizations experiencing transi-tions more often than large organizations.3
In comparing nonprofits across regions, organizationsin the Southeast will retain executives for a longerperiod of time with 60% of executives in the Southeastplanning to stay in their positions for 5 years or morein comparison to an average of 53% of executives inall regions planning to stay in their positions for 5years or more. None of the other variations by regionwere significantly different from the average of allrespondents.
There is evidence that baby-boomers (who are theexecutives of most of our nonprofits and are currentlyin their 40s and 50s) will retire from the nonprofit
Key Findings
Number of Executives in Past 10 years(n=2224)
42.30%
32.7%
14.8%
5.5%2.3% 1.5% 0.4%
one two three four five six ormore
Don'tKnow
Anticipated Years Remaining in Executive Director Position(n=2210)
7.1%
15.9%
22.5%19.2%
33.8%
less than a year 1 to 2 years 3 to 4 years 5 years More than 5years
Anticipated Number of Years Executives Will Remain In Current Position(n=2210)
18%21%
17%
8%
21%
31%
14%
33%
21% 20%
40%
13%
24%29%
7%
16%19%
34%
22%
8%
35%
30%23%
17%
4%
18%
7%
11%
4%
28%
less than ayear
1 to 2 years 3 to 4 years 5 years More than 5years
Total
Midw est
Northeast
Rock Mountains & Southw est
Southeast
West Coast

Nonprofit Executive Leadership and Transition Survey 2004 5
sector in two waves. Forming the first wave, a littleover half of the baby-boomers (57%) in nonprofitexecutive director positions say they plan to leave by2010, though they may remain a resource to the fieldas consultants or in other part-time roles. The secondwave will be formed by the other 43% of baby boomerexecutives as they reach age 62, the age when workforce participation drops precipitously.4 Even ifbaby-boomers remain working past age 62, they arelikely to significantly reduce work hours. Four out offive of the baby-boomer executives who are staying intheir current positions for more than 5 years plan toretire after leaving their positions. If recent transitionpatterns hold, most of these transitions will occur by2020, when all but the youngest baby-boomers willhave reached 62.
Characteristics of ExecutivesThe average nonprofit executive director is a whitewoman in her 50s with about 6 years of experience asan executive. The pool of executive directors isheavily weighted toward those over 40 years old, with84% over this age and a significant number (55%) over50 years of age.Eighty-four percent of executives are white; 10% are
African American; and 4% are Hispanic/Latino.Deputy directors are slightly more ethnically andracially diverse than the executives. Fifteen percent ofdeputies are African-American compared to 10% ofexecutives. Asian and Latino/Hispanic representationis similar among deputies and executives. In compari-son, 42% of the organizations serve primarily whitecommunities, 22% serve predominately African-American communities, and 25% serve mixed commu-nities.
Fifty-eight percent of the executives are women.Women more often head smaller organizations in terms
of both staff and budget than their male counterparts.The median number of staff for female-led organiza-tions is 6 to 10, whereas for men it is 21 to 50, and themedian budget for female-led organizations is$500,000 to $1 million, whereas for men it is $1million to $2 million. On average, women also earnless than men; making $60,000 to $69,999 compared tomen’s $70,000 to $79,999.
There is a range in the tenure of current executives.Forty-three percent of executives have been in theircurrent positions for 4 years or fewer. Twenty-onepercent have been on the job for fewer than 2 years.On the other hand, 28% have been in their jobs forover 10 years. This distribution demonstrates thatnonprofits have a pool of relatively new leadership aswell as long-time leaders in the field.
Nineteen percent of executives indicate that theyhelped found their organizations. Taking into accountthe overlap between long time executives andfounders, 34% of respondents either helped to foundtheir organizations or have been in their positions forover 10 years.
Almost half (47%) of executives have a Master’sdegree. Another 35% earned a Bachelor’s degree anddid not pursue further education. Twelve percent haveeither aDoctorateor Lawdegree.
Executive Director Age(n=2221)
11.3%
43.7%
28.8%
13.1%2.0%
Over 6051 to 6041 to 5031 to 40Under 30
Executive Director Tenure(n=2215)
15.6%12.6% 11.9%
15.8%22.3% 20.6%
more15
years
11 to15
years
8 to 10years
5 to 7years
2 to 4years
lessthan 2years
Race/Ethnicity of Executives and Organization's Primary Clientele(n=2221)
0%
4%
22%
42%
25%
0.7%
0.7%
83.5%
0%
5%
9.9%
3.6%
0.2%American Indian
Other
Asian
Hispanic/Latino
African American
Caucasian/White
Mixed racial
Exec. Dir.Primary Clientele

Nonprofit Executive Leadership and Transition Survey 2004 6
Career Paths of Executives
A majority of nonprofit executives are in their positionfor the first time (60%). Many (42%) have had experi-ence at some point in their careers in for-profit compa-nies, and 73% have over 10 years experience in thenonprofit sector. When asked about their future plans,a minority (11%) anticipates moving into governmentor for profit businesses. Twenty-one percent plan totake another executive job and 38% plan toretire or semi-retire.The current pool of executive directorsincludes about a third (38%) who have beenexecutives in the past. Twenty percent havehad one other executive position and 18%have had more than one other executiveposition.
While more than half (60%) of executives arein this position for the first time, 73% haveover 10 years of experience working in thenonprofit sector, and 32% have over 25 yearsin the sector.
The career path for most executives includes signifi-cant work in nonprofits, but also includes experiencein multiple sectors at earlier points in their careers.Sixty-one percent worked for a nonprofit immediatelybefore becoming the executive director. The next
highestpercentage,12%, camefrom aposition in afor-profitbusiness.Eightpercentcame from a
government position.
In terms of other experience, executives have movedamong multiple sectors in their careers. Forty-twopercent have worked for a for-profit company at somepoint in their careers, 31% have worked in education,29% have worked in government, 27% were self-employed, and 12% have been consultants.
Finally, a third of respondents (35%) indicate they areplanning to move into other sectors when they leavetheir current positions. Twenty-one percent are plan-ning to take another executive director position in thenon-profit sector and 38% are planning to retire orsemi-retire. Twelve percent of respondents anticipatebecoming a consultant and another 5% indicate aninterest in government or the public sector. A greaternumber of older executives plan to retire or semi-retirewhen they leave their current positions than doyounger executives.
Comparing anticipated next positions across regions,more executives in the Southeast are planning to retireor semi-retire after leaving their current positions thanin other regions (46% in comparison to an average of38%), and more executives in the Rocky Mountain/Southwest area are planning to take another executiveposition (27% in comparison to an average of 21%).Other differences among regions are not significantlydifferent from the average of all respondents.
Management Capacity & Salary and Benefits
Many nonprofits have some staff in senior manage-ment positions, which may serve as a training groundfor executives. However, fewer small organizations
Number of Years in Nonprofit Sector(n=2212)
32%
26%
15%15%10%
Over 25years
16 to 25years
11 to 15years
5 to 10 yearsLess than 5years
Anticipated Next Position(n=2212)
21%
11%7%
35%
13%
4%
39%
27%
15%11%11% 12%
3% 5%
23%
12%5%5%
5%12%
21%
38%
12%5%
38%
12% 7%
22%
12%
3%4%
46%
18%
7%
34%
12%
Retirement NP ExecutiveDirector
Consultant Other Government For Profit
Total
M idwest
Northeast
Rocky M t/Southwest
Southeast
West Coast
Number of Previous Executive Director Positions(n=2212)
1%1%5%11%
20%
60%
five ormore
FourThreeTwoOneNone

Nonprofit Executive Leadership and Transition Survey 2004 7
have any form of middle management than do eithermedium or large organizations. About one third (36%)of all responding organizations have a deputy directoror someone they consider to be the second in charge,and a majority (74%) have program directors. Thedeputy directors are younger and more ethnicallydiverse than the executives.
The table below shows the distribution of organiza-tions with the most common types of senior andmiddle management. Thirty-six percent of all respond-ing organizations have deputy directors, 45% havefundraising personnel, 74% have program directors,and 56% have a finance director. This layer of man-agement allows individuals to build skills and experi-
ence and to potentially move into leadership positionsin the future. However, middle management positionsare less common in smaller organizations. Only 13%of small organizations (under 5 FTE) have a deputydirector compared to 56.5% of large organizations withover 20 FTE. This trend holds for other managementpositions as well as is shown in the table.The deputy directors are younger than executives--30% are under 40 compared to 15% of executives.Further, deputy directors are more diverse--15% areAfrican-American compared to 10% of executives.
Almost half (44%) of executives earn $40,000 to$80,000. Salaries fall into three primary categories:under $40,000 (15%), between $40,000 and $80,000(44%), and over $80,000 (39%).
Most organi-zations offerretirementand healthbenefits toexecutivesand staff.Specifically,64% oforganiza-tions offer their executive retirement benefits to whichthe organization contributes, 79% offer employer-paidhealth insurance, and 73% offer retirement benefits to
staff as well as to executives. Benefits are also relatedto the size of the organization with a larger percentageof large organizations offering retirement and healthbenefits than medium and small organizations.
Comparing salaries across regions, Northeast execu-tives are paid slightly more with 47% earning over$80,000 compared to an average of 29% and execu-tives in the Midwest are paid slightly less with 20%earning under $40,000 in comparison to an average of15%. Other salary differences among regions are notstatistically significant.
When comparing deputy director salaries to executivesalaries, deputies are paid significantly less with 24%of deputies earning under $40,000 compared to 15% of
executives and 26% of deputiesearning over $80,000 in compari-son to 39% of executives.
All 0 to 5 FTE 6 to 20 FTE Over 20 FTEDeputy director 36% 13.0% 33.5% 56.5%Fundraising/Development director 45% 12.0% 46.0% 69.0%Program director 74% 46.0% 77.9% 93.7%Finance director/CFO/Controller 56% 15.0% 54.0% 89.7%
Table: Middle Management by Size of Organization
Executive Director Salaryn=2221
14%
11%
7% 7%
11% 12%10% 11%
10%
5%
$125
K and up
$100
,000 to
$124,9
99
$90 t
o $99
,999
$80 t
o $89
,999
$70 t
o 79,99
99
$60 t
o $69,9
99
$50 t
o $59,9
99
$40 t
o $49
,999
$25 t
o $39,99
9
Under $
25,000
Executive and Deputy Directors Agesn(executives)=2221; n(deputies)=2214
28.8%
13.1%
2.0%
28.8%
34.9%
43.7%
11.3%6.4%
24.3%
5.6%
Over 60
51 to 60
41 to 50
31 to 40
Under 30 Deputy Executive
Executive and Deputy Directors Race/Ethnicityn(executives)=2221; n(deputies)=2214
0.7%
3.6%
9.9%
83.5%
0.2%
1.2%
78.2%
0.7%
0.2%
15.6%
3.7%
1.1%Other
American Indian
Asian
Latino/Hispanic
Black
White
Deputy
Executive
Nonprofit Executive Leadership and Transition Survey 2004 8
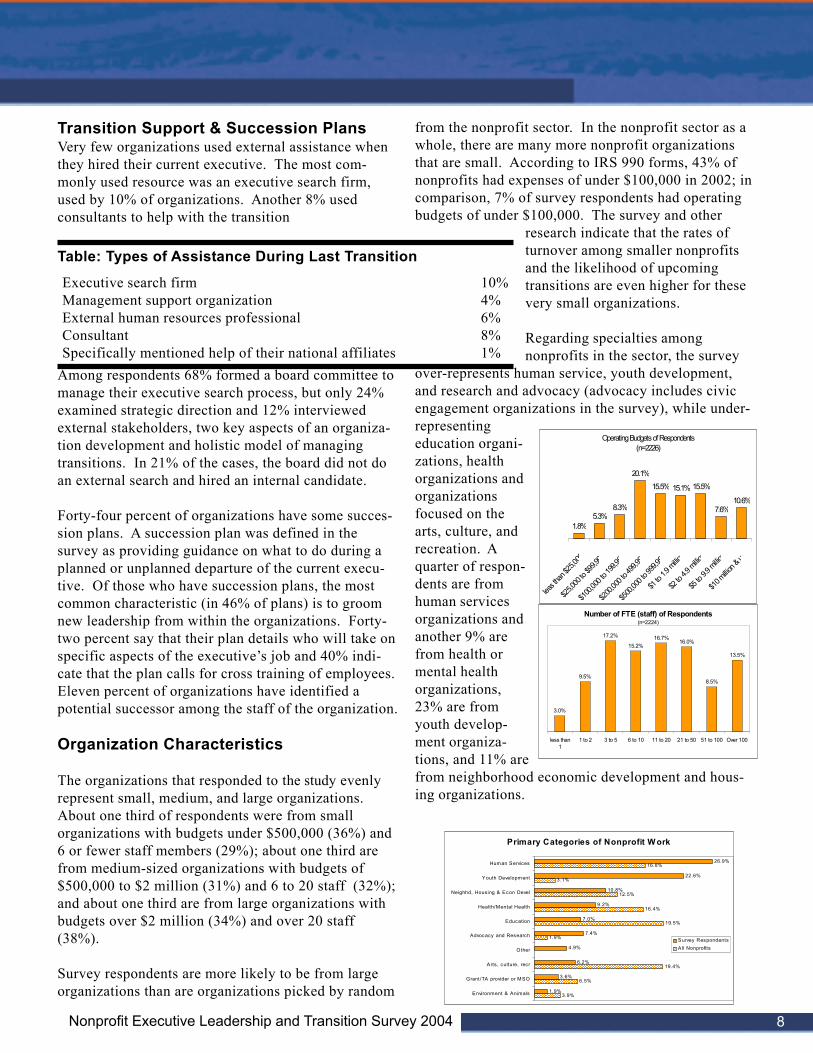
Transition Support & Succession PlansVery few organizations used external assistance whenthey hired their current executive. The most com-monly used resource was an executive search firm,used by 10% of organizations. Another 8% usedconsultants to help with the transition
Among respondents 68% formed a board committee tomanage their executive search process, but only 24%examined strategic direction and 12% interviewedexternal stakeholders, two key aspects of an organiza-tion development and holistic model of managingtransitions. In 21% of the cases, the board did not doan external search and hired an internal candidate.
Forty-four percent of organizations have some succes-sion plans. A succession plan was defined in thesurvey as providing guidance on what to do during aplanned or unplanned departure of the current execu-tive. Of those who have succession plans, the mostcommon characteristic (in 46% of plans) is to groomnew leadership from within the organizations. Forty-two percent say that their plan details who will take onspecific aspects of the executive’s job and 40% indi-cate that the plan calls for cross training of employees.Eleven percent of organizations have identified apotential successor among the staff of the organization.
Organization Characteristics
The organizations that responded to the study evenlyrepresent small, medium, and large organizations.About one third of respondents were from smallorganizations with budgets under $500,000 (36%) and6 or fewer staff members (29%); about one third arefrom medium-sized organizations with budgets of$500,000 to $2 million (31%) and 6 to 20 staff (32%);and about one third are from large organizations withbudgets over $2 million (34%) and over 20 staff(38%).
Survey respondents are more likely to be from largeorganizations than are organizations picked by random
from the nonprofit sector. In the nonprofit sector as awhole, there are many more nonprofit organizationsthat are small. According to IRS 990 forms, 43% ofnonprofits had expenses of under $100,000 in 2002; incomparison, 7% of survey respondents had operatingbudgets of under $100,000. The survey and other
research indicate that the rates ofturnover among smaller nonprofitsand the likelihood of upcomingtransitions are even higher for thesevery small organizations.
Regarding specialties amongnonprofits in the sector, the survey
over-represents human service, youth development,and research and advocacy (advocacy includes civicengagement organizations in the survey), while under-representingeducation organi-zations, healthorganizations andorganizationsfocused on thearts, culture, andrecreation. Aquarter of respon-dents are fromhuman servicesorganizations andanother 9% arefrom health ormental healthorganizations,23% are fromyouth develop-ment organiza-tions, and 11% arefrom neighborhood economic development and hous-ing organizations.
Executive search firm 10%Management support organization 4%External human resources professional 6%Consultant 8%Specifically mentioned help of their national affiliates 1%
Table: Types of Assistance During Last Transition
Number of FTE (staff) of Respondents(n=2224)
13.5%
8.5%
16.0%16.7%
15.2%
17.2%
9.5%
3.0%
Over 10051 to 10021 to 5011 to 206 to 103 to 51 to 2less than1
Primary Categories of Nonprofit W ork
3.9%
6.5%
19.4%
1.9%
19.5%
16.4%
12.5%
3.1%
16.8%
1.9%
3.6%
6.2%
4.9%
7.4%
7.0%
9.2%
10.8%
22.6%
26.9%
Environment & Animals
Grant/TA provider or MSO
Arts , culture, recr
Other
Advocacy and Research
Education
Health/Mental Health
Neighhd, Housing & Econ Devel
Youth Development
Human Services
Survey RespondentsA ll Nonprofits
Operating Budgets of Respondents(n=2226)
1.8%5.3%
8.3%
20.1%
15.5% 15.1% 15.5%
7.6%10.6%
less th
an $2
5,000
$25,0
00 to
$99,9
99
$100,
000 t
o 199,
999
$200,
000 t
o 499,
999
$500,
000 t
o 999,
999
$1 to
1.9 m
illion
$2 to
4.9 m
illion
$5 to
9.9 m
illion
$10 m
illion &
up

Nonprofit Executive Leadership and Transition Survey 2004 9
Largest survey of its kind. With over 2,200respondents from every state, this survey had twotimes as many respondents than the last nationalsurvey of nonprofit executives conducted byCompassPoint in 2001 or the interviews done for “TheState of the Nonprofit Workforce”5 in 2002. It is overfour times the size of the Nonprofit Times SalarySurvey conducted biennially. It is also almost as largeas the Abbott, Lander & Associates Salary and BenefitsSurveys, which are focused primarily on compensa-tion. While there are undoubtedly larger surveys ofnonprofits on a range of leadership issues withinspecific geographic regions, we believe this is thelargest survey in scope and in response rate of non-profit executives about their career paths and antici-pated leadership transitions.
Who Are the Leaders of Nonprofit Organizations?A third of executives are either long-time execu-tives or founders. Nineteen percent of executivesindicate that they helped found their organizations, and28% have been in their jobs for more than 10 years.Taking into account the overlap between the twogroups, 34% of respondents either helped found theirorganizations or had been in their positions for over 10years. Experience supporting organizations duringtransitions indicates organizations losing a long timeexecutive or founder faces particularly challengingissues during the transition.
Most are first-time executives and less than aquarter plan to take another executive position inthe nonprofit sector. A majority of nonprofit execu-tives are in their positions for the first time (60%).Many (42%) have had experience at some point intheir careers in for-profit companies, and 73% havemore than 10 years experience in the nonprofit sector.In the future, only 21% plan to take another executivejob, and 38% plan to retire or semi-retire after leavingtheir current positions. The career path for executivesincludes experience in a range of sectors and evenonce they have reached executive leadership positionsin the nonprofit sector, most don’t plan to remain asemployees of the sector. Women rule the nonprofit sector in terms ofnumbers but run smaller organizations and makeless money than men. Women lead 58% ofnonprofits. However, women more often head smallerorganizations both in terms of staff and budget. The
median number of staff for female-led organizations is6 to 10, whereas for men it is 21 to 50. The medianbudget for female-led organizations is $500,000 to $1million, whereas for male-led organizations it is $1million to $2 million. On average earn, they also earnless than men making $60,000 to $69,999 compared tomen’s $70,000 to $79,999.
There is limited leadership diversity in thesector. Eighty-four percent of executives are white;10% are African American; and 4% are Hispanic/Latino. Deputy Directors are slightly more ethnicallyand racially diverse than the executives. Fifteenpercent of deputies are African-American compared to10% of executives. Asian and Latino/Hispanic repre-sentation is similar among deputies and executives.
What Does the Future Hold for Nonprofit ExecutiveTransitions?The sector is moving from relative stability toinstability at the top.Among survey respondents, 65% said they anticipatean executive transition within five years by 2010. Incomparison, just 57% of nonprofits had experienced anexecutive transition in the past 10 years (1994 to2004). This is consistent with other research, whichshows a transition rate of ten percent a year in the nearterm. The rate will then increase slowly.
Transitions will likely occur in two waves.This study confirms earlier indications that manyexecutives of nonprofit organizations are in their50s (55% are over 50) and that these baby-boomerexecutives are going to leave the sector in twowaves—by 2010 and then another wave by 2020. Forming the first wave, a little over half of the baby-boomers (57%) in nonprofit executive director posi-tions say they plan to leave by 2010, though they mayremain a resource to the field as consultants or in otherpart-time roles. The second wave will be formed by theother 43% of baby boomer executives as they hitretirement age. Four out of five of the baby-boomerexecutives who are staying in their current positionsfor more than 5 years plan to retire after leaving theirpositions. If recent transition patterns hold, most ofthese transitions will occur by 2020, when all but theyoungest baby-boomers will have reached 62, the agewhen work force participation drops precipitously.6
Highlights & Conclusions

Nonprofit Executive Leadership and Transition Survey 2004 10
leaders who might otherwise find many executivepositions filled in the short term and consequentlyleave the sector
Longer-term strategies should be primarily focusedaround dealing with the leadership shortage that willimpact all sectors between 2010 and 2020. Examplesof strategies might include:• Using current long-term, experienced executives to
train younger leaders• Providing leadership opportunities for younger
members of nonprofit staffs (opportunities forgrowth in the field)
• Focusing on both recruitment and retention ofyounger workers
• Providing innovative means for baby-boomers toreduce hours but still be resources to the field
The sector should listen to younger leaders and staffand develop an understanding of what will motivate“tomorrow’s” leaders to stay engaged today. Further,women have been an important source of leadershipfor the sector. Moving forward it will be critical totalk with younger women about what salary andbenefits will be necessary to attract them to leadership.
The increasing number of transitions provides anopportunity to increase the number of people of colorin leadership positions in the nonprofit sector. At thesame time, we should note that in the long term withthe overall leadership shortage across sectors, talentedpeople of color may become even more difficult toattract to nonprofits. Therefore, it is important tocontinue to be proactive and creative about attractingpeople of color into employment in nonprofits.
Nonprofits, with their lower salary structures and longworking hours, may bare the brunt of the comingleadership shortage. While the survey suggests thatthe nonprofit sectoris already be making improvementsin benefits packages, organizations need to continuethis trend-regularly reviewing their compensation andbenefits packages to ensure they are at market levels.
With forethought and planning, nonprofit sector canuse the coming generational waves of transition tostrengthen and diversify the leadership of the sectorand ensure that critical nonprofit organizations are ableto creatively and effectively serve America’s communi-ties.
Recommendations
How Prepared are Nonprofit Organizations forTransitions?Senior management positions exists, but are notextensive in many places.Many organizations have some staff in senior manage-ment positions, which may serve as a training groundfor future executives. About one third (36%) of theorganizations have a deputy director or someone theyconsider to be the second in charge. A majority (74%)has a program director. Smaller organizations havefewer middle management positions than either me-dium or large organizations.
Nonprofit organizations have relatively limitedexperience with transition planning; more haveexperience with succession planning.Very few organizations used external assistance whenthey hired their current executive. The most com-monly used resource was an executive search firm,employed by 10% of organizations. Another 8% usedconsultants. In terms of transition process, 68% formeda board committee to manage their executive searchprocess, but only 24% examined strategic direction and12% interviewed external stakeholders, two key partsof an organization development and holistic approachto managing transitions. On the other hand, 44% oforganizations reported having succession plans.7
Benefits may be better than assumed. Amongrespondents, 64% of organizations offer retirementbenefits to which the organization contributes, 79%offer employer-paid health insurance, and 73% offerretirement benefits to staff as well as executives.
Recommendations
Nonprofits, funders and intermediaries interested inusing the coming increase in executive transitions tostrengthen the sector should pursue both long andshort-term strategies to address the transition patternsof baby-boomers leading most nonprofits in the coun-try. The short term strategies might include:• Raising awareness about the issue and the potential
to use the moment of transition as a time tostrengthen the organization
• Providing assistance to baby-boomers from othersectors looking for positions in the nonprofit sector
• Providing transition support and assistance for thegrowing number of transitions
• Explicitly seeking leadership positions for younger

Nonprofit Executive Leadership and Transition Survey 2004 11
1 Baby-boomers were born from 1945 to 1965; Genera-tion Xers were born from 1966 to 1975; the baby-boom echo or Generation Yers were born from the late1970s through 2000. The baby-boom echo maysurpass the number of people in the original baby-boom. There were 98 million people born from 1976to 2001.2 We compare the last 10 years to the next 5 yearsbecause 10 years provides a longer-range sense of thestability of the leadership in the sector (a specificquestion in the survey was “how many executivedirectors has your organization had in the last 10years?”), while 5 years is the longest realistictimeframe to ask people about their specific employ-ment plans.3 In this survey small organizations have budgets under$500,000 or 6 or fewer staff members; medium-sizedorganizations have budgets of $500,000 to $2 millionor 6 to 20 staff; and large organizations have budgetsover $2 million or over 20 staff.4 Dohm, Arlene. “Gauging the labor force effects ofretiring baby-boomers.” In Monthly Labor ReviewJuly 2000. Washington, DC: Bureau of Labor Statis-tics.5 Light, P. “The Content of their Character: The Stateof the Nonprofit Workforce” in the Nonprofit Quar-terly Fall 2002. Boston: Third Sector New England.6 Dohm, Arlene. “Gauging the labor force effects ofretiring baby-boomers.” In Monthly Labor Review July2000. Washington, DC: Bureau of Labor Statistics.7 A succession plan was defined in the survey asproviding guidance on what to do during a planned orunplanned departure of the current executive director.
Endnotes

Nonprofit Executive Leadership and Transition Survey 2004 12
Appendix A: Local and Regional Comparisons
Following are summaries of information by region. Further, if within each region there was a local sponsor, weincluded data from these local areas.
Summary of Executive Characteristics and Transition Information for the Midwest RegionThe Midwest Region included Iowa, Illinois, Indiana, Kansas, Michigan, Minnesota, Missouri, Nebraska, Ohio,Oklahoma, South Dakota, and Wisconsin.
National Midwest Cleveland Milwaukee
Organizations with 1 or 2 executives in last 10 years 75% 75% 72% 77%Executives transitioning in next 5 years 65% 63% 65% 66%Executives transitioning in next 2 years 23% 26% 28% 26%Executives over 50 years old 55% 54% 51% 55%Executives in position for over 10 years 28% 28% 27% 26%Executives that are founders 19% 20% 18% 26%Executives that are white 84% 84% 74% 84%Serving racially mixed and/or communities of color 56% 46% 55% 46%First-time executive directors 60% 61% 60% 60%Executives with over 10 years in nonprofit sector 73% 73% 74% 69%Executives planning to take another executive position 21% 21% 18% 20%Executives planning to retire 38% 38% 37% 39%Organizations with succession plans 44% 39% 25% 12%
* There were additional respondents from the Midwest that were not in either Cleveland or Milwaukee.
Summary of Executive Characteristics and Transition Information for the Northeast RegionThe Northeast Region included Connecticut, Washington, DC, Delaware, Massachusetts, Maryland, Maine, NewHampshire, New Jersey, New York, Pennsylvania, Rhode Island, and Vermont.
* There were additional respondents from the Northeast that were not in either Greater NYC or Pittsburgh.
National Northeast NYC Pittsburgh
Organizations with 1 or 2 executives in last 10 years 75% 78% 75% 76%Executives transitioning in next 5 years 65% 69% 70% 66%Executives transitioning in next 2 years 23% 25% 30% 26%Executives over 50 years old 55% 55% 54% 50%Executives in position for over 10 years 28% 30% 32% 25%Executives that are founders 19% 23% 24% 24%Executives that are white 84% 83% 77% 85%Serving racially mixed and/or communities of color 56% 56% 61% 38%First-time executive directors 60% 63% 66% 68%Executives with over 10 years in nonprofit sector 73% 76% 74% 70%Executives planning to take another executive position 21% 22% 19% 25%Executives planning to retire 38% 35% 33% 34%Organizations with succession plans 44% 31% 25% 31%
Nonprofit Executive Leadership and Transition Survey 2004 13
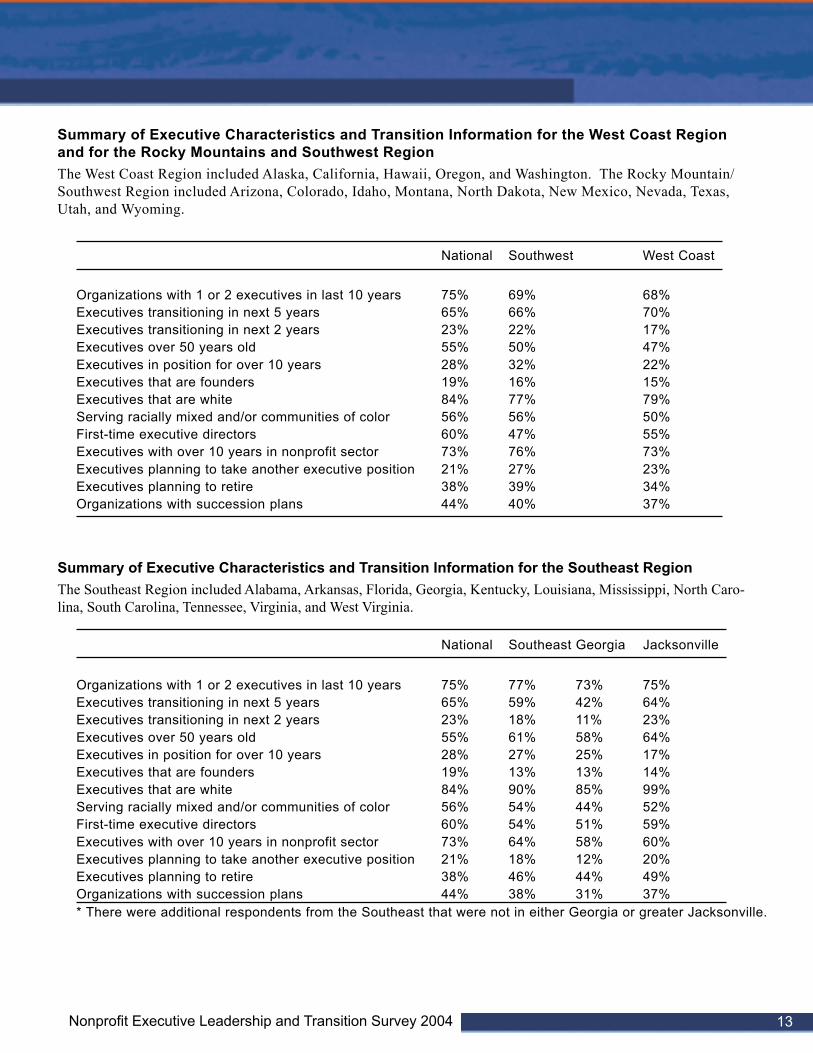
Summary of Executive Characteristics and Transition Information for the West Coast Regionand for the Rocky Mountains and Southwest RegionThe West Coast Region included Alaska, California, Hawaii, Oregon, and Washington. The Rocky Mountain/Southwest Region included Arizona, Colorado, Idaho, Montana, North Dakota, New Mexico, Nevada, Texas,Utah, and Wyoming.
National Southwest West Coast
Organizations with 1 or 2 executives in last 10 years 75% 69% 68%Executives transitioning in next 5 years 65% 66% 70%Executives transitioning in next 2 years 23% 22% 17%Executives over 50 years old 55% 50% 47%Executives in position for over 10 years 28% 32% 22%Executives that are founders 19% 16% 15%Executives that are white 84% 77% 79%Serving racially mixed and/or communities of color 56% 56% 50%First-time executive directors 60% 47% 55%Executives with over 10 years in nonprofit sector 73% 76% 73%Executives planning to take another executive position 21% 27% 23%Executives planning to retire 38% 39% 34%Organizations with succession plans 44% 40% 37%
Summary of Executive Characteristics and Transition Information for the Southeast RegionThe Southeast Region included Alabama, Arkansas, Florida, Georgia, Kentucky, Louisiana, Mississippi, North Caro-lina, South Carolina, Tennessee, Virginia, and West Virginia.
National Southeast Georgia Jacksonville
Organizations with 1 or 2 executives in last 10 years 75% 77% 73% 75%Executives transitioning in next 5 years 65% 59% 42% 64%Executives transitioning in next 2 years 23% 18% 11% 23%Executives over 50 years old 55% 61% 58% 64%Executives in position for over 10 years 28% 27% 25% 17%Executives that are founders 19% 13% 13% 14%Executives that are white 84% 90% 85% 99%Serving racially mixed and/or communities of color 56% 54% 44% 52%First-time executive directors 60% 54% 51% 59%Executives with over 10 years in nonprofit sector 73% 64% 58% 60%Executives planning to take another executive position 21% 18% 12% 20%Executives planning to retire 38% 46% 44% 49%Organizations with succession plans 44% 38% 31% 37%* There were additional respondents from the Southeast that were not in either Georgia or greater Jacksonville.

Nonprofit Executive Leadership and Transition Survey 2004 14
The nonprofit executive leadership surveys were conducted primarily through a web-based survey instrument.However, paper surveys were available upon request. Some respondents did request hard copies and completedthe paper surveys. The survey was self-administered.
The survey was promoted by a variety of partner organizations to their networks and to nonprofits in theircommunities. First, The Annie E. Casey Foundation reached out to its national partners in the NeighborhoodTransformation/Family Development National Campaign and invited these partners to include their local mem-bers/affiliates in the survey. Collectively, the networks affiliated with the national partners represent a signifi-cant share of the nation’s health and human services field. Eleven of the national organizations participated inthe survey, some including all local executive directors in the sample, others targeting specific subgroups. In all,932 leaders completed the survey, offering significant insight into the leadership transition issues affecting thiscommunity. Specifically, the following Annie E. Casey Foundation national partners encouraged their affiliatesand networks to participate in the survey:
• Alliance for Children and Families• Big Brothers Big Sisters of America• Boys & Girls Clubs of America• Camp Fire U.S.A.• Family Support America• Girls Inc.• Goodwill Industries International• Points of Light Foundation and Volunteer Center National Network• United Way of America• Volunteers of America
In addition, Annie E. Casey Foundation grant recipients from 2002, 2003, or 2004 were encouraged to partici-pate.
Finally, TransitionGuides solicited participation of local partners, as shown below, and worked with these part-ners to invite their networks and other nonprofits in their area to participate in the survey:
• The Bayer Center for Nonprofit Management (Greater Pittsburgh area)• Georgia Center for Nonprofits (Atlanta and nonprofits across the state)• Greater Milwaukee Foundation Donors Forum of Wisconsin and Helen Bader Institute for Non-
profit Management at the University of Wisconsin –Milwaukee (Greater Milwaukee)• Nonprofit Center of Northeast Florida, in collaboration with the United Way of Northeast
Florida, Community Foundation, the Jessie Ball duPont Fund, and the Jacksonville Children’sCommission (Greater Jacksonville)
• The Support Center for Nonprofit Management (Greater New York City)• United Way Services of Greater Cleveland in collaboration with The Cleveland Foundation
In all, 9,000 nonprofit organizations were invited to respond to the survey. More than 2,200 responded to thesurvey. The response rate was about 25%.
We used a variety of techniques to eliminate duplication in the data that would have arisen because of thesevarious data collection methods. First we asked respondents if they had completed the survey before and usedthis to identify potential duplications. We also cleaned the data by sorting according to city and state and scan-ning for duplicate responses. In this way, we were able to eliminate over 50 duplicate entries.
Appendix B: Survey Method & Questions

Nonprofit Executive Leadership and Transition Survey 2004 15
Analysis DescriptionsIn some cases, the percentages of the categories do not add up to 100%, because respondents did not answer thequestions. All the graphs in the report are based on unique responses.
We did note an appreciable degree of differences among the small, medium, and large organizations in terms ofpast and impending stability of the organizations (Q11 and Q31). To test the statistical significance of the differ-ences, a series of t tests were conducted. All results that were statistically significant at the 95% level are notedin the report.
Variable DescriptionsSeventy-three variables are identified in the survey questions. Following are the survey questions, possibleresponses, and coding used in data analysis.
1. Have you completed this survey within the last 2 months? 0 = FALSE; 1 = TRUE2. Please tell us what city your organization is located in.3. Please tell us what state your organization is located in using the 2-letter abbreviation.4. The organization I lead received funding from United Way Services of Great Cleveland in 2002, 2003, or 2004. 0 = no;
1 = yes5. The organization I lead received funding from Cleveland Foundation in 2002, 2003, or 2004. 0 = no; 1 = yes6. The organization I lead received a grant from the Annie E. Casey Foundation in 2002, 2003, or 2004. 0 = no; 1 = yes7. The organization I lead is a member/affiliate of United Way of America. 0 = no; 1 = yes8. The organization I lead is a member/affiliate of Boys & Girls Clubs of America. 0 = no; 1 = yes9. The organization I lead is a member/affiliate of Big Brothers Big Sisters of America. 0 = no; 1 = yes10. The organization I lead is a member/affiliate of Girls Inc. 0 = no; 1 = yes11. The organization I lead is a member/affiliate of NCCED. 0 = no; 1 = yes12. The organization I lead is a member/affiliate of Points of Light Foundation & Volunteer Center National Network. 0 =
no; 1 = yes13. The organization I lead is a member/affiliate of Camp Fire USA. 0 = no; 1 = yes14. The organization I lead is a member/affiliate of Goodwill Industries International Inc. 0 = no; 1 = yes15. The organization I lead is a member/affiliate of Alliance for Children and Families. 0 = no; 1 = yes16. The organization I lead is a member/affiliate of GA. 0 = no; 1 = yes17. The organization I lead is a member/affiliate of Family Support America. 0 = no; 1 = yes18. How many paid staff members are there in the organization? 1 = over 100; 2 = 51 to 100; 3 = 21 to 50; 4 = 11 to 20; 5 =
6 to 10; 6 = 3 to 5; 7 = 1 to 2; 8 = less than 119. What is the organization’s current operating budget? 1 = 10 million and up; 2 = 5 million to 9.9 million; 3 = 2 million to
4.9 million; 4 = 1 million to 1.9 million; 5 = 500,000 to 999,999; 6 = 200,000 to 499,999; 7 = 100,000 to 199,999; 8 =25,000 to 99,999; 9 = less than 25,000
20. Which of the following best describes the primary category of the organization’s work? 1 = other; 2 = youth develop-ment; 3 = research; 4 = neighborhood revitalization; 5 = human services; 6 = health/mental health; 7 = environment; 8 =employment/job related; 9 = education; 10 = arts, culture, recreation; 11 = affordable housing development or manage-ment; 12 = advocacy
21. Please enter further details for the “other” item you entered above.22. Please select the following that most accurately describes the organization’s primary clientele. 1 = other; 2 = mixed racial
and ethnic; 3 = American Indian; 4 = Asian/Pacific Islander; 5 = Latino or Hispanic; 6 = African American/black; 7 =Caucasian/white
23. Please enter further details for the “other” item you entered above.24. How many executive directors has the organization had in the last 10 years? 1 = I don’t know; 2 = six or more; 3 = five; 4
= four; 5 = three; 6 = two; 7 = one25. When the current executive director was hired - executive search firm 0 = no; 1 = yes26. When the current executive director was hired - management support organization 0 = no; 1 = yes27. When the current executive director was hired - external human resources professional 0 = no; 1 = yes28. When the current executive director was hired – consultant 0 = no; 1 = yes29. When the current executive director was hired – other 0 = no; 1 = yes30. Please enter further details for the “other” item you entered above.

Nonprofit Executive Leadership and Transition Survey 2004 16
31. Board formed a committee to manage finding a new executive director. 0 = no; 1 = yes32. Board engaged in some strategic planning before seeking a new executive or soon after the hire. 0 = no; 1 = yes33. Stakeholders were interviewed about their perception of the organization. 0 = no; 1 = yes34. Board convened, decided to forgo an external search, and hired an internal candidate. 0 = no; 1 = yes35. Organization doesn’t have a succession plan. 0 = no; 1 = yes36. Details who will be responsible for each component of the executive director’s job 0 = no; 1 = yes37. Describes who will let other staff and stakeholders know about the change in executive leadership 0 = no; 1 = yes38. Cross-training of staff so they can take on management and leadership responsibilities 0 = no; 1 = yes39. Grooms new leadership within the organization 0 = no; 1 = yes40. Other 0 = no; 1 = yes41. Has a successor to the current executive director been identified from among the staff of the organization? 0 = no; 1 = yes42. Mark all of the following positions that are currently filled - executive director/CEO/president 0 = no; 1 = yes43. Mark all of the following positions that are currently filled - deputy director/COO/associate director 0 = no; 1 = yes44. Mark all of the following positions that are currently filled - fundraising/development director 0 = no; 1 = yes45. Mark all of the following positions that are currently filled - program directors 0 = no; 1 = yes46. Mark all of the following positions that are currently filled - finance director/CFO/controller 0 = no; 1 = yes47. Mark of the following which the organization offers - retirement plan to which the organization contributes 0 = no; 1 =
yes48. Mark of the following which the organization offers - retirement plan to which the employee contributes 0 = no; 1 = yes49. Mark of the following which the organization offers - health insurance which is partly paid for by the organization 0 =
no; 1 = yes50. Mark of the following which the organization offers - health insurance which is paid for by the employees 0 = no; 1 = yes51. Does the organization offer retirement benefits to staff other than the executive? 0 = no; 1 = yes52. What is the age of the executive director? 1 = over 60; 2 = 51 to 60; 3 = 41 to 50; 4 = 31 to 40; 5 = under 3053. What is the gender of the executive director? 1 = female; 2 = male54. Please mark of the following which most accurately describes the executive director’s race or ethnicity. 1 = other; 2 =
American Indian; 3 = Asian/Pacific Islander; 4 = Latino or Hispanic; 5 = African American/black; 6 = Caucasian/white55. Please mark the following that most accurately describes the executive director’s current annual salary. 1 = 125,000 and
up; 2 = 100,000 to 124,999; 3 = 90,000 to 99,999; 4 = 80,000 to 89,999; 5 = 70,000 to 79,999; 6 = 60,000 to 69,999; 7 =50,000 to 59,999; 8 = 40,000 to 49,999; 9 = 25,000 to 39,999; 10 = 0 to 24,999
56. What is the highest level of education that the executive director has completed? 1 = other; 2 = doctorate degree; 3 = lawdegree; 4 = master’s degree; 5 = bachelor’s degree; 6 = AA degree; 7 = high school
57. What is the age of the deputy director/COO/associate director? 1 = we don’t have a 2nd-in-charge; 2 =over 60; 3 = 51 to60; 4 = 41 to 50; 5 = 31 to 40; 6 = under 30
58. What is the gender of the deputy director/COO/associate director? 1 = we don’t have a 2nd-in-charge; 2 = female; 3 =male
59. Please mark the following which most accurately describes the deputy director/COO/associate director’s race or ethnicity.1 = we don’t have a 2nd-in-charge; 2 = other; 3 = American Indian; 4 = Asian/Pacific Islander; 5 = Latino or Hispanic; 6= African American/black; 7 = Caucasian/white
60. Please mark the following that most accurately describes the deputy director/COO/associate director’s current annualsalary. 1 = we don’t have a 2nd-in-charge; 2 = 125,000 and up; 3 = 100,000 to 124,999; 4 = 90,000 to 99,999; 5 = 80,000to 89,999; 6 = 70,000 to 79,999; 7 = 60,000 to 69,999; 8 = 50,000 to 59,999; 9 = 40,000 to 49,999; 10 = 25,000 to39,999; 11 = 0 to 24,999
61. How long have you been in your position as executive director? 1 = more than 15 years; 2 = 11 to 15 years; 3 = 8 to 10years; 4 = 5 to 7years; 5 = 2 to 4 years; 6 = less than 2 years
62. Did you help found the organization? 1 = no; 2 = yes63. Knowing that the future may be impossible to predict, how much longer do you imagine that you will stay in your current
position as executive director? 1 = more than 5 years; 2 = 5 years; 3 = 3 to 4 years; 4= 1 to 2 years; 5 = less than 1 year64. How many previous executive director positions have you held? 1 = five or more; 2 = four; 3 = three; 4 = two; 5 = one; 6
= none65. How many years have you worked in the nonprofit sector? 1 = over 25 years; 2 = 16 to 25 years; 3 = 11 to 15 years; 4 = 5
to 10 years; 5 = less than 5 years66. Immediately prior to taking this executive director position, in which sector did you work? 1 = other; 2 = didn’t work
outside the home; 3 = nonprofit organization; 4 = government position; 5 = in school; 6 = other for-profit business/corporate sector; 7 = consulting firm; 8 = self=employed
Nonprofit Executive Leadership and Transition Survey 2004 17
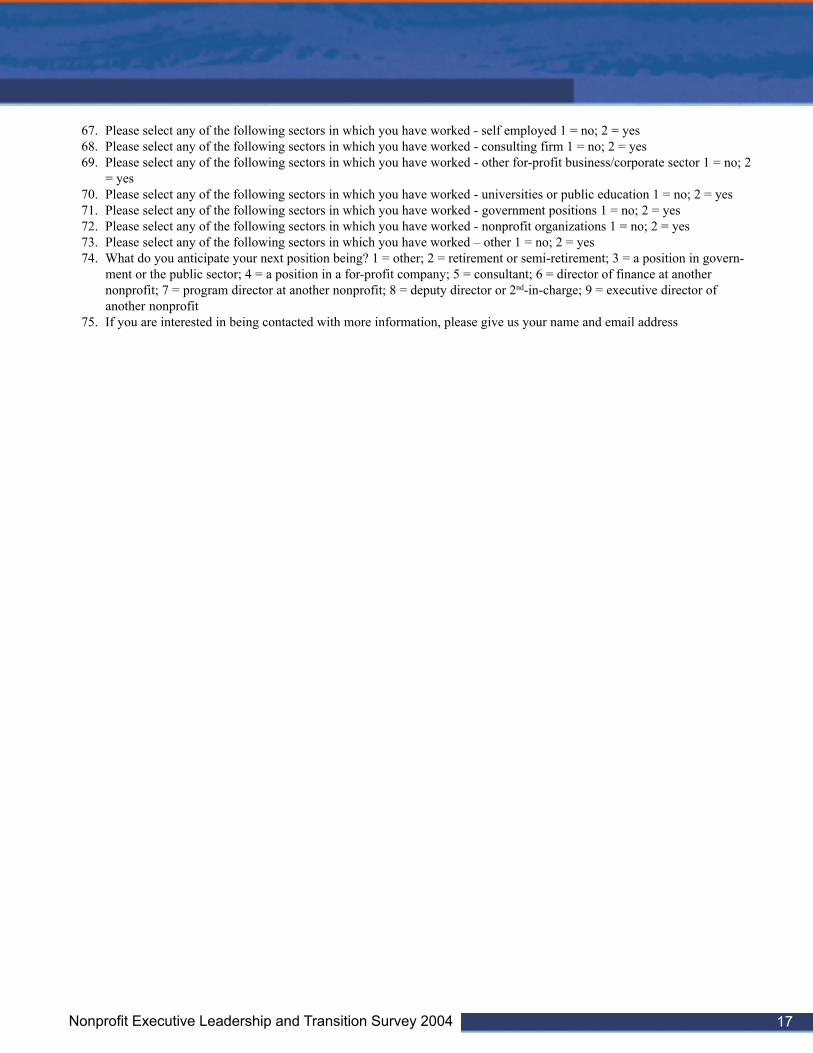
67. Please select any of the following sectors in which you have worked - self employed 1 = no; 2 = yes68. Please select any of the following sectors in which you have worked - consulting firm 1 = no; 2 = yes69. Please select any of the following sectors in which you have worked - other for-profit business/corporate sector 1 = no; 2
= yes70. Please select any of the following sectors in which you have worked - universities or public education 1 = no; 2 = yes71. Please select any of the following sectors in which you have worked - government positions 1 = no; 2 = yes72. Please select any of the following sectors in which you have worked - nonprofit organizations 1 = no; 2 = yes73. Please select any of the following sectors in which you have worked – other 1 = no; 2 = yes74. What do you anticipate your next position being? 1 = other; 2 = retirement or semi-retirement; 3 = a position in govern-
ment or the public sector; 4 = a position in a for-profit company; 5 = consultant; 6 = director of finance at anothernonprofit; 7 = program director at another nonprofit; 8 = deputy director or 2nd-in-charge; 9 = executive director ofanother nonprofit
75. If you are interested in being contacted with more information, please give us your name and email address

AcknowledgementsThis survey would not have been possible withoutthe pioneering work of Tom Adams ofTransitionGuides and Tim Wolfred ofCompassPoint in San Francisco. In the early1990s, CompassPoint completed the first surveyof executives, which raised many of the issuesthat this report further explores. Donna Stark andSherri Killins at the Annie E. Casey Foundationprovided unwavering support for the idea thatleadership transitions can provide an opportunityfor improving the capacity of nonprofit organiza-tions. Their support for this and other researchhas helped to build a baseline from which the rateof transitions over the next 10 years can be mea-sured. Our partners, undaunted by technicalchallenges, advertised the survey and encour-aged executive directors in their networks tocomplete it. Without them this data would notexist. Xiaomei Tan, PhD candidate at The Ameri-can University, provided invaluable data analysissupport. Thank you all!
CreditsJohn Beilenson of Strategic Communications &Planning provided editorial support. Media Studios provided graphic design assis-tance.
Contact informationFor additional copies of this publication, pleasevisit the Annie E. Casey Foundation website atwww.aecf.org/initiatives/leadership or LeadershipLearning Community atwww.leadershiplearning.org

This research was funded in part by the Annie E. Casey Foundation. We thank them for their support but acknowledge that the findings and conclusions presented in this report are those of the author(s) alone, and do not necessarily reflect the opinions of the Foundation.
Further information about TransitionGuides at www.transitionguides.com Further information about Managance Consulting at www.managance.com