nonlinear subjective and dynamic responses of seated subjects exposed to horizontal whole-body...
TRANSCRIPT
ARTICLE IN PRESS
JOURNAL OFSOUND ANDVIBRATION
0022-460X/$ - s
doi:10.1016/j.js
�CorrespondE-mail addr
Journal of Sound and Vibration 321 (2009) 416–434
www.elsevier.com/locate/jsvi
Nonlinear subjective and dynamic responses of seated subjectsexposed to horizontal whole-body vibration
G.H.M.J. Subashia, N. Nawaysehb, Y. Matsumotoa, M.J. Griffinc,�
aDepartment of Civil and Environmental Engineering, Saitama University, 255 Shimo-Ohkubo, Sakura, Saitama 338-8570, JapanbMechanical Engineering Department, College of Engineering, Dhofar University, PO Box 2509,
Postal Code 211 Salalah, Sultanate of OmancHuman Factors Research Unit, Institute of Sound and Vibration Research, University of Southampton, Southampton SO17 1BJ, UK
Received 28 February 2008; received in revised form 10 September 2008; accepted 16 September 2008
Handling Editor: C.L. Morfey
Available online 17 November 2008
Abstract
The effect of the magnitude of fore-and-aft and lateral vibration on the subjective and mechanical responses of seated
subjects has been investigated experimentally using simultaneous measurements of relative discomfort and apparent mass.
Twelve male subjects were exposed to sinusoidal vibration at nine frequencies (between 1.6 and 10Hz) at four magnitudes
(in the range 0.125–1.0m s�2 r.m.s.) in both horizontal directions (fore-and-aft and lateral). The method of magnitude
estimation was used to estimate discomfort relative to that caused by a 4Hz reference vibration in the same axis. The
apparent mass was calculated from the acceleration and the applied force so as to quantify the mechanical response of the
body. With each direction of excitation, the apparent mass was normalised by dividing it by the apparent mass obtained at
4Hz, so that the mechanical responses could be compared with the subjective responses.
The relative discomfort and the normalised apparent mass were similarly affected by the frequency and magnitude of
vibration, with significant correlations between the relative discomfort and the normalised apparent mass. The results
indicate that the discomfort caused by horizontal whole-body vibration is associated with the apparent mass in a frequency
range where motion of the whole body is dominant. In this frequency range, the nonlinear subjective responses may be
attributed, at least in part, to the nonlinear dynamic responses to horizontal whole-body vibration.
r 2008 Elsevier Ltd. All rights reserved.
1. Introduction
People in sitting postures may be exposed to horizontal vibration while in transport and in workingenvironments. A reduction of discomfort caused by such vibration will improve the quality of environmentswhere people cannot avoid vibration exposure. When the vibration is complex and contains manycomponents, one way to reduce vibration discomfort is to reduce the magnitude of the vibration componentthat is perceived as greatest.
ee front matter r 2008 Elsevier Ltd. All rights reserved.
v.2008.09.041
ing author. Tel.: +44 238 059 2277.
ess: [email protected] (M.J. Griffin).

ARTICLE IN PRESSG.H.M.J. Subashi et al. / Journal of Sound and Vibration 321 (2009) 416–434 417
Current standards (e.g., ISO 2631–1 [1] and BS 6841 [2]) define methods of evaluating human exposures tovibration using frequency weightings believed to represent the dependence of human response to vibration onvibration frequency. These frequency weightings have been based on the frequency-dependence of subjectiveresponses, mainly vibration discomfort, found in experimental studies. Donati et al. [3] found that sittingsubjects may be less sensitive to fore-and-aft acceleration at 1Hz than at 2 or 3Hz. Corbridge and Griffin [4]found that maximum sensitivity to lateral acceleration occurred between 1.25 and 2Hz, with sensitivitydecreasing at higher and lower frequencies. Miwa [5] found that sensitivity to lateral acceleration decreased atfrequencies greater than about 3.15Hz.
Previous frequency weightings have mainly been based on the assumption that the frequency-dependence ofvibration discomfort is independent of vibration magnitude. A few studies have investigated the effect ofvibration magnitude on subjective responses to horizontal vibration [6–8]. Griffin et al. [6] investigated theeffect of vibration magnitude on equivalent comfort contours with horizontal vibration at frequencies from1 to 63Hz in the magnitude range between 0.5 and 1.25m s�2 r.m.s. They reported ‘‘over the range of levelsinvestigated the differences in shape of contours of equivalent discomfort for translational vibration are smallcompared with differences between individuals’’ and that ‘‘for this range of levels it therefore seems reasonableto determine and apply a single equivalent comfort contour’’. Howarth and Griffin [7] investigated the effectof vibration magnitude on subjective reaction to vibration at frequencies between 4 and 63Hz at lowmagnitudes between 0.04 and 0.4m s�2 r.m.s. They concluded that the frequency weighting Wd in BS 6841 [2]provided a ‘‘reasonable approximation to the frequency dependence of subjective response’’ to lateralvibration measured in the experiment, although some evidence of the effect of vibration magnitude can be seenin the frequency weightings determined from their experimental results at different vibration magnitudes.Morioka and Griffin [8] investigated the effect of vibration magnitude on equivalent comfort contours morecomprehensively with frequencies from 2–315Hz and velocities from 0.02–1.25m s�1 r.m.s. They concludedthat ‘‘the shapes of the equivalent comfort contours depended on vibration magnitude’’ and ‘‘no single linearfrequency weighting can provide accurate predictions of discomfort caused by a wide range of magnitudes ofwhole-body vibration’’.
The biodynamic responses of the body exposed to horizontal vibration have been found to be nonlinear: theresonance frequencies of the apparent mass (or the mechanical impedance) decrease with increases in vibrationmagnitude [9–12]. There appear to be three resonances in the fore-and-aft apparent mass of the seated bodyover the frequency range below 10Hz. A first resonance has been found at around 1Hz [9,10], with noinfluence of vibration magnitude on the resonance frequency of this mode [9]. A second resonance frequencyhas been found between 1 and 3Hz, with the frequency decreasing with increasing vibration magnitude [9–11].A third resonance, between 3 and 5Hz, also shows a nonlinear characteristic [10–12] and is more visible withlow vibration magnitudes than high vibration magnitudes. With lateral excitation of the seated body, the firstresonance appears at about 0.7Hz and does not seem to be affected by vibration magnitude [9]. A secondresonance has been identified between 1.5 and 3Hz [9,11] and decreases with increasing vibration magnitude.A third resonance in the apparent mass has been reported between 5 and 6Hz and appears to decrease withincreasing vibration magnitude [11,12].
A comparison of previous studies of subjective responses and dynamic responses suggests that the seatedhuman body is more sensitive to fore-and-aft (or lateral) acceleration at frequencies close to peaks in theapparent mass. The similarity between subjective and dynamic responses of the seated body suggests thesubjective responses may be associated with the dynamic responses. If the subjective responses are related tothe dynamic responses, the subjective responses will show a nonlinearity similar to the nonlinearity in thedynamic responses.
There is some evidence that the subjective responses are correlated with the dynamic responses of the seatedbody exposed to vertical vibration [13,14]. Griffin and Whitham [13] found a relation between the subjectiveresponse and the transmissibility to the head at frequencies less than 6.3Hz and greater than 16Hz.Matsumoto and Griffin [14] found that subjective responses were correlated with the mechanical impedanceand the apparent mass in the frequency range between 3.15 and 8.0Hz. There is no known study of anassociation between the subjective and dynamic responses of the body exposed to horizontal vibration (i.e.,fore-and-aft or lateral vibration), although horizontal vibration is present on the seats of vehicles and cancontribute to discomfort [15,16].

ARTICLE IN PRESSG.H.M.J. Subashi et al. / Journal of Sound and Vibration 321 (2009) 416–434418
The objective of this study was to investigate the correlation between subjective and dynamic responses ofseated subjects exposed to fore-and-aft and lateral vibration, focusing on the effects of vibration magnitudewith both responses. It was hypothesised that subjective and dynamic responses to fore-and-aft and lateralvibration would be nonlinear. It was also hypothesised that the nonlinearity in the subjective response wouldbe related to the nonlinearity in the dynamic response. The subjective responses were represented bymagnitude estimates of discomfort and the dynamic responses were represented by the apparent massfrequency response functions. The effects of the frequency and magnitude of the input vibration on thecorrelation between the magnitude estimates of discomfort and the apparent mass were investigated byobtaining simultaneous measurements of subjective and dynamic responses.
2. Method
2.1. Apparatus
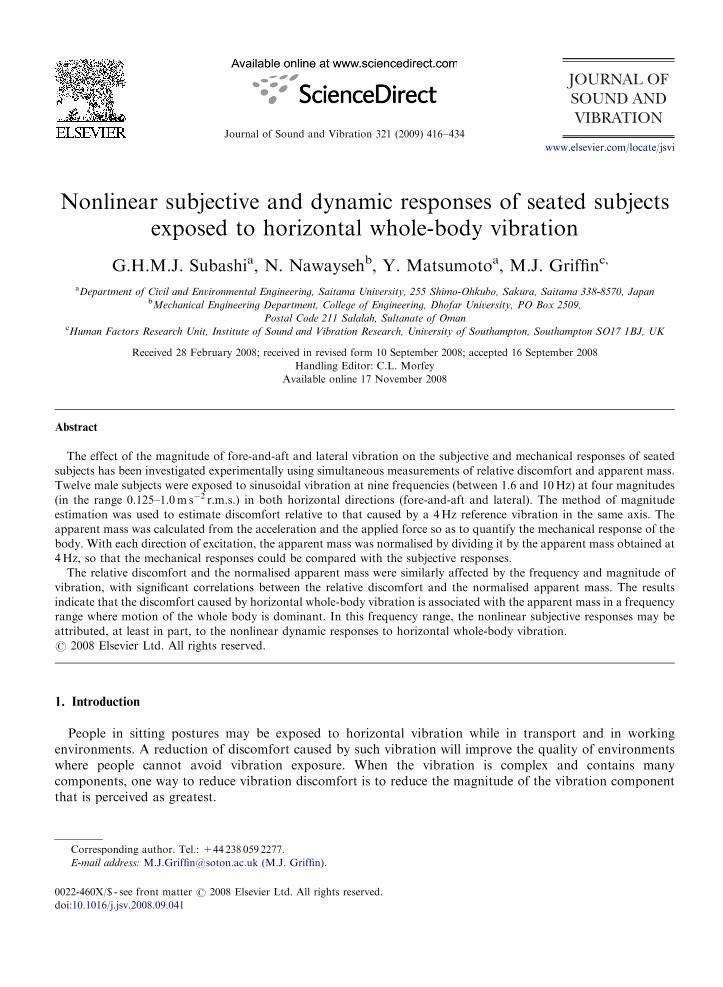
A slip table made by Kinball Industries, Inc. was driven by an electro-dynamic vibrator, Derritron VP 85, toproduce horizontal vibration. A tri-axial force platform, Kistler 9281 B, was rigidly fixed on the top plate ofthe slip table so as to measure the forces at the interface between the vibrating surface and seated subjects.A piezoresistive uni-axial accelerometer, Entran, EGCSY-240D*-50, was mounted on the top surface of theforce platform to measure the acceleration in the direction of excitation. Subjects were seated on the topsurface of the force platform. Their feet were supported on a stationary footrest with the upper surface of theirupper legs horizontal when at rest. A photograph of experimental setup with a seated subject is shown inFig. 1.
2.2. Subjects
Twelve male volunteers from the staff and students of the University of Southampton participated in theexperiment. Their characteristics were represented by a median age of 27 years (range 23–51 years), medianheight 1.78m (range 1.70–1.86m) and median weight 73 kg (range 60–85 kg). The experiment was approved bythe Human Experimentation Safety and Ethics Committee of the Institute of Sound and Vibration Research(ISVR), University of Southampton prior to the commencement of the experiment that was conducted in alaboratory at the ISVR.
2.3. Experimental conditions
Sinusoidal vibration having frequencies of 1.6, 2.0, 2.5, 3.15, 4.0, 5.0, 6.3, 8.0, and 10.0Hz were used in theexperiment. The duration of vibration was 4 s with the first 0.5 s and last 0.5 s tapered by cosine functions.
Slip table
Force platform
Subject inupright sitting
posture
Fig. 1. A photograph of experimental setup with a seated subject.

ARTICLE IN PRESSG.H.M.J. Subashi et al. / Journal of Sound and Vibration 321 (2009) 416–434 419
Four different magnitudes of vibration were used in the experiment: 0.125, 0.25, 0.5, and 1.0m s�2 r.m.s.Stimuli with a frequency of 1.6Hz at 0.5 and 1.0m s�2 r.m.s., and stimuli with frequencies of 2.0 and 2.5Hz at1.0m s�2 r.m.s. were not presented due to a displacement limitation of the vibrator.
Subjects were exposed to a series of two vibrations: a 4 s ‘reference’ stimulus and a 4 s ‘test’ stimuluspresented with an interval of 2 s. The reference stimulus was at 4Hz. The acceleration magnitude of thereference stimulus was the same as that of the test stimulus. The order of presenting the magnitudes and thefrequencies of the test stimuli was randomized among the 12 subjects. An experimental session consisted oftwo parts: exposure to fore-and-aft vibration and exposure to lateral vibration, achieved by changing theorientation of the seated subjects.
2.4. Measurements
Relative discomfort was measured using the method of magnitude estimation. The magnitude of discomfortassigned to all reference stimuli was 100. Subjects were asked to estimate the discomfort caused by the teststimuli relative to the discomfort caused by the reference stimulus. For example, a subject who considered thata test stimulus was half as uncomfortable as the reference stimulus should assign it the value of 50. A subjectwho considered a test stimulus to be twice as uncomfortable as the reference stimulus should assign it the valueof 200.
For each stimulus, the acceleration and the force in the direction of excitation were measured. The signalswere digitised at 1000 samples per second after low pass filtering at 12Hz.
2.5. Analysis of dynamic response
The apparent mass was determined from the ratio of the r.m.s. value of the force and the r.m.s. value of theacceleration in the direction of excitation:
Mf ¼F r:m:s:;f
ar:m:s:;f(1)
where Mf is the apparent mass at the frequency f (Hz), Fr.m.s.,f and ar.m.s.,f represent the r.m.s. values of theforce and the acceleration at this frequency, respectively.
The r.m.s. values were calculated for a period when the input signals had a constant magnitude (i.e., themiddle 3 s of the 4 s period of vibration). Before the calculation of the r.m.s. value of the force, the product ofthe mass of the parts of the force platform above the transducers and the acceleration in the direction ofexcitation was subtracted from the measured force signal so as to eliminate the effect of the mass of the partsof the force platform above the transducers on the measured force. The apparent mass was determined for thetwo directions of excitation (i.e., the fore-and-aft and lateral directions).
The apparent mass, Mf, calculated with the above method was normalised by dividing it by the value of theapparent mass obtained at 4Hz, M4Hz. This normalisation was intended to compare the apparent massdirectly with the magnitude estimates of discomfort that were obtained relative to the discomfort caused by the4Hz reference stimulus. The purpose of this normalisation was different from the normalisation of theapparent mass with respect to subjects’ static mass, which is usually carried out to reduce the effect of staticmass on the apparent mass in biodynamic studies.
3. Results with fore-and-aft excitation
3.1. Subjective response in the fore-and-aft direction
The magnitude estimates of the relative discomfort indicated by subjects exposed to fore-and-aft vibrationvaried depending on the frequency and the magnitude of the vibration (Fig. 2). The median magnitudeestimate was greatest at 2.5Hz at vibration magnitudes of 0.125, 0.25, and 0.5m s�2 r.m.s. The magnitudeestimates were significantly affected by the frequency at all magnitudes of vibration (po0.0001, Friedmantwo-way analysis of variance). The statistical significance of the effect of frequency on the magnitude estimates

ARTICLE IN PRESS
1 2 3 4 5 6 7 8 9 100
50
100
150
200
Frequency (Hz)
Fore
-and
-aft
mag
nitu
de e
stim
ate
Fig. 2. Medians of magnitude estimates of relative discomfort by 12 subjects exposed to fore-and-aft vibration at four magnitudes: B——:
0.125ms�2 r.m.s.; � - . - . -: 0.25m s�2 r.m.s.; o – – – –: 0.5m s�2 r.m.s.; and D—: 1.0ms�2 r.m.s.
G.H.M.J. Subashi et al. / Journal of Sound and Vibration 321 (2009) 416–434420
was investigated further using the Wilcoxon matched-pairs signed ranks test. At 0.125 and 0.25m s�2 r.m.s.,the magnitude estimate at 2.5Hz was greater than that at 2.0Hz (po0.05, Wilcoxon) and greater than that at3.15Hz (p ¼ 0.072, Wilcoxon for 0.125m s�2 r.m.s., p ¼ 0.028, Wilcoxon for 0.25m s�2 r.m.s.).
The median magnitude estimate of discomfort caused by vibration at 4Hz was exactly 100 for all vibrationmagnitudes. This is consistent with the 4Hz test stimulus having the same magnitude as the 4Hz referencestimulus for all magnitudes. Friedman two-way analysis of variance showed that the difference in themagnitude estimates at 4Hz at different magnitudes was not statistically significant (p40.1). The magnitudeestimates were significantly affected by the vibration magnitude at 2.0, 2.5, 3.15Hz (po0.01, Friedman) andat 10.0Hz (p ¼ 0.025, Friedman). For these frequencies, the magnitude estimates at 0.125m s�2 r.m.s. weresignificantly less than those at the higher magnitudes (po0.05, Wilcoxon, Table 1). At 3.15Hz, the magni-tude estimates at 0.25m s�2 r.m.s. were significantly less than those at 0.5m s�2 r.m.s. (p ¼ 0.044, Wilcoxon,Table 1).
3.2. Dynamic response in the fore-and-aft direction
The apparent mass changed depending on the frequency and magnitude of vibration (Fig. 3).At 0.25m s�2 r.m.s, the fore-and-aft apparent mass was greatest at 2.5Hz. The effect of frequency onthe apparent mass was statistically significant for all magnitudes of vibration (po0.0001, Friedmantwo-way analysis of variance). At 0.125 and 0.25m s�2 r.m.s., the apparent mass at 2.5Hz was significantlygreater than that at 2.0Hz (po0.05, Wilcoxon). There was a significant decrease in the apparent masswith each increase in frequency above 5Hz at 0.125 and 0.25m s�2 r.m.s. (po0.05, Wilcoxon). At 0.5 and1.0m s�2 r.m.s., the apparent mass decreased significantly with each increase in frequency above 3.15Hz(po0.05, Wilcoxon).
The fore-and-aft apparent mass was dependent on vibration magnitude at all frequencies except at 1.6 and3.15Hz (at 2.5 and 4.0Hz, po0.01, Friedman; at 2.0, 5.0, 6.3, 8.0 and 10.0Hz, po0.0001, Friedman).Statistical significances of the effect of vibration magnitude were determined using Wilcoxon matched-pairssigned ranks test. At 5.0, 6.3, 8.0 and 10.0Hz, the fore-and-aft apparent mass decreased with each increase invibration magnitude (po0.01, Wilcoxon), except between 0.125 and 0.25m s�2 r.m.s. at 5Hz. At 4.0Hz, theapparent mass at 1.0m s�2 r.m.s. was significantly less than at other vibration magnitudes (po0.05,Wilcoxon). At 2.0 and 2.5Hz, the apparent mass at 0.5m s�2 r.m.s. was significantly greater than that at othervibration magnitudes (po 0.05, Wilcoxon), except between 0.125 and 0.25m s�2 r.m.s. at 2.5Hz.

ARTICLE IN PRESS
1 2 3 4 5 6 7 8 9 100
25
50
75
Frequency (Hz)
Fore
-and
-aft
appa
rent
mas
s (k
g)
Fig. 3. Median apparent mass of 12 subjects exposed to fore-and-aft vibration at four magnitudes: B——: 0.125m s�2 r.m.s.; � - . - . -:
0.25m s�2 r.m.s.; o – – – –: 0.5m s�2 r.m.s.; and D—: 1.0m s�2 r.m.s.
Table 1
Statistical significance of the effect of vibration magnitude on the magnitude estimates determined by Wilcoxon matched-pairs signed
ranks test for fore-and-aft vibration: **po0.01, *po0.05
Vibration magnitude (m s�2 r.m.s.) 0.250 0.500 1.000
At 2.0Hz
0.125 0.041* 0.002** �
0.250 y 0.154 �
0.500 y �
At 2.5Hz
0.125 0.029* 0.002** �
0.250 y 0.167 �
0.500 y �
At 3.15Hz
0.125 0.040* 0.003** 0.025*
0.250 y 0.044* 0.159
0.500 y 0.798
At 10.0Hz
0.125 0.040* 0.040* 0.012*
0.250 y 0.887 0.345
0.500 y 0.138
The data for which Friedman two-way analysis of variance showed statistical significance are presented.
For the comparisons showing statistical significance, the magnitude estimate for the lower vibration magnitude is significantly less than
that for higher vibration magnitude.
G.H.M.J. Subashi et al. / Journal of Sound and Vibration 321 (2009) 416–434 421
3.3. Comparison between subjective and dynamic responses in the fore-and-aft direction
Fig. 4 shows the median normalised apparent mass determined by dividing the median apparent mass at allfrequencies by the median apparent mass at 4Hz, so as to compare the apparent masses with the magnitudeestimates of relative discomfort. At low frequencies, the dependence of the median normalised apparentmasses on vibration magnitude is similar to that of the median magnitude estimates of the relative discomfortpresented in Fig. 2. The magnitude-dependence of the normalised apparent mass was statistically significant atall frequencies except at 1.6Hz (p ¼ 0.026 at 3.15Hz, po0.01 at 2.0, 2.5 and 10Hz, po0.0001 at 5.0, 6.3 and8.0Hz; Friedman). The statistical significance of the effect of vibration magnitude on the normalised apparent

ARTICLE IN PRESS
0
0.5
1
1.5
Nor
mal
ised
fore
-and
-aft
appa
rent
mas
s
1 2 3 4 5 6 7 8 9 10Frequency (Hz)
Fig. 4. Median normalised apparent mass of 12 subjects exposed to fore-and-aft vibration at four magnitudes B——: 0.125m s�2 r.m.s.;
� - . - . -: 0.25m s�2 r.m.s.; o – – – –: 0.5m s�2 r.m.s.; and D—: 1.0m s�2 r.m.s.
G.H.M.J. Subashi et al. / Journal of Sound and Vibration 321 (2009) 416–434422
mass is shown in Table 2. The effect of vibration magnitude on the normalised apparent mass was similar tothe effect of vibration magnitude on the magnitude estimates of discomfort (Table 1) at 2.0, 2.5 and 3.15Hz.At 2.0 and 2.5Hz, the normalised apparent mass at 0.125m s�2 r.m.s. was significantly less than at0.5m s�2 r.m.s. (po0.05, Wilcoxon, Table 2) and less than at 0.25m s�2 r.m.s. with marginal non-significance(po0.1, Wilcoxon, Table 2), while the magnitude estimate at 0.125m s�2 r.m.s. was significantly less thanat 0.25 and 0.5m s�2 r.m.s. (po0.05, Wilcoxon, Table 1). At 3.15Hz, the normalised apparent mass at0.125m s�2 r.m.s. was significantly less than at 1.0m s�2 r.m.s. (p ¼ 0.034, Wilcoxon, Table 2) and less thanat 0.5m s�2 r.m.s. with marginal non-significance (p ¼ 0.099, Wilcoxon, Table 2), while the magnitudeestimate of discomfort at 0.125m s�2 r.m.s. was significantly less than at 0.5 and 1.0m s�2 r.m.s. (po0.05,Wilcoxon, Table 1).
The normalised apparent mass decreased with an increase in each vibration magnitude at 5.0, 6.3, and8.0Hz, except between 0.125 and 0.25m s�2 r.m.s. at 5.0Hz, between 0.25 and 0.5m s�2 r.m.s. at 6.3Hz, andbetween 0.5 and 1.0m s�2 r.m.s. at 8.0Hz (Table 2). At these frequencies, there was no significant effect ofvibration magnitude on the magnitude estimate of discomfort, as shown in Table 1. At 10.0Hz, the normalisedapparent mass at 0.125m s�2 r.m.s. was significantly greater than that at other vibration magnitudes (po0.05,Wilcoxon, Table 2), whereas the magnitude estimate at 0.125m s�2 r.m.s. was significantly less than at othervibration magnitudes (po0.05, Wilcoxon, Table 1).
A comparison between the median magnitude estimates and the median normalised fore-and-aft apparentmasses measured over all frequencies and all magnitudes is shown in Fig. 5. Table 3 shows the Spearman rankorder correlation coefficient, rs, between the median magnitude estimates and the median normalised apparentmasses at each vibration magnitude so as to investigate whether or not the effects of vibration frequency onboth responses were similar. Except for the lowest vibration magnitude, the positive correlation between themedian magnitude estimates and the median normalised apparent masses was statistically significant(po0.01). At 0.125m s�2 r.m.s., the correlation between the magnitude estimates and the normalised apparentmasses was marginally non-significant (p ¼ 0.097). At all vibration magnitudes, there were statisticallysignificant correlations between magnitude estimates of discomfort and the normalised apparent masses in thedata from individual subjects: five subjects at 0.125m s�2 r.m.s., seven subjects at 0.25m s�2 r.m.s., ninesubjects at 0.5m s�2 r.m.s., and six subjects at 1.0m s�2 r.m.s. (po0.05).
The Spearman rank order correlation coefficient, rs, between the median magnitude estimates and themedians of the normalised apparent masses at each frequency was determined so as to investigate whetherthe effects of vibration magnitude on both responses were related, although the size of each data set to test thecorrelation was small (Table 4). The correlation between the median magnitude estimate and the mediannormalised apparent mass was positive at low frequencies (i.e., between 2 and 5Hz), whereas the correlationwas negative at high frequencies (i.e., between 6.3 and 10.0Hz). The positive correlations found at low

ARTICLE IN PRESS
Table 2
Statistical significance of the effect of vibration magnitude on the normalised fore-and-aft apparent mass determined by Wilcoxon
matched-pairs signed ranks test: **po0.01, *po0.05, and ***po0.1
Vibration magnitude (m s�2 r.m.s.) 0.250 0.500 1.000
At 2.0Hz
0.125 0.084***b 0.005**b �
0.250 y 0.008**b �
0.500 y �
At 2.5Hz
0.125 0.071***b 0.009**b �
0.250 y 0.034*b �
0.500 y �
At 3.15Hz
0.125 0.814 0.099***b 0.034*b
0.250 y 0.136 0.049*b
0.500 y 0.209
At 5.0Hz
0.125 0.388 0.012*a 0.002**a
0.250 y 0.012*a 0.003**a
0.500 y 0.012*a
At 6.3Hz
0.125 0.010*a 0.002**a 0.002**a
0.250 y 0.060***a 0.005**a
0.500 y 0.002**a
At 8.0Hz
0.125 0.019*a 0.006**a 0.003**a
0.250 y 0.010*a 0.002**a
0.500 y 0.158
At 10.0Hz
0.125 0.042*a 0.012*a 0.004**a
0.250 y 0.117 0.041*a
0.500 y 0.480
The data for which Friedman two-way analysis of variance showed statistical significance are presented.aThe normalised apparent mass at lower vibration magnitude is significantly greater than that at higher vibration magnitude.bThe normalised apparent mass at lower vibration magnitude is significantly less than that at higher vibration magnitude.
G.H.M.J. Subashi et al. / Journal of Sound and Vibration 321 (2009) 416–434 423
frequencies were statistically significant (po0.01), whereas the negative correlations found at 8.0 and 10.0Hzwere marginally non-significant (p ¼ 0.051).
4. Results with lateral excitation
4.1. Subjective response in the lateral direction
Fig. 6 shows the effect of the frequency and the magnitude of vibration on the magnitude estimates ofrelative discomfort indicated by subjects exposed to lateral vibration. The median magnitude estimate wasgreatest at 2.5Hz at vibration magnitudes of 0.125 and 0.25m s�2 r.m.s. The effect of vibration frequency onthe magnitude estimates was statistically significant for all vibration magnitudes (po0.0001, Friedman). At0.125, 0.25 and 0.5m s�2 r.m.s., the magnitude estimate at 2.5Hz was significantly greater than that at 3.15Hz(po0.01, Wilcoxon), although the difference in magnitude estimates between 2.5Hz and 2.0Hz was notstatistically significant (p40.1, Wilcoxon).
As expected, the median magnitude estimates of vibration at 4Hz were the same (i.e., 100) for allmagnitudes (p40.1, Friedman). The effect of vibration magnitude on the magnitude estimates was statistically

ARTICLE IN PRESS
0 0.5 1 1.50
50
100
150
Normalised fore-and-aft apparent mass
Fore
-and
-aft
mag
nitu
de e
stim
ate
Fig. 5. Median magnitude estimates compared with the normalised apparent mass for fore-and-aft vibration at four magnitudes:
B: 0.125m s�2 r.m.s.; � : 0.25m s�2 r.m.s.; o: 0.5m s�2 r.m.s.; and D: 1.0m s�2 r.m.s.
Table 3
Correlations between median magnitude estimates and medians of the normalised fore-and-aft apparent mass at four vibration
magnitudes: Spearman rank order correlation coefficient, rs
Vibration magnitude (m s�2 r.m.s.) Correlation coefficient Number of samples
0.125 0.586*** 9
0.25 0.833** 9
0.5 0.970** 8
1 1.000** 6
**po0.01 and ***po0.1.
Table 4
Correlations between median magnitude estimates and medians of the normalised fore-and-aft apparent mass at nine frequencies:
Spearman rank order correlation coefficient, rs
Frequency (Hz) Correlation coefficient Number of samples
1.60 �1.000 2
2.00 1.000** 3
2.50 1.000** 3
3.15 1.000** 4
4.00 � �
5.00 1.000** 4
6.30 �0.258 4
8.00 �0.949*** 4
10.00 �0.949*** 4
**po0.01 and ***po0.1.
G.H.M.J. Subashi et al. / Journal of Sound and Vibration 321 (2009) 416–434424
significant at 1.6, 2.0, 3.15, 10.0Hz (po0.01, Friedman) and at 6.3Hz (p ¼ 0.045, Friedman), and marginallynon-significant at 2.5 and 5.0Hz (po0.1, Friedman). At 2.0, 2.5 and 5.0Hz, magnitude estimates at0.125m s�2 r.m.s. were significantly less than at 0.5m s�2 r.m.s. (po0.05, Wilcoxon, Table 5). At 6.3 and10Hz, the magnitude estimates at 0.125m s�2 r.m.s. were significantly less than at other vibration magnitudes(po0.05, Wilcoxon). At 3.15Hz, the magnitude estimates at 1.0m s�2 r.m.s. were significantly greatercompared to other vibration magnitudes (po0.05, Wilcoxon). At the frequencies of 1.6 and 3.15Hz, themagnitude estimates obtained with a vibration magnitude of 0.125m s�2 r.m.s. were significantly less than thatobtained with a vibration magnitude of 0.25m s�2 r.m.s. (po0.05, Wilcoxon).

ARTICLE IN PRESS
0
50
100
150
200
Late
ral m
agni
tude
est
imat
e
1 2 3 4 5 6 7 8 9 10Frequency (Hz)
Fig. 6. Medians of magnitude estimates of relative discomfort by 12 subjects exposed to lateral vibration at four magnitudes: B——:
0.125m s�2 r.m.s.; � - . - . -: 0.25m s�2 r.m.s.; o – – – –: 0.5m s�2 r.m.s.; and D—: 1.0m s�2 r.m.s.
G.H.M.J. Subashi et al. / Journal of Sound and Vibration 321 (2009) 416–434 425
4.2. Dynamic response in the lateral direction
For all magnitudes of vibration, the apparent mass was significantly affected by frequency (po0.0001,Friedman, Fig. 7). The apparent mass was greatest at 2.0Hz with a vibration magnitude of 0.125 and0.25m s�2 r.m.s. and was greatest at the lowest frequencies used with a vibration magnitude of 0.5 and1.0m s�2 r.m.s. (2.0 and 3.15Hz, respectively). At 0.125 and 0.25m s�2 r.m.s., the difference in the apparentmass between 1.6 and 2.0Hz was marginally non-significant (po0.1, Wilcoxon). The apparent mass at 2.0Hzwas significantly greater than that at 2.5Hz for vibration magnitudes of 0.25 and 0.5m s�2 r.m.s. (po0.01,Wilcoxon). At 0.125m s�2 r.m.s., the difference in the apparent mass between 2.0 and 2.5Hz was marginallynon-significant (p ¼ 0.084, Wilcoxon). At all magnitudes, the apparent mass decreased significantly with eachincrease in frequency above 2.5Hz (po0.05, Wilcoxon), except between 4 and 5Hz at 0.125 and0.25m s�2 r.m.s., and between 8 and 10Hz at 0.125m s�2 r.m.s.
The apparent mass was affected by vibration magnitude at all frequencies except 1.6, 2.0 and 3.15Hz (at 2.5,4.0, 5.0 and 6.3Hz, po0.01, Friedman; at 8.0 and 10.0Hz, po0.0001, Friedman). The statistical significancesof the effect of vibration magnitude were determined using the Wilcoxon matched-pairs signed ranks test. Theapparent mass decreased with each increase in vibration magnitude at 2.5, 8.0 and 10.0Hz (po0.05,Wilcoxon), except between 0.125 and 0.25m s�2 r.m.s. at 8.0Hz. At 4.0Hz, the apparent mass at1.0m s�2 r.m.s. was significantly less than at 0.25 and 0.5m s�2 r.m.s. (po0.05, Wilcoxon). At 5.0 and6.3Hz, the apparent mass at 1.0m s�2 r.m.s. was significantly less than at other vibration magnitudes (po0.05,Wilcoxon). In addition, the apparent mass at 5.0Hz decreased significantly with an increase in vibrationmagnitude from 0.25 to 0.5m s�2 r.m.s., and the apparent mass at 6.3Hz was significantly greater at0.125m s�2 r.m.s. than at 0.5m s�2 r.m.s. (po0.05, Wilcoxon).
4.3. Comparison between subjective and dynamic responses in the lateral direction
Fig. 8 shows the median normalised apparent mass determined by dividing the median apparent mass at allfrequencies by the median apparent mass at 4Hz. The frequency-dependence of the normalised apparent massmay be compared with that of the magnitude estimates of discomfort shown in Fig. 6. Statistical significancesof the effect of vibration magnitude on the normalised apparent mass were determined using Wilcoxonmatched-pairs signed ranks test and are presented in Table 6.
At 2.5, 3.15, 6.3 and 10Hz, the normalised apparent masses tended to decrease with increasing vibrationmagnitude, although a similar trend of magnitude-dependence was not clear in the magnitude estimatespresented in Table 5. At 2.5 and 10Hz, the normalised apparent mass at 0.125m s�2 r.m.s. was significantly

ARTICLE IN PRESS
Table 5
Statistical significance of the effect of vibration magnitude on the magnitude estimates determined by Wilcoxon matched-pairs signed
ranks test for lateral vibration: **po0.01, *po0.05, and ***po0.1
Vibration magnitude (m s�2 r.m.s.) 0.250 0.500 1.000
At 1.6Hz
0.125 0.003** � �
0.250 y � �
0.500 y �
At 2.0Hz
0.125 0.646 0.010* �
0.250 y 0.117 �
0.500 y �
At 2.5Hz
0.125 0.084*** 0.017* �
0.250 y 0.593 �
0.500 y �
At 3.15Hz
0.125 0.024* 0.054*** 0.008**
0.250 y 0.259 0.013*
0.500 y 0.040*
At 5.0Hz
0.125 0.239 0.032* 0.306
0.250 y 0.261 0.766
0.500 y 0.553
At 6.3Hz
0.125 0.036* 0.034* 0.023*
0.250 y 0.153 0.113
0.500 y 0.838
At 10.0Hz
0.125 0.025* 0.009** 0.017*
0.250 y 0.085*** 0.157
0.500 y 0.441
The data for which Friedman two-way analysis of variance showed statistical significance are presented.
For the comparisons showing statistical significance, the magnitude estimate for the lower vibration magnitude is significantly less than
that for higher vibration magnitude.
G.H.M.J. Subashi et al. / Journal of Sound and Vibration 321 (2009) 416–434426
greater than at other vibration magnitudes (po0.05, Wilcoxon, Table 6), whereas the magnitude estimate ofdiscomfort at 0.125m s�2 r.m.s. was significantly less than at other vibration magnitudes (po0.05, Wilcoxon,Table 5), except at 0.25m s�2 r.m.s. at 2.5Hz. At 3.15 and 6.3Hz, the normalised apparent mass decreasedsignificantly (Table 6) with increasing vibration magnitude, whereas the magnitude estimate of discomfortincreased significantly (Table 5) with increasing vibration magnitude for some combinations: from 0.125 to0.25m s�2 r.m.s. for 3.15 and 6.3Hz, from 0.125 to 0.5m s�2 r.m.s. for 3.15Hz, and from 0.125 to1.0m s�2 r.m.s. for 6.3Hz. However, at 3.15Hz, the normalised apparent mass increased significantly withincreasing vibration magnitude from 0.5 to 1.0m s�2 r.m.s. (p ¼ 0.049, Wilcoxon, Table 6) and the magnitudeestimate of discomfort also increased significantly with increasing vibration magnitude from 0.5 to1.0m s�2 r.m.s. (p ¼ 0.040, Wilcoxon, Table 5).
Fig. 9 compares the median magnitude estimates with the median normalised lateral apparent masses.Spearman rank order correlation coefficients, rs, between the median magnitude estimate and the mediannormalised apparent mass at all magnitudes are presented in Table 7. The correlations between medianmagnitude estimates and the median normalised apparent masses were statistically significant for allvibration magnitudes except 1.0m s�2 r.m.s. (po0.01). At all vibration magnitudes, the correlations betweenthe magnitude estimates and the normalised apparent masses were statistically significant for many subjects: 10

ARTICLE IN PRESS
1 2 3 4 5 6 7 8 9 100
25
50
75
100
Frequency (Hz)
Late
ral a
ppar
ent m
ass
(kg)
Fig. 7. Median apparent mass of 12 subjects exposed to lateral vibration at four magnitudes: B——: 0.125m s�2 r.m.s.; � - . - . -:
0.25m s�2 r.m.s.; o – – – –: 0.5m s�2 r.m.s.; and D—: 1.0m s�2 r.m.s.
0
0.5
1
1.5
2
2.5
3
3.5
Nor
mal
ised
late
ral a
ppar
ent m
ass
1 2 3 4 5 6 7 8 9 10Frequency (Hz)
Fig. 8. Median normalised apparent mass of 12 subjects exposed to lateral vibration at four magnitudes:B——: 0.125m s�2 r.m.s.; � - . - . -:
0.25ms�2 r.m.s.; o – – – –: 0.5m s�2 r.m.s.; and D—: 1.0m s�2 r.m.s.
G.H.M.J. Subashi et al. / Journal of Sound and Vibration 321 (2009) 416–434 427
subjects at 0.125m s�2 r.m.s., 10 subjects at 0.25m s�2 r.m.s., 11 subjects at 0.5m s�2 r.m.s., and six subjects at1.0m s�2 r.m.s. (po0.05).
Table 8 shows Spearman rank order correlation coefficient, rs, between median magnitude estimates and themedian normalised apparent masses for each frequency. When changing vibration magnitude, there werenegative correlations between the median magnitude estimates and the normalised apparent masses at mostfrequencies. However, the correlations were not statistically significant, except for a significant correlation at6.3Hz (p ¼ 0.001) and a marginally non-significant correlation at 10.0Hz (p ¼ 0.051).
5. Discussion
5.1. Subjective response
For fore-and-aft vibration, irrespective of vibration magnitude, the relative discomfort varied with thefrequency of vibration (Fig. 2). The relative discomfort at 2.5Hz was more than at 2.0Hz and more than at

ARTICLE IN PRESS
Table 6
Statistical significance of the effect of vibration magnitude on the normalised lateral apparent mass determined by Wilcoxon matched-
pairs signed ranks test: **po0.01, *po0.05, ypo0.1
Vibration magnitude (m s�2 r.m.s.) 0.250 0.500 1.000
At 2.5Hz
0.125 0.041*a 0.034*a �
0.250 y 0.117 �
0.500 y �
At 3.15Hz
0.125 0.071ya 0.099ya 0.209
0.250 y 0.814 0.182
0.500 y 0.049*b
At 6.3Hz
0.125 0.060ya 0.117 0.041*a
0.250 y 0.638 0.137
0.500 y 0.136
At 8.0Hz
0.125 0.071ya 0.041*a 0.060ya
0.250 y 0.239 0.084ya
0.500 y 0.433
At 10.0Hz
0.125 0.015*a 0.005**a 0.005**a
0.250 y 0.084ya 0.010*a
0.500 y 0.005**a
aThe normalised apparent mass at lower vibration magnitude is significantly greater than that at higher vibration magnitude.bThe normalised apparent mass at lower vibration magnitude is significantly less than that at higher vibration magnitude.
0 1 2 3 40
50
100
150
200
Normalised lateral apparent mass
Late
ral m
agni
tude
est
imat
e
Fig. 9. Median magnitude estimates compared with the normalized apparent mass for lateral vibration at four magnitudes:
B: 0.125m s�2 r.m.s.; � : 0.25m s�2 r.m.s.; o: 0.5m s�2 r.m.s; and D: 1.0m s�2 r.m.s.
G.H.M.J. Subashi et al. / Journal of Sound and Vibration 321 (2009) 416–434428
frequencies greater than 3.15Hz for all three vibration magnitudes. This implies that the subjects were mostsensitive to vibration around 2.5Hz, as observed in previous studies: maximum sensitivity to fore-and-aftvibration was found between 2.5 and 3.25Hz by Donati et al. [3], and at frequencies between 2 and 3.15Hz byGriffin et al. [6].
For lateral vibration, the relative discomfort also tended to be greatest at 2.5Hz, although there was nosignificant difference in magnitude estimates between 2.0 and 2.5Hz (Fig. 6). The frequency range in which

ARTICLE IN PRESS
Table 7
Correlations between median magnitude estimates and medians of the normalised lateral apparent mass at four vibration magnitudes:
Spearman rank order correlation coefficient, rs
Vibration magnitude
(m s�2 r.m.s.)
Correlation coefficient Number of samples
0.125 0.946** 9
0.25 0.917** 9
0.5 0.905** 8
1 0.714 6
**po0.01.
Table 8
Correlations between median magnitude estimates and medians of the normalised lateral apparent mass at nine frequencies: Spearman
rank order correlation coefficient, rs
Frequency (Hz) Correlation coefficient Number of samples
1.60 1.000 2
2.00 �0.500 3
2.50 �0.500 3
3.15 �0.400 4
4.00 � �
5.00 �0.316 4
6.30 �1.000** 4
8.00 0.258 4
10.00 �0.949*** 4
***po0.1 and **po0.01.
G.H.M.J. Subashi et al. / Journal of Sound and Vibration 321 (2009) 416–434 429
subjects were most sensitive to lateral vibration in the present study is partially consistent with previousstudies: Corbridge and Griffin [4] found greatest sensitivity to lateral vibration in the frequency range 1.25 and2.0Hz, Griffin et al. [6] found sensitivity decreased with increasing frequency above 2.5Hz, and Miwa [5]found sensitivity decrease above 3.15Hz. The differences may be attributed to sitting posture: subjects sat on aseat having no backrest with feet supported on a non-vibrating height-adjustable footrest in the present studyand in Griffin et al. [6], but on a seat with a 400-mm high backrest and feet supported on the moving vibratortable in Corbridge and Griffin [4], and on a seat having no backrest and feet unsupported in Miwa [5]. Inter-subject variability and vibration magnitude may also have contributed to the differences between the studies.
Relative discomfort was affected by vibration magnitude in the fore-and-aft direction (Fig. 2) and in thelateral direction (Fig. 6) over the frequency range 1.6–10Hz. The effect of vibration magnitude on relativediscomfort is similar to the effect of vibration magnitude on equivalent comfort contours found in previousstudies: fore-and-aft vibration from 2–10Hz by Morioka and Griffin [8] and lateral vibration from 4–8Hz byHowarth and Griffin [7] and from 4–10Hz by Morioka and Griffin [8]. The equivalent comfort contours fromthese previous studies were compared with the relative discomfort obtained in the present study by calculatingthe magnitude estimates relative to the discomfort at 4Hz based on the equivalent comfort contours in thoseprevious studies.
With fore-and-aft vibration, Morioka and Griffin [8] observed a magnitude-dependence in the equivalentcomfort contours. Their study and the present study show that discomfort relative to 4Hz tended to increasewith increasing vibration magnitude at frequencies lower than 4Hz. For example, the relative discomfort at2Hz calculated with respect to the discomfort at 4Hz increased from about 117 to 237 with the vibrationmagnitude increasing from 0.125 to 0.5m s�2 r.m.s., while the median magnitude estimate in the present studyincreased from 102.5 to 132.5 (Fig. 2) (100 is equivalent to the discomfort caused by a 4Hz reference stimulus).The differences in the magnitude estimates of the relative discomfort between the two studies may be partlybecause the reference vibrations used in the experiments were different: the frequency of the referencevibration was 4Hz in the present study and 20Hz in Morioka and Griffin [8].

ARTICLE IN PRESSG.H.M.J. Subashi et al. / Journal of Sound and Vibration 321 (2009) 416–434430
With lateral vibration, Howarth and Griffin [7] indicated that the shapes of equivalent comfort contoursdepend on vibration magnitude in the frequency range from 4 to 63Hz at vibration magnitudes from 0.04 to0.4m s�2 r.m.s. They showed that the magnitude estimate of relative discomfort with respect to 4Hz decreasedwith decreasing vibration magnitude at frequencies greater than 4Hz. The present study found a similar trendwith relative discomfort decreasing with decreasing vibration magnitude, as shown in Fig. 6, although thistrend was not necessarily statistically significant. At frequencies of 6.3 and 10Hz, Morioka and Griffin [8] alsoindicated that the discomfort relative to 4Hz decreased with decreasing vibration magnitude showing a similartrend that found in the present study (Fig. 6, Table 5). At frequencies lower than 4Hz, the effect of vibrationmagnitude on relative discomfort found by Morioka and Griffin [8] appears different from the present study.Their study found that discomfort relative to 4Hz tended to decrease with increasing vibration magnitudewhereas the present study found the relative discomfort tended to increase with increasing vibrationmagnitude (Fig. 6). Possible reasons for the difference may include differences in sitting posture: subjects hadno thigh contact with a vibrating surface on the small seat used by Morioka and Griffin [8] while subjects hadtheir thighs in contact with the vibrating surface in the present study. In addition, subjects kept their hands onstationary cylindrical handles in Morioka and Griffin [8] while subjects kept their hands on their laps in thepresent study. These differences in sitting posture may have a greater effect on discomfort caused by lateralvibration than discomfort caused by fore-and-aft vibration because the hands and the thighs may have moreeffect on the stability of the body exposed to lateral vibration than fore-and-aft vibration. At frequencies from2 to 4Hz, the ranges of vibration magnitudes used by Morioka and Griffin [8] (i.e., 0.05–0.4 and0.05–0.8m s�2 r.m.s., respectively) were slightly lower than the range used in the present study (i.e.,0.125–0.5m s�2 r.m.s. at 2Hz and 0.125–1.0m s�2 r.m.s. at 4Hz). This difference may have an effect on theaccuracy of the calculated magnitude estimate obtained from extrapolation of the equivalent comfort contoursderived in Ref. [8].
The single frequency weighting for fore-and-aft and lateral vibration in the current principal standards forevaluating horizontal vibration (e.g., ISO 2631–1 [1] and BS 6841 [2]) implies that the frequency-dependence ofsubjective response is independent of the magnitude of vibration. In contrast, a significant nonlinearity in thesubjective response has been found in the present and previous studies. The frequency weighting, Wd, givenin both ISO 2631–1 and BS 6841 for the evaluation of horizontal vibration has been compared withthe magnitude estimates obtained at four magnitudes of fore-and-aft vibration (Fig. 10) and lateral vibration(Fig. 11). In the figures, the relative discomfort has been converted to dB with respect to the reference of 100,and the Wd frequency weighting has been adjusted so that the weighting factor at 4Hz is 0 dB to allowcomparison with the relative discomfort at 4Hz in the present study. Figs. 10 and 11 indicate that thenonlinearity in the subjective responses is sufficiently great to be considered when formulating frequencyweightings for horizontal vibration. Relative to lower frequencies, the frequency weightings derived from thepresent study suggest that the standard weighting, Wd, underestimates discomfort caused by vibration atfrequencies greater than about 4Hz.
In the present study, relative discomfort was measured using vibration stimuli with a duration of 4 s. It isexpected that vibration discomfort will increase with increasing duration of vibration. Miwa [17] investigateddiscomfort produced by sinusoidal vertical and horizontal vibration with durations in the range 0.005–6 s andconcluded that the discomfort caused by vibration did not increase with increasing duration in the range 2–6 s.Griffin and Whitham [18] investigated whether the discomfort produced by 4, 8, 16 and 32Hz whole-bodyvertical vibration was dependent on the duration of exposure up to 32 s and concluded that there was, veryapproximately, a fourth-power relationship such that a sixteen-fold increase in duration was equivalent to adoubling of vibration magnitude. The effect of vibration duration on discomfort may differ at differentfrequencies and with different axes of excitation so that the relative discomfort, and therefore the optimumfrequency weighting, depends on the exposure duration.
5.2. Biodynamic responses
The peak frequencies of the apparent mass found in the present study with sinusoidal vibration (i.e., 2.5Hzin the fore-and-aft direction (Fig. 3) and 2.0Hz in the lateral direction (Fig. 7)) are consistent with those foundin previous studies with random vibration. Fairley and Griffin [9] found a resonance, corresponding to the

ARTICLE IN PRESS
-9
-6
-3
0
3
6
Fact
or (d
B)
1 2 3 4 5 6 7 8 9 10Frequency (Hz)
Fig. 10. Comparison between Wd frequency weighting, ISO 2631-1 and BS 6841, and magnitude estimates obtained with fore-and-aft
vibration at four magnitudes: B : 0.125m s�2 r.m.s.; � - . - . -: 0.25m s�2 r.m.s.; o – – – –: 0.5m s�2 r.m.s.; and D—: 1.0m s�2 r.m.s., —
Wd. The Wd weighting was raised to have a value of 0 dB at 4Hz.
-9
-6
-3
0
3
6
Fact
or (d
B)
1 2 3 4 5 6 7 8 9 10Frequency (Hz)
Fig. 11. Comparison between Wd frequency weighting, ISO 2631-1 and BS 6841 and magnitude estimates obtained with lateral vibration
at four magnitudes: B——: 0.125m s�2 r.m.s.; � - . - . -: 0.25m s�2 r.m.s.; o – – – –: 0.5m s�2 r.m.s.; and D—: 1.0m s�2 r.m.s., Wd. The
Wd weighting was raised to have a value of 0 dB at 4Hz.
G.H.M.J. Subashi et al. / Journal of Sound and Vibration 321 (2009) 416–434 431
second mode, around 2.5Hz with fore-and-aft excitation and around 2.0Hz with lateral excitation usingrandom vibration over the frequency range 0.25–20Hz. Mansfield and Lundstrom [12] measured the apparentmasses of seated subjects exposed to random vibration over the frequency range 1.5–20Hz. A first resonance,according to these authors, was around 3.0Hz with fore-and-aft vibration and around 1.9Hz with lateralvibration, although low coherency between the acceleration and the force measured at low frequencies mighthave affected the accuracy of the resonances observed in the apparent mass. The peak frequencies in theapparent masses obtained with sinusoidal vibration in the present study are not necessarily the same as theresonance frequencies of the apparent masses obtained with random vibration: the coarse frequency resolutionachieved with sinusoidal vibration prevents accurate definition of the resonance frequency.
The peak frequency in the fore-and-aft apparent mass (Fig. 3) and the lateral apparent mass (Fig. 7) tendedto decrease with increasing vibration magnitude, consistent with the nonlinearity in the dynamic responsereported in previous studies [9,11,12]. With random vibration, Fairley and Griffin [9] found that the frequency

ARTICLE IN PRESSG.H.M.J. Subashi et al. / Journal of Sound and Vibration 321 (2009) 416–434432
of the second mode of vibration decreased by 1 or 2Hz with vibration magnitude increasing from 0.5 to2.0m s�2 r.m.s., with both fore-and-aft and lateral excitation. With increasing vibration magnitude from 0.25to 0.5m s�2 r.m.s., Mansfield and Lundstrom [12] concluded ‘‘increases in vibration magnitude caused the firstapparent mass peak to reduce in frequency’’. Using sinusoidal vibration, Holmlund and Lundstrom [11]reported the ‘‘normalised mechanical impedance spectra for X direction showed in principal one peak at about3–5Hz’’ and ‘‘corresponding spectra for the Y direction showed two peaks at about 2 and 6Hz at lowvibration levels’’. With increasing vibration magnitude, the results of their study showed that the mechanicalimpedance at frequencies less than the peak frequency increased while that at the frequencies greater than thepeak frequency decreased [11].
5.3. Comparison between subjective and biodynamic responses
In the present study, there was evidence of a relation between subjective and dynamic responses of seatedsubjects exposed to horizontal vibration.
The magnitude estimates of relative discomfort had a peak at 2.5Hz with fore-and-aft excitation andbetween 2.0 and 2.5Hz with lateral excitation (Figs. 2 and 6). These frequency ranges are consistent with theranges in which the normalised apparent mass was greatest (Figs. 4 and 8). The significant correlations foundbetween the median relative discomfort and the median normalised apparent mass (Figs. 5 and 9, Tables 3and 7) are consistent with the motion of major body segments being associated with discomfort over the rangeof frequencies investigated, but they are not proof of a causal relation.
The movements of body segments are reflected in the apparent mass, although the movements responsiblefor resonances in the fore-and-aft and lateral apparent masses are not yet understood. The vibration modecontributing to the peak in the fore-and-aft apparent mass around 2.5Hz in the present study might beattributed to shear deformation of the buttocks tissue and pitching, or bending, of the upper-body giving fore-and-aft motion of the buttocks and the hips out of phase with fore-and-aft motion of the shoulders and thehead, as hypothesised by Fairley and Griffin [9]. At a similar frequency, Kitazaki and Griffin [19] found thatfore-and-aft motion of the head was out of phase with motion of the pelvis caused by bending of the spineduring vertical excitation. Also, shear deformation of buttocks tissues was observed during vertical excitationat vibration modes greater than 1.49Hz, and was dominant around 5 and 9Hz. The peak of the lateralapparent mass observed around 2.0Hz might be attributed to lateral motion of the upper-body similar to thehypothesis made by Fairley and Griffin [9]: lateral motion at the hips caused by shear deformation of thebuttocks and rocking of the upper body out of phase with lateral motion of the shoulders and the head.
With increases in the vibration magnitude there were significant increases in the relative discomfort at 2.0,2.5 and 3.15Hz caused by fore-and-aft excitation (Fig. 2). At the same frequencies, the normalised fore-and-aft apparent mass increased with increasing vibration magnitude (Fig. 4). This is consistent with a relationbetween relative discomfort and normalised apparent mass at these frequencies. The increases in the apparentmass with increasing vibration magnitude might be attributed to increases in the ratio of motion of the bodysegments to seat motion or increases in the parts of the body mass excited by input vibration, or both,according to Newton’s second law of motion. Increases in the motion of the body segments relative to the seat,or increases in the body portions excited, may also be expected to increase discomfort. This relation betweenthe motion of the body and discomfort may be a cause of the similar nonlinear characteristics found in therelative discomfort and in the normalised apparent mass. The nonlinearity in magnitude estimates andnormalised apparent mass found with lateral vibration seems similar to those with fore-and-aft vibration,although less clear.
With fore-and-aft excitation, there were significant positive correlations between the median relativediscomfort and the median normalised apparent mass at 2.0, 2.5, 3.15 and 5.0Hz (Table 4). This implies thatthe magnitude-dependence of relative discomfort was associated with the nonlinear characteristics observed inthe apparent mass of the body. There was a negative correlation between median relative discomfort and themedian normalised apparent mass at 8.0 and 10Hz, with marginal statistical significance. Fig. 12a and bcompare the magnitude estimates of all subjects with their normalised apparent mass obtained at a vibrationmagnitude of 0.25m s�2 r.m.s. at 2.5Hz (a low frequency) and at 8.0Hz (a high frequency), respectively. It canbe seen in the data from individual subjects shown in Fig. 12 that there appears to be a positive correlation

ARTICLE IN PRESS
0 0.5 1 1.5 2 2.50
50
100
150
200
250
Normalised apparent mass
Mag
nitu
de e
stim
ate
0 0.5 1 1.50
50
100
150
Normalised apparent mass
Mag
nitu
de e
stim
ate
Fig. 12. Magnitude estimates compared with the normalised fore-and-aft apparent mass at 0.25ms�2r.m.s. for two frequencies: (a) at
2.5Hz and (b) at 8Hz.
G.H.M.J. Subashi et al. / Journal of Sound and Vibration 321 (2009) 416–434 433
between the magnitude estimate and the normalised apparent mass at 2.5Hz while there was no correlation at8.0Hz. At 2.5Hz, the positive correlation between the magnitude estimates and the normalised apparentmasses was statistically significant at 0.25m s�2 r.m.s. (rs ¼ 0.712, p ¼ 0.009) and marginally non-significant at0.125m s�2 r.m.s. (rs ¼ 0.530, p ¼ 0.072). In Appendix A, the Spearman rank order correlation coefficients, rs,
between the magnitude estimates and the normalised apparent masses are shown for each frequency andmagnitude investigated. At low frequencies the correlations are generally positive and sometimes statisticallysignificant while at high frequencies the correlations are variable in direction and generally not statisticallysignificant (see Appendix A). With lateral vibration, the Spearman rank order correlation coefficients, rs,between the magnitude estimates and the normalised apparent masses were variable in direction. Thecorrelations were statistically significant at 0.5m s�2 r.m.s. for 3.15Hz (rs ¼ 0.723, p ¼ 0.008) and marginallynon-significant at 0.25m s�2 r.m.s. for 2Hz (rs ¼ 0.508, p ¼ 0.092) and 5Hz (rs ¼ 0.550, p ¼ 0.064).
It appears that the discomfort caused by horizontal whole-body vibration of seated subjects is associatedwith the apparent mass of the whole-body in the frequency range where motions of the upper-body dominateboth responses. However, at higher frequencies, where the local vibrations at various parts of the bodydominate discomfort, the subjective responses are not likely to be associated with the apparent mass of thewhole body.
6. Conclusions
When seated subjects are exposed to fore-and-aft or lateral whole-body vibration in the frequency range1.6–10Hz, their discomfort and apparent mass are similarly affected by the frequency and magnitude ofvibration, and there are correlations between subject apparent mass and subject discomfort.
Acknowledgement
This research was partially supported by the Japan Society for the Promotion of Science, Grant-in-Aid forJSPS Fellows, 17 � 05357, 2005–7.
Appendix A. Correlation between magnitude estimates and normalised apparent masses in the fore-and-aft axis
for individual data
For further details see Table A1.

ARTICLE IN PRESS
Table A1
Correlations between magnitude estimates and the normalised fore-and-aft apparent masses at nine frequencies and at four vibration
magnitudes: Spearman rank order correlation coefficient, rs
Vibration
magnitude
(m s�2 r.m.s.)
Correlation coefficient
1.6 2.0 2.5 3.15 4.0 5.0 6.3 8.0 10.0
0.125 �0.118 0.615* 0.530*** 0.456 � 0.058 0.239 �0.299 0.450
0.25 0.283 0.430 0.712** 0.542*** � 0.052 0.126 0.340 0.283
0.5 � 0.299 0.416 0.025 � 0.425 0.594* �0.028 0.430
1 � � � 0.412 � �0.459 0.155 �0.092 �0.078
**po0.01, *po0.05, ***po0.1.
G.H.M.J. Subashi et al. / Journal of Sound and Vibration 321 (2009) 416–434434
References
[1] International Organization for Standardization ISO 2631-1, Mechanical Vibration and Shock—Evaluation of Human Exposure to
Whole-body Vibration—Part 1: General Requirements, 1997.
[2] British Standards Institution BS 6841, Guide to Measurement and Evaluation of Human Exposure to Whole-body Mechanical Vibration
and Repeated Shock, 1987.
[3] P. Donati, A. Grosjean, P. Mistrot, L. Roure, The subjective equivalence of sinusoidal and random whole-body vibration in the
sitting position (an experimental study using the ‘floating reference vibration’ method), Ergonomics 26 (1983) 251–273.
[4] C. Corbridge, M.J. Griffin, Vibration and comfort: vertical and lateral motion in the range 0.5–5.0Hz, Ergonomics 29 (1986) 249–272.
[5] T. Miwa, Evaluation methods for vibration effect. Part 1: measurements of threshold and equal sensation contours of whole body for
vertical and horizontal vibrations, Industrial Health 5 (1967) 183–205.
[6] M.J. Griffin, E.M. Whitham, K.C. Parsons, Vibration and comfort. I: translational seat vibration, Ergonomics 25 (1982) 603–630.
[7] H.V.C. Howarth, M.J. Griffin, The frequency dependence of subjective reaction to vertical and horizontal whole-body vibration at
low magnitudes, Journal of Acoustic Society of America 83 (1988) 1406–1413.
[8] M. Morioka, M.J. Griffin, Magnitude dependence of equivalent comfort contours for fore-and-aft, lateral and vertical whole-body
vibration, Journal of Sound and Vibration 298 (2006) 755–772.
[9] T.E. Fairley, M.J. Griffin, The apparent mass of the seated human body in the fore-and-aft and lateral directions, Journal of Sound
and Vibration 139 (1990) 299–306.
[10] N. Nawayseh, M.J. Griffin, Non-linear dual-axis biodynamic response to fore-and-aft whole-body vibration, Journal of Sound and
Vibration 282 (2005) 831–862.
[11] P. Holmlund, R. Lundstrom, Mechanical impedance of the human body in the horizontal direction, Journal of Sound and Vibration
215 (1998) 801–812.
[12] N.J. Mansfield, R. Lundstrom, The apparent mass of the human body exposed to non-orthogonal horizontal vibration, Journal of
Biomechanics 32 (1999) 1269–1278.
[13] M.J. Griffin, E.M. Whitham, Individual variability and its effect on subjective and biodynamic response to whole-body vibration,
Journal of Sound and Vibration 58 (1978) 239–250.
[14] Y. Matsumoto, M.J. Griffin, Nonlinear subjective and biodynamic responses to continuous and transient whole-body vibration in the
vertical direction, Journal of Sound and Vibration 287 (2005) 919–937.
[15] M.J. Griffin, Handbook of Human Vibration, Academic Press, London, 1990.
[16] G.S. Newell, N.J. Mansfield, L. Notini, Inter-cycle variation in whole-body vibration exposures of operators driving track-type loader
machines, Journal of Sound and Vibration 298 (2006) 563–579.
[17] T. Miwa, Evaluation methods for vibration effect. Part 7: the vibration greatness of the pulses, Industrial Health 6 (1968) 143–164.
[18] M.J. Griffin, E.M. Whitham, Discomfort produced by impulsive whole-body vibration, The Journal of the Acoustical Society of
America 68 (5) (1980) 1277–1284.
[19] S. Kitazaki, M.J. Griffin, A modal analysis of whole-body vertical vibration, using a finite element model of the human body, Journal
of Sound and Vibration 200 (1997) 83–103.