noninvasive automatic monitoring of instantaneous arterial blood pressure using the vascular...
TRANSCRIPT
Med. & Biol. Eng. & Comput., 1983, 21,557-565
Noninvasive automatic monitoring of instantaneous arterial blood pressure using the vascular unloading technique
K. Y a m a k o s h i A. Kamiya The Research Institute of Applied Electricity, Hokkaido University, Nishi 6 chome, Kita 12 jyo, Kita-ku, Sapporo 060, Japan
H. Sh imazu H. I to
Department of Physiology, Kyorin University School of Medicine, 20-2 Shinkawa 6 chome, Mitaka-shi, Tokyo 181, Japan
T. T o g a w a
Institute for Medical and Dental Engineering. Tokyo Medical and Dental University, 2-3-10 Surugadai, Kanda, Chiyoda-ku, Tokyo 101, Japan
A b s t r a c t - - F o r the noninvasive monitor ing Of the beat-to-beat systofic and diastofic pressure and pressure waveform in the human finger, a new automated instrument was designed. This measurement is based on a principle called the vascular unloading technique. Using a hydraufic servocontrol system, the vascular volume change caused by intra-arterial pressure change can be compensoted by applying counter pressure to maintain a constant vascular volume in the unloaded state. In this state the controlled counterpressure instantaneously fol lows the intra-arterial pressure. In this instrument all the necessary procedures, such as the setting of the reference value for the servocontrol, control of the servogain, processing and displaying of the data on a recorder, were carried out automatically. The simultaneous comparison of data with direct measurements and a few examples of the indirect pressure recordings by this instrument are shown and the principles, operation and evaluation of this method are described. This instrument was shown to permit the noninvasive and accurate tracking of instantaneous arterial pressure and to perform acceptably over a wide range of arterial pressure.
Keywords - - lns tan taneous arterial pressure, Noninvasive automatic monitoring, Servocontrol system, Vascular unloading technique
I Introduction
VARIOUS automatic instruments for the noninvasive measurement of arterial blood pressure have been developed (GEDDES, 1970; COBBOLD, 1974). In most of them the sphygmomanometric technique based on Riva-Rocci's principle is utilised, so that the arterial pressure can be monitored only intermittently. Since then, much effort has been expended in devising noninvasive methods such as arterial tonometry (SMITH and BICKLEY, 1964; PRESSMAN and NEWGARD, 1963; STEIN and BLICK, 1971) and the tracking-cuff method (SHAPIRO et al., 1981) for the beat-to-beat continuous recording of arterial pressure. However, because there are some practical and/or seriously unsolved problems in the measurement principle (YAMAKOSHI et al., 1980; SHAPIRO et al., 1981 ), the progress in these methods has not yet been extended so as tO be in wide use.
We have recently devised a new method for the noninvasive measurement of beat-to-beat systolic and
Received l ltb November 1982 �9 IFMBE: 1983
diastolic pressure and pressure waveform, and demonstrated its validity and accuracy through in vitro and in vivo studies using excised arterial segments, the rat's tail and the human finger (YAMAKOSHI et al., 1979, 1980). This method is based on a principle known as the 'indirect unloading technique' which was originally proposed by MAREY (1876) (GEDDES, 1970) and lately by SHIRER (1962) and PENAZ (1973). Using a hydraulic servocontrol system, the vascular volume change associated with intra-arterial pressure can be compensated by applying counter pressure to maintain a constant vascular volume in an unloaded state. The vascular volume in this state is called the unloaded vascular volume. In this state the controlled counter pressure instantaneously follows the intra- arterial pressure.
This paper describes a new automated instrument using this technique, which was designed for practical and convenient use for monitoring the instantaneous arterial pressure continuously and noninvasively. The simultaneous comparison of data with direct
Medical & BieJogical Engineering & Computing September 1983 557

measurements and a few examples of the indirect pressure recordings by this instrument are shown and the operation and evaluation of this instrument are described;
2 Materials and methods
2.1 Descript ion o f the ins trument 2.1.1 Servocontro t sys tem and mechanical and
volume-sensing units. Fig. 1 is a schematic diagram of the instrument for the automatic measurement of instantaneous arterial pressure at the middle or root of a human finger. The principle of this instrument is based on the volume-servocontrol system which is essentially the same as that previously reported (YAMAKOSHI et al., 1979, 1980). The major components of this instrument are:
(a) a hydraulic compression chamber which is equipped with an occluding cuff
(b) an electromagnetic shaker for controlling the counter pressure (cuff pressure Pc)
(c) an infra-red transmittance photoelectric plethysmograph
(d) a volume servo circuit
(e) a pen recorder
( f ) a processing unit which operates a sequential control of the entire measurement procedure.
The chamber has a diaphragm actuator (effective diaphragm area = 15cm 2) which is linked with plunger (p) of the shaker via a retainer plate (r.p.) firmly fixed to the diaphragm. A finger is placed in the chamber through the cuff, so that the finger segment can be compressed by the hydraulic pressure in the chamber (Pc). The cuff is a thin-walled (0.1 mm) rubber tube which is formed so that no cuff tension is developed during the compression. Both flanges of the cuff are firmly fixed to both ends of the chamber by a pair of annular discs (a.d.). The effective cuff widths used were 22, 26 and 30mm, with respective inner diameters of 15, 20 and 23 mm, according to the size of the finger segment. This mechanical chamber system has a compliance of approximately 0.2 ml/100 mm Hg.
The shaker (G-005, Shinken Co.) has a maximum displacement of +5ram, a force of 68.7N and a natural frequency of 90 Hz. The position of the plunger is sensed by a photoelectric linear displacement transducer (l.t.) (frequency response - 3 d B at 100 Hz). The controlled volume (S~) can be obtained if necessary from the output of this transducer. The cuff pressure is measured by a pressure transducer (UPS-300, Ueda Electronics Works Co.; linearity 0 - 300 mm Hg/+ 0" 1% full scale, frequency response, flat up to about 80 Hz).
The photoelectric plethysmograph is used to detect the volume change in the finger. Series-connected light-emitting diodes (TLN 104, Toshiba Electric Co.; peak wavelength, 940nm) and parallel-connected phototransistors (TPS 605, Toshiba Electric Co.) serve
at/il l
PRES$ORE TRAN$OUCER ~-~PEN-REGORDER
SHAKER
dL..i ~ . ] r NOISE LEVELIET CONTROLLER
Fig. 1 Schematic diagram of the instrument for the noninvasive measurement of instantaneous arterial pressure in the finger. The solid thick line indicates the volume servo-control loop. The arrangements and connections of the light emitting diodes (l.e.d.) and the phototransistors (p.t.) are shown in the insets. For symbols see text
558 Medical & Biological Engineering & Computing September 1983

as light source (1.e.d.) and photodetector (p.t.), respectively. The arrangements of these l.e.d, and p.t. elements are shown in the insets of Fig. 1. They are fixed directly on the skin of the finger opposite each other using pieces of adhesive tape. At this time care should be taken not to over compress the finger segment by the tape. The frequency response of this plethysmograph is uniform up to about 100 Hz.
2.1.2 Open-loop operation. The two successive operations are carried out automatically to obtain the instantaneous arterial pressure noninvasively by this instrument. The first is an 'open-loop operation' to set a reference value for the servocontrol (PGre f in Fig. 1), and the second is a 'closed-loop operation' to display the instantaneous arterial pressure by automatically adjusting the loop gain of the system. These two operations are demonstrated in the timing chart of the sequential procedure shown in Fig. 2, which will be understood by making reference to Fig. 1.
Following a start signal, the cuff pressure is raised gradually at a rate of 2 3 mm Hg per heartbeat up to a preset pressure level (160,200,250, or 300mm Hg) by a fluid microroller pump. During this stage, the peak amplitude of the beat-to-beat pulsations (P'gw) superimposed on the photoelectric plethysmogram
(p.g.) through an a.c. amplifier (a.c. amp) is detected and held by a peak-hold circuit (p.h.c.). The magnitude of the peak-held beat-to-beat signal is successively compared and the maximum one is discriminated by a maximum peak detector (m.p.d.). The mean level of the plethysmogram at the point of the maximum pulsation serves as the reference value for the servocontrol (PGref)*, whereas the cuff pressure at this point is used as an initial value for the servocontrol (P,,,).
The values thus determined (PGre f and P j are then stored in a central controlling unit. After reaching the upper level, the cuff pressure is decreased until it reaches the pressure value previously stored. The corresponding mean level of the plethysmogram at this moment is compared with the preceding one. If these two values are equal, a sample and hold circuit (s/h) is turned to the hold mode by a triggering signal from a hold-signal generator (h.s.g.) to set this value as PGrej-. When they are not equal, relatively large fluctuations in intra-arterial pressure are considered to take place. In this case the cuff pressure is precisely controlled again until the maximum amplitude of the pulsation is detected.
Signal artei'acts due to movements of the finger are
* This point has been experimentally proved to correspond with the unloaded vascular volume (YAMAKOSHI et at, 1982a).
START SIGNAL J-] INFUSION
MICRO-PUMP SUCTION
CUFF PRESSURE: Pc
PEAK HOLD SIGNAL OF PG PULSATIONSc PGpI _
SIGNAL FOR CONFIRMATION GF MAX. POINT OF PGp
SAMPLE-UOLO FOR s OC LEVE L OF PG X - [
START SIGNAL FOR SERVOCONTNOL ON
SHAKER OFF
AUTO-GAIN OF POWER AMP
RECORDER
1 ,o,,T I , , , l l i , . . . . i
F i g . 2
J-I
SYSTOLIC PRESSURE
DIASTOLIC PRESSURE
] ] 1 , . . . . . . . . .
0 ON OFf
[
n i
I POR ~ PGp[co,t/PGplmax T-^ /~ .
PG SIGNAL O . . . . . . . . . . . . . . . . . . . . . . . . . . . . . . . . . . . . . . . -PG-PJmaz~L~ ~ ~ . ~ ' ~ . . , PGpJcont
OPEN-LOOP OPERATION " z t - CLOSED-LOOP OPERATION
Timing chart of the sequential procedure. See text.['or fi~rther details
Medical & Biological Engineering & Computing September 1983 559

rejected by the operation conditioned by the following criteria:
(a) the difference in amplitud e of two consecutive pulsations is compared with a preset noise level during the process of the increase or decrease in cuff pressure and is discriminated if it is within an allowable limit
(b) at the moment when an artefact is found, the driving of the roller pump is suspended to maintain the cuff pressure to obtain at least two consecutive pulsations of almost equal amplitude, and the operation is continued again just after these pulsations are confirmed to be almost equal.
In this way PG~,, I is exactly determined and set automatically during the open-loop operation. The c[osed-loop operation then follows to start the continuous measurement of instantaneous arterial pressure.
2.1.3 Closed-loop operation. The plethysmographic signal is subtracted from PG~,,y by means of a differential amplifier (d.amp) to produce a
servocontrol error. The error is fed to a power amplifier (p.a.; maximum output power, 80 W) via a gain and phase lead4ag compensator (c.m.p.). Thus, the shaker is driven by the p.a. to control Pc in accordance with the eompensated error signal. Automatic adjustment of the closed-loop gain of the servosystem is carried out by controlling the gain of the p.a. by the use of a gain controller (a.g.c.) which is constructed using a photocoupler (MCD-521, Toshiba Electric Co.). The gain of the p.a. is gradually increased until it reaches a preset value of the pulse disappearance ratio (PDR: - 1 0 , - 1 5 , - 2 0 , or - 25 dB) which is defined as the ratio of the amplitude of the plethysmographic pulsation during the servocontrol (PGrl~o,t) to the maximum amplitude (PGp[m,~,) (PDR = PGpl,.o,]PG~,lm,~; see Fig. 2). It has been previously demonstrated that less than 5% measurement error in pulse pressure is attainable when PDR is less than approximately - 1 5 d B (YAMAKOSH1 e t al., 1979, 19~,0). The p.g. signal is almost clamped a ta PG,~ I value at the moment when PDR reaches the preset value, and then the instantaneous arterial pressure measured from Pc is displayed on the recorder.
GUFF PRESSURE
Pc
mmH 200-
100-
I--lOs--~ ~-ls-~
Pli _ / 4 ~ , l l l i l l l l la l lnl l l l & ~ ~ Illa''l L[
PLETHYSMOGRAM
PG
PG PULSATION �9 MAXIMUM POINT
AUTO-GAIN ~PE=ATiO~ POR -50 dB
DETECTION SIGNAL FOR MAXIMUM PEAK OF PGp t
/
Fig. 3
START / OPEN-LOOP OPERATION ~CLOSEO-LOOP OPERATION
An example showin9 the SimultaneOus recordings of cuff pressure (P,.), the "photoelectric plethysmogram (p.g.), its pulsatile component ( PG t,) and detection signal fi~r the maximum peak of PG p obtained from an index.finger of a health)' subject in the open- and closed-loop operation
560 Medical & Biological Engineering~& Computing September 1983

The dynamic characteristics of this closed-loop system, including the mechanical chamber system, were assessed by measuring the Bode's diagram of the open-loop system (input = sinusoidal p.g. signal with constant amplitude; output = Pc. To obtain a high response and stability of the system it was necessary to utilise the c.m.p, with an appropriate transfer function
6c(s) -~ (1 +2'5 x lO-2s)(1 + 10 "?'S)
(1+5"2x 10⁻²s)(l + l ' 2 x 10 2s)
The frequency response was evaluated by transferring the measured Bode's diagram to the Nichols chart; the bandwidth of better than 40 Hz and the maximum amplitude ratio in ~ (maximum gain My) of approximately +3dB were obtained under the condition of P D R ~< - 15 dB.
Less than 1 min is required for the instantaneous arterial pressure to be displayed on the recorder according to this sequential procedure. Approximately 1 h of continuous recording is possible without much discomfort, which is brought about by the venous congestion of the finger distal concerned to the measuring site. To avoid discomfort due to finger .compression a 5min measurement intermission is
provided in this instrument. This can be inserted in each continuous recording of 1/6, 1/2, 1, or 2 h preset.
2.2 Evaluation; subjects and methods
The instrument has been successfully used to measure the instantaneous arterial pressure in 55 subjects (45 males from 18 to 69 years old and 10 females from 20 to 55 years old), including six hypo- and 18 hypertensives and five patients with vascular diseases. The index or middle finger was used as a measuring site. During the measurements the subjects were in a supine or sitting position with the arm under test held horizontally at heart level.
First, a simultaneous comparison of the indirect arterial pressure given by this instrument with the direct arterial pressure was carried out in three normotensives and three hypertensives with an indwelling arterial catheter for routine care. The catheter was inserted into the left brachial artery at the medial side of the cubital fossa (the catheter tip in the artery was placed 4-5cm proximal to the insertion point) and connected to a Statham P-37 pressure transducer. In this study the subjects were supine on a bed and the left index or middle finger was used as the measuring site. A linear correlation analysis was examined from a part of the simultaneous data
2~
i /
J ~ 10( ~ i ~ OTlNSIV[ _ (/
/ / / /
/// 0 100
DIRECT PRESSURE Pb mraHg
Y=X
/ HYPERTENSiVI
J
Fig. 4
(a) (b)
( a) A part qf the simultaneous recordings (?]direct brachial arterial pressure ( Pb) and indirect.finger arterial pressure ( P,.). by this instrument obtained in a normotensive (upper records) and a hypertensive subject (lower records). Various testings during the measurement are indicated in the lower part of the records
( b ) Lissajous's flgures of the indirect (ordinate) and direct (abscissa) pressure waveJorms surrounded by broken lines in ( a). Each onset of the rising.]hot of these paired wavejbrms was shifted to be coincident in this diagram
Medica l & Biological Engineering & Comput ing September 1983 561

obtained under the various conditions such as resting, the cold pressor test, the Valsalva monoeuvre, deep breathing, the carotid sinus compression test and mental arithmetic. Under three or four of these conditions 80-120 consecutive pairs of beat-to-beat systolic and diastolic pressure values were collected for each subject. The mean number of the paired data in each correlation study was 100.
The performance, practicability and convenience of use for the measurement of arterial pressure by this instrument were evaluated by the other subjects without arterial catheters. All the measurements were performed at room temperature, around 18 -2TC.
determined manually from the raw signal of PGp. The difference between the P,.~ and PI.i values was 1.0 + 0.7 mm Hg (mean + s.d.). This indicates that the initial value can be automatically set within an accuracy of approximately 1%.
By the closed-loop operation instantaneous arterial pressure was successfully obtained. PDR was preliminarily set at - 20 dB in this example. Both beat- to-beat systolic and diastolic pressure can be determined from the servocontrolled cuff pressure after reaching the fixed value of PDR by the automatic gain control of the power amplifier. Measurements were stable in all the subjects showing better than - 1 5 d B i n PDR.
3 Results
3.1 Per]brmance qf the operation
Fig. 3 shows an example of the actual operations showing the simultaneous recordings of cuff pressure (P,.), the photoelectric plethysmogram (p.g.), its pulsatile component (PGp) and detection signal for the maximum peak of PGp obtained from the index finger of a healthy subject. The p.g. signal is recorded only in the closed-loop operation in this figure.
In the open-loop operation, it was observed that the automatic determination of the maximum peak of PG~, indicated by the detection signal was successfully performed and that the cuff pressure corresponding to the maximum point (Pc~) was given exactly by the initial value for the servocontrol. The accuracy of the Pc~ thus automatically determined was evaluated through 45 measurements in 20 different subjects by comparing p,.~ with the initial cuff pressure (p',.~)
3.2 Comparison stud)"
Fig. 4a is a part of the simultaneous recordings of direct brachial arterial pressure (P~) and indirect finger pressure (Pc) by this instrument obtained in a normotensive and a hypertensive subject. As shown in the lower parts of each pair of records in this Figure, arterial pressure waveforms recorded by this instrument were as similar as those obtained by the direct method. The similarity between these waveforms was also demonstrated by the Lissajous's figures in Fig. 4b obtained in the same subjects. (In this diagram each onset of the rising foot of direct and indirect pressure waveforms was shifted to be coincident.) It was clearly shown that the transient changes in the indirect pressure produced by various testings were in good agreement with those in the direct intra-arterial pressure. These results represent the ability of the instrument to track the instantaneous arterial pressure in different pressure levels. However,
~oo ~-
~ ! 100.
O- 900!
,oo.
BEFORE OPERATION ~Hg i
BaH 9
n
200"
100'
AFTER OPERATION
i i . . , ; +
p . . . . .
. . . . . . : i ] i ' i . . . . 150
i . ^ i ~i ~ ' " "
' - - 5 0 :
. i i i i i i '. i i i
Fig. 5 An example qf the indirect arterial pressure recordings obtained J?om the right (upper records) and left index.finger (lower records) q] a patient with a stenosis in the left subclavian artery be]bre (leJt panel) and after (right panel) the vascular reconstruction by gr~]Hng an art([ieial vessel. See text .[or.[urther explanation
562 Medical & Biological Engineering & Computing September 1983
che indirect finger pressure was about 10mm Hg lower than the directly recorded brachial arterial pressure, which would be caused by the difference in the recording sites and/or by the construction due to the insertion of the catheter.
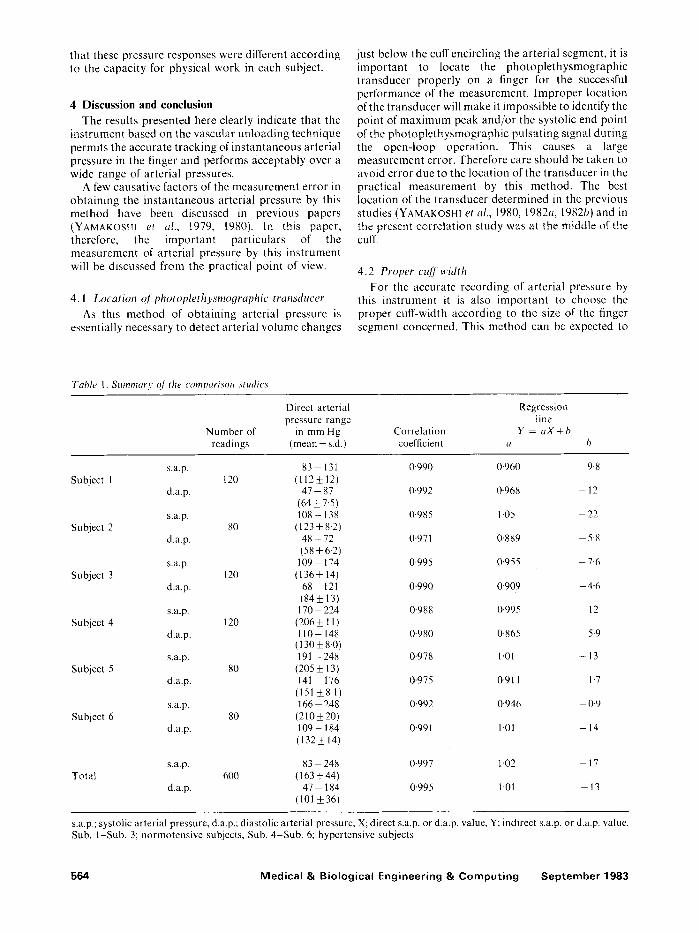
The results of the linear correlation analyses obtained from six subjects are summarised in Table 1. There was a fairly good correlation between the direct and indirect measurement of both systolic and diastolic pressures at a within-subject level as well as across all the subjects. This suggests that this instrument is a practicable substitute for intra-arterial catheterisation in measuring instantaneous arterial pressure.
3.3 Examples o f indirect pressure recordings
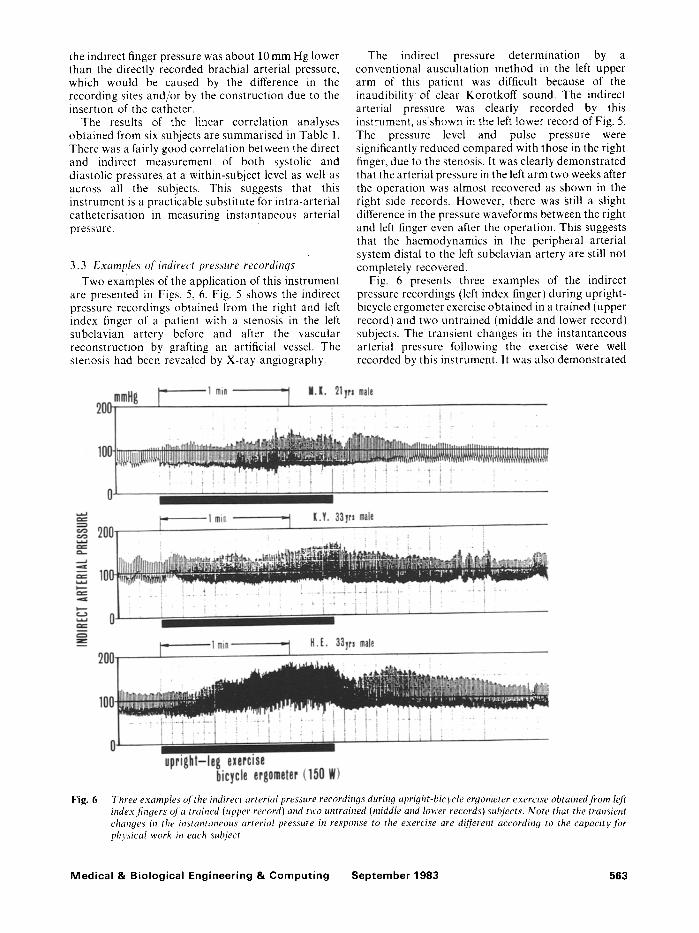
Two examples of the application of this instrument are presented in Figs. 5, 6. Fig. 5 shows the indirect pressure recordings obtained from the right and left index finger of a patient with a stenosis in the left subclavian artery before and after the vascular reconstruction by grafting an artificial vessel. The stenosis had been revealed by X-ray angiography.
The indirect pressure determination by a conventional auscultation method in the left upper arm of this patient was difficult because of the inaudibility of clear Korotkoff sound. The indirect arterial pressure was clearly recorded by this instrument, as shown in the left lower record of Fig. 5. The pressure level and pulse pressure were significantly reduced compared with those in the right finger, due to the stenosis. It was clearly demonstrated that the arterial pressure in the left arm two weeks after the operation was almost recovered as shown in the right side records. However, there was Still a slight difference in the pressure waveforms between the right and left finger even after the operation. This suggests that the haemodynamics in the peripheral arterial system distal to the left subclavian artery are still not completely recovered.
Fig. 6 presents three examples of the indirect pressure recordings (left index finger) during upright- bicycle ergometer exercise obtained in a trained (upper record) and two untrained (middle and lower record) subjects. The transient changes in the instantaneous arterial pressure following the exercise were well recorded by this instrument. It was also demonstrated
Fig. 6 Three examples of the indirect arterial pressure recordings during upright-bicycle ergometer exercise obtained fi'om left index.fingers of a trained (upper record) and two untrained (middle and lower records) subjects. Note that the transient changes in the instantaneous arterial pressure in response to the exercise are dijJerent according to the capacity Jor physical work in each subject
Medical & Biological Engineering & Computing September 1983 563
that these pressure responses were different according to the capacity for physical work in each subject.
4 Discussion and conclusion
The results presented here clearly indicate that the instrument based on the vascular unloading technique permits the accurate tracking of instantaneous arterial pressure in the finger and performs acceptably over a wide range of arterial pressures.
A few causative factors of the measurement error in obtaining the instantaneous arterial pressure by this method have been discussed in previous papers (YAMAKOSHI et al., 1979, 1980). In this paper, therefore, the important particulars of the measurement of arterial pressure by this instrument will be discussed from the practical point of view.
4.1 Location q]photoplethysmoqraphic transducer
As this method of obtaining arterial pressure is essentially necessary to detect arterial volume changes
just below the cuff encircling the arterial segment, it is important to locate the photople thysmographic transducer properly on a finger for the successful performance of the measurement, lmproper location of the transducer will make it impossible to identify the point of maximum peak and/or the systolic end point of the photople thysmographic pulsating signal during the open-loop operation. This causes a large measurement error. Therefore care should be taken to avoid error due to the location of the transducer in the practical measurement by this method. The best location of the transducer determined in the previous studies (YAMAKOSHI et al., 1980, 1982a, 1982b) and in the present correlation study was at the middle of the cuff.
4.2 Proper cuff width For the accurate recording of arterial pressure by
this instrument it is also important to choose the proper cuff-width according to the size of the finger segment concerned. This method can be expected to
Table 1. Summary o/the comparisor~ studies
Direct arterial Regression pressure range line
Number of in mm Hg Correlation Y = a X + b readings (mean _+ s.d.) coefficient a b
s.a.p. 83 - 131 0-990 0.960 9.8 Subject 1 120 (112+ 12)
d.a.p. 47 - 87 0-992 0-968 - 12 (64+7.5)
s.a.p. 108 - 138 0"985 1.05 - 22 Subject 2 80 (123 + 8.2)
d.a.p. 48 - 72 0.971 0-889 5"8 (58 -+ 6-2)
s.a.p. 109 - 174 0.995 0.955 7"6 Subject 3 120 (136+ 14)
d.a.p. 68 121 0.990 0"909 4-6 184_+13)
s.a.p. 170 224 0"988 0-995 12 Subject 4 120 (206 + 11 )
d.a.p. 110- 148 0"980 0-865 5"9 (130_+8.0)
s.a.p. 191 -248 0"978 1.01 - 13 Subject 5 80 (205 _+ 13)
d.a.p. 141 176 0.975 0-911 1.7 (151•
s.a.p. 166 - 248 0.992 0"946 0.9 Subject 6 80 (210+20)
d.a.p. 109-184 0.991 1-01 - 14 (132_+14)
s.a.p. 83 - 248 0-997 1-02 - 17 Total 600 ( 163 • 44)
d.a.p. 47 - 184 0-995 1-01 - 13 (101 _+36)
s.a.p.; systolic arterial pressure, d.a.p.; diastolic arterial pressure, X; direct s.a.p, or d.a.p, value, Y; indirect s.a.p, or d.a.p, value, Sub. 1-Sub. 3; normotensive subjects, Sub. 4-Sub. 6; hypertensive subjects
564 Medical & Biological Engineering & Computing September 1983
permit acceptable measurement under the following two condit ions:
(a) the cuff pressure is t ransmit ted to at least the central area of the arterial segment just below the cuff
(b) arterial volume changes in this area are detected by the photop le thysmographic t ransducer placed exactly at the middle of the cuff.
ALEXANDER et al. (1977) have reported the relat ionship between the cuff-width and the pressure t ransmission to artery th rough theoretical and experimental investigations. According to their considerat ions, the applied counter pressure is accurately t ransmit ted th roughout the arterial segment when the cuff width is greater than 1"2 times the d iameter of the segment concerned. In this study, using h u m a n fingers, we selected the proper cuff-width according to their considerat ions; the cuff-width ranging from 1.3 to 1"5 times the diameters of the finger segments was used in this study. The results shown in Fig. 4 and Table 1, and previous compar ison data (YAMAKOSH1 et HI., 1979, 1980) were successfully obta ined using this cuff width. This, in turn, strongly suggests tha t the two condi t ions (a) and (b) stated above could be satisfied by this method.
4.3 Wide dynamic range
Ins tan taneous arterial pressure can be measured noninvasively and cont inuously in a fully automat ic manne r with this instrument. This is an enormous difference from other au tomat ic ins t ruments based on convent ional cuff / sphygmomanometr ic techniques, which moni to r systolic and diastolic pressure only intermittently, at about half-minute intervals (SMITH and BICKLEY, 1964; GEDDES, 1970; COBBOLD, 1974). Fur thermore , as this method using the vascular un loading technique does not measure a blood flow dependent parameter , but ra ther b lood volume pulsations, it could be capable of conduct ing an accurate recording of ins tantaneous arterial pressure in such difficult condi t ions as hypotens ion or cardiovascular shock. Al though the ampli tude of volume pulsat ions is reduced in such condit ions, the max imum peak is still usually measurable, and then the closed-loop opera t ion can be succeeded to record ins tan taneous arterial pressure. RAMSEY (1979) and YELDERMAN and REAM'(1979) have reported that a convent ional cuff/oscillometric method can measure mean arterial pressure even in such difficult condit ions. We have also reported almost the same opin ion using a volume/oscil lometric method (YAMAKOSHI er al., 1982a, b). This method is similar to the cuff/oscillometric or the volume/oscil lometric method in its ability to measure arterial pressure in such difficult condit ions.
In conclusion, the ins t rument for the au tomat ic and noninvas ive moni tor ing of ins tan taneous arterial pressure using the vascular unloading technique
appears to have good operat ing characterist ics and validity and to be useful and applicable to a very wide field in basic life sciences and clinics.
Acknowledgment- The authors wish to thank Ueda Electronics Works Co., Tokyo, Japan, for their assistance in constructing the instrument, Prof. K. Tsuchiya, Department of Mechanical Engineering, Waseda University, for his valuable criticism, Prof. H. Yasuda, Department of Cardiovascular Medicine, Hokkaido University, for his clinical assistance, and Mr. M. Shibata and Mr. A. Kawarada for their technical assistance.
References
ALEXANDER, H., COHEN, M. L. and STEINFIELD, L. S. (1977) Criteria in the choice of an occluding cuff for the indirect measurement of blood pressure. Med. & Biol. Eng. & Comput., 15, 2-10.
COBBOLD, R. S. C. (1974) Transducers jor biomedical measurement: principles and applications. John Wiley & Sons, New York, 486.
GEDDES, L. A. (1970) The direct and indirect measurement of blood pressure. Year Book Medical Publishers, Chicago, 196.
MArEY, E. J. (1876) Pression et vitesse du sang. In Pbysiolo~tique experimenta/e vol. 2, MASSON, G. led.), Paris.
PENAZ, J. (1973) Photoelectric measurement of blood pressure, volume and flow in the finger. Digest 10th Internt. Conf. Med. Biol. Engng., 104.
PRESSMAN, G. L. and NEWGARD, P. M. (1963) A transducer for the continuous external measurement of arterial blood pressure. IEEE Trans., BME-10, 73 81.
RAMSEY, M. Ill (1979) Noninvasive automatic determination of mean arterial pressure. Med. & Biol. Eng. & Comput., 1"7, 11 18.
SHAPIRO, D., GREENSTADT, L., LANE, J. D. and RUB1NSTEIN, E. (1981) Tracking-cuff system for beat-to-beat recording of blood pressure. Psychophysiol., 18, 129-136.
SHIRER, H. W. (1962) Blood pressure measuring methods. IRE Trans., BME-9, 116-125.
SM1TH, C. R. and BICKELY, W. H. (1964) The measurement of blood pressure in the human body. SP-5006, NASA, 1 34.
STE1N, P. D. and BLICK, E. F. (197l) Arterial tonometry for the atraumatic measurement of arterial blood pressure. J. Appl. Physiol., 30, 593-596.
YAMAKOSHI, K., SHIMAZU, H. and TOGAWA, T. (1979) Indirect measurement of instantaneous arterial blood pressure in the rat. Amer. J. Physiol., 237, H632 H637.
YAMAKOSHI, K., SmMAZU, H. and TOGAWA, T. (1980) Indirect measurement of instantaneous arterial blood pressure in the human finger by the vascular unloading technique. IEEE Trans., BME-27, 150 155.
YAMAKOSH1, K., SHIMAZU, H., SHIBATA, M. and KAM1YA, A. (1982a) New oscillometric method for indirect measurement of systolic and mean arterial pressure in the human finger. Part 1: model experiment. Med. & Biol. Eng. & Comput., 20, 307 313.
YAMAKOSHI, K., SHIMAZU, H., SH1BATA, M. and KAMIYA, A. (1982b) New oscillometric method for indirect measurement of systolic and mean arterial pressure in the human finger. Part 2: correlation study, ibid., 20, 314-318.
YELDERMAN, M. and REAM, A. (1979) Indirect measurement of mean blood pressure in the anesthetized patient. Anesthesiol., 50, 253-256.
Medical & Biological Engineering & Computing September 1983 565