nongovernmental organizations, democracy, and deforestation: a cross-national analysis
TRANSCRIPT
This article was downloaded by: [University of California, San Francisco]On: 28 October 2014, At: 15:38Publisher: RoutledgeInforma Ltd Registered in England and Wales Registered Number: 1072954 Registeredoffice: Mortimer House, 37-41 Mortimer Street, London W1T 3JH, UK
Society & Natural Resources: AnInternational JournalPublication details, including instructions for authors andsubscription information:http://www.tandfonline.com/loi/usnr20
Nongovernmental Organizations,Democracy, and Deforestation: A Cross-National AnalysisJohn M. Shandra a , Louis E. Esparza b & Bruce London ca Department of Sociology , State University of New York at StonyBrook , Stony Brook , New York , USAb Department of Sociology , California State University at LosAngeles , Los Angeles , California , USAc Department of Sociology , Clark University , Worcester ,Massachusetts , USAPublished online: 23 Aug 2011.
To cite this article: John M. Shandra , Louis E. Esparza & Bruce London (2012) NongovernmentalOrganizations, Democracy, and Deforestation: A Cross-National Analysis, Society & Natural Resources:An International Journal, 25:3, 251-269, DOI: 10.1080/08941920.2011.573841
To link to this article: http://dx.doi.org/10.1080/08941920.2011.573841
PLEASE SCROLL DOWN FOR ARTICLE
Taylor & Francis makes every effort to ensure the accuracy of all the information (the“Content”) contained in the publications on our platform. However, Taylor & Francis,our agents, and our licensors make no representations or warranties whatsoever as tothe accuracy, completeness, or suitability for any purpose of the Content. Any opinionsand views expressed in this publication are the opinions and views of the authors,and are not the views of or endorsed by Taylor & Francis. The accuracy of the Contentshould not be relied upon and should be independently verified with primary sourcesof information. Taylor and Francis shall not be liable for any losses, actions, claims,proceedings, demands, costs, expenses, damages, and other liabilities whatsoever orhowsoever caused arising directly or indirectly in connection with, in relation to or arisingout of the use of the Content.
This article may be used for research, teaching, and private study purposes. Anysubstantial or systematic reproduction, redistribution, reselling, loan, sub-licensing,systematic supply, or distribution in any form to anyone is expressly forbidden. Terms &
Conditions of access and use can be found at http://www.tandfonline.com/page/terms-and-conditions
Dow
nloa
ded
by [
Uni
vers
ity o
f C
alif
orni
a, S
an F
ranc
isco
] at
15:
38 2
8 O
ctob
er 2
014
Nongovernmental Organizations, Democracy, andDeforestation: A Cross-National Analysis
JOHN M. SHANDRA
Department of Sociology, State University of New York at Stony Brook,Stony Brook, New York, USA
LOUIS E. ESPARZA
Department of Sociology, California State University at Los Angeles,Los Angeles, California, USA
BRUCE LONDON
Department of Sociology, Clark University, Worcester,Massachusetts, USA
There have been several cross-national studies published in the world politytheoretical tradition that demonstrate the beneficial impact of international nongo-vernmental organizations. However, these studies neglect the role of domestic non-governmental organizations. We address this gap in the literature by conducting across-national study that considers the impact of both international and domesticnongovernmental organizations on deforestation. We use data from a sample of60 nations for the period of 1990 to 2005. We find substantial support for the worldpolity theory that higher levels of both types of nongovernmental organizations areassociated with lower rates of deforestation. We expand the analysis to test apolitical opportunity structure hypothesis that democracy enhances the ability ofnongovernmental organizations to deal with the causes of forest loss. In doing so,we find that international and domestic nongovernmental organizations tend todecrease forest loss more in democratic rather than in repressive nations.
Keywords cross-national, deforestation, nongovernmental organizations
In recent years, there have been several cross-national studies published in the worldpolity theoretical tradition that examine how international nongovernmental organi-zations (INGOs), organizations with operations in two or more nations, affect vari-ous environmental issues including adoption of environmental impact assessmentlaws, establishment of environmental ministries, and ratification of environmentaltreaties (e.g., Hironaka 2002; Frank et al. 2000; Frank 1999). Largely absent fromthis research, however, is consideration of the role that domestic nongovernmental
Received 29 July 2009; accepted 8 February 2010.Address correspondence to John M. Shandra, Department of Sociology, State University
of New York at Stony Brook, Stony Brook, NY 11794-0751, USA. E-mail: [email protected]
Society and Natural Resources, 25:251–269Copyright # 2012 Taylor & Francis Group, LLCISSN: 0894-1920 print=1521-0723 onlineDOI: 10.1080/08941920.2011.573841
251
Dow
nloa
ded
by [
Uni
vers
ity o
f C
alif
orni
a, S
an F
ranc
isco
] at
15:
38 2
8 O
ctob
er 2
014

organizations (DNGOs), organizations with operations in only a single nation, playin such affairs; see Frank et al. (2007) as a notable exception. This is somewhat sur-prising for a couple of reasons. First, Trzyna (1996) has collected data on the numberof DNGOs for each nation. Second, there is a substantial amount of evidence sug-gesting that both INGOs and DNGOs use similar tactics and techniques in helpingto bring about environmental improvements. For instance, INGOs and DNGOsfund conservation projects, support social movement activity, write corporate codesof conduct, monitor compliance with environmental agreements, and conductresearch for intergovernmental organizations (e.g., Newell 2000; Bryant and Bailey1997; Princen 1994). However, the ability of INGOs and DNGOs to bring aboutenvironmental improvements has been called into question. Princen (1994) notes thatINGO and DNGO projects may be too small scale, ad hoc, or limited in geographi-cal focus to bring about any meaningful change. Chapin (2004) argues that increasedcorporate funding of INGOs and DNGOs may lead these organizations to overlookenvironmental malfeasances of donors, thereby threatening their legitimacy.
Thus, we begin our cross-national study with the goal of examining the con-tested effects of both INGOs and DNGOs on deforestation. Note that mostcross-national research in the world polity tradition examines policies (e.g., treaties,impact assessments, environmental ministry establishments). In contrast, we exam-ine an outcome (e.g., environmental degradation)—see also Shandra (2007) andSchofer and Hironaka (2005). We also expand this study in another novel way.Lewis (2000) finds that INGOs have been more successful at protecting land areain the democratic nation of Ecuador than in the Pinochet military dictatorship ofChile. She attributes this finding to the fact that these governments provide different‘‘political opportunity structures’’ that shape the operations of INGOs. Put differ-ently, the level of democracy moderates the effects of INGOs and DNGOs on defor-estation. This compelling hypothesis has not been demonstrated to hold beyond theLatin American nations examined by Lewis (2000). Thus, we test the generality ofline of reasoning here using cross-national data for a large sample of nations in orderto determine whether INGOs and DNGOs help to decrease deforestation more indemocratic than repressive nations.
We now turn to a review of world polity theory and its predictions regarding theimpact of INGOs on forest loss. We extend this discussion to consider DNGOs. Wethen elaborate upon the political opportunity structure hypothesis that governmentsmay enhance or constrain the ability of these organizations to deal with deforestation.We go on to discuss the inclusion of other theoretically relevant predictors in ourcross-national models. We conclude by discussing the findings, theoretical and meth-odological implications, policy suggestions, and possible directions for future research.
World Polity Theory
World polity theory suggests several mechanisms by which INGOs may affect forestloss. To begin, INGOs provide financial, technical, and organizational support atthe local level (Ndegwa 1996). In many instances, this involves funding conservationinitiatives including agroforestry projects, demarcation of protected areas, and moni-toring illegal logging (Bryant and Bailey 1997). A good example of this tactic is adebt-for-nature swap. In a debt-for-nature swap, a portion of a nation’s debt is paidoff by an INGO or consortium of these organizations, in return for which the recipientnation agrees to set aside an area for complete protection (Bryant and Bailey 1997).
252 J. M. Shandra et al.
Dow
nloa
ded
by [
Uni
vers
ity o
f C
alif
orni
a, S
an F
ranc
isco
] at
15:
38 2
8 O
ctob
er 2
014

DNGOs also help to fund and establish conservation projects (Barbosa 2001).For instance, Fundacion Natura, a nongovernmental organization in Ecuador,works with INGOs that implement debt-for-nature swaps (Bryant and Bailey1997). It manages agroforestry projects in communities living close to protectedareas established after debt-for-nature swaps have been implemented. The goalis to stop the exploitation of natural resources inside the protected areas by provid-ing local people alternative income generating activities (Bryant and Bailey 1997).
Second, INGOs employ more confrontational tactics (Rich 1994). This can beobserved in practice when they employ various frames and discourses that encouragelocal social movement activity within a nation (e.g., logging blockades, strikes, pro-tests, union organization, and consumer boycotts) (Princen 1994). It may alsoinvolve monitoring and exposing illegal logging (Barbosa 2001).
A good illustration of this point comes from Malaysia. The Penan have beenengaged in protest activities including blockading logging roads and sabotaging log-ging equipment to regain control over forests in the Sarawak region, which theydepend upon for hunting and gathering (Hurst 1990). Several INGOs have triedto help the Penan in their struggle. For instance, Friends of the Earth organized bothconsumer boycotts of hardware stores to stop selling timber from the Sarawakregion and educational campaigns concerning the plight of the Penan (Bryant andBailey 1997). The organization also lobbied local governments in the region torefrain from using Malaysian timber in public construction projects while also press-ing the European Union to ban forestry imports from Malaysia (Keck and Sikkink1998).
However, Bryant and Bailey (1997) argue that two DNGOs, Sahabat AlamMalaysia and the World Rainforest Movement, were heavily involved with the plightof the Penan struggle even before it became somewhat of a ‘‘cause celebre’’ amongINGOs. These two DNGOs put pressure on the Malaysian government to end log-ging by providing logistical support for logging blockades, supporting national letterwriting campaigns, mounting legal challenges in the Malaysian courts, and arrangingfor Penan representatives to meet with high ranking government officials (Hurst1990). The World Rainforest Movement and Sahabat Alam Malaysia also actedas an information clearinghouse and led reporters to ‘‘good’’ stories, which contrib-uted to the heightened international media attention around the Penan (Bryant andBailey 1997).
Third, INGOs also help protect forests by setting standards and creating techni-cal guidelines. The Forestry Stewardship Council proves to be a good example of this.In the early 1990s, businesses, consumer groups, and several INGOs, led by theWorldWildlife Fund, came together to design a program to alleviate customer confusionregarding what products came from sustainably harvested forests (Newell 2000).The participants in the program voluntarily agree to meet nine principles of forestmanagement. A Forestry Stewardship Council logo denotes that the product was har-vested from an independently certified forest that meets the nine principles (Newell2000). Initially, the program was criticized for failing to secure participants from poornations (Bryant and Bailey 1997). Today, DNGOs help to monitor compliance byensuring logging is being done in accordance with the principles (Newell 2000).
Fourth, INGOs work to decrease deforestation by shaping the language ofenvironmental treaties and research produced by intergovernmental organizations(Frank et al. 2000). In the absence of resources and formal enforcement mechanisms,they monitor compliance with treaty obligations (Barbosa 2001). Thus, INGOs
Nongovernmental Organizations and Deforestation 253
Dow
nloa
ded
by [
Uni
vers
ity o
f C
alif
orni
a, S
an F
ranc
isco
] at
15:
38 2
8 O
ctob
er 2
014

are in a position to point out embarrassing failures and hypocrisies of governmentsnot meeting obligations or not participating in a treaty or intergovernmentalorganization.
An example of this process at work involves the International Tropical TimberOrganization (ITTO). This organization was created in 1983 by 63 nations thatconsume and produce tropical timber (Keck and Sikkink 1998). It focuses onencouraging the timber trade while improving forestry management. In 1990,Malaysia asked the ITTO to determine if logging was occurring at sustainable levelsin the Sarawak. The report revealed that logging was occurring at 8 to 10 timesbeyond a sustainable level and recommended reducing timber harvests by 1.5 millioncubic meters annually. Initially, Malaysia dismissed the findings of the report(Keck and Sikkink 1998). However, INGOs publicized the findings and organizedconsumer boycotts of timber from the Sarawak.
The ITTO also funds a range of conservation projects in member nations (Poore2003). At first, INGOs were the major participants in implementing funded projectsthrough the ITTO’s Civil Society Advisory Group (Poore 2003). There were very fewDNGOs involved. Today, however, hundreds of DNGOs participate in projectdesign, implementation, and evaluation (Poore 2003).
This discussion notes a number of different tactics that both INGOs andDNGOs use to reduce forest loss. Thus, world polity theory proposes that higherlevels of both types of organizations should be associated with lower rates ofdeforestation.
Considering Possible Interaction Effects
This hypothesis of an inverse relationship between INGOs and DNGOs and forestloss may be somewhat more complicated than presented. It may well be that the levelof democracy, interpreted as a nation’s political opportunity structure, influences theability of DNGOs and INGOs to deal with the causes of deforestation. As noted ear-lier, this is the key finding in a study by Lewis (2000). It has also been discussed byPayne (1995), Tarrow (1994), and Kitschelt (1986).
This point is fairly obvious in a repressive nation where INGOs and DNGOsare often tolerated only if they meet the approval of government officials (Bryantand Bailey 1997). Put differently, repressive nations tend to use their lawmakingpowers to ‘‘dull the sharp edge of nongovernmental organization criticism’’ (Clark1991, 179). Such policies involve overt repression including the outlawing ofstrikes, protests, and unions, arresting nongovernmental organization leaders,and, in extreme circumstances, executing these leaders (Peet 2003). A repressivegovernment may also use administrative repression where legal codes and bureau-cratic regulations are utilized to control ‘‘troublesome’’ groups (Wiktorowicz2002). This form of repression includes restricting the press, requiring membersof INGOs and DNGOs to register with the government, and requiring govern-ment approval to form an organization (Wiktorowicz 2002). Such control ofINGOs and DNGOs has been documented in Chile, China, Indonesia, Jordan,Nigeria, Zimbabwe, and Zambia (e.g., Wiktorowicz 2002; Bryant and Bailey1997; Hurst 1990).
This process may best be illustrated by returning to our example from Malaysia(Hurst 1990). The intervention by INGOs and DNGOs on behalf of the Penan ledPrime Minister Mahathir to order a crackdown on all protest activity in Malaysia
254 J. M. Shandra et al.
Dow
nloa
ded
by [
Uni
vers
ity o
f C
alif
orni
a, S
an F
ranc
isco
] at
15:
38 2
8 O
ctob
er 2
014
(Hurst 1990). The overt repression included outlawing protests and arrestingmembers of Sahabat Alam Malaysia and the World Rainforest Movement (Bryantand Bailey 1997). The government also implemented a number of laws to stifleINGO and DNGO criticism. The government required INGOs and DNGOs to gothrough a lengthy bureaucratic process to obtain government recognition. It alsorequired that these organizations submit annual reports to the government, whichmay or may not lead to renewal of their recognized status (Barbosa 2001).
Simultaneously, DNGOs had to obtain official approval from the Malaysiangovernment to initiate or maintain connections or affiliations with INGOs andensure that all members were Malaysian (Bryant and Bailey 1997). There was alsoan attempt by the government to limit freedom of speech and press. Barbosa(2001) describes how the Malaysian news agency was made the official domesticdistributor for all foreign agencies and the sole wire transmitter of news fromreporters in Malaysia to their news desks. If these guidelines were not followed byforeign reporters, then the government expelled them from the country (Barbosa2001).
Clearly, repressive governments may engage in practices and enact policies thathinder the ability of INGOs and DNGOs to deal with forest loss. However, democ-racy may enhance this ability. On the one hand, this may be the result of democraticgovernments providing citizens with ways to engage in public policy debates byguaranteeing freedom of speech, press, and assembly. Greater freedom of the pressand assembly leads to a wider diffusion of information, which, in turn, raises publicawareness regarding environmental issues (Payne 1995). On the other hand, it maybe due to democratic leaders being willing to tolerate political activism in order tomaintain legitimacy (Li and 2006). The responsiveness of public officials in demo-cratic nations is to some extent based upon the need to be reelected. The officialswho fail to address the concerns of citizens or give the impression of concern facethe risk of losing a subsequent election.
Some illustrative case study evidence comes from Brazil. In 1986, Brazil passed alaw that required environmental impact assessments to be conducted for develop-ment projects, that assessments be written in publicly understandable languages,and that public hearings be held to review the results (Rich 1994). Such changesallowed more than 400 people to gather in the city of Acre on May 11, 1990. Thiswas the first public hearing ever held in the Amazon regarding a project that wouldresult in a substantial amount of deforestation. A group of cattle ranchers hadapplied for a license to convert 14,300 acres of forest to pasture. The NationalCouncil of Rubber Tappers, with the help of INGO officials, prepared a detailedrebuttal of the environmental assessment presented by the ranchers (Rich 1994).While the ranchers argued that the pasture expansion would bring more economicprogress to Acre, the activists countered that the project would lead to a substantialamount of forest loss and undermine the livelihoods of local people. After few days,the state environmental agency ruled against the cattle ranching proposal (Rich1994).
According to the previous discussion, political opportunity structure theory sug-gests that INGOs and DNGOs should decrease deforestation more in democraticthan repressive nations. Thus, our approach is to (1) incorporate the neglected roleof DNGOs in cross-national research and (2) test a political opportunity structurehypothesis by including interaction terms between democracy and the INGO andDNGO variables in our regression models.
Nongovernmental Organizations and Deforestation 255
Dow
nloa
ded
by [
Uni
vers
ity o
f C
alif
orni
a, S
an F
ranc
isco
] at
15:
38 2
8 O
ctob
er 2
014
Methods
For our analysis, we employ ordinary least-squares regression. The dependent vari-able is the deforestation rate from 1990 to 2005. We include a variety of independentvariables measured in 1990—see below for a description of these variables. To ensurethat we do not violate assumptions of ordinary least-squares regression, we calculatea variety of regression diagnostics. First, variance inflation factor scores do notexceed a value of 10, indicating no potential problems with multicollinearity (Yorket al. 2003). Second, there do not appear to be any problems with influential cases oroutliers based on an examination of Cook’s D and outlier statistics, respectively.Third, we present robust standard errors because Breusch–Pagan tests indicatepotential problems with heteroskedasticity.
Sample
We include all nations that are classified as low and middle income according to theWorld Bank (2003).1 We also do not include nations formed following the collapseof the Soviet Union because there were no data for them in 1990. This yields a sam-ple of 60 nations for which complete data are available. We restrict our sample tolow- and middle-income nations because we are interested in the effects of INGOsand DNGOs on the environments of these countries. We also test hypotheses fromdependency theory regarding the impact of structural adjustment lending on forests(see later discussion), and high-income nations do not receive structural adjustmentloans (Rich 1994).
Dependent Variable
Deforestation
The dependent variable for our analysis is the average annual percentage change innatural forest area from 1990 to 2005. Note that deforestation is signified by a posi-tive value for interpretation purposes. The data may be obtained from the Food andAgriculture Organization (FAO) of the United Nations (FAO 2005). We providedescriptive statistics and a bivariate correlation matrix in Table 1. All data comefrom the World Bank (2003) unless noted.
Independent Variables
International Nongovernmental Organizations
We include the number of INGOs working on environmental and animal rightsissues in a nation per capita for 1990. The data were collected by Smith and Wiest(2005). Smith and Wiest’s (2005) measure differs from other measures of INGOs(e.g., Schofer and Hironaka 2005; Frank 1999) because it excludes labor unions,institutes, and academic foundations.
This variable does have some limitations. It measures the number of INGOs percapita within a nation. This tells us nothing about the types or numbers of projectsbeing undertaken by these groups. It also does not detail the amount of money beingspent on conservation and environmental protection. While the latter types of datawould provide a more accurate test of the relationship between INGOs and forest
256 J. M. Shandra et al.
Dow
nloa
ded
by [
Uni
vers
ity o
f C
alif
orni
a, S
an F
ranc
isco
] at
15:
38 2
8 O
ctob
er 2
014

Table
1.Descriptivestatisticsandbivariate
correlationmatrix
(n¼60)
Mean
Standard
Deviation
(1)
(2)
(3)
(4)
(5)
(6)
(7)
(8)
(9)
(10)
(11)
(12)
(13)
(14)
(15)
(1)Deforestation,
1990–2005
.625
1.011
1.000
(2)International
NGOs,1990
.795
1.223
�.041
1.000
(3)Domestic
NGOs,1990
.514
.394
�.203
.344
1.000
(4)DebtService,
1990
2.821
.810
.190
.053
�.101
1.000
(5)Structural
Adjustment,
1990
2.388
.453
.206
.048
.099
.326
1.000
(6)Forestry
Exports,1990
.001
.001
.035
.189
.352
.181
.133
1.000
(7)Environmental
Ministry,1990
.416
.497
.056
.165
�.166
�.126
.011
�.256
1.000
(8)Dem
ocracy,
1990
�4.250
1.552
�.166
.376
�.155
.235
.216
.293
�.005
1.000
(9)Gross
Domestic
Product,1990
7.651
.796
�.325
.081
�.026
�.212
�.076
.032
.083
.584
1.000
(10)Economic
Growth
Rate,
1980–1990
2.080
4.709
.103
.187
�.146
.241
.021
.225
�.146
.174
�.060
1.000
(11)Service-Based
Economic
Activity,1990
3.794
.272
.068
.176
�.033
.033
.174
.166
.121
.475
.275
.253
1.000
(Continued
)
257
Dow
nloa
ded
by [
Uni
vers
ity o
f C
alif
orni
a, S
an F
ranc
isco
] at
15:
38 2
8 O
ctob
er 2
014

Table
1.Continued
Mean
Standard
Deviation
(1)
(2)
(3)
(4)
(5)
(6)
(7)
(8)
(9)
(10)
(11)
(12)
(13)
(14)
(15)
(12)Rural
Population
Growth,
1980–1990
1.047
1.467
.366
.183
�.057
.009
�.081
.130
.036
�.277
�.582
.218
�.042
1.000
(13)Urban
Population
Growth,
1980–1990
3.636
1.733
.250
�.040
�.158
.241
�.009
�.047
.088
�.317
�.607
.309
.098
.468
1.000
(14)NaturalForest
Stocks,1990
8.953
1.720
.165
.532
.348
�.175
�.156
�.130
.019
.130
.044
.135
�.026
.128
�.084
1.000
(15)Data
Quality,
1990
.416
.497
.156
�.054
�.047
�.241
�.152
�.224
.108
�.181
�.102
�.182
�.110
.095
.101
�.046
1.000
258
Dow
nloa
ded
by [
Uni
vers
ity o
f C
alif
orni
a, S
an F
ranc
isco
] at
15:
38 2
8 O
ctob
er 2
014
loss, they are not available at this time. From the preceding, world polity theoryhypothesizes that higher levels of INGOs per capita should be associated with lowerrates of deforestation.
Domestic Nongovernmental Organizations
We also include the total number of DNGOs working on environmental issues percapita for 1990. The data may be obtained from Trzyna (1996). They have been usedby Frank et al. (2007) as well as Bates and Rudel (2000). According to Trzyna (1996),a domestic nongovernmental organization has projects or operations in one nation.Note that we exclude any organization listed by Trzyna (1996) that the Union ofInternational Association’s Yearbook of International Associations (1990) classifiesas an INGO.
The limitations of the INGOs variable apply to this measure. Additionally,Trzyna’s (1996) data underestimate the total number of DNGOs within a nation.This is because DNGOs are often very small and therefore not registered with thegovernment or other international bodies (e.g., United Nations). Moreover, someDNGOs may try to ‘‘disguise’’ their efforts from the government to avoid inter-ference or harassment. Finally, note that the date of the DNGO measure is 1990.Many DNGOs came into existence after the Earth Summit in 1992 (Bryant andBailey 1997). This suggests that future research should examine a more recent timeperiod in order to capture the effects of these organizations. It is important to notethat although Trynza (1996) data do underestimate DNGOs, we use the third edi-tion, which should have improved measures over earlier volumes. We expect thathigher levels of DNGOs per capita should be associated with lower rates of forestloss.
Structural Adjustment
Proper models specification requires the inclusion of other independent variablehypothetically linked to deforestation. We discuss the operationalization drawn fromseveral additional theoretical perspectives. For a similarly specified model, seeShandra et al. (2008a).
To capture the effects of structural adjustment, pressure, and conditionalityrequired by the International Monetary Fund and World Bank, Walton and Ragin(1990) developed a conditionality index. This index is the sum of four variables,which includes (1) the number of debt renegotiations between a country and an inter-national financial body, (2) the number of debt restructurings experienced by anindebted nation, (3) the number of times a country utilized the InternationalMonetary Fund Extended Fund Facility, and (4) the total International MonetaryFund loans received by a country as a percentage of its allocated quota. The vari-ables were measured in 1990. The four components of the index are converted toz scores and summed. Dependency theory hypothesizes that structural adjustmentshould be associated with higher rates of deforestation because these loans requirepoor nations to increase exports of natural resources, liberalize trade in extractivesectors, and cut spending for environmental services, in return for the money—seeShandra et al. (2008a) for a complete discussion regarding dependency theory’spredictions regarding the effects of structural adjustment and debt service onforest loss.
Nongovernmental Organizations and Deforestation 259
Dow
nloa
ded
by [
Uni
vers
ity o
f C
alif
orni
a, S
an F
ranc
isco
] at
15:
38 2
8 O
ctob
er 2
014

Debt Service Ratio
It is also important to control for debt service as well as structural adjustment. Wealso include the average sum of principal and interest payments in foreign currency,goods, or services on long-term public and publicly guaranteed private debt withmaturity of one year or longer as a percentage of goods and services exports in1990. We log this variable to deal with its skewed distribution. According to depen-dency theory, higher levels of debt service should lead to higher rates of deforestationas poor nations boost exports of natural resources to generate foreign exchange topay their debts (Rich 1994).
Forestry Exports
We also include total forestry exports as a percentage of total exports for 1990. Theseexports include wood, lumber, cork, pulp, and paper. The forestry data may beobtained from the United Nations (2008) Commodity Trade Statistics Database.We hypothesize that higher levels of total forestry export should be associated withhigher rates of deforestation.
Environmental Ministry Presence
We include a dummy variable that measures whether or not a nation had an environ-mental ministry. Nations that established an environmental ministry by 1990 arecoded with a value of 1. All other nations are coded with a value of 0. The datamay be obtained from Frank (1999). We hypothesize that nations with an environ-mental ministry should tend to have lower rates of deforestation than nations with-out an environmental ministry because ministries implement conservation projectsand programs (Frank 1999).
Democracy
We use the average of the Freedom House (1997) political rights and civil libertiesscales to measure democracy. Political rights reflect the degree to which a nationis governed by democratically elected representatives and has fair, open, andinclusive elections. Civil liberties reflect whether within a nation there is freedomof press, freedom of assembly, general personal freedom, freedom of private organi-zations, and freedom of private property (Freedom House 1997). The variables havethe following coding: free (1–2), partially free (3–5), and not free (6–7). We multiplythe index by �1 to ease interpretation. According to Li and Reuveny (2006), higherlevels of democracy should be associated with lower rates of deforestation becausedemocratic nations have higher levels of political activism and greater freedom ofthe press and assembly, leading to a wider diffusion of information regardingenvironmental issues.
Gross Domestic Product
We include gross domestic product per capita for 1990 as a measure of economicdevelopment. We log this variable to correct for its skewed distribution. Burnset al. (2003) find higher levels of gross domestic product per capita are associated
260 J. M. Shandra et al.
Dow
nloa
ded
by [
Uni
vers
ity o
f C
alif
orni
a, S
an F
ranc
isco
] at
15:
38 2
8 O
ctob
er 2
014
with lower deforestation rates. They attribute this finding to wealthier nations beingable to ‘‘externalize’’ their environmental costs by importing natural resources frompoorer nations.
Economic Growth Rate
We also include the economic growth rate from 1980 to 1990. It is thought thathigher rates of economic growth should be correlated with higher rates of defores-tation. This is because there are large amounts of capital available for investmentin activities that accelerate forest loss during periods of economic expansion (Rudel1989).
Service-Based Economic Activity
It is also important to include a measure of domestic economy structure in cross-national research on forests (Ehrhardt-Martinez et al. 2002). Therefore, we includevalue added from services as a percentage of gross domestic product for 1990. Welog this variable to deal with its skewed distribution. We expect that this measureshould be associated with lower rates of deforestation because service-basedeconomic activities are presumed to put less pressure on forests than other typesof economic activity (e.g., agriculture).
Rural and Urban Population Growth Rates
As suggested by neo-Malthusian theory, York et al. (2003) argue that researchersshould examine not only overall growth rates per se, but also the impact of popu-lation growth in different contexts. Jorgenson and Burns (2007a) use such anapproach and find that higher rates of rural population growth are associated withhigher rates of deforestation while higher rates of urban population growth are asso-ciated with lower rates of forest loss. They argue that expanding urban centers createeconomic opportunities other than agricultural ones, which attract people to citiesand relieve pressure on forests. Therefore, we also include the average annual per-centage change in rural and urban population growth in our models.
Natural Forest Stocks
It is necessary to include a measure that controls for the potentially biasing effects ofrelative abundance or scarcity of forest resources (Rudel 1989). Therefore, we con-trol for natural forest area stocks in a nation for 1990. We log this variable to controlfor its skewed distribution. The data may be obtained from the FAO (2005).
Data Quality
We also take into account the data quality of the deforestation estimates. The datamay be obtained from the FAO (2005). We classify forestry statistics as being highlyreliable if they are based upon remote sensing survey or current national field sam-pling estimates. We classify forestry statistics as having low reliability if they arebased upon extrapolation from an outdated inventory or expert estimates. We ident-ify those nations in which forest cover measures are based upon remote sensing
Nongovernmental Organizations and Deforestation 261
Dow
nloa
ded
by [
Uni
vers
ity o
f C
alif
orni
a, S
an F
ranc
isco
] at
15:
38 2
8 O
ctob
er 2
014
surveys or current national field sampling estimates as being of high data quality(1¼ high data quality).
Results and Discussion
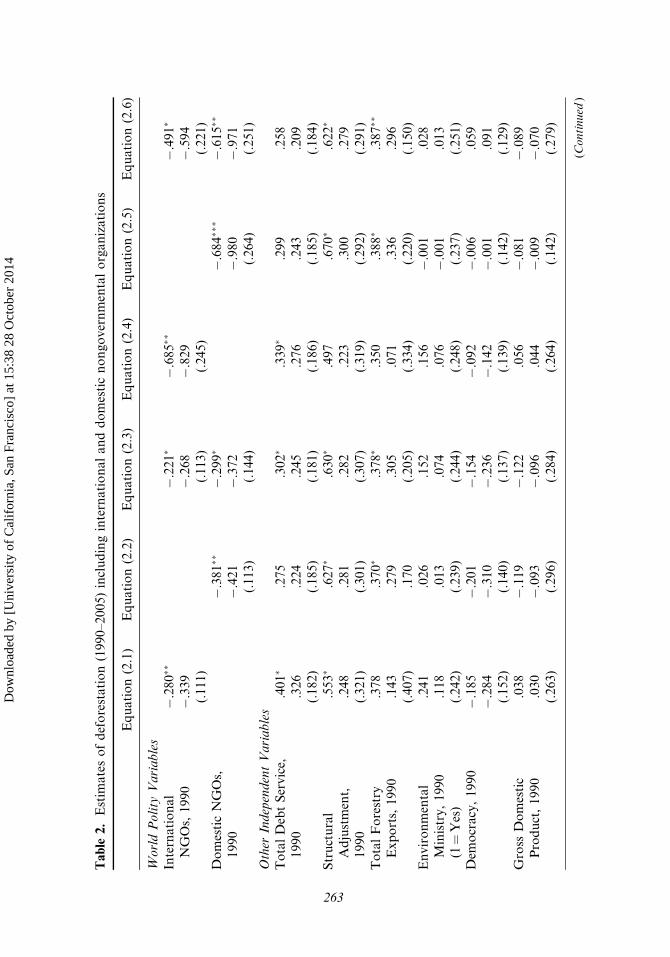
In Table 2, we present ordinary least-squares estimates of deforestation. In everyequation, we include debt service, structural adjustment, forestry exports, democ-racy, environmental ministry presence, gross domestic product, economic growth,service-based economic activity, rural population growth, urban populationgrowth, natural forest stocks, and data quality. We examine the additive effect ofINGOs on forest loss in Eq. (2.1). We consider the additive effect of DNGOs inEq. (2.2). In Eq. (2.3), we examine the additive effects of both INGOs and DNGOs.
We organize Eqs. (2.4) through (2.6) in a similar way. However, we includeinteraction terms between democracy and the INGO and DNGO measures to testthe political opportunity structure hypothesis that democracy enhances the abilityof these organizations to deal with deforestation. We construct the interaction termsby multiplying the democracy and INGO or DNGO variables together. We then cal-culate the effects of INGOs and DNGOs in democratic nations (i.e., democracyvariable¼�1) to facilitate interpretation of the findings (Jaccard and Turrisi 2001).
Let us begin by discussing the findings pertaining to the INGO and DNGOvariables. First, we find substantial support for world polity theory that higher levelsof INGOs and DNGOs per capita are associated with lower rates of forest loss.Specifically, the coefficient for the INGOs variable is negative and significantin Eq. (2.1). The coefficient for the DNGO variable is negative and significant inEq. (2.2). The findings remain stable when examining these variables together inthe same model. In Eq. (2.3), the coefficients for INGO and DNGO variablesremain negative and statistically significant.
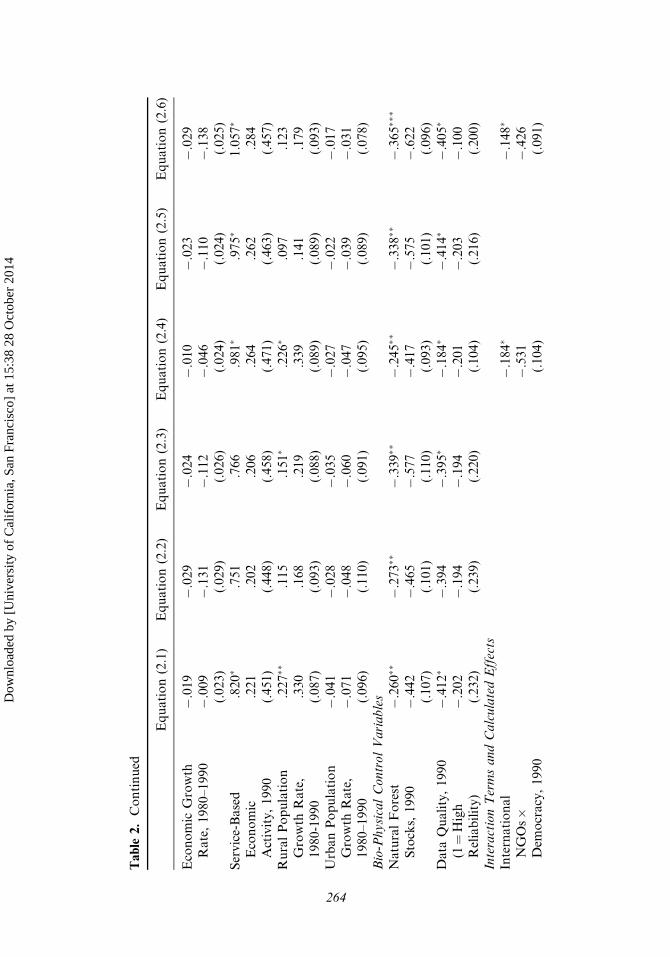
However, we noted earlier that the ability of these groups to implement projectsto deal with the causes of forest loss may be enhanced in democratic nations. We testthis political opportunity structure hypothesis in the remaining equations of Table 2.In Eq. (2.4), we find that INGOs tend to decrease deforestation more in democraticnations. The coefficient for the interaction term between democracy and INGOs isstatistically significant. Further, the effect of INGOs on forest loss in democraticnations is equal to �.501. A similar pattern of results emerges in Eq. (2.5) forDNGOs. The coefficient for the interaction term between democracy and DNGOsis statistically significant in Eq. (2.5), and the calculated effect of DNGOs on defor-estation in democratic nations is equal to �.512. In Eq. (2.6), we include both inter-action terms together in the model. In doing so, the findings remain similar to theresults presented in the previous two equations.2
A number of other factors also help to explain forest loss. First, we find supportfor dependency theory regarding the harmful effects of debt and structural adjust-ment. The coefficients for the structural adjustment variable are positive and signifi-cant in five of six equations in Table 2. The coefficients for the debt service measureare positive and significant in Eqs. (2.1), (2.3), and (2.4). It is mostly likely the casethat debt and structural adjustment tend to increase deforestation by boostingexports of forestry products while cutting environmental spending by governments.Toward this end, the coefficients for the forestry export variable are positive andsignificant in four of six equations. The coefficients for the environmentalministry variable are not statistically significant. Second, we also find support for
262 J. M. Shandra et al.
Dow
nloa
ded
by [
Uni
vers
ity o
f C
alif
orni
a, S
an F
ranc
isco
] at
15:
38 2
8 O
ctob
er 2
014
Table
2.Estim
atesofdeforestation(1990–2005)includinginternationalanddomesticnongovernmen
talorganizations
Equation(2.1)
Equation(2.2)
Equation(2.3)
Equation(2.4)
Equation(2.5)
Equation(2.6)
WorldPolity
Variables
International
NGOs,1990
�.280��
�.221�
�.685��
�.491�
�.339
(.111)
�.268
(.113)
�.829
(.245)
�.594
(.221)
DomesticNGOs,
1990
�.381��
�.299�
�.684��
��.615��
�.421
(.113)
�.372
(.144)
�.980
(.264)
�.971
(.251)
Other
IndependentVariables
TotalDebtService,
1990
.401�
.275
.302�
.339�
.299
.258
.326
(.182)
.224
(.185)
.245
(.181)
.276
(.186)
.243
(.185)
.209
(.184)
Structural
Adjustment,
1990
.553�
.627�
.630�
.497
.670�
.622�
.248
(.321)
.281
(.301)
.282
(.307)
.223
(.319)
.300
(.292)
.279
(.291)
TotalForestry
Exports,1990
.378
.370�
.378�
.350
.388�
.387��
.143
(.407)
.279
.170
.305
(.205)
.071
(.334)
.336
(.220)
.296
(.150)
Environmental
Ministry,1990
(1¼Yes)
.241
.026
.152
.156
�.001
.028
.118
(.242)
.013
(.239)
.074
(.244)
.076
(.248)
�.001
(.237)
.013
(.251)
Dem
ocracy,1990
�.185
�.201
�.154
�.092
�.006
.059
�.284
(.152)
�.310
(.140)
�.236
(.137)
�.142
(.139)
�.001
(.142)
.091
(.129)
Gross
Domestic
Product,1990
.038
�.119
�.122
.056
�.081
�.089
.030
(.263)
�.093
(.296)
�.096
(.284)
.044
(.264)
�.009
(.142)
�.070
(.279)
(Continued
)
263
Dow
nloa
ded
by [
Uni
vers
ity o
f C
alif
orni
a, S
an F
ranc
isco
] at
15:
38 2
8 O
ctob
er 2
014
Table
2.Continued
Equation(2.1)
Equation(2.2)
Equation(2.3)
Equation(2.4)
Equation(2.5)
Equation(2.6)
Economic
Growth
Rate,1980–1990
�.019
�.029
�.024
�.010
�.023
�.029
�.009
(.023)
�.131
(.029)
�.112
(.026)
�.046
(.024)
�.110
(.024)
�.138
(.025)
Service-Based
Economic
Activity,1990
.820�
.751
.766
.981�
.975�
1.057�
.221
(.451)
.202
(.448)
.206
(.458)
.264
(.471)
.262
(.463)
.284
(.457)
RuralPopulation
Growth
Rate,
1980-1990
.227��
.115
.151�
.226�
.097
.123
.330
(.087)
.168
(.093)
.219
(.088)
.339
(.089)
.141
(.089)
.179
(.093)
UrbanPopulation
Growth
Rate,
1980–1990
�.041
�.028
�.035
�.027
�.022
�.017
�.071
(.096)
�.048
(.110)
�.060
(.091)
�.047
(.095)
�.039
(.089)
�.031
(.078)
Bio-PhysicalControlVariables
NaturalForest
Stocks,1990
�.260��
�.273��
�.339��
�.245��
�.338��
�.365��
�
�.442
(.107)
�.465
(.101)
�.577
(.110)
�.417
(.093)
�.575
(.101)
�.622
(.096)
Data
Quality,1990
(1¼High
Reliability)
�.412�
�.394
�.395�
�.184�
�.414�
�.405�
�.202
(.232)
�.194
(.239)
�.194
(.220)
�.201
(.104)
�.203
(.216)
�.100
(.200)
InteractionTermsandCalculatedEffects
International
NGOs�
Dem
ocracy,1990
�.184�
�.148�
�.531
(.104)
�.426
(.091)
264
Dow
nloa
ded
by [
Uni
vers
ity o
f C
alif
orni
a, S
an F
ranc
isco
] at
15:
38 2
8 O
ctob
er 2
014

DomesticNGOs�
Dem
ocracy,1990
�.172��
��.157�
�.863
(.041)
�.652
(.078)
Effectof
International
NGOsin
Dem
ocratic
Nations
�.501
�.343
EffectofDomestic
NGOsin
Dem
ocratic
Nations
�.512
�.494
Constant
�3.922
(3.663)
�1.788
(3.662)
�1.079
(3.617)
�4.338
(3.571)
�1.646
(3.590)
�1.195
(3.473)
R-Square
.399
.426
.472
.432
.526
.562
Breusch-Pagan
Heteroskedasti-
city
Test
8.851��
4.795�
6.000��
4.463�
5.190��
7.280��
Number
ofCases
60
60
60
60
60
60
HighestVariance
InflationFactor
Score
3.581
3.800
3.800
5.365
5.061
6.250
MeanVariance
InflationFactor
Score
1.890
1.932
1.996
2.991
2.990
3.153
Note.Thefirstnumber
reported
istheunstandardized
coefficient,thesecondnumber
isthestandardized
coefficient,andthethirdnumber
inparenth-
eses
istherobuststandard
error.A
statisticallysignificantBreusch-Pagantestindicatesthepresence
ofheteroskedasticityin
themodel.Thus,wepresent
robust
standard
errors
todealwiththeproblem.
� p<.05,��p<.01,��
� p<.001foraone-tailed
test.
265
Dow
nloa
ded
by [
Uni
vers
ity o
f C
alif
orni
a, S
an F
ranc
isco
] at
15:
38 2
8 O
ctob
er 2
014
neo-Malthusian theory regarding the detrimental impact of demographic factors onforest loss. The coefficients for rural population growth are positive in all six equa-tions and significant in three equations of Table 2. This indicates that higher rates ofrural population growth correspond with higher rates of deforestation.3 Third, wefind that higher levels of service-based economic activity is associated with higherrates of forest loss. The coefficients for this variable are positive and significant infour of six equations. This finding contradicts our expected hypothesis thatservice-based economic activities are presumed to put less pressure on forests thanother types of economic activity (e.g., agriculture). However, it may be the case thatpoor nations with more service-based economies are experiencing a growth inresource consumption, especially of forestry-related products such as paper andwood (Jorgenson and Burns 2007b). Fourth, we find that it is important to includebiophysical control variables. The coefficients for the forest stock variable are nega-tive and significant in every equation. The data quality coefficients are negative andsignificant in five of six equations, indicating that forest loss estimates based uponremote sensing tend to indicate a lower rate of forest loss. This finding is most likelythe case because remote sensing lead to more accurate definition of forest boundariesand the clearing go on in these areas than other methods (e.g., expert estimates oroutdated national field samples).
There are a number of nonsignificant findings that also deserve to be mentioned.First, we do not find support for the idea that economic growth tends to increasedeforestation. This variable fails to explain any significant variation in the dependentvariable.4 Second, we do not find that economic development is significantly relatedto deforestation. The coefficients for gross domestic product per capita do not reacha level of statistical significant. Third, we do not find that nations with higher levelsof urban population growth tend to have lower rates of deforestation. The coeffi-cients are not statistically significant in any equation of Table 2.5
Conclusion
This study extends cross-national research on the natural environment in a couple ofnovel ways. First, we note there has been a substantial amount of scholarly work,especially in the world polity tradition, directed toward the role that INGOs playin environmental affairs (e.g., Frank et al. 2000; Frank 1999). However, there hasbeen relatively little attention given to the impact of DNGOs. We address this gapin the cross-national literature and find that higher levels of both types of organiza-tions are associated with lower rates of deforestation. We extend this line of inquiryto test a political opportunity structure hypothesis that governments moderate theability of INGOs and DNGOs to deal with forest loss (Lewis 2000). We do so byincluding interaction terms between democracy and the INGO and DNGO variablesand find that both INGOs and DNGOs decrease deforestation more in democraticnations.
There are some theoretical and methodological implications that follow fromthese findings. The results are reminiscent of findings from Shandra et al. (2008b)study. These authors find that higher levels of both environmental and women’sINGOs are associated with lower rates of forest loss and conclude that it is importantto consider different ‘‘types’’ of INGOs in cross-national research. We extend this lineof reasoning here but in a slightly different way. We argue that it is necessary toexamine the impact of not only INGOs but also DNGOs in cross-national research.
266 J. M. Shandra et al.
Dow
nloa
ded
by [
Uni
vers
ity o
f C
alif
orni
a, S
an F
ranc
isco
] at
15:
38 2
8 O
ctob
er 2
014
Some policy implications follow from our main findings regarding INGOs,DNGOs, structural adjustment, debt service, and democracy. First, it may serveINGOs and DNGOs well to lobby the leaders of multilateral financial institutionsto eliminate or change structural adjustment lending practices. However, changesto lending policies may be more likely to occur by focusing their attention on thelawmakers in the rich nations of the world that fund these financial institutions.
This was the approach taken by the National Wildlife Federation and Environ-mental Policy Institute against the World Bank to stop financing of a massiveresettlement and rural development project in the Brazilian Amazon during the1980s (Bryant and Bailey 1997). While protests directed by these groups at the WorldBank achieved little, a well-publicized media campaign in the United States Congressforced the World Bank to stop remaining loan disbursements ‘‘pending thepreparation and carrying out of emergency environmental and Indian lands protec-tion measures by the Brazilian government’’ (Rich 1994, 126). This media campaigninvolved working with Brazilian nongovernmental organization to document howforest loss was affecting local people and then publicizing the findings in the media.The Environmental Policy Institute and National Wildlife Federation also broughtthose affected by the deforestation to tell their stories before Congress (Barbosa2001). Such a partnership between INGOs and DNGOs to reduce forest loss is whatKeck and Sikkink (1998) refer to as a ‘‘boomerang effect.’’
Further, because we find that democracy enhances the ability of INGOs andDNGOs to reduce forest loss, they should also push for democratic reforms in thenations in which they operate (Rich 1994). This may include lobbying governmentsto pass legal frameworks that legitimize the formation of DNGOs, labor unions, andsocial movements. There should also be a push to ensure that participation of thesegroups in carrying out environmental impact assessments along with accessibility tosuch assessments. INGOs and DNGOs should also lobby governments to ensure thefreedom of speech, press, and assembly to all their citizens. In doing so, Annis (1987)argues that a ‘‘virtuous circle’’ will emerge that strengthens the ability of INGOs,DNGOs, and governments together to deal with environmental problems.
We conclude with some directions for future research. First, this study demon-strates INGOs and DNGOs are associated with lower rates of forest loss. This pat-tern of findings may also be observed in cross-national studies of carbon dioxideemissions, biodiversity loss, and water pollution. Second, Lewis (2000) argues thatINGOs often seek out nations with high levels of DNGOs in which to work. There-fore, it may also prove fruitful to examine if high levels of DNGOs enhance the effec-tiveness of INGOs to deal with forest loss. Third, we use cross-national data over aspan of 15 years (i.e., 1990–2005) to examine how various political–economic factorsimpact forests. Unfortunately, comparable data on deforestation are limited to thistime period due to changes in data collection methodologies (FAO 2005). Thus, it isimperative that cross-national research be supplemented with historical-comparativeanalyses in order to understand fully the causes of deforestation over longer periodsof time (Rudel 2005).
Notes
1. The following 60 nations are included: Albania, Algeria, Angola, Argentina, Bangladesh,Benin, Bolivia, Brazil, Bulgaria, Burkina Faso, Central African Republic, Chad, Chile,China, Colombia, Congo, Costa Rica, Cote D’Ivoire, Ecuador, El Salvador, Gabon,
Nongovernmental Organizations and Deforestation 267
Dow
nloa
ded
by [
Uni
vers
ity o
f C
alif
orni
a, S
an F
ranc
isco
] at
15:
38 2
8 O
ctob
er 2
014

Gambia, Ghana, Guatemala, Guinea, Guinea Bissau, Honduras, Hungary, India, Iran,Jamaica, Kenya, Madagascar, Malawi, Malaysia, Mauritius, Mexico, Mongolia,Mozambique, Nepal, Nicaragua, Niger, Pakistan, Panama, Papua New Guinea, Paraguay,Peru, Philippines, Poland, Romania, Senegal, South Africa, Sri Lanka, Sudan, Tanzania,Thailand, Turkey, Uganda, Zambia, and Zimbabwe.
2. We reran the models using the numbers of INGOs and DNGOs in a country. The findingsare similar to the results presented.
3. We also examined the effect of total population growth from 1980 to 1990 on deforestation.The coefficients for this variable are not statistically significant.
4. We also examine the effect of economic growth from 1990–2005 on forest loss to determineif this variable has a more immediate impact. The coefficients for this variable are notstatistically significant.
5. We include a set of dummy variables for the region in which a nation is located. Thecoefficients are not statistically significant.
References
Annis, S. 1987. The next World Bank: Financing development from the bottom up. GrassrootsDev. 11:24–29.
Barbosa, L. C. 2001. The Brazilian Amazon rainforest: Global ecopolitics, development, anddemocracy. New York: University of American Press.
Bates, D. C., and T. K. Rudel. 2000. The political ecology of conserving tropical rain forests:A cross-national analysis. Society Nat. Resources 13:619–634.
Bryant, R. L., and S. Bailey. 1997. Third world political ecology. London: Routledge.Burns, T. J., E. L. Kick, and B. L. Davis. 2003. Theorizing and rethinking linkages between
the natural environment and the modern world system: Deforestation in the late 20thcentury. J. World-Systems Res. 9:357–390.
Chapin, M. 2004. A challenge to conservationists. World Watch Mag. 1:17–34.Clark, J. 1991. Democratizing development: The role of voluntary organizations. London:
Earthscan Press.Ehrhardt-Martinez, K., E. M. Crenshaw, and J. C. Jenkins. 2002. Deforestation and the
environmental Kuznets curve: A cross-national investigation of intervening mechanisms.Social Sci. Q. 83:226–43.
Food and Agriculture Organization of the United Nations. 2005. Global forest resourcesassessment 2005: Progress towards sustainable forest management. Food and AgricultureOrganization Forestry Paper 147. Rome: United Nations.
Frank, D. J., W. Longhofer, and E. Schofer. 2007. World society, non-governmentalorganizations, and policy reform in Asia. Int J. Compar. Sociol. 48:275–295.
Frank, D. J., A. Hironaka, and E. Schofer. 2000. The nation-state and the natural environ-ment over the twentieth century. Am. Sociol. Rev. 65:96–116.
Frank, D. J. 1999. The social bases of environmental treaty ratification. Sociol. Inquiry69:523–550.
Freedom House. 1997. Freedom in the world: 1996–1997. New York: Freedom House.Hironaka, A. 2002. The globalization of environmental protection: The case of environmental
impact assessments. Int. J. Compar. Sociol. 43:65–78.Hurst, P. 1990. Rainforest politics. London: Zed Books.Jaccard, J., and R. Turrisi. 2001. Interaction effects in multiple regression. Thousand Oaks,
CA: Sage.Jorgenson, A. K., and T. J. Burns. 2007a. Effects of rural and urban populations and national
development on deforestation in less developed countries, 1990–2000. Sociol. Inq.77:460–482.
Jorgenson, A. K., and T. J. Burns. 2007b. The political-economic causes of change in theecological footprints of nations 1991–2001: A quantitative investigation. Social Sci.Res. 36:834–853.
268 J. M. Shandra et al.
Dow
nloa
ded
by [
Uni
vers
ity o
f C
alif
orni
a, S
an F
ranc
isco
] at
15:
38 2
8 O
ctob
er 2
014

Keck, M., and K. Sikkink. 1998. Activists beyond borders. Ithaca, NY: Cornell UniversityPress.
Kitschelt, H. 1986. Political opportunity structures and political protest: Anti-nuclearmovements in four democracies. Br. J. Polit. Sci. 16:57–85.
Lewis, T. L. 2000. Transnational conservation movement organizations: Shaping the pro-tected area systems of less developed nations. Mobilization 5:105–123.
Li, Q., and R. Reuveny. 2006. Democracy and environmental degradation. Int. Stud. Q.50:935–956.
Ndegwa, S. 1996. The two faces of civil society: Non-governmental organizations and politics inAfrica. New York: Kumarian Press.
Newell, P. 2000. Environmental NGOs and globalization: The governance of TNCs. In Globalsocial movements, ed. R. Cohen and S. M. Rai, 117–133. London: Athlone Press.
Payne, R. A. 1995. Freedom and the environment. J. Democracy 6:41–55.Peet, R. 2003. The unholy trinity: The International Monetary Fund, World Bank, and World
Trade Organization. London: Zed Books.Poore, D. 2003. Changing landscapes: The development of the International Tropical Timber
Organization and its influence on tropical forest management. London: Earthscan.Princen, T. 1994. Non-governmental organizations: Creating a niche in environment diplo-
macy. In Environmental NGOs in world politics: Linking the local and the global, ed.T. Princen and M. Finger, 138–167. New York: Routledge.
Rich, B. A. 1994. Mortgaging the earth: The World Bank, environmental impoverishment, andthe crisis of development. Boston: Beacon Press.
Rudel, T. K. 2005. Tropical forests: Regional paths of destruction and regeneration in the latetwentieth century. New York: Columbia University Press.
Rudel, T. 1989. Population, development, and tropical deforestation: A cross-national study.Rural Sociol. 54:327–38.
Schofer, E., and A. Hironaka. 2005. The effects of world society on environmental outcomes.Social Forces 84:25–47.
Shandra, J. M., E. Shor, G. Maynard, and B. London. 2008a. Debt, structural adjustment,and deforestation: A cross-national analysis. J. World-Systems Res. 14:1–21.
Shandra, J. M., C. L. Shandra, and B. London. 2008b. Women, non-governmental organiza-tions, and deforestation: A cross-national study. Population Environ. 38:48–72.
Shandra, J. M. 2007. The world polity and deforestation: A cross-national analysis.International J. Compar. Sociol. 48:5–28.
Smith, J., and D. Wiest. 2005. The uneven geography of global civil society: National andglobal influences on transnational association. Social Forces 84:632–652.
Tarrow, S. 1994. Power in movement: Social movements, collective action and politics.Cambridge, UK: Cambridge University Press.
Trzyna, T. 1996. World directory of environmental organizations. Claremont, CA: PublicAffairs Clearinghouse for the Sierra Club.
Union of International Associations. 1990. Yearbook of international organizations.New York: K. G. Saur.
United Nations. 2008. United Nations commodity trade database. http://comtrade.un.org/db/(accessed 15 October 2008).
Walton, J., and C. Ragin. 1990. Global and national sources of political protest: Third Worldresponses to the debt crisis. Am. Sociol. Rev. 55:875–90.
Wiktorowicz, Q. 2002. The political limits to non-governmental organizations in Jordan.World Dev. 30:77–93.
World Bank. 2003. World development indicators. World Bank: Washington, DC: Compactdisk.
York, R., E. A. Rosa, and T. Dietz. 2003. Footprints on the earth: The environmentalconsequences of modernity. Am. Sociol. Rev. 68:279–300.
Nongovernmental Organizations and Deforestation 269
Dow
nloa
ded
by [
Uni
vers
ity o
f C
alif
orni
a, S
an F
ranc
isco
] at
15:
38 2
8 O
ctob
er 2
014