nomar international public market - wichita.gov documents/nomar... · nomar international public...
TRANSCRIPT
NOMAR INTERNATIONAL PUBLIC MARKET FEASIBILITY STUDY September 27, 2007

NOMAR INTERNATIONAL PUBLIC MARKET FEASIBILITY STUDY
Nomar International Public MarketFeasibility StudySeptember 27, 2007
For: West 21st Street Community Development Corporation 358 North Main Street Wichita, Kansas 67202 Joey DeLeon, Board President [email protected] 263-5756 ext. 4707
Funded by: Wichita-Sedgwick County Metropolitan Area Planning Department City Hall – 10th Floor 455 North Main Wichita, Kansas 67202 David Barber AICP, Advanced Plans Manager – Advanced Plans Division [email protected] 316-268-4490
Architect: Law/Kingdon, Inc. 345 Riverview, Suite 200 Wichita, Kansas 67203 316.268.0230 Tony Rangel, AIA [email protected] 316-268-0230 ext. 494
Market Analysis: Economics Research Associates (ERA) 388 Market Street, Suite 1580 San Francisco, California 94111 Sujata Srivastava [email protected] 415-956-8152 ext. 220

NOMAR INTERNATIONAL PUBLIC MARKET FEASIBILITY STUDY
Table of Contents
I. Executive Summary..................................................................................................................1-26 Introduction Project Description Summary of Market Analysis Preferred Concept Design 1B-2 Financial Pro Forma for Concept 1B-2 Implementation Steps - Timeline
II. Site Analysis.............................................................................................................................27-31 Analysis Site Selection Opportunities/Limitations District Land Use Study
III. Market Analysis.......................................................................................................................32-45 Market Demographics Retail Demand Forecast Supportable Retail Development Recommended Tenanting Strategy Interviews with Stakeholders and Vendors Opportunities / Challenges
IV. Public Markets Case Studies..................................................................................................46-67
V. Concepts: Design and Financial Feasibility..........................................................................68-100
VI. Appendix - Site & Building Material Palette..........................................................................101-102

NOMAR INTERNATIONAL PUBLIC MARKET EXECUTIVE SUMMARY
4
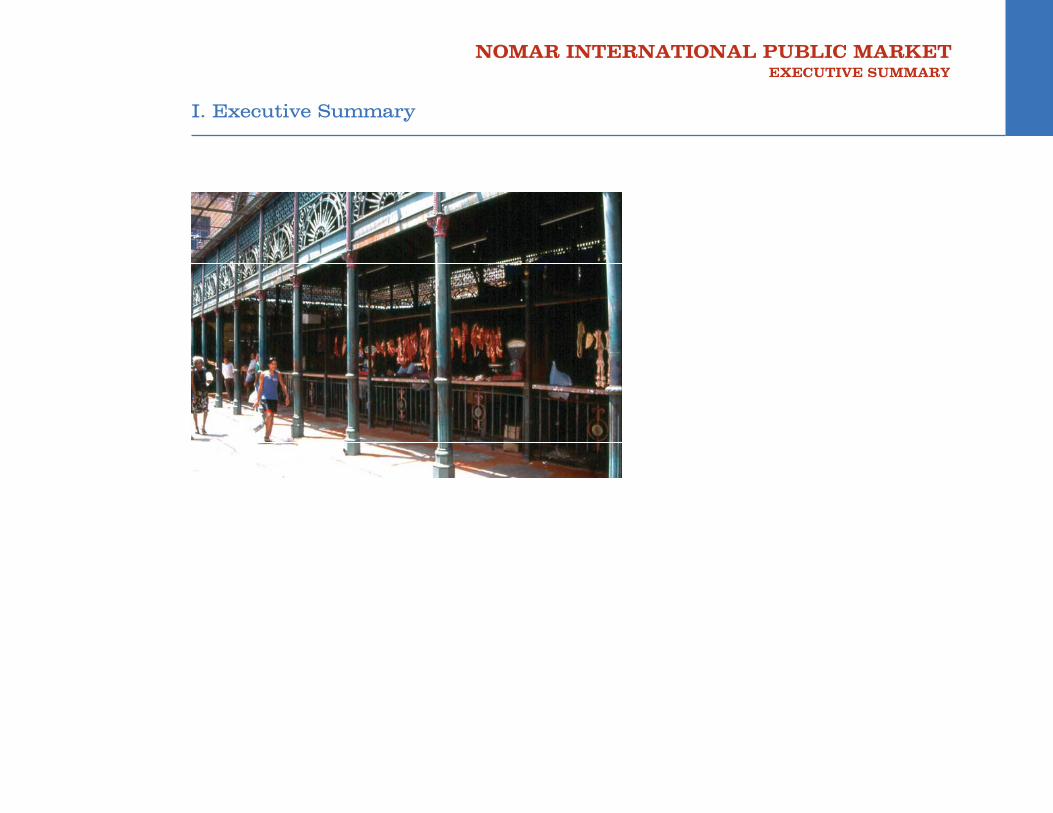
I. Executive Summary
NOMAR INTERNATIONAL PUBLIC MARKET EXECUTIVE SUMMARY
1
Introduction
The Nomar International Public Market will be an indoor-outdoor market facil-ity located at the heart of the Nomar District at West 21st Street and Market Street. The goals of the Nomar Interna-tional Public Market are:
• To create a unique dining, shopping, and entertainment venue in Wichita while respecting the traditions, his- tory, and cultures of the area.
• To revitalize the Nomar District and surrounding neighborhoods by at- tracting regional residents and visi- tors to the area.
• To provide new economic develop- ment opportunities for Hispanic/La- tino, Asian, and other entrepreneurs.
Earlier in 2007, the Greteman Group fi nalized a marketing and branding study for the Nomar International Dis-trict, which is characterized by historical buildings such as the Nomar Theater, as well as cultural and ethnic diversity. In addition, the City of Wichita has devel-oped a Master Plan for the area, which includes plans for streetscape improve-ments on West 21st Street and
an improved intersection at West 21st Street and Broadway, which will require realignment of Broadway.
The block on the northeast corner of West 21st Street and Market Street, containing a City-owned parking lot, is one potential lo-cation for the Nomar International Market. A second potential location is the exist-ing Disabled American Veterans building, which would require renovation.
In this report, ERA evaluated the project’s ability to be economically self-sustaining. This feasibility study examines consumer demand for the facility, and projects oper-ating costs and revenues for the market under three scenarios, using the concept designs developed by Law/Kingdon for each site. The results of this study will help guide the West 21st Street CDC and the City of Wichita in the development, operations, and management of the pro-posed Nomar International Public Market.
Project Description
The Nomar International Public Market will contain three main components: 1) an indoor market hall building featuring local vendors selling fi ne art, handicrafts,
baked goods, prepared foods, ethnic specialty items, and other products; 2) an outdoor regional farmers market emphasizing locally grown, specialty, and organic products; and 3) performing artists and festivals utilizing the public plaza spaces around the market.The market will draw from primarily four customer segments: Latino residents in the Wichita area; Asian residents in the Wichita area; regional customers look-ing for a unique shopping and dining experience; and visitors to the region. The following are some of the key operating characteristics of the Nomar International Public Market: • The market will include an indoor market hall as well as some out door plazas to accommodate stalls for a farmers market. • Indoor/outdoor plazas providing op- portunity for performances and events • The market hall facility will be open all year-round, six days a week. The farmers market will operate twice a week but will be closed dur- ing winter months. • The CDC, a tax-exempt non-profi t organization, will be in charge of management and operations once the building is completed.
NOMAR INTERNATIONAL PUBLIC MARKET EXECUTIVE SUMMARY
2
• The market will give preference to vendors that provide unique prod- ucts not offered elsewhere in Wichita. • The City will retain ownership of the land and the building, but will lease the facility to the CDC at a nominal rate. • The majority of vendors at the mar- ket will be “start-up” businesses with little capital of their own. • Indoor tenants in the market hall building will be generally on multi- year leases. Outdoor farmers mar- ket tenants will rent stalls by the day.
Summary of Market Analysis
Introduction and Methodology
In order to understand the potential for the Nomar International Market, ERA estimated potential consumer demand for new retail development in the Nomar District. ERA collected demographic data for the relevant market areas, and also analyzed the tourism and visitor trends to Wichita. ERA also analyzed taxable retail sales trends and per cap-ita spending patterns. Based on these factors, ERA calculated total demand generated by each of the major source
markets, and calculated the amount of new supportable retail development currently and over the next fi ve year period.It is important to note that the demand estimate includes the entire Nomar District area, and is not exclusive to the Nomar International Market. The Nomar Inter-national Market may have the potential to capture a signifi cant share of the future retail demand, depending on the site and location, vendor demand, design, access, and other factors.
The Nomar District has historically at-tracted a diverse mix of residents and businesses. In recent years, it has devel-oped into a center for the Hispanic com-munity, serving fi rst-generation immigrants as well as more well-established Hispanic residents throughout the Wichita metro-politan area. The businesses in the core of the Nomar District largely refl ect this, with a proliferation of stores selling ap-parel, music, food, groceries, and services targeting the Hispanic market. In addition, an increasing amount of Asian businesses have begun to locate in the area, including restaurants and grocery stores. Because of the importance and the fast growth of the Asian and Hispanic market segments in the Nomar District, as well as the inter-national concept for the market, ERA has considered them as the primary source
markets for new retail development in the area.
One of the objectives of the Nomar Dis-trict plan is to attract Wichita residents to the area. The surveys conducted by the Greteman Group indicated inter-est on the part of city residents to visit the district for food or shopping, if the right retail experience were provided. Therefore, ERA also evaluated market demand from all non-Hispanic and non-Asian residents within a 15-mile radius of the Nomar District.
With the idea that the Nomar District may eventually develop into a visitor attraction, ERA also considered demand generated by visitors to the Wichita region, including business/convention visitors and leisure travelers.
ERA estimated current retail spending and forecast future retail spending for all of the market segments: the Hispanic market, the Asian market, the secondary market, and the tourist market. Current demand estimates were based on 2006 population estimates and per-capita spending. Forecasts of incremental demand from 2006 to 2013 were based on population estimates and per-capita spending rates by retail sector, adjusting
NOMAR INTERNATIONAL PUBLIC MARKET EXECUTIVE SUMMARY
3
or income growth. ERA then calculated total current supportable space in the Nomar District based on projected retail sales capture for current and future de-mand, and the estimated sales volume per square foot per year by retail sector.
Estimate of Retail Demand
According to our analysis, the current demand for retail space in the Nomar District generated by the market seg-ments analyzed above totals 158,000 square feet. From 2007 to 2013, ERA estimates that the Nomar District could support an additional 56,000 square feet of retail from demand growth in these segments for a total of 214,000 square feet.
The majority of the current and future retail demand is for the following store categories:
• Food services and drinking places (32 percent of total retail space) • Food and beverage stores (17 percent of total retail space) • Clothing and accessories (14 percent)
A substantial amount of the retail space,
about 42 percent, would be geared to- wards the Hispanic market in the Wichita metropolitan area. Asian residents ac-count for 16 percent of the demand. The secondary market will compose about 29 percent of the retail demand. Finally the visitor market is the smallest source of demand, accounting for 13 percent of the space.
The market demand for retail in the Nomar District would support the development of over 200,000 square feet in the next fi ve years. The amount of this demand that is captured within the International Mar-ket facility depends on a variety of factors including: the site characteristics such as size, location, and access; vendor demand for stall space; the amount of parking that can be accommodated; the surrounding land uses and densities; and other factors.
It is ERA’s opinion that in order to have a catalyzing effect, the new retail additions in the Nomar District should be sized at a scale large enough to have a signifi cant impact on the community and draw from the larger resident and visitor markets. It is unclear whether the Nomar International Market alone will be large enough to revi-talize the area. There may be a need to incentivize other types of private retail
development near and around the mar-ket in order to have enough of a “critical mass.”
Recommended Tenanting Strategy
Nomar International Market’s share of the future retail demand depends on various factors, including:
• Site characteristics • Design, visibility and access • Vendor demand • Merchandise mix • Availability of parking on-site
Based on ERA’s experience with other similar public markets, we recommend that the Nomar International Market be sized at approximately 25,000 to 30,000 square feet (in gross leasable area) in order to be at a scale large enough to attract some portion of the regional mar-ket demand rather than serving simply as a neighborhood/convenience retail center. ERA has found that in many cases, smaller markets have trouble generating suffi cient revenues to cover fi xed operating costs (such as person-nel and utilities) and have limited poten-tial to attract customers from outside the immediate area.
NOMAR INTERNATIONAL PUBLIC MARKET EXECUTIVE SUMMARY
4
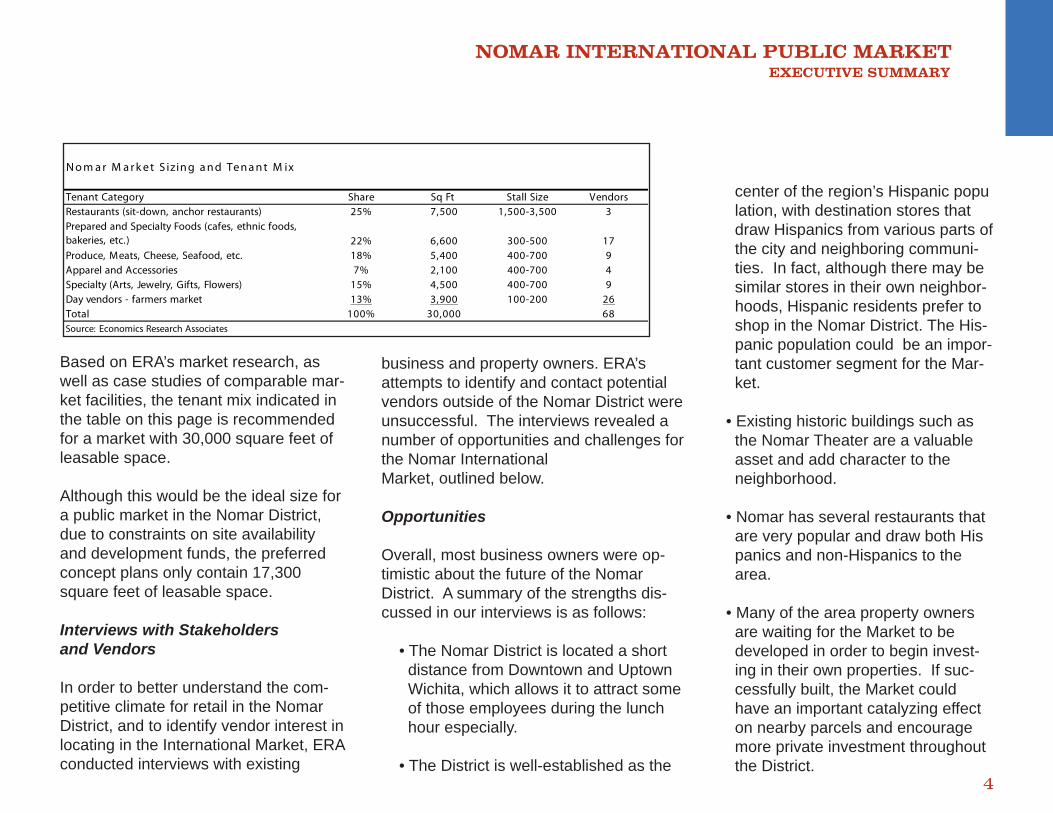
Based on ERA’s market research, as well as case studies of comparable mar-ket facilities, the tenant mix indicated in the table on this page is recommended for a market with 30,000 square feet of leasable space.
Although this would be the ideal size for a public market in the Nomar District, due to constraints on site availability and development funds, the preferred concept plans only contain 17,300 square feet of leasable space.
Interviews with Stakeholders and Vendors
In order to better understand the com-petitive climate for retail in the Nomar District, and to identify vendor interest in locating in the International Market, ERA conducted interviews with existing
business and property owners. ERA’s attempts to identify and contact potential vendors outside of the Nomar District were unsuccessful. The interviews revealed a number of opportunities and challenges for the Nomar International Market, outlined below.
Opportunities
Overall, most business owners were op-timistic about the future of the Nomar District. A summary of the strengths dis-cussed in our interviews is as follows:
• The Nomar District is located a short distance from Downtown and Uptown Wichita, which allows it to attract some of those employees during the lunch hour especially.
• The District is well-established as the
center of the region’s Hispanic popu lation, with destination stores that draw Hispanics from various parts of the city and neighboring communi- ties. In fact, although there may be similar stores in their own neighbor- hoods, Hispanic residents prefer to shop in the Nomar District. The His- panic population could be an impor- tant customer segment for the Mar- ket.
• Existing historic buildings such as the Nomar Theater are a valuable asset and add character to the neighborhood.
• Nomar has several restaurants that are very popular and draw both His panics and non-Hispanics to the area.
• Many of the area property owners are waiting for the Market to be developed in order to begin invest- ing in their own properties. If suc- cessfully built, the Market could have an important catalyzing effect on nearby parcels and encourage more private investment throughout the District.
N o m a r M a r k e t S izin g a n d Te n a n t M ix
Tenant Category Share Sq Ft Stall Size VendorsRestaurants (sit-down, anchor restaurants) 25% 7,500 1,500-3,500 3Prepared and Specialty Foods (cafes, ethnic foods, bakeries, etc.) 22% 6,600 300-500 17Produce, Meats, Cheese, Seafood, etc. 18% 5,400 400-700 9Apparel and Accessories 7% 2,100 400-700 4Specialty (Arts, Jewelry, Gifts, Flowers) 15% 4,500 400-700 9Day vendors - farmers market 13% 3,900 100-200 26Total 100% 30,000 68Source: Economics Research Associates
NOMAR INTERNATIONAL PUBLIC MARKET EXECUTIVE SUMMARY
5
Challenges
For existing business owners, there were a number of concerns about the viability of their own businesses if the market is developed, and fears about the future of the District overall. Some of the established businesses in the No-mar District see the Market as competi-tion and feel threatened by the develop-ment. The central issues discussed in our interviews are described below:
• Currently, rents in the Nomar Dis- trict for retail space are very low at $5 per square foot per year or less annually. There is concern from many of the businesses that the rents at the Market facility will be too high for them to be able to afford it.
• None of the business owners that we interviewed can be considered “anchors” for the Market facility. Al- though there is much interest from existing business owners and entre- preneurs in locating in the Market fa- cility, many of these entrepreneurs have limited experience running a business. There are various busi- ness training programs that may help to prepare business owners,
but they are not directly linked to the Market project.
• Business and property owners are concerned that the newly formed West 21st Street CDC has limited capacity to manage and operate the facility once it is built.
• Business owners reported that crimes and gang activities in the area, com- bined with disinvestment by some area property owners over the years, has created a perception among many Wichita area residents that the neigh- borhood is unsafe.
• The frequency of train traffi c on the railroad tracks just east of Broadway and 21st Street can limit and/or delay access to the neighborhood, and to the proposed sites for the Market.
NOMAR INTERNATIONAL PUBLIC MARKET EXECUTIVE SUMMARY
6
PREFERRED DESIGN CONCEPT 1B-2
The goal of the Nomar International Public Market us to develop a public market venue that will be the catalyst for the redevelopment of the Nomar Market District. With that in mind the facility design is intended to establish the character and identity for the district and provide the market synergy needed to strengthen the vitality of the whole district.
When applying the principals of retail development to the Nomar Market District the properties along 21st Street and Broadway Avenue offer the great-est potential for success of the public market. The visibility, volume of traf-fi c, access, historic structures, existing retail uses and their histories as retail corridors are key criteria for siting a new retail establishment. Furthermore, with the pending improvements to the 21st and Broadway intersection and the sub-sequent right-of-way acquisition by the City of Wichita, the area along the north side of 21st Street between Market Street and Broadway Avenue provide an opportunity for partnership between the CDC and the City that would greatly benefi t the public market. Finally, the
existence of multiple contiguous storefront retail structures along both sides of 21st Street, Market Street and Broadway Av-enues provide ready made low cost retail properties for use by new and established ethnic businesses. This potential offers the value individual business growth due to the synergy of ethnic businesses while strengthen the district brand and identity.
With this perspective it is recommended that the CDC partner with the City of Wich-ita to develop the property at the NW cor-ner of 21st Street and Broadway Avenue. This property will provide for the develop-ment of a 26,000 square foot public mar-ket building and a couple of public plaza spaces. Additionally, the preferred design concept will require the realignment of Market Street north of 21st Street to maxi-mize the developable land opportunity for the market. The design concept also re-quires the purchase of additional adjacent property for use as on-site parking and the development of a shared parking agree-ment with adjacent parking lot owners.
The design concept for the public market building takes cues from other successful public markets throughout the United
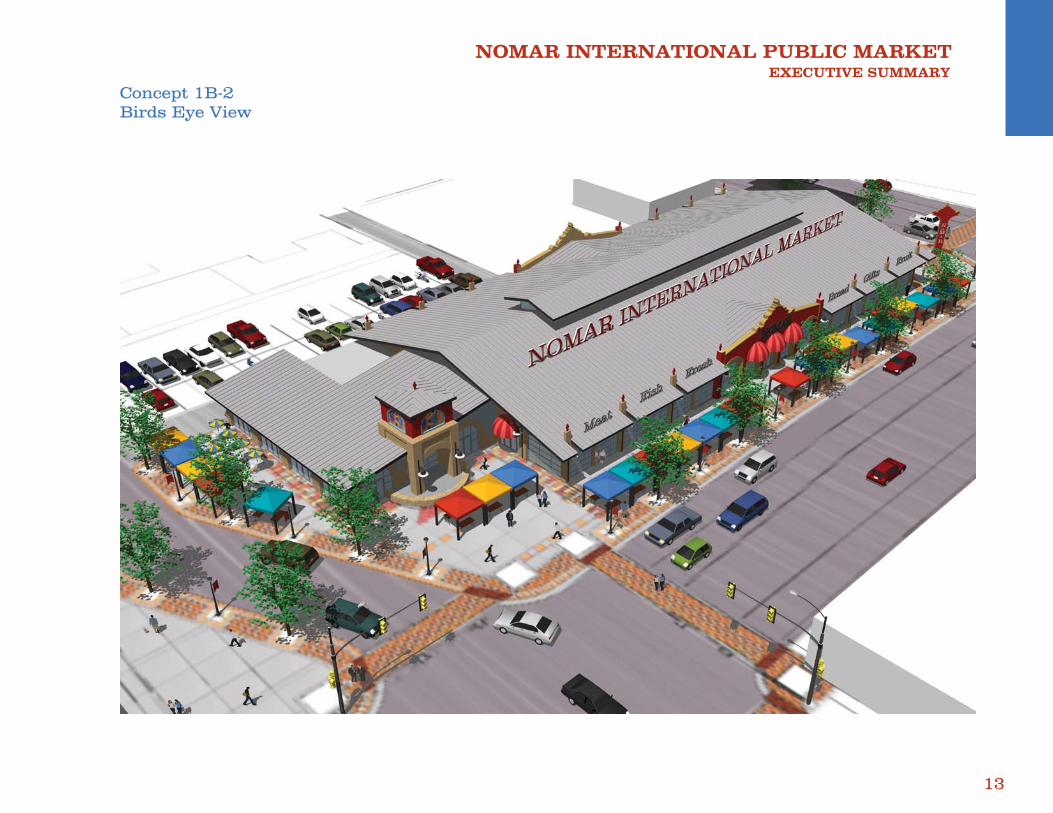
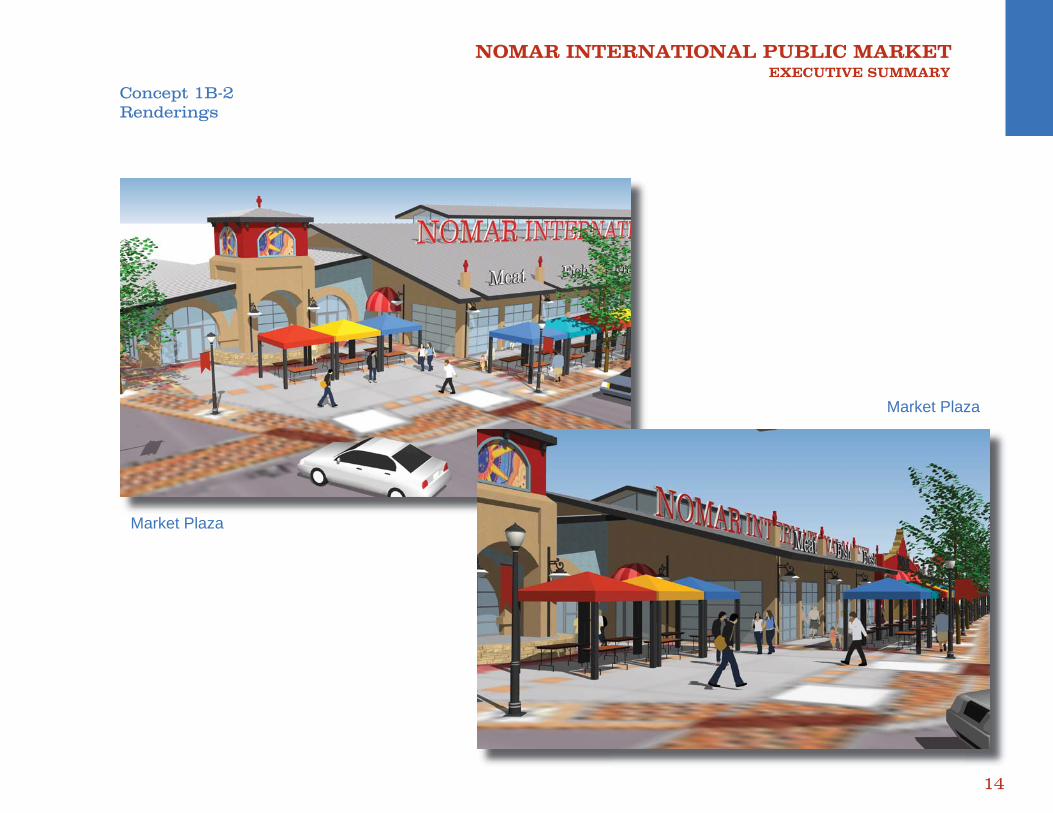
States as well as the historic architec-ture of Nomar Market District itself. As a result the building will be comprised of an open steel frame structure with a prominent metal roof and monumental signage. The exterior walls will primar-ily be roll up glass clad doors which will defi ne each tenant space. This confi guration offers the opportunity to open the market building to the environ-ment during mild seasonal periods and allows the tenant to expand his sales area to the wide sidewalk along 21st Street. With the doors up, the vendor’s sidewalk space defi ned by the large roof overhangs coupled with the temporary tent structure tenant spaces immediate-ly adjacent to 21st Street the patron will have the experience of walking through a European street market. During in climate weather the doors will be closed providing a controlled interior climate for year round shopping. Since the doors will be clad in glass they will offer store-front display opportunities and provide for an alternate window shopping ex-perience for the visitor to the Nomar Market District. The other exterior wall material will be a stucco fi nish to match the color and character of the nearby historic Nomar Theater.
NOMAR INTERNATIONAL PUBLIC MARKET EXECUTIVE SUMMARY
7
There will be three primary building entries defi ned by prominent build-ing features that refl ect the character of the Spanish revival architecture of the nearby historic Nomar Theater and other adjacent commercial structures. They will compliment and reinforcing the visual brand of the district.
While the prominent metal roof and monumental signage is reminiscent of other popular public markets around the country, the clerestory roof struc-ture with operable glazing will provide a unique twist to that traditional de-sign. When the weather warrants, the clerestory windows can be opened to enhance the natural cross ventilation created by the open storefronts. The added convection action created by the operable clerestory and large ceil-ing mounted area fans will contribute to the open, airy feeling of the interior space. Furthermore, there will be no air conditioning systems employed in the building, only gas fi red ceiling mounted unit heaters for use during the winter months of operation.
The use of simple materials, a pre-man-ufactured metal building structure, mini
mal fi nishes, furnishings and building sys-tems all contribute to a cost conscientious building design that offers maximum fl ex-ibility and usability as a public market.
Of signifi cance, this design concept ex-emplifi es many of the same sustainable design principals outlined by the United States Green Building Council (USGBC), the national agency tasked with promot-ing and monitoring green building design in America. The design criteria outlined in the USGBCs Leadership in Energy and Environmental Design (LEED) certifi ca-tion process is refl ected in the building elements listed previously as well as the siting of the building on an existing urban site and the signifi cant use of daylighting concepts (clerestory, deep overhangs, south facing glazing, open market environ-ment (no walls). In its’ built design, this facility could become a model for sustain-able design of public structures in the City of Wichita.
Another signifi cant feature of the building include the indoor food court and events space that includes a performance stage and tables and chairs that can accommo-date a variety of functions. It is envisioned that at lunch time, market patrons will pur-chase their food from market vendors,
sit in the indoor food court and listen to musicians and other entertainers. Dur-ing festivals or special events the food court can become an open dance fl oor or concert venue that further enhances the market experience. Additionally, this space can be opened up to the adja-cent outdoor market plaza where there is another stage that refl ects the indoor stage. The ability to accommodate events inside and outside, adds to the fl exibility and marketability of the public market and its brand as a community events venue.
The key component of the market build-ing is the central vendor area. Gener-ally, the building is envisioned as an open market venue with a variety of tenant confi guration options. The fl oor plan currently identifi es a number of 240 square foot tenant modules. These modules can be leased individually or in combinations to suite a tenant’s specifi c needs providing maximum fl exibility in leasing options. Each vendor will be responsible for the built out of their own tenant space following a set of guidelines identifi ed in a tenant manual. Generous ten foot aisles and expansive views offer shoppers comfortable ac-cess to each vendor and an
NOMAR INTERNATIONAL PUBLIC MARKET EXECUTIVE SUMMARY
8
ability to visually navigate the whole array of vendor offerings. It is expected that a variety of vendor types will result in a similar variety of space confi gura-tions. Vendor spaces may be a varying combination of counter tops, display cases and shelving, while others may maximize fl oor space, or utilize custom fi xturing and cabinetry. An overhead tenant grid may be employed to accom-modate vendor signage, accent lighting and generally defi ne the tenant space. All tenant spaces will offer basic power options and general overhead lighting. Some tenant spaces will offer specialty power options, data and communica-tions connections as well as limited plumbing options. It is expected that vendor product storage will be accom-modated within each tenant space. The facility will also include a vendor receiv-ing area and some minimal cold storage to accommodate delivers and storage of perishable goods. It is expected that some vendors will provide cold storage within their own tenant space. The CDC will need to establish specifi c deliver and storage practices to assure that there is no interruption of vendor activity during business hours.
Finally, the site and positioning of the building maximize the visual presence of the market along two major traffi c corridors following the primary criteria of retail de-sign…. location, location, location. Ac-cess to the site will be adequate given the markets prominence position on the inter-section of Broadway Avenue and North 21st Street. However, parking will be a challenge given the desire to not overbur-den the district and nearby neighborhood with a sea of parking and a limited ability to acquire signifi cant contiguous property. It is recommended that the CDC negotiate a shared parking agreement with adjacent commercial property owners in the district to enhance its parking capacity.
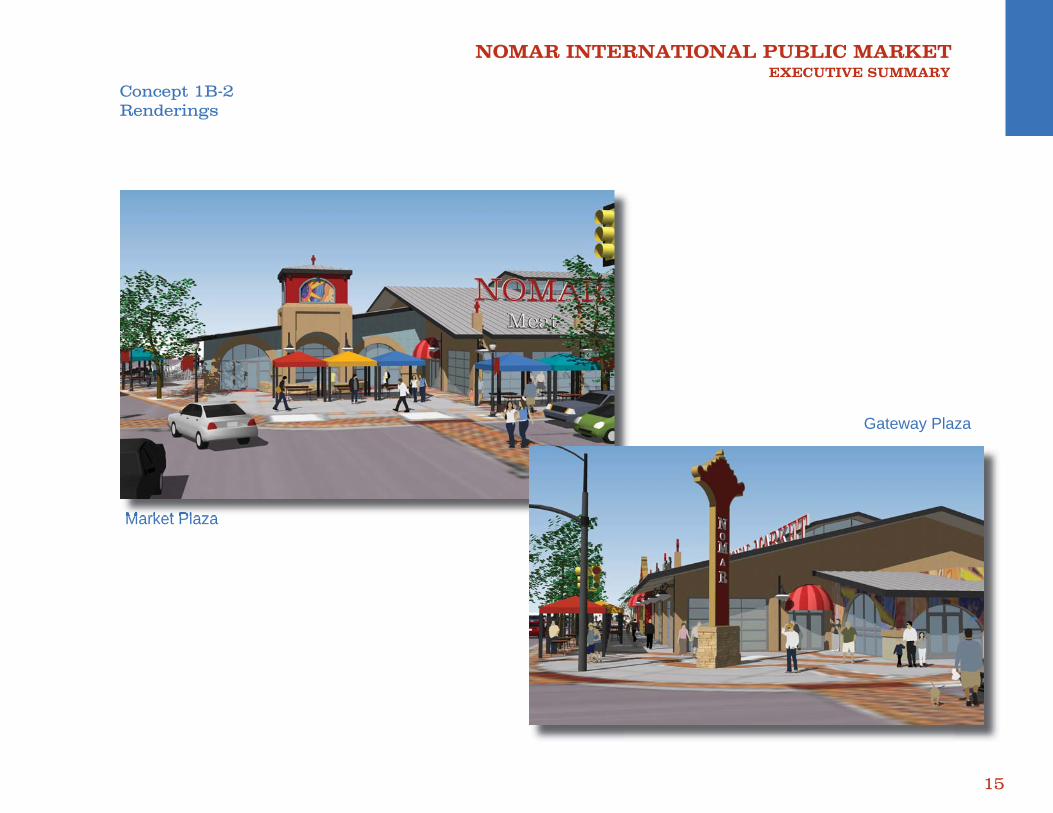
The site will also offer opportunity for the development of two separate public plaza spaces. One, the gateway plaza at the intersection of Broadway Avenue and North 21st Street, will provide for a signa-ture landmark feature to defi ne the entry to the Nomar District. It will also serve as a gathering and events space and serve as a unique outdoor vendor option for market tenants positioned around it. The second, the market plaza at the intersection of Mar-ket Street and North 21st Street, will
provide a outdoor entertainment venue while serving as a visual landmark on Axis with Market Street. The Nomar In-ternational Public Market will be located on North Market Street at the Market Street Plaza, thus reinforcing the district brand and establishing its presence in the greater Wichita community.
The sidewalk area around the market will include signifi cant streetscape (pav-ing, lighting, furniture and furnishings) and landscape features to enhance the visual appeal of the market build-ing. These features will also serve to strengthen the presence of the street vendors positioned in the tenant tent structures, creating a unique and lively outdoor shopping experience that com-pliments the offerings inside the market building.
The following images provide a glimpse of the design of the Nomar International Public Market building.
NOMAR INTERNATIONAL PUBLIC MARKET EXECUTIVE SUMMARY
9
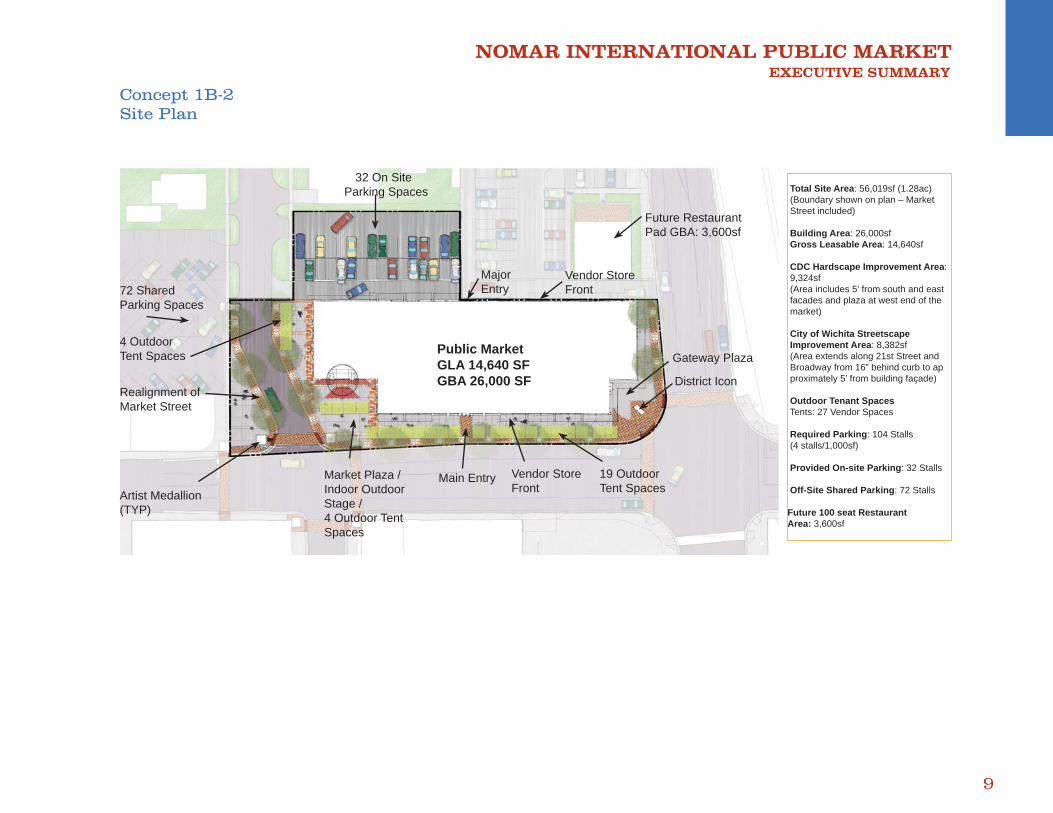
Concept 1B-2Site Plan
32 On Site Parking Spaces
Major Entry
Vendor Store Front
Future RestaurantPad GBA: 3,600sf
District Icon
Gateway Plaza
19 OutdoorTent Spaces
Vendor Store Front
Main EntryMarket Plaza / Indoor Outdoor Stage / 4 Outdoor Tent Spaces
72 Shared Parking Spaces
Realignment ofMarket Street
Artist Medallion(TYP)
Public MarketGLA 14,640 SFGBA 26,000 SF
Total Site Area: 56,019sf (1.28ac) (Boundary shown on plan – Market Street included)
Building Area: 26,000sf Gross Leasable Area: 14,640sf CDC Hardscape Improvement Area: 9,324sf (Area includes 5’ from south and east facades and plaza at west end of the market)
City of Wichita Streetscape Improvement Area: 8,382sf (Area extends along 21st Street and Broadway from 16” behind curb to ap proximately 5’ from building façade)
Outdoor Tenant Spaces Tents: 27 Vendor Spaces
Required Parking: 104 Stalls (4 stalls/1,000sf)
Provided On-site Parking: 32 Stalls
Off-Site Shared Parking: 72 Stalls
Future 100 seat RestaurantArea: 3,600sf
4 Outdoor Tent Spaces
NOMAR INTERNATIONAL PUBLIC MARKET EXECUTIVE SUMMARY
10
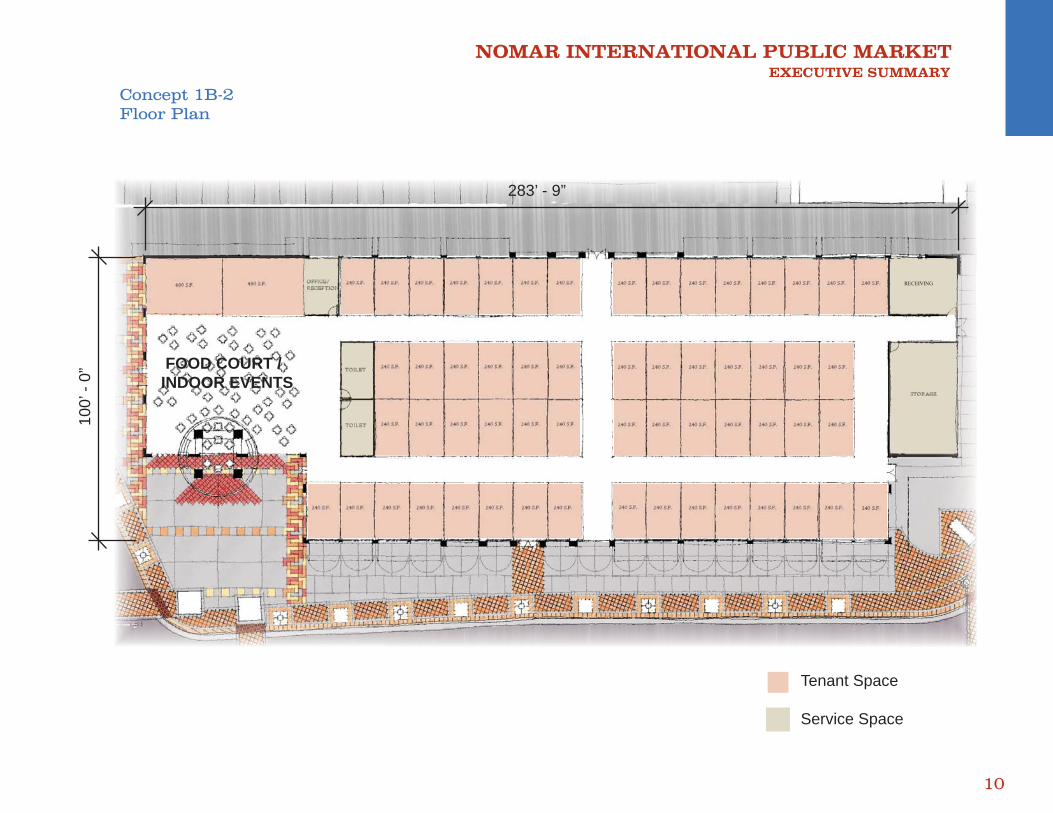
Concept 1B-2Floor Plan
Tenant Space
Service Space
283’ - 9”
100’
- 0”
FOOD COURT / INDOOR EVENTS
NOMAR INTERNATIONAL PUBLIC MARKET EXECUTIVE SUMMARY
11
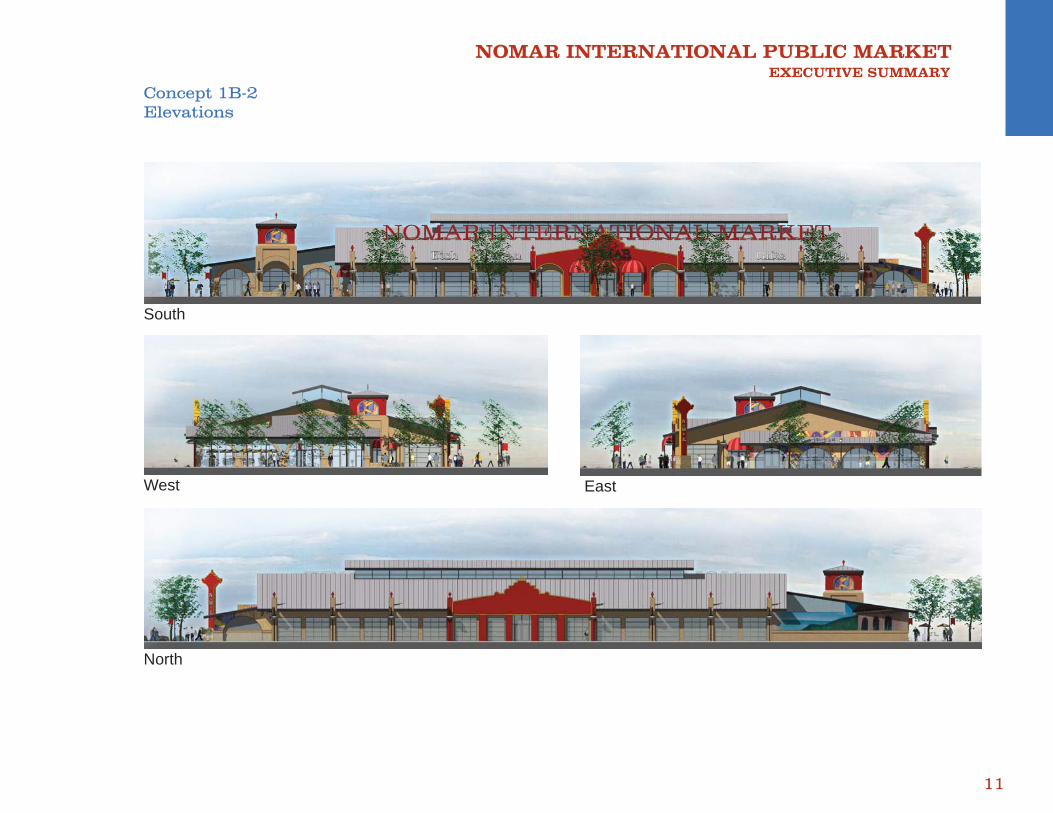
South
West East
North
Concept 1B-2Elevations
NOMAR INTERNATIONAL PUBLIC MARKET EXECUTIVE SUMMARY
12
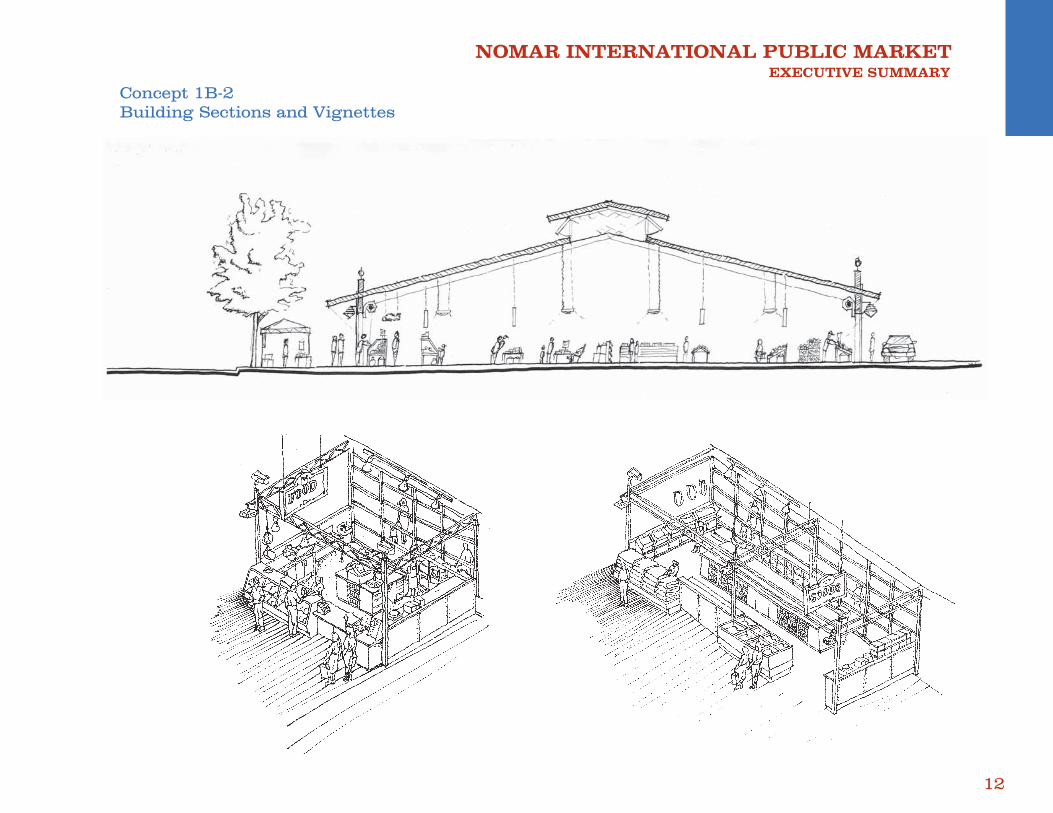
Concept 1B-2Building Sections and Vignettes
NOMAR INTERNATIONAL PUBLIC MARKET EXECUTIVE SUMMARY
13
Concept 1B-2Birds Eye View
NOMAR INTERNATIONAL PUBLIC MARKET EXECUTIVE SUMMARY
14
Concept 1B-2Renderings
Market Plaza
Market Plaza
NOMAR INTERNATIONAL PUBLIC MARKET EXECUTIVE SUMMARY
15
Concept 1B-2Renderings
Market Plaza
Gateway Plaza
NOMAR INTERNATIONAL PUBLIC MARKET EXECUTIVE SUMMARY
16
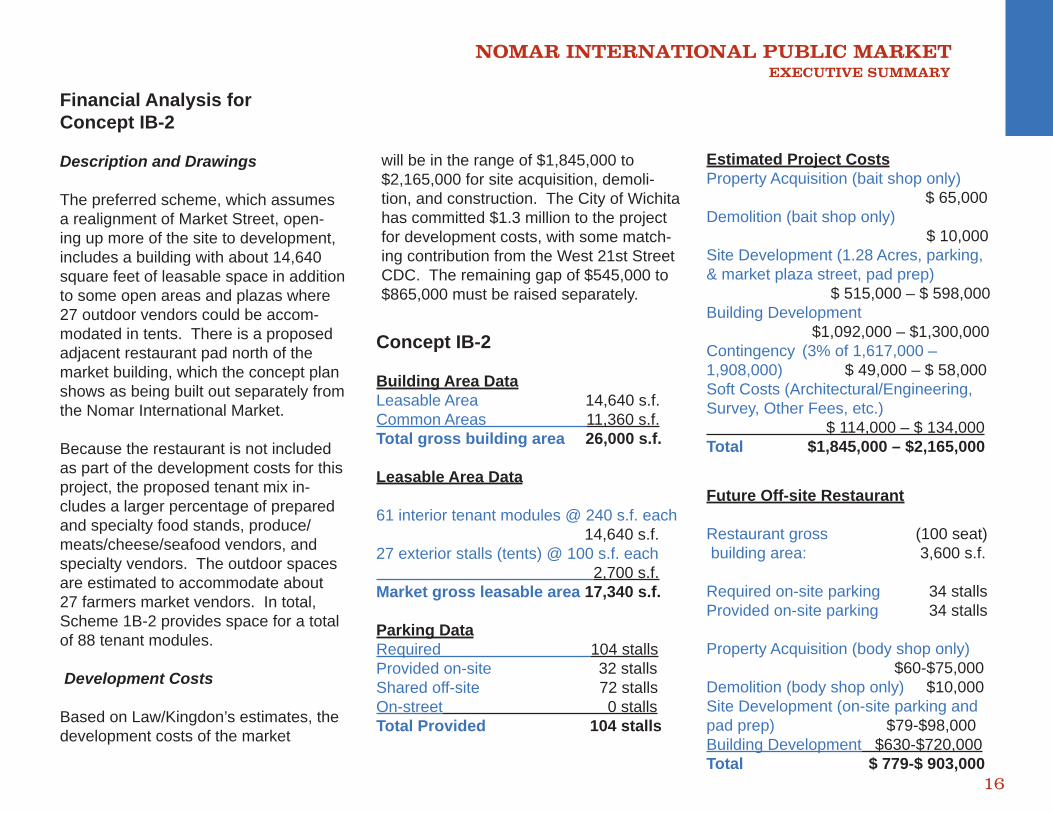
Financial Analysis for Concept IB-2
Description and Drawings
The preferred scheme, which assumes a realignment of Market Street, open-ing up more of the site to development, includes a building with about 14,640 square feet of leasable space in addition to some open areas and plazas where 27 outdoor vendors could be accom-modated in tents. There is a proposed adjacent restaurant pad north of the market building, which the concept plan shows as being built out separately from the Nomar International Market.
Because the restaurant is not included as part of the development costs for this project, the proposed tenant mix in-cludes a larger percentage of prepared and specialty food stands, produce/meats/cheese/seafood vendors, and specialty vendors. The outdoor spaces are estimated to accommodate about 27 farmers market vendors. In total, Scheme 1B-2 provides space for a total of 88 tenant modules.
Development Costs
Based on Law/Kingdon’s estimates, the development costs of the market
will be in the range of $1,845,000 to $2,165,000 for site acquisition, demoli-tion, and construction. The City of Wichita has committed $1.3 million to the project for development costs, with some match-ing contribution from the West 21st Street CDC. The remaining gap of $545,000 to $865,000 must be raised separately.
Estimated Project CostsProperty Acquisition (bait shop only) $ 65,000Demolition (bait shop only) $ 10,000Site Development (1.28 Acres, parking, & market plaza street, pad prep) $ 515,000 – $ 598,000Building Development $1,092,000 – $1,300,000Contingency (3% of 1,617,000 – 1,908,000) $ 49,000 – $ 58,000Soft Costs (Architectural/Engineering, Survey, Other Fees, etc.) $ 114,000 – $ 134,000Total $1,845,000 – $2,165,000
Future Off-site Restaurant
Restaurant gross (100 seat) building area: 3,600 s.f. Required on-site parking 34 stallsProvided on-site parking 34 stalls
Property Acquisition (body shop only) $60-$75,000Demolition (body shop only) $10,000Site Development (on-site parking and pad prep) $79-$98,000Building Development $630-$720,000Total $ 779-$ 903,000
Concept IB-2
Building Area DataLeasable Area 14,640 s.f.Common Areas 11,360 s.f.Total gross building area 26,000 s.f. Leasable Area Data
61 interior tenant modules @ 240 s.f. each 14,640 s.f.27 exterior stalls (tents) @ 100 s.f. each 2,700 s.f.Market gross leasable area 17,340 s.f.
Parking DataRequired 104 stallsProvided on-site 32 stalls Shared off-site 72 stallsOn-street 0 stallsTotal Provided 104 stalls
NOMAR INTERNATIONAL PUBLIC MARKET EXECUTIVE SUMMARY
17
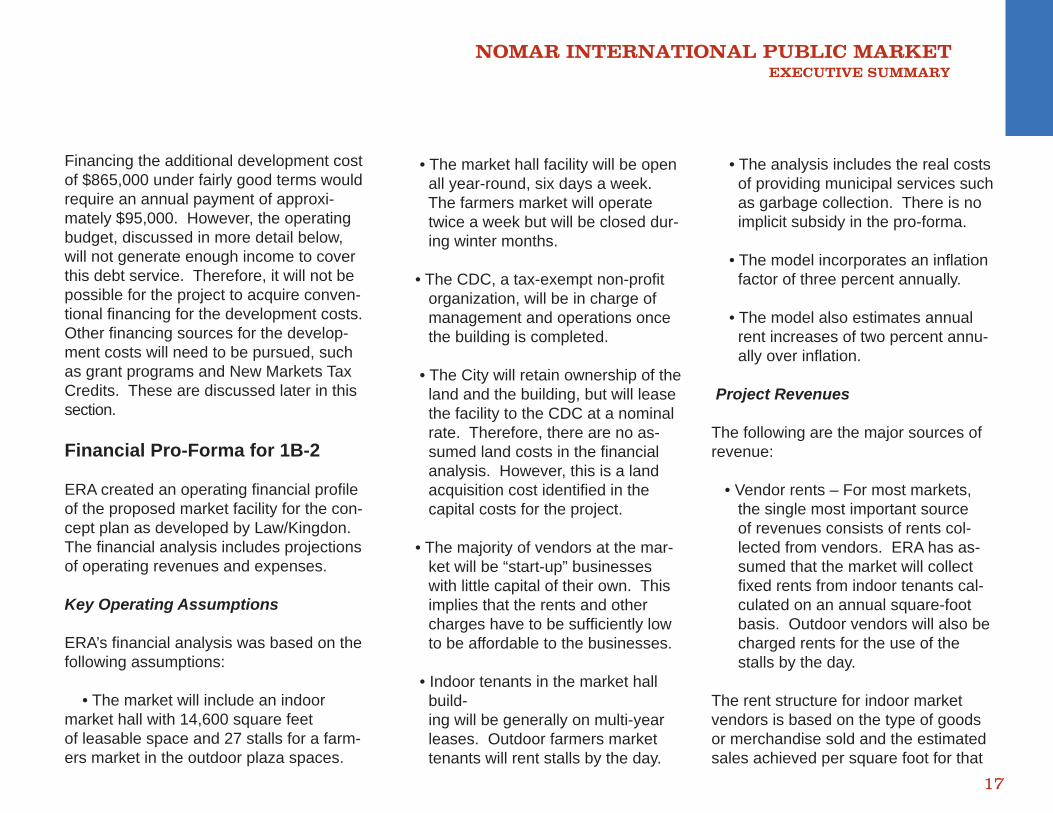
Financing the additional development cost of $865,000 under fairly good terms would require an annual payment of approxi-mately $95,000. However, the operating budget, discussed in more detail below, will not generate enough income to cover this debt service. Therefore, it will not be possible for the project to acquire conven-tional fi nancing for the development costs. Other fi nancing sources for the develop-ment costs will need to be pursued, such as grant programs and New Markets Tax Credits. These are discussed later in this section.
Financial Pro-Forma for 1B-2
ERA created an operating fi nancial profi le of the proposed market facility for the con-cept plan as developed by Law/Kingdon. The fi nancial analysis includes projections of operating revenues and expenses.
Key Operating Assumptions
ERA’s fi nancial analysis was based on the following assumptions:
• The market will include an indoor market hall with 14,600 square feet of leasable space and 27 stalls for a farm-ers market in the outdoor plaza spaces.
• The market hall facility will be open all year-round, six days a week. The farmers market will operate twice a week but will be closed dur- ing winter months.
• The CDC, a tax-exempt non-profi t organization, will be in charge of management and operations once the building is completed.
• The City will retain ownership of the land and the building, but will lease the facility to the CDC at a nominal rate. Therefore, there are no as- sumed land costs in the fi nancial analysis. However, this is a land acquisition cost identifi ed in the capital costs for the project.
• The majority of vendors at the mar- ket will be “start-up” businesses with little capital of their own. This implies that the rents and other charges have to be suffi ciently low to be affordable to the businesses.
• Indoor tenants in the market hall build- ing will be generally on multi-year leases. Outdoor farmers market tenants will rent stalls by the day.
• The analysis includes the real costs of providing municipal services such as garbage collection. There is no implicit subsidy in the pro-forma.
• The model incorporates an infl ation factor of three percent annually.
• The model also estimates annual rent increases of two percent annu- ally over infl ation.
Project Revenues
The following are the major sources of revenue:
• Vendor rents – For most markets, the single most important source of revenues consists of rents col- lected from vendors. ERA has as- sumed that the market will collect fi xed rents from indoor tenants cal- culated on an annual square-foot basis. Outdoor vendors will also be charged rents for the use of the stalls by the day.
The rent structure for indoor market vendors is based on the type of goods or merchandise sold and the estimated sales achieved per square foot for that
NOMAR INTERNATIONAL PUBLIC MARKET EXECUTIVE SUMMARY
18
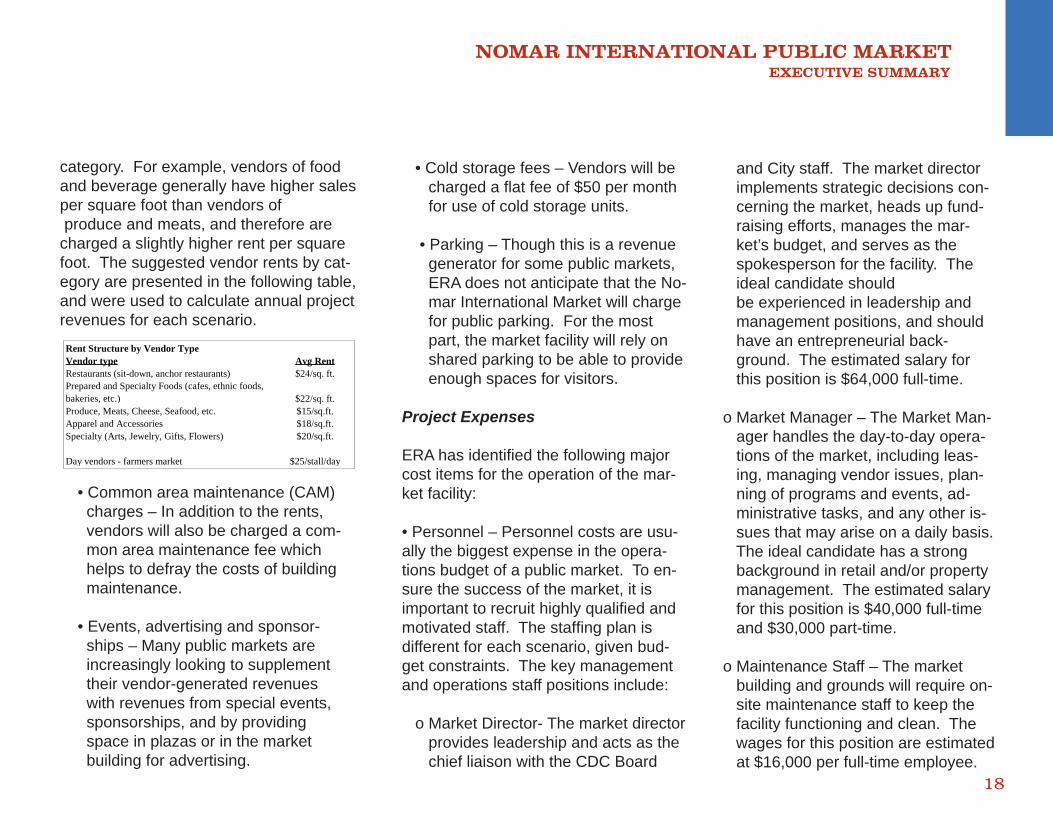
category. For example, vendors of food and beverage generally have higher sales per square foot than vendors of produce and meats, and therefore are charged a slightly higher rent per square foot. The suggested vendor rents by cat-egory are presented in the following table, and were used to calculate annual project revenues for each scenario.
• Common area maintenance (CAM) charges – In addition to the rents, vendors will also be charged a com- mon area maintenance fee which helps to defray the costs of building maintenance.
• Events, advertising and sponsor- ships – Many public markets are increasingly looking to supplement their vendor-generated revenues with revenues from special events, sponsorships, and by providing space in plazas or in the market building for advertising.
Rent Structure by Vendor TypeVendor type Avg RentRestaurants (sit-down, anchor restaurants) $24/sq. ft.Prepared and Specialty Foods (cafes, ethnic foods, bakeries, etc.) $22/sq. ft.Produce, Meats, Cheese, Seafood, etc. $15/sq.ft.Apparel and Accessories $18/sq.ft.Specialty (Arts, Jewelry, Gifts, Flowers) $20/sq.ft.
Day vendors - farmers market $25/stall/day
• Cold storage fees – Vendors will be charged a fl at fee of $50 per month for use of cold storage units.
• Parking – Though this is a revenue generator for some public markets, ERA does not anticipate that the No- mar International Market will charge for public parking. For the most part, the market facility will rely on shared parking to be able to provide enough spaces for visitors.
Project Expenses
ERA has identifi ed the following majorcost items for the operation of the mar-ket facility:
• Personnel – Personnel costs are usu-ally the biggest expense in the opera-tions budget of a public market. To en-sure the success of the market, it is important to recruit highly qualifi ed and motivated staff. The staffi ng plan is different for each scenario, given bud-get constraints. The key management and operations staff positions include:
o Market Director- The market director provides leadership and acts as the chief liaison with the CDC Board
and City staff. The market director implements strategic decisions con- cerning the market, heads up fund- raising efforts, manages the mar- ket’s budget, and serves as the spokesperson for the facility. The ideal candidate should be experienced in leadership and management positions, and should have an entrepreneurial back- ground. The estimated salary for this position is $64,000 full-time. o Market Manager – The Market Man- ager handles the day-to-day opera- tions of the market, including leas- ing, managing vendor issues, plan- ning of programs and events, ad- ministrative tasks, and any other is- sues that may arise on a daily basis. The ideal candidate has a strong background in retail and/or property management. The estimated salary for this position is $40,000 full-time and $30,000 part-time.
o Maintenance Staff – The market building and grounds will require on- site maintenance staff to keep the facility functioning and clean. The wages for this position are estimated at $16,000 per full-time employee.
NOMAR INTERNATIONAL PUBLIC MARKET EXECUTIVE SUMMARY
19
o Security – Because the City is not providing any police services to the market, some security staff will be needed. The wages for this posi- tion are estimated at $24,000 per full-time employee.
• Marketing/Advertising/Events – The mar-ket’s success will largely be determined in the fi rst few years of operation. In order to attract customers and vendors, the mar-ket will need to have an active marketing campaign, which may include ads in the newspaper, radio, and other media; post-ers and fl yers distributed around town; and holding special events. In the fi rst two to three years, the marketing budget will be larger than in the following years, once the facility has become better established.
• Utilities – The second largest cost to pub-lic markets is the cost of providing utilities. The market building will be heated but not cooled, and will require gas, electric, and water/sewer utilities. The cost of utilities is only partially offset by CAM charges.
• Garbage and Recycling – Because the City is not planning to subsidize any of its services to the market, ERA hasestimated the annual cost of trashcollection.
• Other costs – The market will incur additional operating costs such as insurance, legal/professional costs, and permits/fees.
• Contingency – The model has built in a contingency factor of ten percent of total expenses to account for certain capital replacement costs, tenant improvement allowances, and other factors that may come up during the course of the mar-ket’s operations.
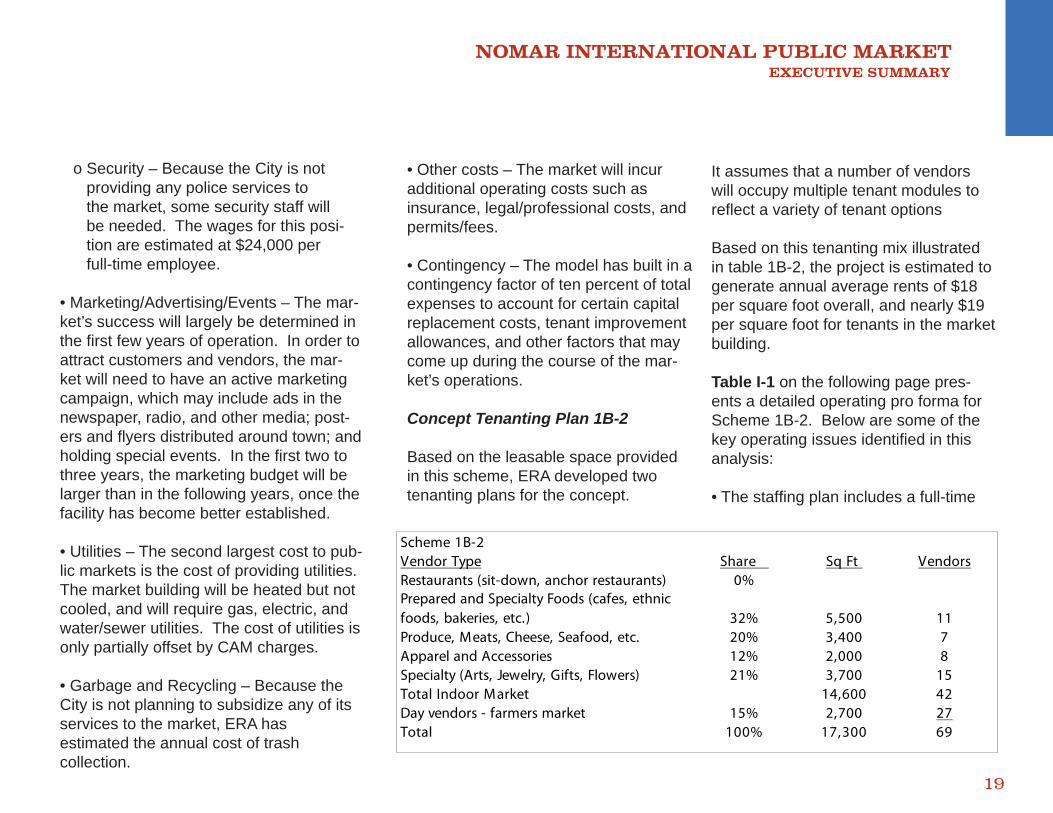
Concept Tenanting Plan 1B-2
Based on the leasable space provided in this scheme, ERA developed twotenanting plans for the concept.
Scheme 1B-2Vendor Type Share Sq Ft VendorsRestaurants (sit-down, anchor restaurants) 0%Prepared and Specialty Foods (cafes, ethnic foods, bakeries, etc.) 32% 5,500 11Produce, Meats, Cheese, Seafood, etc. 20% 3,400 7Apparel and Accessories 12% 2,000 8Specialty (Arts, Jewelry, Gifts, Flowers) 21% 3,700 15Total Indoor Market 14,600 42Day vendors - farmers market 15% 2,700 27Total 100% 17,300 69
It assumes that a number of vendors will occupy multiple tenant modules to refl ect a variety of tenant options
Based on this tenanting mix illustrated in table 1B-2, the project is estimated to generate annual average rents of $18 per square foot overall, and nearly $19 per square foot for tenants in the market building.
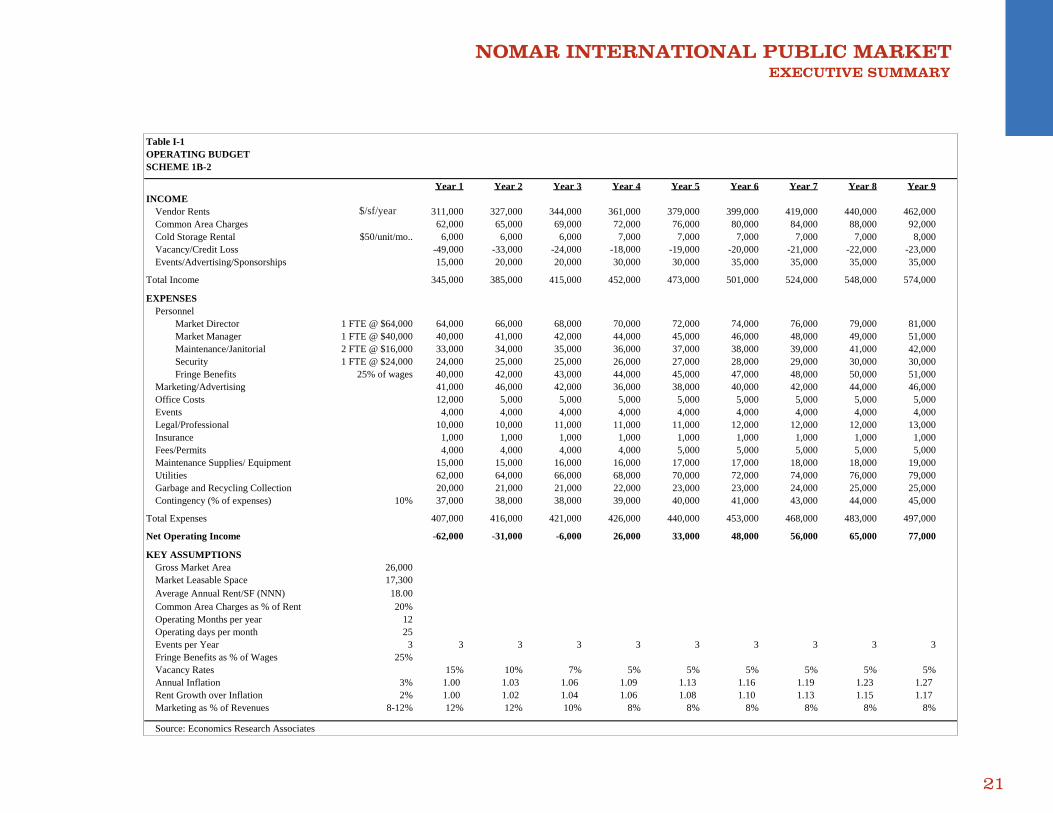
Table I-1 on the following page pres-ents a detailed operating pro forma for Scheme 1B-2. Below are some of the key operating issues identifi ed in this analysis:
• The staffi ng plan includes a full-time
NOMAR INTERNATIONAL PUBLIC MARKET EXECUTIVE SUMMARY
20
Market Director, a part-time Market Manager, two full-time maintenance and one security staff. Fringe bene- fi ts (health insurance and payroll taxes) are an additional 25 percent of wages. Personnel accounts for almost half of all operating expenses.
• The larger plaza spaces in this scheme would allow for up to three annual events at the market by Year 8. Events and sponsorships are esti- mated to bring in annual revenues in the range of $15,000 to $35,000 a year as the number of events, fund raising activities, and popularity of the market grow.
• The marketing and advertising bud- get accounts for eight to 12 percent of total revenues. Marketing expens- es will be heavier in the fi rst three years of the project.
• Because of the larger amount of leasable space, it will take slightly longer to lease up in this scheme. At opening in Year 1, the market is expected to have a vacancy rate of 15 percent, which will stabilize to fi ve percent by Year 4.
• Utilities costs are estimated at about $62,000 per year and garbage col- lection costs are estimated at about $20,000.
• Offi ce administration costs include a one-time expense of about $12,000 in the fi rst-year to equip the space with computers, printers, faxes, telecommunications, etc. Af- ter that, the cost of offi ce manage- ment drops down to about $5,000 annually.
The Net Operating Income in Scheme 1B-2 is negative up until Year 4 as the project leases up and rents begin to increase. The operating gap is due to the fact that the rents generated by the small amount of leasable space are insuffi cient to cover the costs of personnel, utilities, and other fi xed overhead expenses. Over the fi rst three years, the total operating shortfall is almost $100,000 in this scenario.
NOMAR INTERNATIONAL PUBLIC MARKET EXECUTIVE SUMMARY
21
Table I-1OPERATING BUDGETSCHEME 1B-2
Year 1 Year 2 Year 3 Year 4 Year 5 Year 6 Year 7 Year 8 Year 9INCOME
Vendor Rents 311,000 327,000 344,000 361,000 379,000 399,000 419,000 440,000 462,000Common Area Charges 62,000 65,000 69,000 72,000 76,000 80,000 84,000 88,000 92,000Cold Storage Rental $50/unit/mo.. 6,000 6,000 6,000 7,000 7,000 7,000 7,000 7,000 8,000Vacancy/Credit Loss -49,000 -33,000 -24,000 -18,000 -19,000 -20,000 -21,000 -22,000 -23,000Events/Advertising/Sponsorships 15,000 20,000 20,000 30,000 30,000 35,000 35,000 35,000 35,000
Total Income 345,000 385,000 415,000 452,000 473,000 501,000 524,000 548,000 574,000
EXPENSESPersonnel
Market Director 1 FTE @ $64,000 64,000 66,000 68,000 70,000 72,000 74,000 76,000 79,000 81,000Market Manager 1 FTE @ $40,000 40,000 41,000 42,000 44,000 45,000 46,000 48,000 49,000 51,000Maintenance/Janitorial 2 FTE @ $16,000 33,000 34,000 35,000 36,000 37,000 38,000 39,000 41,000 42,000Security 1 FTE @ $24,000 24,000 25,000 25,000 26,000 27,000 28,000 29,000 30,000 30,000Fringe Benefits 25% of wages 40,000 42,000 43,000 44,000 45,000 47,000 48,000 50,000 51,000
Marketing/Advertising 41,000 46,000 42,000 36,000 38,000 40,000 42,000 44,000 46,000Office Costs 12,000 5,000 5,000 5,000 5,000 5,000 5,000 5,000 5,000Events 4,000 4,000 4,000 4,000 4,000 4,000 4,000 4,000 4,000Legal/Professional 10,000 10,000 11,000 11,000 11,000 12,000 12,000 12,000 13,000Insurance 1,000 1,000 1,000 1,000 1,000 1,000 1,000 1,000 1,000Fees/Permits 4,000 4,000 4,000 4,000 5,000 5,000 5,000 5,000 5,000Maintenance Supplies/ Equipment 15,000 15,000 16,000 16,000 17,000 17,000 18,000 18,000 19,000Utilities 62,000 64,000 66,000 68,000 70,000 72,000 74,000 76,000 79,000Garbage and Recycling Collection 20,000 21,000 21,000 22,000 23,000 23,000 24,000 25,000 25,000Contingency (% of expenses) 10% 37,000 38,000 38,000 39,000 40,000 41,000 43,000 44,000 45,000
Total Expenses 407,000 416,000 421,000 426,000 440,000 453,000 468,000 483,000 497,000
Net Operating Income -62,000 -31,000 -6,000 26,000 33,000 48,000 56,000 65,000 77,000
KEY ASSUMPTIONSGross Market Area 26,000Market Leasable Space 17,300Average Annual Rent/SF (NNN) 18.00Common Area Charges as % of Rent 20%Operating Months per year 12Operating days per month 25Events per Year 3 3 3 3 3 3 3 3 3 3Fringe Benefits as % of Wages 25%Vacancy Rates 15% 10% 7% 5% 5% 5% 5% 5% 5%Annual Inflation 3% 1.00 1.03 1.06 1.09 1.13 1.16 1.19 1.23 1.27 Rent Growth over Inflation 2% 1.00 1.02 1.04 1.06 1.08 1.10 1.13 1.15 1.17 Marketing as % of Revenues 8-12% 12% 12% 10% 8% 8% 8% 8% 8% 8%
Source: Economics Research Associates
$/sf/year
NOMAR INTERNATIONAL PUBLIC MARKET EXECUTIVE SUMMARY
22
Implementation Steps
Fund Raising
Because the market has both a gap in its development costs as well as an operating shortfall, the fi rst key step is to identify some sources of fi nancing to help cover the costs of building and run-ning the facility.
As mentioned above, because the mar-ket does not achieve a positive operat-ing balance until Year 4, it will not be possible to acquire private debt for the remaining $545,000 to $865,000 in the development cost budget. Alternative sources of fi nancing should be explored. Among these include the following:
• New Markets Tax Credits – The New Markets Tax Credit program can provide a commercial project in a low-income area with equity or debt fi nancing from an eligible community development entity (CDE). Because the Nomar International Market would be located in a low-income census tract, it is potentially a quali- fi ed project. NMTC funds are usually used for site development and con- struction costs. Though the tax-credit
program has not been used in the state of Kansas, this project is an ideal can- didate for this type of fi nancing. Eligible national CDEs that have New Markets Tax Credit allocations which could be used in Kansas include Bank of Amer- ica, Citibank, Consortium America, ESIC New Markets Partners, Local Ini- tiatives Support Corporation, MBS Urban Initiatives, National City New Market Fund, NCB, Structured Products Group, Wachovia, and others. • Tax Increment Financing. The City intends to create a tax-increment fi - nancing district in what has been de- fi ned as the Nomar Marketplace Dis- trict, containing the Nomar International Market site. Because the TIF has not yet been created, there are no exist- ing funds for the construction of the market. However, if the TIF district is created in the future, it could provide funding for construction of parking facili- ties and other public improvements as the market and surrounding areas be- come more successful.
There are a variety of grant programs to help with the operations of the proposed Nomar International Market. ERA has identifi ed the following:
• Project for Public Spaces Grants– This grant program makes approxi- mately $400,000 available for 10 public market projects. The focus of the program is on farmers markets, and the funds can help with both la- bor and other operational costs that are diffi cult to fi nance in other ways.
• USDA Farmers Market Promotion Program - The USDA has $1 mil- lion available (maximum of $75,000 per project) for eligible uses such as training and information shar- ing for farmers and vendors, con- sumer education, and innovative market operations strategies.
• The Department of Health & Human Services Administration for Children and Families – This grant program funds operating costs to CDCs that are experienced in implementing economic development projects, targeting those that provide assis- tance to low-income communities.
In order to raise the funds for capital costs and the operating gaps, the CDC should begin its fundraising activities as soon as possible to identify potential sponsors and partners.
NOMAR INTERNATIONAL PUBLIC MARKET EXECUTIVE SUMMARY
23
Planning & Regulatory Issues
In addition to the fundraising activities, the CDC will also need to work with the city and area property and business owners to address some of the planning and regulatory issues that will affect the market’s operations. Some of these tasks include:
• Working with City offi cials to make sure that the activities planned will be permitted/licensed (outdoor vending, open-air food service, pub- lic events, etc.)
• Making arrangements with neighbor- ing property owners to provide shared parking. This is critical since the market will not provide any on- site parking for its customers or busi- nesses.
Development Issues – Next Steps
The following is a synopsis of the issues that will need to be addressed for pro-gression of the selected design concept.
1) Re-alignment of Market Street north of 21st Street a. Coordination of the fi nal re-align- ment of Market Street with the
Engineering Department (specifi cally Traffi c Engineering). b. Issues related to the re-alignment are: i. Vacation of City right-of-way ii. Final alignment geometrics iii. Coordination of Market St. inter- section with 21st Street street improvement plans iv. Existing utility modifi cations v. Signalization and crosswalk de- sign c. Initiate any traffi c studies required by the Engineering Department.
2) Market Parking a. Purchase of land north of the Market for on-site parking and possible truck vendor area. b. Establish shared parking agreements with owners of parking lot on the west side of Market. These will need to be submitted to the City of Wichita prior to building permitting. c. Consideration of additional land acqui- sition for more adjacent parking
3) Planning/Operational a. Obtain a certifi cate of exemption from the North Industrial Corridor under ground water contamination initiative. This exemption will assure that the CDC is not held liable for the costs as-
sociated with the current mitigation efforts. b. Pursue establishment of a Tax Incre- ment Finance (TIF) district for the Normar Market District. These funds could be used to fi nance additional capital costs associated with the mar- ket building project as well as other physical improvements in the market district. c. Pursue a Special Operations permit for food service in a public market from the Sedgwick County Health Department. d. Pursue vacation of zoning building setbacks to a zero-lot line along all street frontages and along the alley. e. Verify the current zoning will allow for a public market and pursue a condi- tional use permit if necessary. f. Coordinate proposed construction within City right-of-way. Determine if improvements by the CDC in right-of- way will require a minor street privilege permit of if the City of Wichita will as- sume ownership of those improve- ments.
Marketing and Promotion
An aggressive marketing and promotion program should be launched in advance of

NOMAR INTERNATIONAL PUBLIC MARKET EXECUTIVE SUMMARY
24
the market’s opening in order to en-sure its success. This entails reaching out to prospective shoppers as well as vendors, the community, partners and funders. Elements of the marketing program include the following:
• Advertising – The Nomar Interna- tional Market should advertise in radio and print, taking advantage of Spanish-speaking media as well as English-speaking media. As a non- profi t the market may be able to obtain free publicity in the form of public service announcements, newspaper articles, calendar listings in community newspapers, fl yers, etc.
• Public relations – The market will need a full public relations program in order to ensure a good relation- ship with local political and business leaders and community members. Collaboration with other non-profi t and cultural institutions with similar objectives is one way of accomplish- ing this. The CDC may also need to work with existing Nomar District business owners to get their sup- port on the market project.
• Special events – Many public mar- kets rely on special events to pro- mote the facility. These can range from food tastings to music festivals. Special events can be a good oppor- tunity to draw in new customers or cultivate sponsorships.
Vendor Qualifi cation and Operating Guidelines
Vendor recruitment and qualifi cation will be an important task prior to leasing the facil-ity. This will include some of the market-ing/promotion elements described above. The CDC will have to mount a campaign to identify and recruit potential vendors from all over the city that have an intereset in operating a stall either on a weekly basis in the outdoor farmers market, or on a per-manent basis in the indoor market hall. In order to do this, the CDC should work with existing organizsations that provide assis-tance to small business owners and en-trepreneurs. The CDC may also organize public meetings in cultural and community institutions to recruit vendors. Once po-tential vendors are identifi ed and have applied, they should be interviewed and screened to make sure that they are quali-fi ed and experienced.
The CDC will also need to set up solid policy and tenant guidelines for man-agement and operations of market prior to opening. The tenant guidelines will establish hours of operation, products sold, prioritization of tenanting, regula-tions on loading and unloading, etc.
Vendor Business Education
Given that a number of potential ven-dors may have limited experience run-ning a business, it is recommended that the CDC enlists the services of local business training organizations. While these services might be offered directly by the CDC, the number existing busi-ness training programs in the City of Wichita offer opportunity to prepare these new business owners for the rig-ors of business operations and expose the values of Nomar International Mar-ket as a business incubator to the larger business community.
With that goal in mind, the CDC could develop a vendor transition program that assists the growing tenants to re-locate to existing retail space within the Nomar District. This opens up more op-portunities for new businesses to form and start at the market.
NOMAR INTERNATIONAL PUBLIC MARKET EXECUTIVE SUMMARY
25
MARKET EXPANSION OPPORTUNITIES
The CDC should plan for future expan-sion opportunities. Given the market analysis data and the limited scope of the current project it is likely that the market will need to grow to accommo-date an increasing number of market vendors. The following master plan outlines a proposed series of phases to begin the planning for future growth of the public market. This planning effort is important in consideration of the immediate land acquisition efforts needed for the initial phase of the proj-ect. The adjacent property will never be as affordable as it is today before the market is built. Additionally, the master plan concept will offer insights, positive speculation and leverage in negotiation of shared parking and other agreements with adjacent district business and prop-erty owners.
Of note, phase II identifi es development of the site planned for parking in phase I. The master plan for this area will include the creation of open air kiosks that become wholly independent tenant spaces. They are enclosed, weather-tight, fully functioning retail spaces in a kiosk confi guration. They can be com-pletely opened up or enclosed and
offer the advantage of full utility service and a bit of autonomy from the tenants positioned directly adjacent to one another. A concept image of the kiosk is located in the appendix section of this report. The other element of new development on this same site is the development of additional storefront retail space that similar in size and design to the perimeter tenant spaces in the main market building. These spaces would be slightly larger than the 240 ten-ant module and have the same roll up door system and look of those in the main mar-ket building. Of course additional property would need to be purchased nearby to accommodate the current and increased parking requirements for the market facili-ties.
Phase III explores the development of a larger outdoor market plaza centered on a large central pedestrian plaza space that can serve as either event plaza, market parking, outdoor tenant (tent structures) confi guration or any combination of the three. It is fl anked by vehicular access drives which also serve to provide access to front door parking for new storefront re-tail space on the north side of the site and new storefront retail space carved out of the back of existing commercial buildings on the north side of 21st Street.
The master plan also serves to provide vision for the development of the market district as a whole. It is envisioned that the existing commercial properties along both sides of 21st Street North will benefi t from the development of the market in the form of new tenants and increased interest in being associated with the successful pubic market facility. This new retail activity will migrate to a lesser degree to the existing commercial properties along Market street south of 21st Street. Additionally the exist-ing commercial development along Broad-way Avenue both north and south of 21st Street will evolve into a greater and denser mix of restaurant, retail, commercial and perhaps even residential offerings.
Serving as a catalyst for development in the Nomar District, the International Public Market will provide a positive and profound impact on the commercial activity and overall success of the district.

NOMAR INTERNATIONAL PUBLIC MARKET EXECUTIVE SUMMARY
26
Concept 1BMaster Plan
Major Entry
District Icon
Gateway Plaza
Vendor Store Front
Main EntryMarket Plaza / Indoor Outdoor Stage / Outdoor Tent Spaces
Artist Medallion(TYP)
Public Market Building
ExistingBusiness
ExistingBusiness
Plaza for Markets / Onsite Parking
Future Small Business Buildings
Plaza for Markets / Onsite Parking
Future Small Business Buildings
Open Air Kiosks Conditioned
Market Building Vendor StoreFront
Future Restaurant
Vendor Store Front
Vendor Store Front
Phase IIIPhase IIPhase I

NOMAR INTERNATIONAL PUBLIC MARKET SITE ANALYSIS
1
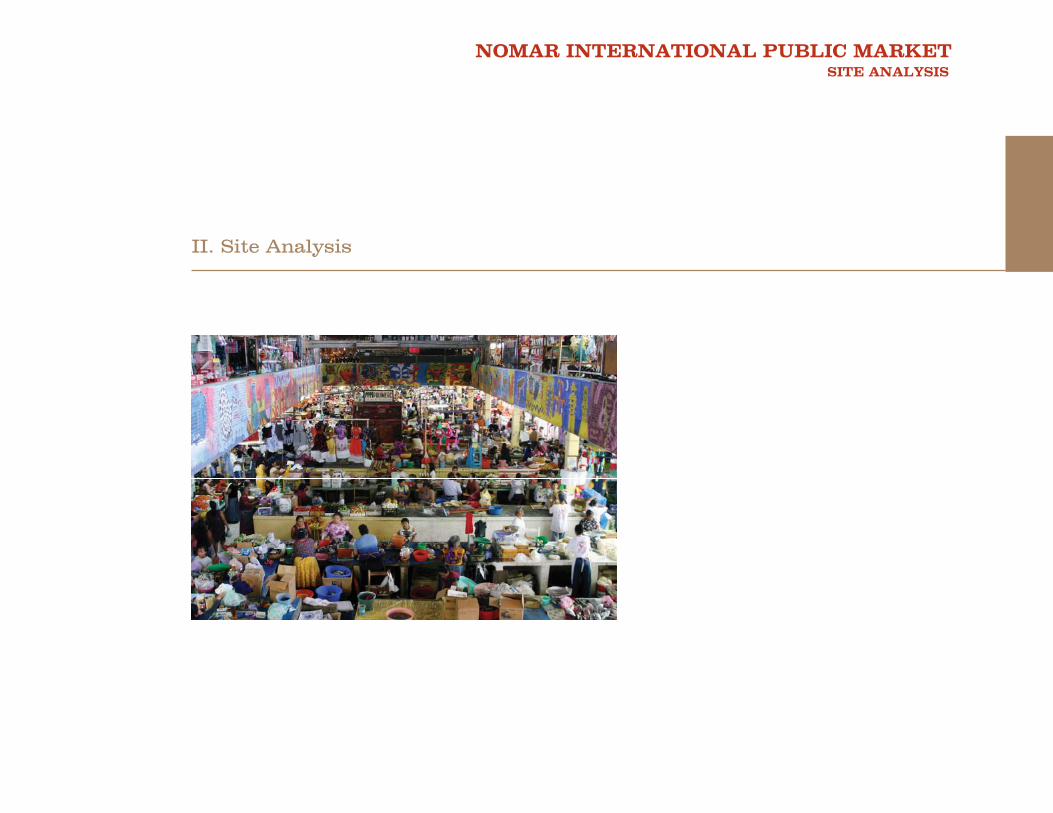
II. Site Analysis
NOMAR INTERNATIONAL PUBLIC MARKET SITE ANALYSIS
27
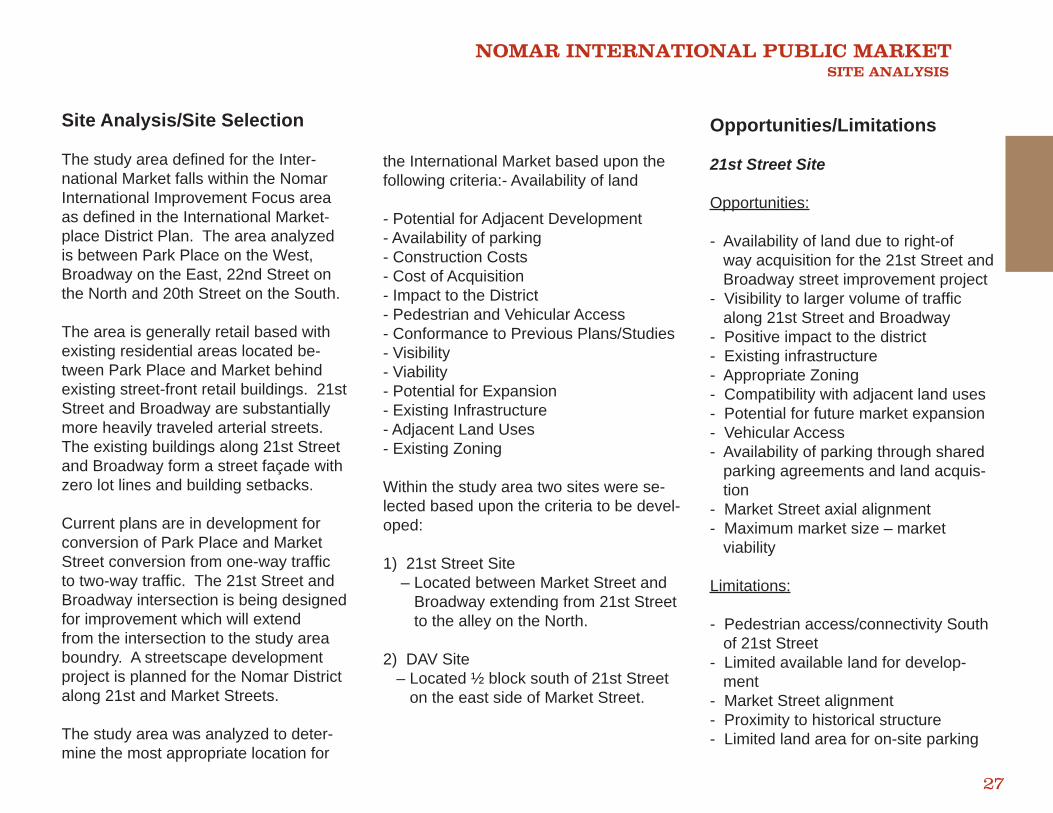
Site Analysis/Site Selection
The study area defi ned for the Inter-national Market falls within the Nomar International Improvement Focus area as defi ned in the International Market-place District Plan. The area analyzed is between Park Place on the West, Broadway on the East, 22nd Street on the North and 20th Street on the South.
The area is generally retail based with existing residential areas located be-tween Park Place and Market behind existing street-front retail buildings. 21st Street and Broadway are substantially more heavily traveled arterial streets. The existing buildings along 21st Street and Broadway form a street façade with zero lot lines and building setbacks.
Current plans are in development for conversion of Park Place and Market Street conversion from one-way traffi c to two-way traffi c. The 21st Street and Broadway intersection is being designed for improvement which will extend from the intersection to the study area boundry. A streetscape development project is planned for the Nomar District along 21st and Market Streets.
The study area was analyzed to deter-mine the most appropriate location for
the International Market based upon the following criteria:- Availability of land - Potential for Adjacent Development- Availability of parking - Construction Costs - Cost of Acquisition - Impact to the District- Pedestrian and Vehicular Access - Conformance to Previous Plans/Studies- Visibility - Viability - Potential for Expansion - Existing Infrastructure- Adjacent Land Uses - Existing Zoning
Within the study area two sites were se-lected based upon the criteria to be devel-oped:
1) 21st Street Site – Located between Market Street and Broadway extending from 21st Street to the alley on the North.
2) DAV Site – Located ½ block south of 21st Street on the east side of Market Street.
Opportunities/Limitations
21st Street Site
Opportunities:
- Availability of land due to right-of way acquisition for the 21st Street and Broadway street improvement project- Visibility to larger volume of traffi c along 21st Street and Broadway- Positive impact to the district- Existing infrastructure- Appropriate Zoning- Compatibility with adjacent land uses- Potential for future market expansion- Vehicular Access- Availability of parking through shared parking agreements and land acquis- tion- Market Street axial alignment- Maximum market size – market viability
Limitations:
- Pedestrian access/connectivity South of 21st Street- Limited available land for develop- ment- Market Street alignment- Proximity to historical structure- Limited land area for on-site parking
NOMAR INTERNATIONAL PUBLIC MARKET SITE ANALYSIS
28
Opportunities/Limitations
DAV Site
Opportunities:
- Pedestrian Access - Availability of parking through shared parking agreements- Existing Infrastructure- Existing Building- Appropriate Zoning- Conformance with previous plans studies- Potential for adjacent development- Conversion of Market Street to two- way traffi c- Vehicular Access
Limitations:
- Cost of land acquisition- Poor visibility from 21st Street and Broadway- Cost of building rehabilitation- Limited expansion opportunities- Adjacent land uses- Maximum market size – market viability - Limited land area for on-site parking
Site
NOMAR INTERNATIONAL PUBLIC MARKET SITE ANALYSIS
29
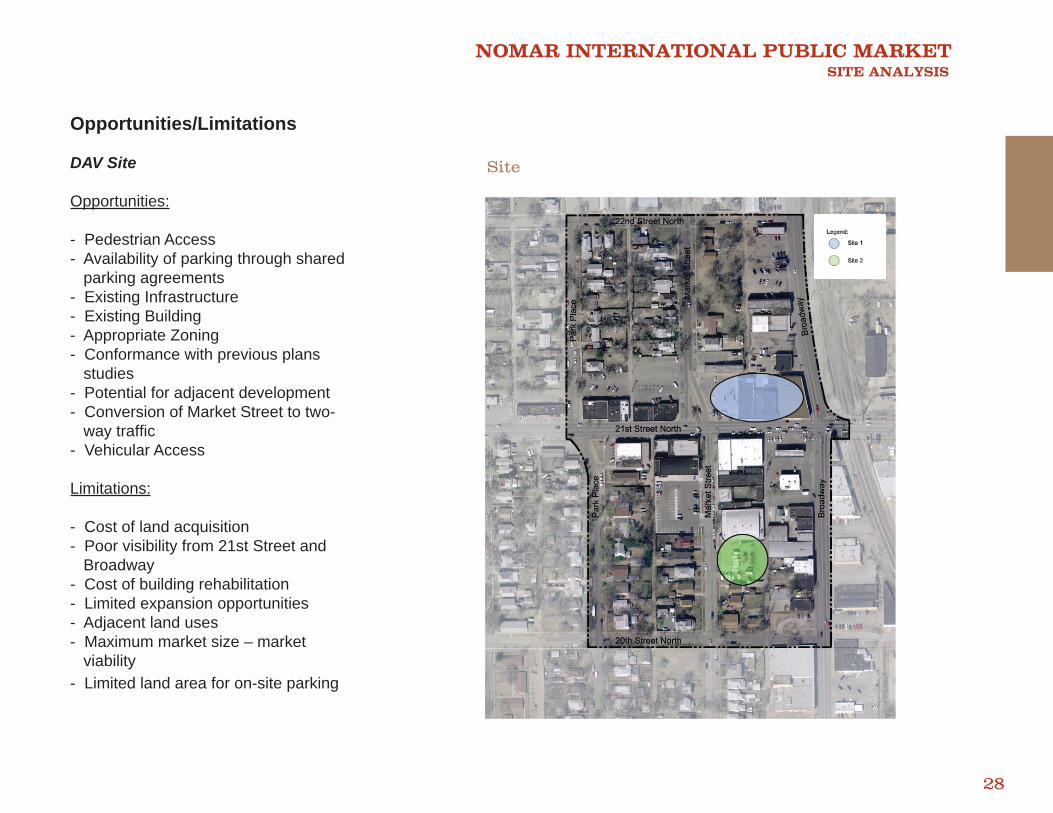
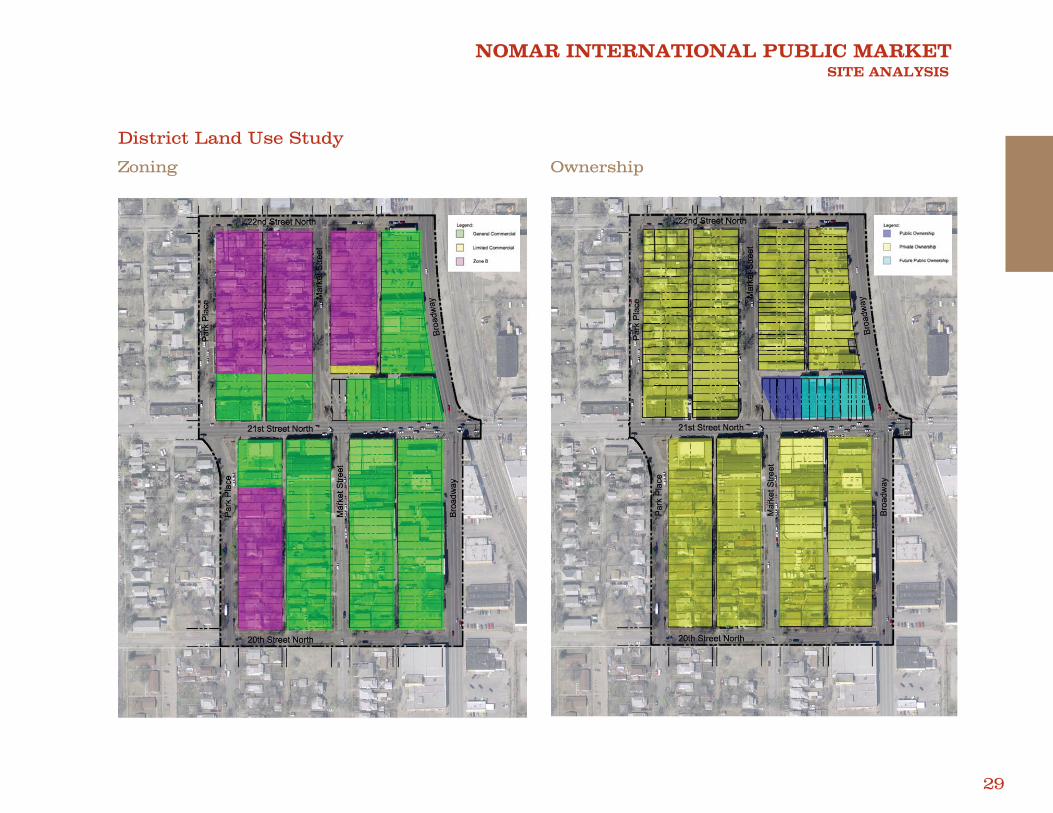
Zoning Ownership
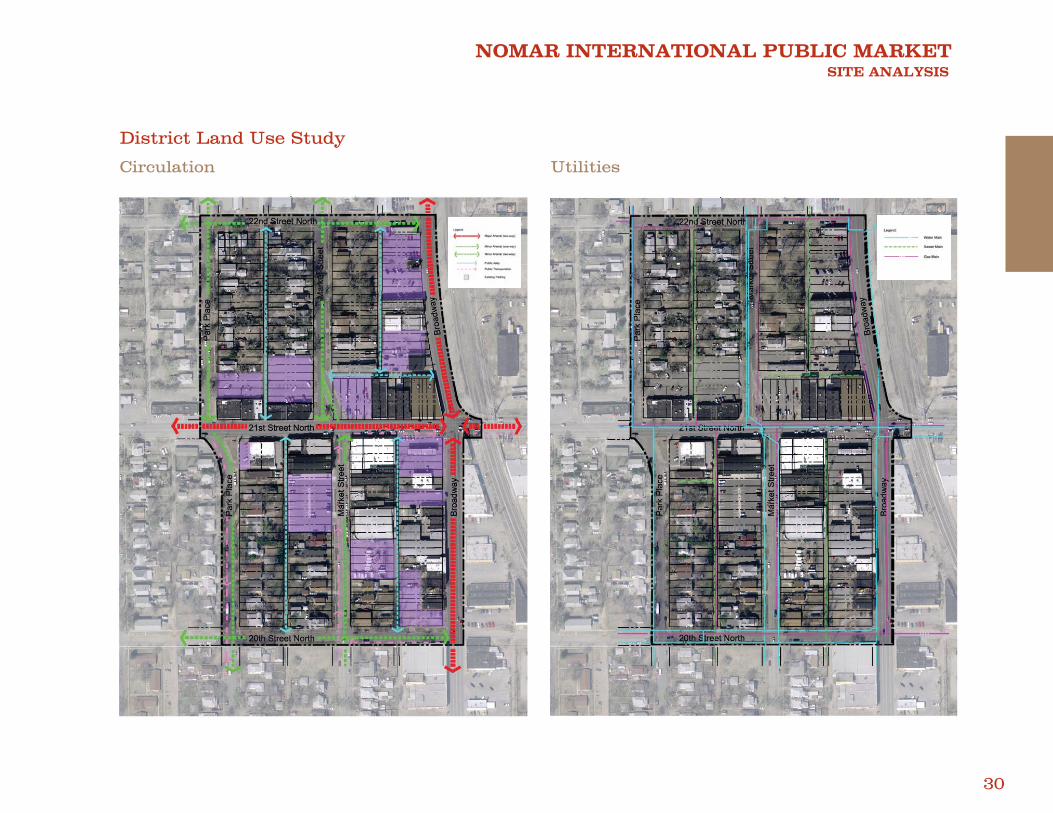
District Land Use Study
NOMAR INTERNATIONAL PUBLIC MARKET SITE ANALYSIS
30
Circulation Utilities
District Land Use Study
NOMAR INTERNATIONAL PUBLIC MARKET SITE ANALYSIS
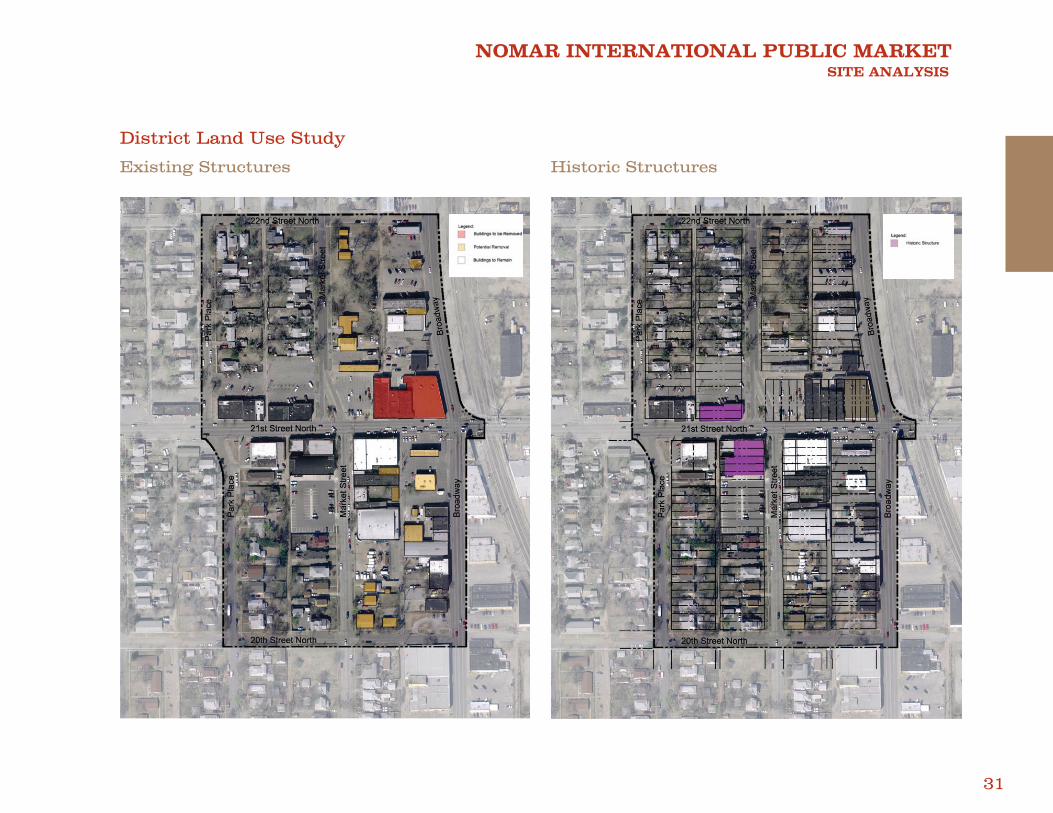
31
Existing Structures Historic Structures
District Land Use Study

NOMAR INTERNATIONAL PUBLIC MARKET MARKET ANALYSIS
1
III. Market Analysis
NOMAR INTERNATIONAL PUBLIC MARKET MARKET ANALYSIS
32
IntroductionIn this section, ERA estimates potential consumer demand for new retail de-velopment in the Nomar District. ERA collected demographic data for the rel-evant market areas, and also analyzed the tourism and visitor trends to Wichita. ERA also analyzed taxable retail sales trends and per capita spending patterns. Based on these factors, ERA calculated total demand generated by each of the major source markets, and calculated the amount of new supportable retail development currently and over the next fi ve year period.
It is important to note that the demand estimate includes the entire Nomar Dis-trict area, and is not exclusive to the No-mar International Market. The Nomar International Market may have the po-tential to capture a signifi cant share of the future retail demand, depending on the site and location, vendor demand, design, access, and other factors.
Finally, ERA also summarizes the re-sults of interviews with prospective vendors and presents a recommended tenanting strategy for the proposed No-mar International Market.
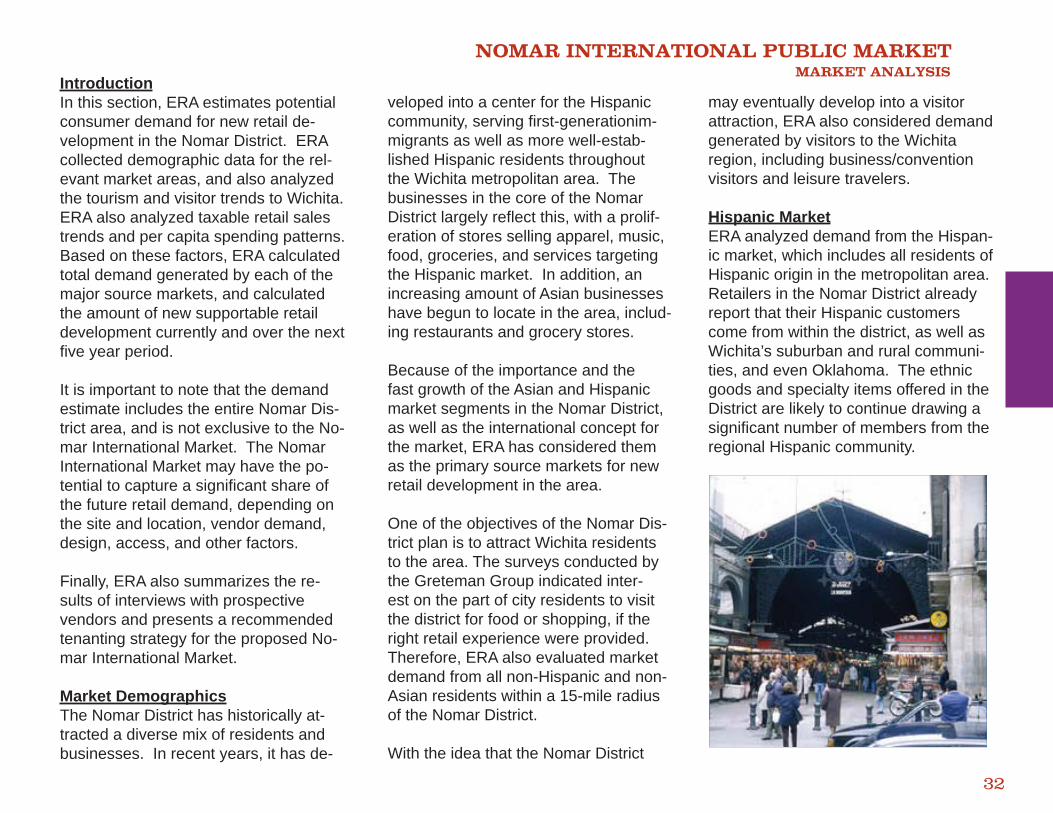
Market DemographicsThe Nomar District has historically at-tracted a diverse mix of residents andbusinesses. In recent years, it has de-
veloped into a center for the Hispaniccommunity, serving fi rst-generationim-migrants as well as more well-estab-lished Hispanic residents throughout the Wichita metropolitan area. The businesses in the core of the Nomar District largely refl ect this, with a prolif-eration of stores selling apparel, music, food, groceries, and services targeting the Hispanic market. In addition, an increasing amount of Asian businesses have begun to locate in the area, includ-ing restaurants and grocery stores.
Because of the importance and the fast growth of the Asian and Hispanic market segments in the Nomar District, as well as the international concept for the market, ERA has considered them as the primary source markets for new retail development in the area.
One of the objectives of the Nomar Dis-trict plan is to attract Wichita residents to the area. The surveys conducted by the Greteman Group indicated inter-est on the part of city residents to visit the district for food or shopping, if the right retail experience were provided. Therefore, ERA also evaluated market demand from all non-Hispanic and non-Asian residents within a 15-mile radius of the Nomar District.
With the idea that the Nomar District
may eventually develop into a visitor attraction, ERA also considered demand generated by visitors to the Wichita region, including business/convention visitors and leisure travelers.
Hispanic MarketERA analyzed demand from the Hispan-ic market, which includes all residents of Hispanic origin in the metropolitan area. Retailers in the Nomar District already report that their Hispanic customers come from within the district, as well as Wichita’s suburban and rural communi-ties, and even Oklahoma. The ethnic goods and specialty items offered in the District are likely to continue drawing a signifi cant number of members from the regional Hispanic community.
NOMAR INTERNATIONAL PUBLIC MARKET MARKET ANALYSIS
33
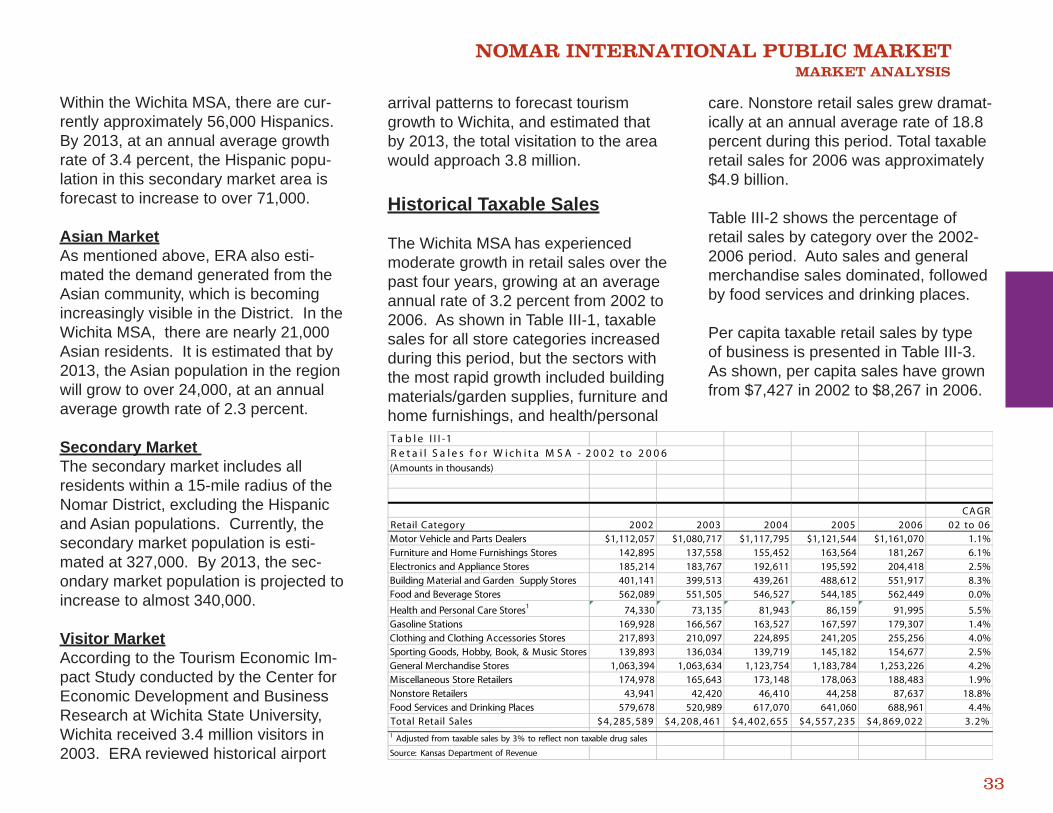
T a b l e I I I -1R e t a i l S a l e s f o r W i c h i t a M S A - 2 0 0 2 t o 2 0 0 6(Amounts in thousands)
CA GRRetail Category 2002 2003 2004 2005 2006 02 to 06Motor Vehicle and Parts Dealers $1,112,057 $1,080,717 $1,117,795 $1,121,544 $1,161,070 1.1%Furniture and Home Furnishings Stores 142,895 137,558 155,452 163,564 181,267 6.1%Electronics and Appliance Stores 185,214 183,767 192,611 195,592 204,418 2.5%Building Material and Garden Supply Stores 401,141 399,513 439,261 488,612 551,917 8.3%Food and Beverage Stores 562,089 551,505 546,527 544,185 562,449 0.0%
Health and Personal Care Stores1 74,330 73,135 81,943 86,159 91,995 5.5%Gasoline Stations 169,928 166,567 163,527 167,597 179,307 1.4%Clothing and Clothing Accessories Stores 217,893 210,097 224,895 241,205 255,256 4.0%Sporting Goods, Hobby, Book, & Music Stores 139,893 136,034 139,719 145,182 154,677 2.5%General Merchandise Stores 1,063,394 1,063,634 1,123,754 1,183,784 1,253,226 4.2%Miscellaneous Store Retailers 174,978 165,643 173,148 178,063 188,483 1.9%Nonstore Retailers 43,941 42,420 46,410 44,258 87,637 18.8%Food Services and Drinking Places 579,678 520,989 617,070 641,060 688,961 4.4%Total Retail Sales $4, 285, 589 $4, 208, 461 $4, 402, 655 $4, 557, 235 $4, 869, 022 3. 2%1 Adjusted from taxable sales by 3% to reflect non taxable drug sales
Source: Kansas Department of Revenue
Within the Wichita MSA, there are cur-rently approximately 56,000 Hispanics. By 2013, at an annual average growth rate of 3.4 percent, the Hispanic popu-lation in this secondary market area is forecast to increase to over 71,000.
Asian MarketAs mentioned above, ERA also esti-mated the demand generated from the Asian community, which is becoming increasingly visible in the District. In the Wichita MSA, there are nearly 21,000 Asian residents. It is estimated that by 2013, the Asian population in the region will grow to over 24,000, at an annual average growth rate of 2.3 percent.
Secondary Market The secondary market includes all residents within a 15-mile radius of the Nomar District, excluding the Hispanicand Asian populations. Currently, the secondary market population is esti-mated at 327,000. By 2013, the sec-ondary market population is projected to increase to almost 340,000.
Visitor MarketAccording to the Tourism Economic Im-pact Study conducted by the Center for Economic Development and Business Research at Wichita State University, Wichita received 3.4 million visitors in 2003. ERA reviewed historical airport
arrival patterns to forecast tourism growth to Wichita, and estimated that by 2013, the total visitation to the area would approach 3.8 million.
Historical Taxable Sales
The Wichita MSA has experienced moderate growth in retail sales over the past four years, growing at an average annual rate of 3.2 percent from 2002 to 2006. As shown in Table III-1, taxable sales for all store categories increased during this period, but the sectors with the most rapid growth included building materials/garden supplies, furniture and home furnishings, and health/personal
care. Nonstore retail sales grew dramat-ically at an annual average rate of 18.8 percent during this period. Total taxable retail sales for 2006 was approximately $4.9 billion.
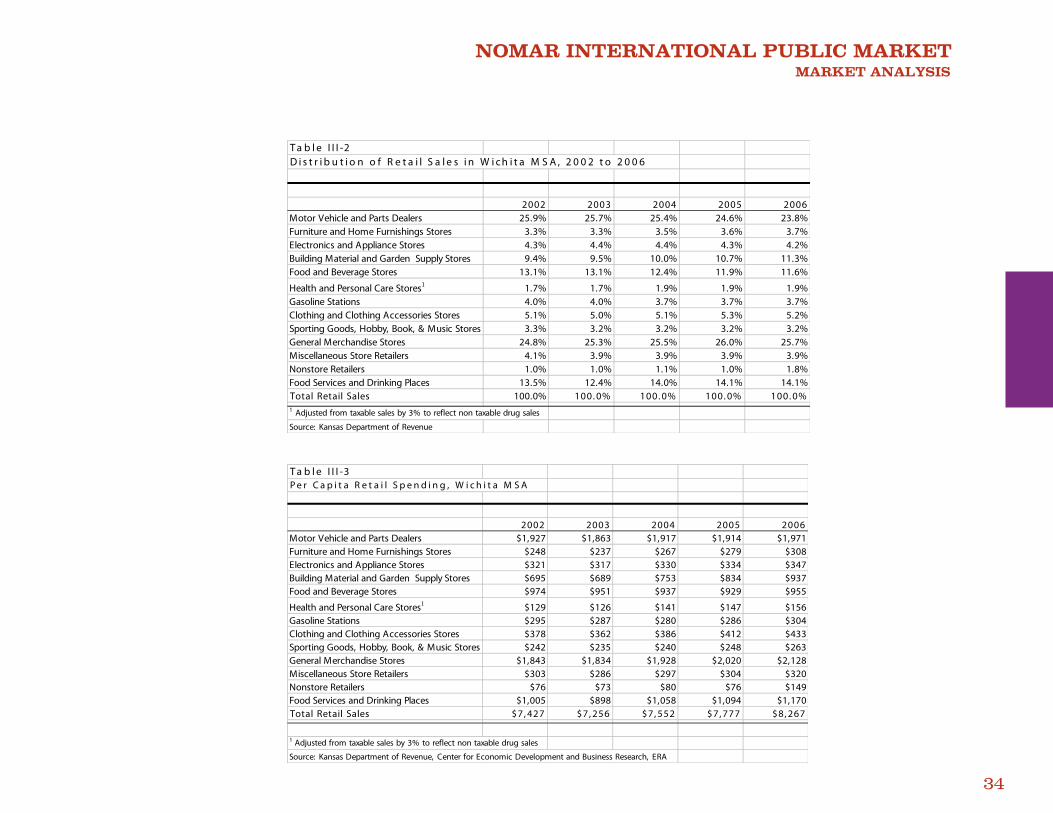
Table III-2 shows the percentage of retail sales by category over the 2002-2006 period. Auto sales and general merchandise sales dominated, followed by food services and drinking places.
Per capita taxable retail sales by type of business is presented in Table III-3. As shown, per capita sales have grown from $7,427 in 2002 to $8,267 in 2006.
NOMAR INTERNATIONAL PUBLIC MARKET MARKET ANALYSIS
34
T a b l e I I I -2D i s t r i b u t i o n o f R e t a i l S a l e s i n W i c h i t a M S A , 2 0 0 2 t o 2 0 0 6
2002 2003 2004 2005 2006Motor Vehicle and Parts Dealers 25.9% 25.7% 25.4% 24.6% 23.8%Furniture and Home Furnishings Stores 3.3% 3.3% 3.5% 3.6% 3.7%Electronics and Appliance Stores 4.3% 4.4% 4.4% 4.3% 4.2%Building Material and Garden Supply Stores 9.4% 9.5% 10.0% 10.7% 11.3%Food and Beverage Stores 13.1% 13.1% 12.4% 11.9% 11.6%
Health and Personal Care Stores1 1.7% 1.7% 1.9% 1.9% 1.9%Gasoline Stations 4.0% 4.0% 3.7% 3.7% 3.7%Clothing and Clothing Accessories Stores 5.1% 5.0% 5.1% 5.3% 5.2%Sporting Goods, Hobby, Book, & Music Stores 3.3% 3.2% 3.2% 3.2% 3.2%General Merchandise Stores 24.8% 25.3% 25.5% 26.0% 25.7%Miscellaneous Store Retailers 4.1% 3.9% 3.9% 3.9% 3.9%Nonstore Retailers 1.0% 1.0% 1.1% 1.0% 1.8%Food Services and Drinking Places 13.5% 12.4% 14.0% 14.1% 14.1%Total Retail Sales 100.0% 100. 0% 100. 0% 100. 0% 100. 0%1 Adjusted from taxable sales by 3% to reflect non taxable drug sales
Source: Kansas Department of Revenue
T a b l e I I I -3P e r C a p i t a R e t a i l S p e n d i n g , W i c h i t a M S A
2002 2003 2004 2005 2006Motor Vehicle and Parts Dealers $1,927 $1,863 $1,917 $1,914 $1,971Furniture and Home Furnishings Stores $248 $237 $267 $279 $308Electronics and Appliance Stores $321 $317 $330 $334 $347Building Material and Garden Supply Stores $695 $689 $753 $834 $937Food and Beverage Stores $974 $951 $937 $929 $955
Health and Personal Care Stores1 $129 $126 $141 $147 $156Gasoline Stations $295 $287 $280 $286 $304Clothing and Clothing Accessories Stores $378 $362 $386 $412 $433Sporting Goods, Hobby, Book, & Music Stores $242 $235 $240 $248 $263General Merchandise Stores $1,843 $1,834 $1,928 $2,020 $2,128Miscellaneous Store Retailers $303 $286 $297 $304 $320Nonstore Retailers $76 $73 $80 $76 $149Food Services and Drinking Places $1,005 $898 $1,058 $1,094 $1,170Total Retail Sales $7, 427 $7, 256 $7, 552 $7, 777 $8, 267
1 Adjusted from taxable sales by 3% to reflect non taxable drug sales
Source: Kansas Department of Revenue, Center for Economic Development and Business Research, ERA
NOMAR INTERNATIONAL PUBLIC MARKET MARKET ANALYSIS
35
Retail Demand Forecast
ERA estimated current retail spending and forecast future retail spending for all of the market segments: the Hispanic market, the Asian market, the secondary market, and the tourist market. Current demand estimates were based on 2006 population estimates and per-capita spending. Forecasts of incremental demand from 2006 to 2013 were based on population estimates and per-capita spending rates by retail sector, adjusting for income growth. ERA then calculated total current sup-portable space in the Nomar District based on projected retail sales capture for current and future demand, and the estimated sales volume per square foot per year by retail sector.
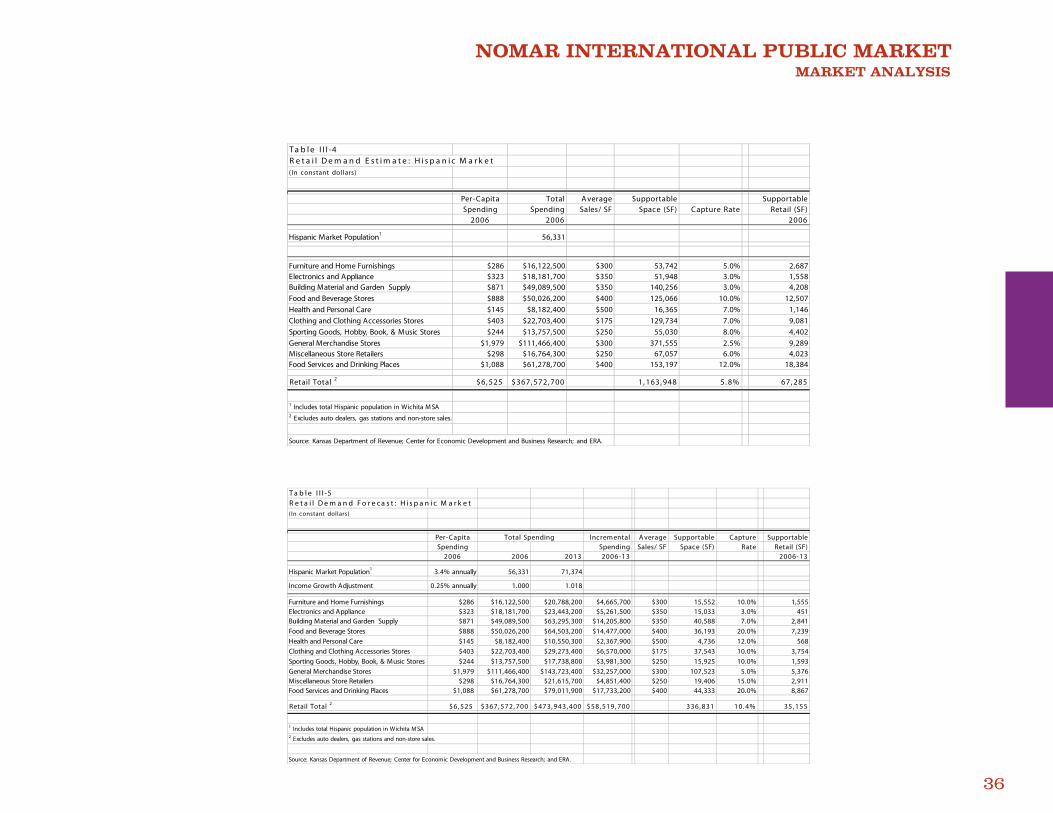
Hispanic MarketWith total per capita retail spending estimated at about $6,500 and a market of about 56,000 people, ERA estimates that Wichita area Hispanics have total retail spending potential of approximate-ly $368 million in 2006. This translates to supportable retail space of 1.2 million square feet. Applying capture rates to each category, with the ethnic chararac-ter of the Nomar District, ERA estimates that the district could capture about 5.8 percent of the retail purchases of the area’s Hispanic population (see Table
III-4).
As the Nomar District matures and the Hispanic population grows in the re-gion, the district will be poised capture a greater percentage of the incremental retail demand generated by the His-panic market. From 2007 to 2013, the District could capture more than 10 percent of the incremental demand for retail space from the Hispanic market (see Table III-5).
Asian MarketThe estimated per-capita spending from the Asian market is about $6,700, with a total population of almost 21,000. Therefore, Wichita’s Asian population has a current spending potential of $138 million, translation to almost 440,000 square feet of retail space. ERA es-timates that the district can capture about 5.7 percent of the current demand (Table III-6).
The growth in the Asian population from 2007 to 2013 will spur incremental retail demand of $15 million, equivalent to 86,000 square feet of retail. ERA esti-mates that the Nomar District could cap-ture nearly 11 percent of this new retail demand from the Asian market segment (Table III-7)
Secondary Market The secondary market population is about 327,000. Based on an assump-tion of per-capita spending of $7,000, the spending power of the secondary market is almost $2.4 billion, supporting more than seven million square feet of retail. The Nomar District could conser-vatively capture 0.6 percent of the exist-ing demand generated by the second-ary market (Table III-8).
The secondary market will grow by 13,000 from 2007 to 2013, generating incremental demand of $95 million to support an additional 426,000 square feet of retail development. ERA esti-mates that the Nomar District can cap-ture slightly less than two percent of this incremental demand (Table III-9).
NOMAR INTERNATIONAL PUBLIC MARKET MARKET ANALYSIS
36
T a b l e I I I -4R e t a i l D e m a n d E s t i m a t e : H i s p a n i c M a r k e t( In constant dollars)
Per-Capita Total A verage Supportable SupportableSpending Spending Sales/ SF Space (SF) Capture Rate Retail (SF)
2006 2006 2006
Hispanic Market Population1 56,331
Furniture and Home Furnishings $286 $16,122,500 $300 53,742 5.0% 2,687Electronics and Appliance $323 $18,181,700 $350 51,948 3.0% 1,558Building Material and Garden Supply $871 $49,089,500 $350 140,256 3.0% 4,208Food and Beverage Stores $888 $50,026,200 $400 125,066 10.0% 12,507Health and Personal Care $145 $8,182,400 $500 16,365 7.0% 1,146Clothing and Clothing Accessories Stores $403 $22,703,400 $175 129,734 7.0% 9,081Sporting Goods, Hobby, Book, & Music Stores $244 $13,757,500 $250 55,030 8.0% 4,402General Merchandise Stores $1,979 $111,466,400 $300 371,555 2.5% 9,289Miscellaneous Store Retailers $298 $16,764,300 $250 67,057 6.0% 4,023Food Services and Drinking Places $1,088 $61,278,700 $400 153,197 12.0% 18,384
Retail Total 2 $6, 525 $367, 572, 700 1, 163, 948 5. 8% 67, 285
1 Includes total Hispanic population in Wichita M SA2 Excludes auto dealers, gas stations and non-store sales.
Source: Kansas Department of Revenue; Center for Economic Development and Business Research; and ERA.
T a b l e I I I -5R e t a i l D e m a n d F o r e c a s t : H i s p a n i c M a r k e t( In constant dollars)
Per-Capita Incremental A verage Supportable Capture SupportableSpending Spending Sales/ SF Space (SF) Rate Retail (SF)
2006 2006 2013 2006-13 2006-13
Hispanic Market Population1 3.4% annually 56,331 71,374
Income Growth Adjustment 0.25% annually 1.000 1.018
Furniture and Home Furnishings $286 $16,122,500 $20,788,200 $4,665,700 $300 15,552 10.0% 1,555Electronics and Appliance $323 $18,181,700 $23,443,200 $5,261,500 $350 15,033 3.0% 451Building Material and Garden Supply $871 $49,089,500 $63,295,300 $14,205,800 $350 40,588 7.0% 2,841Food and Beverage Stores $888 $50,026,200 $64,503,200 $14,477,000 $400 36,193 20.0% 7,239Health and Personal Care $145 $8,182,400 $10,550,300 $2,367,900 $500 4,736 12.0% 568Clothing and Clothing Accessories Stores $403 $22,703,400 $29,273,400 $6,570,000 $175 37,543 10.0% 3,754Sporting Goods, Hobby, Book, & Music Stores $244 $13,757,500 $17,738,800 $3,981,300 $250 15,925 10.0% 1,593General Merchandise Stores $1,979 $111,466,400 $143,723,400 $32,257,000 $300 107,523 5.0% 5,376Miscellaneous Store Retailers $298 $16,764,300 $21,615,700 $4,851,400 $250 19,406 15.0% 2,911Food Services and Drinking Places $1,088 $61,278,700 $79,011,900 $17,733,200 $400 44,333 20.0% 8,867
Retail Total 2 $6, 525 $367, 572, 700 $473, 943, 400 $58, 519, 700 336, 831 10. 4% 35, 155
1 Includes total Hispanic population in Wichita M SA2 Excludes auto dealers, gas stations and non-store sales.
Source: Kansas Department of Revenue; Center for Economic Development and Business Research; and ERA.
Total Spending

NOMAR INTERNATIONAL PUBLIC MARKET MARKET ANALYSIS
37
T a b l e I I I -6R e t a i l D e m a n d E s t i m a t e : A s i a n M a r k e t( In constant dollars)
Per-Capita Total A verage Supportable SupportableSpending Spending Sales/ SF Space (SF) Capture Rate Retail (SF)
2006 2006 2006
Asian Market Population1 20,752
Furniture and Home Furnishings $292 $6,067,200 $300 20,224 5.0% 1,011Electronics and Appliance $330 $6,842,100 $350 19,549 3.0% 586Building Material and Garden Supply $890 $18,473,200 $350 52,781 3.0% 1,583Food and Beverage Stores $907 $18,825,700 $400 47,064 10.0% 4,706Health and Personal Care $148 $3,079,200 $500 6,158 7.0% 431Clothing and Clothing Accessories Stores $412 $8,543,700 $175 48,821 7.0% 3,417Sporting Goods, Hobby, Book, & Music Stores $249 $5,177,200 $250 20,709 8.0% 1,657General Merchandise Stores $2,021 $41,946,700 $300 139,822 2.5% 3,496Miscellaneous Store Retailers $304 $6,308,700 $250 25,235 5.0% 1,262Food Services and Drinking Places $1,111 $23,060,200 $400 57,651 12.0% 6,918
Retail Total 2 $6, 666 $138, 323, 800 438, 014 5. 7% 25, 068
1 Includes total Asian population in Wichita M SA2 Excludes auto dealers, gas stations and non-store sales.
Source: Kansas Department of Revenue; Center for Economic Development and Business Research; and ERA.
T a b l e I I I -7R e t a i l D e m a n d F o r e c a s t : A s i a n M a r k e t( In constant dollars)
Per-Capita Incremental A verage Supportable Capture SupportableSpending Spending Sales/ SF Space (SF) Rate Retail (SF)
2006 2006 2013 2006-13 2006-13
Asian Market Population1 2.3% annually 20,752 24,387
Income Growth Adjustment 0.3% annually 1.000 1.018
Furniture and Home Furnishings $292 $6,067,200 $7,255,600 $1,188,400 $300 3,961 15.0% 594Electronics and Appliance $330 $6,842,100 $8,182,300 $1,340,200 $350 3,829 7.0% 268Building Material and Garden Supply $890 $18,473,200 $22,091,700 $3,618,500 $350 10,339 10.0% 1,034Food and Beverage Stores $907 $18,825,700 $22,513,300 $3,687,600 $400 9,219 15.0% 1,383Health and Personal Care $148 $3,079,200 $3,682,300 $603,100 $500 1,206 12.0% 145Clothing and Clothing Accessories Stores $412 $8,543,700 $10,217,200 $1,673,500 $175 9,563 8.0% 765Sporting Goods, Hobby, Book, & Music Stores $249 $5,177,200 $6,191,300 $1,014,100 $250 4,056 12.0% 487General Merchandise Stores $2,021 $41,946,700 $50,163,100 $8,216,400 $300 27,388 7.0% 1,917Miscellaneous Store Retailers $304 $6,308,700 $7,544,400 $1,235,700 $250 4,943 10.0% 494Food Services and Drinking Places $1,111 $23,060,200 $27,577,200 $4,517,000 $400 11,293 20.0% 2,259
Retail Total 2 $6, 666 $138, 323, 800 $165, 418, 400 $15, 270, 000 85, 797 10. 9% 9, 345
1 Includes total Asian population in Wichita M SA2 Excludes auto dealers, gas stations and non-store sales.
Source: Kansas Department of Revenue; Center for Economic Development and Business Research; and ERA.
Total Spending
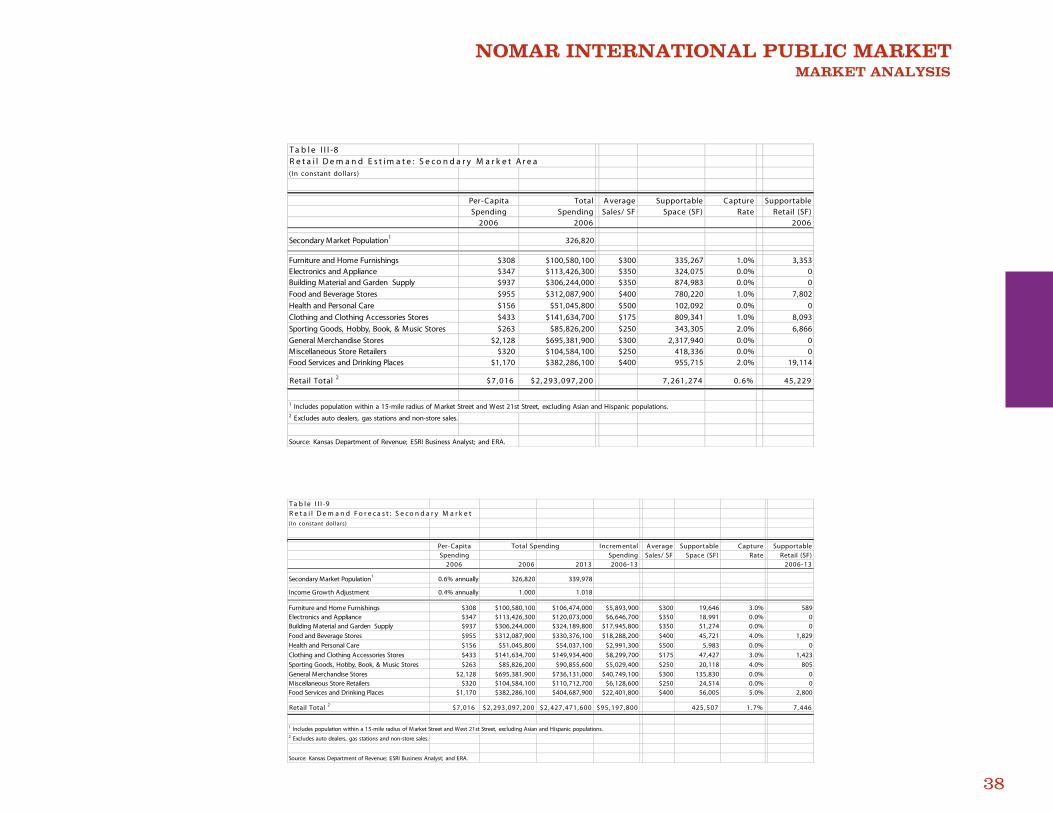
NOMAR INTERNATIONAL PUBLIC MARKET MARKET ANALYSIS
38
T a b l e I I I -8R e t a i l D e m a n d E s t i m a t e : S e c o n d a r y M a r k e t A r e a( In constant dollars)
Per-Capita Total A verage Supportable Capture SupportableSpending Spending Sales/ SF Space (SF) Rate Retail (SF)
2006 2006 2006
Secondary Market Population1 326,820
Furniture and Home Furnishings $308 $100,580,100 $300 335,267 1.0% 3,353Electronics and Appliance $347 $113,426,300 $350 324,075 0.0% 0Building Material and Garden Supply $937 $306,244,000 $350 874,983 0.0% 0Food and Beverage Stores $955 $312,087,900 $400 780,220 1.0% 7,802Health and Personal Care $156 $51,045,800 $500 102,092 0.0% 0Clothing and Clothing Accessories Stores $433 $141,634,700 $175 809,341 1.0% 8,093Sporting Goods, Hobby, Book, & Music Stores $263 $85,826,200 $250 343,305 2.0% 6,866General Merchandise Stores $2,128 $695,381,900 $300 2,317,940 0.0% 0Miscellaneous Store Retailers $320 $104,584,100 $250 418,336 0.0% 0Food Services and Drinking Places $1,170 $382,286,100 $400 955,715 2.0% 19,114
Retail Total 2 $7, 016 $2, 293, 097, 200 7, 261, 274 0. 6% 45, 229
1 Includes population within a 15-mile radius of M arket Street and West 21st Street, excluding Asian and Hispanic populations.2 Excludes auto dealers, gas stations and non-store sales.
Source: Kansas Department of Revenue; ESRI Business Analyst; and ERA.
T a b l e I I I -9R e t a i l D e m a n d F o r e c a s t : S e c o n d a r y M a r k e t( In constant dollars)
Per-Capita Incremental A verage Supportable Capture SupportableSpending Spending Sales/ SF Space (SF) Rate Retail (SF)
2006 2006 2013 2006-13 2006-13
Secondary Market Population1 0.6% annually 326,820 339,978
Income Growth Adjustment 0.4% annually 1.000 1.018
Furniture and Home Furnishings $308 $100,580,100 $106,474,000 $5,893,900 $300 19,646 3.0% 589Electronics and Appliance $347 $113,426,300 $120,073,000 $6,646,700 $350 18,991 0.0% 0Building Material and Garden Supply $937 $306,244,000 $324,189,800 $17,945,800 $350 51,274 0.0% 0Food and Beverage Stores $955 $312,087,900 $330,376,100 $18,288,200 $400 45,721 4.0% 1,829Health and Personal Care $156 $51,045,800 $54,037,100 $2,991,300 $500 5,983 0.0% 0Clothing and Clothing Accessories Stores $433 $141,634,700 $149,934,400 $8,299,700 $175 47,427 3.0% 1,423Sporting Goods, Hobby, Book, & Music Stores $263 $85,826,200 $90,855,600 $5,029,400 $250 20,118 4.0% 805General Merchandise Stores $2,128 $695,381,900 $736,131,000 $40,749,100 $300 135,830 0.0% 0Miscellaneous Store Retailers $320 $104,584,100 $110,712,700 $6,128,600 $250 24,514 0.0% 0Food Services and Drinking Places $1,170 $382,286,100 $404,687,900 $22,401,800 $400 56,005 5.0% 2,800
Retail Total 2 $7, 016 $2, 293, 097, 200 $2, 427, 471, 600 $95, 197, 800 425, 507 1. 7% 7, 446
1 Includes population within a 15-mile radius of M arket Street and West 21st Street, excluding Asian and Hispanic populations.2 Excludes auto dealers, gas stations and non-store sales.
Source: Kansas Department of Revenue; ESRI Business Analyst; and ERA.
Total Spending
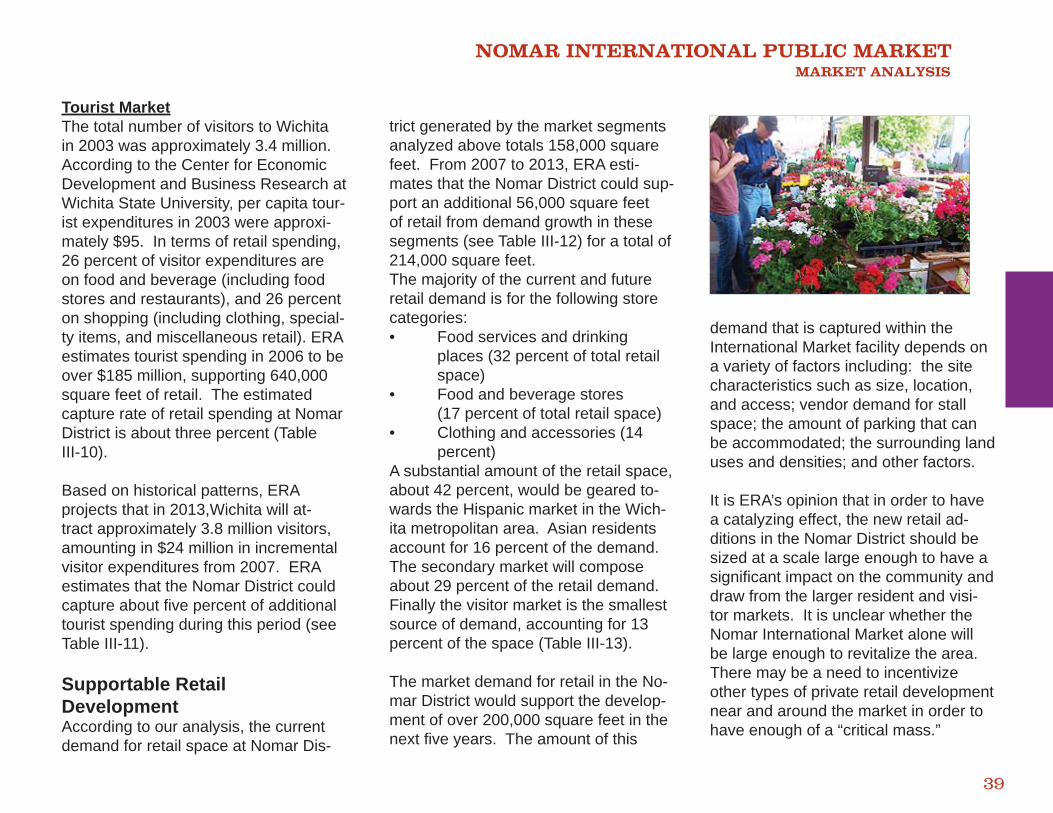
NOMAR INTERNATIONAL PUBLIC MARKET MARKET ANALYSIS
39
Tourist MarketThe total number of visitors to Wichita in 2003 was approximately 3.4 million. According to the Center for Economic Development and Business Research at Wichita State University, per capita tour-ist expenditures in 2003 were approxi-mately $95. In terms of retail spending, 26 percent of visitor expenditures are on food and beverage (including food stores and restaurants), and 26 percent on shopping (including clothing, special-ty items, and miscellaneous retail). ERA estimates tourist spending in 2006 to be over $185 million, supporting 640,000 square feet of retail. The estimated capture rate of retail spending at Nomar District is about three percent (Table III-10).
Based on historical patterns, ERA projects that in 2013,Wichita will at-tract approximately 3.8 million visitors, amounting in $24 million in incremental visitor expenditures from 2007. ERA estimates that the Nomar District could capture about fi ve percent of additional tourist spending during this period (see Table III-11).
Supportable Retail DevelopmentAccording to our analysis, the current demand for retail space at Nomar Dis-
trict generated by the market segments analyzed above totals 158,000 square feet. From 2007 to 2013, ERA esti-mates that the Nomar District could sup-port an additional 56,000 square feet of retail from demand growth in these segments (see Table III-12) for a total of 214,000 square feet. The majority of the current and future retail demand is for the following store categories: • Food services and drinking places (32 percent of total retail space)• Food and beverage stores (17 percent of total retail space)• Clothing and accessories (14 percent)A substantial amount of the retail space, about 42 percent, would be geared to-wards the Hispanic market in the Wich-ita metropolitan area. Asian residents account for 16 percent of the demand. The secondary market will compose about 29 percent of the retail demand. Finally the visitor market is the smallest source of demand, accounting for 13 percent of the space (Table III-13).
The market demand for retail in the No-mar District would support the develop-ment of over 200,000 square feet in the next fi ve years. The amount of this
demand that is captured within the International Market facility depends on a variety of factors including: the site characteristics such as size, location, and access; vendor demand for stall space; the amount of parking that can be accommodated; the surrounding land uses and densities; and other factors.
It is ERA’s opinion that in order to have a catalyzing effect, the new retail ad-ditions in the Nomar District should be sized at a scale large enough to have a signifi cant impact on the community and draw from the larger resident and visi-tor markets. It is unclear whether the Nomar International Market alone will be large enough to revitalize the area. There may be a need to incentivize other types of private retail development near and around the market in order to have enough of a “critical mass.”
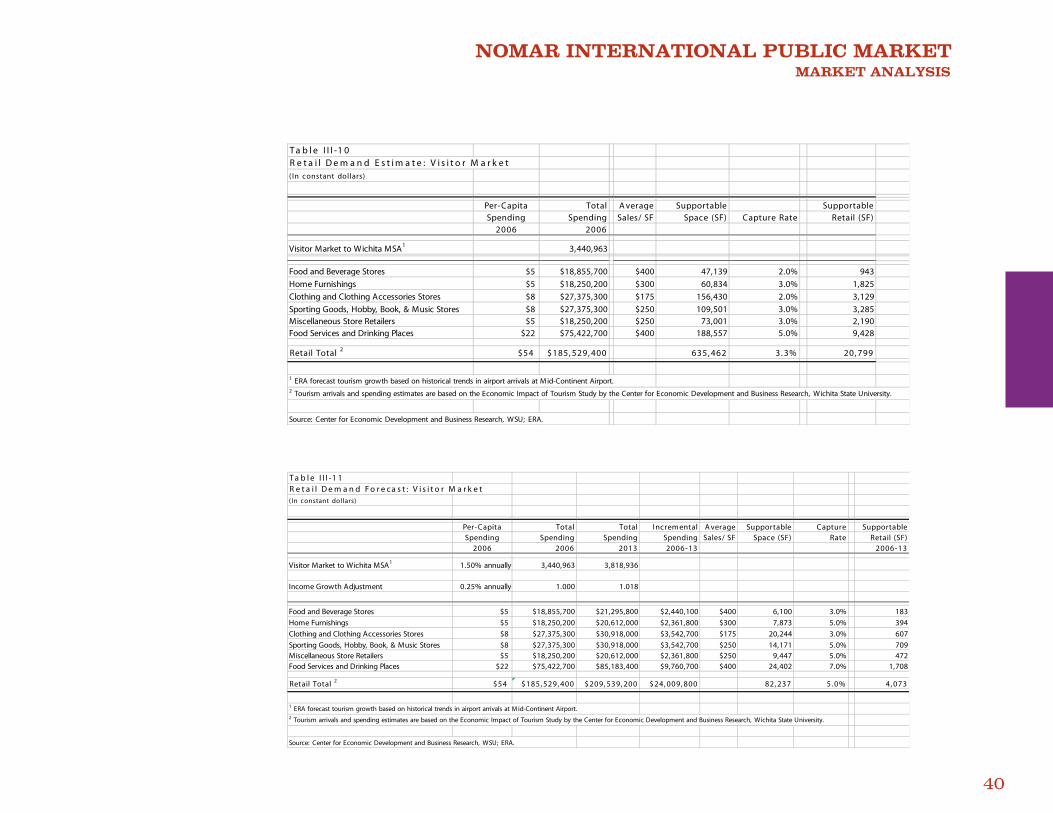
NOMAR INTERNATIONAL PUBLIC MARKET MARKET ANALYSIS
40
T a b l e I I I -1 0R e t a i l D e m a n d E s t i m a t e : V i s i t o r M a r k e t( In constant dollars)
Per-Capita Total A verage Supportable SupportableSpending Spending Sales/ SF Space (SF) Capture Rate Retail (SF)
2006 2006
Visitor Market to Wichita MSA1 3,440,963
Food and Beverage Stores $5 $18,855,700 $400 47,139 2.0% 943Home Furnishings $5 $18,250,200 $300 60,834 3.0% 1,825Clothing and Clothing Accessories Stores $8 $27,375,300 $175 156,430 2.0% 3,129Sporting Goods, Hobby, Book, & Music Stores $8 $27,375,300 $250 109,501 3.0% 3,285Miscellaneous Store Retailers $5 $18,250,200 $250 73,001 3.0% 2,190Food Services and Drinking Places $22 $75,422,700 $400 188,557 5.0% 9,428
Retail Total 2 $54 $185, 529, 400 635, 462 3. 3% 20, 799
1 ERA forecast tourism growth based on historical trends in airport arrivals at M id-Continent Airport.2 Tourism arrivals and spending estimates are based on the Economic Impact of Tourism Study by the Center for Economic Development and Business Research, Wichita State University.
Source: Center for Economic Development and Business Research, WSU; ERA.
T a b l e I I I -1 1R e t a i l D e m a n d F o r e c a s t : V i s i t o r M a r k e t( In constant dollars)
Per-Capita Total Total Incremental A verage Supportable Capture SupportableSpending Spending Spending Spending Sales/ SF Space (SF) Rate Retail (SF)
2006 2006 2013 2006-13 2006-13
Visitor Market to Wichita MSA1 1.50% annually 3,440,963 3,818,936
Income Growth Adjustment 0.25% annually 1.000 1.018
Food and Beverage Stores $5 $18,855,700 $21,295,800 $2,440,100 $400 6,100 3.0% 183Home Furnishings $5 $18,250,200 $20,612,000 $2,361,800 $300 7,873 5.0% 394Clothing and Clothing Accessories Stores $8 $27,375,300 $30,918,000 $3,542,700 $175 20,244 3.0% 607Sporting Goods, Hobby, Book, & Music Stores $8 $27,375,300 $30,918,000 $3,542,700 $250 14,171 5.0% 709Miscellaneous Store Retailers $5 $18,250,200 $20,612,000 $2,361,800 $250 9,447 5.0% 472Food Services and Drinking Places $22 $75,422,700 $85,183,400 $9,760,700 $400 24,402 7.0% 1,708
Retail Total 2 $54 $185, 529, 400 $209, 539, 200 $24, 009, 800 82, 237 5. 0% 4, 073
1 ERA forecast tourism growth based on historical trends in airport arrivals at M id-Continent Airport.2 Tourism arrivals and spending estimates are based on the Economic Impact of Tourism Study by the Center for Economic Development and Business Research, Wichita State University.
Source: Center for Economic Development and Business Research, WSU; ERA.
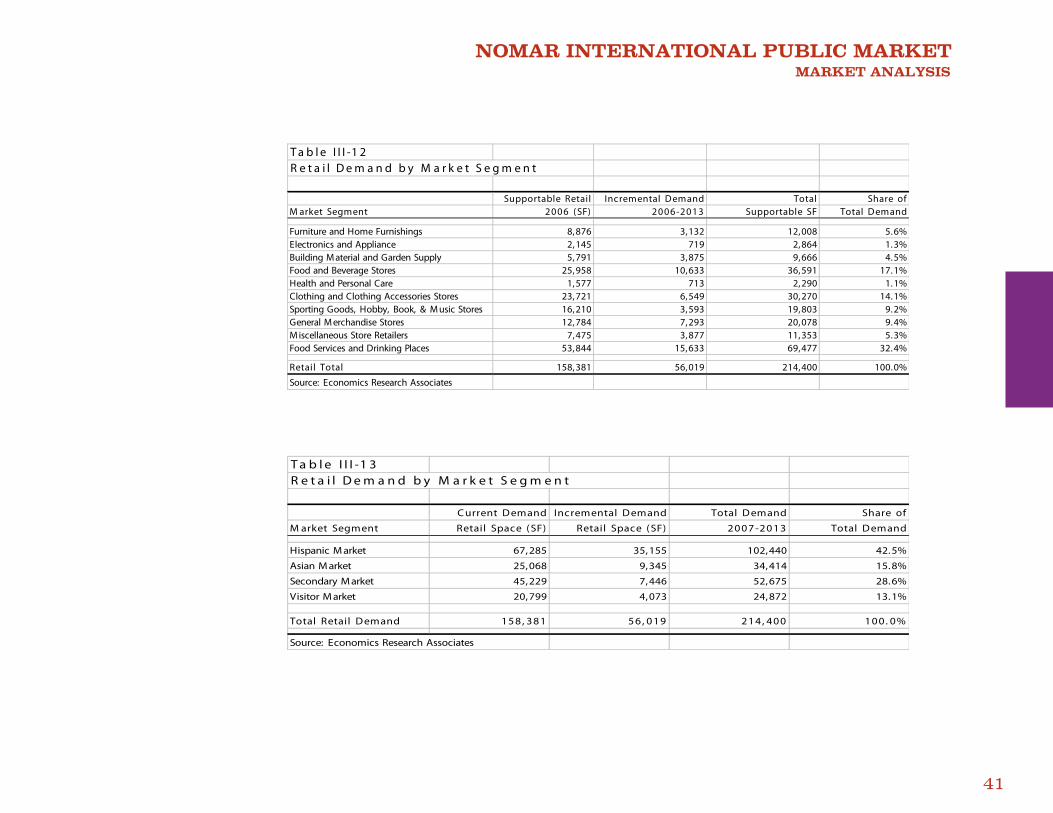
NOMAR INTERNATIONAL PUBLIC MARKET MARKET ANALYSIS
41
T a b l e I I I -1 2R e t a i l D e m a n d b y M a r k e t S e g m e n t
Supportable Retail Incremental Demand Total Share ofM arket Segment 2006 (SF) 2006-2013 Supportable SF Total Demand
Furniture and Home Furnishings 8,876 3,132 12,008 5.6%Electronics and Appliance 2,145 719 2,864 1.3%Building M aterial and Garden Supply 5,791 3,875 9,666 4.5%Food and Beverage Stores 25,958 10,633 36,591 17.1%Health and Personal Care 1,577 713 2,290 1.1%Clothing and Clothing Accessories Stores 23,721 6,549 30,270 14.1%Sporting Goods, Hobby, Book, & M usic Stores 16,210 3,593 19,803 9.2%General M erchandise Stores 12,784 7,293 20,078 9.4%M iscellaneous Store Retailers 7,475 3,877 11,353 5.3%Food Services and Drinking Places 53,844 15,633 69,477 32.4%
Retail Total 158,381 56,019 214,400 100.0%
Source: Economics Research Associates
T a b l e I I I -1 3R e t a i l D e m a n d b y M a r k e t S e g m e n t
C urrent Demand Incremental Demand Total Demand Share of
M arket Segment Retail Space (SF) Retail Space (SF) 2007-2013 Total Demand
Hispanic M arket 67,285 35,155 102,440 42.5%
Asian M arket 25,068 9,345 34,414 15.8%
Secondary M arket 45,229 7,446 52,675 28.6%
Visitor M arket 20,799 4,073 24,872 13.1%
Total Retail Demand 158, 381 56, 019 214, 400 100. 0%
Source: Economics Research Associates
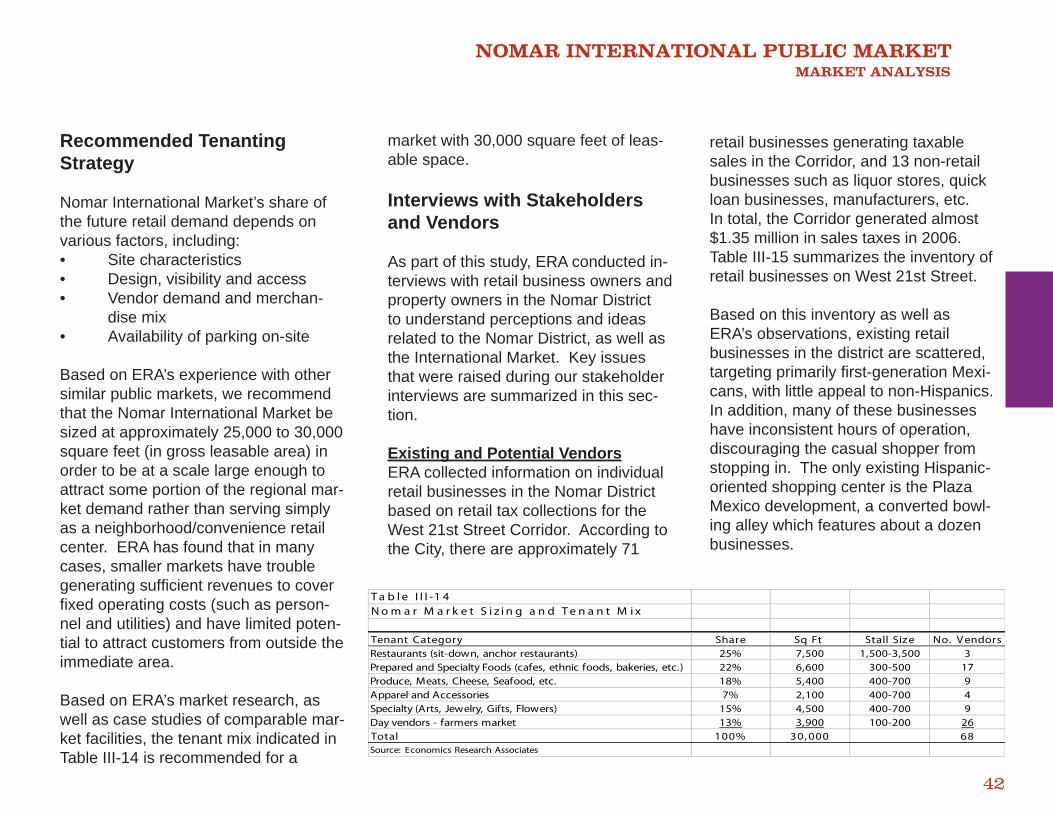
NOMAR INTERNATIONAL PUBLIC MARKET MARKET ANALYSIS
42
T a b l e I I I -1 4N o m a r M a r k e t S i z i n g a n d T e n a n t M i x
Tenant Category Share Sq Ft Stall Size No. V endorsRestaurants (sit-down, anchor restaurants) 25% 7,500 1,500-3,500 3Prepared and Specialty Foods (cafes, ethnic foods, bakeries, etc.) 22% 6,600 300-500 17Produce, Meats, Cheese, Seafood, etc. 18% 5,400 400-700 9Apparel and Accessories 7% 2,100 400-700 4Specialty (Arts, Jewelry, Gifts, Flowers) 15% 4,500 400-700 9Day vendors - farmers market 13% 3,900 100-200 26Total 100% 30, 000 68Source: Economics Research Associates
Recommended Tenanting Strategy
Nomar International Market’s share of the future retail demand depends on various factors, including:• Site characteristics• Design, visibility and access• Vendor demand and merchan- dise mix• Availability of parking on-site
Based on ERA’s experience with other similar public markets, we recommend that the Nomar International Market be sized at approximately 25,000 to 30,000 square feet (in gross leasable area) in order to be at a scale large enough to attract some portion of the regional mar-ket demand rather than serving simply as a neighborhood/convenience retail center. ERA has found that in many cases, smaller markets have trouble generating suffi cient revenues to cover fi xed operating costs (such as person-nel and utilities) and have limited poten-tial to attract customers from outside the immediate area.
Based on ERA’s market research, as well as case studies of comparable mar-ket facilities, the tenant mix indicated in Table III-14 is recommended for a
market with 30,000 square feet of leas-able space.
Interviews with Stakeholders and Vendors
As part of this study, ERA conducted in-terviews with retail business owners and property owners in the Nomar District to understand perceptions and ideas related to the Nomar District, as well as the International Market. Key issues that were raised during our stakeholder interviews are summarized in this sec-tion.
Existing and Potential VendorsERA collected information on individual retail businesses in the Nomar District based on retail tax collections for the West 21st Street Corridor. According to the City, there are approximately 71
retail businesses generating taxable sales in the Corridor, and 13 non-retail businesses such as liquor stores, quick loan businesses, manufacturers, etc. In total, the Corridor generated almost $1.35 million in sales taxes in 2006. Table III-15 summarizes the inventory of retail businesses on West 21st Street.
Based on this inventory as well as ERA’s observations, existing retail businesses in the district are scattered, targeting primarily fi rst-generation Mexi-cans, with little appeal to non-Hispanics. In addition, many of these businesses have inconsistent hours of operation, discouraging the casual shopper from stopping in. The only existing Hispanic-oriented shopping center is the Plaza Mexico development, a converted bowl-ing alley which features about a dozen businesses.
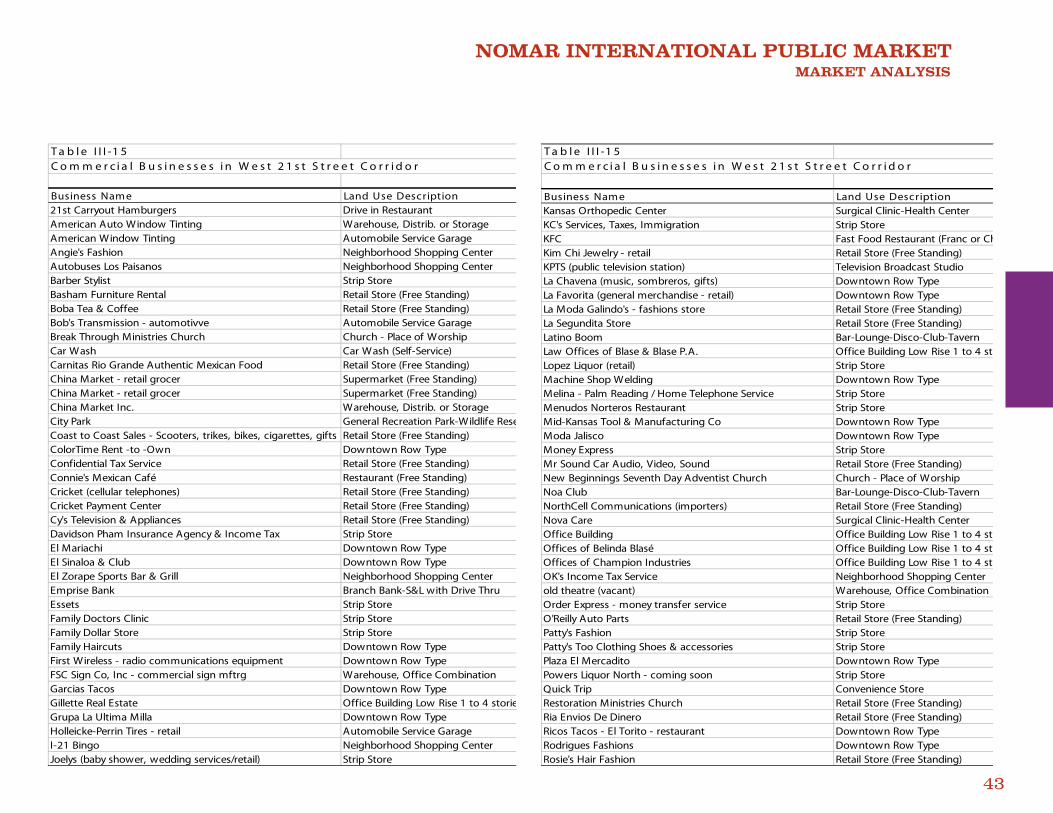
NOMAR INTERNATIONAL PUBLIC MARKET MARKET ANALYSIS
43
T a b l e I I I -1 5C o m m e r c i a l B u s i n e s s e s i n W e s t 2 1 s t S t r e e t C o r r i d o r
Business Name Land Use Description21st Carryout Hamburgers Drive in RestaurantAmerican Auto Window Tinting Warehouse, Distrib. or StorageAmerican Window Tinting Automobile Service GarageAngie's Fashion Neighborhood Shopping CenterAutobuses Los Paisanos Neighborhood Shopping CenterBarber Stylist Strip StoreBasham Furniture Rental Retail Store (Free Standing)Boba Tea & Coffee Retail Store (Free Standing)Bob's Transmission - automotivve Automobile Service GarageBreak Through Ministries Church Church - Place of WorshipCar Wash Car Wash (Self-Service)Carnitas Rio Grande Authentic Mexican Food Retail Store (Free Standing)China Market - retail grocer Supermarket (Free Standing)China Market - retail grocer Supermarket (Free Standing)China Market Inc. Warehouse, Distrib. or StorageCity Park General Recreation Park-Wildlife ReseCoast to Coast Sales - Scooters, trikes, bikes, cigarettes, gifts Retail Store (Free Standing)ColorTime Rent -to -Own Downtown Row TypeConfidential Tax Service Retail Store (Free Standing)Connie's Mexican Café Restaurant (Free Standing)Cricket (cellular telephones) Retail Store (Free Standing)Cricket Payment Center Retail Store (Free Standing)Cy's Television & Appliances Retail Store (Free Standing)Davidson Pham Insurance Agency & Income Tax Strip StoreEl Mariachi Downtown Row TypeEl Sinaloa & Club Downtown Row TypeEl Zorape Sports Bar & Grill Neighborhood Shopping CenterEmprise Bank Branch Bank-S&L with Drive ThruEssets Strip StoreFamily Doctors Clinic Strip StoreFamily Dollar Store Strip StoreFamily Haircuts Downtown Row TypeFirst Wireless - radio communications equipment Downtown Row TypeFSC Sign Co, Inc - commercial sign mftrg Warehouse, Office CombinationGarcias Tacos Downtown Row TypeGillette Real Estate Office Building Low Rise 1 to 4 storieGrupa La Ultima Milla Downtown Row TypeHolleicke-Perrin Tires - retail Automobile Service GarageI-21 Bingo Neighborhood Shopping CenterJoelys (baby shower, wedding services/retail) Strip Store
T a b l e I I I -1 5C o m m e r c i a l B u s i n e s s e s i n W e s t 2 1 s t S t r e e t C o r r i d o r
Business Name Land Use DescriptionKansas Orthopedic Center Surgical Clinic-Health CenterKC's Services, Taxes, Immigration Strip StoreKFC Fast Food Restaurant (Franc or ChKim Chi Jewelry - retail Retail Store (Free Standing)KPTS (public television station) Television Broadcast StudioLa Chavena (music, sombreros, gifts) Downtown Row TypeLa Favorita (general merchandise - retail) Downtown Row TypeLa Moda Galindo's - fashions store Retail Store (Free Standing)La Segundita Store Retail Store (Free Standing)Latino Boom Bar-Lounge-Disco-Club-TavernLaw Offices of Blase & Blase P.A. Office Building Low Rise 1 to 4 stoLopez Liquor (retail) Strip StoreMachine Shop Welding Downtown Row TypeMelina - Palm Reading / Home Telephone Service Strip StoreMenudos Norteros Restaurant Strip StoreMid-Kansas Tool & Manufacturing Co Downtown Row TypeModa Jalisco Downtown Row TypeMoney Express Strip StoreMr Sound Car Audio, Video, Sound Retail Store (Free Standing)New Beginnings Seventh Day Adventist Church Church - Place of WorshipNoa Club Bar-Lounge-Disco-Club-TavernNorthCell Communications (importers) Retail Store (Free Standing)Nova Care Surgical Clinic-Health CenterOffice Building Office Building Low Rise 1 to 4 stoOffices of Belinda Blasé Office Building Low Rise 1 to 4 stoOffices of Champion Industries Office Building Low Rise 1 to 4 stoOK's Income Tax Service Neighborhood Shopping Centerold theatre (vacant) Warehouse, Office CombinationOrder Express - money transfer service Strip StoreO'Reilly Auto Parts Retail Store (Free Standing)Patty's Fashion Strip StorePatty's Too Clothing Shoes & accessories Strip StorePlaza El Mercadito Downtown Row TypePowers Liquor North - coming soon Strip StoreQuick Trip Convenience StoreRestoration Ministries Church Retail Store (Free Standing)Ria Envios De Dinero Retail Store (Free Standing)Ricos Tacos - El Torito - restaurant Downtown Row TypeRodrigues Fashions Downtown Row TypeRosie's Hair Fashion Retail Store (Free Standing)
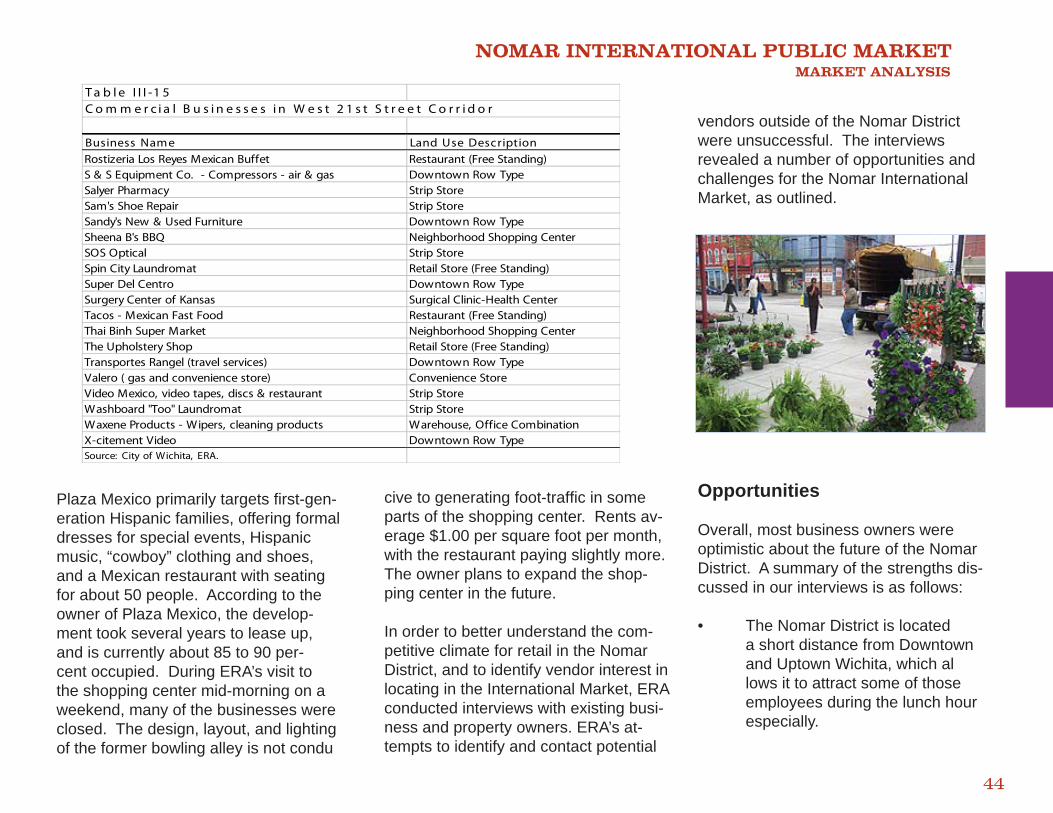
NOMAR INTERNATIONAL PUBLIC MARKET MARKET ANALYSIS
44
T a b l e I I I -1 5C o m m e r c i a l B u s i n e s s e s i n W e s t 2 1 s t S t r e e t C o r r i d o r
Business Name Land Use DescriptionRostizeria Los Reyes Mexican Buffet Restaurant (Free Standing)S & S Equipment Co. - Compressors - air & gas Downtown Row TypeSalyer Pharmacy Strip StoreSam's Shoe Repair Strip StoreSandy's New & Used Furniture Downtown Row TypeSheena B's BBQ Neighborhood Shopping CenterSOS Optical Strip StoreSpin City Laundromat Retail Store (Free Standing)Super Del Centro Downtown Row TypeSurgery Center of Kansas Surgical Clinic-Health CenterTacos - Mexican Fast Food Restaurant (Free Standing)Thai Binh Super Market Neighborhood Shopping CenterThe Upholstery Shop Retail Store (Free Standing)Transportes Rangel (travel services) Downtown Row TypeValero ( gas and convenience store) Convenience StoreVideo Mexico, video tapes, discs & restaurant Strip StoreWashboard "Too" Laundromat Strip StoreWaxene Products - Wipers, cleaning products Warehouse, Office CombinationX-citement Video Downtown Row TypeSource: City of Wichita, ERA.
Plaza Mexico primarily targets fi rst-gen-eration Hispanic families, offering formal dresses for special events, Hispanic music, “cowboy” clothing and shoes, and a Mexican restaurant with seating for about 50 people. According to the owner of Plaza Mexico, the develop-ment took several years to lease up, and is currently about 85 to 90 per-cent occupied. During ERA’s visit to the shopping center mid-morning on a weekend, many of the businesses were closed. The design, layout, and lighting of the former bowling alley is not condu
cive to generating foot-traffi c in some parts of the shopping center. Rents av-erage $1.00 per square foot per month, with the restaurant paying slightly more. The owner plans to expand the shop-ping center in the future.
In order to better understand the com-petitive climate for retail in the Nomar District, and to identify vendor interest in locating in the International Market, ERA conducted interviews with existing busi-ness and property owners. ERA’s at-tempts to identify and contact potential
vendors outside of the Nomar District were unsuccessful. The interviews revealed a number of opportunities and challenges for the Nomar International Market, as outlined.
Opportunities
Overall, most business owners were optimistic about the future of the Nomar District. A summary of the strengths dis-cussed in our interviews is as follows:
• The Nomar District is located a short distance from Downtown and Uptown Wichita, which al lows it to attract some of those employees during the lunch hour especially.
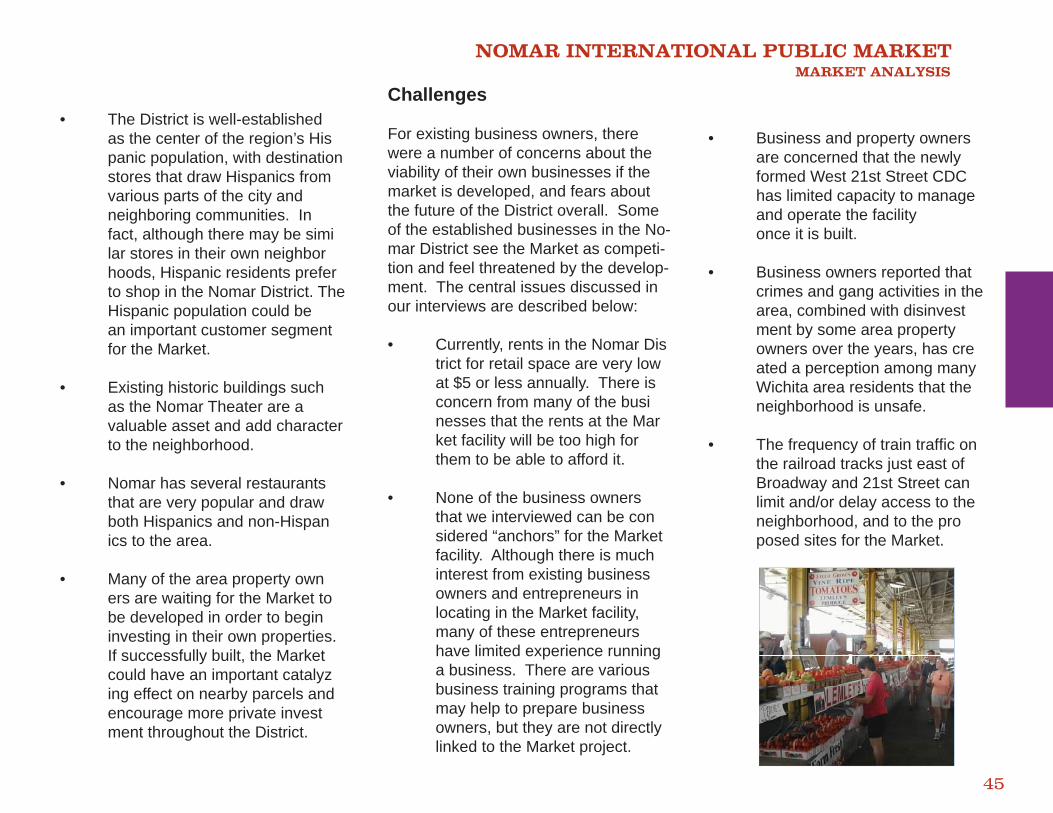
NOMAR INTERNATIONAL PUBLIC MARKET MARKET ANALYSIS
45
• The District is well-established as the center of the region’s His panic population, with destination stores that draw Hispanics from various parts of the city and neighboring communities. In fact, although there may be simi lar stores in their own neighbor hoods, Hispanic residents prefer to shop in the Nomar District. The Hispanic population could be an important customer segment for the Market. • Existing historic buildings such as the Nomar Theater are a valuable asset and add character to the neighborhood.
• Nomar has several restaurants that are very popular and draw both Hispanics and non-Hispan ics to the area.
• Many of the area property own ers are waiting for the Market to be developed in order to begin investing in their own properties. If successfully built, the Market could have an important catalyz ing effect on nearby parcels and encourage more private invest ment throughout the District.
Challenges
For existing business owners, there were a number of concerns about the viability of their own businesses if the market is developed, and fears about the future of the District overall. Some of the established businesses in the No-mar District see the Market as competi-tion and feel threatened by the develop-ment. The central issues discussed in our interviews are described below:
• Currently, rents in the Nomar Dis trict for retail space are very low at $5 or less annually. There is concern from many of the busi nesses that the rents at the Mar ket facility will be too high for them to be able to afford it.
• None of the business owners that we interviewed can be con sidered “anchors” for the Market facility. Although there is much interest from existing business owners and entrepreneurs in locating in the Market facility, many of these entrepreneurs have limited experience running a business. There are various business training programs that may help to prepare business owners, but they are not directly linked to the Market project.
• Business and property owners are concerned that the newly formed West 21st Street CDC has limited capacity to manage and operate the facility once it is built.
• Business owners reported that crimes and gang activities in the area, combined with disinvest ment by some area property owners over the years, has cre ated a perception among many Wichita area residents that the neighborhood is unsafe.
• The frequency of train traffi c on the railroad tracks just east of Broadway and 21st Street can limit and/or delay access to the neighborhood, and to the pro posed sites for the Market.

NOMAR INTERNATIONAL PUBLIC MARKET PUBLIC MARKETS CASE STUDIES
1
IV. Public Markets Case Studies
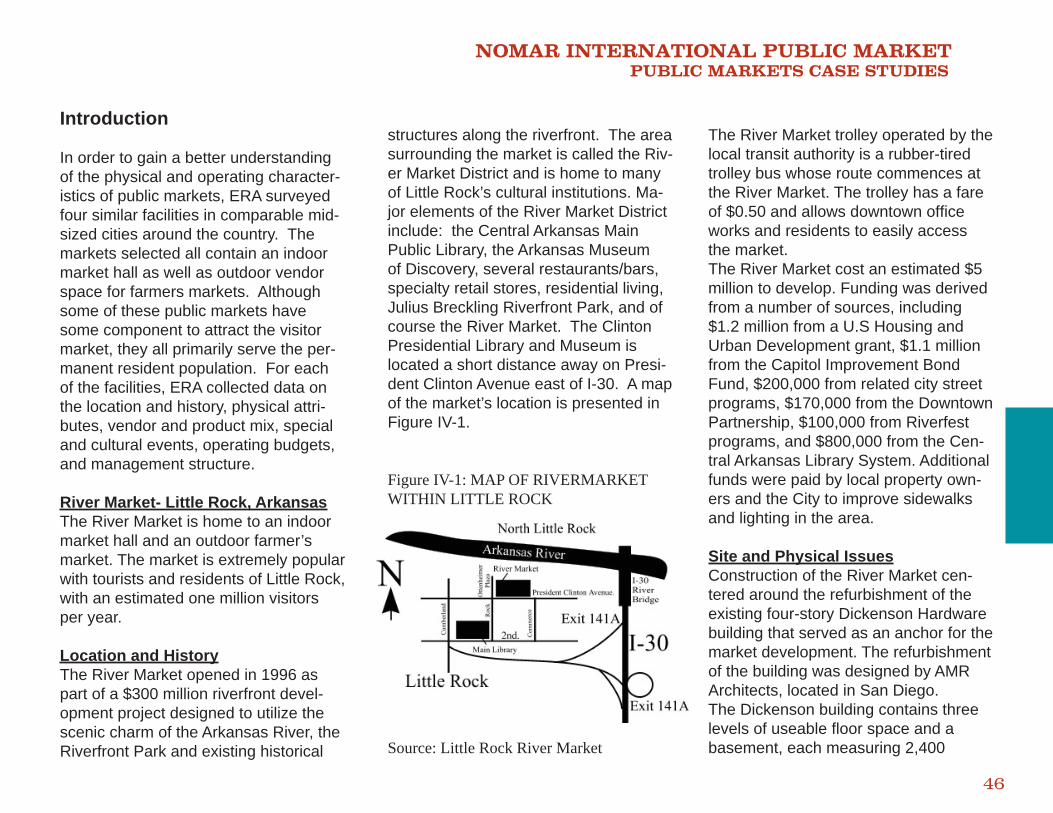
NOMAR INTERNATIONAL PUBLIC MARKET PUBLIC MARKETS CASE STUDIES
46
Introduction
In order to gain a better understanding of the physical and operating character-istics of public markets, ERA surveyed four similar facilities in comparable mid-sized cities around the country. The markets selected all contain an indoor market hall as well as outdoor vendor space for farmers markets. Although some of these public markets have some component to attract the visitor market, they all primarily serve the per-manent resident population. For each of the facilities, ERA collected data on the location and history, physical attri-butes, vendor and product mix, special and cultural events, operating budgets, and management structure.
River Market- Little Rock, ArkansasThe River Market is home to an indoor market hall and an outdoor farmer’s market. The market is extremely popular with tourists and residents of Little Rock, with an estimated one million visitors per year.
Location and HistoryThe River Market opened in 1996 as part of a $300 million riverfront devel-opment project designed to utilize the scenic charm of the Arkansas River, the Riverfront Park and existing historical
structures along the riverfront. The area surrounding the market is called the Riv-er Market District and is home to many of Little Rock’s cultural institutions. Ma-jor elements of the River Market District include: the Central Arkansas Main Public Library, the Arkansas Museum of Discovery, several restaurants/bars, specialty retail stores, residential living, Julius Breckling Riverfront Park, and of course the River Market. The Clinton Presidential Library and Museum is located a short distance away on Presi-dent Clinton Avenue east of I-30. A map of the market’s location is presented in Figure IV-1.
Figure IV-1: MAP OF RIVERMARKET WITHIN LITTLE ROCK
Source: Little Rock River Market
The River Market trolley operated by the local transit authority is a rubber-tired trolley bus whose route commences at the River Market. The trolley has a fare of $0.50 and allows downtown offi ce works and residents to easily access the market.The River Market cost an estimated $5 million to develop. Funding was derived from a number of sources, including $1.2 million from a U.S Housing and Urban Development grant, $1.1 million from the Capitol Improvement Bond Fund, $200,000 from related city street programs, $170,000 from the Downtown Partnership, $100,000 from Riverfest programs, and $800,000 from the Cen-tral Arkansas Library System. Additional funds were paid by local property own-ers and the City to improve sidewalks and lighting in the area.
Site and Physical IssuesConstruction of the River Market cen-tered around the refurbishment of the existing four-story Dickenson Hardware building that served as an anchor for the market development. The refurbishment of the building was designed by AMR Architects, located in San Diego. The Dickenson building contains three levels of useable fl oor space and a basement, each measuring 2,400
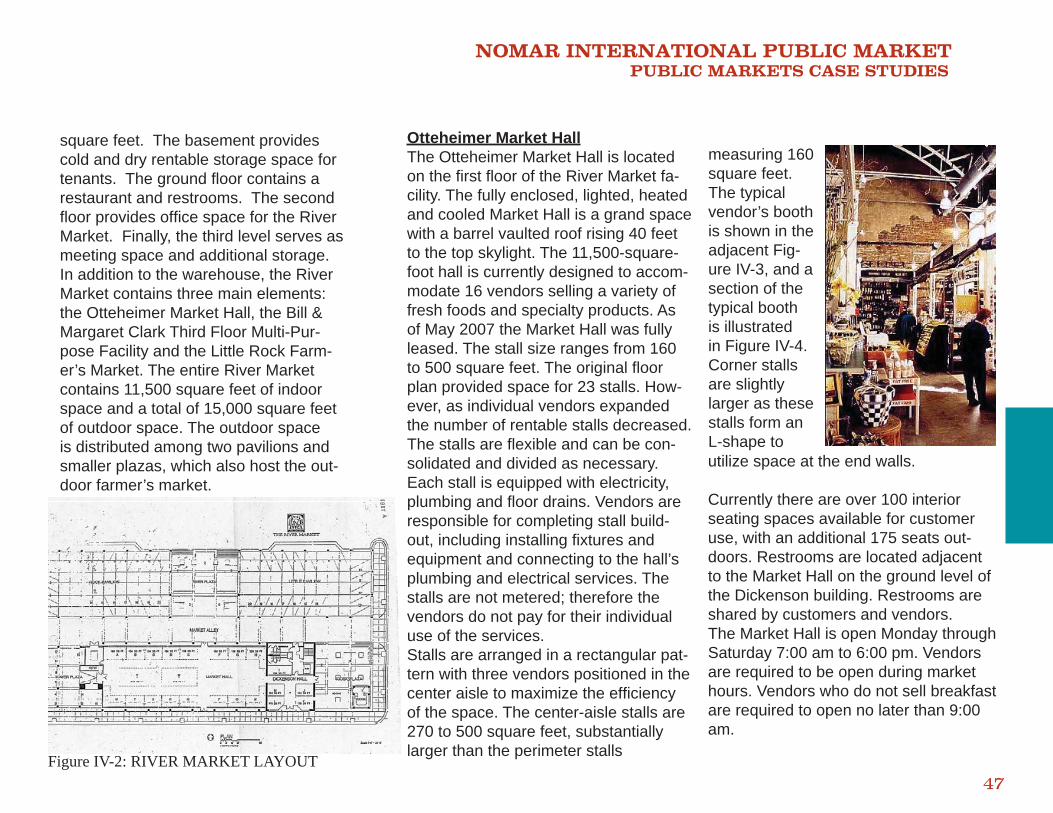
NOMAR INTERNATIONAL PUBLIC MARKET PUBLIC MARKETS CASE STUDIES
47
square feet. The basement provides cold and dry rentable storage space for tenants. The ground fl oor contains a restaurant and restrooms. The second fl oor provides offi ce space for the River Market. Finally, the third level serves as meeting space and additional storage. In addition to the warehouse, the River Market contains three main elements: the Otteheimer Market Hall, the Bill & Margaret Clark Third Floor Multi-Pur-pose Facility and the Little Rock Farm-er’s Market. The entire River Market contains 11,500 square feet of indoor space and a total of 15,000 square feet of outdoor space. The outdoor space is distributed among two pavilions and smaller plazas, which also host the out-door farmer’s market.
measuring 160 square feet. The typical vendor’s booth is shown in the adjacent Fig-ure IV-3, and a section of the typical booth is illustrated in Figure IV-4. Corner stalls are slightly larger as these stalls form an L-shape to
Figure IV-2: RIVER MARKET LAYOUT
Otteheimer Market HallThe Otteheimer Market Hall is located on the fi rst fl oor of the River Market fa-cility. The fully enclosed, lighted, heated and cooled Market Hall is a grand space with a barrel vaulted roof rising 40 feet to the top skylight. The 11,500-square-foot hall is currently designed to accom-modate 16 vendors selling a variety of fresh foods and specialty products. As of May 2007 the Market Hall was fully leased. The stall size ranges from 160 to 500 square feet. The original fl oor plan provided space for 23 stalls. How-ever, as individual vendors expanded the number of rentable stalls decreased. The stalls are fl exible and can be con-solidated and divided as necessary. Each stall is equipped with electricity, plumbing and fl oor drains. Vendors are responsible for completing stall build-out, including installing fi xtures and equipment and connecting to the hall’s plumbing and electrical services. The stalls are not metered; therefore the vendors do not pay for their individual use of the services.Stalls are arranged in a rectangular pat-tern with three vendors positioned in the center aisle to maximize the effi ciency of the space. The center-aisle stalls are 270 to 500 square feet, substantially larger than the perimeter stalls
utilize space at the end walls.
Currently there are over 100 interior seating spaces available for customer use, with an additional 175 seats out-doors. Restrooms are located adjacent to the Market Hall on the ground level of the Dickenson building. Restrooms are shared by customers and vendors.The Market Hall is open Monday through Saturday 7:00 am to 6:00 pm. Vendors are required to be open during market hours. Vendors who do not sell breakfast are required to open no later than 9:00 am.
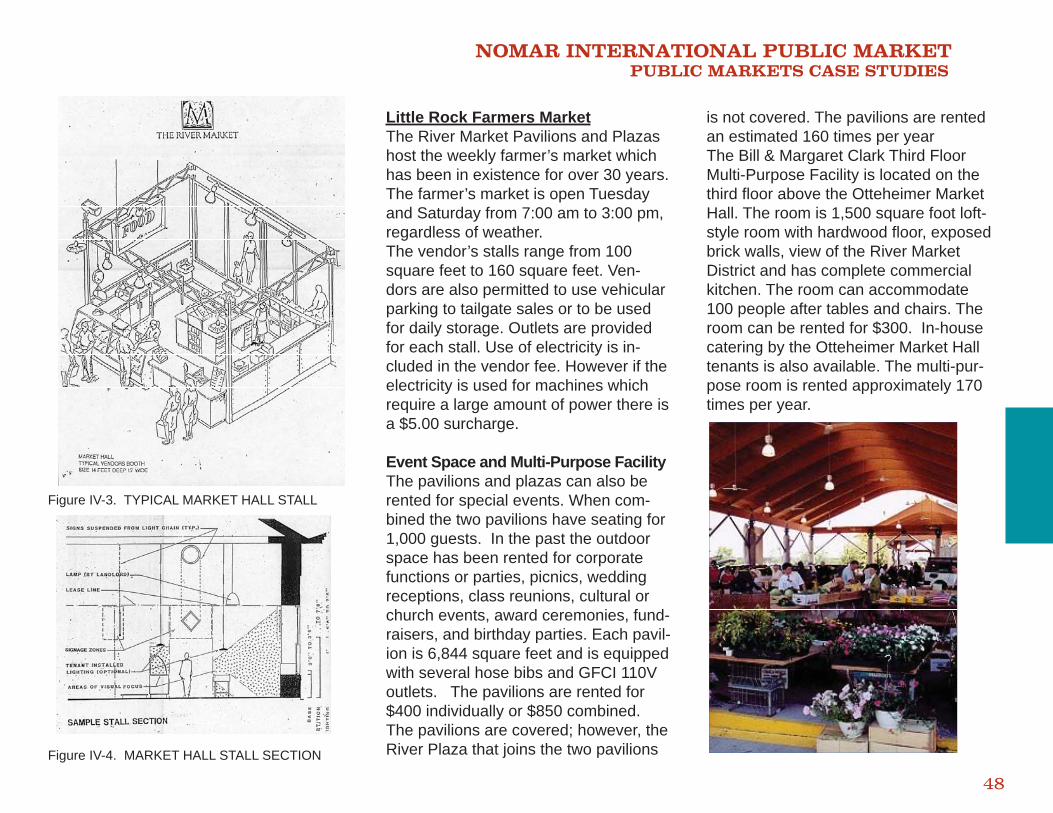
NOMAR INTERNATIONAL PUBLIC MARKET PUBLIC MARKETS CASE STUDIES
48
Little Rock Farmers MarketThe River Market Pavilions and Plazas host the weekly farmer’s market which has been in existence for over 30 years. The farmer’s market is open Tuesday and Saturday from 7:00 am to 3:00 pm, regardless of weather. The vendor’s stalls range from 100 square feet to 160 square feet. Ven-dors are also permitted to use vehicular parking to tailgate sales or to be used for daily storage. Outlets are provided for each stall. Use of electricity is in-cluded in the vendor fee. However if the electricity is used for machines which require a large amount of power there is a $5.00 surcharge.
Event Space and Multi-Purpose FacilityThe pavilions and plazas can also be rented for special events. When com-bined the two pavilions have seating for 1,000 guests. In the past the outdoor space has been rented for corporate functions or parties, picnics, wedding receptions, class reunions, cultural or church events, award ceremonies, fund-raisers, and birthday parties. Each pavil-ion is 6,844 square feet and is equipped with several hose bibs and GFCI 110V outlets. The pavilions are rented for $400 individually or $850 combined. The pavilions are covered; however, the River Plaza that joins the two pavilions
is not covered. The pavilions are rented an estimated 160 times per yearThe Bill & Margaret Clark Third Floor Multi-Purpose Facility is located on the third fl oor above the Otteheimer Market Hall. The room is 1,500 square foot loft-style room with hardwood fl oor, exposed brick walls, view of the River Market District and has complete commercial kitchen. The room can accommodate 100 people after tables and chairs. The room can be rented for $300. In-house catering by the Otteheimer Market Hall tenants is also available. The multi-pur-pose room is rented approximately 170times per year.
Figure IV-3. TYPICAL MARKET HALL STALL
Figure IV-4. MARKET HALL STALL SECTION
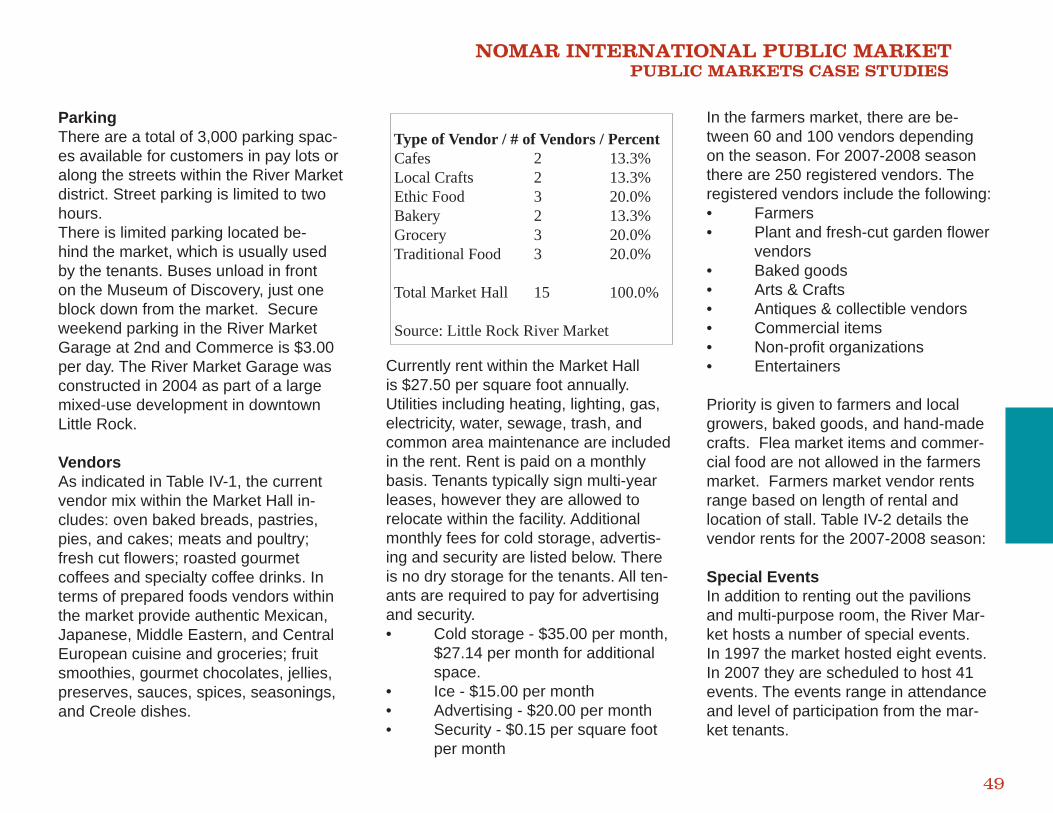
NOMAR INTERNATIONAL PUBLIC MARKET PUBLIC MARKETS CASE STUDIES
49
ParkingThere are a total of 3,000 parking spac-es available for customers in pay lots or along the streets within the River Market district. Street parking is limited to two hours. There is limited parking located be-hind the market, which is usually used by the tenants. Buses unload in front on the Museum of Discovery, just one block down from the market. Secure weekend parking in the River Market Garage at 2nd and Commerce is $3.00 per day. The River Market Garage was constructed in 2004 as part of a large mixed-use development in downtown Little Rock.
VendorsAs indicated in Table IV-1, the current vendor mix within the Market Hall in-cludes: oven baked breads, pastries, pies, and cakes; meats and poultry; fresh cut fl owers; roasted gourmet coffees and specialty coffee drinks. In terms of prepared foods vendors within the market provide authentic Mexican, Japanese, Middle Eastern, and Central European cuisine and groceries; fruit smoothies, gourmet chocolates, jellies, preserves, sauces, spices, seasonings, and Creole dishes.
Currently rent within the Market Hall is $27.50 per square foot annually. Utilities including heating, lighting, gas, electricity, water, sewage, trash, and common area maintenance are included in the rent. Rent is paid on a monthly basis. Tenants typically sign multi-year leases, however they are allowed to relocate within the facility. Additional monthly fees for cold storage, advertis-ing and security are listed below. There is no dry storage for the tenants. All ten-ants are required to pay for advertising and security. • Cold storage - $35.00 per month, $27.14 per month for additional space. • Ice - $15.00 per month• Advertising - $20.00 per month• Security - $0.15 per square foot per month
In the farmers market, there are be-tween 60 and 100 vendors depending on the season. For 2007-2008 season there are 250 registered vendors. The registered vendors include the following:• Farmers• Plant and fresh-cut garden fl ower vendors• Baked goods• Arts & Crafts• Antiques & collectible vendors• Commercial items• Non-profi t organizations• Entertainers
Priority is given to farmers and local growers, baked goods, and hand-made crafts. Flea market items and commer-cial food are not allowed in the farmers market. Farmers market vendor rents range based on length of rental and location of stall. Table IV-2 details the vendor rents for the 2007-2008 season:
Special EventsIn addition to renting out the pavilions and multi-purpose room, the River Mar-ket hosts a number of special events. In 1997 the market hosted eight events. In 2007 they are scheduled to host 41 events. The events range in attendance and level of participation from the mar-ket tenants.
Type of Vendor / # of Vendors / Percent Cafes 2 13.3% Local Crafts 2 13.3% Ethic Food 3 20.0% Bakery 2 13.3% Grocery 3 20.0% Traditional Food 3 20.0% Total Market Hall 15 100.0% Source: Little Rock River Market
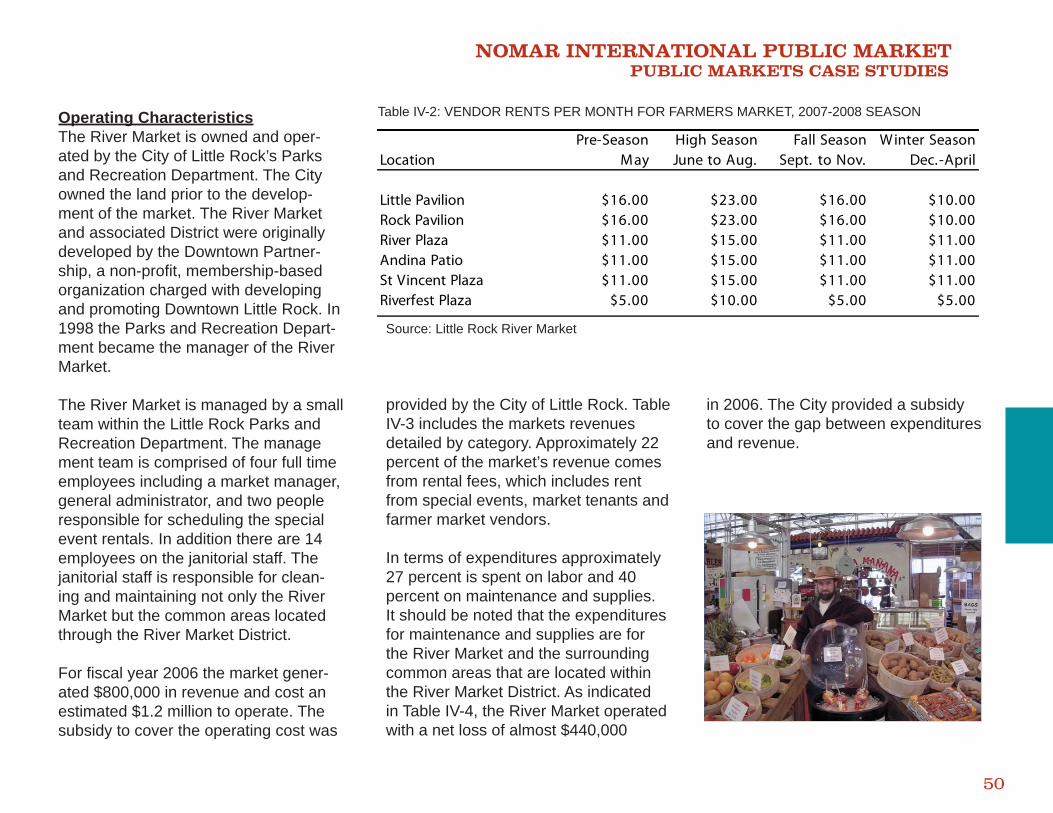
NOMAR INTERNATIONAL PUBLIC MARKET PUBLIC MARKETS CASE STUDIES
50
Pre-Season High Season Fall Season Winter SeasonLocation May June to Aug. Sept. to Nov. Dec.-April
Little Pavilion $16.00 $23.00 $16.00 $10.00Rock Pavilion $16.00 $23.00 $16.00 $10.00River Plaza $11.00 $15.00 $11.00 $11.00Andina Patio $11.00 $15.00 $11.00 $11.00St Vincent Plaza $11.00 $15.00 $11.00 $11.00Riverfest Plaza $5.00 $10.00 $5.00 $5.00
Operating CharacteristicsThe River Market is owned and oper-ated by the City of Little Rock’s Parks and Recreation Department. The City owned the land prior to the develop-ment of the market. The River Market and associated District were originally developed by the Downtown Partner-ship, a non-profi t, membership-based organization charged with developing and promoting Downtown Little Rock. In 1998 the Parks and Recreation Depart-ment became the manager of the River Market.
The River Market is managed by a small team within the Little Rock Parks and Recreation Department. The management team is comprised of four full time employees including a market manager, general administrator, and two people responsible for scheduling the special event rentals. In addition there are 14 employees on the janitorial staff. The janitorial staff is responsible for clean-ing and maintaining not only the River Market but the common areas located through the River Market District.
For fi scal year 2006 the market gener-ated $800,000 in revenue and cost an estimated $1.2 million to operate. Thesubsidy to cover the operating cost was
Source: Little Rock River Market
provided by the City of Little Rock. Table IV-3 includes the markets revenues detailed by category. Approximately 22percent of the market’s revenue comes from rental fees, which includes rent from special events, market tenants and farmer market vendors.
In terms of expenditures approximately 27 percent is spent on labor and 40 percent on maintenance and supplies. It should be noted that the expenditures for maintenance and supplies are for the River Market and the surrounding common areas that are located within the River Market District. As indicatedin Table IV-4, the River Market operated with a net loss of almost $440,000
in 2006. The City provided a subsidy to cover the gap between expenditures and revenue.
Table IV-2: VENDOR RENTS PER MONTH FOR FARMERS MARKET, 2007-2008 SEASON
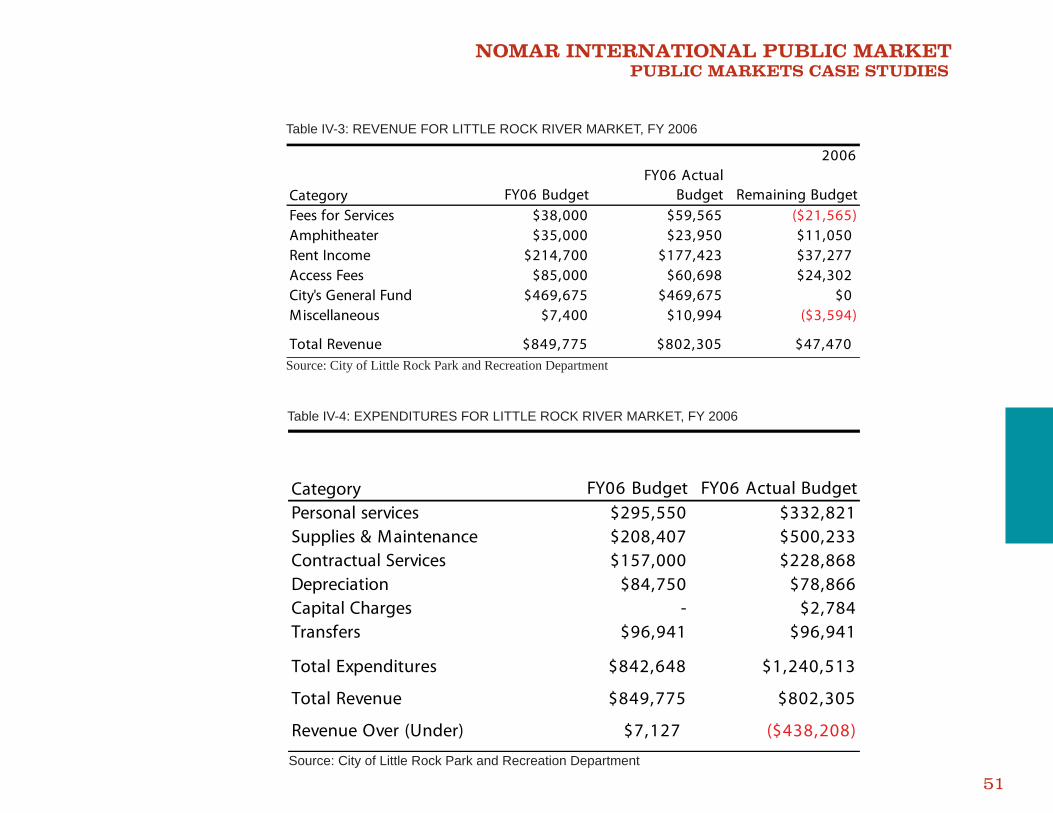
NOMAR INTERNATIONAL PUBLIC MARKET PUBLIC MARKETS CASE STUDIES
51
2006
Category FY06 BudgetFY06 Actual
Budget Remaining BudgetFees for Services $38,000 $59,565 ($21,565)Amphitheater $35,000 $23,950 $11,050Rent Income $214,700 $177,423 $37,277Access Fees $85,000 $60,698 $24,302City's General Fund $469,675 $469,675 $0Miscellaneous $7,400 $10,994 ($3,594)
Total Revenue $849,775 $802,305 $47,470
Table IV-3: REVENUE FOR LITTLE ROCK RIVER MARKET, FY 2006
Source: City of Little Rock Park and Recreation Department
Category FY06 Budget FY06 Actual BudgetPersonal services $295,550 $332,821Supplies & Maintenance $208,407 $500,233Contractual Services $157,000 $228,868Depreciation $84,750 $78,866Capital Charges - $2,784Transfers $96,941 $96,941
Total Expenditures $842,648 $1,240,513
Total Revenue $849,775 $802,305
Revenue Over (Under) $7,127 ($438,208)
Table IV-4: EXPENDITURES FOR LITTLE ROCK RIVER MARKET, FY 2006
Source: City of Little Rock Park and Recreation Department
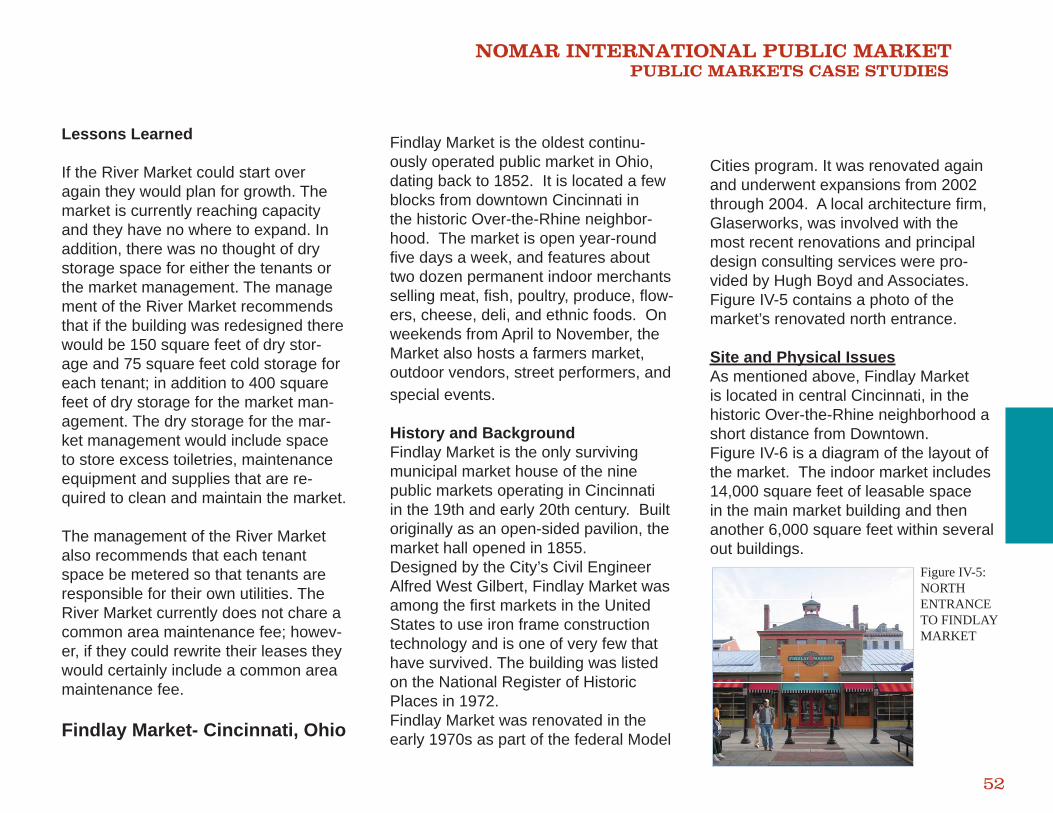
NOMAR INTERNATIONAL PUBLIC MARKET PUBLIC MARKETS CASE STUDIES
52
Lessons Learned
If the River Market could start over again they would plan for growth. The market is currently reaching capacity and they have no where to expand. In addition, there was no thought of dry storage space for either the tenants or the market management. The management of the River Market recommendsthat if the building was redesigned there would be 150 square feet of dry stor-age and 75 square feet cold storage for each tenant; in addition to 400 square feet of dry storage for the market man-agement. The dry storage for the mar-ket management would include space to store excess toiletries, maintenance equipment and supplies that are re-quired to clean and maintain the market.
The management of the River Market also recommends that each tenant space be metered so that tenants are responsible for their own utilities. The River Market currently does not chare a common area maintenance fee; howev-er, if they could rewrite their leases they would certainly include a common area maintenance fee.
Findlay Market- Cincinnati, Ohio
Findlay Market is the oldest continu-ously operated public market in Ohio, dating back to 1852. It is located a few blocks from downtown Cincinnati in the historic Over-the-Rhine neighbor-hood. The market is open year-round fi ve days a week, and features about two dozen permanent indoor merchants selling meat, fi sh, poultry, produce, fl ow-ers, cheese, deli, and ethnic foods. On weekends from April to November, the Market also hosts a farmers market, outdoor vendors, street performers, and special events.
History and BackgroundFindlay Market is the only surviving municipal market house of the nine public markets operating in Cincinnati in the 19th and early 20th century. Built originally as an open-sided pavilion, the market hall opened in 1855.Designed by the City’s Civil Engineer Alfred West Gilbert, Findlay Market was among the fi rst markets in the United States to use iron frame construction technology and is one of very few that have survived. The building was listed on the National Register of Historic Places in 1972. Findlay Market was renovated in the early 1970s as part of the federal Model
Cities program. It was renovated againand underwent expansions from 2002 through 2004. A local architecture fi rm, Glaserworks, was involved with the most recent renovations and principal design consulting services were pro-vided by Hugh Boyd and Associates. Figure IV-5 contains a photo of the market’s renovated north entrance.
Site and Physical IssuesAs mentioned above, Findlay Market is located in central Cincinnati, in the historic Over-the-Rhine neighborhood a short distance from Downtown. Figure IV-6 is a diagram of the layout of the market. The indoor market includes 14,000 square feet of leasable space in the main market building and then another 6,000 square feet within several out buildings.
Figure IV-5: NORTH ENTRANCE TO FINDLAY MARKET
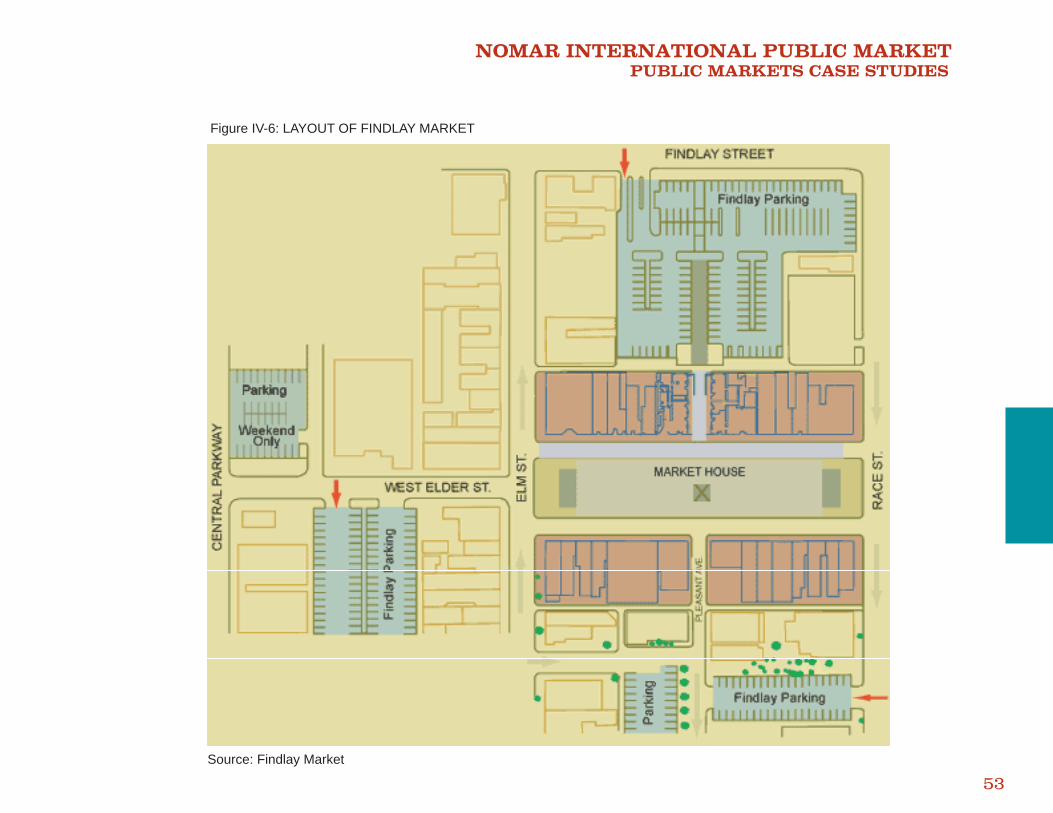
NOMAR INTERNATIONAL PUBLIC MARKET PUBLIC MARKETS CASE STUDIES
53
Figure IV-6: LAYOUT OF FINDLAY MARKET
Source: Findlay Market
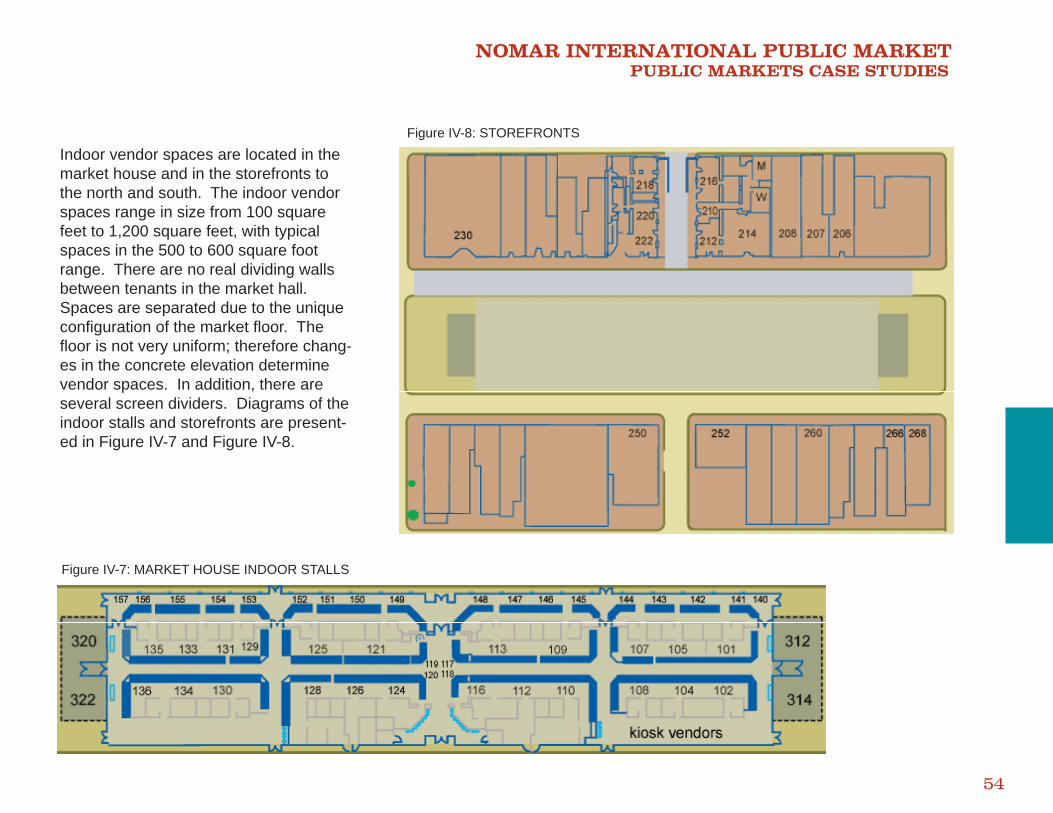
NOMAR INTERNATIONAL PUBLIC MARKET PUBLIC MARKETS CASE STUDIES
54
Indoor vendor spaces are located in the market house and in the storefronts to the north and south. The indoor vendor spaces range in size from 100 square feet to 1,200 square feet, with typical spaces in the 500 to 600 square foot range. There are no real dividing walls between tenants in the market hall. Spaces are separated due to the unique confi guration of the market fl oor. The fl oor is not very uniform; therefore chang-es in the concrete elevation determine vendor spaces. In addition, there are several screen dividers. Diagrams of the indoor stalls and storefronts are present-ed in Figure IV-7 and Figure IV-8.
Figure IV-7: MARKET HOUSE INDOOR STALLS
Figure IV-8: STOREFRONTS
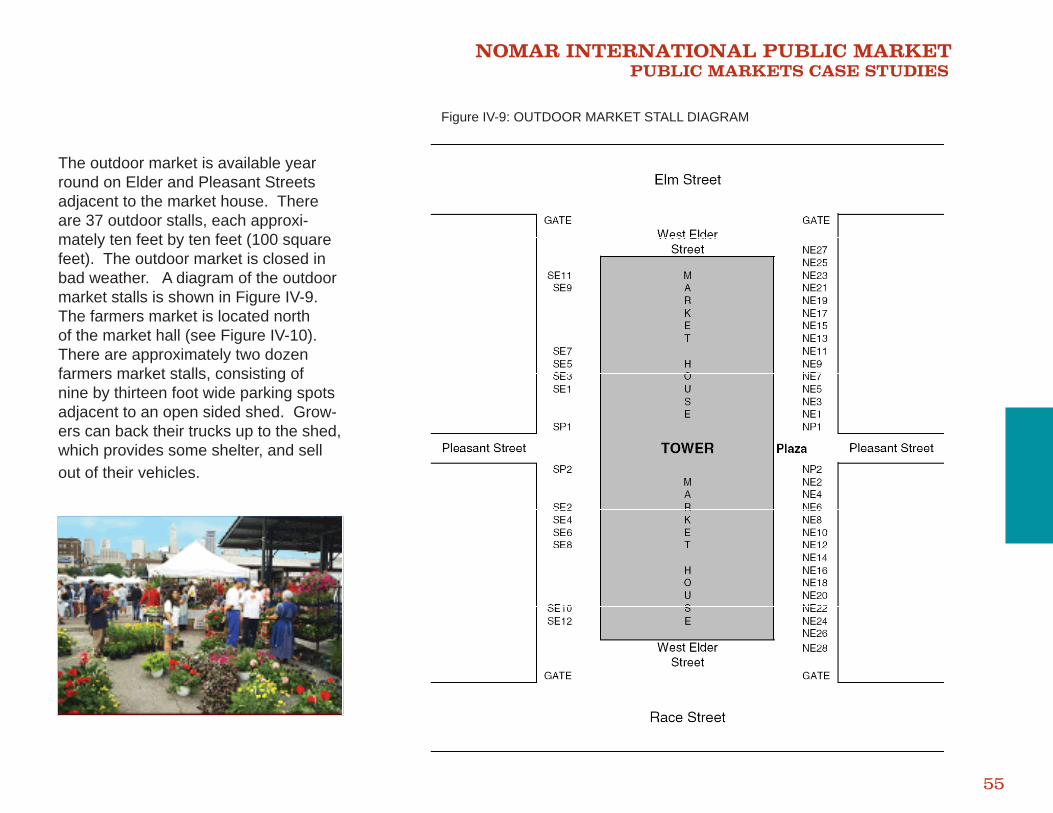
NOMAR INTERNATIONAL PUBLIC MARKET PUBLIC MARKETS CASE STUDIES
55
The outdoor market is available year round on Elder and Pleasant Streets adjacent to the market house. There are 37 outdoor stalls, each approxi-mately ten feet by ten feet (100 square feet). The outdoor market is closed in bad weather. A diagram of the outdoor market stalls is shown in Figure IV-9.The farmers market is located north of the market hall (see Figure IV-10). There are approximately two dozen farmers market stalls, consisting of nine by thirteen foot wide parking spots adjacent to an open sided shed. Grow-ers can back their trucks up to the shed, which provides some shelter, and sell out of their vehicles.
Figure IV-9: OUTDOOR MARKET STALL DIAGRAM
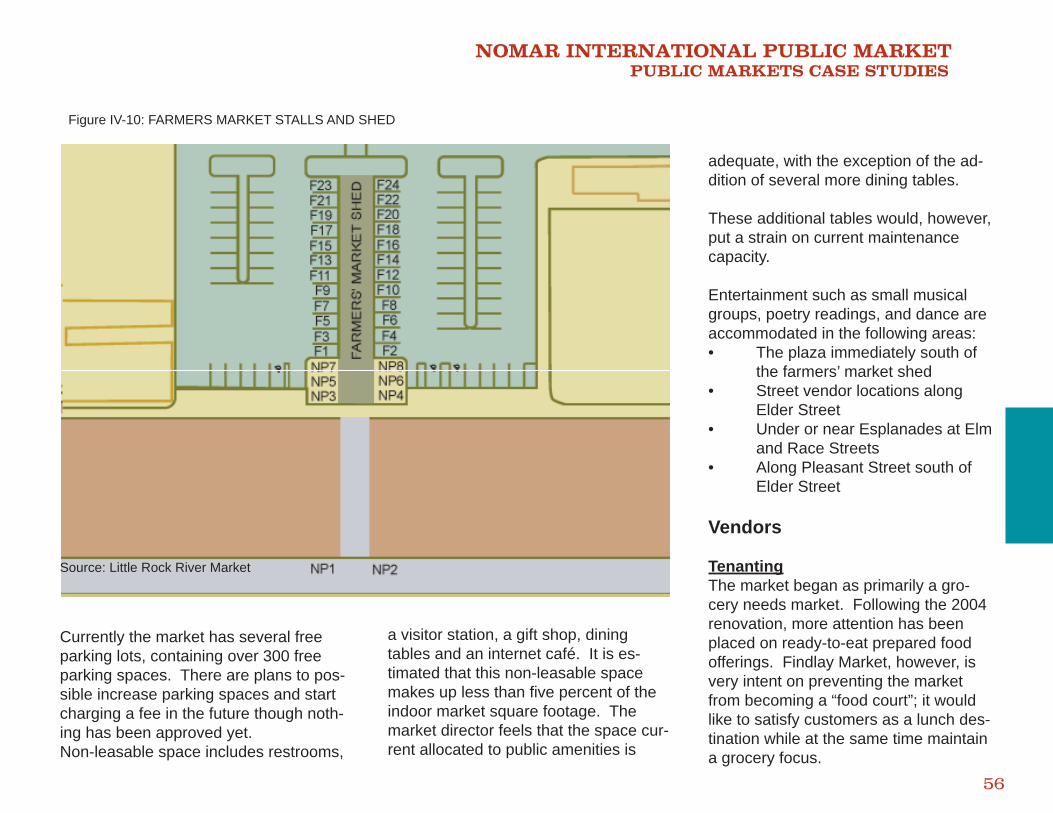
NOMAR INTERNATIONAL PUBLIC MARKET PUBLIC MARKETS CASE STUDIES
56
Figure IV-10: FARMERS MARKET STALLS AND SHED
Source: Little Rock River Market
Currently the market has several free parking lots, containing over 300 free parking spaces. There are plans to pos-sible increase parking spaces and start charging a fee in the future though noth-ing has been approved yet.Non-leasable space includes restrooms,
a visitor station, a gift shop, dining tables and an internet café. It is es-timated that this non-leasable space makes up less than fi ve percent of the indoor market square footage. The market director feels that the space cur-rent allocated to public amenities is
adequate, with the exception of the ad-dition of several more dining tables.
These additional tables would, however, put a strain on current maintenance capacity.
Entertainment such as small musical groups, poetry readings, and dance are accommodated in the following areas: • The plaza immediately south of the farmers’ market shed• Street vendor locations along Elder Street• Under or near Esplanades at Elm and Race Streets• Along Pleasant Street south of Elder Street
Vendors
TenantingThe market began as primarily a gro-cery needs market. Following the 2004 renovation, more attention has been placed on ready-to-eat prepared food offerings. Findlay Market, however, is very intent on preventing the market from becoming a “food court”; it would like to satisfy customers as a lunch des-tination while at the same time maintain a grocery focus.
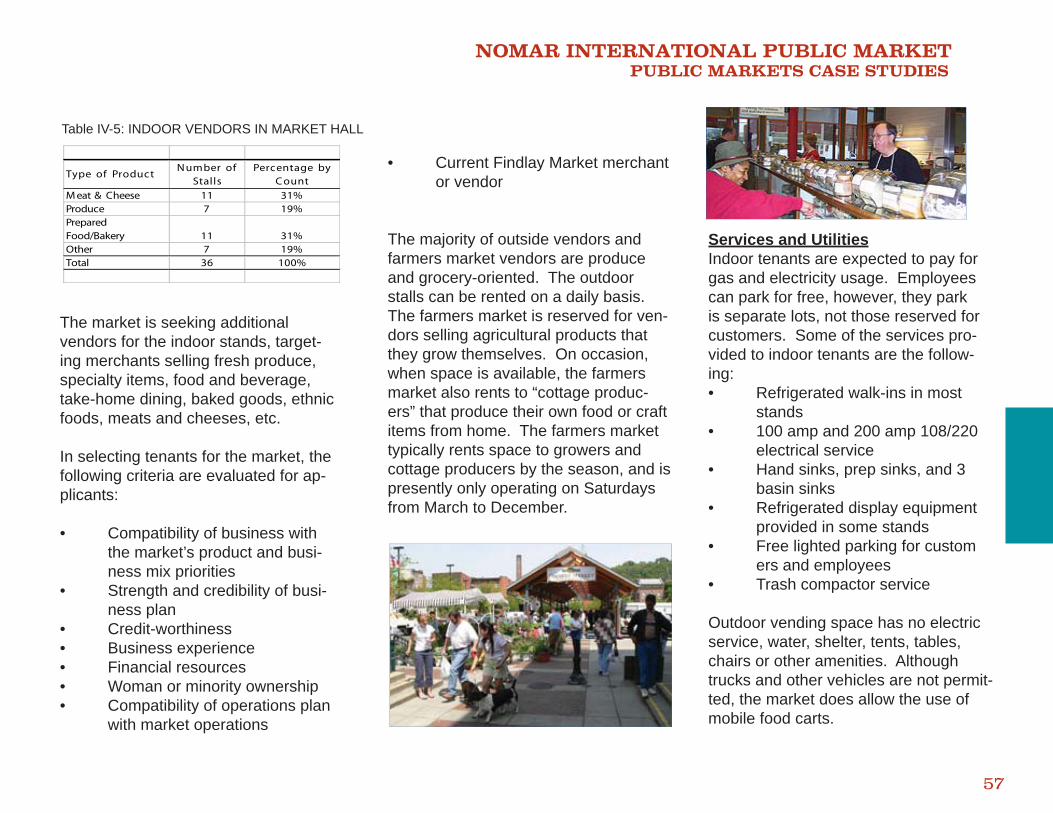
NOMAR INTERNATIONAL PUBLIC MARKET PUBLIC MARKETS CASE STUDIES
57
The market is seeking additional vendors for the indoor stands, target-ing merchants selling fresh produce, specialty items, food and beverage, take-home dining, baked goods, ethnic foods, meats and cheeses, etc.
In selecting tenants for the market, the following criteria are evaluated for ap-plicants:
• Compatibility of business with the market’s product and busi- ness mix priorities• Strength and credibility of busi- ness plan• Credit-worthiness• Business experience• Financial resources• Woman or minority ownership• Compatibility of operations plan with market operations
• Current Findlay Market merchant or vendor
The majority of outside vendors and farmers market vendors are produce and grocery-oriented. The outdoor stalls can be rented on a daily basis. The farmers market is reserved for ven-dors selling agricultural products that they grow themselves. On occasion, when space is available, the farmers market also rents to “cottage produc-ers” that produce their own food or craft items from home. The farmers market typically rents space to growers and cottage producers by the season, and is presently only operating on Saturdays from March to December.
Services and UtilitiesIndoor tenants are expected to pay for gas and electricity usage. Employees can park for free, however, they park is separate lots, not those reserved for customers. Some of the services pro-vided to indoor tenants are the follow-ing:• Refrigerated walk-ins in most stands• 100 amp and 200 amp 108/220 electrical service• Hand sinks, prep sinks, and 3 basin sinks• Refrigerated display equipment provided in some stands• Free lighted parking for custom ers and employees• Trash compactor service
Outdoor vending space has no electric service, water, shelter, tents, tables, chairs or other amenities. Although trucks and other vehicles are not permit-ted, the market does allow the use of mobile food carts.
Type of ProductN umber of
StallsPercentage by
C ountM eat & Cheese 11 31%Produce 7 19%Prepared Food/Bakery 11 31%Other 7 19%Total 36 100%
Table IV-5: INDOOR VENDORS IN MARKET HALL
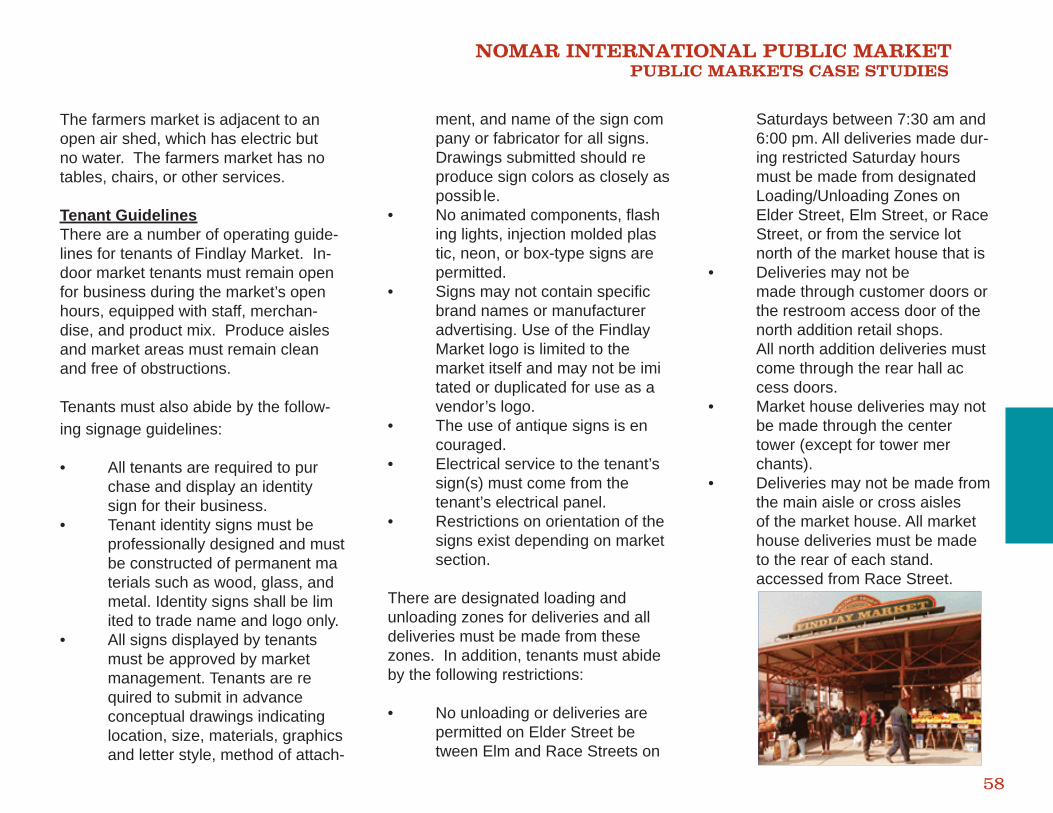
NOMAR INTERNATIONAL PUBLIC MARKET PUBLIC MARKETS CASE STUDIES
58
The farmers market is adjacent to an open air shed, which has electric but no water. The farmers market has no tables, chairs, or other services.
Tenant GuidelinesThere are a number of operating guide-lines for tenants of Findlay Market. In-door market tenants must remain open for business during the market’s open hours, equipped with staff, merchan-dise, and product mix. Produce aisles and market areas must remain clean and free of obstructions.
Tenants must also abide by the follow-ing signage guidelines:
• All tenants are required to pur chase and display an identity sign for their business. • Tenant identity signs must be professionally designed and must be constructed of permanent ma terials such as wood, glass, and metal. Identity signs shall be lim ited to trade name and logo only.• All signs displayed by tenants must be approved by market management. Tenants are re quired to submit in advance conceptual drawings indicating location, size, materials, graphics and letter style, method of attach-
ment, and name of the sign com pany or fabricator for all signs. Drawings submitted should re produce sign colors as closely as possib le.• No animated components, fl ash ing lights, injection molded plas tic, neon, or box-type signs are permitted.• Signs may not contain specifi c brand names or manufacturer advertising. Use of the Findlay Market logo is limited to the market itself and may not be imi tated or duplicated for use as a vendor’s logo.• The use of antique signs is en couraged.• Electrical service to the tenant’s sign(s) must come from the tenant’s electrical panel. • Restrictions on orientation of the signs exist depending on market section.
There are designated loading and unloading zones for deliveries and all deliveries must be made from these zones. In addition, tenants must abide by the following restrictions:
• No unloading or deliveries are permitted on Elder Street be tween Elm and Race Streets on
Saturdays between 7:30 am and 6:00 pm. All deliveries made dur- ing restricted Saturday hours must be made from designated Loading/Unloading Zones on Elder Street, Elm Street, or Race Street, or from the service lot north of the market house that is • Deliveries may not be made through customer doors or the restroom access door of the north addition retail shops. All north addition deliveries must come through the rear hall ac cess doors.• Market house deliveries may not be made through the center tower (except for tower mer chants).• Deliveries may not be made from the main aisle or cross aisles of the market house. All market house deliveries must be made to the rear of each stand. accessed from Race Street.
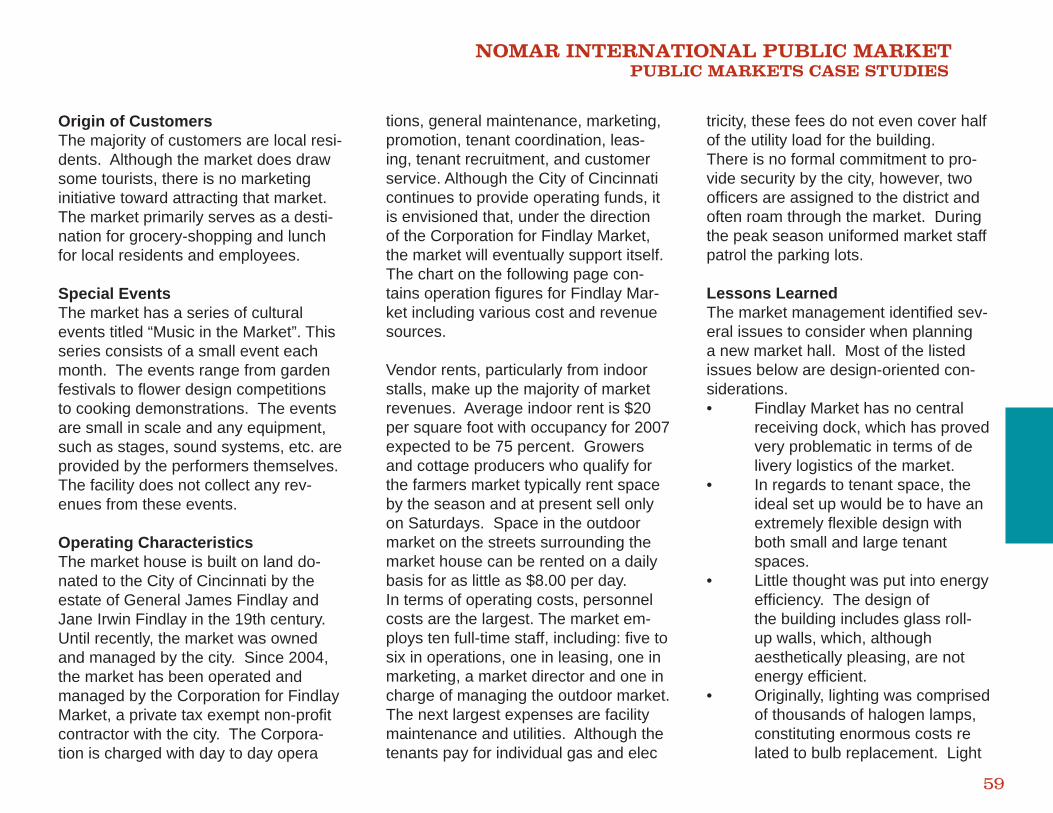
NOMAR INTERNATIONAL PUBLIC MARKET PUBLIC MARKETS CASE STUDIES
59
Origin of CustomersThe majority of customers are local resi-dents. Although the market does draw some tourists, there is no marketing initiative toward attracting that market. The market primarily serves as a desti-nation for grocery-shopping and lunch for local residents and employees.
Special EventsThe market has a series of cultural events titled “Music in the Market”. This series consists of a small event each month. The events range from garden festivals to fl ower design competitions to cooking demonstrations. The events are small in scale and any equipment, such as stages, sound systems, etc. are provided by the performers themselves. The facility does not collect any rev-enues from these events.
Operating CharacteristicsThe market house is built on land do-nated to the City of Cincinnati by the estate of General James Findlay and Jane Irwin Findlay in the 19th century. Until recently, the market was owned and managed by the city. Since 2004, the market has been operated and managed by the Corporation for Findlay Market, a private tax exempt non-profi t contractor with the city. The Corpora-tion is charged with day to day opera
tions, general maintenance, marketing, promotion, tenant coordination, leas-ing, tenant recruitment, and customer service. Although the City of Cincinnati continues to provide operating funds, it is envisioned that, under the direction of the Corporation for Findlay Market, the market will eventually support itself. The chart on the following page con-tains operation fi gures for Findlay Mar-ket including various cost and revenue sources.
Vendor rents, particularly from indoor stalls, make up the majority of market revenues. Average indoor rent is $20 per square foot with occupancy for 2007 expected to be 75 percent. Growers and cottage producers who qualify for the farmers market typically rent space by the season and at present sell only on Saturdays. Space in the outdoor market on the streets surrounding the market house can be rented on a daily basis for as little as $8.00 per day.In terms of operating costs, personnel costs are the largest. The market em-ploys ten full-time staff, including: fi ve to six in operations, one in leasing, one in marketing, a market director and one in charge of managing the outdoor market. The next largest expenses are facility maintenance and utilities. Although the tenants pay for individual gas and elec
tricity, these fees do not even cover half of the utility load for the building.There is no formal commitment to pro-vide security by the city, however, two offi cers are assigned to the district and often roam through the market. During the peak season uniformed market staff patrol the parking lots.
Lessons LearnedThe market management identifi ed sev-eral issues to consider when planning a new market hall. Most of the listed issues below are design-oriented con-siderations.• Findlay Market has no central receiving dock, which has proved very problematic in terms of de livery logistics of the market. • In regards to tenant space, the ideal set up would be to have an extremely fl exible design with both small and large tenant spaces.• Little thought was put into energy effi ciency. The design of the building includes glass roll- up walls, which, although aesthetically pleasing, are not energy effi cient. • Originally, lighting was comprised of thousands of halogen lamps, constituting enormous costs re lated to bulb replacement. Light
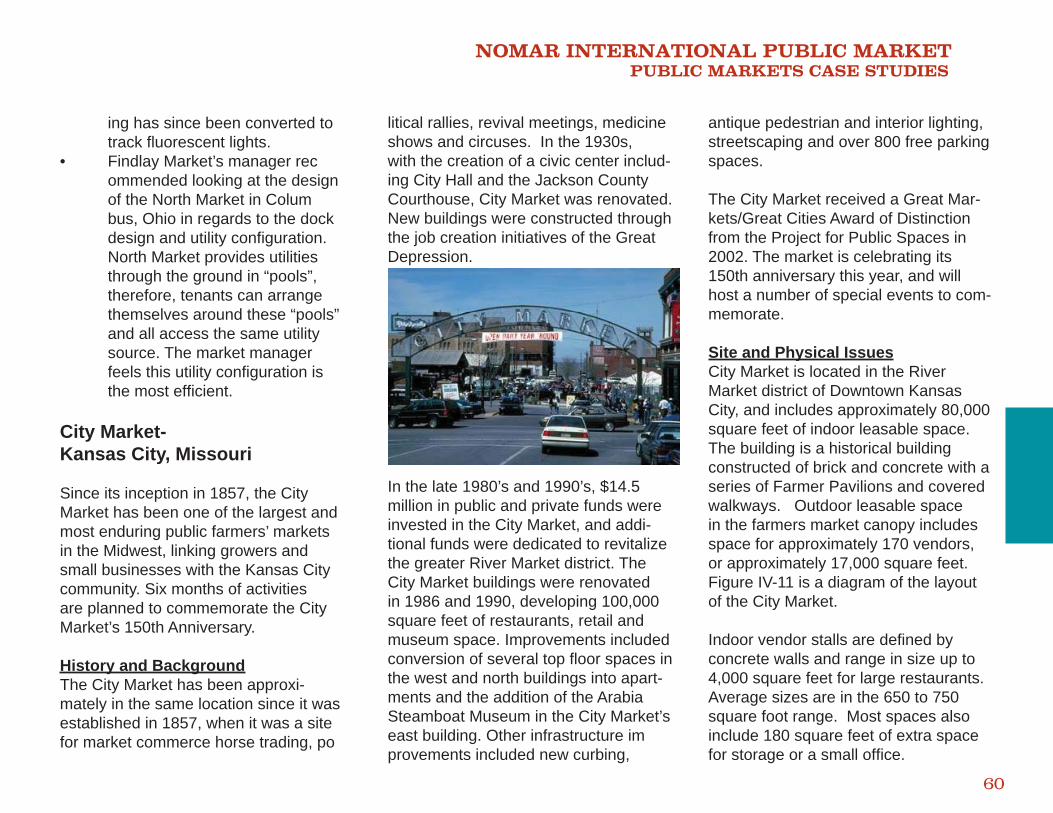
NOMAR INTERNATIONAL PUBLIC MARKET PUBLIC MARKETS CASE STUDIES
60
ing has since been converted to track fl uorescent lights. • Findlay Market’s manager rec ommended looking at the design of the North Market in Colum bus, Ohio in regards to the dock design and utility confi guration. North Market provides utilities through the ground in “pools”, therefore, tenants can arrange themselves around these “pools” and all access the same utility source. The market manager feels this utility confi guration is the most effi cient.
City Market- Kansas City, Missouri
Since its inception in 1857, the City Market has been one of the largest and most enduring public farmers’ markets in the Midwest, linking growers and small businesses with the Kansas City community. Six months of activities are planned to commemorate the City Market’s 150th Anniversary.
History and BackgroundThe City Market has been approxi-mately in the same location since it was established in 1857, when it was a site for market commerce horse trading, po
litical rallies, revival meetings, medicine shows and circuses. In the 1930s, with the creation of a civic center includ-ing City Hall and the Jackson County Courthouse, City Market was renovated. New buildings were constructed through the job creation initiatives of the Great Depression.
In the late 1980’s and 1990’s, $14.5 million in public and private funds were invested in the City Market, and addi-tional funds were dedicated to revitalize the greater River Market district. The City Market buildings were renovated in 1986 and 1990, developing 100,000 square feet of restaurants, retail and museum space. Improvements included conversion of several top fl oor spaces in the west and north buildings into apart-ments and the addition of the Arabia Steamboat Museum in the City Market’s east building. Other infrastructure improvements included new curbing,
antique pedestrian and interior lighting, streetscaping and over 800 free parking spaces.
The City Market received a Great Mar-kets/Great Cities Award of Distinction from the Project for Public Spaces in 2002. The market is celebrating its 150th anniversary this year, and will host a number of special events to com-memorate.
Site and Physical IssuesCity Market is located in the River Market district of Downtown Kansas City, and includes approximately 80,000 square feet of indoor leasable space. The building is a historical building constructed of brick and concrete with a series of Farmer Pavilions and covered walkways. Outdoor leasable space in the farmers market canopy includes space for approximately 170 vendors, or approximately 17,000 square feet. Figure IV-11 is a diagram of the layout of the City Market.
Indoor vendor stalls are defi ned by concrete walls and range in size up to 4,000 square feet for large restaurants. Average sizes are in the 650 to 750 square foot range. Most spaces also include 180 square feet of extra space for storage or a small offi ce.
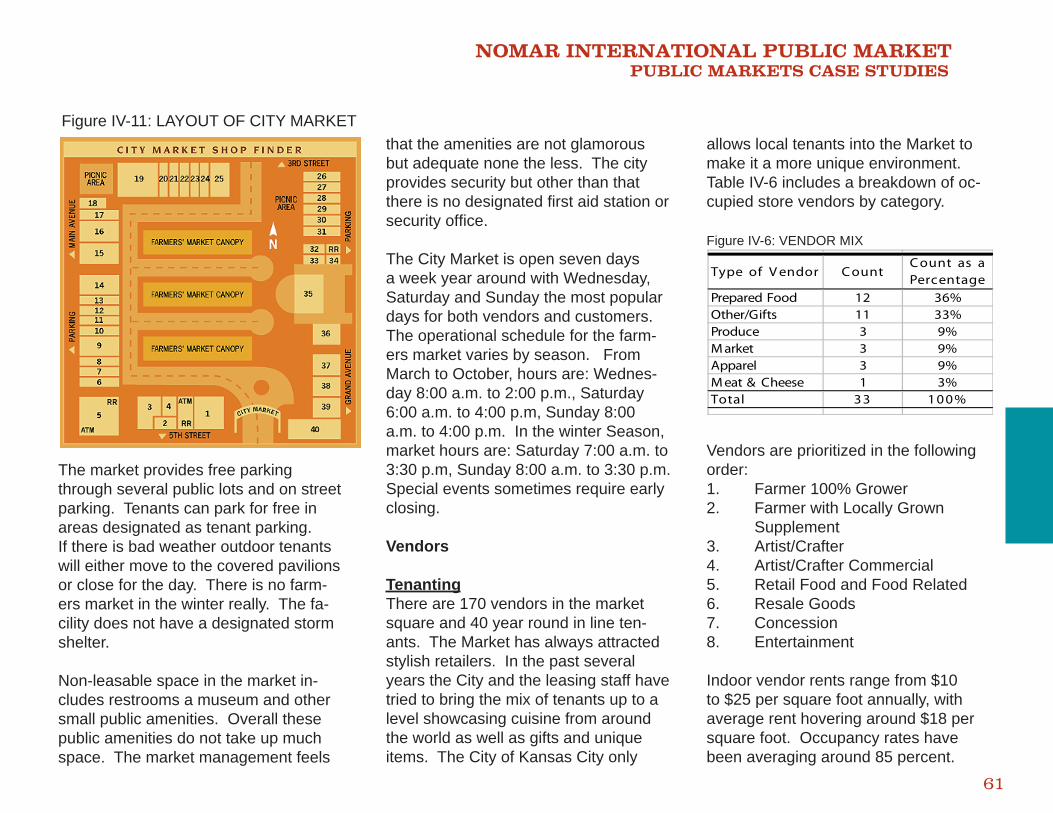
NOMAR INTERNATIONAL PUBLIC MARKET PUBLIC MARKETS CASE STUDIES
61
Figure IV-11: LAYOUT OF CITY MARKET
The market provides free parking through several public lots and on street parking. Tenants can park for free in areas designated as tenant parking.If there is bad weather outdoor tenants will either move to the covered pavilions or close for the day. There is no farm-ers market in the winter really. The fa-cility does not have a designated storm shelter.
Non-leasable space in the market in-cludes restrooms a museum and other small public amenities. Overall these public amenities do not take up much space. The market management feels
that the amenities are not glamorous but adequate none the less. The city provides security but other than that there is no designated fi rst aid station or security offi ce.
The City Market is open seven days a week year around with Wednesday, Saturday and Sunday the most popular days for both vendors and customers. The operational schedule for the farm-ers market varies by season. From March to October, hours are: Wednes-day 8:00 a.m. to 2:00 p.m., Saturday 6:00 a.m. to 4:00 p.m, Sunday 8:00 a.m. to 4:00 p.m. In the winter Season, market hours are: Saturday 7:00 a.m. to 3:30 p.m, Sunday 8:00 a.m. to 3:30 p.m. Special events sometimes require early closing.
Vendors
TenantingThere are 170 vendors in the market square and 40 year round in line ten-ants. The Market has always attracted stylish retailers. In the past several years the City and the leasing staff have tried to bring the mix of tenants up to a level showcasing cuisine from around the world as well as gifts and unique items. The City of Kansas City only
allows local tenants into the Market to make it a more unique environment. Table IV-6 includes a breakdown of oc-cupied store vendors by category.
Figure IV-6: VENDOR MIX
Vendors are prioritized in the following order:1. Farmer 100% Grower 2. Farmer with Locally Grown Supplement3. Artist/Crafter4. Artist/Crafter Commercial5. Retail Food and Food Related6. Resale Goods7. Concession8. Entertainment
Indoor vendor rents range from $10 to $25 per square foot annually, with average rent hovering around $18 per square foot. Occupancy rates have been averaging around 85 percent.
Type of V endor C ountC ount as a Percentage
Prepared Food 12 36%Other/Gifts 11 33%Produce 3 9%M arket 3 9%Apparel 3 9%M eat & Cheese 1 3%Total 33 100%

NOMAR INTERNATIONAL PUBLIC MARKET PUBLIC MARKETS CASE STUDIES
62
Farmers market stalls can pay a daily fee on the weekend raging from $12 to $80 depending on day of the weekend, type of vendor and whether or not the vendor has a contract with the market. Or they can pay an annual fee ranging from $100 - $500 depending on day and vendor type.
Services and UtilitiesThe landlord pays for all heat, gas, elec-tricity, and utilities used in the premises and the tenant pays for all water, sewer, heat, gas, electricity, and utilities used in their individual spaces. The market does not provide any set-up equipment or supplies. It is the responsibility of the vendor to provide tables, chairs, change, cash registers or cash boxes, signage, extension cords and covering, tape, decoration, display equipment, tent, tent weights and proper licenses necessary to do business. There is no common grease interceptor for food vendors.
Tenant GuidelinesTenants must abide by the following signage guidelines:• Tenant shall be required to have a sign on the exterior (as per signage criteria) of the Premises, consistent with the architectural
guidelines set forth by landlord as to its location, design, content, installation, and maintenance. • The sign shall be installed by a sign company approved by land lord. All costs associated with the selection, installation, and maintenance of the sign shall be paid by Tenant. • Tenant may not install more than three exterior signs at the Premises unless Landlord’s prior written authorization has been obtained.• Signs must be up within 30 days of opening.• To help with the cost the City will buy the sign for the tenant and charge no interest for a year.• No lit signs are allowed.
Tenants must abide by the following delivery and unloading restrictions:• Approved vendors without an Annual Stall Contract are not allowed to occupy any area in side the Market until they have paid and received a stall assign ment for that day.• If a vendor’s assigned space does not include a parking spot, then vendor is allowed to unload inside the Market, then imme
diately upon unloading move his/her vehicle to a City Market parking lot for the remainder of the day.• At no time should vehicles be parked in the fi re lane, on the curb, brick area, block any drive lane, entrance or exit in The City Market. Parking in these areas will result in the vendor receiving a probationary warning and/or suspension.• Vehicles will be towed at the discretion of the Market Master at the vendor’s expense.• All employees of weekend ven dors should park in the lot on the corner of 3rd and Grand Street, not in empty stall spaces or be hind vendors’ vehicles.• All vendors must be checked-in no later than 7:30 a.m. on Satur day. No vehicle will be allowed to drive in the Market Square between 7:30 a.m. – 3:00 p.m.• All vendors must be checked- in no later than 9:00 a.m. on Sun day. No vehicle will be allowed to drive in the Market Square between 9:00 a.m. – 2:00 p.m.• Vendors selling large quantities of product to customers must arrange with customer to have
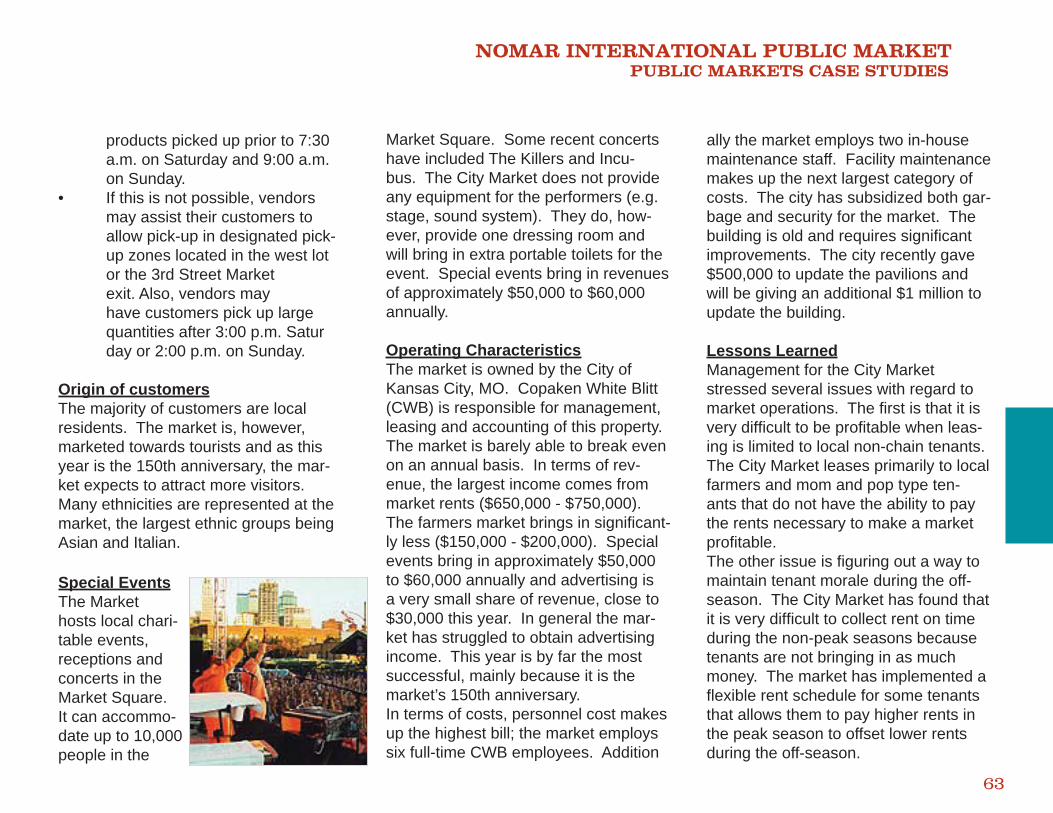
NOMAR INTERNATIONAL PUBLIC MARKET PUBLIC MARKETS CASE STUDIES
63
products picked up prior to 7:30 a.m. on Saturday and 9:00 a.m. on Sunday.• If this is not possible, vendors may assist their customers to allow pick-up in designated pick- up zones located in the west lot or the 3rd Street Market exit. Also, vendors may have customers pick up large quantities after 3:00 p.m. Satur day or 2:00 p.m. on Sunday.
Origin of customersThe majority of customers are local residents. The market is, however, marketed towards tourists and as this year is the 150th anniversary, the mar-ket expects to attract more visitors. Many ethnicities are represented at the market, the largest ethnic groups being Asian and Italian.
Market Square. Some recent concerts have included The Killers and Incu-bus. The City Market does not provide any equipment for the performers (e.g. stage, sound system). They do, how-ever, provide one dressing room and will bring in extra portable toilets for the event. Special events bring in revenues of approximately $50,000 to $60,000 annually.
Operating CharacteristicsThe market is owned by the City of Kansas City, MO. Copaken White Blitt (CWB) is responsible for management, leasing and accounting of this property. The market is barely able to break even on an annual basis. In terms of rev-enue, the largest income comes from market rents ($650,000 - $750,000). The farmers market brings in signifi cant-ly less ($150,000 - $200,000). Special events bring in approximately $50,000 to $60,000 annually and advertising is a very small share of revenue, close to $30,000 this year. In general the mar-ket has struggled to obtain advertising income. This year is by far the most successful, mainly because it is the market’s 150th anniversary. In terms of costs, personnel cost makes up the highest bill; the market employssix full-time CWB employees. Addition
ally the market employs two in-house maintenance staff. Facility maintenance makes up the next largest category of costs. The city has subsidized both gar-bage and security for the market. The building is old and requires signifi cant improvements. The city recently gave $500,000 to update the pavilions and will be giving an additional $1 million to update the building.
Lessons LearnedManagement for the City Market stressed several issues with regard to market operations. The fi rst is that it is very diffi cult to be profi table when leas-ing is limited to local non-chain tenants. The City Market leases primarily to local farmers and mom and pop type ten-ants that do not have the ability to pay the rents necessary to make a market profi table. The other issue is fi guring out a way to maintain tenant morale during the off-season. The City Market has found that it is very diffi cult to collect rent on time during the non-peak seasons because tenants are not bringing in as much money. The market has implemented a fl exible rent schedule for some tenants that allows them to pay higher rents in the peak season to offset lower rents during the off-season.
Special EventsThe Market hosts local chari-table events, receptions and concerts in the Market Square. It can accommo-date up to 10,000 people in the
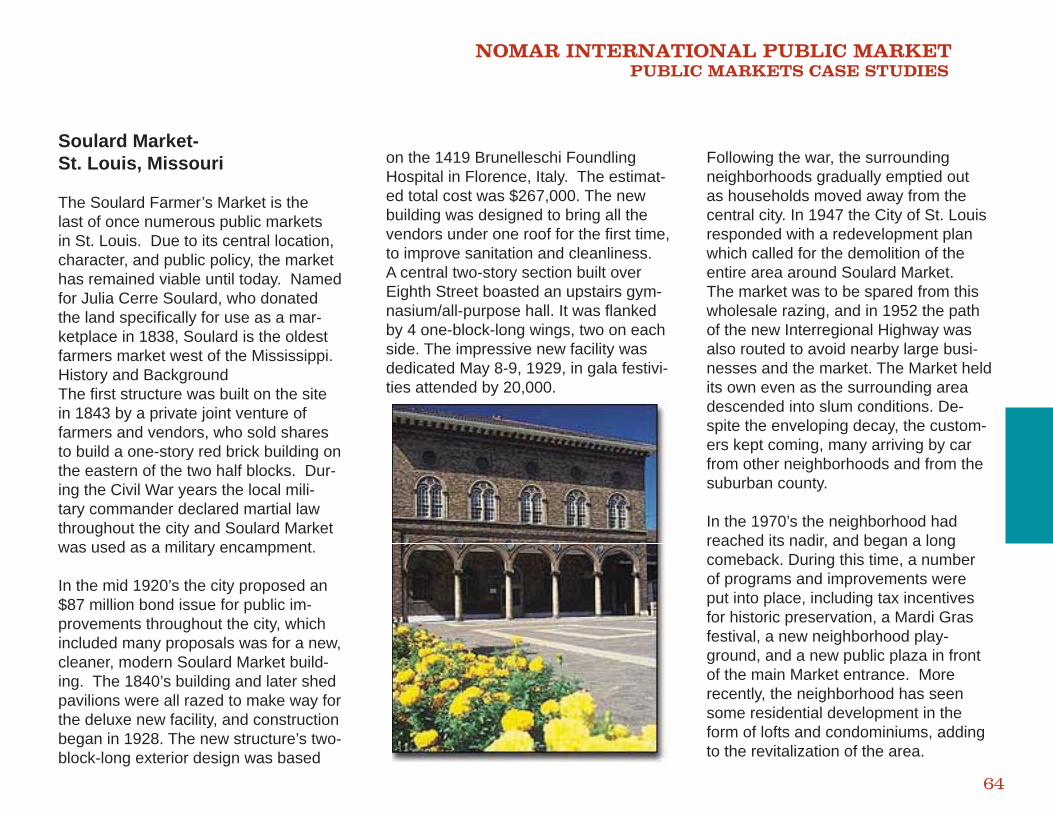
NOMAR INTERNATIONAL PUBLIC MARKET PUBLIC MARKETS CASE STUDIES
64
Soulard Market- St. Louis, Missouri
The Soulard Farmer’s Market is the last of once numerous public markets in St. Louis. Due to its central location, character, and public policy, the market has remained viable until today. Named for Julia Cerre Soulard, who donated the land specifi cally for use as a mar-ketplace in 1838, Soulard is the oldest farmers market west of the Mississippi. History and BackgroundThe fi rst structure was built on the site in 1843 by a private joint venture of farmers and vendors, who sold shares to build a one-story red brick building on the eastern of the two half blocks. Dur-ing the Civil War years the local mili-tary commander declared martial law throughout the city and Soulard Market was used as a military encampment.
In the mid 1920’s the city proposed an $87 million bond issue for public im-provements throughout the city, which included many proposals was for a new, cleaner, modern Soulard Market build-ing. The 1840’s building and later shed pavilions were all razed to make way for the deluxe new facility, and construction began in 1928. The new structure’s two-block-long exterior design was based
on the 1419 Brunelleschi Foundling Hospital in Florence, Italy. The estimat-ed total cost was $267,000. The new building was designed to bring all the vendors under one roof for the fi rst time, to improve sanitation and cleanliness. A central two-story section built over Eighth Street boasted an upstairs gym-nasium/all-purpose hall. It was fl anked by 4 one-block-long wings, two on each side. The impressive new facility was dedicated May 8-9, 1929, in gala festivi-ties attended by 20,000.
Following the war, the surrounding neighborhoods gradually emptied out as households moved away from the central city. In 1947 the City of St. Louis responded with a redevelopment plan which called for the demolition of the entire area around Soulard Market. The market was to be spared from this wholesale razing, and in 1952 the path of the new Interregional Highway was also routed to avoid nearby large busi-nesses and the market. The Market held its own even as the surrounding area descended into slum conditions. De-spite the enveloping decay, the custom-ers kept coming, many arriving by car from other neighborhoods and from the suburban county.
In the 1970’s the neighborhood had reached its nadir, and began a long comeback. During this time, a number of programs and improvements were put into place, including tax incentives for historic preservation, a Mardi Gras festival, a new neighborhood play-ground, and a new public plaza in front of the main Market entrance. More recently, the neighborhood has seen some residential development in the form of lofts and condominiums, adding to the revitalization of the area.
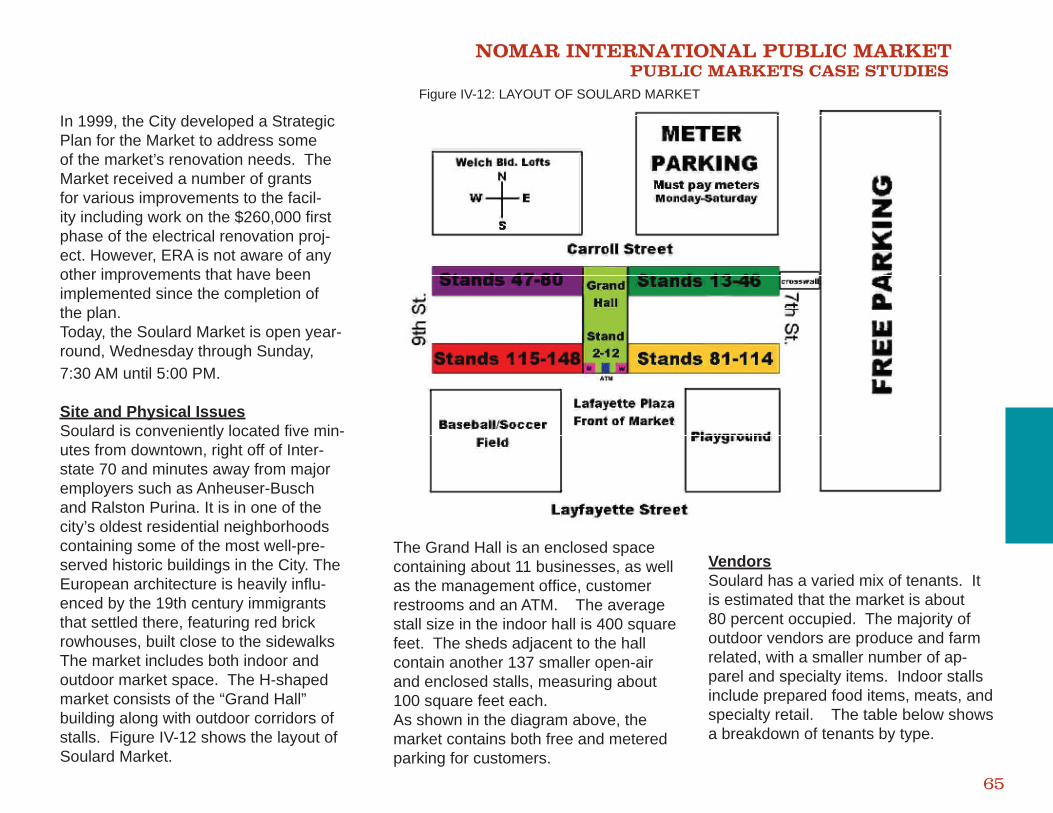
NOMAR INTERNATIONAL PUBLIC MARKET PUBLIC MARKETS CASE STUDIES
65
In 1999, the City developed a Strategic Plan for the Market to address some of the market’s renovation needs. The Market received a number of grants for various improvements to the facil-ity including work on the $260,000 fi rst phase of the electrical renovation proj-ect. However, ERA is not aware of any other improvements that have been implemented since the completion of the plan.Today, the Soulard Market is open year-round, Wednesday through Sunday, 7:30 AM until 5:00 PM.
Site and Physical IssuesSoulard is conveniently located fi ve min-utes from downtown, right off of Inter-state 70 and minutes away from major employers such as Anheuser-Busch and Ralston Purina. It is in one of the city’s oldest residential neighborhoods containing some of the most well-pre-served historic buildings in the City. The European architecture is heavily infl u-enced by the 19th century immigrants that settled there, featuring red brick rowhouses, built close to the sidewalks The market includes both indoor and outdoor market space. The H-shaped market consists of the “Grand Hall” building along with outdoor corridors of stalls. Figure IV-12 shows the layout of Soulard Market.
The Grand Hall is an enclosed space containing about 11 businesses, as well as the management offi ce, customer restrooms and an ATM. The average stall size in the indoor hall is 400 square feet. The sheds adjacent to the hall contain another 137 smaller open-air and enclosed stalls, measuring about 100 square feet each.As shown in the diagram above, the market contains both free and meteredparking for customers.
VendorsSoulard has a varied mix of tenants. It is estimated that the market is about 80 percent occupied. The majority of outdoor vendors are produce and farm related, with a smaller number of ap-parel and specialty items. Indoor stalls include prepared food items, meats, and specialty retail. The table below shows a breakdown of tenants by type.
Figure IV-12: LAYOUT OF SOULARD MARKET
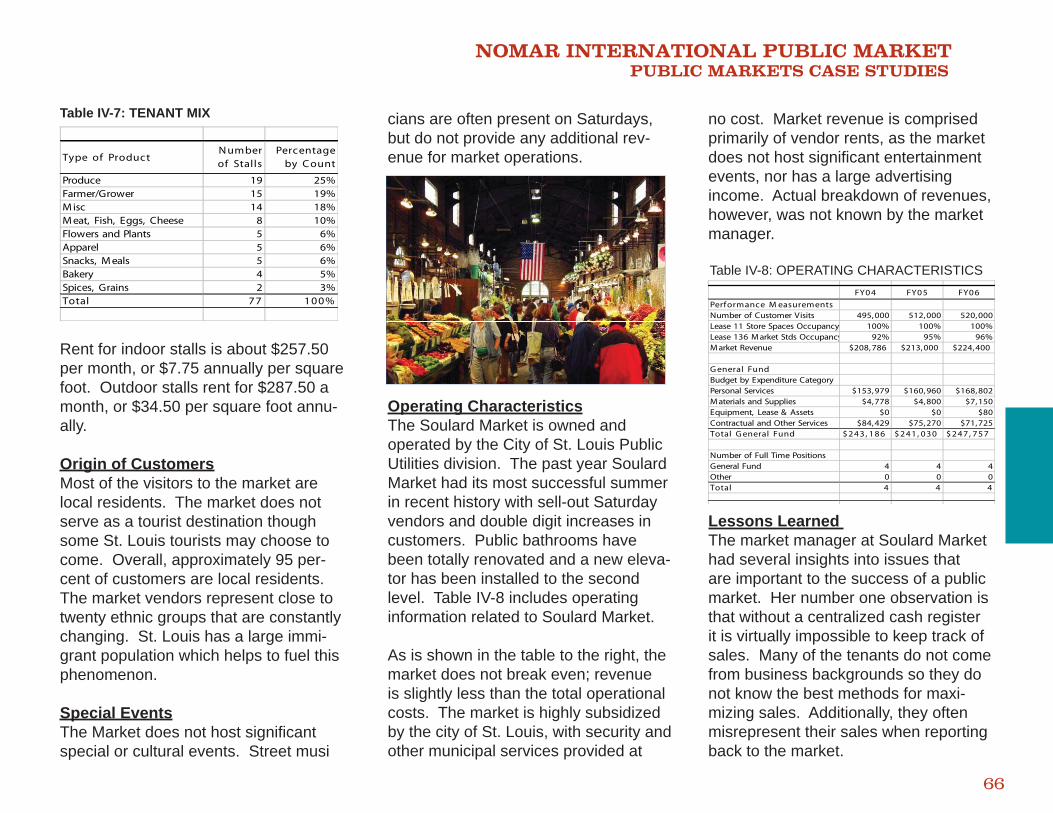
NOMAR INTERNATIONAL PUBLIC MARKET PUBLIC MARKETS CASE STUDIES
66
Type of ProductN umber of Stalls
Percentage by C ount
Produce 19 25%Farmer/Grower 15 19%M isc 14 18%M eat, Fish, Eggs, Cheese 8 10%Flowers and Plants 5 6%Apparel 5 6%Snacks, M eals 5 6%Bakery 4 5%Spices, Grains 2 3%Total 77 100%
Rent for indoor stalls is about $257.50 per month, or $7.75 annually per square foot. Outdoor stalls rent for $287.50 a month, or $34.50 per square foot annu-ally.
Origin of CustomersMost of the visitors to the market are local residents. The market does not serve as a tourist destination though some St. Louis tourists may choose to come. Overall, approximately 95 per-cent of customers are local residents. The market vendors represent close to twenty ethnic groups that are constantly changing. St. Louis has a large immi-grant population which helps to fuel this phenomenon.
Special EventsThe Market does not host signifi cant special or cultural events. Street musi
cians are often present on Saturdays, but do not provide any additional rev-enue for market operations.
Operating CharacteristicsThe Soulard Market is owned and operated by the City of St. Louis Public Utilities division. The past year Soulard Market had its most successful summer in recent history with sell-out Saturday vendors and double digit increases in customers. Public bathrooms have been totally renovated and a new eleva-tor has been installed to the second level. Table IV-8 includes operating information related to Soulard Market.
As is shown in the table to the right, the market does not break even; revenue is slightly less than the total operational costs. The market is highly subsidized by the city of St. Louis, with security and other municipal services provided at
no cost. Market revenue is comprised primarily of vendor rents, as the market does not host signifi cant entertainment events, nor has a large advertising income. Actual breakdown of revenues, however, was not known by the market manager.
Lessons Learned The market manager at Soulard Market had several insights into issues that are important to the success of a public market. Her number one observation is that without a centralized cash register it is virtually impossible to keep track of sales. Many of the tenants do not come from business backgrounds so they do not know the best methods for maxi-mizing sales. Additionally, they often misrepresent their sales when reporting back to the market.
Table IV-7: TENANT MIX
FY04 FY05 FY06Performance M easurementsNumber of Customer Visits 495,000 512,000 520,000Lease 11 Store Spaces Occupancy 100% 100% 100%Lease 136 M arket Stds Occupancy 92% 95% 96%M arket Revenue $208,786 $213,000 $224,400
G eneral Fund Budget by Expenditure CategoryPersonal Services $153,979 $160,960 $168,802M aterials and Supplies $4,778 $4,800 $7,150Equipment, Lease & Assets $0 $0 $80Contractual and Other Services $84,429 $75,270 $71,725Total G eneral Fund $243, 186 $241, 030 $247, 757
Number of Full Time PositionsGeneral Fund 4 4 4Other 0 0 0Total 4 4 4
Table IV-8: OPERATING CHARACTERISTICS
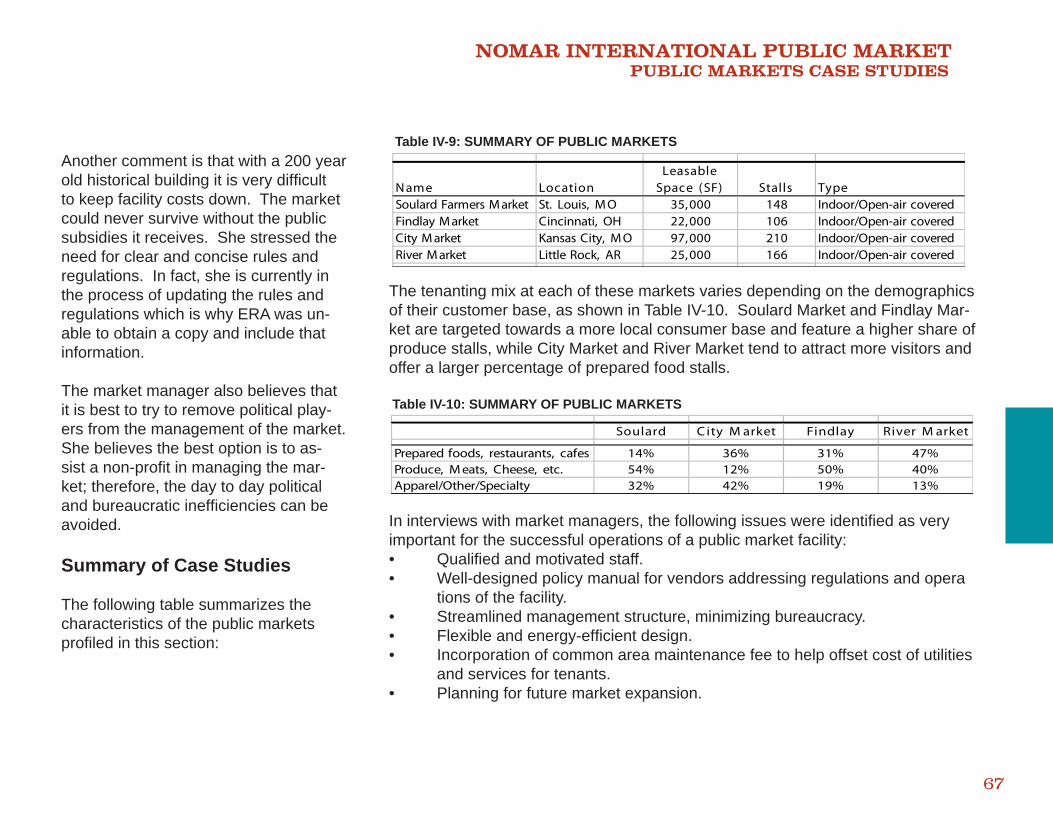
NOMAR INTERNATIONAL PUBLIC MARKET PUBLIC MARKETS CASE STUDIES
67
Another comment is that with a 200 year old historical building it is very diffi cult to keep facility costs down. The market could never survive without the public subsidies it receives. She stressed the need for clear and concise rules and regulations. In fact, she is currently in the process of updating the rules and regulations which is why ERA was un-able to obtain a copy and include that information.
The market manager also believes that it is best to try to remove political play-ers from the management of the market. She believes the best option is to as-sist a non-profi t in managing the mar-ket; therefore, the day to day political and bureaucratic ineffi ciencies can be avoided.
Summary of Case Studies
The following table summarizes the characteristics of the public markets profi led in this section:
The tenanting mix at each of these markets varies depending on the demographics of their customer base, as shown in Table IV-10. Soulard Market and Findlay Mar-ket are targeted towards a more local consumer base and feature a higher share of produce stalls, while City Market and River Market tend to attract more visitors and offer a larger percentage of prepared food stalls.
In interviews with market managers, the following issues were identifi ed as very important for the successful operations of a public market facility:• Qualifi ed and motivated staff.• Well-designed policy manual for vendors addressing regulations and opera tions of the facility.• Streamlined management structure, minimizing bureaucracy.• Flexible and energy-effi cient design.• Incorporation of common area maintenance fee to help offset cost of utilities and services for tenants.• Planning for future market expansion.
N ame LocationLeasable
Space (SF) Stalls TypeSoulard Farmers M arket St. Louis, M O 35,000 148 Indoor/Open-air coveredFindlay M arket Cincinnati, OH 22,000 106 Indoor/Open-air coveredCity M arket Kansas City, M O 97,000 210 Indoor/Open-air coveredRiver M arket Little Rock, AR 25,000 166 Indoor/Open-air covered
Table IV-9: SUMMARY OF PUBLIC MARKETS
Soulard C ity M arket Findlay River M arket
Prepared foods, restaurants, cafes 14% 36% 31% 47%Produce, M eats, Cheese, etc. 54% 12% 50% 40%Apparel/Other/Specialty 32% 42% 19% 13%
Table IV-10: SUMMARY OF PUBLIC MARKETS

NOMAR INTERNATIONAL PUBLIC MARKET CONCEPTS: DESIGN AND FINANCIAL FEASIBILITY
1
V. Concepts: Design and Financial Feasibility
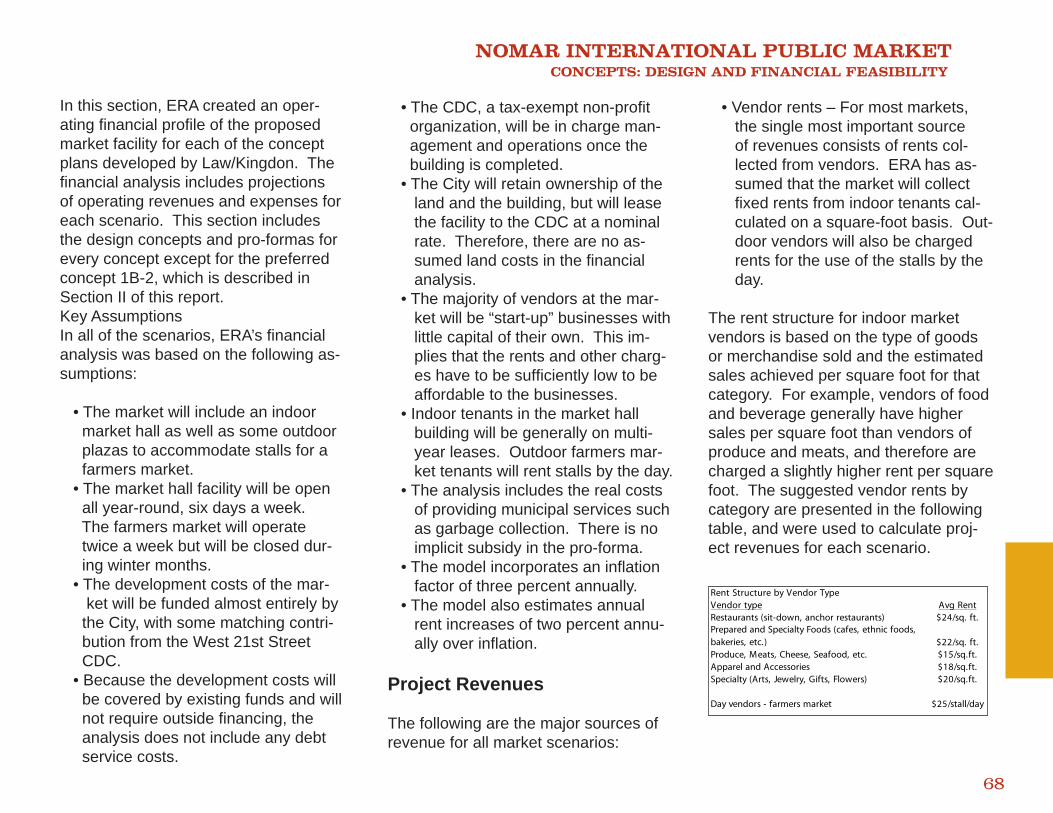
NOMAR INTERNATIONAL PUBLIC MARKET CONCEPTS: DESIGN AND FINANCIAL FEASIBILITY
68
In this section, ERA created an oper-ating fi nancial profi le of the proposed market facility for each of the concept plans developed by Law/Kingdon. The fi nancial analysis includes projections of operating revenues and expenses for each scenario. This section includes the design concepts and pro-formas for every concept except for the preferred concept 1B-2, which is described in Section II of this report.Key AssumptionsIn all of the scenarios, ERA’s fi nancial analysis was based on the following as-sumptions:
• The market will include an indoor market hall as well as some outdoor plazas to accommodate stalls for a farmers market. • The market hall facility will be open all year-round, six days a week. The farmers market will operate twice a week but will be closed dur- ing winter months. • The development costs of the mar- ket will be funded almost entirely by the City, with some matching contri- bution from the West 21st Street CDC. • Because the development costs will be covered by existing funds and will not require outside fi nancing, the analysis does not include any debt service costs.
• The CDC, a tax-exempt non-profi t organization, will be in charge man- agement and operations once the building is completed. • The City will retain ownership of the land and the building, but will lease the facility to the CDC at a nominal rate. Therefore, there are no as- sumed land costs in the fi nancial analysis. • The majority of vendors at the mar- ket will be “start-up” businesses with little capital of their own. This im- plies that the rents and other charg- es have to be suffi ciently low to be affordable to the businesses. • Indoor tenants in the market hall building will be generally on multi- year leases. Outdoor farmers mar- ket tenants will rent stalls by the day. • The analysis includes the real costs of providing municipal services such as garbage collection. There is no implicit subsidy in the pro-forma. • The model incorporates an infl ation factor of three percent annually. • The model also estimates annual rent increases of two percent annu- ally over infl ation.
Project Revenues
The following are the major sources of revenue for all market scenarios:
• Vendor rents – For most markets, the single most important source of revenues consists of rents col- lected from vendors. ERA has as- sumed that the market will collect fi xed rents from indoor tenants cal- culated on a square-foot basis. Out- door vendors will also be charged rents for the use of the stalls by the day.
The rent structure for indoor market vendors is based on the type of goods or merchandise sold and the estimated sales achieved per square foot for that category. For example, vendors of food and beverage generally have higher sales per square foot than vendors of produce and meats, and therefore are charged a slightly higher rent per square foot. The suggested vendor rents by category are presented in the following table, and were used to calculate proj-ect revenues for each scenario.
Rent Structure by Vendor TypeVendor type Avg RentRestaurants (sit-down, anchor restaurants) $24/sq. ft.Prepared and Specialty Foods (cafes, ethnic foods, bakeries, etc.) $22/sq. ft.Produce, Meats, Cheese, Seafood, etc. $15/sq.ft.Apparel and Accessories $18/sq.ft.Specialty (Arts, Jewelry, Gifts, Flowers) $20/sq.ft.
Day vendors - farmers market $25/stall/day
NOMAR INTERNATIONAL PUBLIC MARKET CONCEPTS: DESIGN AND FINANCIAL FEASIBILITY
69
• Common area maintenance (CAM) charges – In addition to the rents, vendors will also be charged a com- mon area maintenance fee which helps to defray the costs of building maintenance. • Events, advertising and sponsor- ships – Many public markets are increasingly looking to supplement their vendor-generated revenues with revenues from special events, sponsorships, and by providing space in plazas or in the market building for advertising. • Cold storage fees – In some of the design concepts, cold storage space was designated. Vendors will be charged a fl at fee of $50 per month for use of cold storage units. • Parking – Though this is a revenue generator for some public markets, ERA does not anticipate that the No- mar International Market will charge for public parking. For the most part, the market facility will rely on shared parking to be able to provide enough spaces for visitors.
Project Expenses
ERA has identifi ed the following major cost items for the operation of the mar-ket facility:
• Personnel – Personnel costs are usually the biggest expense in the operations budget of a public market. To ensure the success of the market, it is important to recruit highly quali- fi ed and motivated staff. The staffi ng plan is different for each scenario, given budget constraints. The key management and operations staff positions include:
o Market Director- The market director provides leadership and acts as the chief liaison with the CDC Board and City staff. The market director implements stra- tegic decisions concerning the market, heads up fundraising efforts, manages the market’s budget, and serves as the spokesperson for the facility. The ideal candidate should be expe- rienced in leadership and man- agement positions, and should have an entrepreneurial back ground. The estimated salary for this position is $64,000 full-time.
o Market Manager – The Market Manager handles the day-to-day operations of the market, includ- ing leasing, managing ven- dor issues, planning of programs and events, offi ce administration,
and any other issues that may arise on a daily basis. The ideal candidate has a strong back ground in retail and/or property management. The estimated sal ary for this position is $40,000 full-time and $30,000 part-time.
o Maintenance Staff – The market building and grounds will re- quire on-site maintenance staff to keep the facility functioning and clean. The wages for this posi- tion are estimated at $16,000 per full-time employee.
o Security – Because the City is not providing any police services to the market, some security staff will be needed. The wages for this position are estimated at $24,000 per full-time employee.
• Marketing/Advertising/Events – The market’s success will largely be de- termined in the fi rst few years of operation. In order to attract custom- ers and vendors, the market will need to have an active marketing campaign, which may include ads in the newspaper, radio, and other media; posters and fl yers distrib- uted around town; and holding spe- cial events. In the fi rst two to three
NOMAR INTERNATIONAL PUBLIC MARKET CONCEPTS: DESIGN AND FINANCIAL FEASIBILITY
70
years, the marketing budget will be larger than in the following years, once the facility has become better established.
• Utilities – The second largest cost to public markets is the cost of pro- viding utilities. The market building will be heated but not cooled, and will require gas, electric, and water/ sewer utilities. The cost of utilities is only partially offset by CAM charges.
• Garbage and Recycling – Because the City is not planning to subsidize any of its services to the market, ERA has estimated the annual cost of trash collection.
• Other costs – The market will in cur additional operating costs such as insurance, legal/professional costs, and permits/fees. It is as- sumed that the facility will be cov- ered by the City’s liability insurance.
• Contingency – The model has built in a contingency factor of 10 percent of total expenses to account for certain capital replacement costs, tenant improvement allowances, and other factors that may come up dur- ing the course of the market’s opera- tions.
Pro-Formas by Scenario
As mentioned above, ERA developed detailed pro-formas for each of the con-cept plans developed by Law/Kingdon. The preferred concept, Concept 1B-2, is presented in the Executive Summary. The following describes the operating budget for each of the alternative sce-narios considered.
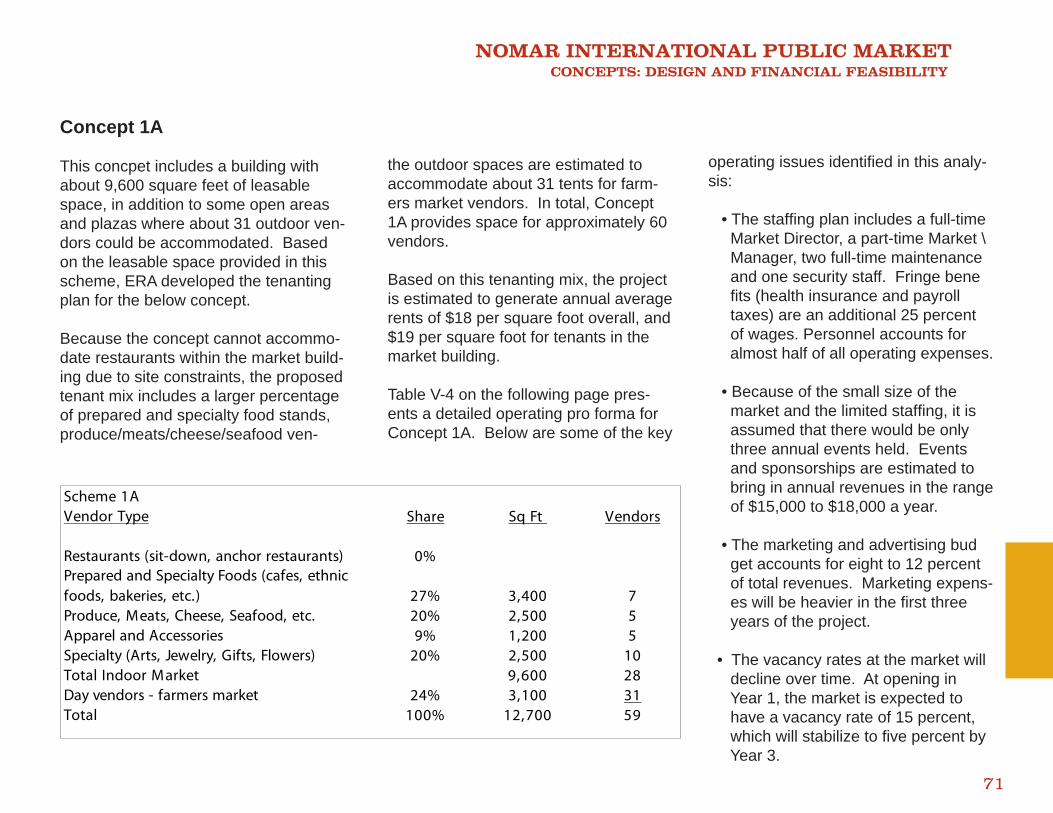
NOMAR INTERNATIONAL PUBLIC MARKET CONCEPTS: DESIGN AND FINANCIAL FEASIBILITY
71
Concept 1A
This concpet includes a building with about 9,600 square feet of leasable space, in addition to some open areas and plazas where about 31 outdoor ven-dors could be accommodated. Based on the leasable space provided in this scheme, ERA developed the tenanting plan for the below concept.
Because the concept cannot accommo-date restaurants within the market build-ing due to site constraints, the proposed tenant mix includes a larger percentage of prepared and specialty food stands, produce/meats/cheese/seafood ven-
the outdoor spaces are estimated to accommodate about 31 tents for farm-ers market vendors. In total, Concept 1A provides space for approximately 60 vendors.
Based on this tenanting mix, the project is estimated to generate annual average rents of $18 per square foot overall, and $19 per square foot for tenants in the market building.
Table V-4 on the following page pres-ents a detailed operating pro forma forConcept 1A. Below are some of the key
operating issues identifi ed in this analy-sis:
• The staffi ng plan includes a full-time Market Director, a part-time Market \ Manager, two full-time maintenance and one security staff. Fringe bene fi ts (health insurance and payroll taxes) are an additional 25 percent of wages. Personnel accounts for almost half of all operating expenses. • Because of the small size of the market and the limited staffi ng, it is assumed that there would be only three annual events held. Events and sponsorships are estimated to bring in annual revenues in the range of $15,000 to $18,000 a year.
• The marketing and advertising bud get accounts for eight to 12 percent of total revenues. Marketing expens- es will be heavier in the fi rst three years of the project.
• The vacancy rates at the market will decline over time. At opening in Year 1, the market is expected to have a vacancy rate of 15 percent, which will stabilize to fi ve percent by Year 3.
Scheme 1AVendor Type Share Sq Ft Vendors
Restaurants (sit-down, anchor restaurants) 0%Prepared and Specialty Foods (cafes, ethnic foods, bakeries, etc.) 27% 3,400 7Produce, Meats, Cheese, Seafood, etc. 20% 2,500 5Apparel and Accessories 9% 1,200 5Specialty (Arts, Jewelry, Gifts, Flowers) 20% 2,500 10Total Indoor Market 9,600 28Day vendors - farmers market 24% 3,100 31Total 100% 12,700 59
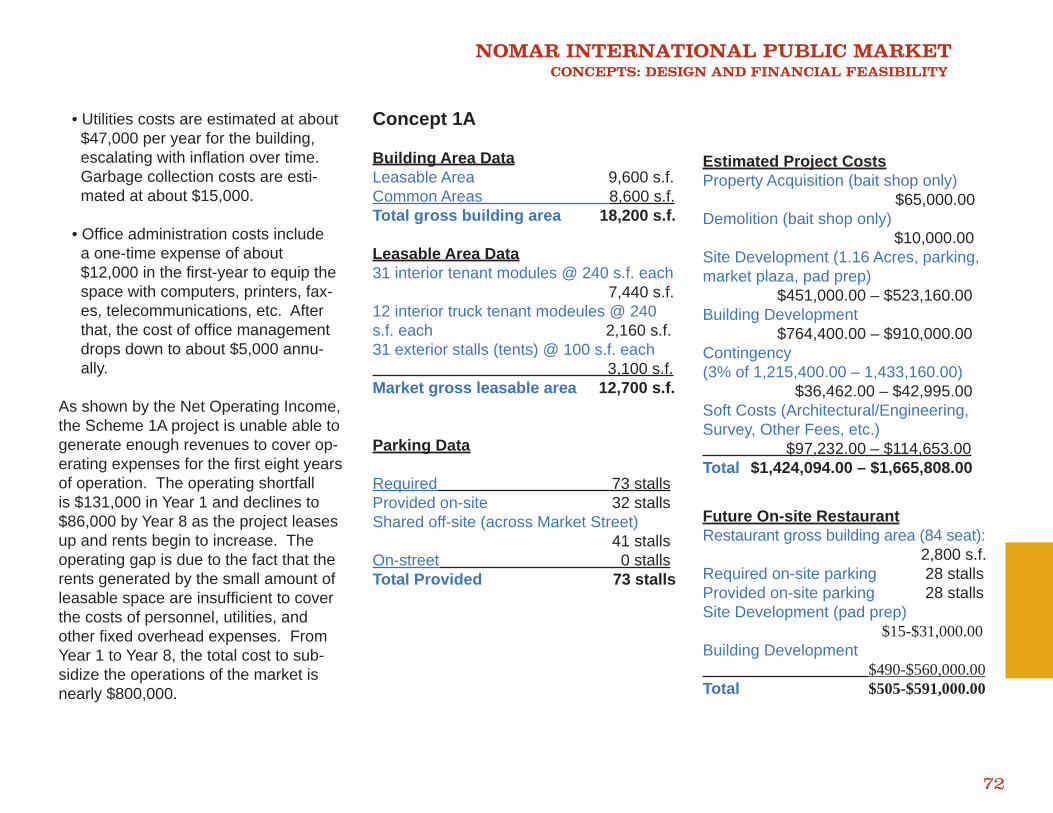
NOMAR INTERNATIONAL PUBLIC MARKET CONCEPTS: DESIGN AND FINANCIAL FEASIBILITY
72
• Utilities costs are estimated at about $47,000 per year for the building, escalating with infl ation over time. Garbage collection costs are esti- mated at about $15,000.
• Offi ce administration costs include a one-time expense of about $12,000 in the fi rst-year to equip the space with computers, printers, fax- es, telecommunications, etc. After that, the cost of offi ce management drops down to about $5,000 annu- ally.
As shown by the Net Operating Income, the Scheme 1A project is unable able to generate enough revenues to cover op-erating expenses for the fi rst eight years of operation. The operating shortfall is $131,000 in Year 1 and declines to $86,000 by Year 8 as the project leases up and rents begin to increase. The operating gap is due to the fact that the rents generated by the small amount of leasable space are insuffi cient to cover the costs of personnel, utilities, and other fi xed overhead expenses. From Year 1 to Year 8, the total cost to sub-sidize the operations of the market is nearly $800,000.
Estimated Project CostsProperty Acquisition (bait shop only) $65,000.00Demolition (bait shop only) $10,000.00Site Development (1.16 Acres, parking, market plaza, pad prep) $451,000.00 – $523,160.00Building Development $764,400.00 – $910,000.00Contingency (3% of 1,215,400.00 – 1,433,160.00) $36,462.00 – $42,995.00Soft Costs (Architectural/Engineering, Survey, Other Fees, etc.) $97,232.00 – $114,653.00Total $1,424,094.00 – $1,665,808.00
Future On-site RestaurantRestaurant gross building area (84 seat): 2,800 s.f. Required on-site parking 28 stallsProvided on-site parking 28 stallsSite Development (pad prep) $15-$31,000.00Building Development $490-$560,000.00Total $505-$591,000.00
Concept 1A
Building Area DataLeasable Area 9,600 s.f.Common Areas 8,600 s.f.Total gross building area 18,200 s.f. Leasable Area Data31 interior tenant modules @ 240 s.f. each 7,440 s.f.12 interior truck tenant modeules @ 240 s.f. each 2,160 s.f.31 exterior stalls (tents) @ 100 s.f. each 3,100 s.f.Market gross leasable area 12,700 s.f.
Parking Data
Required 73 stallsProvided on-site 32 stallsShared off-site (across Market Street) 41 stallsOn-street 0 stallsTotal Provided 73 stalls
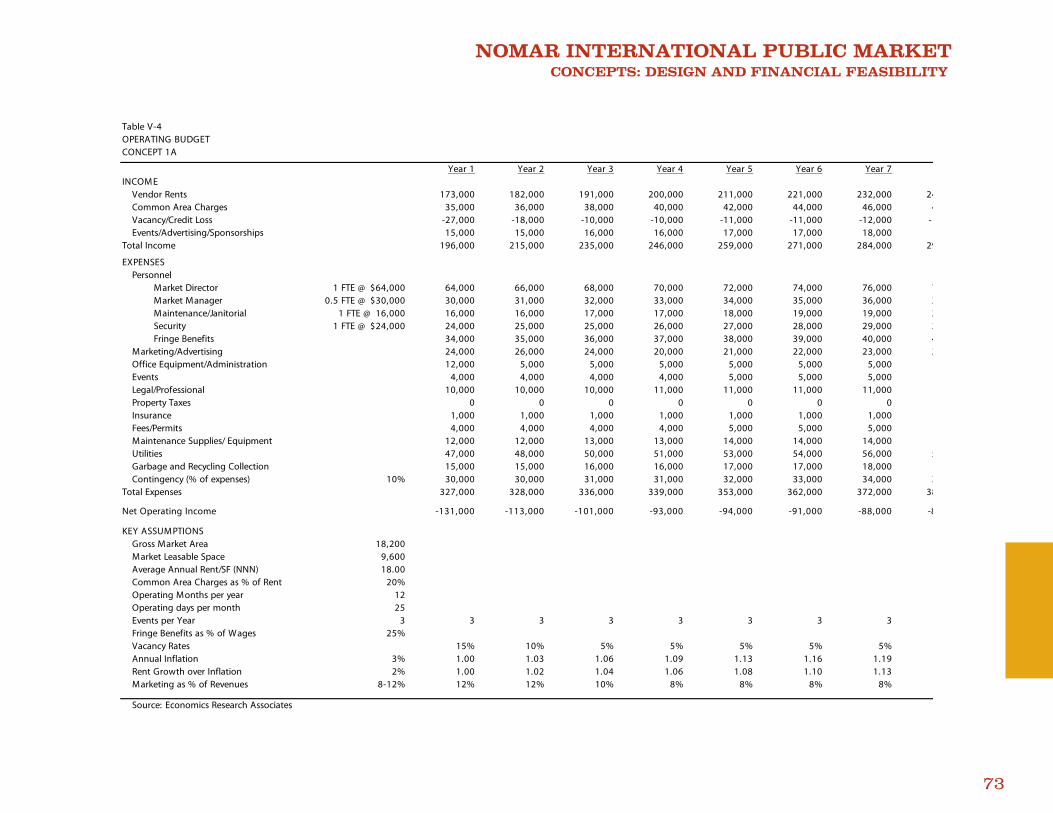
NOMAR INTERNATIONAL PUBLIC MARKET CONCEPTS: DESIGN AND FINANCIAL FEASIBILITY
73
Table V-4OPERATING BUDGETCONCEPT 1A
Year 1 Year 2 Year 3 Year 4 Year 5 Year 6 Year 7INCOME
Vendor Rents 173,000 182,000 191,000 200,000 211,000 221,000 232,000 24Common Area Charges 35,000 36,000 38,000 40,000 42,000 44,000 46,000 4Vacancy/Credit Loss -27,000 -18,000 -10,000 -10,000 -11,000 -11,000 -12,000 -1Events/Advertising/Sponsorships 15,000 15,000 16,000 16,000 17,000 17,000 18,000 1
Total Income 196,000 215,000 235,000 246,000 259,000 271,000 284,000 29
EXPENSESPersonnel
Market Director 1 FTE @ $64,000 64,000 66,000 68,000 70,000 72,000 74,000 76,000 7Market Manager 0.5 FTE @ $30,000 30,000 31,000 32,000 33,000 34,000 35,000 36,000 3Maintenance/Janitorial 1 FTE @ 16,000 16,000 16,000 17,000 17,000 18,000 19,000 19,000 2Security 1 FTE @ $24,000 24,000 25,000 25,000 26,000 27,000 28,000 29,000 3Fringe Benefits 34,000 35,000 36,000 37,000 38,000 39,000 40,000 4
Marketing/Advertising 24,000 26,000 24,000 20,000 21,000 22,000 23,000 2Office Equipment/Administration 12,000 5,000 5,000 5,000 5,000 5,000 5,000Events 4,000 4,000 4,000 4,000 5,000 5,000 5,000Legal/Professional 10,000 10,000 10,000 11,000 11,000 11,000 11,000 1Property Taxes 0 0 0 0 0 0 0Insurance 1,000 1,000 1,000 1,000 1,000 1,000 1,000Fees/Permits 4,000 4,000 4,000 4,000 5,000 5,000 5,000Maintenance Supplies/ Equipment 12,000 12,000 13,000 13,000 14,000 14,000 14,000 1Utilities 47,000 48,000 50,000 51,000 53,000 54,000 56,000 5Garbage and Recycling Collection 15,000 15,000 16,000 16,000 17,000 17,000 18,000 1Contingency (% of expenses) 10% 30,000 30,000 31,000 31,000 32,000 33,000 34,000 3
Total Expenses 327,000 328,000 336,000 339,000 353,000 362,000 372,000 38
Net Operating Income -131,000 -113,000 -101,000 -93,000 -94,000 -91,000 -88,000 -8
KEY ASSUMPTIONSGross Market Area 18,200Market Leasable Space 9,600Average Annual Rent/SF (NNN) 18.00Common Area Charges as % of Rent 20%Operating Months per year 12Operating days per month 25Events per Year 3 3 3 3 3 3 3 3Fringe Benefits as % of Wages 25%Vacancy Rates 15% 10% 5% 5% 5% 5% 5%Annual Inflation 3% 1.00 1.03 1.06 1.09 1.13 1.16 1.19Rent Growth over Inflation 2% 1.00 1.02 1.04 1.06 1.08 1.10 1.13Marketing as % of Revenues 8-12% 12% 12% 10% 8% 8% 8% 8%
Source: Economics Research Associates
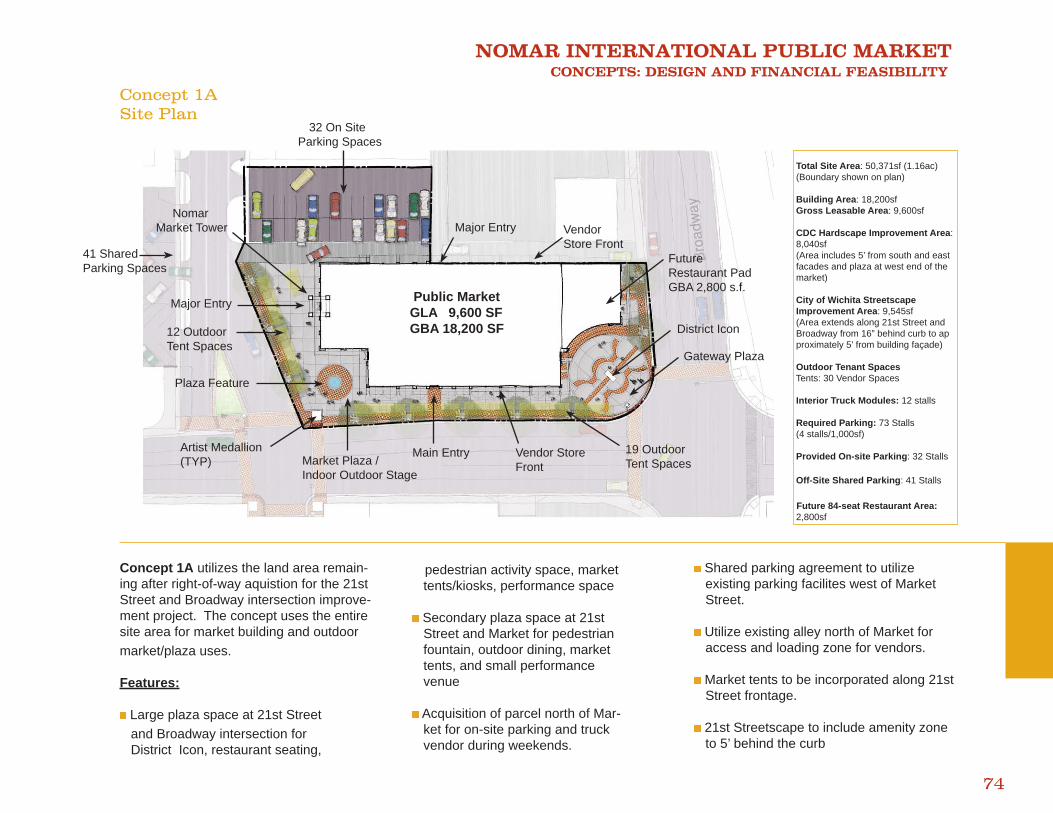
NOMAR INTERNATIONAL PUBLIC MARKET CONCEPTS: DESIGN AND FINANCIAL FEASIBILITY
74
Concept 1A utilizes the land area remain-ing after right-of-way aquistion for the 21st Street and Broadway intersection improve-ment project. The concept uses the entire site area for market building and outdoor market/plaza uses.
Features:
Large plaza space at 21st Street and Broadway intersection for District Icon, restaurant seating,
pedestrian activity space, market tents/kiosks, performance space
Secondary plaza space at 21st Street and Market for pedestrian fountain, outdoor dining, market tents, and small performance venue
Acquisition of parcel north of Mar- ket for on-site parking and truck vendor during weekends.
Shared parking agreement to utilize existing parking facilites west of Market Street.
Utilize existing alley north of Market for access and loading zone for vendors.
Market tents to be incorporated along 21st Street frontage.
21st Streetscape to include amenity zone to 5’ behind the curb
Concept 1ASite Plan
32 On Site Parking Spaces
Major Entry Vendor Store Front
District Icon
Gateway Plaza
19 OutdoorTent Spaces
Vendor Store Front
Main EntryMarket Plaza / Indoor Outdoor Stage
41 Shared Parking Spaces
12 Outdoor Tent Spaces
Plaza Feature
Artist Medallion(TYP)
Public Market GLA 9,600 SF GBA 18,200 SF
Major Entry
Future Restaurant Pad GBA 2,800 s.f.
Nomar Market Tower
Total Site Area: 50,371sf (1.16ac) (Boundary shown on plan) Building Area: 18,200sf Gross Leasable Area: 9,600sf
CDC Hardscape Improvement Area: 8,040sf (Area includes 5’ from south and east facades and plaza at west end of the market)
City of Wichita Streetscape Improvement Area: 9,545sf (Area extends along 21st Street and Broadway from 16” behind curb to ap proximately 5’ from building façade)
Outdoor Tenant Spaces Tents: 30 Vendor Spaces
Interior Truck Modules: 12 stalls
Required Parking: 73 Stalls (4 stalls/1,000sf)
Provided On-site Parking: 32 Stalls
Off-Site Shared Parking: 41 Stalls
Future 84-seat Restaurant Area: 2,800sf
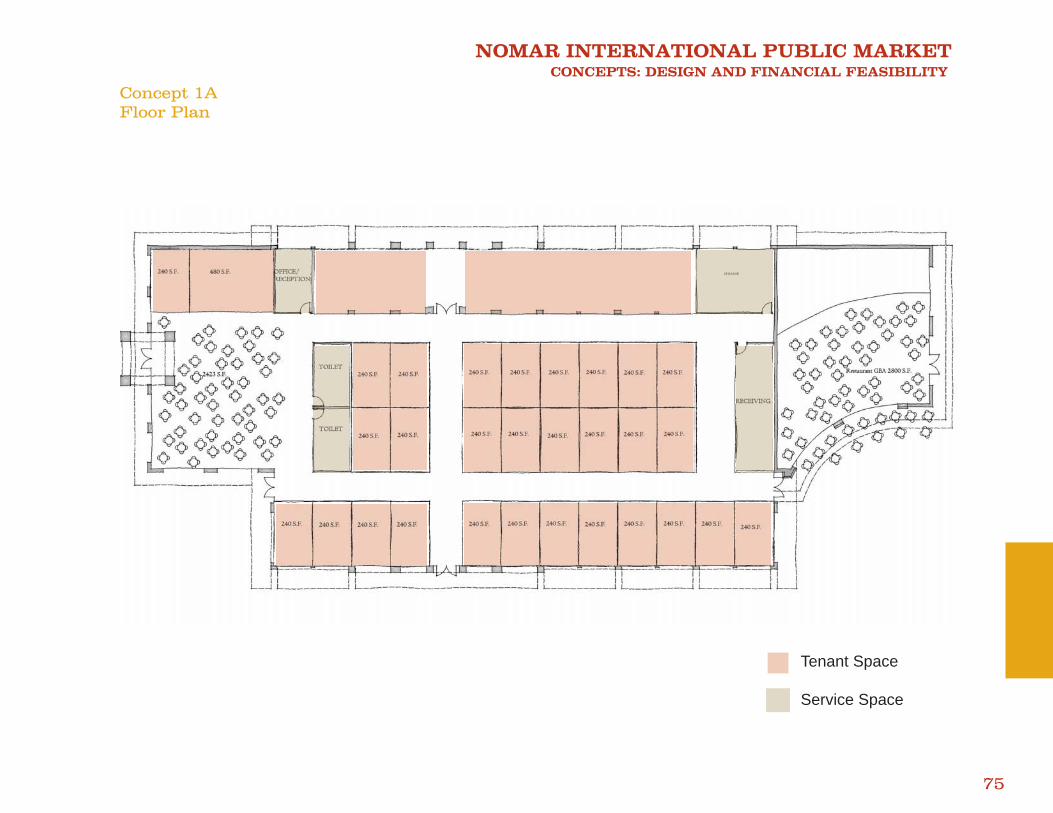
NOMAR INTERNATIONAL PUBLIC MARKET CONCEPTS: DESIGN AND FINANCIAL FEASIBILITY
75
Concept 1AFloor Plan
Tenant Space
Service Space
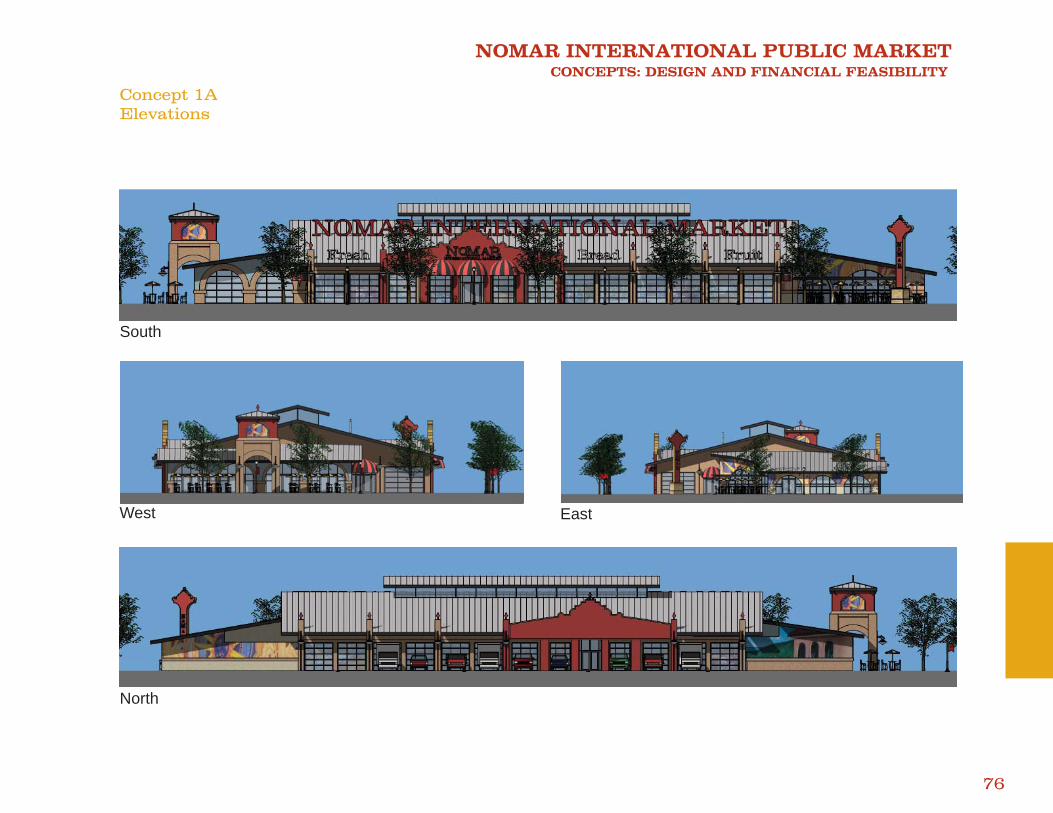
NOMAR INTERNATIONAL PUBLIC MARKET CONCEPTS: DESIGN AND FINANCIAL FEASIBILITY
76
Concept 1AElevations
South
West East
North
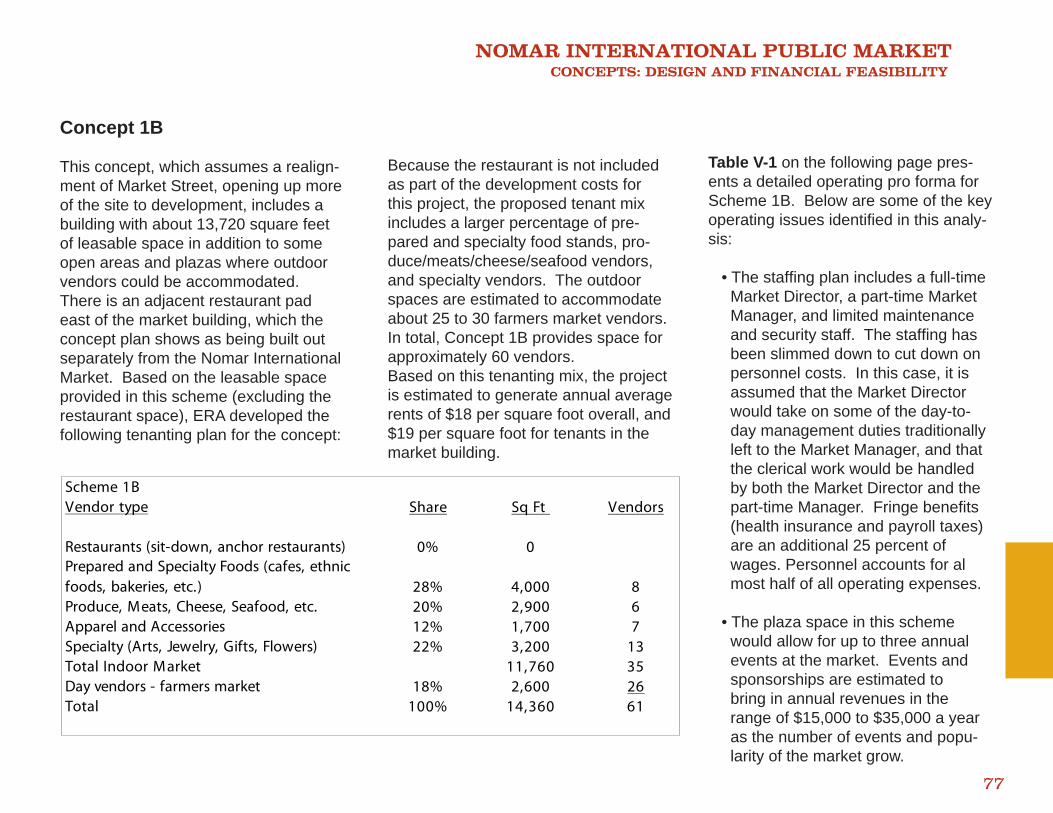
NOMAR INTERNATIONAL PUBLIC MARKET CONCEPTS: DESIGN AND FINANCIAL FEASIBILITY
77
Concept 1B
This concept, which assumes a realign-ment of Market Street, opening up more of the site to development, includes a building with about 13,720 square feet of leasable space in addition to some open areas and plazas where outdoor vendors could be accommodated. There is an adjacent restaurant pad east of the market building, which the concept plan shows as being built out separately from the Nomar International Market. Based on the leasable space provided in this scheme (excluding the restaurant space), ERA developed the following tenanting plan for the concept:
Because the restaurant is not included as part of the development costs for this project, the proposed tenant mix includes a larger percentage of pre-pared and specialty food stands, pro-duce/meats/cheese/seafood vendors, and specialty vendors. The outdoor spaces are estimated to accommodate about 25 to 30 farmers market vendors. In total, Concept 1B provides space for approximately 60 vendors.Based on this tenanting mix, the project is estimated to generate annual average rents of $18 per square foot overall, and $19 per square foot for tenants in the market building.
Table V-1 on the following page pres-ents a detailed operating pro forma for Scheme 1B. Below are some of the key operating issues identifi ed in this analy-sis:
• The staffi ng plan includes a full-time Market Director, a part-time Market Manager, and limited maintenance and security staff. The staffi ng has been slimmed down to cut down on personnel costs. In this case, it is assumed that the Market Director would take on some of the day-to- day management duties traditionally left to the Market Manager, and that the clerical work would be handled by both the Market Director and the part-time Manager. Fringe benefi ts (health insurance and payroll taxes) are an additional 25 percent of wages. Personnel accounts for al most half of all operating expenses.
• The plaza space in this scheme would allow for up to three annual events at the market. Events and sponsorships are estimated to bring in annual revenues in the range of $15,000 to $35,000 a year as the number of events and popu- larity of the market grow.
Scheme 1BVendor type Share Sq Ft Vendors
Restaurants (sit-down, anchor restaurants) 0% 0Prepared and Specialty Foods (cafes, ethnic foods, bakeries, etc.) 28% 4,000 8Produce, Meats, Cheese, Seafood, etc. 20% 2,900 6Apparel and Accessories 12% 1,700 7Specialty (Arts, Jewelry, Gifts, Flowers) 22% 3,200 13Total Indoor Market 11,760 35Day vendors - farmers market 18% 2,600 26Total 100% 14,360 61
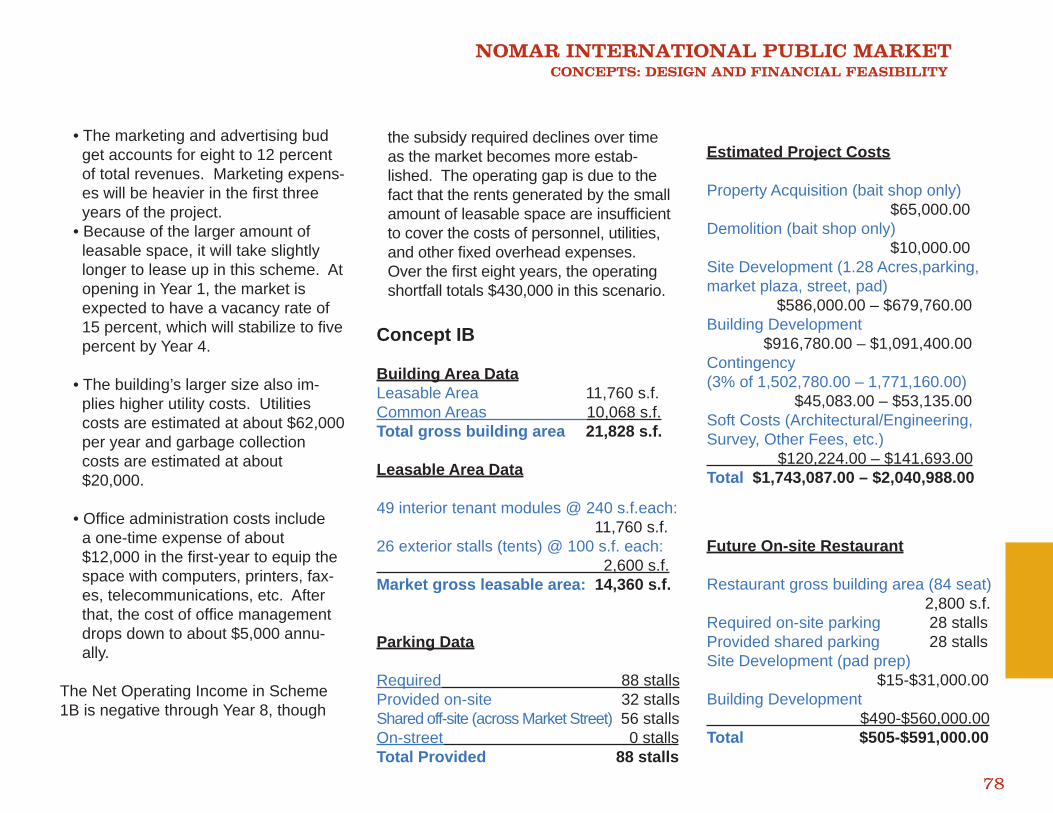
NOMAR INTERNATIONAL PUBLIC MARKET CONCEPTS: DESIGN AND FINANCIAL FEASIBILITY
78
• The marketing and advertising bud get accounts for eight to 12 percent of total revenues. Marketing expens- es will be heavier in the fi rst three years of the project. • Because of the larger amount of leasable space, it will take slightly longer to lease up in this scheme. At opening in Year 1, the market is expected to have a vacancy rate of 15 percent, which will stabilize to fi ve percent by Year 4.
• The building’s larger size also im- plies higher utility costs. Utilities costs are estimated at about $62,000 per year and garbage collection costs are estimated at about $20,000.
• Offi ce administration costs include a one-time expense of about $12,000 in the fi rst-year to equip the space with computers, printers, fax- es, telecommunications, etc. After that, the cost of offi ce management drops down to about $5,000 annu- ally.
The Net Operating Income in Scheme 1B is negative through Year 8, though
the subsidy required declines over time as the market becomes more estab-lished. The operating gap is due to the fact that the rents generated by the small amount of leasable space are insuffi cient to cover the costs of personnel, utilities, and other fi xed overhead expenses. Over the fi rst eight years, the operating shortfall totals $430,000 in this scenario.
Estimated Project Costs
Property Acquisition (bait shop only) $65,000.00Demolition (bait shop only) $10,000.00Site Development (1.28 Acres,parking, market plaza, street, pad) $586,000.00 – $679,760.00Building Development $916,780.00 – $1,091,400.00Contingency (3% of 1,502,780.00 – 1,771,160.00) $45,083.00 – $53,135.00Soft Costs (Architectural/Engineering, Survey, Other Fees, etc.) $120,224.00 – $141,693.00Total $1,743,087.00 – $2,040,988.00
Future On-site Restaurant
Restaurant gross building area (84 seat) 2,800 s.f.Required on-site parking 28 stallsProvided shared parking 28 stallsSite Development (pad prep) $15-$31,000.00Building Development $490-$560,000.00Total $505-$591,000.00
Concept IB
Building Area DataLeasable Area 11,760 s.f.Common Areas 10,068 s.f.Total gross building area 21,828 s.f. Leasable Area Data
49 interior tenant modules @ 240 s.f.each: 11,760 s.f.26 exterior stalls (tents) @ 100 s.f. each: 2,600 s.f.Market gross leasable area: 14,360 s.f.
Parking Data
Required 88 stallsProvided on-site 32 stallsShared off-site (across Market Street) 56 stallsOn-street 0 stallsTotal Provided 88 stalls
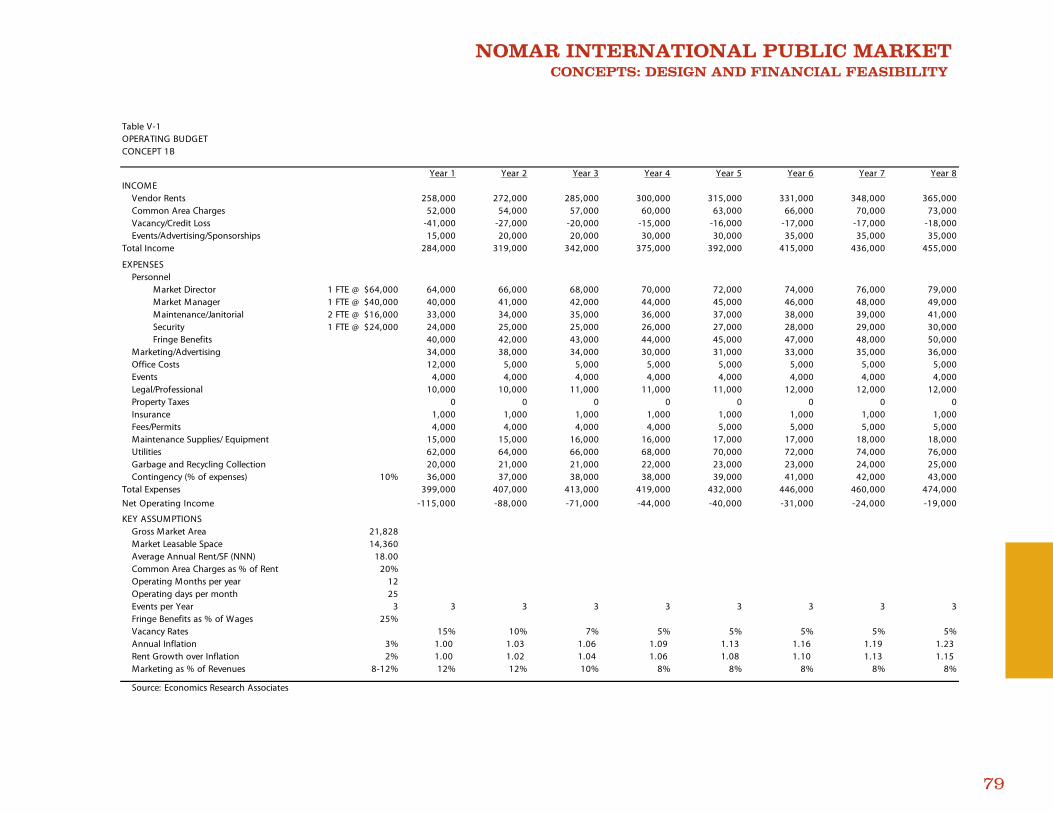
NOMAR INTERNATIONAL PUBLIC MARKET CONCEPTS: DESIGN AND FINANCIAL FEASIBILITY
79
Table V-1OPERATING BUDGETCONCEPT 1B
Year 1 Year 2 Year 3 Year 4 Year 5 Year 6 Year 7 Year 8INCOME
Vendor Rents 258,000 272,000 285,000 300,000 315,000 331,000 348,000 365,000Common Area Charges 52,000 54,000 57,000 60,000 63,000 66,000 70,000 73,000Vacancy/Credit Loss -41,000 -27,000 -20,000 -15,000 -16,000 -17,000 -17,000 -18,000Events/Advertising/Sponsorships 15,000 20,000 20,000 30,000 30,000 35,000 35,000 35,000
Total Income 284,000 319,000 342,000 375,000 392,000 415,000 436,000 455,000
EXPENSESPersonnel
Market Director 1 FTE @ $64,000 64,000 66,000 68,000 70,000 72,000 74,000 76,000 79,000Market Manager 1 FTE @ $40,000 40,000 41,000 42,000 44,000 45,000 46,000 48,000 49,000Maintenance/Janitorial 2 FTE @ $16,000 33,000 34,000 35,000 36,000 37,000 38,000 39,000 41,000Security 1 FTE @ $24,000 24,000 25,000 25,000 26,000 27,000 28,000 29,000 30,000Fringe Benefits 40,000 42,000 43,000 44,000 45,000 47,000 48,000 50,000
Marketing/Advertising 34,000 38,000 34,000 30,000 31,000 33,000 35,000 36,000Office Costs 12,000 5,000 5,000 5,000 5,000 5,000 5,000 5,000Events 4,000 4,000 4,000 4,000 4,000 4,000 4,000 4,000Legal/Professional 10,000 10,000 11,000 11,000 11,000 12,000 12,000 12,000Property Taxes 0 0 0 0 0 0 0 0Insurance 1,000 1,000 1,000 1,000 1,000 1,000 1,000 1,000Fees/Permits 4,000 4,000 4,000 4,000 5,000 5,000 5,000 5,000Maintenance Supplies/ Equipment 15,000 15,000 16,000 16,000 17,000 17,000 18,000 18,000Utilities 62,000 64,000 66,000 68,000 70,000 72,000 74,000 76,000Garbage and Recycling Collection 20,000 21,000 21,000 22,000 23,000 23,000 24,000 25,000Contingency (% of expenses) 10% 36,000 37,000 38,000 38,000 39,000 41,000 42,000 43,000
Total Expenses 399,000 407,000 413,000 419,000 432,000 446,000 460,000 474,000Net Operating Income -115,000 -88,000 -71,000 -44,000 -40,000 -31,000 -24,000 -19,000
KEY ASSUMPTIONSGross Market Area 21,828Market Leasable Space 14,360Average Annual Rent/SF (NNN) 18.00Common Area Charges as % of Rent 20%Operating Months per year 12Operating days per month 25Events per Year 3 3 3 3 3 3 3 3 3Fringe Benefits as % of Wages 25%Vacancy Rates 15% 10% 7% 5% 5% 5% 5% 5%Annual Inflation 3% 1.00 1.03 1.06 1.09 1.13 1.16 1.19 1.23 Rent Growth over Inflation 2% 1.00 1.02 1.04 1.06 1.08 1.10 1.13 1.15 Marketing as % of Revenues 8-12% 12% 12% 10% 8% 8% 8% 8% 8%
Source: Economics Research Associates
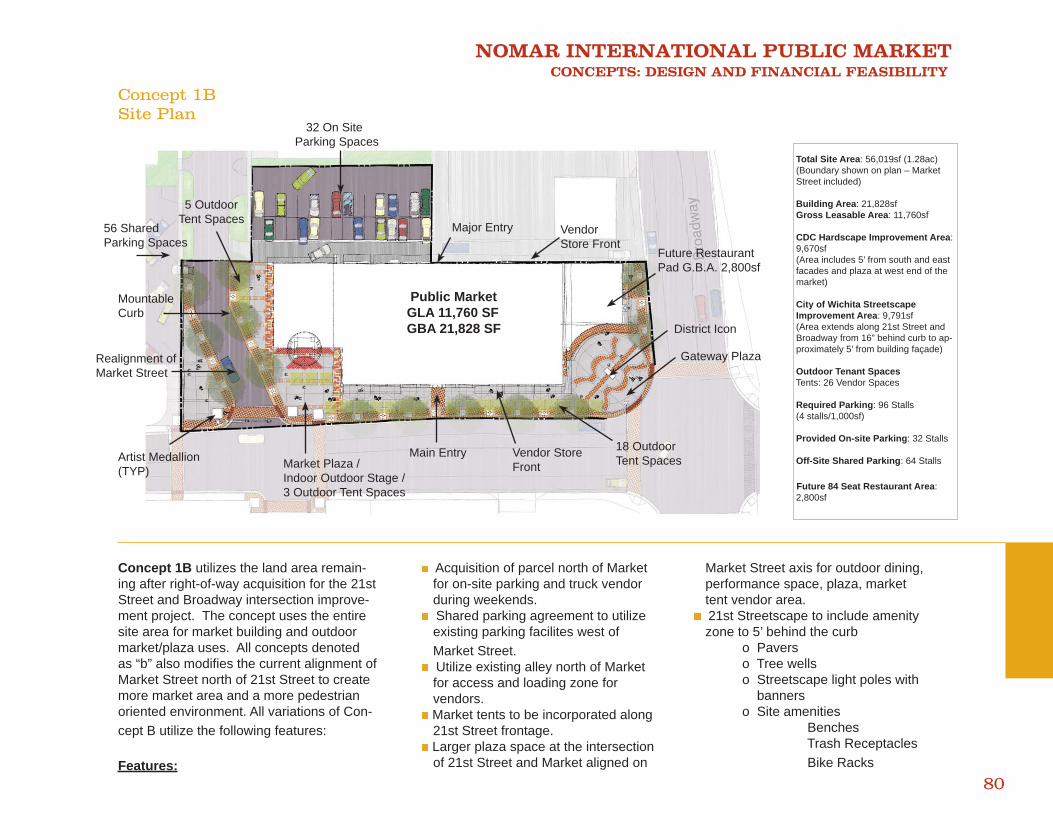
NOMAR INTERNATIONAL PUBLIC MARKET CONCEPTS: DESIGN AND FINANCIAL FEASIBILITY
80
32 On Site Parking Spaces
Major Entry Vendor Store Front
District Icon
Gateway Plaza
18 OutdoorTent Spaces
Vendor Store Front
Main EntryMarket Plaza / Indoor Outdoor Stage / 3 Outdoor Tent Spaces
56 Shared Parking Spaces
Realignment of Market Street
Artist Medallion(TYP)
Public Market GLA 11,760 SF GBA 21,828 SF
Mountable Curb
Concept 1BSite Plan
Concept 1B utilizes the land area remain-ing after right-of-way acquisition for the 21st Street and Broadway intersection improve-ment project. The concept uses the entire site area for market building and outdoor market/plaza uses. All concepts denoted as “b” also modifi es the current alignment of Market Street north of 21st Street to create more market area and a more pedestrian oriented environment. All variations of Con-cept B utilize the following features:
Features:
Acquisition of parcel north of Market for on-site parking and truck vendor during weekends. Shared parking agreement to utilize
existing parking facilites west of Market Street. Utilize existing alley north of Market
for access and loading zone for vendors. Market tents to be incorporated along
21st Street frontage. Larger plaza space at the intersection
of 21st Street and Market aligned on
Market Street axis for outdoor dining, performance space, plaza, market tent vendor area. 21st Streetscape to include amenity
zone to 5’ behind the curb o Pavers o Tree wells o Streetscape light poles with banners o Site amenities � Benches � Trash Receptacles � Bike Racks
Total Site Area: 56,019sf (1.28ac) (Boundary shown on plan – Market Street included)
Building Area: 21,828sf Gross Leasable Area: 11,760sf CDC Hardscape Improvement Area: 9,670sf (Area includes 5’ from south and east facades and plaza at west end of the market)
City of Wichita Streetscape Improvement Area: 9,791sf (Area extends along 21st Street and Broadway from 16” behind curb to ap- proximately 5’ from building façade)
Outdoor Tenant Spaces Tents: 26 Vendor Spaces
Required Parking: 96 Stalls (4 stalls/1,000sf)
Provided On-site Parking: 32 Stalls
Off-Site Shared Parking: 64 Stalls
Future 84 Seat Restaurant Area: 2,800sf
5 Outdoor Tent Spaces
Future RestaurantPad G.B.A. 2,800sf
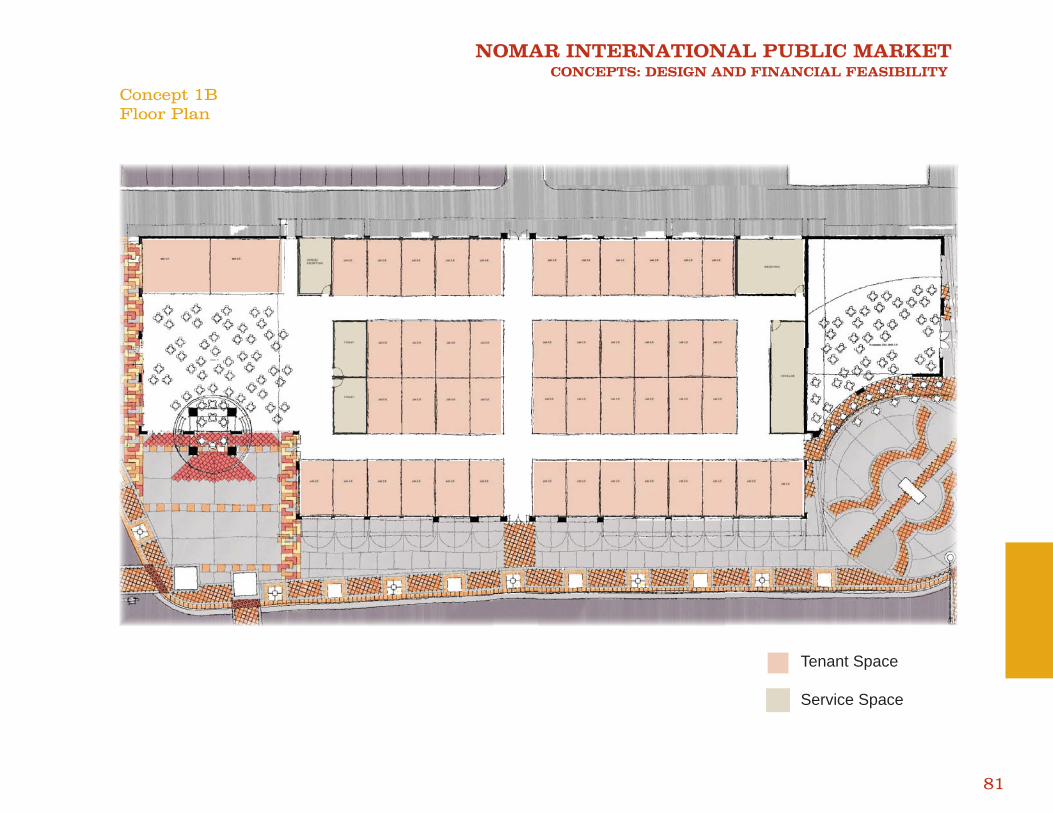
NOMAR INTERNATIONAL PUBLIC MARKET CONCEPTS: DESIGN AND FINANCIAL FEASIBILITY
81
Concept 1BFloor Plan
Tenant Space
Service Space
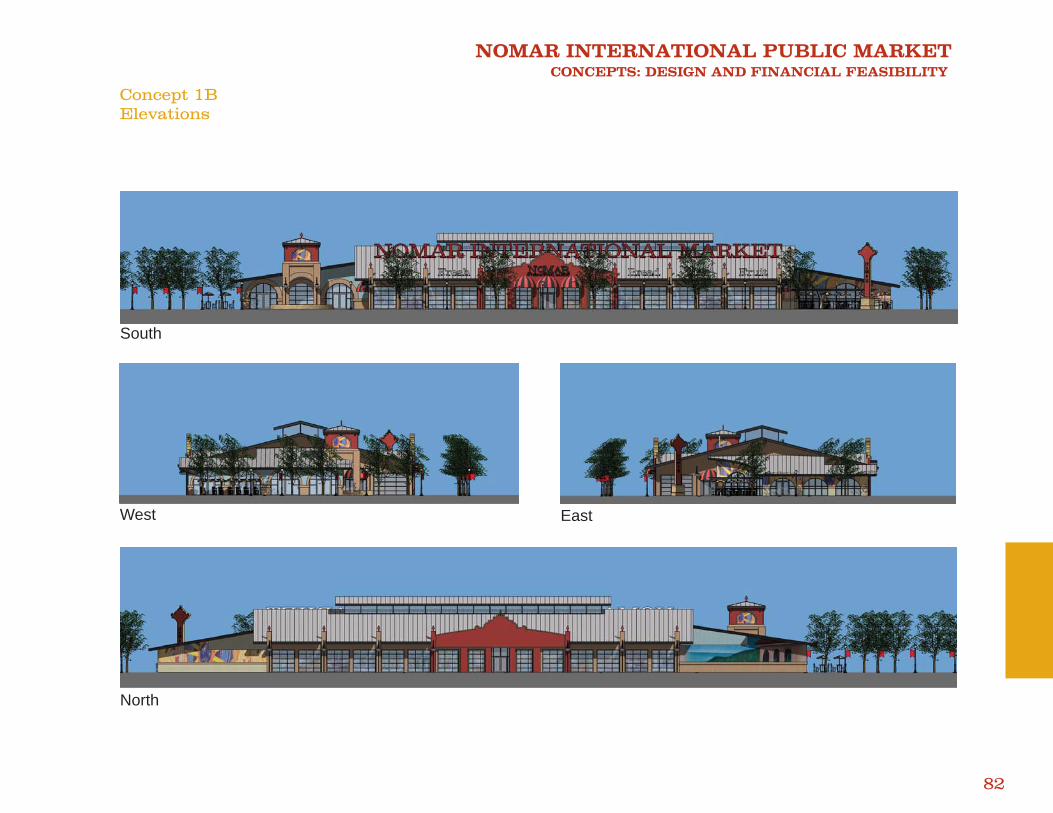
NOMAR INTERNATIONAL PUBLIC MARKET CONCEPTS: DESIGN AND FINANCIAL FEASIBILITY
82
South
West East
North
Concept 1BElevations
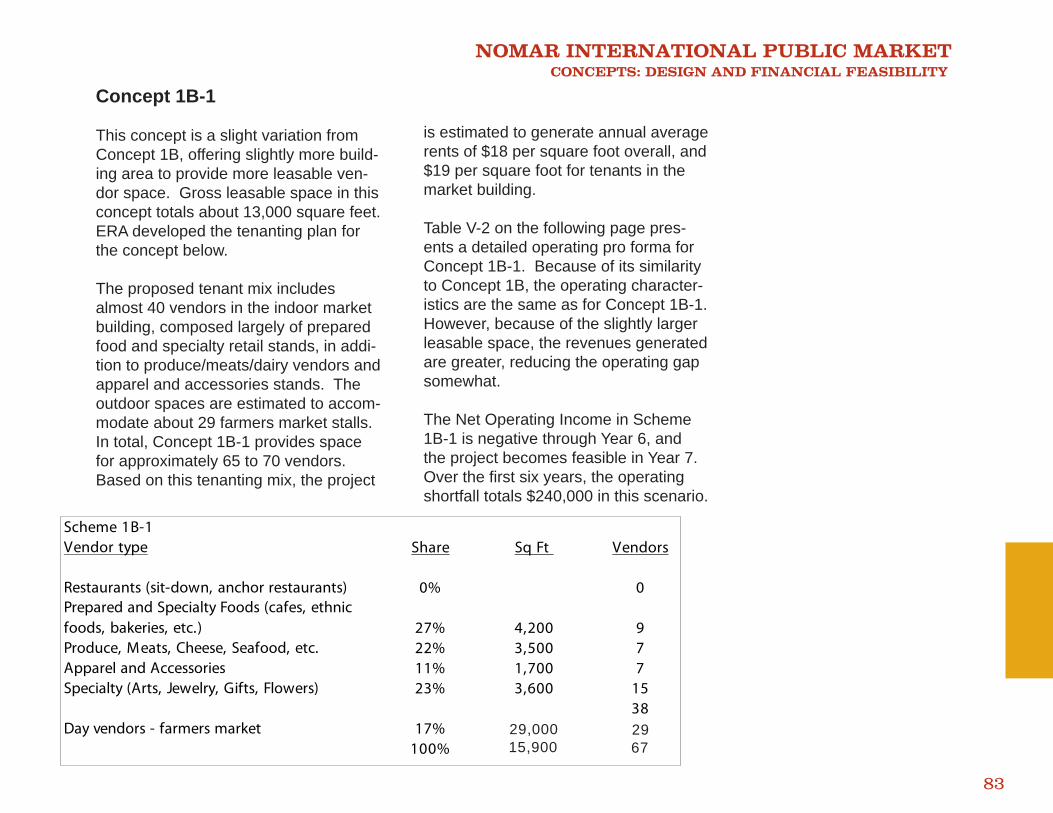
NOMAR INTERNATIONAL PUBLIC MARKET CONCEPTS: DESIGN AND FINANCIAL FEASIBILITY
83
Concept 1B-1
This concept is a slight variation from Concept 1B, offering slightly more build-ing area to provide more leasable ven-dor space. Gross leasable space in this concept totals about 13,000 square feet. ERA developed the tenanting plan for the concept below.
The proposed tenant mix includes almost 40 vendors in the indoor market building, composed largely of prepared food and specialty retail stands, in addi-tion to produce/meats/dairy vendors and apparel and accessories stands. The outdoor spaces are estimated to accom-modate about 29 farmers market stalls. In total, Concept 1B-1 provides spacefor approximately 65 to 70 vendors.Based on this tenanting mix, the project
is estimated to generate annual average rents of $18 per square foot overall, and $19 per square foot for tenants in the market building.
Table V-2 on the following page pres-ents a detailed operating pro forma for Concept 1B-1. Because of its similarity to Concept 1B, the operating character-istics are the same as for Concept 1B-1. However, because of the slightly larger leasable space, the revenues generated are greater, reducing the operating gap somewhat.
The Net Operating Income in Scheme 1B-1 is negative through Year 6, and the project becomes feasible in Year 7. Over the fi rst six years, the operating shortfall totals $240,000 in this scenario.
Scheme 1B-1Vendor type Share Sq Ft Vendors
Restaurants (sit-down, anchor restaurants) 0% 0Prepared and Specialty Foods (cafes, ethnic foods, bakeries, etc.) 27% 4,200 9Produce, Meats, Cheese, Seafood, etc. 22% 3,500 7Apparel and Accessories 11% 1,700 7Specialty (Arts, Jewelry, Gifts, Flowers) 23% 3,600 15
13,000 38Day vendors - farmers market 17% 2,600 26
100% 15,600 6429,00015,900
2967
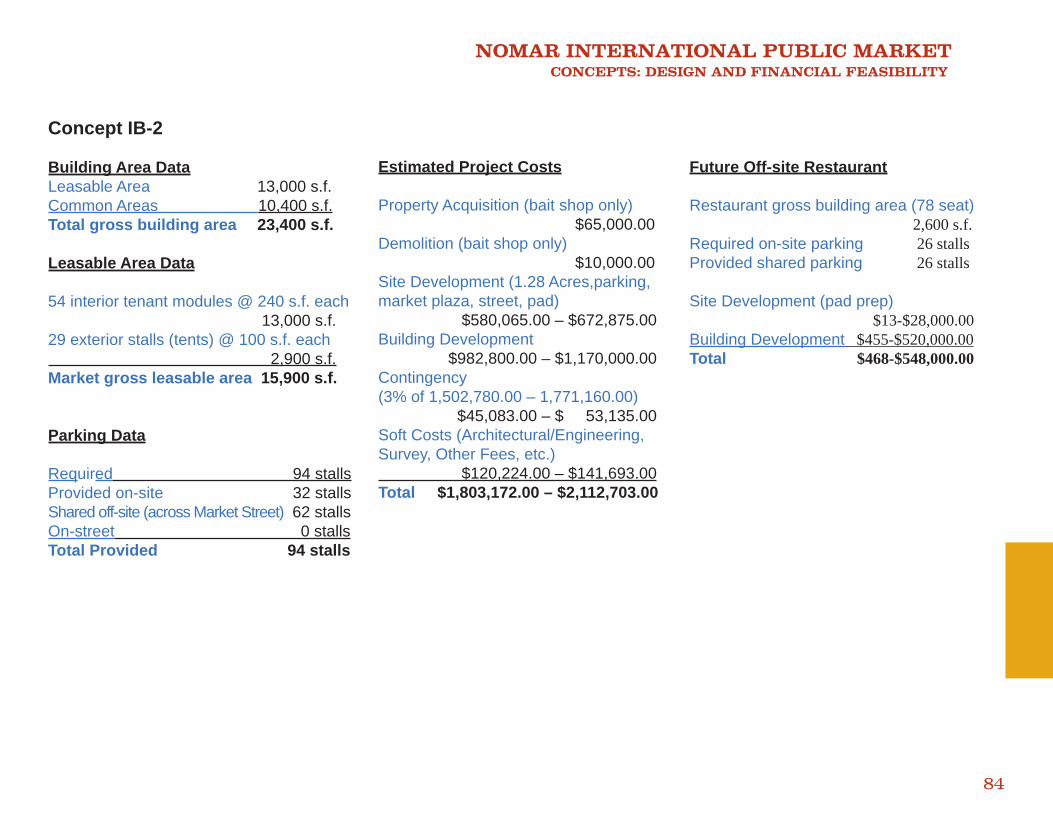
NOMAR INTERNATIONAL PUBLIC MARKET CONCEPTS: DESIGN AND FINANCIAL FEASIBILITY
84
Estimated Project Costs
Property Acquisition (bait shop only) $65,000.00Demolition (bait shop only) $10,000.00Site Development (1.28 Acres,parking, market plaza, street, pad) $580,065.00 – $672,875.00Building Development $982,800.00 – $1,170,000.00Contingency (3% of 1,502,780.00 – 1,771,160.00) $45,083.00 – $ 53,135.00Soft Costs (Architectural/Engineering, Survey, Other Fees, etc.) $120,224.00 – $141,693.00Total $1,803,172.00 – $2,112,703.00
Future Off-site Restaurant
Restaurant gross building area (78 seat) 2,600 s.f.Required on-site parking 26 stallsProvided shared parking 26 stalls
Site Development (pad prep) $13-$28,000.00Building Development $455-$520,000.00Total $468-$548,000.00
Concept IB-2
Building Area DataLeasable Area 13,000 s.f.Common Areas 10,400 s.f.Total gross building area 23,400 s.f. Leasable Area Data
54 interior tenant modules @ 240 s.f. each 13,000 s.f.29 exterior stalls (tents) @ 100 s.f. each 2,900 s.f.Market gross leasable area 15,900 s.f.
Parking Data
Required 94 stallsProvided on-site 32 stallsShared off-site (across Market Street) 62 stallsOn-street 0 stallsTotal Provided 94 stalls
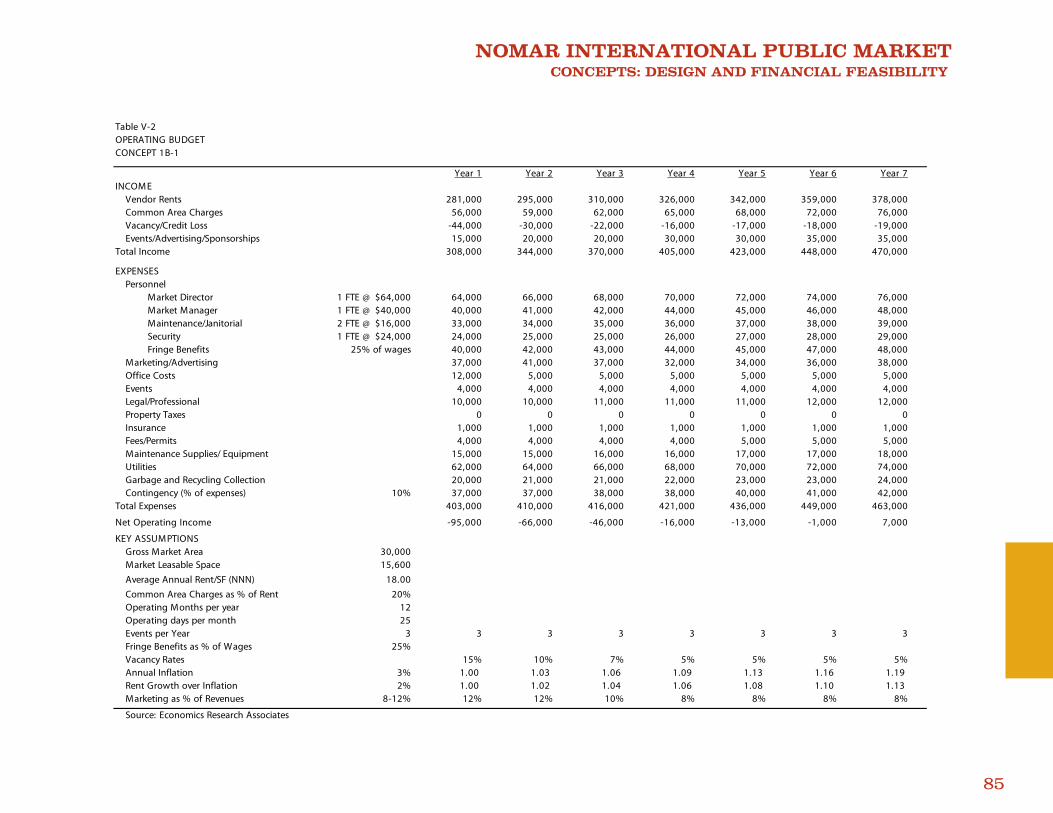
NOMAR INTERNATIONAL PUBLIC MARKET CONCEPTS: DESIGN AND FINANCIAL FEASIBILITY
85
Table V-2OPERATING BUDGETCONCEPT 1B-1
Year 1 Year 2 Year 3 Year 4 Year 5 Year 6 Year 7INCOME
Vendor Rents 281,000 295,000 310,000 326,000 342,000 359,000 378,000Common Area Charges 56,000 59,000 62,000 65,000 68,000 72,000 76,000Vacancy/Credit Loss -44,000 -30,000 -22,000 -16,000 -17,000 -18,000 -19,000Events/Advertising/Sponsorships 15,000 20,000 20,000 30,000 30,000 35,000 35,000
Total Income 308,000 344,000 370,000 405,000 423,000 448,000 470,000
EXPENSESPersonnel
Market Director 1 FTE @ $64,000 64,000 66,000 68,000 70,000 72,000 74,000 76,000Market Manager 1 FTE @ $40,000 40,000 41,000 42,000 44,000 45,000 46,000 48,000Maintenance/Janitorial 2 FTE @ $16,000 33,000 34,000 35,000 36,000 37,000 38,000 39,000Security 1 FTE @ $24,000 24,000 25,000 25,000 26,000 27,000 28,000 29,000Fringe Benefits 25% of wages 40,000 42,000 43,000 44,000 45,000 47,000 48,000
Marketing/Advertising 37,000 41,000 37,000 32,000 34,000 36,000 38,000Office Costs 12,000 5,000 5,000 5,000 5,000 5,000 5,000Events 4,000 4,000 4,000 4,000 4,000 4,000 4,000Legal/Professional 10,000 10,000 11,000 11,000 11,000 12,000 12,000Property Taxes 0 0 0 0 0 0 0Insurance 1,000 1,000 1,000 1,000 1,000 1,000 1,000Fees/Permits 4,000 4,000 4,000 4,000 5,000 5,000 5,000Maintenance Supplies/ Equipment 15,000 15,000 16,000 16,000 17,000 17,000 18,000Utilities 62,000 64,000 66,000 68,000 70,000 72,000 74,000Garbage and Recycling Collection 20,000 21,000 21,000 22,000 23,000 23,000 24,000Contingency (% of expenses) 10% 37,000 37,000 38,000 38,000 40,000 41,000 42,000
Total Expenses 403,000 410,000 416,000 421,000 436,000 449,000 463,000
Net Operating Income -95,000 -66,000 -46,000 -16,000 -13,000 -1,000 7,000
KEY ASSUMPTIONSGross Market Area 30,000Market Leasable Space 15,600Average Annual Rent/SF (NNN) 18.00Common Area Charges as % of Rent 20%Operating Months per year 12Operating days per month 25Events per Year 3 3 3 3 3 3 3 3Fringe Benefits as % of Wages 25%Vacancy Rates 15% 10% 7% 5% 5% 5% 5%Annual Inflation 3% 1.00 1.03 1.06 1.09 1.13 1.16 1.19 Rent Growth over Inflation 2% 1.00 1.02 1.04 1.06 1.08 1.10 1.13 Marketing as % of Revenues 8-12% 12% 12% 10% 8% 8% 8% 8%
Source: Economics Research Associates
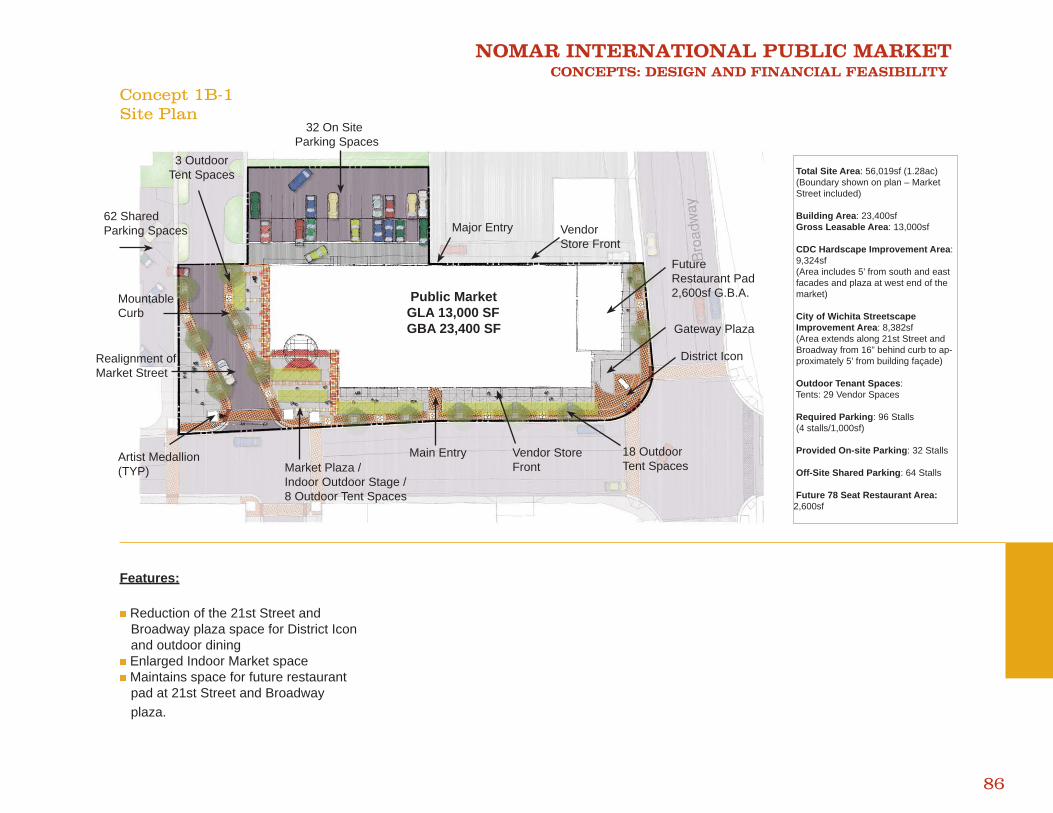
NOMAR INTERNATIONAL PUBLIC MARKET CONCEPTS: DESIGN AND FINANCIAL FEASIBILITY
86
Concept 1B-1Site Plan
Features:
Reduction of the 21st Street and Broadway plaza space for District Icon and outdoor dining Enlarged Indoor Market space Maintains space for future restaurant
pad at 21st Street and Broadway plaza.
Total Site Area: 56,019sf (1.28ac) (Boundary shown on plan – Market Street included)
Building Area: 23,400sf Gross Leasable Area: 13,000sf CDC Hardscape Improvement Area: 9,324sf (Area includes 5’ from south and east facades and plaza at west end of the market)
City of Wichita Streetscape Improvement Area: 8,382sf (Area extends along 21st Street and Broadway from 16” behind curb to ap- proximately 5’ from building façade)
Outdoor Tenant Spaces: Tents: 29 Vendor Spaces
Required Parking: 96 Stalls (4 stalls/1,000sf)
Provided On-site Parking: 32 Stalls
Off-Site Shared Parking: 64 Stalls
Future 78 Seat Restaurant Area:2,600sf
32 On Site Parking Spaces
Major Entry Vendor Store Front
Gateway Plaza
District Icon
18 OutdoorTent Spaces
Vendor Store Front
Main EntryMarket Plaza / Indoor Outdoor Stage / 8 Outdoor Tent Spaces
62 Shared Parking Spaces
Realignment of Market Street
Artist Medallion(TYP)
Public Market GLA 13,000 SF GBA 23,400 SF
Mountable Curb
Future Restaurant Pad 2,600sf G.B.A.
3 OutdoorTent Spaces
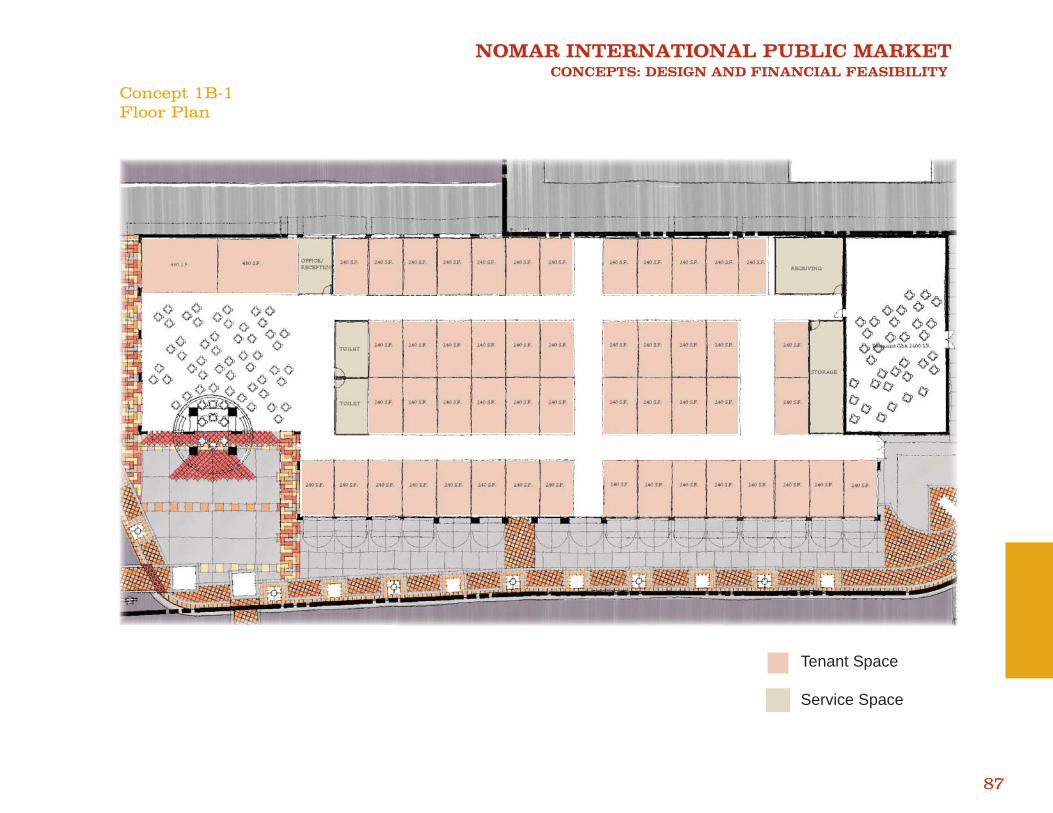
NOMAR INTERNATIONAL PUBLIC MARKET CONCEPTS: DESIGN AND FINANCIAL FEASIBILITY
87
Concept 1B-1Floor Plan
Tenant Space
Service Space
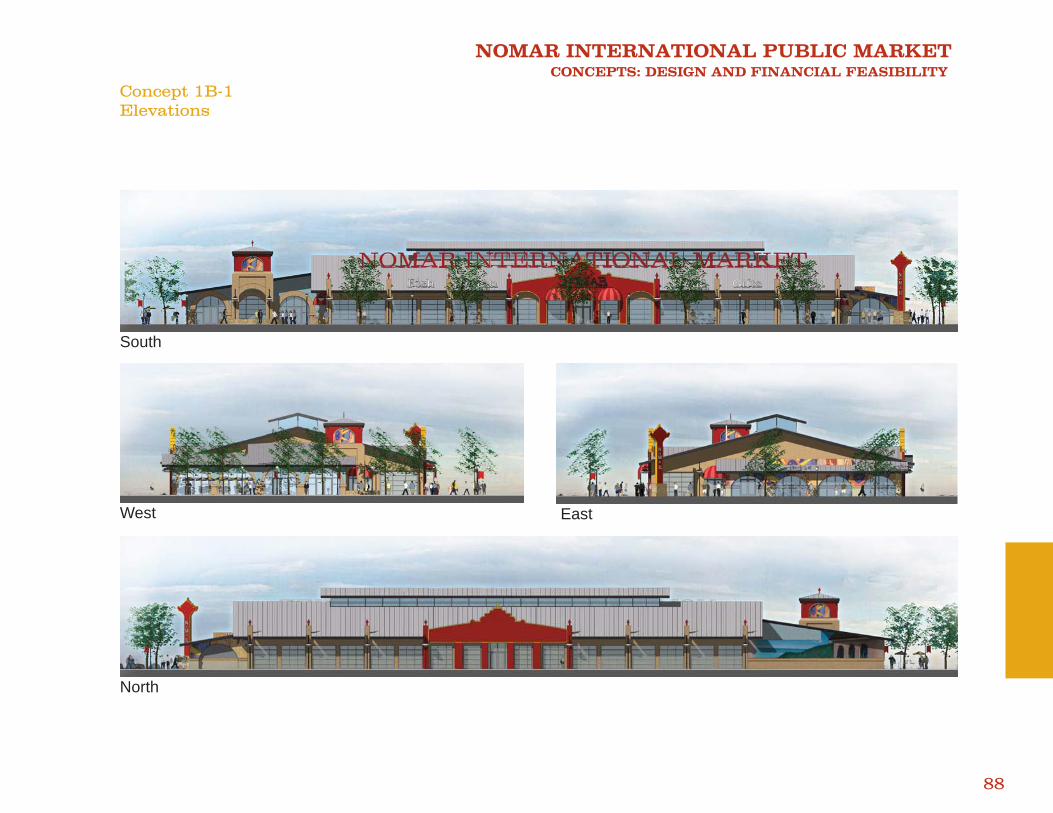
NOMAR INTERNATIONAL PUBLIC MARKET CONCEPTS: DESIGN AND FINANCIAL FEASIBILITY
88
South
West East
North
Concept 1B-1Elevations
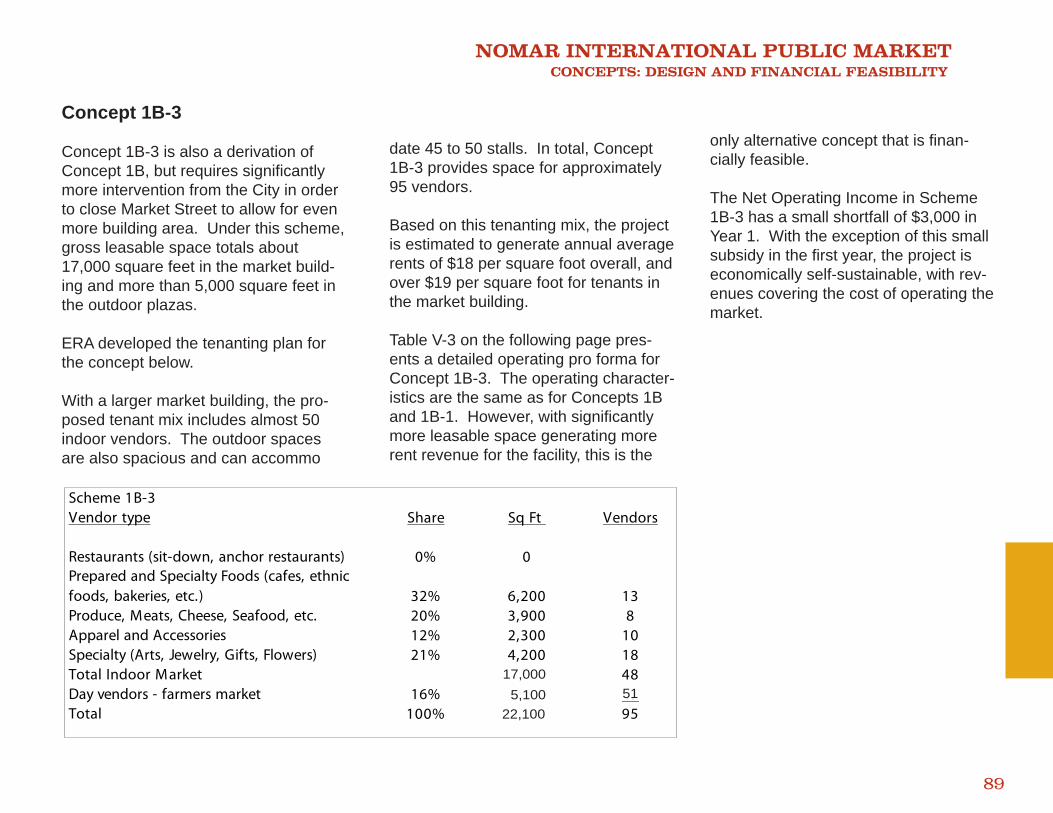
NOMAR INTERNATIONAL PUBLIC MARKET CONCEPTS: DESIGN AND FINANCIAL FEASIBILITY
89
Concept 1B-3
Concept 1B-3 is also a derivation of Concept 1B, but requires signifi cantly more intervention from the City in order to close Market Street to allow for even more building area. Under this scheme, gross leasable space totals about 17,000 square feet in the market build-ing and more than 5,000 square feet in the outdoor plazas.
ERA developed the tenanting plan for the concept below.
With a larger market building, the pro-posed tenant mix includes almost 50 indoor vendors. The outdoor spaces are also spacious and can accommo
date 45 to 50 stalls. In total, Concept 1B-3 provides space for approximately 95 vendors.
Based on this tenanting mix, the project is estimated to generate annual average rents of $18 per square foot overall, and over $19 per square foot for tenants in the market building.
Table V-3 on the following page pres-ents a detailed operating pro forma for Concept 1B-3. The operating character-istics are the same as for Concepts 1B and 1B-1. However, with signifi cantly more leasable space generating more rent revenue for the facility, this is the
only alternative concept that is fi nan-cially feasible.
The Net Operating Income in Scheme 1B-3 has a small shortfall of $3,000 in Year 1. With the exception of this small subsidy in the fi rst year, the project is economically self-sustainable, with rev-enues covering the cost of operating the market.
Scheme 1B-3Vendor type Share Sq Ft Vendors
Restaurants (sit-down, anchor restaurants) 0% 0Prepared and Specialty Foods (cafes, ethnic foods, bakeries, etc.) 32% 6,200 13Produce, Meats, Cheese, Seafood, etc. 20% 3,900 8Apparel and Accessories 12% 2,300 10Specialty (Arts, Jewelry, Gifts, Flowers) 21% 4,200 18Total Indoor Market 16,600 48Day vendors - farmers market 16% 4,700 47Total 100% 21,300 95
17,000 5,10022,100
51
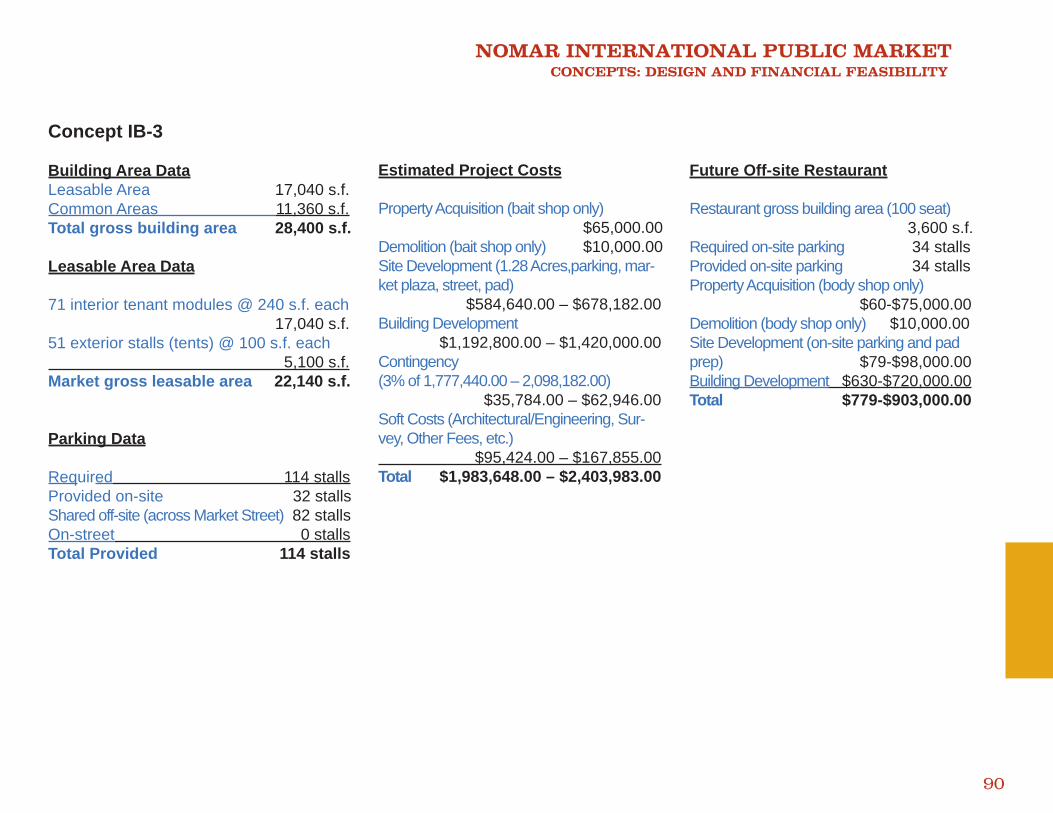
NOMAR INTERNATIONAL PUBLIC MARKET CONCEPTS: DESIGN AND FINANCIAL FEASIBILITY
90
Estimated Project Costs
Property Acquisition (bait shop only) $65,000.00Demolition (bait shop only) $10,000.00Site Development (1.28 Acres,parking, mar-ket plaza, street, pad) $584,640.00 – $678,182.00Building Development $1,192,800.00 – $1,420,000.00Contingency (3% of 1,777,440.00 – 2,098,182.00) $35,784.00 – $62,946.00Soft Costs (Architectural/Engineering, Sur-vey, Other Fees, etc.) $95,424.00 – $167,855.00Total $1,983,648.00 – $2,403,983.00
Future Off-site Restaurant
Restaurant gross building area (100 seat) 3,600 s.f.Required on-site parking 34 stallsProvided on-site parking 34 stallsProperty Acquisition (body shop only) $60-$75,000.00Demolition (body shop only) $10,000.00Site Development (on-site parking and pad prep) $79-$98,000.00Building Development $630-$720,000.00Total $779-$903,000.00
Concept IB-3
Building Area DataLeasable Area 17,040 s.f.Common Areas 11,360 s.f.Total gross building area 28,400 s.f. Leasable Area Data
71 interior tenant modules @ 240 s.f. each 17,040 s.f.51 exterior stalls (tents) @ 100 s.f. each 5,100 s.f.Market gross leasable area 22,140 s.f.
Parking Data
Required 114 stallsProvided on-site 32 stallsShared off-site (across Market Street) 82 stallsOn-street 0 stallsTotal Provided 114 stalls

NOMAR INTERNATIONAL PUBLIC MARKET CONCEPTS: DESIGN AND FINANCIAL FEASIBILITY
91
Table V-3OPERATING BUDGETCONCEPT 1B-3
Year 1 Year 2 Year 3 Year 4 Year 5 Year 6 Year 7 Year 8INCOME
Vendor Rents 383,000 403,000 423,000 445,000 467,000 491,000 516,000 542,000Common Area Charges 77,000 81,000 85,000 89,000 93,000 98,000 103,000 108,000Vacancy/Credit Loss -60,000 -40,000 -30,000 -22,000 -23,000 -25,000 -26,000 -27,000Events/Advertising/Sponsorships 15,000 20,000 20,000 30,000 30,000 35,000 35,000 35,000
Total Income 415,000 464,000 498,000 542,000 567,000 599,000 628,000 658,000
EXPENSESPersonnel
Market Director 1 FTE @ $64,000 64,000 66,000 68,000 70,000 72,000 74,000 76,000 79,000Market Manager 1 FTE @ $40,000 40,000 41,000 42,000 44,000 45,000 46,000 48,000 49,000Maintenance/Janitorial 2 FTE @ $16,000 33,000 34,000 35,000 36,000 37,000 38,000 39,000 41,000Security 1 FTE @ $24,000 24,000 25,000 25,000 26,000 27,000 28,000 29,000 30,000Fringe Benefits 25% of wages 40,000 42,000 43,000 44,000 45,000 47,000 48,000 50,000
Marketing/Advertising 50,000 56,000 50,000 43,000 45,000 48,000 50,000 53,000Office Costs 12,000 5,000 5,000 5,000 5,000 5,000 5,000 5,000Events 4,000 4,000 4,000 4,000 4,000 4,000 4,000 4,000Legal/Professional 10,000 10,000 11,000 11,000 11,000 12,000 12,000 12,000Property Taxes 0 0 0 0 0 0 0 0Insurance 1,000 1,000 1,000 1,000 1,000 1,000 1,000 1,000Fees/Permits 4,000 4,000 4,000 4,000 5,000 5,000 5,000 5,000Maintenance Supplies/ Equipment 15,000 15,000 16,000 16,000 17,000 17,000 18,000 18,000Utilities 63,000 65,000 67,000 69,000 71,000 73,000 75,000 77,000Garbage and Recycling Collection 20,000 21,000 21,000 22,000 23,000 23,000 24,000 25,000Contingency (% of expenses) 10% 38,000 39,000 39,000 40,000 41,000 42,000 43,000 45,000
Total Expenses 418,000 428,000 431,000 435,000 449,000 463,000 477,000 494,000
Net Operating Income -3,000 36,000 67,000 107,000 118,000 136,000 151,000 164,000
KEY ASSUMPTIONSGross Floor Area 28,400Market Leasable Space 21,300Average Annual Rent/SF (NNN) 18.00Common Area Charges as % of Rent 20%Operating Months per year 12Operating days per month 25Events per Year 3 3 3 3 3 3 3 3 3Fringe Benefits as % of Wages 25%Vacancy Rates 15% 10% 7% 5% 5% 5% 5% 5%Annual Inflation 3% 1.00 1.03 1.06 1.09 1.13 1.16 1.19 1.23 Rent Growth over Inflation 2% 1.00 1.02 1.04 1.06 1.08 1.10 1.13 1.15 Marketing as % of Revenues 8-12% 12% 12% 10% 8% 8% 8% 8% 8%
Source: Economics Research Associates
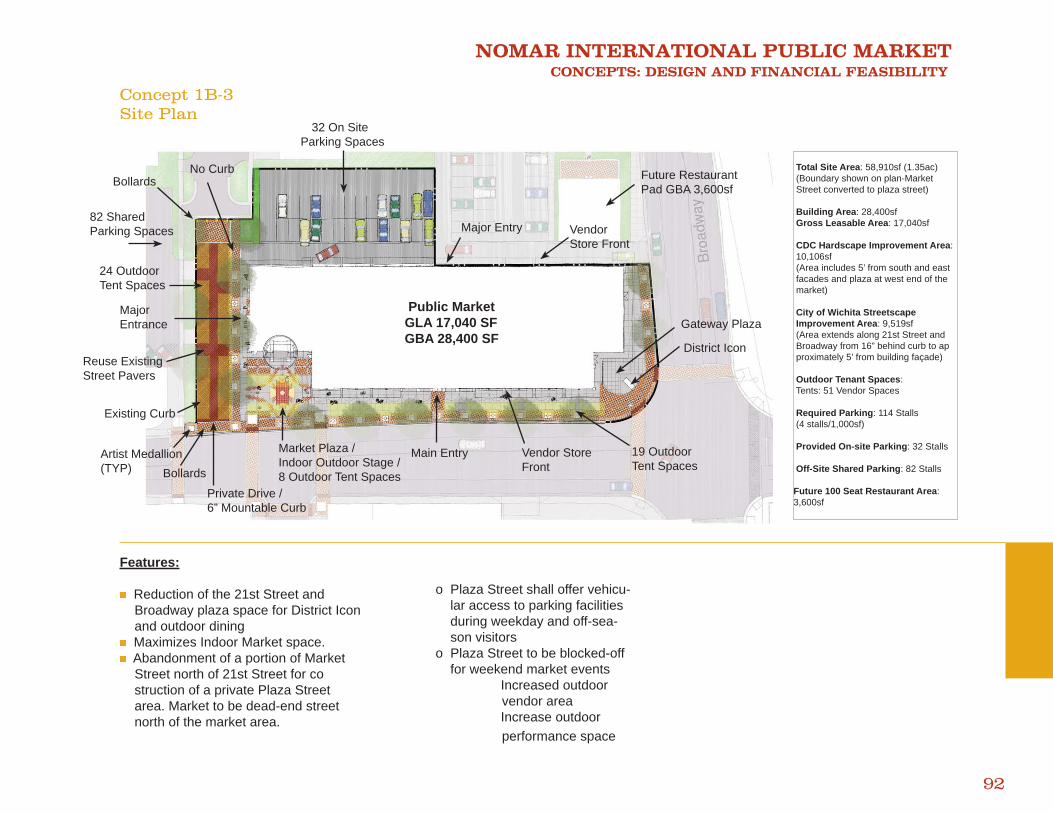
NOMAR INTERNATIONAL PUBLIC MARKET CONCEPTS: DESIGN AND FINANCIAL FEASIBILITY
92
Concept 1B-3Site Plan
Features:
Reduction of the 21st Street and Broadway plaza space for District Icon and outdoor dining Maximizes Indoor Market space. Abandonment of a portion of Market
Street north of 21st Street for co struction of a private Plaza Street area. Market to be dead-end street north of the market area.
o Plaza Street shall offer vehicu- lar access to parking facilities during weekday and off-sea- son visitors o Plaza Street to be blocked-off for weekend market events � Increased outdoor vendor area � Increase outdoor performance space
Total Site Area: 58,910sf (1.35ac) (Boundary shown on plan-Market Street converted to plaza street)
Building Area: 28,400sf Gross Leasable Area: 17,040sf
CDC Hardscape Improvement Area: 10,106sf (Area includes 5’ from south and east facades and plaza at west end of the market)
City of Wichita Streetscape Improvement Area: 9,519sf (Area extends along 21st Street and Broadway from 16” behind curb to ap proximately 5’ from building façade)
Outdoor Tenant Spaces: Tents: 51 Vendor Spaces
Required Parking: 114 Stalls (4 stalls/1,000sf)
Provided On-site Parking: 32 Stalls
Off-Site Shared Parking: 82 Stalls
Future 100 Seat Restaurant Area: 3,600sf
32 On Site Parking Spaces
Major Entry Vendor Store Front
Gateway Plaza
District Icon
19 OutdoorTent Spaces
Vendor Store Front
Main EntryMarket Plaza / Indoor Outdoor Stage / 8 Outdoor Tent Spaces
82 Shared Parking Spaces
Reuse Existing Street Pavers
Artist Medallion(TYP)
Public Market GLA 17,040 SF GBA 28,400 SF
Major Entrance
Future RestaurantPad GBA 3,600sf
Private Drive / 6” Mountable Curb
Bollards
Existing Curb
24 Outdoor Tent Spaces
BollardsNo Curb
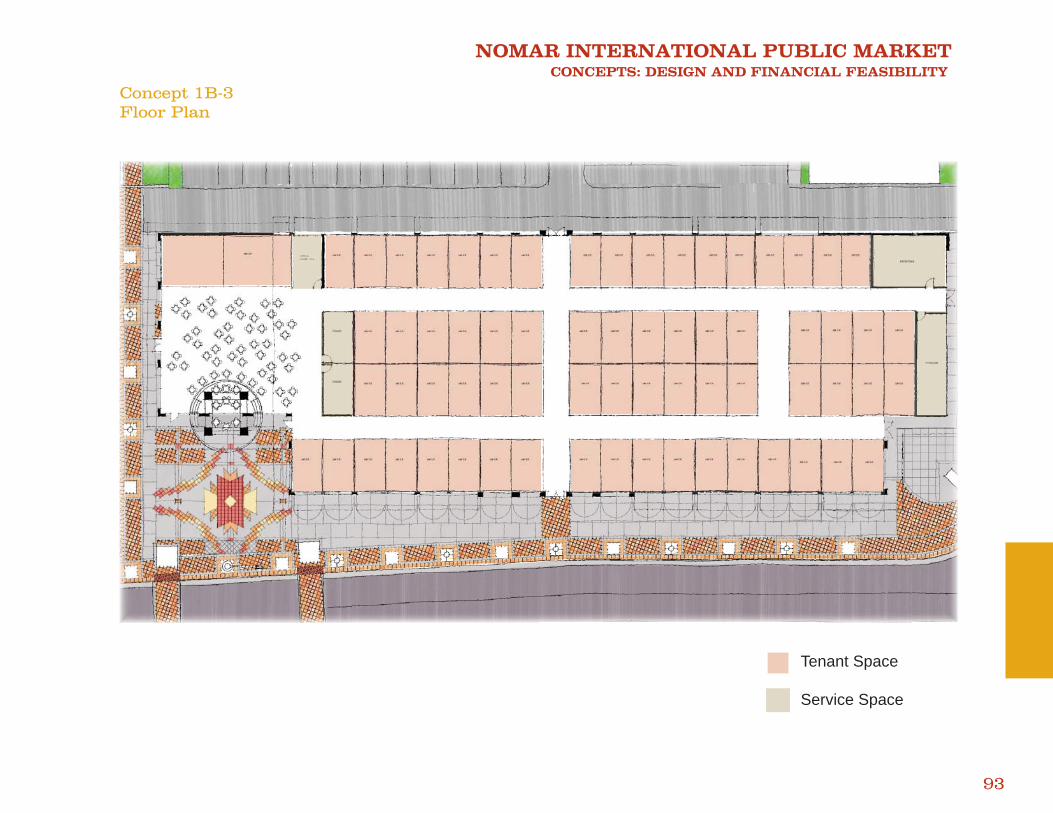
NOMAR INTERNATIONAL PUBLIC MARKET CONCEPTS: DESIGN AND FINANCIAL FEASIBILITY
93
Concept 1B-3Floor Plan
Tenant Space
Service Space
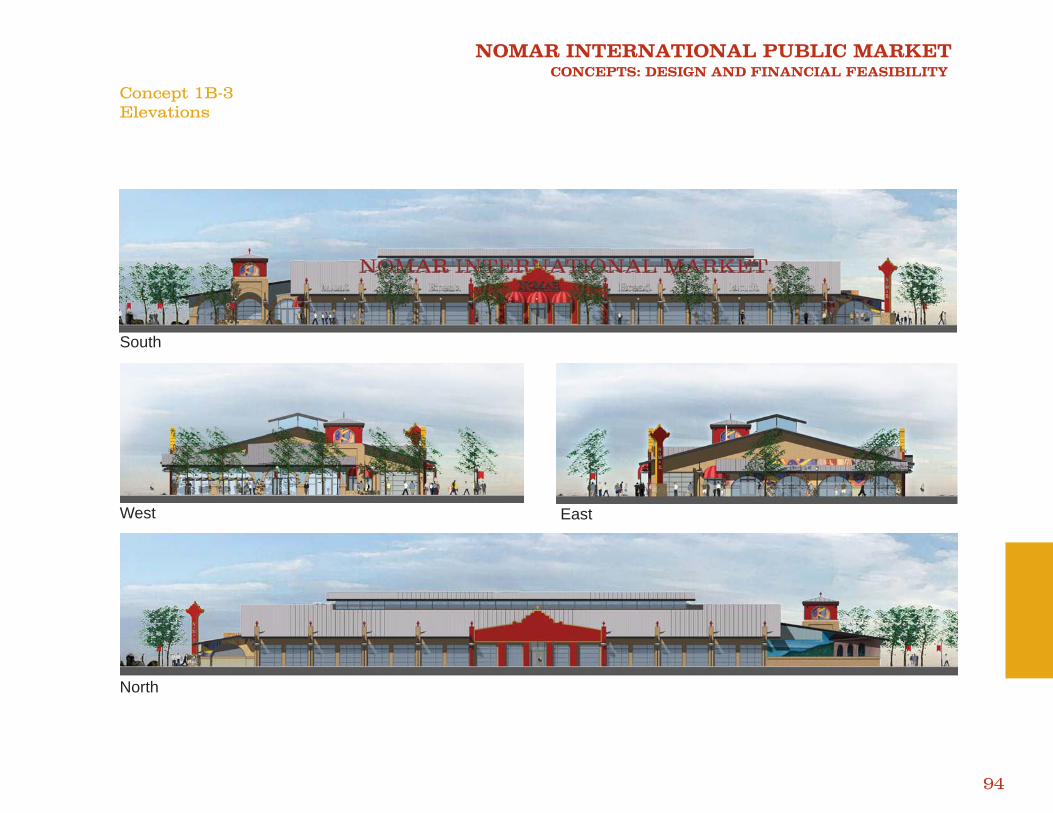
NOMAR INTERNATIONAL PUBLIC MARKET CONCEPTS: DESIGN AND FINANCIAL FEASIBILITY
94
Concept 1B-3Elevations
South
West East
North
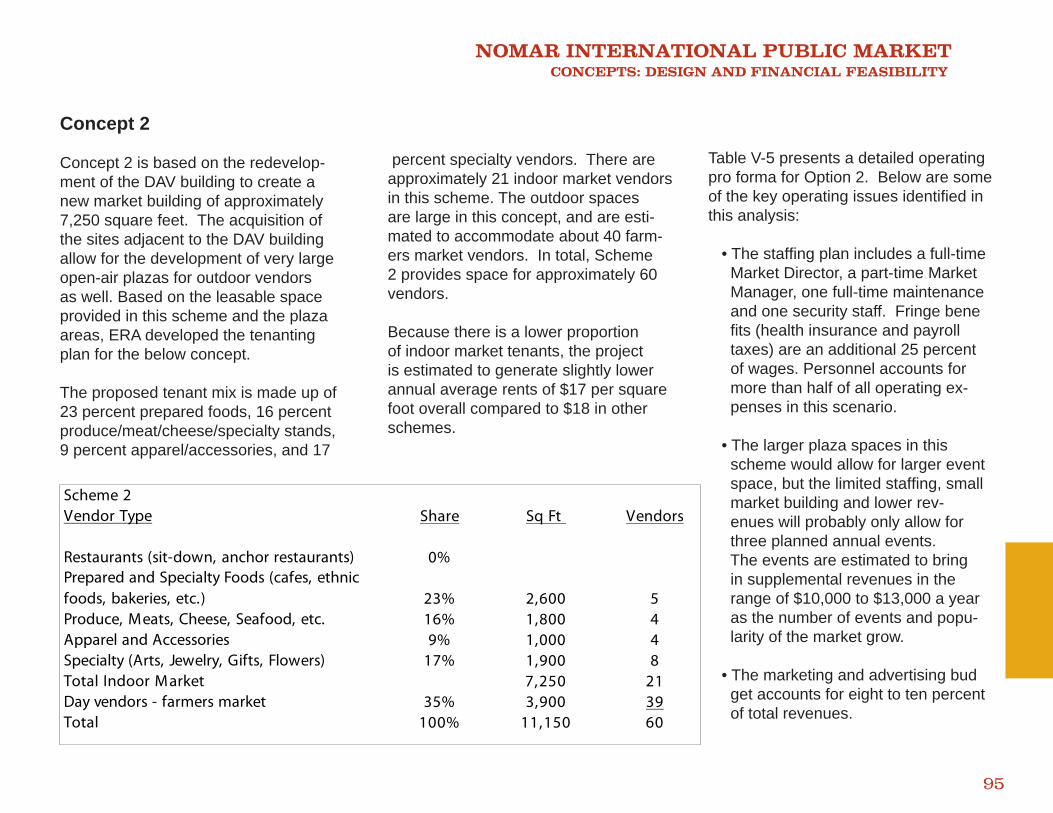
NOMAR INTERNATIONAL PUBLIC MARKET CONCEPTS: DESIGN AND FINANCIAL FEASIBILITY
95
Concept 2
Concept 2 is based on the redevelop-ment of the DAV building to create a new market building of approximately 7,250 square feet. The acquisition of the sites adjacent to the DAV building allow for the development of very large open-air plazas for outdoor vendors as well. Based on the leasable space provided in this scheme and the plaza areas, ERA developed the tenanting plan for the below concept.
The proposed tenant mix is made up of 23 percent prepared foods, 16 percent produce/meat/cheese/specialty stands, 9 percent apparel/accessories, and 17
percent specialty vendors. There are approximately 21 indoor market vendors in this scheme. The outdoor spaces are large in this concept, and are esti-mated to accommodate about 40 farm-ers market vendors. In total, Scheme 2 provides space for approximately 60 vendors. Because there is a lower proportion of indoor market tenants, the project is estimated to generate slightly lower annual average rents of $17 per square foot overall compared to $18 in other schemes.
Table V-5 presents a detailed operating pro forma for Option 2. Below are some of the key operating issues identifi ed in this analysis:
• The staffi ng plan includes a full-time Market Director, a part-time Market Manager, one full-time maintenance and one security staff. Fringe bene fi ts (health insurance and payroll taxes) are an additional 25 percent of wages. Personnel accounts for more than half of all operating ex- penses in this scenario.
• The larger plaza spaces in this scheme would allow for larger event space, but the limited staffi ng, small market building and lower rev- enues will probably only allow for three planned annual events. The events are estimated to bring in supplemental revenues in the range of $10,000 to $13,000 a year as the number of events and popu- larity of the market grow.
• The marketing and advertising bud get accounts for eight to ten percent of total revenues.
Scheme 2Vendor Type Share Sq Ft Vendors
Restaurants (sit-down, anchor restaurants) 0%Prepared and Specialty Foods (cafes, ethnic foods, bakeries, etc.) 23% 2,600 5Produce, Meats, Cheese, Seafood, etc. 16% 1,800 4Apparel and Accessories 9% 1,000 4Specialty (Arts, Jewelry, Gifts, Flowers) 17% 1,900 8Total Indoor Market 7,250 21Day vendors - farmers market 35% 3,900 39Total 100% 11,150 60
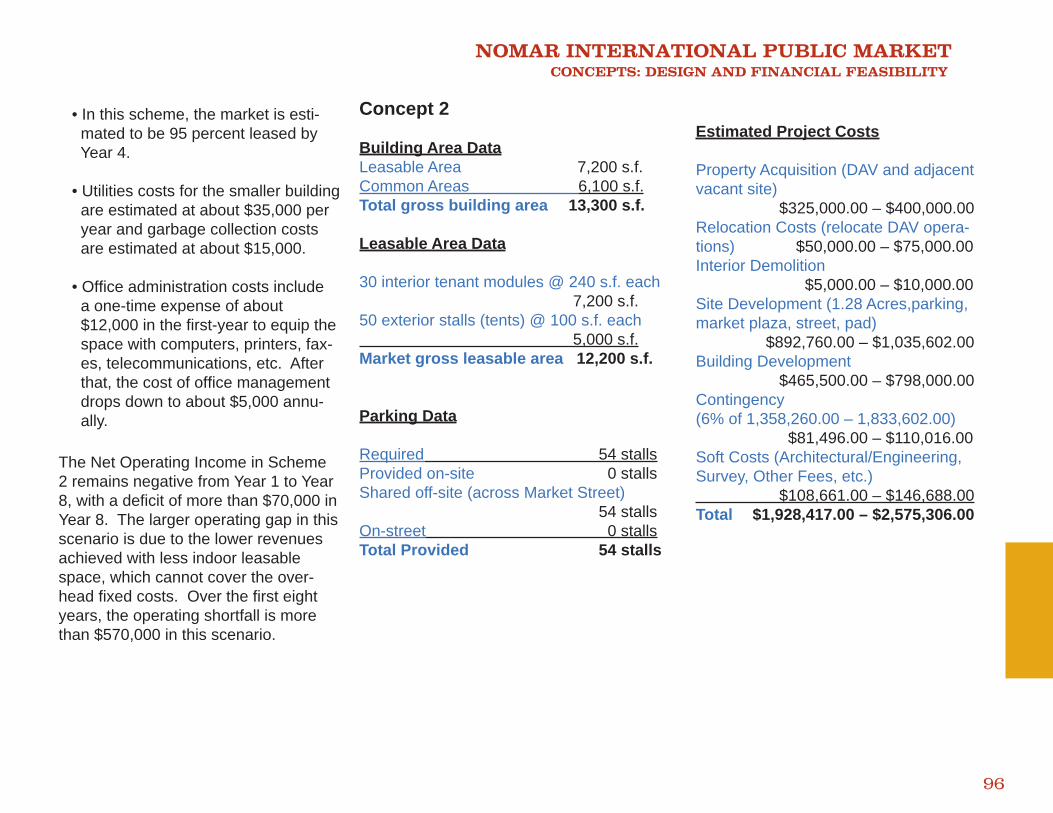
NOMAR INTERNATIONAL PUBLIC MARKET CONCEPTS: DESIGN AND FINANCIAL FEASIBILITY
96
• In this scheme, the market is esti- mated to be 95 percent leased by Year 4.
• Utilities costs for the smaller building are estimated at about $35,000 per year and garbage collection costs are estimated at about $15,000.
• Offi ce administration costs include a one-time expense of about $12,000 in the fi rst-year to equip the space with computers, printers, fax- es, telecommunications, etc. After that, the cost of offi ce management drops down to about $5,000 annu- ally.
The Net Operating Income in Scheme 2 remains negative from Year 1 to Year 8, with a defi cit of more than $70,000 in Year 8. The larger operating gap in this scenario is due to the lower revenues achieved with less indoor leasable space, which cannot cover the over-head fi xed costs. Over the fi rst eight years, the operating shortfall is more than $570,000 in this scenario.
Estimated Project Costs
Property Acquisition (DAV and adjacent vacant site) $325,000.00 – $400,000.00 Relocation Costs (relocate DAV opera-tions) $50,000.00 – $75,000.00 Interior Demolition $5,000.00 – $10,000.00Site Development (1.28 Acres,parking, market plaza, street, pad) $892,760.00 – $1,035,602.00Building Development $465,500.00 – $798,000.00Contingency (6% of 1,358,260.00 – 1,833,602.00) $81,496.00 – $110,016.00Soft Costs (Architectural/Engineering, Survey, Other Fees, etc.) $108,661.00 – $146,688.00Total $1,928,417.00 – $2,575,306.00
Concept 2
Building Area DataLeasable Area 7,200 s.f.Common Areas 6,100 s.f.Total gross building area 13,300 s.f. Leasable Area Data
30 interior tenant modules @ 240 s.f. each 7,200 s.f.50 exterior stalls (tents) @ 100 s.f. each 5,000 s.f.Market gross leasable area 12,200 s.f.
Parking Data
Required 54 stallsProvided on-site 0 stallsShared off-site (across Market Street) 54 stallsOn-street 0 stallsTotal Provided 54 stalls

NOMAR INTERNATIONAL PUBLIC MARKET CONCEPTS: DESIGN AND FINANCIAL FEASIBILITY
97
Table V-5OPERATING BUDGETCONCEPT 2
Year 1 Year 2 Year 3 Year 4 Year 5 Year 6 Year 7INCOME
Vendor Rents 190,000 199,000 209,000 220,000 231,000 243,000 255,000Common Area Charges 38,000 40,000 42,000 44,000 46,000 49,000 51,000Vacancy/Credit Loss -30,000 -20,000 -15,000 -11,000 -12,000 -12,000 -13,000Events/Advertising/Sponsorships 10,000 10,000 11,000 11,000 11,000 12,000 12,000
Total Income 208,000 229,000 247,000 264,000 276,000 292,000 305,000
EXPENSESPersonnel
Market Director 1 FTE @ $64,000 64,000 66,000 68,000 70,000 72,000 74,000 76,000Market Manager 0.5 FTE @ $30,000 30,000 31,000 32,000 33,000 34,000 35,000 36,000Maintenance/Janitorial 1 FTE @ 16,000 16,000 16,000 17,000 17,000 18,000 19,000 19,000Security 1 FTE @ $24,000 24,000 25,000 25,000 26,000 27,000 28,000 29,000Fringe Benefits 34,000 35,000 36,000 37,000 38,000 39,000 41,000
Marketing/Advertising 21,000 23,000 25,000 21,000 22,000 23,000 24,000Office Costs 12,000 5,000 5,000 5,000 5,000 5,000 5,000Events 4,000 4,000 4,000 4,000 4,000 4,000 4,000Legal/Professional 10,000 10,000 11,000 11,000 11,000 12,000 12,000Property Taxes 0 0 0 0 0 0 0Insurance 1,000 1,000 1,000 1,000 1,000 1,000 1,000Events 4,000 4,000 4,000 4,000 5,000 5,000 5,000Maintenance Supplies/ Equipment 15,000 15,000 16,000 16,000 17,000 17,000 18,000Utilities 35,000 36,000 37,000 38,000 39,000 41,000 42,000Garbage and Recycling Collection 15,000 15,000 16,000 16,000 17,000 17,000 18,000Contingency (% of expenses) 10% 29,000 29,000 30,000 30,000 31,000 32,000 33,000
Total Expenses 314,000 315,000 327,000 329,000 341,000 352,000 363,000
Net Operating Income -106,000 -86,000 -80,000 -65,000 -65,000 -60,000 -58,000
KEY ASSUMPTIONSGross Market Area 13,300Market Leasable Space 11,150Average Annual Rent/SF (NNN) 17.00Common Area Charges as % of Rent 20%Operating Months per year 12Operating days per month 25Events per Year 3 3 3 3 3 3 3 3Fringe Benefits as % of Wages 25%Vacancy Rates 15% 10% 7% 5% 5% 5% 5%Annual Inflation 3% 1.00 1.03 1.06 1.09 1.13 1.16 1.19 Rent Growth over Inflation 2% 1.00 1.02 1.04 1.06 1.08 1.10 1.13 Marketing as % of Revenues 8-10% 10% 10% 10% 8% 8% 8% 8%
Source: Economics Research Associates
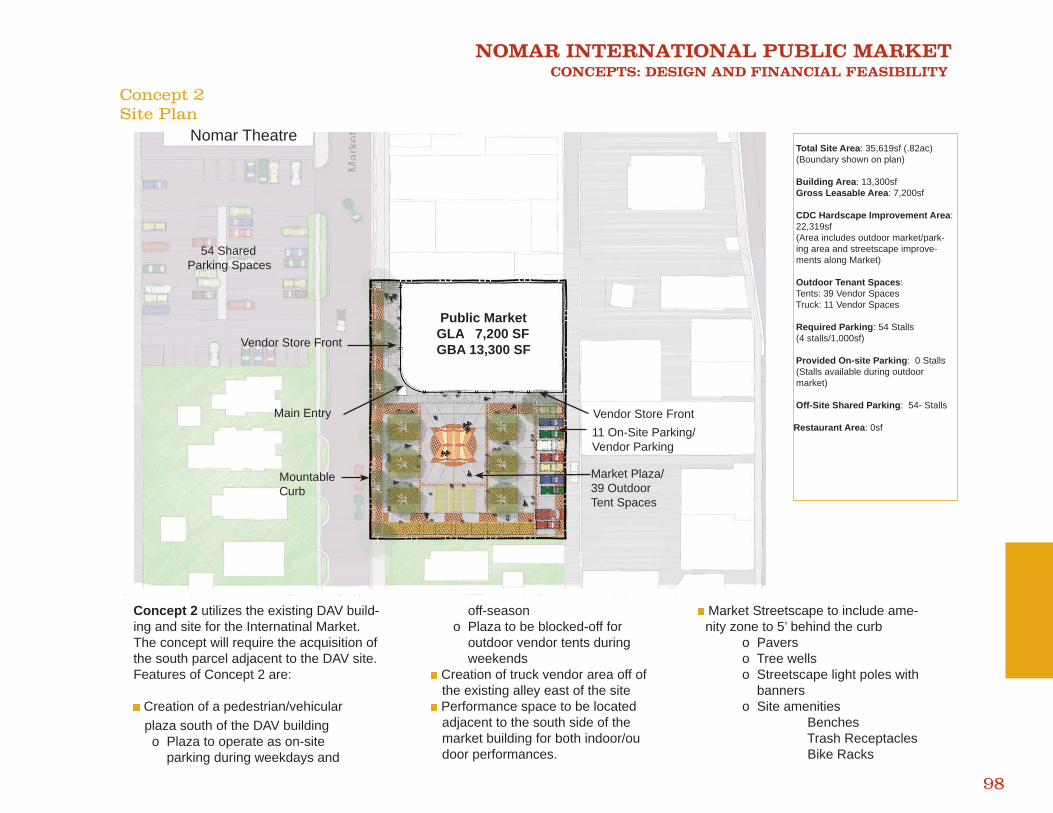
NOMAR INTERNATIONAL PUBLIC MARKET CONCEPTS: DESIGN AND FINANCIAL FEASIBILITY
98
Concept 2Site Plan
Concept 2 utilizes the existing DAV build-ing and site for the Internatinal Market. The concept will require the acquisition of the south parcel adjacent to the DAV site. Features of Concept 2 are:
Creation of a pedestrian/vehicular plaza south of the DAV building o Plaza to operate as on-site parking during weekdays and
off-season o Plaza to be blocked-off for outdoor vendor tents during weekends Creation of truck vendor area off of
the existing alley east of the site Performance space to be located
adjacent to the south side of the market building for both indoor/ou door performances.
Market Streetscape to include ame- nity zone to 5’ behind the curb o Pavers o Tree wells o Streetscape light poles with banners o Site amenities � Benches � Trash Receptacles � Bike Racks
Nomar Theatre
Vendor Store FrontMain Entry
54 Shared Parking Spaces
Public Market GLA 7,200 SF GBA 13,300 SFVendor Store Front
11 On-Site Parking/ Vendor Parking
Market Plaza/39 OutdoorTent Spaces
MountableCurb
Total Site Area: 35,619sf (.82ac) (Boundary shown on plan)
Building Area: 13,300sf Gross Leasable Area: 7,200sf CDC Hardscape Improvement Area: 22,319sf (Area includes outdoor market/park- ing area and streetscape improve- ments along Market)
Outdoor Tenant Spaces: Tents: 39 Vendor Spaces Truck: 11 Vendor Spaces
Required Parking: 54 Stalls (4 stalls/1,000sf)
Provided On-site Parking: 0 Stalls (Stalls available during outdoor market)
Off-Site Shared Parking: 54- Stalls
Restaurant Area: 0sf
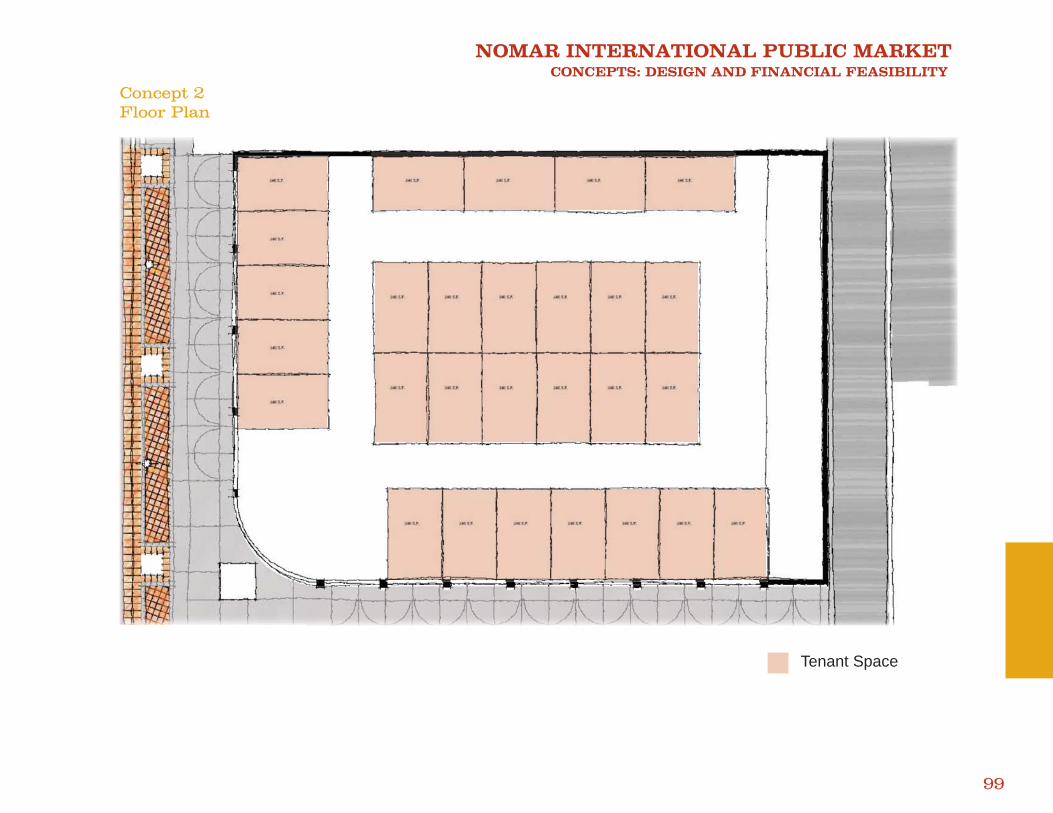
NOMAR INTERNATIONAL PUBLIC MARKET CONCEPTS: DESIGN AND FINANCIAL FEASIBILITY
99
Concept 2Floor Plan
Tenant Space
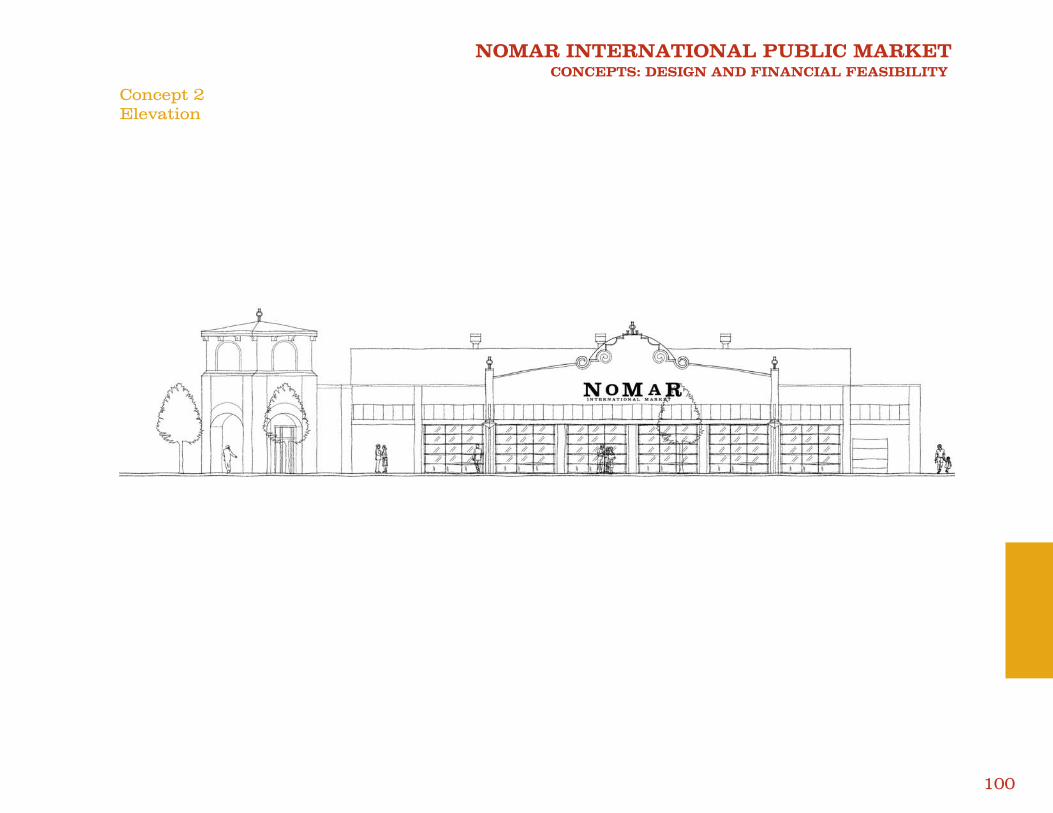
NOMAR INTERNATIONAL PUBLIC MARKET CONCEPTS: DESIGN AND FINANCIAL FEASIBILITY
100
Concept 2Elevation
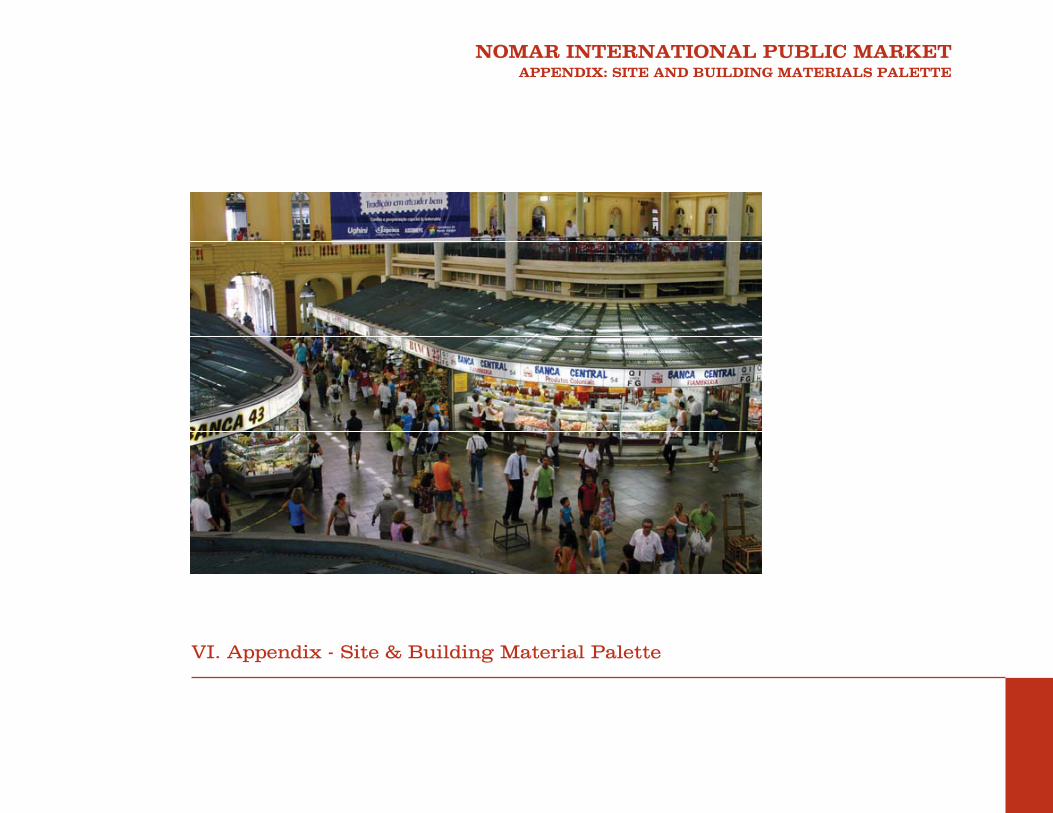
NOMAR INTERNATIONAL PUBLIC MARKET APPENDIX: SITE AND BUILDING MATERIALS PALETTE
1
VI. Appendix - Site & Building Material Palette
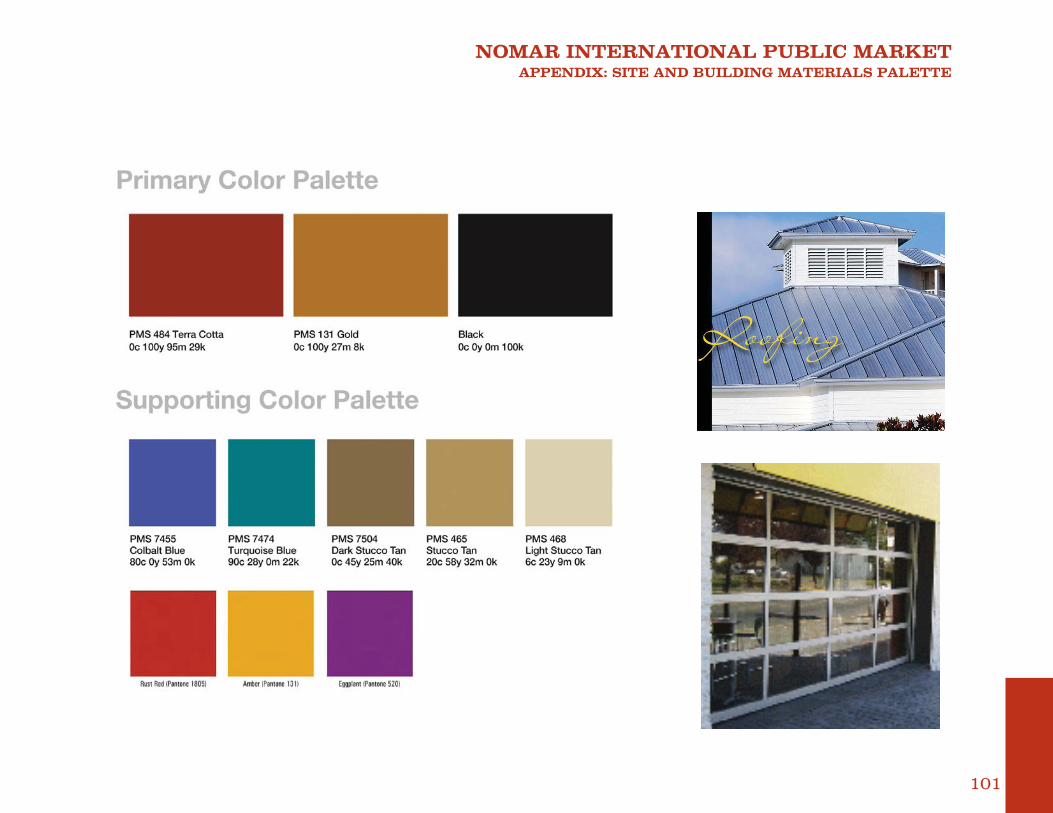
NOMAR INTERNATIONAL PUBLIC MARKET APPENDIX: SITE AND BUILDING MATERIALS PALETTE
101
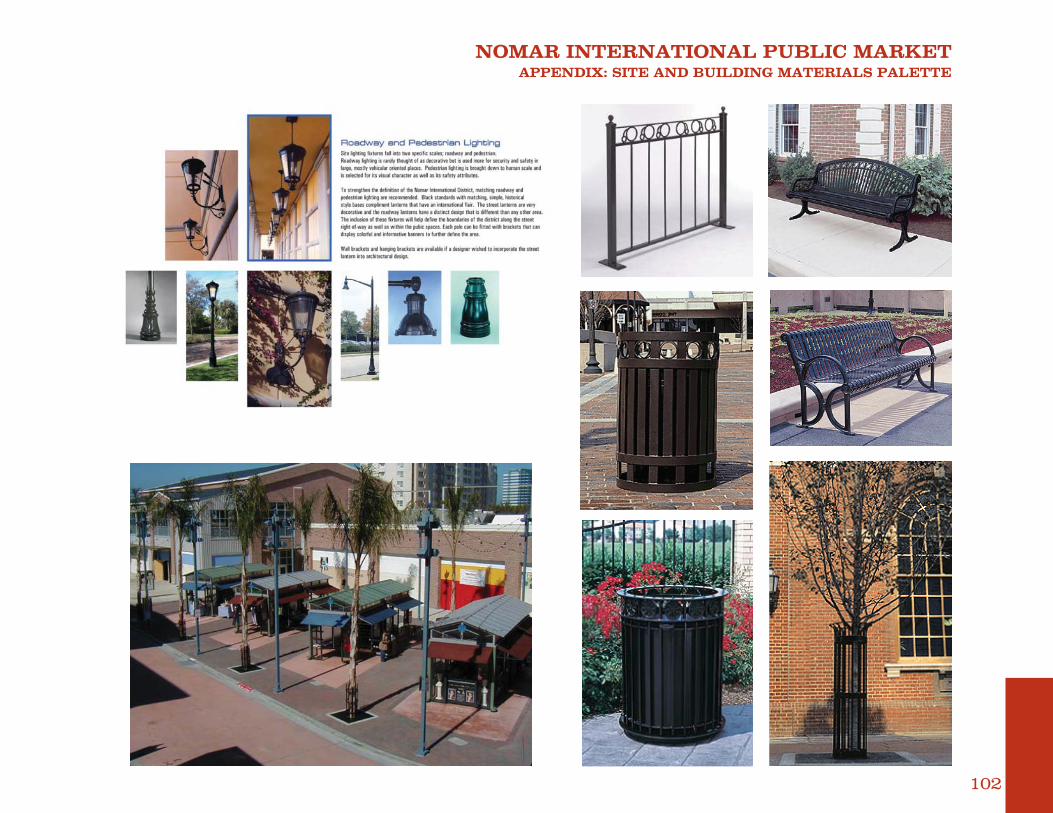
NOMAR INTERNATIONAL PUBLIC MARKET APPENDIX: SITE AND BUILDING MATERIALS PALETTE
102