no. 44 — september 2014 the effect of index futures ... · the effect of index futures trading on...
TRANSCRIPT

CIGI PAPERSNO. 44 — SEPTEMBER 2014
THE EFFECT OF INDEX FUTURES TRADING ON VOLATILITY THREE MARKETS FOR CHINESE STOCKSMARTIN T. BOHL, JEANNE DIESTELDORF AND PIERRE L. SIKLOS


THE EFFECT OF INDEX FUTURES TRADING ON VOLATILITY: THREE MARKETS FOR CHINESE STOCKS
Martin T. Bohl, Jeanne Diesteldorf and Pierre L. Siklos

Copyright © 2014 by the Centre for International Governance Innovation
The opinions expressed in this publication are those of the authors and do not necessarily reflect the views of the Centre for International Governance Innovation or its Operating Board of Directors or International Board of Governors.
This work is licensed under a Creative Commons Attribution — Non-commercial — No Derivatives License. To view this license, visit (www.creativecommons.org/licenses/by-nc-nd/3.0/). For re-use or distribution, please include this copyright notice.
ACKNOWLEDGEMENTS
We are indebted to participants of the seventeenth Conference of the Swiss Society for Financial Market Research in Zurich, participants of the Center for International Capital Markets Conference “China after 35 Years of Economic Transition” in London, participants of the Pacific Rim 3 Conference in Kona, Hawaii, the Conference of the International Association of Applied Econometrics in London, as well as participants of the World Finance Conference in Venice for very helpful comments. The third author is grateful to CIGI for financial assistance from a CIGI Collaborative grant. The second author is thankful to Rainer Matthes from Metzler Asset Management in Frankfurt for kind support and Janusz Brzeszczynski for helpful suggestions.
67 Erb Street West Waterloo, Ontario N2L 6C2 Canada tel +1 519 885 2444 fax + 1 519 885 5450 www.cigionline.org

THE EFFECT OF INDEx FuTuRES TRADING ON vOLATILITy THREE MARKETS FOR CHINESE STOCKS
MARTIN T. BOHL, JEANNE DIESTELDORF AND PIERRE L. SIKLOS • v
TABLE OF CONTENTSvi About the Authors
vi Acronyms
1 Executive Summary
1 Introduction
2 The Chinese Spot and Derivatives Market(s)
4 Literature Review
6 Data and Methodology
6 Econometric Approach
8 Empirical Results
11 Conclusion
14 Works Cited
17 Appendix
17 Additional Institutional Information about Spot and Derivatives Markets in Asia
18 Principal Component Estimation Results
23 About CIGI
23 CIGI Masthead

CIGI PAPERS NO. 44 — SEPTEMBER 2014
vI • THE CENTRE FOR INTERNATIONAL GOvERNANCE INNOvATION
ABOUT THE AUTHORSMartin T. Bohl is professor of economics at the Centre for Quantitative Economics, Westphalian Wilhelminian University of Münster. From 1999 to 2006, he was a professor of finance and capital markets at the European University Viadrina Frankfurt (Oder). His research focuses on monetary theory and policy as well as financial market research.
Jeanne Diesteldorf is a Ph.D. student and research associate at the Westphalian Wilhelminian University of Münster in Münster, Germany.
Pierre L. Siklos is a CIGI senior fellow and a research associate at Australian National University’s Centre for Macroeconomic Analysis. His research interests are in applied time series analysis and monetary policy, with a focus on inflation and financial markets.
ACRONYMSBHHH Berndt, Hall, Hall, and Hausman
CFFEX China Financial Futures Exchange
CSI300 China Securities Index 300
CSRC Chinese Securities Regulatory Commission
CNY Chinese Yuan Renminbi
FTSE Financial Times Stock Exchange
GARCH Generalized Auto-RegressiveConditional Heteroscedasticity
GFC global financial crisis
HKD Hong Kong dollar
HSCEI Hang Seng China Enterprise Index
MSCI Morgan Stanley Capital International
PRC People’s Republic of China
QFII Qualified Foreign Institutional Investor
S&P Standard & Poor’s
SGX Singapore Exchange
USD United States dollar

THE EFFECT OF INDEx FuTuRES TRADING ON vOLATILITy THREE MARKETS FOR CHINESE STOCKS
MARTIN T. BOHL, JEANNE DIESTELDORF AND PIERRE L. SIKLOS • 1
EXECUTIVE SUMMARYThis paper examines whether the introduction of Chinese stock index futures had an impact on the volatility of the underlying spot market. To this end, we estimate several Generalized Auto-Regressive Conditional Heteroscedasticity (GARCH) models and compare our findings for mainland China with Chinese index futures traded in Singapore and Hong Kong. Our results indicate that Chinese index futures decrease spot market volatility with all three spot markets considered. In contrast, we do not obtain the same results for the companion index futures markets in Hong Kong and Singapore. China’s stock market is relatively young and largely dominated by private retail investors. Nevertheless, our evidence is favourable to the stabilization hypothesis usually confirmed in mature markets.
INTRODUCTIONSince the introduction of index futures trading, extensive research has been devoted to the question of whether index futures trading results in volatility spillovers between futures markets and their underlying spot markets. A vast part of the literature has upheld the so-called stabilization hypothesis, which posits that futures markets reduce volatility of the underlying spot market. By contrast, others find that the introduction of futures markets increases stock market volatility. Unsurprisingly, this phenomenon is referred to as the destabilization hypothesis.
Many of the futures markets investigated in the literature are homogeneous in terms of their investor structure. Historically, the introduction of futures trading in developed financial markets coincided with the rise of institutional ownership in the early 1980s. Hence, futures markets typically investigated in the earlier literature are dominated by institutional investors. These institutions are presumed to be run by well-informed, rational investors as opposed to individual investors, who are viewed as uninformed or driven by sentiment or other behavioural biases (Lee, Lin and Liu 1999; Cohen, Gompers and Vuolteenaho 2002; Barber and Odean 2008; Kaniel, Saar and Titman 2008). Early empirical findings indicate evidence in favour of the stabilizing hypothesis for mature financial markets dominated by institutional investors. In contrast, papers focusing on developing derivatives markets typically dominated by individual investors report evidence in favour of the destabilizing hypothesis.
China’s stock index futures provides a unique and interesting setting for research: it is a large market dominated by private investors as opposed to institutional investors. It is the first market in mainland China where futures on Chinese stock indices can be bought. Previously, investors’ only option was to trade Chinese stock index futures offshore in Singapore and Hong Kong. Accordingly, we compare our findings to developments in both the A50
and the Hang Seng China Enterprises Index (HSCEI) sister markets. This makes an investigation of the introduction of a mainland market all the more interesting from the perspective of the stabilizing role of futures markets. Equally important is that, given their location, there may well be spillover effects between the three markets that are also considered in this study. To the extent that there are institutional characteristics, which may lead to differences in market behaviour, it is of considerable interest to investigate these effects. This also represents another feature of our analysis, which, as far as we are aware, has not before been considered in the extant literature.
On April 16, 2010, the Shanghai-based China Financial Futures Exchange (CFFEX) launched the country’s first stock index futures on the China Securities Index 300 (CSI300). With 93.3 million futures contracts traded with a notional value of USD 12.1 trillion in 2012, the CSI300 index futures market is one of the largest in the world. At the same time, it is a tightly regulated market with high barriers to entry and an interesting investor structure: 98 percent of CSI300 index futures market participants are so-called retail investors; only up to two percent are (foreign) institutional investors. Given this unusual setting, it is of separate interest to investigate whether the introduction of the CSI300 index futures had an impact on the volatility of prices in the underlying spot market. As the CSI300 index futures market is a relatively young, yet impressively large, market where typical institutional investors play a negligible role, we assume to find evidence in favour of the destabilizing hypothesis. However, investors in the CSI300 futures market face high monetary and regulatory barriers to entry. Therefore, their characteristics must certainly differ from what is commonly known in the financial literature. One may therefore question if our preliminary hypothesis is plausible.
To the best of our knowledge, the type of comparison undertaken in this paper has not yet been considered in the literature. To this end, we follow the existing literature and estimate different varieties of GARCH models. Besides the widely used GARCH(1,1) model, we also consider both GJR-GARCH and EGARCH variants.
The rest of the paper proceeds as follows: The second section outlines the history and institutional setting of the markets under consideration. The third section offers a brief literature review. The fourth section describes the data and methodology. The fifth section provides our empirical results while the sixth section concludes. Additional institutional information on Asian spot and derivatives markets is provided in the Appendix.

CIGI PAPERS NO. 44 — SEPTEMBER 2014
2 • THE CENTRE FOR INTERNATIONAL GOvERNANCE INNOvATION
THE CHINESE SPOT AND DERIVATIVES MARKET(S)Since their introduction in 1990 and 1991, the stock exchanges in Shanghai and Shenzhen have grown to become two of the largest in Southeast Asia. At the end of 2012, total market capitalization had reached USD 2,547 billion in Shanghai and USD 1,150 billion for the smaller Shenzhen stock exchange, rivalling the Tokyo stock exchange with a market capitalization of about USD 3,479 billion. By comparison, at the same time, the New York Stock Exchange Euronext had a total market capitalization of USD 14,085 billion (World Federation of Exchanges 2012).1
Initially, stock markets in Shanghai and Shenzhen were segmented into A and B shares, which ensured discrimination according to ownership restrictions. Domestic citizens could only buy or sell A shares, whereas foreign investors were only allowed to trade B shares. This separation of ownership according to investor groups was abolished in two steps. First, in order to improve liquidity and market capitalization of B shares, the Chinese Securities Regulatory Commission (CSRC) allowed domestic investors to enter the market in early 2001. Second, the CSRC liberalized the A-share market to encourage foreign investment in late 2002. However, market entrance is still restricted to Qualified Foreign Institutional Investors (QFIIs), foreign institutions that are allowed to participate in a special certification system.
The CSI300 is the first stock index to broadly reflect performance across both stock exchanges in mainland China. Created on April 8, 2005, it is compiled and published by the China Securities Index Company and consists of 300 large-capitalization and actively traded stocks listed in Shanghai (195 stocks) and Shenzhen (105 stocks). The CSRC gave its approval for the creation of financial futures in 2006, and the CFFEX was inaugurated in September that year. A month later, mock trading began on the CSI300 stock index contract and continued through to 2010. On April 16, 2010, the CSI300 index futures market was finally launched.2 It is interesting that the market was launched in the aftermath of the so-called global financial crisis (GFC) and shortly after Europe’s own financial crisis erupted in May 2010.
The Chinese authorities designed markets with conservative specifications and high barriers to entry.
1 Unless noted otherwise, the information in this section relies on discussion with and material provided by Metzler Asset Management, Frankfurt, Germany, KPMG Financial Services (2011) and Walter and Howie (2012).
2 Information on CSI300 futures contract specifications is obtained from www.cffex.com.cn/en_new/sspz/hs300zs/ as well as the authors’ calculations based on data from Thomson Reuters Datastream.
The contract size is the index value of the CSI300 index futures multiplied by Chinese Yuan Renminbi (CNY) 300 (approximately USD 48). The relatively large multiplier of 300 tends to discourage participation of small investors in the market. Five futures contracts are traded simultaneously; their expiration dates fall over the next three consecutive months and the two nearest quarter-end months (which are March, June, September and December). The third Friday of each month is the settlement day, and the settlement price is calculated as the arithmetic average of the CSI300 spot index during the last two trading hours of that day. A price limit of +/- 10 percent with respect to the settlement price of the last trading day ought to limit extensive price fluctuations. In addition, if changes in the daily futures price exceed six percent and last for more than a minute, bid/ask quotes are restricted to a range between +/- six percent for the following 10 minutes. This procedure is designed to stabilize the futures market under conditions of extremely high volatility.
Before opening a futures trading account, investors are required to deposit at least CNY 500,000 (approximately USD 81,000). The minimum trading account size is CNY one million. Initial margins are set at 12 percent; the tick size is 0.2 index points worth USD 8.8. A single futures trading account can have only 100 contracts, though the limit can be raised by approval of the CFFEX. Domestic mutual funds can only have a long futures position of up to 10 percent of its assets under management and a short futures position of up to 20 percent of its stock holdings. Investors must have prior experience with commodities futures trading or mock trading of index futures. Initially, foreign investors were excluded from the market. However, since May 4, 2011, QFIIs are allowed to participate. The same holds for equity funds, balanced funds and capital preservation funds. Overall, high market entry barriers as well as the large contract size of CSI300 index futures show that the product has been designed to offset speculators.
Prior to the introduction of CSI300 index futures, investors could already invest in two offshore sister spot and index futures markets in Singapore and Hong Kong. The Financial Times Stock Exchange (FTSE) China A50 index is a real-time index comprising the 50 largest A share companies by market capitalization. Its base date is July 21, 2003 and its base value is 5000. The Singapore Exchange (SGX) FTSE China A50 index futures are offshore futures denominated in USD and first issued on September 5, 2006 by the SGX.3 Facing the competition from mainland China, it made a series of substantial revisions to the futures contract specifications on August 23, 2010, at which point the contract size was reduced to USD 1 from USD 10 multiples of the futures price. With the index futures closing at 8,540 points on January 4, 2013, one futures contract cost USD
3 Relevant information from www.sgx.com/wps/portal/sgxweb/home/products/derivatives/equity/chinaa50 and own calculations.

THE EFFECT OF INDEx FuTuRES TRADING ON vOLATILITy THREE MARKETS FOR CHINESE STOCKS
MARTIN T. BOHL, JEANNE DIESTELDORF AND PIERRE L. SIKLOS • 3
8,540. Following changes leading to extended trading hours, reduced entry barriers, smaller contract sizes and lower margin requirements, A50 trading volume increased sharply.
The contract months are the two nearest consecutive months and March, June, September and December on a one-year cycle. The last trading day is the second-last business day of the contract month. The final settlement price is the official closing price of the FTSE China A50 index rounded to the nearest two decimal places. There are price limits of 10 percent and 15 percent from the previous day’s settlement price followed by a cooling-off period of 10 minutes when the limit is reached. There are no price limits for the rest of the day nor for expiring contracts on their last trading day.
Although the A50 futures market’s trading volume is only nine percent of that of the CSI300 futures market, it has some advantages over the much larger futures market in Shanghai. First, the A50 index futures market has considerably lower entry barriers for investors. Its contract size is smaller and its initial margin is lower. Second, the A50 futures market opens 15 minutes earlier and closes 10 minutes later than the CSI300 futures market. In addition, there is no lunch break in the A50 futures market. Investors can therefore trade in the market longer and without mid-day interruptions. Third, the A50 futures market has an additional T+1 session that lasts until the next day. When the market has unexpected news during extended T and T+1 sessions, the only place where investors can trade is the A50 futures market.
Fourth, the A50 futures contract is settled in USD, which is particularly convenient for international investors. Fifth, unlike in the pure order-driven CSI300 futures market, there are market makers for A50 futures, which ensures liquidity.
The Hang Seng China Enterprise Index (HSCEI) is a market capitalization-weighted stock index compiled and calculated by the Hang Seng Index Company. It has existed since August 8, 1994 and tracks the performance of 40 major H-shares, CNY-denominated shares issued by the People’s Republic of China (PRC) issuers under PRC law, but listed on the Hong Kong stock exchange. While the par value of its components is denominated in CNY, they are subscribed for and traded in Hong Kong dollar (HKD).
The respective HSCEI index futures were introduced on December 3, 2003 and are traded on the same exchange as the underlying index.4 All contracts are traded in HKD at the size of 50 times the futures index value. With a futures index value of 11,914 points on January 4, 2013, one futures contract cost HKD 595,700 (USD 76,860). The tick size is one index point, which corresponds to USD 6.5. The initial margin is set at HKD 39,100 (USD 5,045). Available contract months are the spot month, the next calendar month and the next two calendar quarter months. Each contact’s last trading day is the business day immediately preceding the last business day of the contract month. The final settlement price is the average of all quotations of the HSCEI taken at five-minute intervals during the last trading day.
4 Relevant information is from www.hkex.com.hk/eng/prod/drprod/hshares/hhifut.htm and own calculations.
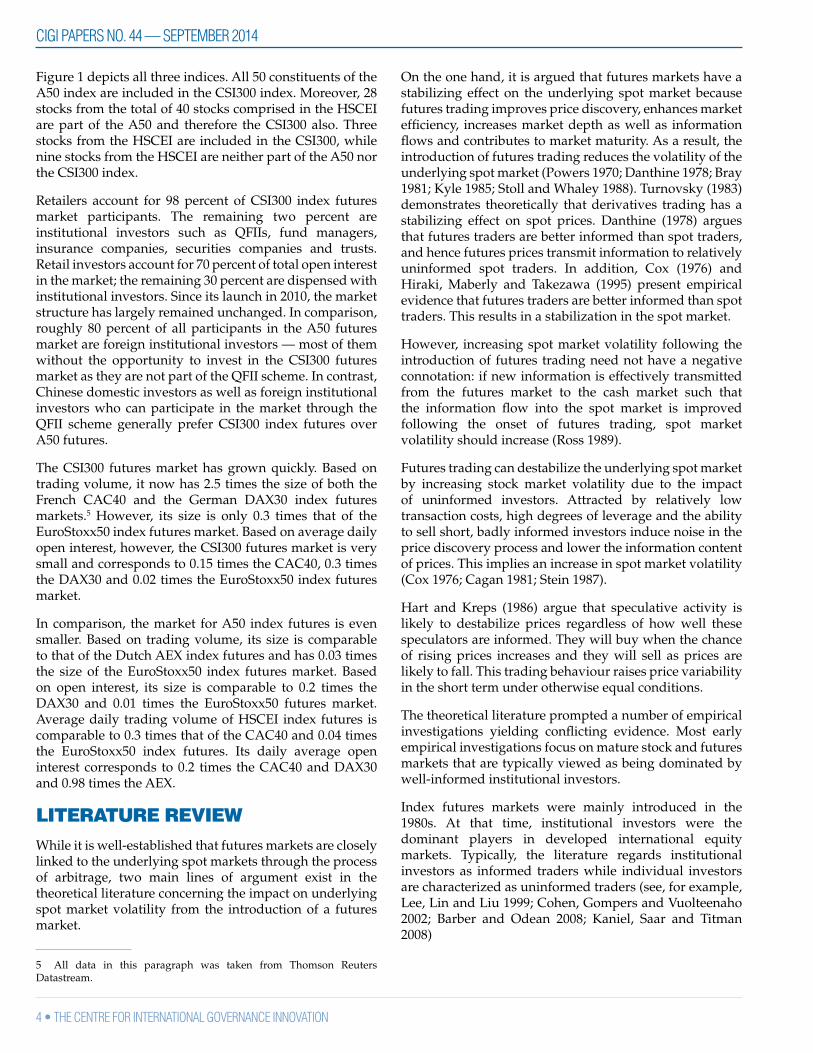
Figure 1: Index Comparison
Notes: All three indices (log of in index points) are taken from Thomson Reuters Datastream
CIGI PAPERS NO. 44 — SEPTEMBER 2014
4 • THE CENTRE FOR INTERNATIONAL GOvERNANCE INNOvATION
Figure 1 depicts all three indices. All 50 constituents of the A50 index are included in the CSI300 index. Moreover, 28 stocks from the total of 40 stocks comprised in the HSCEI are part of the A50 and therefore the CSI300 also. Three stocks from the HSCEI are included in the CSI300, while nine stocks from the HSCEI are neither part of the A50 nor the CSI300 index.
Retailers account for 98 percent of CSI300 index futures market participants. The remaining two percent are institutional investors such as QFIIs, fund managers, insurance companies, securities companies and trusts. Retail investors account for 70 percent of total open interest in the market; the remaining 30 percent are dispensed with institutional investors. Since its launch in 2010, the market structure has largely remained unchanged. In comparison, roughly 80 percent of all participants in the A50 futures market are foreign institutional investors — most of them without the opportunity to invest in the CSI300 futures market as they are not part of the QFII scheme. In contrast, Chinese domestic investors as well as foreign institutional investors who can participate in the market through the QFII scheme generally prefer CSI300 index futures over A50 futures.
The CSI300 futures market has grown quickly. Based on trading volume, it now has 2.5 times the size of both the French CAC40 and the German DAX30 index futures markets.5 However, its size is only 0.3 times that of the EuroStoxx50 index futures market. Based on average daily open interest, however, the CSI300 futures market is very small and corresponds to 0.15 times the CAC40, 0.3 times the DAX30 and 0.02 times the EuroStoxx50 index futures market.
In comparison, the market for A50 index futures is even smaller. Based on trading volume, its size is comparable to that of the Dutch AEX index futures and has 0.03 times the size of the EuroStoxx50 index futures market. Based on open interest, its size is comparable to 0.2 times the DAX30 and 0.01 times the EuroStoxx50 futures market. Average daily trading volume of HSCEI index futures is comparable to 0.3 times that of the CAC40 and 0.04 times the EuroStoxx50 index futures. Its daily average open interest corresponds to 0.2 times the CAC40 and DAX30 and 0.98 times the AEX.
LITERATURE REVIEWWhile it is well-established that futures markets are closely linked to the underlying spot markets through the process of arbitrage, two main lines of argument exist in the theoretical literature concerning the impact on underlying spot market volatility from the introduction of a futures market.
5 All data in this paragraph was taken from Thomson Reuters Datastream.
On the one hand, it is argued that futures markets have a stabilizing effect on the underlying spot market because futures trading improves price discovery, enhances market efficiency, increases market depth as well as information flows and contributes to market maturity. As a result, the introduction of futures trading reduces the volatility of the underlying spot market (Powers 1970; Danthine 1978; Bray 1981; Kyle 1985; Stoll and Whaley 1988). Turnovsky (1983) demonstrates theoretically that derivatives trading has a stabilizing effect on spot prices. Danthine (1978) argues that futures traders are better informed than spot traders, and hence futures prices transmit information to relatively uninformed spot traders. In addition, Cox (1976) and Hiraki, Maberly and Takezawa (1995) present empirical evidence that futures traders are better informed than spot traders. This results in a stabilization in the spot market.
However, increasing spot market volatility following the introduction of futures trading need not have a negative connotation: if new information is effectively transmitted from the futures market to the cash market such that the information flow into the spot market is improved following the onset of futures trading, spot market volatility should increase (Ross 1989).
Futures trading can destabilize the underlying spot market by increasing stock market volatility due to the impact of uninformed investors. Attracted by relatively low transaction costs, high degrees of leverage and the ability to sell short, badly informed investors induce noise in the price discovery process and lower the information content of prices. This implies an increase in spot market volatility (Cox 1976; Cagan 1981; Stein 1987).
Hart and Kreps (1986) argue that speculative activity is likely to destabilize prices regardless of how well these speculators are informed. They will buy when the chance of rising prices increases and they will sell as prices are likely to fall. This trading behaviour raises price variability in the short term under otherwise equal conditions.
The theoretical literature prompted a number of empirical investigations yielding conflicting evidence. Most early empirical investigations focus on mature stock and futures markets that are typically viewed as being dominated by well-informed institutional investors.
Index futures markets were mainly introduced in the 1980s. At that time, institutional investors were the dominant players in developed international equity markets. Typically, the literature regards institutional investors as informed traders while individual investors are characterized as uninformed traders (see, for example, Lee, Lin and Liu 1999; Cohen, Gompers and Vuolteenaho 2002; Barber and Odean 2008; Kaniel, Saar and Titman 2008)

THE EFFECT OF INDEx FuTuRES TRADING ON vOLATILITy THREE MARKETS FOR CHINESE STOCKS
MARTIN T. BOHL, JEANNE DIESTELDORF AND PIERRE L. SIKLOS • 5
Cohen, Gompers and Vuolteenaho (2002) show that institutional investors’ trading decisions are based on fundamental information. As a result, institutional investors drive stock prices to their fair values and thereby exert a stabilizing effect on prices. In comparison, individual investors are less well-informed (Dennis and Weston 2001). Therefore, their trading decisions are more biased by behavioural aspects (Kamesaka, Nofsinger and Kawakita 2003).
An obvious way to empirically investigate the impact of investor behaviour on market stability is to examine the sources of changes in the volatility of returns. In addition, one may want to discriminate between mature and newly created markets for stock index futures. We consider select contributions to both strands of the literature.
Harris (1989) reports statistically but not economically significant increases in stock index returns volatility due to futures trading in the United States. Maberly, Allen and Gilbert (1989) find that volatility rose subsequent to the introduction of index futures on the S&P 500. Lockwood and Linn (1990), Baldauf and Santani (1991), Brorsen (1991) and Pericli and Koutmos (1997) confirm this. Damodaran (1990) finds that the daily price volatility of all the S&P 500 shares increased after the introduction of the S&P 500 futures contract, but that the increase was not statistically significant.
Antoniou and Holmes (1995) examine the British market and find increasing spot market volatilities after the introduction of the FTSE-100 stock index futures. However, they report that the nature of volatility has not changed post-futures introduction. The authors find that the futures have improved the speed and quality of information flowing to the spot market.
Comparing markets in Germany, Japan, Spain, Switzerland, the United Kingdom and the United States, Antoniou, Holmes and Priestley (1998) find that the futures introduction has not had a detrimental effect on the spot market. It appears that there has been an improvement in the way that news is transmitted into prices following the onset of futures trading. Therefore, the view that market turbulence results from the introduction of derivative trading appears unfounded.
Chang, Cheng and Pinegar (1999) confirm the hypothesis that future trading increases spot market volatility in Japan but that there is no volatility spillover to stocks against which futures are not traded.
Lee and Ohk (1992) show that, following the introduction of index futures, volatility of stock returns in Australia, Hong Kong and Japan did not change, but rose significantly in the United Kingdom and the United States. Kan (1997) supports the earlier findings for Hong Kong.
Edwards (1988a; 1988b) report a reduction of spot market volatility subsequent to the introduction of index futures on the S&P 500. Pericli and Koutmos (1997) find that the creation of S&P 500 stock index futures did not cause any shift in the volatility of index stock returns. Darrat, Rahman and Zhong (2002) conclude that index futures trading is not to blame for the observed volatility in the S&P 500 spot market. Rather, they find more support for the alternative view that volatility in the futures market is an outgrowth of a turbulent cash market. Galloway and Miller (1997) document a significant decrease in return volatility and systematic risk as well as a significant increase in trading volume for the MidCap 400 stocks after the introduction of the corresponding index futures. Rahman (2001) shows that the introduction of index futures and futures options on the Dow Jones Industrial Average has produced no structural changes in the conditional volatility of the component stocks.
In line with the findings for the US market, Bacha and Vila (1994) confirm the stabilization hypothesis for the Japanese market, Reyes (1996) for markets in France and Denmark and Dennis and Sim (1999) for the Australian market. On the other hand, Yu (2001) reports that the volatility of stock returns in the United States, France, Japan and Australia rose significantly subsequent to the introduction of the respective index futures but not in the United Kingdom or Hong Kong.
In a broad study, Gulen and Mayhew (2000) examine stock market volatility before and after the introduction of equity index futures trading in 25 countries consisting of a mix of mature and emerging markets. The authors find that futures trading is related to an increase in conditional volatility in the United States and Japan, but in nearly every other country, either no significant effect, or a volatility-dampening effect is reported.
A number of empirical papers specifically investigate the impact of the introduction of stock index futures trading on the underlying spot market in emerging markets. Chiang and Wang (2002) explore the market in Taiwan and report an increase in spot market volatility subsequent to the introduction of index futures. Baklaci and Tütek (2006) examine the Turkish market and find that the introduction of index futures significantly improves the rate at which new information is impounded into spot prices and reduces the persistence of information and volatility in the underlying spot market, resulting in improved efficiency. Caglayan (2011) reports that there have been significant changes in the structure of the volatility in the Turkish spot market following the onset of futures trading. However, both studies for Turkey cover a very short time span of less than two years. Kasman and Kasman (2008) report results in favour of the stabilization hypothesis for the Turkish ISE-30 index and suggest that the direction of both long- and short-run causality flows from spot prices to futures prices, confirming the theory that futures markets enhance

CIGI PAPERS NO. 44 — SEPTEMBER 2014
6 • THE CENTRE FOR INTERNATIONAL GOvERNANCE INNOvATION
the efficiency of the underlying spot market. In line with this, Bohl, Salm and Wilfling (2011) explore the Polish market where it is argued uninformed individuals are the dominant trader type in the futures markets. The authors are able, therefore, to investigate the destabilization hypothesis with a special focus on the influence of individuals trading in index futures on spot market volatility. Their results suggest that the introduction of index futures trading does not destabilize the spot market.
Turning to evidence for China, Arisoy (2008) examines the introduction of the SGX FTSE Xinhua China A50 index futures contract on the volatility and liquidity of its underlying spot market. The findings indicate a significant increase in spot volatility and liquidity in the post-futures period. Conditional volatility estimations suggest that the change in volatility is attributed to an increase in the rate of flow of information to the spot market, rather than speculative trading. After controlling for factors affecting liquidity, Arisoy confirms the finding that the introduction of futures trading induces migration of uninformed traders from spot market to futures market. His results imply an increased trading volume, and more volatile, but more efficient markets. However, as noted previously, their results do not consider some of the institutional idiosyncrasies, notably the height barriers to entry, associated with the creation of this market, which casts doubts on his findings.
We follow the majority of papers cited here in choosing a GARCH approach to model volatility spillovers for data at the daily frequency. However, owing to its recent creation, the sample from the mainland Chinese market(s) is shorter than in some of the studies cited above. In general, samples based on the experience of emerging markets tend to be shorter than in papers that investigate the impact of futures markets on spot markets in mature economies.
DATA AND METHODOLOGYWe analyze the impact of the introduction of the CSI300 index futures on different spot markets in the region. The spot index counterparts are the A50 spot index in Singapore and the HSCEI spot index in Hong Kong, in addition to the CSI300 spot market in Shanghai.
The times series for the CSI300 spot index begins with its introduction on April 8, 2005. The series for the A50 spot index series starts on January 4, 2000; the HSCEI spot index begins on January 3, 2000. Our sample ends on June 24, 2013. All data are taken from Thomson Reuters Datastream. Since CSI300 index futures are traded in CNY, A50 futures in USD and HSCEI futures in HKD, all data are expressed in CNY. As the relevant exchange rates become available to Datastream at 16:15 GMT each day, we use a one-day lag to account for time differences between GMT and GMT+8, the time zone in which all markets under consideration operate.
For each index, we calculate continuous returns in percent:
rt = ln(Pt) ln(Pt 1)
After excluding non-trading days, our samples consist of 1,991 usable observations for the CSI300 index, 3,270 observations for the A50 index and 3,294 observations for the HSCEI.6
ECONOMETRIC APPROACHConditional variance is time-varying. Accordingly, we estimate varieties of GARCH models (Bollerslev 1987) as these are frequently used in similar contexts and thus permit comparability with the extant literature. Frequently, disturbances are assumed to follow a t-distribution. However, we also estimate all models under the assumption of a normal conditional error distribution as additional robustness checks.7
The final model specifications are chosen by the general-to-specific approach. All models consist of the same mean equation and a number of different variance equations. To facilitate distinction between the three different spot markets considered, we add the respective superscripts CSI300, A50 and HSCEI to the estimated coefficients both in the text and in the output tables. Our mean equation is specified as follows:
It takes into account first-order autocorrelation in stock returns as well as international interdependence of the Chinese stock market; and denote the (lagged) logarithmic return on foreign stock markets measured by the return of the Morgan Stanley Capital International (MSCI) world index. In order to account for the effect of foreign stock market movements on all indices under consideration, a number of possible candidates were considered. Based on economic reasoning supported by correlation analysis, the MSCI has been found to best capture movements in international stock markets while not being overly correlated with the Chinese market. The effect of the GFC on Chinese markets is captured by a crisis dummy DGFC variable. To this end, various possible specifications of the GFC dummy were examined both
6 Besides the different raw indices, we also generate three different principal component series based on the presumption that the markets in question possess significant common features. Since the conclusions are unchanged, the relevant results are relegated to the Appendix.
7 Unless otherwise indicated, robustness checks support the findings discussed below.

THE EFFECT OF INDEx FuTuRES TRADING ON vOLATILITy THREE MARKETS FOR CHINESE STOCKS
MARTIN T. BOHL, JEANNE DIESTELDORF AND PIERRE L. SIKLOS • 7
economically and econometrically. A dummy taking on the value of one between June 7, 2007 and April 9, 2009 and zero otherwise has been found to best reflect the impact of the GFC. Its specification follows the St. Louis Fed’s financial crisis timeline and starts on the day Bear Sterns suspended redemptions from its High-Grade Structured Credit Strategies Enhances Leverage Fund.8 The timeline ends in March 2009. However, extreme return volatility in both international and broad Asian stock market indices can be found until early April 2009. Hence, the final specification of the GFC dummy reflects this feature of the data. To capture the various avenues through which the GFC may have impacted equity markets, the mean equation contains interaction terms. DF is a dummy variable equal to zero before, and equal to one after, the introduction of the respective futures markets under consideration. For the CSI300 index futures, it is equal to one following April 16, 2010. In the case of the A50 index futures, DF equals one following September 5, 2006. For HSCEI index futures, the switching date is January 5, 2004. We create symmetric samples centered around these respective dates.
Assuming a GARCH(1,1) structure leads to the specification of two different variance equations:
In equations (2) and (3), the estimated parameters on the dummy variable DF, which capture the difference in volatility following the introduction of derivatives contracts, are most relevant for our research question: for example, if D ( 1) is positive, a positive shift in the conditional volatility process occurs after the introduction of index futures, implying that the spot market volatility is higher after the introduction of futures. This would represent evidence in favour of the destabilizing hypothesis. If the coefficient is statistically significant but negative, index futures exhibit a dampening influence on conditional volatility levels, thereby providing empirical evidence in favour of the stabilizing hypothesis. The additive inclusion of the dummy variable in (3) captures possible changes in the overall level of the variance due to the introduction of index futures. The interaction terms ( 3 and 5) may further contribute or potentially offset a level shift in volatility following the introduction of futures depending upon the degree of volatility persistence. To capture the impact of the GFC on spot market volatility, we also include the crisis dummy variable in all volatility equations. Moreover, we wish to account for possible
8 See also Burdekin and Siklos (2012) for a discussion of alternative specifications of the DGF C variable.
volatility spillovers between international stock markets as well as the sister spot markets. To this end, we include three different variances into each volatility equation. They were obtained from basic GARCH(1,1) estimations taking into account the impact of the GFC. Due to differing time zones and trading hours, we include the contemporaneous value of the MSCI variances and one lag of the A50 and the HSCEI variances.9
To account for the fact that positive and negative shocks can have different effects on subsequent volatility, next we consider GJR-GARCH models as proposed by Glosten, Jagannathan and Runkle (1993):
It takes on the value of zero if the return innovation is zero or positive, i.e., Et−1 ≥ 0, and the value of one in case of negative return shocks, i.e., Et−1< 0. A statistically significant and positive 3 ( 6) coefficient indicates that negative return shocks increase the conditional variance more strongly than positive return shocks. Setting the asymmetry coefficient equal to zero yields the conventional GARCH(1,1) specification. Lastly, we estimate an EGARCH model since this allows for asymmetric responses of conditional volatility to positive and negative shocks. Following Nelson (1991), the EGARCH models modified for our purposes are specified as follows:
where log(ht) is the logarithmic conditional volatility of Et. Regardless of the magnitude of log(ht), the implied value of ht can never be negative. Hence, all estimated coefficients are allowed to be negative. In (6), a positive 1 indicates the degree of volatility persistence; 2 captures the asymmetric effect, while 3 measures the magnitude effect. If 2 is statistically significant and negative, the negative shocks have a stronger impact on conditional volatility than positive shocks, implying the so-called leverage effect.
9 When estimating the models for the A50 (HSCEI) spot market, we only account for spillover effects to the HSCEI (A50) spot market. The CSI300 spot index was only introduced in 2005. Accounting for this fact would mean a considerable loss of observations.

CIGI PAPERS NO. 44 — SEPTEMBER 2014
8 • THE CENTRE FOR INTERNATIONAL GOvERNANCE INNOvATION
Mean Max. Min. Std. Dev. Skew. Kurt. Obs.
CSI 300
Futures Dummy (CSI300)
0 0.100 8.931 -9.695 2.150 -0.426 5.159 1221
1 -0.058 4.926 -6.516 1.431 -0.245 4.911 769
All 0.039 8.931 -9.695 1.906 -0.374 5.694 1990
Futures Dummy (A50)
0 0.003 9.526 -5.797 1.315 0.965 9.680 1624
1 0.017 9.198 -9.861 2.006 -0.252 5.494 1645
Futures Dummy (CSI300)
0 0.033 9.526 -9.861 1.782 0.029 7.047 2501
1 -0.064 5.472 -6.712 1.390 -0.157 5.358 768
All 0.010 9.526 -9.861 1.698 0.019 7.104 3269
HSCEI
Futures Dummy (HSCEI)
0 0.100 10.104 -8.312 2.065 0.230 5.191 985
1 0.009 15.511 -15.014 2.163 0.003 9.363 2308
Futures Dummy (CSI300)
0 0.066 15.511 -15.014 2.277 0.043 8.026 2506
1 -0.059 7.666 -6.463 1.593 0.030 5.006 787
All 0.036 15.511 -15.014 2.134 0.062 8.290 3293
We estimate the mean equation (1) and the respective volatility equations (2) to (7) via maximum likelihood estimations based on the Berndt, Hall, Hall, and Hausman (BHHH) algorithm proposed by Berndt et al. (1974) and employ p-values based on Bollerslev and Wooldridge (1992) robust standard errors, if applicable.
EMPIRICAL RESULTSTable 1 provides summary statistics for the daily (exchange rate adjusted if applicable) spot return of the CSI300, the A50 and the HSCEI indices.
Returns in all three markets indicate skewness and excess kurtosis, a finding that mirrors the properties of most financial time series. Kurtosis is higher before rather than after the introduction of CSI300 index futures in all three markets. One possible explanation may be that the futures introduction coincides with the end of the GFC. During the crisis, extreme market outcomes such as very high and very low daily returns were more likely than afterwards.
Both minima and maxima of all three indices considered are in line with the extrema for broad international stock indices. Ranging between plus and minus 15 percent, only the HSCEI’s return varies a little more than the Standard & Poor’s (S&P) 500, the MSCI World Index or the FTSE All
World index, whose daily returns fluctuate between plus and minus 10 percent during our sample period.10
Considerable differences are found when comparing the standard deviations of all three indices before and after the introduction of their respective index futures. Before the introduction of CSI300 index futures, the CSI300 spot index return’s standard deviation is higher than afterwards. The same holds true for the A50 index and the HSCEI index. In contrast, the introduction of A50 index futures apparently increased standard deviation of the underlying A50 index. The introduction of HSCEI index futures does not alter the underlying indexes’ standard deviation. The results suggest that the introduction of CSI300 index futures had a calming effect on all three spot market returns.
Table 2 reports the regression results for the CSI300 spot market. Generally, the coefficients across all six different mean equations do not differ by much. 4
CSI and 6CSI are
positive and highly significant in all model specifications. This suggests that returns of the MSCI have a strong impact on returns of the CSI300 spot market. Neither the GFC nor the introduction of CSI300 index futures appears to have had a significant effect on the dependent variable.
10 Comparison based on authors’ calculations; data obtained from Thomson Reuters Datastream.
Notes: Our sample is defined as follows: CSI300 — April 8, 2005 to June 24 2013; CSI300 futures introduction on April 16, 2010. A50 — January 4, 2000 to June 24, 2013; A50 futures introduction on September 5, 2006. HSCEI — January 3, 2000 to June 24, 2013; HSCEI futures introduction on December 3, 2003.
Table 1: Summary Statistics

THE EFFECT OF INDEx FuTuRES TRADING ON vOLATILITy THREE MARKETS FOR CHINESE STOCKS
MARTIN T. BOHL, JEANNE DIESTELDORF AND PIERRE L. SIKLOS • 9
The finding for the GFC holds true for various robustness checks with different start and (or) end dates for the dummy specification (not all results are shown).
The results of the estimation of equation (2) (GARCH I) most interestingly yield empirical evidence in favour of the stabilizing hypothesis: D
CSI is negative and significant. Hence, the introduction of CSI300 index futures had a calming impact on CSI300 spot market volatility even if we control for the (end of the) GFC. Moreover, we find a high degree of volatility clustering as well as shock persistence. Neither the GFC-dummy itself nor the volatility of the HSCEI sister spot market are found to exert any impact on the volatility in the CSI300 spot market. However, there is empirical evidence for spillover effects between the CSI300 spot market and the A50 spot market ( 5
CSI is negative and significant). It is not an accident perhaps that the A50 market is located outside the influence, direct or indirect, of Chinese authorities who have, at the very least, moral suasion over behaviour in the HSCEI market. Generally, the foregoing findings are confirmed by the results of the estimation of equation (3) (GARCH II). The introduction of CSI300 index futures had a calming effect on the volatility of its underlying spot market.
Moreover, a positive and significant 9CSI now suggests
spillover effects between the HSCEI spot market and the CSI300 spot market. Overall, as also shown below, it does not appear that spillover effects between the A50 and the CSI300 spot market are robust, while the same cannot be said about the links between the HSCEI and the CSI300 markets.
Estimation of equation (4) does not yield any significant impact of the CSI300 futures introduction on its spot market volatility. A negative and highly significant 1
CSI suggests a high degree of volatility clustering equation here. 6
CSI is positive and highly significant, which shows spillover effects from the A50 spot market to its CSI300 sister spot market. This is confirmed by the results of the GJR-GARCH II model (equation 5), where 10
CSIis positive and highly significant. Moreover, this model specification yields highly significant evidence in favour of the stabilizing hypothesis: negative and highly significant 1
CSI , 3CSI
, 5CSI and 7
CSI strongly confirm that the introduction of CSI300 index futures had a calming effect on the volatility of the underlying spot market.
Generally, the results for both EGARCH model specifications confirm previous findings. Negative and
Table 2: Regression Results — Impact of CSI300 Futures Introduction on CSI300 Spot Market
Notes: *, **, *** denote statistical significance at the 10 percent, five percent and one percent level, respectively.

CIGI PAPERS NO. 44 — SEPTEMBER 2014
10 • THE CENTRE FOR INTERNATIONAL GOvERNANCE INNOvATION
highly significant estimated coefficients DCSI (EGARCH
I), 1CSI and 5
CSI (EGARCH II) yield evidence in favour of the stabilizing hypothesis. A positive and significant 10
CSI
substantiates the spillover effects between the A50 and the CSI300 spot markets.
Neither our results for the GJR-GARCH models nor the output for the EGARCH models report any significant leverage effect. The estimation output for both the GJR- GARCH II and EGARCH II model yield a significant and positive coefficient on the GFC dummy, suggesting that the crisis increased volatility in the CSI300 spot market.
Table 3 shows the regression results for the A50 spot market and the effect of the CSI300 futures introduction. Across all model specifications, strong evidence is found in favour of the stabilizing hypothesis. The introduction of CSI300 index futures had a calming effect on the volatility of the A50 spot market. Moreover, a positive and significant
9A50 (GARCH II),
6A50 and
7A50 (GJR-GARCH
I) as well as 10A50 (GJR-GARCH II) suggest spillover
effects between the A50 spot market and both the CSI300 and the HSCEI sister spot markets. Again, no evidence for the existence of leverage effects is found.
Table 4 summarizes the results obtained for the HSCEI spot market and the possible impact from the introduction of CSI300 futures. They confirm previous findings in favour of the stabilizing hypothesis. Moreover, negative and significant estimates of 10
HSCEI (GJR-GARCH II), 6
HSCEI (EGARCH I) and 10HSCEI (EGARCH II) suggest
negative spillover effects between the CSI300 spot market and its HSCEI sister market. Increases in the volatility of the CSI300 spot market tends to calm the HSCEI spot market.
Finally turning to the examination of the two offshore markets where index futures on Chinese stocks have been traded long before the introduction of CSI300 index futures, Table 5 shows the results for the A50 spot market and any possible impact of the introduction of A50 index futures. Overall, the different estimated coefficients on the dummy variable yield mixed results. For most model specifications, they are insignificant. In some cases, the evidence is favourable to the destabilizing hypothesis.
3A50 and 5
A50 (GARCH II), 3A50 (GJR-GARCH II),
DA50 (EGARCH I) and
5A50 (EGARCH II) are positive and
significant. However, the results have to be interpreted with caution. As outlined above and in the Appendix, A50 index futures trading was extremely narrow before
Table 3: Regression Results — Impact of CSI300 Futures Introduction on A50 Spot Market
Notes: *, **, *** denote statistical significance at the 10 percent, five percent and one percent level, respectively.

THE EFFECT OF INDEx FuTuRES TRADING ON vOLATILITy THREE MARKETS FOR CHINESE STOCKS
MARTIN T. BOHL, JEANNE DIESTELDORF AND PIERRE L. SIKLOS • 11
Table 4: Regression Results — Impact of CSI300 Futures Introduction on HSCEI Spot Market
Notes: *, **, *** denote statistical significance at the 10 percent, five percent and one percent level, respectively.
the introduction of CSI300 futures. Table 6 summarizes our findings for the HSCEI spot market and its own index futures introduction. The relevant estimated coefficients are negative but insignificant. Hence, we find no evidence in favour of neither the stabilizing nor the destabilizing hypothesis.
CONCLUSIONThis paper examines the impact of the introduction of CSI300 index futures on the volatility of its underlying spot market. Equally importantly, we contrast these findings with the A50 and HSCEI spot and derivatives markets, where index futures on Chinese stocks are also traded. At the same time, we model spillover effects between the three markets. To the best of our knowledge, this approach has not been considered and provides new insights into the relevant literature.
The CSI300 derivative market provides a unique setting for our analysis. It is controlled by the CSRC and characterized by high barriers to entry. Access is limited, especially for international (institutional) investors. As a result, Chinese retail investors dominate the market. On the whole, this is rather atypical for an emerging market. In addition, the
market exhibits very high average daily trading volume but low average open interest. No other market has been found to follow similar patterns over the sample period under consideration. This finding may hint at an increased activity of speculators.
Overall, we find robust evidence in favour of the stabilization hypothesis. Our regression results show that the introduction of CSI300 index futures had a significant and negative impact on the volatility of the CSI300 spot index, as well as on both the A50 and HSCEI spot markets. In contrast, the introduction of A50 and HSCEI index futures had unanimous but certainly not calming effects on their respective underlying spot markets. These findings also hold when controlling for the impact of the (end of the) GFC.
Differences in the types of investors, the tightly regulated nature of China’s futures market, together with the existence of two sister markets in the region where comparable stocks are traded, may well combine to explain why China’s market resembles its counterparts in mature economies more so than in emerging markets. Of course, even allowing for spillover effects we cannot claim to have identified all of the sources of the stability-inducing impact from the introduction of a futures market in China.

CIGI PAPERS NO. 44 — SEPTEMBER 2014
12 • THE CENTRE FOR INTERNATIONAL GOvERNANCE INNOvATION
Table 5: Regression Results — Impact of A50 Futures Introduction on A50 Spot Market11
Notes: *, **, *** denote statistical significance at the 10 percent, five percent and one percent level, respectively.
As the CSI300 index was introduced in 2005, it has not been available long enough to be included in these estimations, which rely on samples centered around the introduction of A50 index futures on September 5, 2006 and HSCEI index futures on January 5, 2004, respectively. Therefore, we only include the volatility of one sister spot market in the different variance equations to account for possible spillover effects.
Consequently, there is more research to be done to improve our understanding of the market structures examined. For example, a distinction has to be made between constituent and non-constituent stocks. In addition, firm-specific and possibly further macroeconomic factors apart from the GFC ought to be considered.

THE EFFECT OF INDEx FuTuRES TRADING ON vOLATILITy THREE MARKETS FOR CHINESE STOCKS
MARTIN T. BOHL, JEANNE DIESTELDORF AND PIERRE L. SIKLOS • 13
Table 6: Regression Results — Impact of HSCEI Futures Introduction on HSCEI Spot Market
Notes: *, **, *** denote statistical significance at the 10 percent, five percent and one percent level, respectively.
As the CSI300 index was introduced in 2005, it has not been available long enough to be included in these estimations, which rely on samples centered around the introduction of A50 index futures on September 5, 2006 and HSCEI index futures on January 5, 2004, respectively. Therefore, we only include the volatility of one sister spot market in the different variance equations to account for possible spillover effects.

CIGI PAPERS NO. 44 — SEPTEMBER 2014
14 • THE CENTRE FOR INTERNATIONAL GOvERNANCE INNOvATION
WORKS CITEDAntoniou, A. and P. Holmes. 1995. “Futures Trading,
Information and Spot Price Volatility: Evidence for the FTSE-100 Stock Index Futures Contract using GARCH.” Journal of Banking and Finance 19 (1): 117–29.
Antoniou, A., P. Holmes and R. Priestley. 1998. “The Effects of Stock Index Futures Trading on Stock Index Volatility: An Analysis of the Asymmetric Response of Volatility to News.” Journal of Futures Markets 18 (2): 151–66.
Antoniou, A., G. Koutmos and A. Pericli. 2005. “Index Futures and Positive Feedback Trading: Evidence from Major Stock Exchanges.” Journal of Empirical Finance 12 (2): 219–38.
Arisoy, Y. E. 2008. “Index Futures, Spot Volatility, and Liquidity: Evidence from FTSE Xinhua A50 Index Futures.” Working Paper. European Financial Management Association.
Bacha, O. and A. F. Vila. 1994. “Futures Markets, Regulation and Volatility: The Case of the Nikkei Stock Index Futures Markets.” Pacific-Basin Finance Journal 2 (2–3): 201–25.
Baklaci, H. and H. Tütek. 2006. “The Impact of the Futures Market on Spot Volatility: An Analysis in Turkish Derivatives Markets.” In Computational Finance and Its Applications II, edited by M. Constantino and C.A. Brebbia, 237–46. Southampton, UK: WIT Press.
Baldauf, B. and G.J. Santoni. 1991. “Stock Price Volatility: Some Evidence from an ARCH Model.” Journal of Futures Markets 11 (2): 191–200.
Barber, B. M. and T. Odean. 2008. “All That Glitters: The Effect of Attention and News on the Buying Behavior of Individual and Institutional Investors.” Review of Financial Studies 21 (2): 785–818.
Berndt, E. K., B. H. Hall, R. E. Hall and J. A. Hausmann. 1974. “Estimation and Inference in Nonlinear Structural Models.” Annals of Economic and Social Measurement 3 (4): 103–16.
Bohl, M. T., C. A. Salm and B. Wilfling. 2011. “Do Individual Index Futures Investors Destabilize the Underlying Spot Market?” Journal of Futures Markets 31 (1): 81–101.
Bollerslev, T. 1986. “Generalized Autoregressive Conditional Heteroskedasticity.” Journal of Econometrics 31, 307–27.
———. 1987. “A Conditionally Heteroskedastic Time Series Model for Speculative Prices and Rates of Return.” Review of Economics and Statistics 69 (3): 542–47.
Bollerslev, T. and J. M. Wooldridge. 1992. “Quasi-Maximum Likelihood Estimation and Inference in Dynamic Models with Time-Varying Covariances.” Econometric Reviews 11 (2): 143–72.
Bray, M. 1981. “Futures Trading, Rational Expectations, and the Efficient Markets Hypothesis.” Econometrica 49 (3): 575–96.
Brorsen, B. W. 1991. “Futures Trading, Transaction Costs, and Stock Market Volatility.” Journal of Futures Markets 11 (2): 153–63.
Burdekin, R. C. K. and P. L. Siklos. 2012. “Enter the Dragon: Interactions between Chinese, US and Asia-Pacific Equity Markets, 1995–2010.” Pacific-Basin Finance Journal 20 (3): 521–41.
Cagan, P. 1981. “Financial Futures Markets: Is More Regulation Needed?” Journal of Futures Markets 1 (2): 169–89.
Caglayan, E. 2011. “The Impact of Stock Index Futures on the Turkish Spot Market.” Journal of Emerging Market Finance 10 (1): 73–91.
Chang, E. C., J. W. Cheng and J. M. Pinegar. 1999. “Does Futures Trading Increase Stock Market Volatility? The Case of the Nikkei Stock Index Futures Markets.” Journal of Banking and Finance 23 (5): 727–53.
Chiang, M.-H. and C.-Y. Wang. 2002. “The Impact of Futures Trading on Spot Index Volatility: Evidence for Taiwan Index Futures.” Applied Economics Letters 9 (6): 381–85.
Cohen, R. B., P. A. Gompers and T. Vuolteenaho. 2002. “Who Underreacts to Cash Flow News? Evidence from Trading between Individuals and Institutions.” Journal of Financial Economics 66 (2): 409–62.
Cox, C. C. 1976. “Futures Trading and Market Information.” Journal of Political Economy 84 (6): 1215–37.
Damodaran, A. 1990. “Index Futures and Stock Market Volatility.” The Review of Futures Market 9 (2): 442–55.
Danthine, J.-P. 1978. Information, Futures Prices, and Stabilizing Speculation. Journal of Economic Theory 17 (1): 79–98.
Darrat, A. F., S. Rahman and M. Zhong. 2002. “On the Role of Futures Trading in Spot Market Fluctuations: Perpetrator of Volatility or Victim of Regret?” Journal of Financial Research 25 (3): 431–44.
Dennis, S. A. and A. B. Sim. 1999. “Share Price Volatility with the Introduction of Individual Share Futures on the Sydney Futures Exchange.” International Review of Financial Analysis 8 (2): 153–63.

THE EFFECT OF INDEx FuTuRES TRADING ON vOLATILITy THREE MARKETS FOR CHINESE STOCKS
MARTIN T. BOHL, JEANNE DIESTELDORF AND PIERRE L. SIKLOS • 15
Dennis, P. J. and J. P. Weston. 2001. “Who’s Informed? An Analysis of Stock Ownership and Informed Trading.” Working Paper. AFA 2002 Atlanta Meetings.
Edwards, F. R. 1988a. Does Futures Trading Increase Stock Market Volatility? Financial Analysts Journal 44 (1): 63–9.
———. 1988b. “Futures Trading and Cash Market Volatility: Stock Index and Interest Rate Futures.” Journal of Futures Markets 8 (4): 421–39.
Engle, R. F. 1982. “Autoregressive Conditional Heteroskedasticity with Estimates of the Variance of United Kingdom Inflation.” Econometrica 50 (4): 987–1007.
Fernald, J. and J. H. Rogers. 2002. “Puzzles in the Chinese Stock Market.” The Review of Economics and Statistics 84 (3): 416–32.
Figlewski, S. 1981. “Futures Trading and Volatility in the GNMA Market.” Journal of Finance 36 (2): 445–56.
Galloway, T. M. and J. M. Miller. 1997. “Index Futures Trading and Stock Return Volatility: Evidence from the Introduction of MidCap 400 Index Futures.” Financial Review 32 (4): 845–66.
Glosten, L. R., R. Jagannathan and D. E. Runkle. 1993. “On the Relation between the Expected Value and the Volatility of the nominal Excess Return on Stocks.” Journal of Finance 48 (5): 1779–1801.
Gulen, H. and S. Mayhew. 2000. “Stock Index Futures Trading and Volatility in International Equity Markets.” Journal of Futures Markets 20 (7): 661–85.
Harris, L. 1989. S&P 500 “Cash Stock Price Volatilities.” Journal of Finance 44 (5): 1155–75.
Hart, O. D. and D. M. Kreps. 1986. “Price Destabilizing Speculation.” Journal of Political Economy 94 (5): 927–52.
Hiraki, T., E. D. Maberly and N. Takezawa. 1995. “The Information Content of End-of-the-Day Index Futures Returns: International Evidence from the Osaka Nikkei 225 Futures Contract.” Journal of Banking and Finance 19 (5): 921–36.
Kamesaka, A., J. R. Nofsinger and H. Kawakita. 2003. “Investment Patterns and Performance of Investor Groups in Japan.” Pacific-Basin Finance Journal 11 (1): 1–22.
Kan, A. C. N. 1997. “The Effect of Index Futures Trading on Volatility of HIS Constituent Stocks: A Note.” Pacific-Basin Finance Journal 5 (1): 105–14.
Kaniel, R., G. Saar and S. Titman. 2008. “Individual Investor Trading and Stock Returns.” Journal of Finance 63 (1): 273–310.
Kasman, A. and S. Kasman. 2008. “The Impact of Futures Trading on Volatility of the Underlying Asset in the Turkish Stock Market.” Physica A 387, 2837–45.
KPMG Financial Services. 2011. China’s Capital Markets. The Changing Landscape.
Kyle, A. S. 1985. “Continuous Auctions and Insider Trading.” Econometrica 53 (6): 1315–35.
Lee, S. B. and K. Y. Ohk. 1992. “Stock Index Futures Listing and Structural Change in Time-varying Volatility.” Journal of Futures Markets 12 (5): 493–509.
Lee, Y.-T., J.-C. Lin and Y.-J. Liu. 1999. “Trading Patterns of Big versus Small Players in an Emerging Market: An Empirical Analysis.”Journal of Banking and Finance 23 (5): 701–25.
Lockwood, L. J. and S. C. Linn. 1990. “An Examination of Stock Market Return Volatility during Overnight and Intraday Periods, 1964-1989.” Journal of Finance 45 (2): 591–601.
Maberly, E. D. and D. S. Allen and R. F. Gilbert. 1989. “Stock Index Futures and Cash Market Volatility.” Financial Analysts Journal 45 (6): 75–7.
Nelson, D. B. 1991. “Conditional Heteroskedasticity in Asset Returns: A New Approach.” Econometrica 59 (2): 347–70.
Pericli, A. and G. Koutmos. 1997. “Index Futures and Options and Stock Market Volatility.” Journal of Futures Markets 17 (8): 957–74.
Powers, M.J. 1970. “Does Futures Trading Reduce Price Fluctuations in the Cash Markets?” American Economic Review 60 (3): 460–64.
Rahman, S. 2001. “The Introduction of Derivatives on the Dow Jones Industrial Average and Their Impact on the Volatility of Component Stocks.” Journal of Futures Markets 21 (7): 633–53.
Reyes, M. G. 1996. “Index Futures Trading and Stock Price Volatility: Evidence from Denmark and France.” Journal of Economics and Finance 20 (3): 81–8.
Ross, S. A. 1989. “Information and Volatility: The No-arbitrage Martingale Approach to Timing and Resolution Irrelevancy.” Journal of Finance 44 (1): 1–17.
Stein, J. C. 1987. “Informational Externalities and Welfare-reducing Speculation.” Journal of Political Economy 95 (6): 1123–45.
CIGI PAPERS NO. 44 — SEPTEMBER 2014
16 • THE CENTRE FOR INTERNATIONAL GOvERNANCE INNOvATION
Stoll, H. R. and R. E. Whaley. 1988. “Volatility and Futures: Message versus Messenger.” Journal of Portfolio Management 14 (2): 20–2.
Turnovsky, S. J. 1983. “The Determination of Spot and Futures Prices with Storable Commodities.” Econometrica 51 (5): 1363–87.
Walter, C. E. and F. J. T. Howie. 2012. Red Capitalism. The Fragile Financial Foundation of China’s Extraordinary Rise.
World Federation of Exchanges. 2012. Annual Statistics.
Yu, S.-W. 2001. “Index Futures Trading and Spot Price Volatility.” Applied Economics Letters 8 (3): 183–86.

THE EFFECT OF INDEx FuTuRES TRADING ON vOLATILITy THREE MARKETS FOR CHINESE STOCKS
MARTIN T. BOHL, JEANNE DIESTELDORF AND PIERRE L. SIKLOS • 17
APPENDIX
ADDITIONAL INSTITUTIONAL INFORMATION ABOUT SPOT AND DERIVATIVES MARKETS IN ASIA
• Even though A and B shares were identical in terms of ownership rights, market capitalization of the B-shares segment remained low. As of December 2007, total market capitalization of all A-shares traded in Shanghai (Shenzhen) was about 170 (40) times the total value of B-shares. B-shares typically traded at a considerable discount to A-shares (Fernald and Rogers 2002).
• The QFII system allows licensed professional foreign investors to trade CNY denominated securities in China’s mainland stock exchanges by converting foreign currency to CNY with a quota obtained from the relevant authorities. QFIIs have to satisfy minimum requirements regarding assets under management, paid-in capital and experience in trading.
• The CSI300 index components are adjusted every six months based on their size and liquidity by examination of daily average trading value.
• The settlement price of the nearby CSI300 futures contract was CNY 3431.2 on the first day of trading, giving each futures contract a notional value of CNY 1,029,360 (USD 150,811 at the exchange rate prevailing at that time). As the CSI300 futures market is a pure order-driven trading mechanism without market makers, trading is conducted by a central computer system which matches buy and sell orders.
• The A50 index itself accounts for approximately 47 percent of the total market capitalization of the entire A-share market. Right after the creation of A50 index futures in Singapore, the CFFEX was established in Shanghai and started preparing China’s own index futures with four years of mock trading for large qualified domestic institutions. Most interestingly, there was almost no action in the A50 futures market until the introduction of CSI300 futures in April 2010. Since the market revisions following the introduction of CSI300 index futures, both T and T+1 sessions offer extended trading hours in the A50 futures market. Lunch break was cancelled for a continuous T session from 09:00 to 15:25 local time (GMT+8h) and the T+1 session now trades from 16:40 to 02:00 the next day. The initial margin was reduced and is now USD 500; the maintenance margin is USD 550. The tick size is 5 index points worth USD 5 each.
• In the HSCEI index futures market, trading hours are from 09:15 to 12:00 noon and from 13:00 to 16:15. Since April 8, 2013, there exists an additional T+1 session from 17:00 to 23:00. Trading of expiring contracts closes at 16:00 on the last trading day, which is the business day immediately preceding the last business day of the contract month.
• The correlation between the CSI300 and the A50 spot index is 0.97. The correlation between the CSI300 and the HSCEI is 0.92 and the one between the A50 and the HSCEI is 0.84. The extremely high correlation between the CSI300 and the A50 stems from the fact that the 50 stocks with the highest weight in the CSI300 index are those forming the A50 index.
• With an average of 400,025 contracts traded per day since their introduction, trading volume in the CSI300 futures market is much higher than in the A50 (15,439 contracts for the same period since August 2010) and the HSCEI futures market (43,245 contracts). Since the third quarter of 2012, the CSI300 futures’ trading volume rose to extremely high levels while the other two index futures remained at levels around their average. As noted above, A50 index futures were only lightly traded soon after their introduction in September 2006 (average daily turnover: 94 contracts) and not traded at all between October 2008 and late August 2010. Only the direct competition from CSI300 index futures induced reforms in the contract specifications and market set-up. Subsequently, the number of contracts traded increased to a daily average of 36,000. This is summarized in Figure 2. Figure 3 shows that open interest of CSI300 index futures rose steadily since their introduction, but has remained below that of A50 and HSCEI index futures. Open interest of A50 futures remains low until 2012 (average of 11,138 contracts per day up to the end of December 2011) and shows significant increases during late 2012 and early 2013 (daily average of 181,221). The relatively high trading volume of the CSI300 index futures compared to relatively low open interest could mirror an increased market activity of speculative investors. It may also reflect the large contract size, and therefore relatively high price, in comparison to the other two index futures. Figure 4 shows the ratio of trading volume to open interest for all three futures markets. The average ratio of 6.7 is extremely high for CSI300 futures, compared to averages of 0.3 and 0.5 for A50 and HSCEI futures respectively. An international comparison shows that more markets tend to fluctuate around the same ratios as the latter: for the sample period between April 2010 and June 2013, the average ratio for S&P index futures is 0.1, for EuroStoxx50 futures 0.5 and for Nikkei index futures 0.3. The extraordinarily high ratio of trading

CIGI PAPERS NO. 44 — SEPTEMBER 2014
18 • THE CENTRE FOR INTERNATIONAL GOvERNANCE INNOvATION
volume to open interest for the CSI300 futures may simply reflect the large contract size, possibly leading to a small number of existing contracts that are frequently traded. One other possible reason for the small open interest may be strong market regulation. If the regulator limits market supply of futures contracts, high demand is very likely to result in large trading volume.
PRINCIPAL COMPONENT ESTIMATION RESULTS
Tables 7, 8 and 9 show the regression results for three different principal component series and the possible impact of the CSI300 index futures introduction. The first series (Table 7) captures the principal components of the CSI300, the A50 and the HSCEI spot indices. Generally, we find empirical evidence in favour of the stabilizing hypothesis. Table 8 summarizes our findings for a series containing the principal components of the CSI300, the A50, the HSCEI and the MSCI index. The results are not unanimous. While the estimated coefficients of the GARCH I, GJR-GARCH I and EGARCH I models show no significant impact of the futures introduction, the GARCH II, GJR-GARCH II and EGARCH II models yield evidence in favour of the stabilizing hypothesis. Lastly, estimating our models with a principal component series that combines the three Asian indices, the Chinese B35 index, the EuroStoxx50 index and the S&P 500 index shows no significant impact of the futures introduction at all (Table 9). Therefore, we can summarize that this robustness check strongly confirms the results outlined above.

THE EFFECT OF INDEx FuTuRES TRADING ON vOLATILITy THREE MARKETS FOR CHINESE STOCKS
MARTIN T. BOHL, JEANNE DIESTELDORF AND PIERRE L. SIKLOS • 19
Figure 2: Trading Volume — Total Number of Contracts Traded per Day
Figure 3: Open interest — Total Number of Outstanding Contracts per Day
Figure 4: Trading Volume to Open Interest Ratio
Notes: All data is taken from Thomson Reuters Datastream.

CIGI PAPERS NO. 44 — SEPTEMBER 2014
20 • THE CENTRE FOR INTERNATIONAL GOvERNANCE INNOvATION
Table 7: Regression Results — Impact of CSI300 Futures Introduction on Principal Component Series Asia 3
Notes: *, **, *** denote statistical significance at the 10 percent, five percent and one percent level, respectively.
As the Principal Component series mirror the CSI300, the A50 and the HSCEI, all summands referring to spillover effects across these markets are excluded. In line with this, all summands including the MSCI index are eliminated from the models when the MSCI itself enters the Principal Component calculations.

THE EFFECT OF INDEx FuTuRES TRADING ON vOLATILITy THREE MARKETS FOR CHINESE STOCKS
MARTIN T. BOHL, JEANNE DIESTELDORF AND PIERRE L. SIKLOS • 21
Table 8: Regression Results — Impact of CSI300 Futures Introduction on Principal Component Series Asia 3 plus MSCI
Notes: *, **, *** denote statistical significance at the 10 percent, five percent and one percent level, respectively.
As the Principal Component series mirror the CSI300, the A50 and the HSCEI, all summands referring to spillover effects across these markets are excluded. In line with this, all summands including the MSCI index are eliminated from the models when the MSCI itself enters the Principal Component calculations.

CIGI PAPERS NO. 44 — SEPTEMBER 2014
22 • THE CENTRE FOR INTERNATIONAL GOvERNANCE INNOvATION
Table 9: Regression Results — Impact of CSI300 Futures Introduction on Principal Component Series 6
Notes: *, **, *** denote statistical significance at the 10 percent, five percent and one percent level, respectively.
As the Principal Component series mirror the CSI300, the A50 and the HSCEI, all summands referring to spillover effects across these markets are excluded. In line with this, all summands including the MSCI index are eliminated from the models when the MSCI itself enters the Principal Component calculations.

ABOUT CIGIThe Centre for International Governance Innovation is an independent, non-partisan think tank on international governance. Led by experienced practitioners and distinguished academics, CIGI supports research, forms networks, advances policy debate and generates ideas for multilateral governance improvements. Conducting an active agenda of research, events and publications, CIGI’s interdisciplinary work includes collaboration with policy, business and academic communities around the world.
CIGI’s research programs focus on four themes: the global economy; global security; the environment and energy; and global development.
CIGI was founded in 2001 by Jim Balsillie, then co-CEO of Research In Motion, and collaborates with and gratefully acknowledges support from a number of strategic partners, in particular the Government of Canada and the Government of Ontario.
Le CIGI a été fondé en 2001 par Jim Balsillie, qui était alors co-chef de la direction de Research In Motion. Il collabore avec de nombreux partenaires stratégiques et exprime sa reconnaissance du soutien reçu de ceux-ci, notamment de l’appui reçu du gouvernement du Canada et de celui du gouvernement de l’Ontario.
For more information, please visit www.cigionline.org.
CIGI MASTHEADManaging Editor, Publications Carol Bonnett
Publications Editor Jennifer Goyder
Publications Editor Vivian Moser
Publications Editor Patricia Holmes
Graphic Designer Melodie Wakefield
EXECUTIVE
President Rohinton Medhora
Vice President of Programs David Dewitt
Vice President of Public Affairs Fred Kuntz
Vice President of Finance Mark Menard
