nmr and core analysis technical datasheet · use reservoir fluids and reservoir wettability. pore...
TRANSCRIPT

NMR and Core Analysis Technical Datasheet
Technical background
Essentially, NMR signals are generated from liquids (oil or brine)
when the sample is placed in a magnetic field and then excited
with a brief pulse of radio frequency (RF) energy. Immediately
after the pulse, an NMR signal appears, which then dies away
with a characteristic relaxation time or decay rate known as
T2. The amplitude of the signal immediately after the pulse is
an indication of the total amount of fluid present, while the
T2 of the signal gives valuable information about the physical
environment of the liquids.
In pores filled with a single fluid, there are two main
components to the NMR signal – one coming from the fluid
far from the pore walls, and the other from fluid close to the
pore walls. Fluids far from the pore walls give NMR signals
similar to those from bulk fluids, with relatively long relaxation
times, while fluids close to the pore walls undergo a process of
adsorption and desorption with the pore walls which has the
effect of dramatically reducing their NMR relaxation times.
Introduction
Most people involved in core analysis know that NMR (Nuclear Magnetic Resonance) has been part of the available suite of well
logging measurements since the mid-90s, and that it is also used for routine laboratory core analysis – in part for calibration of NMR
well logs. But how many people really know how NMR works, and the full extent of what it can do for the core analyst? Most core
analysts know that NMR can determine porosity and pore size distributions easily and quickly, but what about fluid mobility such as
Bound Volume Irreducible (BVI), Free Fluid Index (FFI), Clay Bound Water (CBW), and effective porosity? Furthermore, what about
permeability, capillary pressure, and oil/water or gas/water contents? NMR can measure all these parameters quickly and accurately,
and current software makes it possible to do so without extensive knowledge of NMR.
This note is an attempt to introduce NMR and these capabilities to the non-NMR expert petrophysicist and core analyst.

Of course, in a real measurement it is not possible to take NMR
measurements from individual pores. The whole core must be
measured at once, so the resulting NMR signal is a composite of
all the NMR signals from the different pore sizes in the core.
NMR and Core Analysis
Fluids in large pores have long T
2 decay
times, like bulk fluids
Signals from fluids in smaller pores are modified by surface interactions
In large pores, the dominant effect is from the bulk fluids, so larger pores tend to have longer NMR relaxation times. In smaller pores,
the surface-to-volume ratio is much higher, so the fluids close to the pore walls tend to dominate the NMR signal, and smaller pores
show overall shorter NMR relaxation times. This process is illustrated in the figures below.
+
+

Technical Datasheet
Once we have the basic pore size distribution from the NMR
data, a number of useful petrophysical parameters can be
quickly and easily inferred. The integral of all the T2s (area under
the curve) gives us the total porosity when compared to the
signal from a known reference. If we centrifuge the core and
then repeat the NMR measurement, the integral of the second
data set is the irreducible fluid (Bound Volume Irreducible, or
BVI), while the difference between the two is the Free Fluid
Index (FFI).
The next step is to use a mathematical procedure known as an inversion to process the composite NMR signal and separate
it out into its component parts. In theory, there is one T2 component for each different pore size in the core. But in practice,
the analysis is usually restricted to a maximum of about 256 individual T2 components, which is more than adequate for most
practical purposes. The result of the inversion process is a T2 distribution showing the relative population of the individual T
2
decay times that make up the composite NMR signal from the core. Because long T2s come from large pores, and short T
2s from
small pores, this T2 distribution is in effect a model of the pore size distribution in the core.
Beyond the T2/pore size distribution – porosity, BVI,
FFI, CBW and permeability
Inversion
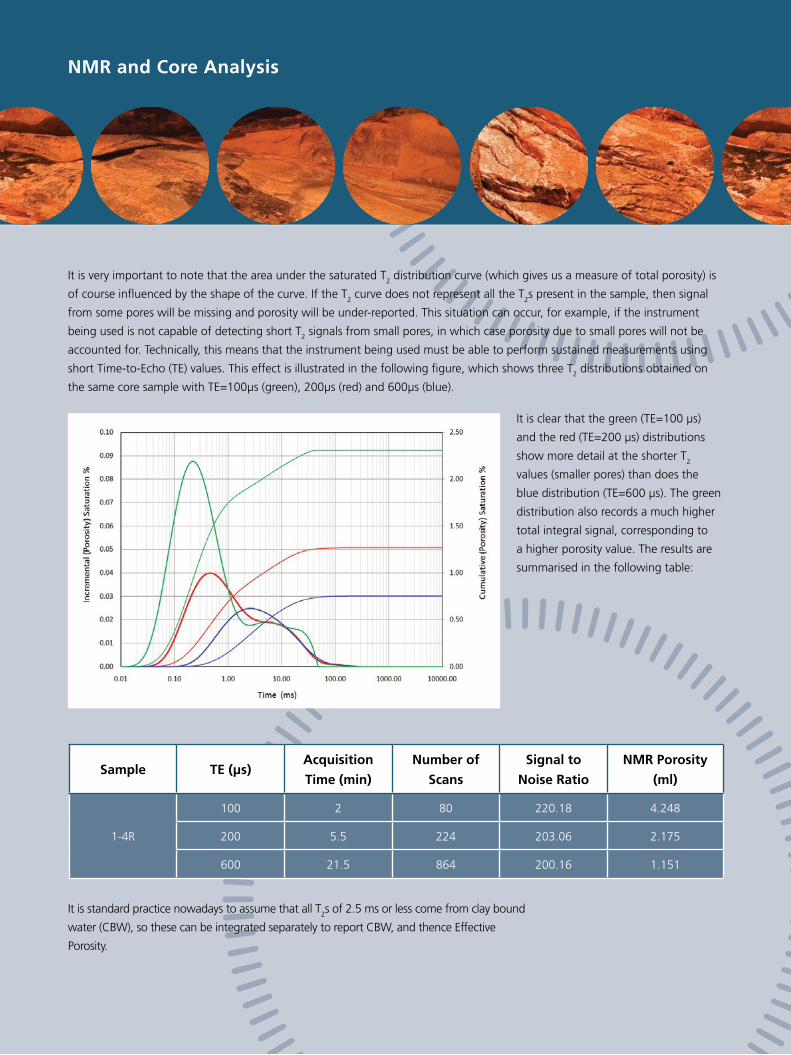
It is very important to note that the area under the saturated T2 distribution curve (which gives us a measure of total porosity) is
of course influenced by the shape of the curve. If the T2 curve does not represent all the T
2s present in the sample, then signal
from some pores will be missing and porosity will be under-reported. This situation can occur, for example, if the instrument
being used is not capable of detecting short T2 signals from small pores, in which case porosity due to small pores will not be
accounted for. Technically, this means that the instrument being used must be able to perform sustained measurements using
short Time-to-Echo (TE) values. This effect is illustrated in the following figure, which shows three T2 distributions obtained on
the same core sample with TE=100µs (green), 200µs (red) and 600µs (blue).
NMR and Core Analysis
It is clear that the green (TE=100 µs)
and the red (TE=200 µs) distributions
show more detail at the shorter T2
values (smaller pores) than does the
blue distribution (TE=600 µs). The green
distribution also records a much higher
total integral signal, corresponding to
a higher porosity value. The results are
summarised in the following table:
Sample TE (µs)Acquisition
Time (min)
Number of
Scans
Signal to
Noise Ratio
NMR Porosity
(ml)
1-4R
100 2 80 220.18 4.248
200 5.5 224 203.06 2.175
600 21.5 864 200.16 1.151
It is standard practice nowadays to assume that all T2s of 2.5 ms or less come from clay bound
water (CBW), so these can be integrated separately to report CBW, and thence Effective
Porosity.

Technical Datasheet
Finally, using either the Coates or the Schlumberger model,
permeability can be estimated from the relaxation data. All of
these calculations are carried out and reported automatically
by the LithoMetrix software incorporated in every GeoSpec
instrument – and the NMR measurement is non-destructive
and much faster than conventional methods of obtaining the
same parameters.
There’s more – Capillary Pressure, Pore Throat
Distribution, Wettability and Fluid Typing
By adding an accessory called Pulsed Field Gradients (pfg)
to the NMR instrument, it becomes possible to carry
out measurements dependent on the diffusion, flow, or
distribution of the fluids within the core sample. As with the
standard measurements discussed above, integrated GIT
Systems software controls the NMR instrument to deliver
pfg-based measurements without expert knowledge of the
NMR theory behind the measurements.
Capillary Pressure
One of the more exciting recent developments in the use
of NMR for core analysis is the ability to measure Capillary
Pressure. Measurements that took weeks or months by
special centrifuge or porous plate can now be done by NMR
in hours or days – and with many times more data points.
The patented GIT-CAP technique is available in Green
Imaging Technologies software offerings, which are available
exclusively on Oxford Instruments’ GeoSpec instrument range.
GIT-CAP uses a combination of conventional centrifuge and
a technique called 1-D Profiling, which is a simple version of
MRI (Magnetic Resonance Imaging) that records NMR signals
in one dimension only – along the axis of the core.
Here’s how it works. After saturating a core, a 1-D profile
measurement is acquired via the NMR instrument. The result
is usually a more-or-less uniform distribution of fluid along
the length of the core, as seen in the figure top right.
The core is then spun in a standard centrifuge, which has the
effect of shifting the fluid distribution towards the outer end of
the core, and another 1-D profile with 30 – 40 points is obtained.
This process is repeated at one more centrifuge spin speed,
then the data is analysed. Capillary pressure is calculated from
knowledge of the centrifuge spin speeds and the changes in the
saturation profile.
Saturation profiles before and after the first centifugation
The 1-D profile records fluid saturation at between 30 and 40 points along the length of the core

Several points are important to note
in this process:
1. Only two centrifuge speeds are required,
compared to eight in a traditional centrifuge
Pc measurement, so four times more
samples can be measured in a given time.
2. Each saturation profile yields 30 – 40 data
points along the core sample instead of
just one per spin speed in the traditional
method. So typically 10 times more data
points are collected in the NMR method.
3. The NMR method uses a standard
centrifuge without stroboscope or fluid
collection measurement, so the centrifuge
itself is likely to be less expensive.
Pore Throat Distribution
and Wettability
Having obtained a Pc curve, pore throat
distributions can now be calculated using
the Washburn equations. The imbibition
and secondary drainage curves generated
by the NMR Pc measurement also allow
USBM wettability to be predicted. Both
of these calculations are integrated into
the software, and follow as a natural
consequence of the NMR Pc data. A
further added advantage is that the NMR
measurement is non-destructive and can
use reservoir fluids and reservoir wettability.
Pore throat distribution obtained from Pc data
NMR and Core Analysis
Primary drainage, imbibition, and secondary drainage capillary pressure curve

Fluid Typing
It was mentioned earlier that GeoSpec instruments fitted with
Pulsed Field Gradients (pfg) are able to carry out measurements
dependent on the diffusion, flow, or distribution of the fluids within
the core sample. One application of this is for fluid typing.
It is possible that different fluids, such as heavy oils and partially bound
water, may exhibit similar T2 values, which makes it difficult to identify
which fluid is which using a standard T2 distribution. However, even if
they have similar T2 values they are unlikely also to have similar diffusion
characteristics, so a measurement that collects both T2 and diffusion data
should in principle be able to separate the fluid types. GIT Systems software,
together with a pfg accessory on a GeoSpec2+ NMR instrument, enables such
measurements to be done. The result is a two-dimensional data map illustrating
the relative proportions of the different fluid types in the sample.
Technical Datasheet
Conclusions
NMR is now a well established core analysis
tool, capable of making a wide range of core
measurements, from pore size distributions to
capillary pressure, on a single instrument. The
partnership between Oxford Instruments and
Green Imaging Technologies allows an integrated
hardware and software solution to be offered
to core analysts so that this wide range of
applications can be covered by technicians with no
specialised knowledge of NMR technology.
Diffusion T2 map

GeoSpec – The new approach to core analysis using NMR
This publication is the copyright of Oxford Instruments plc and provides outline information only, which (unless agreed by the company in writing) may not be used, applied or reproduced for any purpose or form part of any order or contract or regarded as the representation relating to the products or services concerned. Oxford Instruments’ policy is one of continued improvement. The company reserves the right to alter, without notice the specification, design or conditions of supply of any product or service. Oxford Instruments acknowledges all trademarks and registrations. © Oxford Instruments plc, 2015. All rights reserved. Ref: CA-TN-07-15
Oxford Instruments Industrial Analysis
For more information: [email protected]
www.oxford-instruments.com
UK
Tubney Woods, Abingdon, Oxfordshire, OX13 5QX, UK
Tel: +44 (0) 1865 393 200 Fax: +44 (0) 1865 393 333
USA
300 Baker Avenue, Suite 150, Concord, MA, 01742, USA
Tel: +1 978 369 9933 Fax: +1 978 369 8287
China
Floor 1, Building 60, No.461, Hongcao Road, Shanghai,
200233, China
Tel: +86 21 6073 2925 Fax: +86 21 6360 8535
Green Imaging Technologies
For more information: [email protected]
www.greenimaging.com
Canada
520 Brookside Drive, Suite B, Fredericton, NB, E3A 8V2,
Canada
Toll Free: +1 888 944 8462
Tel: +1 506 458 9992 Fax: +1 506 458 9615
Oxford Instruments Magnetic Resonance
For more than 20 years, Oxford Instruments has been the
industry standard for NMR instrumentation for core analysis.
With over a hundred installations, Oxford Instruments truly
understands the needs of core analysts, whether they be in oil
companies, oilfield service companies or academia.
Innovation has been the driving force behind Oxford
Instruments’ growth and success ever since the business spun
out from the University of Oxford over 50 years ago. It is now
a global company with over 1,300 staff worldwide and a
listing on the London Stock Exchange (OXIG).
Green Imaging Technologies
Green Imaging Technologies is committed to providing
innovative solutions for lab-based analysis of rock core via
Nuclear Magnetic Resonance (NMR). GIT’s products and
services offer fast, accurate, non-destructive analysis of rock
core samples used by the oil and gas industry in exploration
and reservoir characterisation.
Beginning with a patented capillary pressure measurement
technique in 2005, GIT has the goal of making NMR core
analysis more accessible and expanding the analysis that can
be done with NMR. GIT’s product offerings have evolved and
expanded to include a full suite of routine and advanced core
analysis tools. A culture of continual innovation has driven the
company to be the industry leader in NMR core analysis.
3374