nivea visage expert lift: innovative products for women
TRANSCRIPT

Interim ReportJanuary – September 2008
NIVEA VISAGE Expert Lift: Innovative Products for Women over 50.
2 Beiersdorf Interim Report January – September 2008
03 Business Developments – Overview
04 Segment Overview
05 Top Topics
06 The Beiersdorf Share
Interim Management Report – Group
07 Results of Operations – Group
08 Results of Operations – Business Segments
12 Balance Sheet Structure – Group
13 Financial Position – Group, Employees
14 Other Disclosures, Opportunities and Risks
15 Outlook for 2008
Interim Consolidated Financial Statements
16 Income Statement, Balance Sheet
17 Cash Flow Statement
18 Statement of Changes in Equity, Statement of Recognized Income and Expense
19 Selected Explanatory Notes
Contents
About the cover:The majority of today’s women between the ages of 50 and 60 are active and feel signifi cantly younger than they are. Therefore, it’s no wonder they don’t want to look older and like to use innovative, effective anti-aging products. NIVEA VISAGE’s new ”Expert Lift“ face care range is tailored to the needs of women’s skin over the age of 50, supplementing the extensive product range in the anti-age segment. With regular use, the intensive moisturizing formula tightens facial contours from within and helps give skin a noticeably fi rmer and smoother appearance. The total care system consists of a day cream, night cream, and eye cream, as well as a beauty tonic.
Beiersdorf Interim Report January – September 2008 3
Business Developments – Overview
Dynamic Sales Growth Continues
Sales growth of 11.8% (adjusted for currency translation effects)
EBIT margin* at 12.1%
Profit after tax* €394 million
Outlook for Fiscal Year 2008
Sales growth (organic) above 8%
EBIT margin* (without acquisitions) up on previous year
Beiersdorf at a Glance
Jan. 1–Sept. 30, Jan. 1–Sept. 30,
in € million (unless otherwise stated) 2007 2008
Sales 4,167 4,547
Change in % (adjusted for currency translation effects) 9.4 11.8
Change in % (organic) 9.4 8.5
Change in % (nominal) 8.1 9.1
Consumer 3,531 3,892
tesa 636 655
Operating result (EBIT) 467 561
Operating result (EBIT, excluding special factors)* 531 548
Profit after tax 338 402
Profit after tax (excluding special factors)* 380 394
Return on sales after tax in % 8.1 8.8
Return on sales after tax in % (excluding special factors)* 9.1 8.7
Earnings per share in € 1.49 1.76
Earnings per share in € (excluding special factors)* 1.68 1.72
Gross cash flow 361 431
Capital expenditure (incl. financial assets) 74 111
Research and development expenses 91 109
Employees (as of September 30) 17,285 21,732
Business Developments – Overview
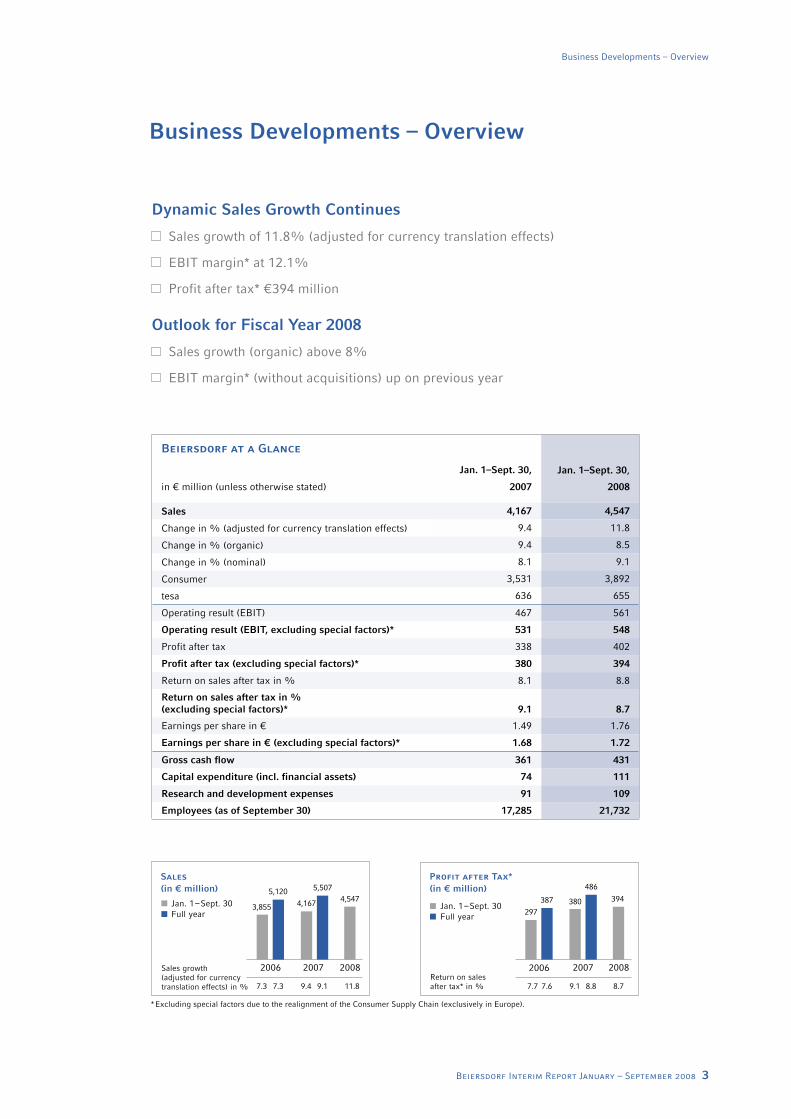
Sales growth (adjusted for currency translation effects) in %
2006 2007 2008
7.3 7.3 9.4 9.1 11.8
Sales(in € million)
Return on salesafter tax* in %
2006 2007 2008
7.7 7.6 9.1 8.8 8.7
Profi t after Tax*(in € million)
Jan. 1 – Sept. 30 Full year
* Excluding special factors due to the realignment of the Consumer Supply Chain (exclusively in Europe).
Jan. 1 – Sept. 30 Full year
3,855
5,120
4,167
5,5074,547
297380
486
394387
4 Beiersdorf Interim Report January – September 2008
Segment Overview
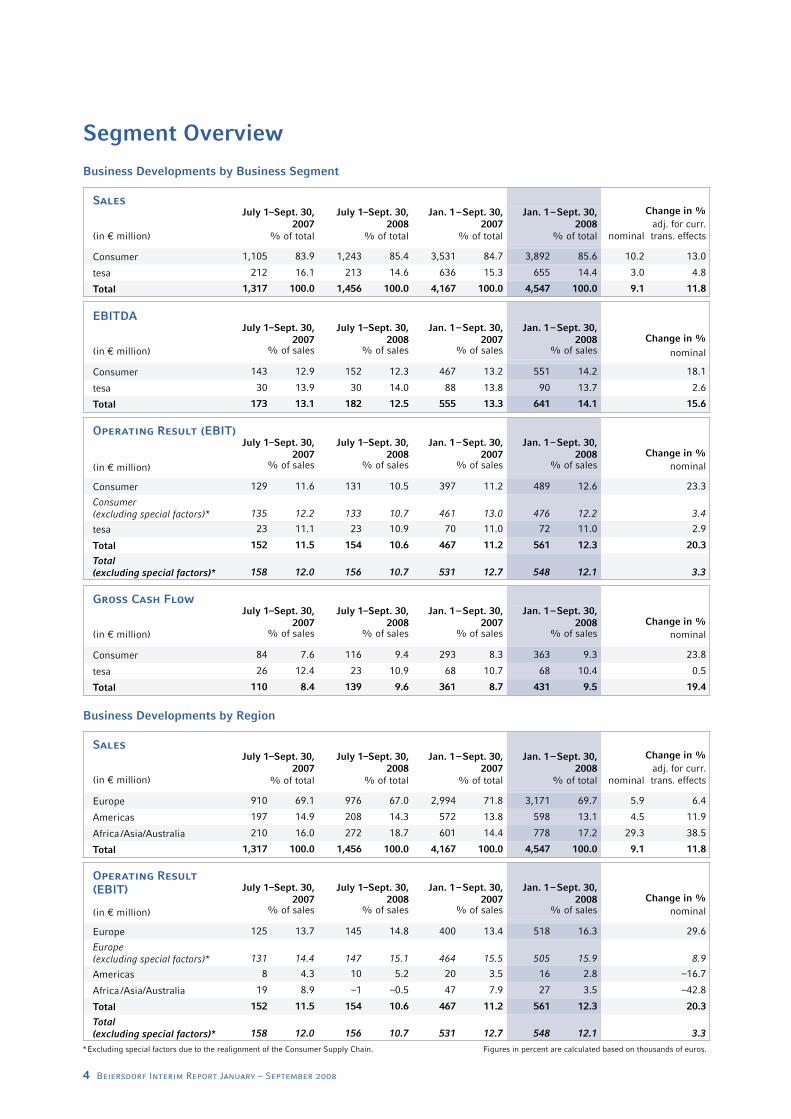
Sales
(in € million)
July 1–Sept. 30,2007
% of total
July 1–Sept. 30,2008
% of total
Jan. 1 – Sept. 30,2007
% of total
Jan. 1 – Sept. 30,2008
% of total
Change in %
nominaladj. for curr. trans. effects
Consumer 1,105 83.9 1,243 85.4 3,531 84.7 3,892 85.6 10.2 13.0
tesa 212 16.1 213 14.6 636 15.3 655 14.4 3.0 4.8
Total 1,317 100.0 1,456 100.0 4,167 100.0 4,547 100.0 9.1 11.8
EBITDA
(in € million)
July 1–Sept. 30,2007
% of sales
July 1–Sept. 30,2008
% of sales
Jan. 1 – Sept. 30,2007
% of sales
Jan. 1 – Sept. 30,2008
% of salesChange in %
nominal
Consumer 143 12.9 152 12.3 467 13.2 551 14.2 18.1
tesa 30 13.9 30 14.0 88 13.8 90 13.7 2.6
Total 173 13.1 182 12.5 555 13.3 641 14.1 15.6
Operating Result (EBIT)
(in € million)
July 1–Sept. 30,2007
% of sales
July 1–Sept. 30,2008
% of sales
Jan. 1 – Sept. 30,2007
% of sales
Jan. 1 – Sept. 30,2008
% of salesChange in %
nominal
Consumer 129 11.6 131 10.5 397 11.2 489 12.6 23.3
Consumer (excluding special factors)* 135 12.2 133 10.7 461 13.0 476 12.2 3.4
tesa 23 11.1 23 10.9 70 11.0 72 11.0 2.9
Total 152 11.5 154 10.6 467 11.2 561 12.3 20.3
Total (excluding special factors)* 158 12.0 156 10.7 531 12.7 548 12.1 3.3
Gross Cash Flow
(in € million)
July 1–Sept. 30,2007
% of sales
July 1–Sept. 30,2008
% of sales
Jan. 1 – Sept. 30,2007
% of sales
Jan. 1 – Sept. 30,2008
% of salesChange in %
nominal
Consumer 84 7.6 116 9.4 293 8.3 363 9.3 23.8
tesa 26 12.4 23 10.9 68 10.7 68 10.4 0.5
Total 110 8.4 139 9.6 361 8.7 431 9.5 19.4
Business Developments by Business Segment
Sales
(in € million)
July 1–Sept. 30,2007
% of total
July 1–Sept. 30,2008
% of total
Jan. 1 – Sept. 30,2007
% of total
Jan. 1 – Sept. 30,2008
% of total
Change in %
nominaladj. for curr. trans. effects
Europe 910 69.1 976 67.0 2,994 71.8 3,171 69.7 5.9 6.4
Americas 197 14.9 208 14.3 572 13.8 598 13.1 4.5 11.9
Africa /Asia/Australia 210 16.0 272 18.7 601 14.4 778 17.2 29.3 38.5
Total 1,317 100.0 1,456 100.0 4,167 100.0 4,547 100.0 9.1 11.8
Operating Result(EBIT)
(in € million)
July 1–Sept. 30,2007
% of sales
July 1–Sept. 30,2008
% of sales
Jan. 1 – Sept. 30,2007
% of sales
Jan. 1 – Sept. 30,2008
% of salesChange in %
nominal
Europe 125 13.7 145 14.8 400 13.4 518 16.3 29.6
Europe (excluding special factors)* 131 14.4 147 15.1 464 15.5 505 15.9 8.9
Americas 8 4.3 10 5.2 20 3.5 16 2.8 –16.7
Africa /Asia/Australia 19 8.9 –1 –0.5 47 7.9 27 3.5 –42.8
Total 152 11.5 154 10.6 467 11.2 561 12.3 20.3
Total (excluding special factors)* 158 12.0 156 10.7 531 12.7 548 12.1 3.3
* Excluding special factors due to the realignment of the Consumer Supply Chain. Figures in percent are calculated based on thousands of euros.
Business Developments by Region
Beiersdorf Interim Report January – September 2008 5
Segment OverviewTop Topics
Top Topics
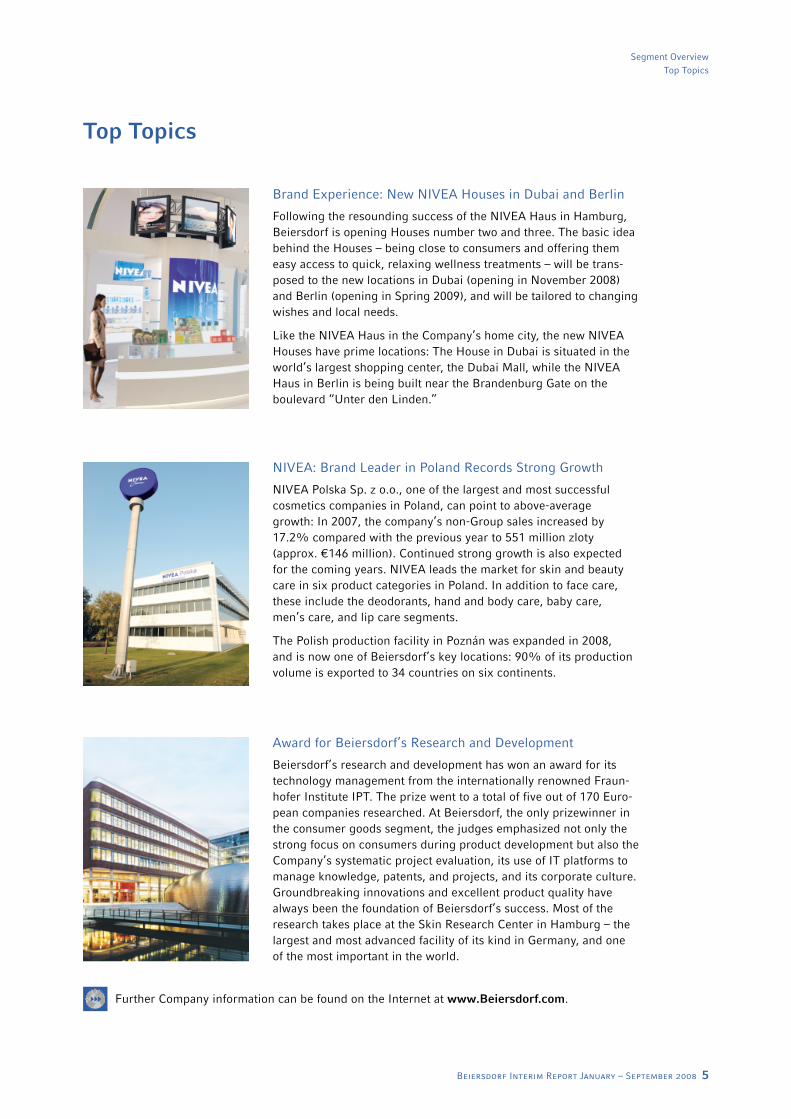
Brand Experience: New NIVEA Houses in Dubai and Berlin
Following the resounding success of the NIVEA Haus in Hamburg, Beiersdorf is opening Houses number two and three. The basic idea behind the Houses – being close to consumers and offering them easy access to quick, relaxing wellness treatments – will be trans-posed to the new locations in Dubai (opening in November 2008) and Berlin (opening in Spring 2009), and will be tailored to changing wishes and local needs.
Like the NIVEA Haus in the Company’s home city, the new NIVEA Houses have prime locations: The House in Dubai is situated in the world’s largest shopping center, the Dubai Mall, while the NIVEA Haus in Berlin is being built near the Brandenburg Gate on the boulevard “Unter den Linden.”
NIVEA: Brand Leader in Poland Records Strong Growth
NIVEA Polska Sp. z o.o., one of the largest and most successful cosmetics companies in Poland, can point to above-average growth: In 2007, the company’s non-Group sales increased by 17.2% compared with the previous year to 551 million zloty (approx. €146 million). Continued strong growth is also expected for the coming years. NIVEA leads the market for skin and beauty care in six product categories in Poland. In addition to face care, these include the deodorants, hand and body care, baby care, men’s care, and lip care segments.
The Polish production facility in Poznán was expanded in 2008, and is now one of Beiersdorf’s key locations: 90% of its production volume is exported to 34 countries on six continents.
Award for Beiersdorf’s Research and Development
Beiersdorf’s research and development has won an award for its technology management from the internationally renowned Fraun-hofer Institute IPT. The prize went to a total of five out of 170 Euro-pean companies researched. At Beiersdorf, the only prizewinner in the consumer goods segment, the judges emphasized not only the strong focus on consumers during product development but also the Company’s systematic project evaluation, its use of IT platforms to manage knowledge, patents, and projects, and its corporate culture. Groundbreaking innovations and excellent product quality have always been the foundation of Beiersdorf’s success. Most of the research takes place at the Skin Research Center in Hamburg – the largest and most advanced facility of its kind in Germany, and one of the most important in the world.
Further Company information can be found on the Internet at www.Beiersdorf.com.
6 Beiersdorf Interim Report January – September 2008
The Beiersdorf Share
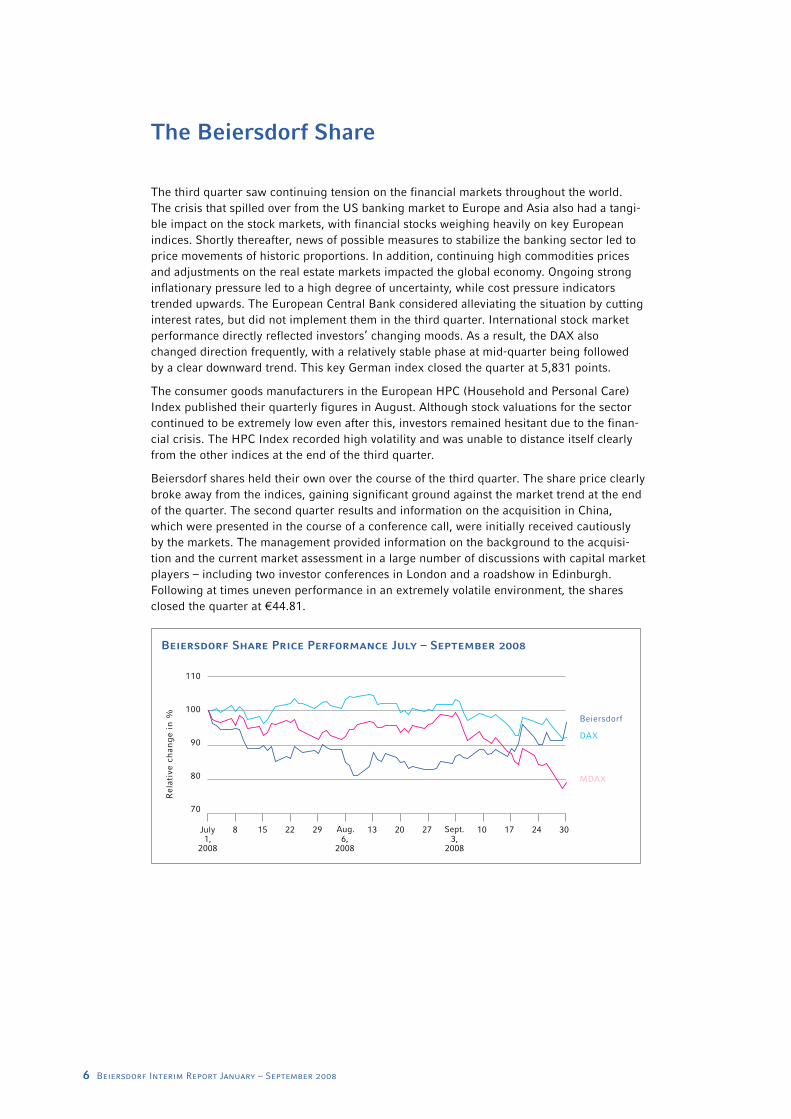
The third quarter saw continuing tension on the financial markets throughout the world. The crisis that spilled over from the US banking market to Europe and Asia also had a tangi-ble impact on the stock markets, with financial stocks weighing heavily on key European indices. Shortly thereafter, news of possible measures to stabilize the banking sector led to price movements of historic proportions. In addition, continuing high commodities prices and adjustments on the real estate markets impacted the global economy. Ongoing strong inflationary pressure led to a high degree of uncertainty, while cost pressure indicators trended upwards. The European Central Bank considered alleviating the situation by cutting interest rates, but did not implement them in the third quarter. International stock market performance directly reflected investors’ changing moods. As a result, the DAX also changed direction frequently, with a relatively stable phase at mid-quarter being followed by a clear downward trend. This key German index closed the quarter at 5,831 points.
The consumer goods manufacturers in the European HPC (Household and Personal Care) Index published their quarterly figures in August. Although stock valuations for the sector continued to be extremely low even after this, investors remained hesitant due to the finan-cial crisis. The HPC Index recorded high volatility and was unable to distance itself clearly from the other indices at the end of the third quarter.
Beiersdorf shares held their own over the course of the third quarter. The share price clearly broke away from the indices, gaining significant ground against the market trend at the end of the quarter. The second quarter results and information on the acquisition in China, which were presented in the course of a conference call, were initially received cautiously by the markets. The management provided information on the background to the acquisi-tion and the current market assessment in a large number of discussions with capital market players – including two investor conferences in London and a roadshow in Edinburgh. Following at times uneven performance in an extremely volatile environment, the shares closed the quarter at €44.81.
Beiersdorf Share Price Performance July – September 2008
110
100
90
80
70
Beiersdorf
MDAX
DAX
Rel
ativ
e ch
ang
e in
%
Aug. Sept.July1,
2008
8 15 22 296,
2008
13 20 273,
2008
10 17 24 30
Beiersdorf Interim Report January – September 2008 7
Results of Operations – Group
Sales growth of 11.8%
EBIT margin (excluding special factors) at 12.1%
Profit after tax (excluding special factors) €394 million
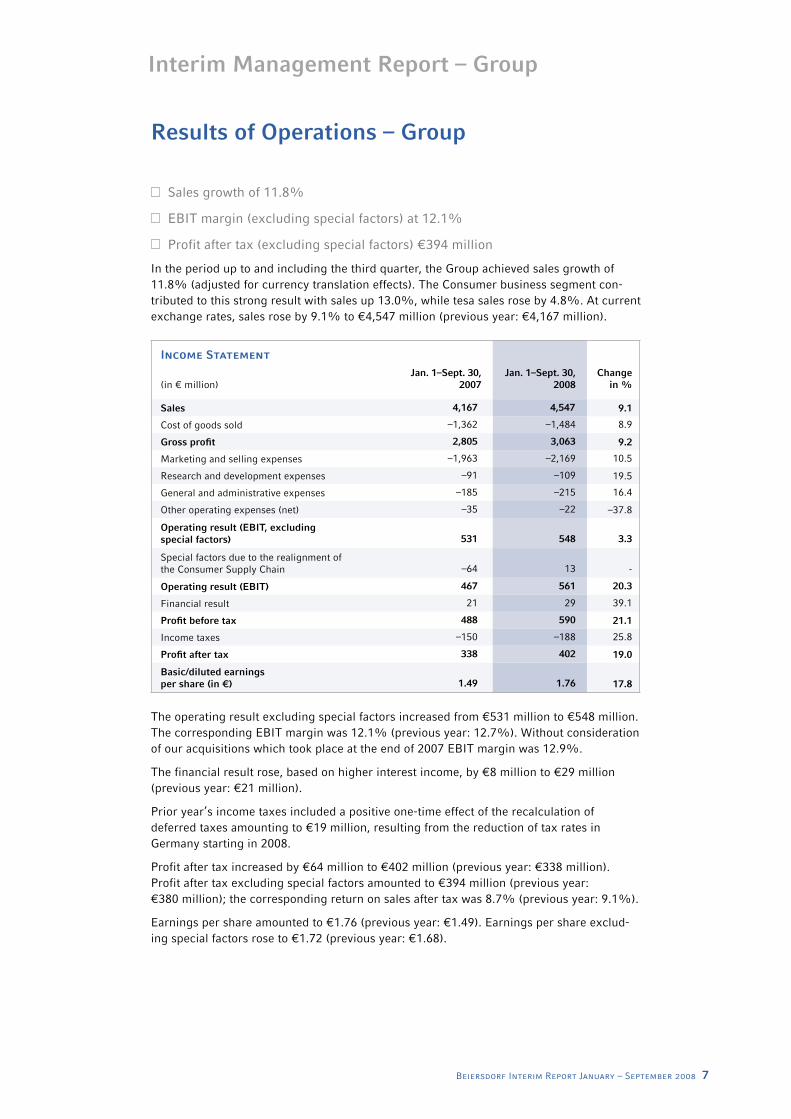
In the period up to and including the third quarter, the Group achieved sales growth of 11.8% (adjusted for currency translation effects). The Consumer business segment con-tributed to this strong result with sales up 13.0%, while tesa sales rose by 4.8%. At current exchange rates, sales rose by 9.1% to €4,547 million (previous year: €4,167 million).
Income Statement
(in € million)Jan. 1–Sept. 30,
2007Jan. 1–Sept. 30,
2008Change in %
Sales 4,167 4,547 9.1
Cost of goods sold –1,362 –1,484 8.9
Gross profi t 2,805 3,063 9.2
Marketing and selling expenses –1,963 –2,169 10.5
Research and development expenses –91 –109 19.5
General and administrative expenses –185 –215 16.4
Other operating expenses (net) –35 –22 –37.8
Operating result (EBIT, excluding special factors) 531 548 3.3
Special factors due to the realignment of the Consumer Supply Chain –64 13 -
Operating result (EBIT) 467 561 20.3
Financial result 21 29 39.1
Profi t before tax 488 590 21.1
Income taxes –150 –188 25.8
Profi t after tax 338 402 19.0
Basic/diluted earnings per share (in €) 1.49 1.76 17.8
The operating result excluding special factors increased from €531 million to €548 million. The corresponding EBIT margin was 12.1% (previous year: 12.7%). Without consideration of our acquisitions which took place at the end of 2007 EBIT margin was 12.9%.
The financial result rose, based on higher interest income, by €8 million to €29 million (previous year: €21 million).
Prior year’s income taxes included a positive one-time effect of the recalculation of deferred taxes amounting to €19 million, resulting from the reduction of tax rates in Germany starting in 2008.
Profit after tax increased by €64 million to €402 million (previous year: €338 million). Profit after tax excluding special factors amounted to €394 million (previous year: €380 million); the corresponding return on sales after tax was 8.7% (previous year: 9.1%).
Earnings per share amounted to €1.76 (previous year: €1.49). Earnings per share exclud-ing special factors rose to €1.72 (previous year: €1.68).
Interim Management Report – Group
8 Beiersdorf Interim Report January – September 2008
Results of Operations – Business Segments
Consumer
Consumer business segment up 13.0% on previous year
Consumer EBIT margin (excluding special factors) at 12.2%
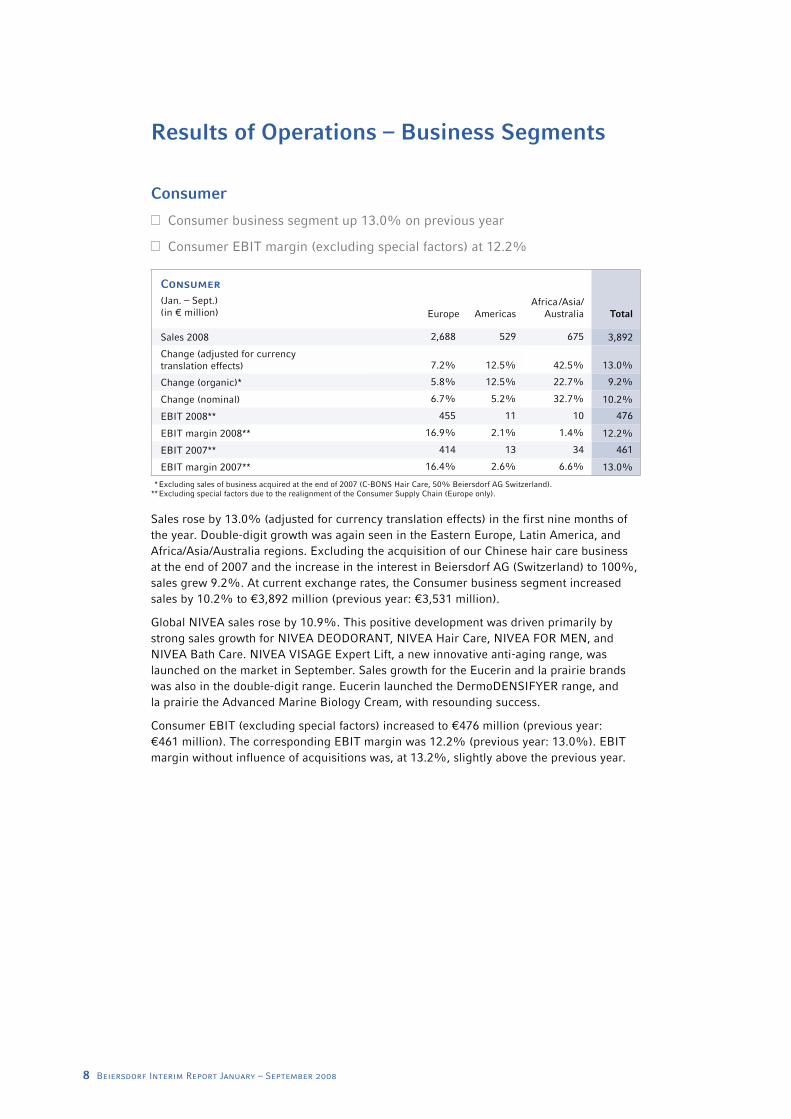
Consumer(Jan. – Sept.)(in € million) Europe Americas
Africa /Asia/Australia Total
Sales 2008 2,688 529 675 3,892
Change (adjusted for currency translation effects) 7.2% 12.5% 42.5% 13.0%
Change (organic)* 5.8% 12.5% 22.7% 9.2%
Change (nominal) 6.7% 5.2% 32.7% 10.2%
EBIT 2008** 455 11 10 476
EBIT margin 2008** 16.9% 2.1% 1.4% 12.2%
EBIT 2007** 414 13 34 461
EBIT margin 2007** 16.4% 2.6% 6.6% 13.0%
* Excluding sales of business acquired at the end of 2007 (C-BONS Hair Care, 50% Beiersdorf AG Switzerland).** Excluding special factors due to the realignment of the Consumer Supply Chain (Europe only).
Sales rose by 13.0% (adjusted for currency translation effects) in the first nine months of the year. Double-digit growth was again seen in the Eastern Europe, Latin America, and Africa/Asia/Australia regions. Excluding the acquisition of our Chinese hair care business at the end of 2007 and the increase in the interest in Beiersdorf AG (Switzerland) to 100%, sales grew 9.2%. At current exchange rates, the Consumer business segment increased sales by 10.2% to €3,892 million (previous year: €3,531 million).
Global NIVEA sales rose by 10.9%. This positive development was driven primarily by strong sales growth for NIVEA DEODORANT, NIVEA Hair Care, NIVEA FOR MEN, and NIVEA Bath Care. NIVEA VISAGE Expert Lift, a new innovative anti-aging range, was launched on the market in September. Sales growth for the Eucerin and la prairie brands was also in the double-digit range. Eucerin launched the DermoDENSIFYER range, and la prairie the Advanced Marine Biology Cream, with resounding success.
Consumer EBIT (excluding special factors) increased to €476 million (previous year: €461 million). The corresponding EBIT margin was 12.2% (previous year: 13.0%). EBIT margin without influence of acquisitions was, at 13.2%, slightly above the previous year.
Beiersdorf Interim Report January – September 2008 9
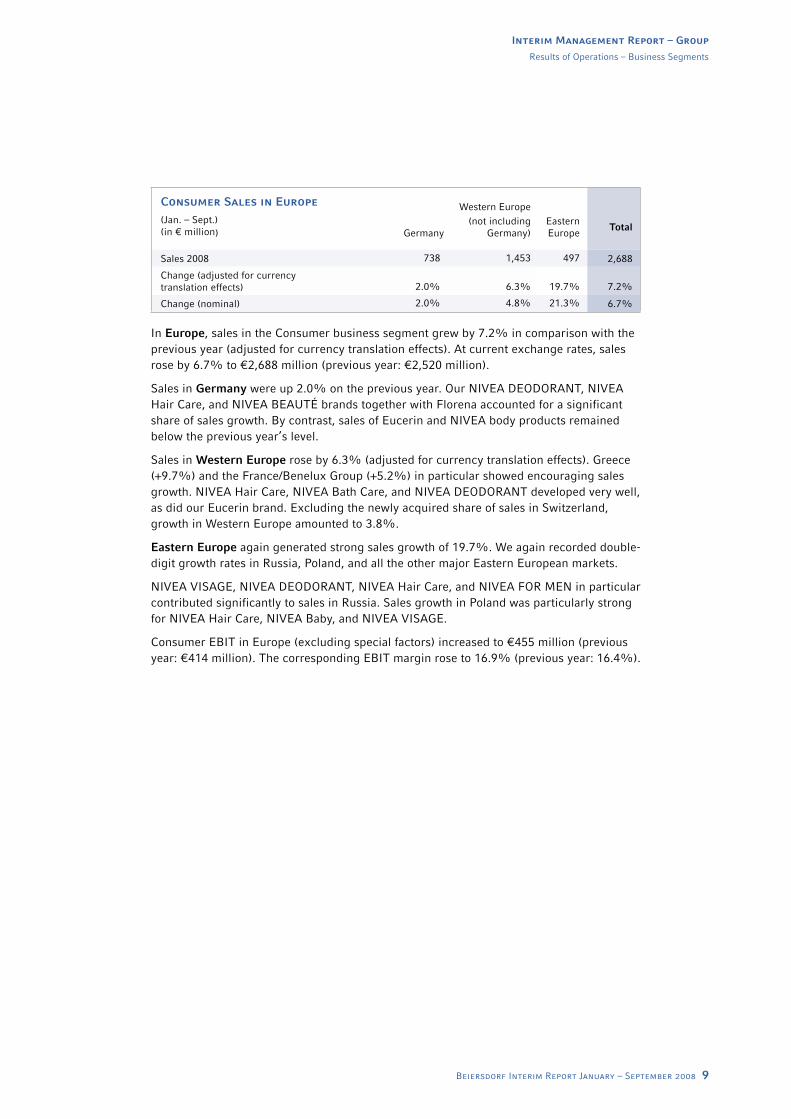
Consumer Sales in Europe Western Europe(Jan. – Sept.)(in € million) Germany
(not includingGermany)
EasternEurope
Total
Sales 2008 738 1,453 497 2,688
Change (adjusted for currency translation effects) 2.0% 6.3% 19.7% 7.2%
Change (nominal) 2.0% 4.8% 21.3% 6.7%
In Europe, sales in the Consumer business segment grew by 7.2% in comparison with the previous year (adjusted for currency translation effects). At current exchange rates, sales rose by 6.7% to €2,688 million (previous year: €2,520 million).
Sales in Germany were up 2.0% on the previous year. Our NIVEA DEODORANT, NIVEA Hair Care, and NIVEA BEAUTÉ brands together with Florena accounted for a significant share of sales growth. By contrast, sales of Eucerin and NIVEA body products remained below the previous year’s level.
Sales in Western Europe rose by 6.3% (adjusted for currency translation effects). Greece (+9.7%) and the France/Benelux Group (+5.2%) in particular showed encouraging sales growth. NIVEA Hair Care, NIVEA Bath Care, and NIVEA DEODORANT developed very well, as did our Eucerin brand. Excluding the newly acquired share of sales in Switzerland, growth in Western Europe amounted to 3.8%.
Eastern Europe again generated strong sales growth of 19.7%. We again recorded double-digit growth rates in Russia, Poland, and all the other major Eastern European markets.
NIVEA VISAGE, NIVEA DEODORANT, NIVEA Hair Care, and NIVEA FOR MEN in particular contributed significantly to sales in Russia. Sales growth in Poland was particularly strong for NIVEA Hair Care, NIVEA Baby, and NIVEA VISAGE.
Consumer EBIT in Europe (excluding special factors) increased to €455 million (previous year: €414 million). The corresponding EBIT margin rose to 16.9% (previous year: 16.4%).
Results of Operations – Business Segments
Interim Management Report – Group
10 Beiersdorf Interim Report January – September 2008
Consumer Sales in the Americas(Jan. – Sept.)(in € million) North America Latin America Total
Sales 2008 221 308 529
Change (adjusted for currency translation effects) 2.9% 21.1% 12.5%
Change (nominal) –8.1% 17.3% 5.2%
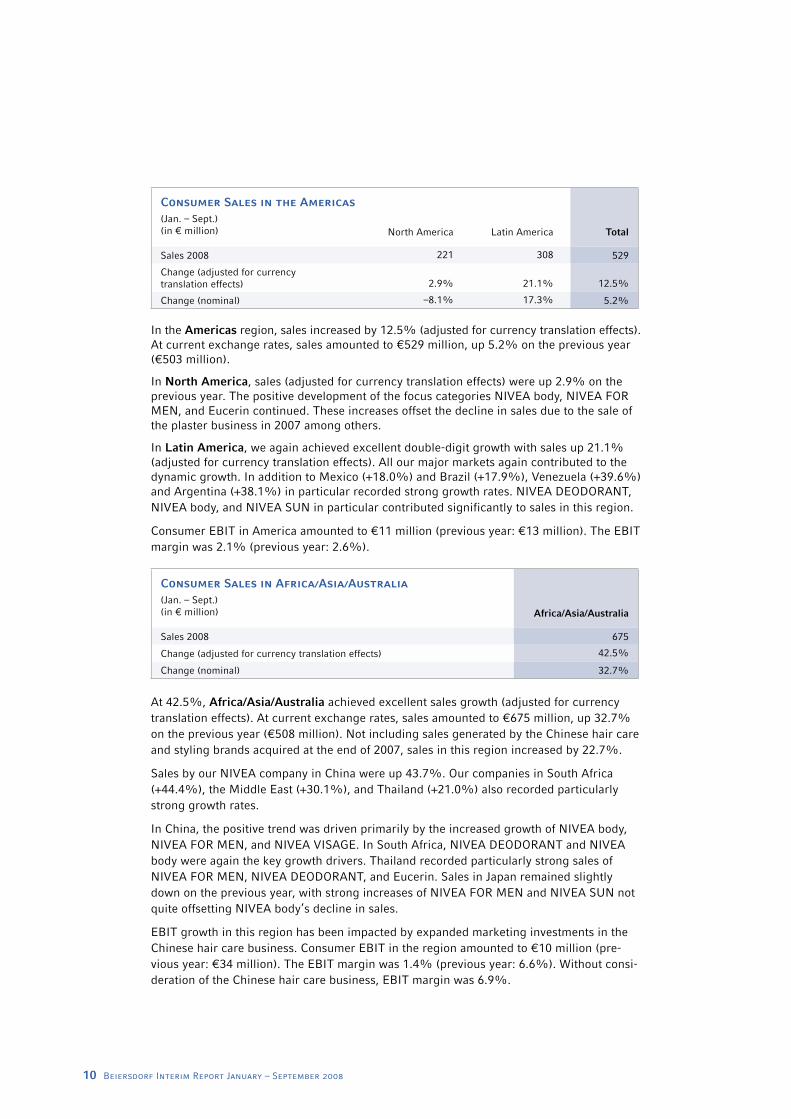
In the Americas region, sales increased by 12.5% (adjusted for currency translation effects). At current exchange rates, sales amounted to €529 million, up 5.2% on the previous year (€503 million).
In North America, sales (adjusted for currency translation effects) were up 2.9% on the previous year. The positive development of the focus categories NIVEA body, NIVEA FOR MEN, and Eucerin continued. These increases offset the decline in sales due to the sale of the plaster business in 2007 among others.
In Latin America, we again achieved excellent double-digit growth with sales up 21.1% (adjusted for currency translation effects). All our major markets again contributed to the dynamic growth. In addition to Mexico (+18.0%) and Brazil (+17.9%), Venezuela (+39.6%) and Argentina (+38.1%) in particular recorded strong growth rates. NIVEA DEODORANT, NIVEA body, and NIVEA SUN in particular contributed significantly to sales in this region.
Consumer EBIT in America amounted to €11 million (previous year: €13 million). The EBIT margin was 2.1% (previous year: 2.6%).
Consumer Sales in Africa/Asia/Australia(Jan. – Sept.)(in € million) Africa/Asia/Australia
Sales 2008 675
Change (adjusted for currency translation effects) 42.5%
Change (nominal) 32.7%
At 42.5%, Africa/Asia/Australia achieved excellent sales growth (adjusted for currency translation effects). At current exchange rates, sales amounted to €675 million, up 32.7% on the previous year (€508 million). Not including sales generated by the Chinese hair care and styling brands acquired at the end of 2007, sales in this region increased by 22.7%.
Sales by our NIVEA company in China were up 43.7%. Our companies in South Africa (+44.4%), the Middle East (+30.1%), and Thailand (+21.0%) also recorded particularly strong growth rates.
In China, the positive trend was driven primarily by the increased growth of NIVEA body, NIVEA FOR MEN, and NIVEA VISAGE. In South Africa, NIVEA DEODORANT and NIVEA body were again the key growth drivers. Thailand recorded particularly strong sales of NIVEA FOR MEN, NIVEA DEODORANT, and Eucerin. Sales in Japan remained slightly down on the previous year, with strong increases of NIVEA FOR MEN and NIVEA SUN not quite offsetting NIVEA body’s decline in sales.
EBIT growth in this region has been impacted by expanded marketing investments in the Chinese hair care business. Consumer EBIT in the region amounted to €10 million (pre-vious year: €34 million). The EBIT margin was 1.4% (previous year: 6.6%). Without consi-deration of the Chinese hair care business, EBIT margin was 6.9%.
Beiersdorf Interim Report January – September 2008 11
Results of Operations – Business Segments
Interim Management Report – Group
tesa
tesa business segment grows by 4.8%
tesa EBIT margin at 11.0%
tesa(Jan. – Sept.)(in € million) Europe Americas
Africa/Asia/Australia Total
Sales 2008 483 69 103 655
Change (adjusted for currency translation effects) 1.9% 8.2% 17.0% 4.8%
Change (organic) 1.9% 8.2% 17.0% 4.8%
Change (nominal) 2.0% –0.2% 10.6% 2.9%
EBIT 2008 50 5 17 72
EBIT margin 2008 10.2% 8.1% 16.9% 11.0%
EBIT 2007 50 6 14 70
EBIT margin 2007 10.5% 9.5% 14.8% 11.0%
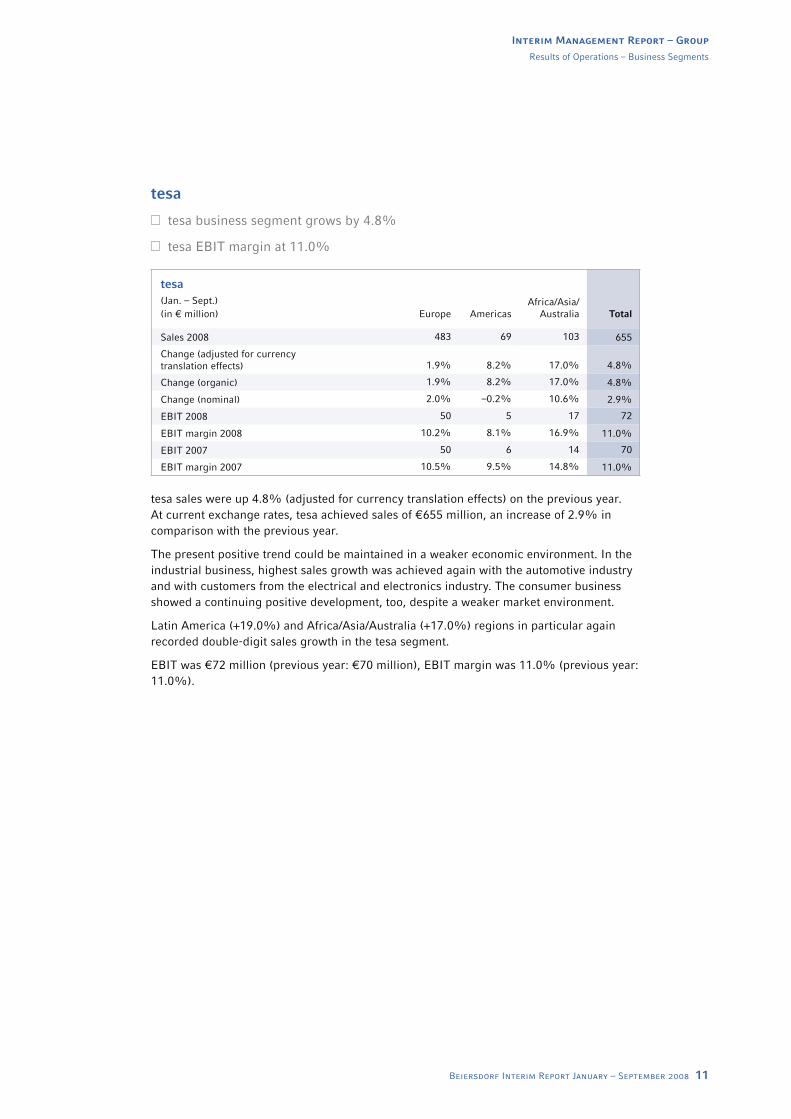
tesa sales were up 4.8% (adjusted for currency translation effects) on the previous year. At current exchange rates, tesa achieved sales of €655 million, an increase of 2.9% in comparison with the previous year.
The present positive trend could be maintained in a weaker economic environment. In the industrial business, highest sales growth was achieved again with the automotive industry and with customers from the electrical and electronics industry. The consumer business showed a continuing positive development, too, despite a weaker market environment.
Latin America (+19.0%) and Africa/Asia/Australia (+17.0%) regions in particular again recorded double-digit sales growth in the tesa segment.
EBIT was €72 million (previous year: €70 million), EBIT margin was 11.0% (previous year: 11.0%).
12 Beiersdorf Interim Report January – September 2008
Balance Sheet Structure – Group
Balance Sheet
Assets (in € million) Dec. 31, 2007 Sept. 30, 2007 Sept. 30, 2008
Non-current assets 1,081 750 1,135
Inventories 598 590 691
Other current assets 1,088 1,071 1,293
Cash and cash equivalents 1,117 1,369 1,191
3,884 3,780 4,310
Equity and liabilities (in € million) Dec. 31, 2007 Sept. 30, 2007 Sept. 30, 2008
Equity 2,070 1,972 2,306
Non-current liabilities 561 520 556
Current liabilities 1,253 1,288 1,448
3,884 3,780 4,310
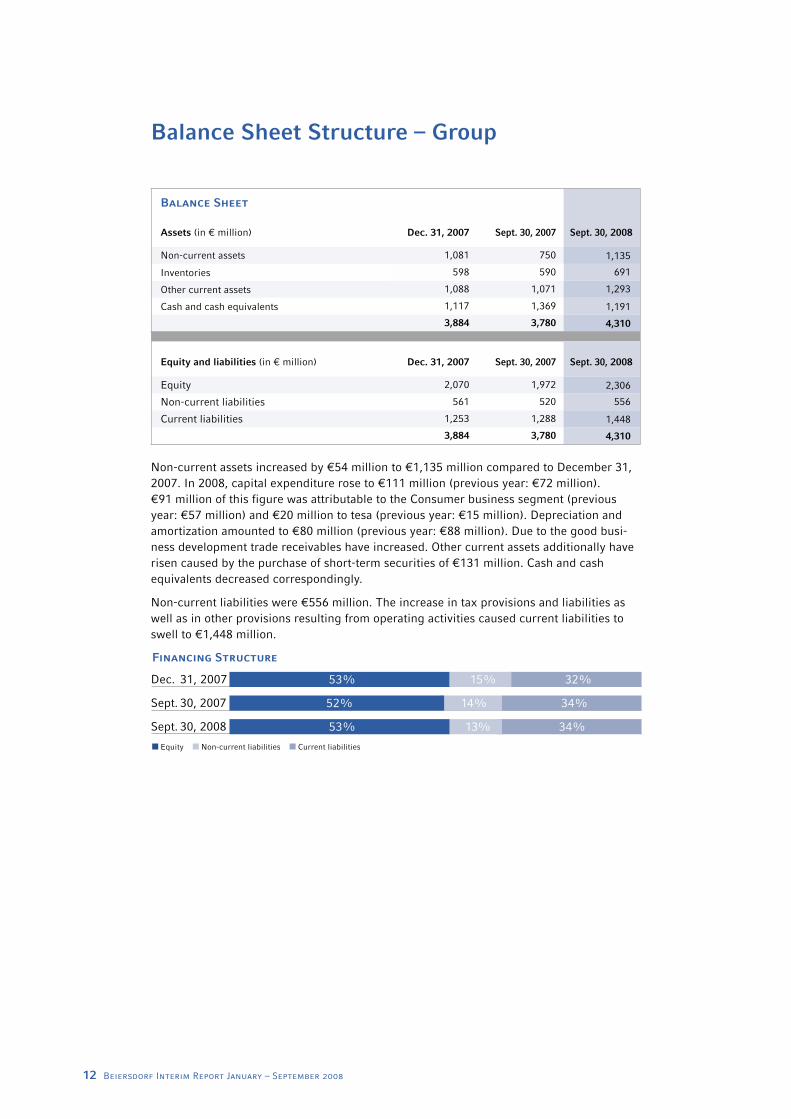
Non-current assets increased by €54 million to €1,135 million compared to December 31, 2007. In 2008, capital expenditure rose to €111 million (previous year: €72 million). €91 million of this figure was attributable to the Consumer business segment (previous year: €57 million) and €20 million to tesa (previous year: €15 million). Depreciation and amortization amounted to €80 million (previous year: €88 million). Due to the good busi-ness development trade receivables have increased. Other current assets additionally have risen caused by the purchase of short-term securities of €131 million. Cash and cash equivalents decreased correspondingly.
Non-current liabilities were €556 million. The increase in tax provisions and liabilities as well as in other provisions resulting from operating activities caused current liabilities to swell to €1,448 million.
Financing Structure
Equity Non-current liabilities Current liabilities
Dec. 31, 2007
Sept. 30, 2007
Sept. 30, 2008
32%
34%
34%
15%
14%
13%
53%
53%
52%
Beiersdorf Interim Report January – September 2008 13
Cash Flow Statement
(in € million)Jan. 1–Sept. 30,
2007 Jan. 1–Sept. 30,
2008
Gross cash flow 361 431
Change in working capital –44 –104
Net cash flow from operating activities 317 327
Net cash flow from investing activities –1 –94
Free cash flow 316 233
Net cash flow from financing activities –170 –162
Exchange rate and other changes –7 3
Net change in cash and cash equivalents 139 74
Cash and cash equivalents as of Jan. 1 1,230 1,117
Cash and cash equivalents as of Sept. 30 1,369 1,191
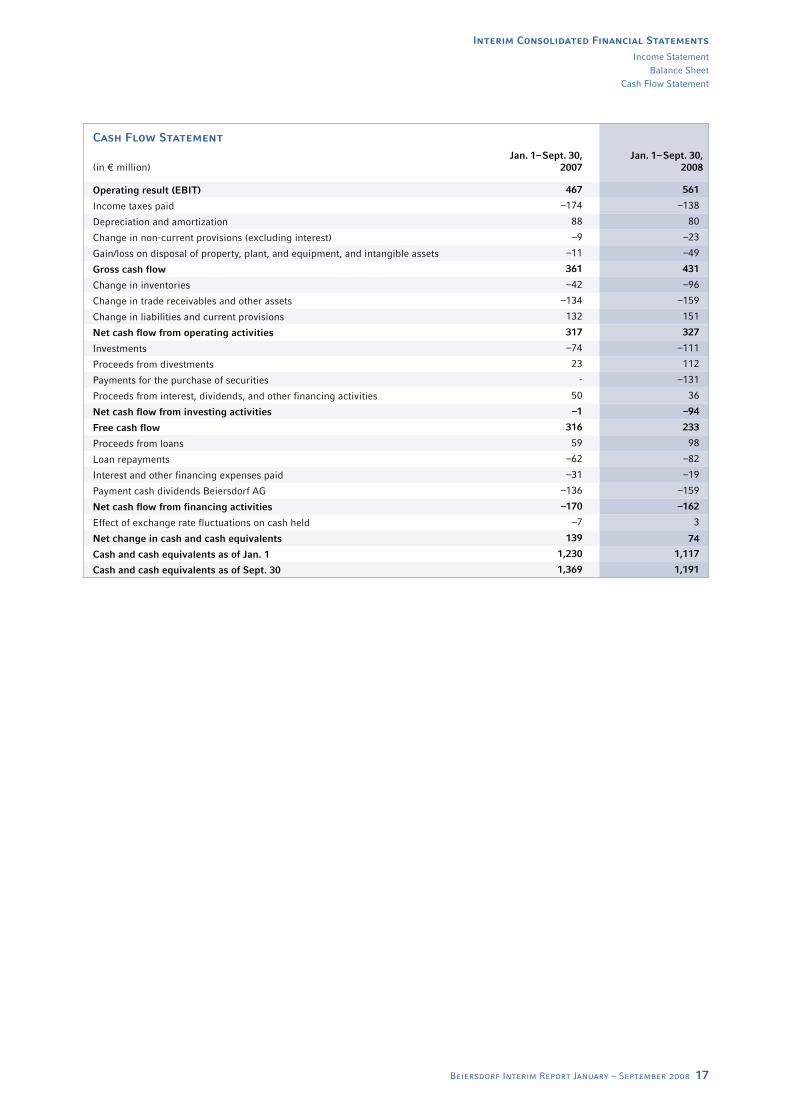
Gross cash flow amounted to €431 million. The net cash outflow from changes in working capital totaled €104 million. Overall, the net cash flow from operating activities was €327 million. The net cash outflow from investing activities amounted to €94 million. Capital expenditure for investments was €111 million and for securities to €131 million. Cash in-flows were achieved by the sale of fixed assets (€112 million) and by interest and other cash inflows (€36 million). Free cash flow totaled €233 million. The net cash outflow from financing activities amounted to €162 million, due to the dividend payment of €159 million as well as interest and other financing expenses in the amount of €3 million. Cash and cash equivalents totaled €1,191 million.
Employees
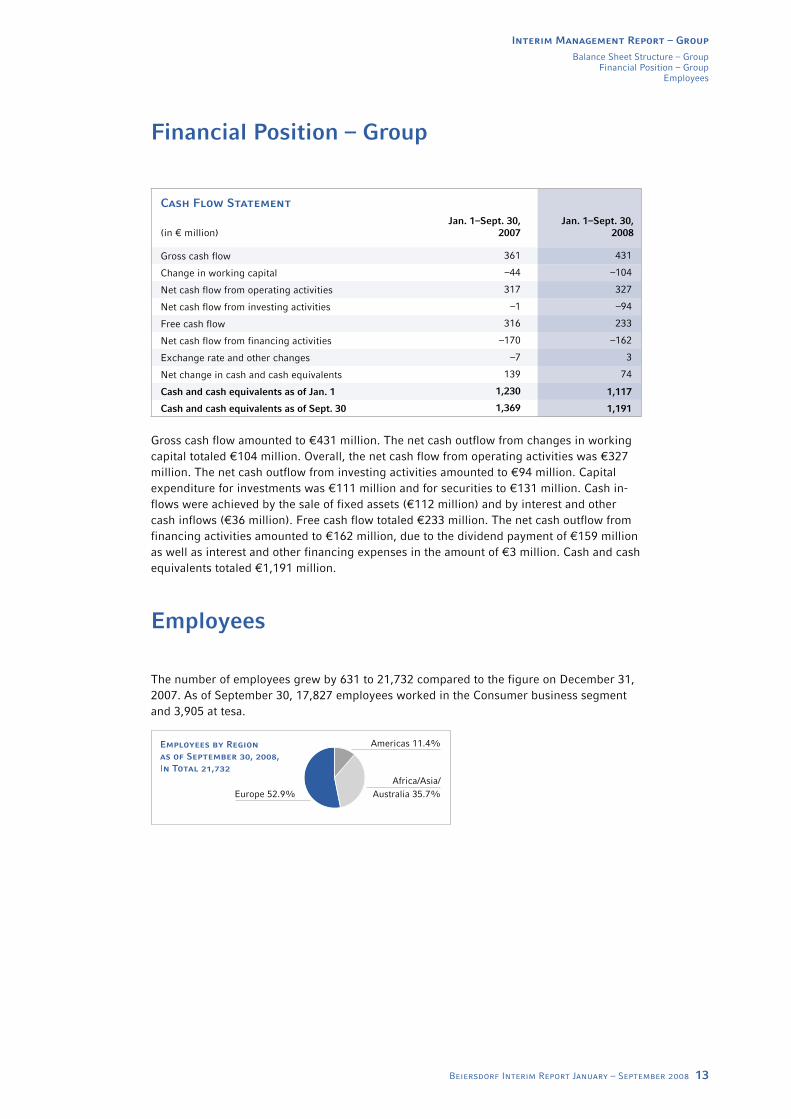
The number of employees grew by 631 to 21,732 compared to the figure on December 31, 2007. As of September 30, 17,827 employees worked in the Consumer business segment and 3,905 at tesa.
Employees by Region as of September 30, 2008,In Total 21,732
Americas 11.4%
Europe 52.9%Africa/Asia/
Australia 35.7%
Balance Sheet Structure – GroupFinancial Position – Group
Employees
Interim Management Report – Group
Financial Position – Group
14 Beiersdorf Interim Report January – September 2008
Other Disclosures
Sale of BODE Chemie
On October 20, 2008, Beiersdorf sold its German affiliate BODE Chemie GmbH & Co. KG, taking effect at year-end, 2008, to Paul Hartmann AG, Heidenheim (Germany).
BODE Chemie produces and sells disinfectants for hands, skin, instruments, and surfaces. This segment is very different from the rest of Beiersdorf’s Consumer business due to its focus on hospitals and wholesalers. BODE Chemie generated sales of around €70 million in 2007.
Opportunities and Risks
For more information on opportunities and risks, please refer to our Risk Report in the Group Management Report as of December 31, 2007 and the disclosures in the Interim Management Report as of June 30, 2008. There were no significant changes in opportunities and risks as of September 30, 2008.
Beiersdorf Interim Report January – September 2008 15
Outlook for 2008
Expected Macroeconomic DevelopmentsThe effects of the current financial crisis on economic developments for the remaining months of the year cannot be estimated as yet. However, the statements made in the last interim report in relation to the full financial year are primarily still valid.
The global cosmetics market is expected to continue its long-term trend growth of around 3% this year.
We are anticipating moderate growth in the major Western European markets. By contrast, we continue to expect significant growth in Eastern Europe, Latin America, and Asia.
As in previous years, we are forecasting substantial regional variations in performance for tesa’s industry and consumer markets. We see high to medium single-digit growth rates in Asia and Eastern Europe, while low single-digit growth rates are likely in more mature markets.
Expected Business DevelopmentsWe expect to see organic sales growth for the Beiersdorf Group in excess of 8% for full-year 2008, well above the respective market rates.
The EBIT margin is expected to increase further on a like-for-like basis as compared with the previous year. The Chinese hair care and styling brands acquired at the end of 2007 are paving the way for a significant growth in sales in the year 2008 and in the year 2009 with substantial marketing investments. As a result, EBIT growth for the Group will be lower than sales growth this year.
As part of the realignment of the Consumer Supply Chain, we are anticipating nonrecurring income of approximately €15 million.
We expect to see organic sales growth in the Consumer business segment of between 8% and 9%. The business activities acquired in China and Switzerland will further increase this sales growth. We are forecasting especially strong organic growth rates in China, Russia, Brazil, and India. The Consumer EBIT margin is expected to increase to approximately 13% on a like-for-like basis as compared with the previous year. Growth in Consumer EBIT will be reduced by the substantial marketing investments in our Chinese hair care business.
The tesa business segment aims to generate above-market sales growth of approximately 5%. The EBIT margin will match the strong figure recorded in the previous year.
Other DisclosuresOpportunities and Risks
Outlook for 2008
Interim Management Report – Group
16 Beiersdorf Interim Report January – September 2008
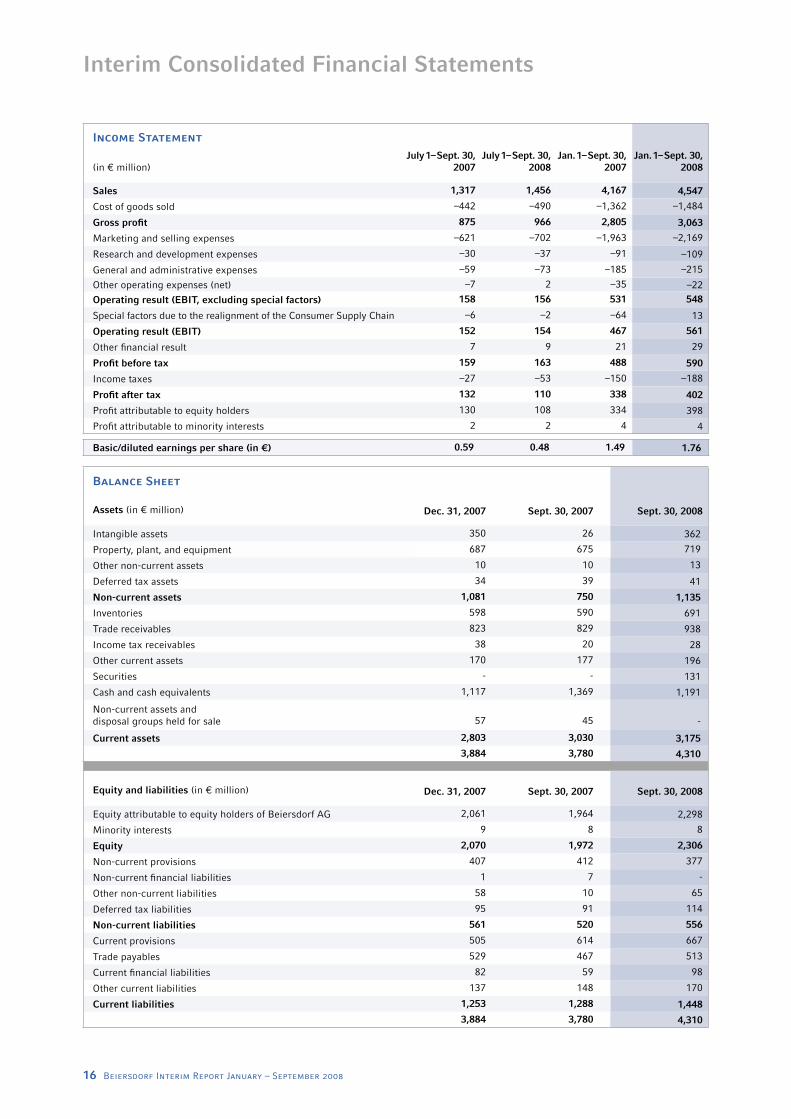
Balance Sheet
Assets (in € million) Dec. 31, 2007 Sept. 30, 2007 Sept. 30, 2008
Intangible assets 350 26 362
Property, plant, and equipment 687 675 719
Other non-current assets 10 10 13
Deferred tax assets 34 39 41
Non-current assets 1,081 750 1,135
Inventories 598 590 691
Trade receivables 823 829 938
Income tax receivables 38 20 28
Other current assets 170 177 196
Securities - - 131
Cash and cash equivalents 1,117 1,369 1,191
Non-current assets and disposal groups held for sale 57 45 -
Current assets 2,803 3,030 3,175
3,884 3,780 4,310
Equity and liabilities (in € million) Dec. 31, 2007 Sept. 30, 2007 Sept. 30, 2008
Equity attributable to equity holders of Beiersdorf AG 2,061 1,964 2,298
Minority interests 9 8 8
Equity 2,070 1,972 2,306
Non-current provisions 407 412 377
Non-current fi nancial liabilities 1 7 -
Other non-current liabilities 58 10 65
Deferred tax liabilities 95 91 114
Non-current liabilities 561 520 556
Current provisions 505 614 667
Trade payables 529 467 513
Current fi nancial liabilities 82 59 98
Other current liabilities 137 148 170
Current liabilities 1,253 1,288 1,448
3,884 3,780 4,310
Interim Consolidated Financial Statements
Income Statement
(in € million)July 1 – Sept. 30,
2007July 1 – Sept. 30,
2008Jan. 1 – Sept. 30,
2007Jan. 1 – Sept. 30,
2008
Sales 1,317 1,456 4,167 4,547
Cost of goods sold –442 –490 –1,362 –1,484
Gross profi t 875 966 2,805 3,063
Marketing and selling expenses –621 –702 –1,963 –2,169
Research and development expenses –30 –37 –91 –109
General and administrative expenses –59 –73 –185 –215
Other operating expenses (net) –7 2 –35 –22
Operating result (EBIT, excluding special factors) 158 156 531 548
Special factors due to the realignment of the Consumer Supply Chain –6 –2 –64 13
Operating result (EBIT) 152 154 467 561
Other fi nancial result 7 9 21 29
Profi t before tax 159 163 488 590
Income taxes –27 –53 –150 –188
Profi t after tax 132 110 338 402
Profi t attributable to equity holders 130 108 334 398
Profi t attributable to minority interests 2 2 4 4
Basic/diluted earnings per share (in €) 0.59 0.48 1.49 1.76
Beiersdorf Interim Report January – September 2008 17
Income StatementBalance Sheet
Cash Flow Statement
Interim Consolidated Financial Statements
Cash Flow Statement
(in € million)Jan. 1 – Sept. 30,
2007Jan. 1 – Sept. 30,
2008
Operating result (EBIT) 467 561
Income taxes paid –174 –138
Depreciation and amortization 88 80
Change in non-current provisions (excluding interest) –9 –23
Gain/loss on disposal of property, plant, and equipment, and intangible assets –11 –49
Gross cash flow 361 431
Change in inventories –42 –96
Change in trade receivables and other assets –134 –159
Change in liabilities and current provisions 132 151
Net cash flow from operating activities 317 327
Investments –74 –111
Proceeds from divestments 23 112
Payments for the purchase of securities - –131
Proceeds from interest, dividends, and other financing activities 50 36
Net cash flow from investing activities –1 –94
Free cash flow 316 233
Proceeds from loans 59 98
Loan repayments –62 –82
Interest and other financing expenses paid –31 –19
Payment cash dividends Beiersdorf AG –136 –159
Net cash flow from financing activities –170 –162
Effect of exchange rate fluctuations on cash held –7 3
Net change in cash and cash equivalents 139 74
Cash and cash equivalents as of Jan. 1 1,230 1,117
Cash and cash equivalents as of Sept. 30 1,369 1,191
18 Beiersdorf Interim Report January – September 2008
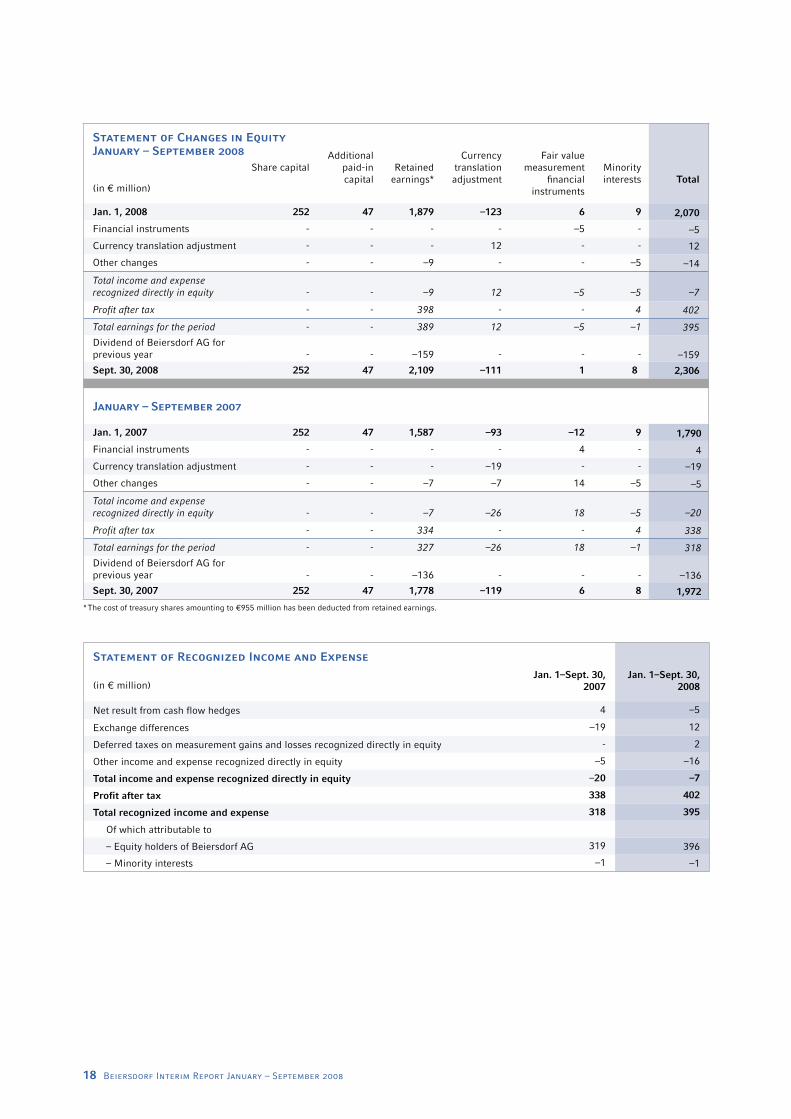
Statement of Changes in Equity
Share capitalAdditional
paid-in capital
Retained earnings*
Currency translation adjustment
Fair value measurement
fi nancialinstruments
Minority interests Total
(in € million)
Jan. 1, 2008 252 47 1,879 –123 6 9 2,070
Financial instruments - - - - –5 - –5
Currency translation adjustment - - - 12 - - 12
Other changes - - –9 - - –5 –14
Total income and expense recognized directly in equity - - –9 12 –5 –5 –7
Profit after tax - - 398 - - 4 402
Total earnings for the period - - 389 12 –5 –1 395
Dividend of Beiersdorf AG for previous year - - –159 - - - –159
Sept. 30, 2008 252 47 2,109 –111 1 8 2,306
January – September 2007
Jan. 1, 2007 252 47 1,587 –93 –12 9 1,790
Financial instruments - - - - 4 - 4
Currency translation adjustment - - - –19 - - –19
Other changes - - –7 –7 14 –5 –5
Total income and expense recognized directly in equity - - –7 –26 18 –5 –20
Profit after tax - - 334 - - 4 338
Total earnings for the period - - 327 –26 18 –1 318
Dividend of Beiersdorf AG for previous year - - –136 - - - –136
Sept. 30, 2007 252 47 1,778 –119 6 8 1,972
* The cost of treasury shares amounting to €955 million has been deducted from retained earnings.
January – September 2008
Statement of Recognized Income and Expense
(in € million)Jan. 1–Sept. 30,
2007Jan. 1–Sept. 30,
2008
Net result from cash flow hedges 4 –5
Exchange differences –19 12
Deferred taxes on measurement gains and losses recognized directly in equity - 2
Other income and expense recognized directly in equity –5 –16
Total income and expense recognized directly in equity –20 –7
Profit after tax 338 402
Total recognized income and expense 318 395
Of which attributable to
– Equity holders of Beiersdorf AG 319 396
– Minority interests –1 –1
Beiersdorf Interim Report January – September 2008 19
Selected Explanatory Notes
Information on the Company and on the GroupThe registered office of Beiersdorf AG is at Unnastrasse 48 in Hamburg (Germany) and the Company is registered with the commercial register of the Hamburg Local Court under the number HRB 1787. The ultimate parent of the Company is maxingvest ag (formerly: Tchibo Holding AG). The activities of Beiersdorf AG and its affiliates (“Beiersdorf Group”) consist primarily of the manufacture and distribution of branded consumer goods in the areas of skin and beauty care, and of the manufacture and distribution of technical adhesive tapes.
Basis of PreparationThe interim consolidated financial statements for the period from January 1 to September 30, 2008, were prepared in accordance with IAS 34 “Interim Financial Reporting.” The interim consolidated financial statements should be read in conjunction with the consoli-dated financial statements as of December 31, 2007.
Accounting PoliciesThe figures disclosed in this interim report were prepared in accordance with International Financial Reporting Standards (IFRSs). The same accounting policies were used in the interim consolidated financial statements as in the annual consolidated financial statements for 2007. The interim report was not audited or reviewed.
Related Party DisclosuresPlease refer to the consolidated financial statements as of December 31, 2007, for related party disclosures. There were no significant changes as of September 30, 2008.
Corporate GovernanceThe declaration of compliance issued by the Supervisory Board and the Executive Board for fiscal year 2007 regarding the recommendations of the German Corporate Governance Code in accordance with § 161 Aktiengesetz (German Stock Corporation Act) was published at the end of December 2007 and is permanently available on our website at www.Beiersdorf.com.
Events After the Balance Sheet DateApart from the sale of the German affiliate BODE Chemie, described in the Group’s Interim Management Report, no further significant events occurred after the balance sheet date that would have a material effect on the Beiersdorf Group’s business developments.
Hamburg, November 2008
Beiersdorf AG
The Executive Board
Statement of Changes in EquityStatement of Recognized Income and Expense
Selected Explanatory Notes
Interim Consolidated Financial Statements
Published by:Beiersdorf Aktiengesellschaft, Global Corporate Identity & Information, Unnastrasse 48, 20245 Hamburg, GermanyTelephone: +49 40 4909-0, Fax: +49 40 4909-3434
Additional Information:Corporate Media Relations: Telephone: +49 40 4909-3077, E-mail: [email protected] Relations: Telephone: +49 40 4909-5000, E-mail: [email protected] on the Internet: www.Beiersdorf.com
Financial Calendar
January 2009 Publication of Preliminary Group Results
March 3, 2009 Publication of Annual Report 2008, Annual Accounts Press Conference, Financial Analyst Meeting
April 30, 2009 Annual General Meeting
May 5, 2009 Interim Report January to March 2009
August 4, 2009 Interim Report January to June 2009
November 3, 2009 Interim Report January to September 2009, Financial Analyst Meeting
The Interim Report is also available in German and a digital version is available on the Internet at www.Beiersdorf.com/interim_report.
Commercial Register Hamburg HRB 1787