nike, inc. table of contents -...
TRANSCRIPT

NIKE, INC.ANNUAL REPORT ON FORM 10-KTable of Contents
Page
PART I 47
ITEM 1. Business . . . . . . . . . . . . . . . . . . . . . . . . . . . . . . . . . . . . . . . . . . . . . . . . . . . . . . . . . . . . . . . . . . . . . . . . . . . . . . . . . . . . . . . . . . . . . . . . . . . . . . . . . . . . . . . . . . . . . . . . . . . . 47General . . . . . . . . . . . . . . . . . . . . . . . . . . . . . . . . . . . . . . . . . . . . . . . . . . . . . . . . . . . . . . . . . . . . . . . . . . . . . . . . . . . . . . . . . . . . . . . . . . . . . . . . . . . . . . . . . . . . . . . . . . . . . . 47Products . . . . . . . . . . . . . . . . . . . . . . . . . . . . . . . . . . . . . . . . . . . . . . . . . . . . . . . . . . . . . . . . . . . . . . . . . . . . . . . . . . . . . . . . . . . . . . . . . . . . . . . . . . . . . . . . . . . . . . . . . . . . 47Sales and Marketing . . . . . . . . . . . . . . . . . . . . . . . . . . . . . . . . . . . . . . . . . . . . . . . . . . . . . . . . . . . . . . . . . . . . . . . . . . . . . . . . . . . . . . . . . . . . . . . . . . . . . . . . . . . 48United States Market . . . . . . . . . . . . . . . . . . . . . . . . . . . . . . . . . . . . . . . . . . . . . . . . . . . . . . . . . . . . . . . . . . . . . . . . . . . . . . . . . . . . . . . . . . . . . . . . . . . . . . . . . . 48International Markets . . . . . . . . . . . . . . . . . . . . . . . . . . . . . . . . . . . . . . . . . . . . . . . . . . . . . . . . . . . . . . . . . . . . . . . . . . . . . . . . . . . . . . . . . . . . . . . . . . . . . . . . . . 48Significant Customer . . . . . . . . . . . . . . . . . . . . . . . . . . . . . . . . . . . . . . . . . . . . . . . . . . . . . . . . . . . . . . . . . . . . . . . . . . . . . . . . . . . . . . . . . . . . . . . . . . . . . . . . . . 49Orders . . . . . . . . . . . . . . . . . . . . . . . . . . . . . . . . . . . . . . . . . . . . . . . . . . . . . . . . . . . . . . . . . . . . . . . . . . . . . . . . . . . . . . . . . . . . . . . . . . . . . . . . . . . . . . . . . . . . . . . . . . . . . . . 49Product Research, Design and Development . . . . . . . . . . . . . . . . . . . . . . . . . . . . . . . . . . . . . . . . . . . . . . . . . . . . . . . . . . . . . . . . . . . . . . . 49Manufacturing . . . . . . . . . . . . . . . . . . . . . . . . . . . . . . . . . . . . . . . . . . . . . . . . . . . . . . . . . . . . . . . . . . . . . . . . . . . . . . . . . . . . . . . . . . . . . . . . . . . . . . . . . . . . . . . . . . . . 49International Operations and Trade . . . . . . . . . . . . . . . . . . . . . . . . . . . . . . . . . . . . . . . . . . . . . . . . . . . . . . . . . . . . . . . . . . . . . . . . . . . . . . . . . . . . . 50Competition . . . . . . . . . . . . . . . . . . . . . . . . . . . . . . . . . . . . . . . . . . . . . . . . . . . . . . . . . . . . . . . . . . . . . . . . . . . . . . . . . . . . . . . . . . . . . . . . . . . . . . . . . . . . . . . . . . . . . . . 50Trademarks and Patents . . . . . . . . . . . . . . . . . . . . . . . . . . . . . . . . . . . . . . . . . . . . . . . . . . . . . . . . . . . . . . . . . . . . . . . . . . . . . . . . . . . . . . . . . . . . . . . . . . . . . 50Employees . . . . . . . . . . . . . . . . . . . . . . . . . . . . . . . . . . . . . . . . . . . . . . . . . . . . . . . . . . . . . . . . . . . . . . . . . . . . . . . . . . . . . . . . . . . . . . . . . . . . . . . . . . . . . . . . . . . . . . . . . 51Executive Officers of the Registrant . . . . . . . . . . . . . . . . . . . . . . . . . . . . . . . . . . . . . . . . . . . . . . . . . . . . . . . . . . . . . . . . . . . . . . . . . . . . . . . . . . . . . 51
ITEM 1A. Risk Factors . . . . . . . . . . . . . . . . . . . . . . . . . . . . . . . . . . . . . . . . . . . . . . . . . . . . . . . . . . . . . . . . . . . . . . . . . . . . . . . . . . . . . . . . . . . . . . . . . . . . . . . . . . . . . . . . . . . . . . . 52ITEM 1B. Unresolved Staff Comments . . . . . . . . . . . . . . . . . . . . . . . . . . . . . . . . . . . . . . . . . . . . . . . . . . . . . . . . . . . . . . . . . . . . . . . . . . . . . . . . . . . . . . . . . . . . . . . 59ITEM 2. Properties . . . . . . . . . . . . . . . . . . . . . . . . . . . . . . . . . . . . . . . . . . . . . . . . . . . . . . . . . . . . . . . . . . . . . . . . . . . . . . . . . . . . . . . . . . . . . . . . . . . . . . . . . . . . . . . . . . . . . . . . . . 59ITEM 3. Legal Proceedings . . . . . . . . . . . . . . . . . . . . . . . . . . . . . . . . . . . . . . . . . . . . . . . . . . . . . . . . . . . . . . . . . . . . . . . . . . . . . . . . . . . . . . . . . . . . . . . . . . . . . . . . . . . . . . 59ITEM 4. Mine Safety Disclosures . . . . . . . . . . . . . . . . . . . . . . . . . . . . . . . . . . . . . . . . . . . . . . . . . . . . . . . . . . . . . . . . . . . . . . . . . . . . . . . . . . . . . . . . . . . . . . . . . . . . . 59
PART II 60
ITEM 5. Market for Registrant’s Common Equity, Related Stockholder Matters and Issuer Purchasesof Equity Securities . . . . . . . . . . . . . . . . . . . . . . . . . . . . . . . . . . . . . . . . . . . . . . . . . . . . . . . . . . . . . . . . . . . . . . . . . . . . . . . . . . . . . . . . . . . . . . . . . . . . . . . . . . . . . 60
ITEM 6. Selected Financial Data . . . . . . . . . . . . . . . . . . . . . . . . . . . . . . . . . . . . . . . . . . . . . . . . . . . . . . . . . . . . . . . . . . . . . . . . . . . . . . . . . . . . . . . . . . . . . . . . . . . . . . 62ITEM 7. Management’s Discussion and Analysis of Financial Condition and Results of Operations . . . . . 64ITEM 7A. Quantitative and Qualitative Disclosures about Market Risk . . . . . . . . . . . . . . . . . . . . . . . . . . . . . . . . . . . . . . . . . . . . . . . . . . 84ITEM 8. Financial Statements and Supplementary Data . . . . . . . . . . . . . . . . . . . . . . . . . . . . . . . . . . . . . . . . . . . . . . . . . . . . . . . . . . . . . . . . . . . . 85ITEM 9. Changes in and Disagreements with Accountants on Accounting and Financial Disclosure . . .115ITEM 9A. Controls and Procedures . . . . . . . . . . . . . . . . . . . . . . . . . . . . . . . . . . . . . . . . . . . . . . . . . . . . . . . . . . . . . . . . . . . . . . . . . . . . . . . . . . . . . . . . . . . . . . . . . . . .115ITEM 9B. Other Information . . . . . . . . . . . . . . . . . . . . . . . . . . . . . . . . . . . . . . . . . . . . . . . . . . . . . . . . . . . . . . . . . . . . . . . . . . . . . . . . . . . . . . . . . . . . . . . . . . . . . . . . . . . . . . .115
PART III 116
(Except for the information set forth under “Executive Officers of the Registrant” in Item 1above, Part III is incorporated by reference from the Proxy Statement for the NIKE, Inc. 2014Annual Meeting of Shareholders.) . . . . . . . . . . . . . . . . . . . . . . . . . . . . . . . . . . . . . . . . . . . . . . . . . . . . . . . . . . . . . . . . . . . . . . . . . . . . . . . . . . . . . . . .
ITEM 10. Directors, Executive Officers and Corporate Governance . . . . . . . . . . . . . . . . . . . . . . . . . . . . . . . . . . . . . . . . . . . . . . . . . . . . .116ITEM 11. Executive Compensation . . . . . . . . . . . . . . . . . . . . . . . . . . . . . . . . . . . . . . . . . . . . . . . . . . . . . . . . . . . . . . . . . . . . . . . . . . . . . . . . . . . . . . . . . . . . . . . . . . . .116ITEM 12. Security Ownership of Certain Beneficial Owners and Management and Related
Stockholder Matters . . . . . . . . . . . . . . . . . . . . . . . . . . . . . . . . . . . . . . . . . . . . . . . . . . . . . . . . . . . . . . . . . . . . . . . . . . . . . . . . . . . . . . . . . . . . . . . . . . . . . . . . . . .116ITEM 13. Certain Relationships and Related Transactions, and Director Independence . . . . . . . . . . . . . . . . . . . . . . . .116ITEM 14. Principal Accountant Fees and Services . . . . . . . . . . . . . . . . . . . . . . . . . . . . . . . . . . . . . . . . . . . . . . . . . . . . . . . . . . . . . . . . . . . . . . . . . . . . . .116
PART IV 117
ITEM 15. Exhibits and Financial Statement Schedules . . . . . . . . . . . . . . . . . . . . . . . . . . . . . . . . . . . . . . . . . . . . . . . . . . . . . . . . . . . . . . . . . . . . . . . .117Signatures . . . . . . . . . . . . . . . . . . . . . . . . . . . . . . . . . . . . . . . . . . . . . . . . . . . . . . . . . . . . . . . . . . . . . . . . . . . . . . . . . . . . . . . . . . . . . . . . . . . . . . . . . . . . . . . . . . . . . . . . .122

UNITED STATESSECURITIES AND EXCHANGE COMMISSION
Washington, D.C. 20549
FORM 10-K(Mark One)
Í ANNUAL REPORT PURSUANT TO SECTION 13 OR 15(D) OF THE SECURITIES EXCHANGE ACT OF 1934FOR THE FISCAL YEAR ENDED MAY 31, 2014
OR‘ TRANSITION REPORT PURSUANT TO SECTION 13 OR 15(D) OF THE SECURITIES EXCHANGE ACT OF 1934
FOR THE TRANSITION PERIOD FROM TO .
Commission File No. 1-10635
NIKE, INC.(Exact name of Registrant as specified in its charter)
OREGON 93-0584541(State or other jurisdiction of incorporation) (IRS Employer Identification No.)
One Bowerman Drive, Beaverton, Oregon 97005-6453(Address of principal executive offices) (Zip Code)
(503) 671-6453
(Registrant’s Telephone Number, Including Area Code)SECURITIES REGISTERED PURSUANT TO SECTION 12(B) OF THE ACT:
Class B Common Stock New York Stock Exchange(Title of Each Class) (Name of Each Exchange on Which Registered)
SECURITIES REGISTERED PURSUANT TO SECTION 12(G) OF THE ACT:NONE
Indicate by check mark YES NO• if the registrant is a well-known seasoned issuer, as defined in Rule 405 of the
Securities Act. Í ‘• if the registrant is not required to file reports pursuant to Section 13 or Section 15(d) of
the Act. ‘ Í• whether the Registrant (1) has filed all reports required to be filed by Section 13 or 15(d)
of the Securities Exchange Act of 1934 during the preceding 12 months (or for suchshorter period that the Registrant was required to file such reports), and (2) has beensubject to such filing requirements for the past 90 days. Í ‘
• whether the registrant has submitted electronically and posted on its corporateWebsite, if any, every Interactive Data File required to be submitted and postedpursuant to Rule 405 of Regulation S-T (§229.405 of this chapter) during the preceding12 months (or for such shorter period that the registrant was required to submit andpost such files). Í ‘
• if disclosure of delinquent filers pursuant to Item 405 of Regulation S-K (§229.405 of thischapter) is not contained herein, and will not be contained, to the best of Registrant’sknowledge, in definitive proxy or information statements incorporated by reference inPart III of this Form 10-K or any amendment to this Form 10-K. ‘ Í
• whether the Registrant is a large accelerated filer, an accelerated filer, a non-accelerated filer, or a smaller reporting company. See the definitionsof “large accelerated filer,” “accelerated filer” and “smaller reporting company” in Rule 12b-2 of the Exchange Act.
Large accelerated filer Í Accelerated filer ‘ Non-accelerated file ‘ Smaller Reporting Company ‘
• whether the registrant is a shell company (as defined in Rule 12b-2 of the Act). ‘ ÍAs of November 30, 2013, the aggregate market values of the Registrant’s Common Stock held by non-affiliates were:
Class A $ 3,536,091,219Class B 56,098,067,138
$59,634,158,357As of July 18, 2014, the number of shares of the Registrant’s Common Stock outstanding were:
Class A 177,557,876Class B 690,739,620
868,297,496
DOCUMENTS INCORPORATED BY REFERENCE:Parts of Registrant’s Proxy Statement for the Annual Meeting of Shareholders to be held on September 18, 2014 are incorporated byreference into Part III of this Report.
45

PART I
PART I
ITEM 1. Business
General
NIKE, Inc. was incorporated in 1968 under the laws of the State of Oregon. Asused in this report, the terms “we,” “us,” “NIKE,” and the “Company” refer toNIKE, Inc. and its predecessors, subsidiaries, and affiliates, collectively, unlessthe context indicates otherwise. Our NIKE e-commerce website is located atwww.nike.com. On our NIKE corporate website, located atwww.nikeinc.com, we post the following filings as soon as reasonablypracticable after they are electronically filed with or furnished to the UnitedStates Securities and Exchange Commission (the “SEC”): our annual reporton Form 10-K, our quarterly reports on Form 10-Q, our current reports onForm 8-K, and any amendments to those reports filed or furnished pursuantto Section 13(a) or 15(d) of the Securities and Exchange Act of 1934, asamended. Our definitive Proxy Statements are also posted. All such filings onour NIKE corporate website are available free of charge. Copies of thesefilings may also be obtained by visiting the Public Reference Room of the SECat 100 F Street, NE, Washington, D.C. 20549 or by calling the SEC at 1-800-SEC-0330. In addition, the SEC maintains a website (www.sec.gov) thatcontains reports, proxy and information statements, and other information
regarding issuers that file electronically. Also available on the NIKE corporatewebsite are the charters of the committees of our Board of Directors, as wellas our corporate governance guidelines and code of ethics; copies of any ofthese documents will be provided in print to any shareholder who submits arequest in writing to NIKE Investor Relations, One Bowerman Drive,Beaverton, Oregon 97005-6453.
Our principal business activity is the design, development, and worldwidemarketing and selling of athletic footwear, apparel, equipment, accessories,and services. NIKE is the largest seller of athletic footwear and athletic apparelin the world. We sell our products to retail accounts, through NIKE-ownedretail stores and internet websites (which we refer to as our “Direct toConsumer” or “DTC” operations), and through a mix of independentdistributors and licensees throughout the world. Virtually all of our productsare manufactured by independent contractors. Practically all footwear andapparel products are produced outside the United States, while equipmentproducts are produced both in the United States and abroad.
Products
We focus our NIKE Brand product offerings in eight key categories: Running,Basketball, Football (Soccer), Men’s Training, Women’s Training, ActionSports, Sportswear (our sports-inspired lifestyle products), and Golf.Basketball includes our Brand Jordan product offerings and Men’s Trainingincludes our baseball and U.S. football product offerings. We also marketproducts designed for kids, as well as for other athletic and recreational usessuch as cricket, lacrosse, tennis, volleyball, wrestling, walking, and outdooractivities.
NIKE’s athletic footwear products are designed primarily for specific athleticuse, although a large percentage of the products are worn for casual or leisurepurposes. We place considerable emphasis on high-quality construction andinnovation in our products. Sportswear, Running, Basketball, and Football(Soccer) are currently our top-selling footwear categories and we expect themto continue to lead in product sales.
We sell sports apparel and accessories covering most of the above-mentioned categories, which feature the same trademarks and are soldpredominantly through the same marketing and distribution channels asathletic footwear. We often market footwear, apparel, and accessories in“collections” of similar use or by category. We also market apparel withlicensed college and professional team and league logos.
We sell a line of performance equipment under the NIKE Brand name,including bags, socks, sport balls, eyewear, timepieces, digital devices, bats,gloves, protective equipment, golf clubs, and other equipment designed forsports activities. We also sell small amounts of various plastic products toother manufacturers through our wholly-owned subsidiary, NIKE IHM, Inc.
One of our wholly-owned subsidiary brands, Hurley, headquartered in CostaMesa, California (“Hurley”), designs and distributes a line of action sports andyouth lifestyle apparel and accessories under the Hurley trademark. Sales ofHurley brand products are included within the NIKE Brand Action Sportscategory.
Our Brand Jordan division designs, distributes and licenses athletic andcasual footwear, apparel and accessories predominantly focused onBasketball using the Jumpman trademark. Sales of Brand Jordan productsare included within the NIKE Brand Basketball category.
Another of our wholly-owned subsidiary brands, Converse, headquartered inNorth Andover, Massachusetts (“Converse”), designs, distributes, andlicenses casual sneakers, apparel, and accessories under the Converse,Chuck Taylor, All Star, One Star, Star Chevron, and Jack Purcell trademarks.Converse results are reported on a stand-alone basis.
In addition to the products we sell to our wholesale customers and directly toconsumers through our Direct to Consumer operations, we have also enteredinto license agreements that permit unaffiliated parties to manufacture and sellusing NIKE-owned trademarks, certain apparel, digital devices andapplications, and other equipment designed for sports activities.
On February 1, 2013, and November 30, 2012, we completed thedivestitures of the Cole Haan and Umbro businesses, respectively, allowingus to better focus our resources on driving growth in the NIKE, Jordan,Converse, and Hurley brands.
NIKE, INC. 2014 Annual Report and Notice of Annual Meeting 47
FOR
M10
-K

PART I
Sales and Marketing
Financial information about geographic and segment operations appears inNote 18 — Operating Segments and Related Information of theaccompanying Notes to the Consolidated Financial Statements.
We experience moderate fluctuations in aggregate sales volume during theyear. Historically, revenues in the first and fourth fiscal quarters have slightlyexceeded those in the second and third quarters. However, the mix ofproduct sales may vary considerably as a result of changes in seasonal andgeographic demand for particular types of footwear, apparel, and equipment.
Because NIKE is a consumer products company, the relative popularity ofvarious sports and fitness activities and changing design trends affect thedemand for our products. We must, therefore, respond to trends and shifts inconsumer preferences by adjusting the mix of existing product offerings,developing new products, styles and categories, and influencing sports andfitness preferences through extensive marketing. Failure to respond in a timely
and adequate manner could have a material adverse effect on our sales andprofitability. This is a continuing risk. We report our NIKE Brand operationsbased on our internal geographic organization. Each NIKE Brand geographyoperates predominantly in one industry: the design, development, marketing,and selling of athletic footwear, apparel, equipment, accessories, andservices. Our reportable operating segments for the NIKE Brand are: NorthAmerica, Western Europe, Central & Eastern Europe, Greater China, Japan,and Emerging Markets. Our NIKE Brand Direct to Consumer operations aremanaged within each geographic segment.
Converse is also a reportable segment, and operates in one industry: thedesign, marketing, licensing, and selling of casual sneakers, apparel, andaccessories.
United States Market
In fiscal 2014, NIKE Brand and Converse sales in the United Statesaccounted for approximately 46% of total revenues, compared to 45% infiscal 2013 and 42% in fiscal 2012. We sell to thousands of retail accounts inthe United States, including a mix of footwear stores, sporting goods stores,athletic specialty stores, department stores, skate, tennis, and golf shops,and other retail accounts. During fiscal 2014, our three largest customersaccounted for approximately 26% of sales in the United States.
We make substantial use of our futures ordering program, which allowsretailers to order five to six months in advance of delivery with the commitmentthat their orders will be delivered within a set time period at a fixed price. Infiscal 2014, 86% of our U.S. wholesale footwear shipments (excluding NIKE
Golf, Hurley, and Converse) were made under the futures program,compared to 87% in fiscal 2013 and 86% in fiscal 2012. In fiscal 2014, 71%of our U.S. wholesale apparel shipments (excluding NIKE Golf, Hurley, andConverse) were made under the futures program, compared to 67% in fiscal2013 and 64% in fiscal 2012.
We utilize NIKE sales offices to solicit sales in the United States, as well asindependent sales representatives to sell specialty products for golf,skateboarding, and snowboarding. In addition, our Direct to Consumeroperations sell NIKE Brand products to consumers through our e-commercewebsite, www.nike.com, and through the following number of retail stores inthe United States:
U.S. Retail Stores NumberNIKE Brand factory stores 176NIKE Brand in-line stores, including NIKETOWNs and employee-only stores 33Converse stores (including factory stores) 84Hurley stores (including factory and employee stores) 29TOTAL 322
NIKE has five primary distribution centers in the United States located inMemphis, Tennessee, three of which are leased. NIKE Brand apparel andequipment products are also shipped from our Foothill Ranch, California
distribution center. Converse and Hurley products are shipped primarily fromOntario, California.
International Markets
In fiscal 2014, non-U.S. NIKE Brand and Converse sales accounted for 54%of total revenues, compared to 55% in fiscal 2013 and 58% in fiscal 2012. Wesell our products to retail accounts, through our own Direct to Consumeroperations, and through a mix of independent distributors, licensees, andsales representatives around the world. We sell to thousands of retailaccounts and operate 16 distribution centers outside of the United States. In
many countries and regions, including Canada, Asia, some Latin Americancountries, and Europe, we have a futures ordering program for retailers similarto the United States futures ordering program described above. During fiscal2014, NIKE’s three largest customers outside of the United States accountedfor approximately 6% of total non-U.S. sales.
Our Direct to Consumer business operates the following number of retail stores outside the United States:
Non-U.S. Retail Stores NumberNIKE Brand factory stores 459NIKE Brand in-line stores, including NIKETOWNs and employee-only stores 71Converse stores (including factory stores) 6TOTAL 536
48

PART I
International branch offices and subsidiaries of NIKE are located in Argentina,Australia, Austria, Belgium, Bermuda, Brazil, Canada, Chile, China, CostaRica, Croatia, Cyprus, the Czech Republic, Denmark, Finland, France,Germany, Greece, Hong Kong, Hungary, India, Indonesia, Ireland, Israel, Italy,Japan, Korea, Malaysia, Mexico, New Zealand, the Netherlands, Norway,
Panama, the Philippines, Poland, Portugal, Russia, Singapore, Slovakia,Slovenia, South Africa, Spain, Sri Lanka, Sweden, Switzerland, Taiwan,Thailand, Turkey, the United Arab Emirates, the United Kingdom, Uruguay,and Vietnam.
Significant Customer
No customer accounted for 10% or more of our worldwide net sales during fiscal 2014.
Orders
Worldwide futures orders for NIKE Brand (excluding NIKE Golf and Hurley)athletic footwear and apparel, scheduled for delivery from June throughNovember 2014, were $13.3 billion compared to $12.1 billion for the sameperiod last year. This futures orders amount is calculated based upon ourforecast of the actual exchange rates under which our revenues will betranslated during this period. Reported futures orders are not necessarilyindicative of our expectation of revenues for this period. This is because themix of orders can shift between futures and at-once orders and the fulfillment
of certain of these futures orders may fall outside of the scheduled time periodnoted above. In addition, foreign currency exchange rate fluctuations as wellas differing levels of discounts, order cancellations, and returns can causedifferences in the comparisons between futures orders and actual revenues.Moreover, a portion of our revenue is not derived from futures orders,including at-once and closeout sales of NIKE Brand footwear and apparel,sales of NIKE Brand equipment, sales from our Direct to Consumeroperations, and sales from our Converse, Hurley, and NIKE Golf businesses.
Product Research, Design and Development
We believe our research, design, and development efforts are key factors inour success. Technical innovation in the design and manufacturing process offootwear, apparel, and athletic equipment receive continued emphasis asNIKE strives to produce products that help to enhance athletic performance,reduce injury, and maximize comfort.
In addition to NIKE’s own staff of specialists in the areas of biomechanics,chemistry, exercise physiology, engineering, industrial design, sustainability,and related fields, we also utilize research committees and advisory boardsmade up of athletes, coaches, trainers, equipment managers, orthopedists,podiatrists, and other experts who consult with us and review designs,materials, concepts for product and manufacturing process improvements,and compliance with product safety regulations around the world. Employee
athletes, athletes engaged under sports marketing contracts, and otherathletes wear-test and evaluate products during the design and developmentprocess.
As we continue to develop new technologies, NIKE is simultaneously focusedon the design of innovative products incorporating such technologiesthroughout our product categories. Using market intelligence and research,the various NIKE design teams identify opportunities to leverage newtechnologies in existing categories responding to consumer preferences. Theproliferation of NIKE AIR, Lunar, Shox, Free, Flywire, Dri-Fit, Flyknit, NIKE+,and NIKE Fuel technologies through Running, Basketball, Men’s Training,Women’s Training, and Sportswear, among others, typifies the Company’sdedication to designing innovative products.
Manufacturing
We are supplied by approximately 150 footwear factories located in 14countries. The largest single footwear factory accounted for approximately5% of total fiscal 2014 NIKE Brand footwear production. Virtually all of ourfootwear is manufactured outside of the United States by independentcontract manufacturers who often operate multiple factories. In fiscal 2014,contract factories in Vietnam, China, and Indonesia manufacturedapproximately 43%, 28%, and 25% of total NIKE Brand footwear,respectively. We also have manufacturing agreements with independentfactories in Argentina, Brazil, India, and Mexico to manufacture footwear forsale primarily within those countries. In fiscal 2014, five footwear contractmanufacturers each accounted for greater than 10% of fiscal 2014 footwearproduction, and in aggregate accounted for approximately 67% of NIKEBrand footwear production in fiscal 2014.
We are supplied by approximately 430 apparel factories located in 41countries. The largest single apparel factory accounted for approximately 7%of total fiscal 2014 NIKE Brand apparel production. Virtually all of our apparelis manufactured outside of the United States by independent contractmanufacturers who often operate multiple factories. In fiscal 2014, most ofthis apparel production occurred in China, Vietnam, Thailand, Indonesia,Sri Lanka, Pakistan, and Malaysia. In fiscal 2014, one apparel contractmanufacturer accounted for greater than 10% of fiscal 2014 apparel
production, and the top five contract manufacturers in aggregate accountedfor approximately 34% of NIKE Brand apparel production in fiscal 2014.
The principal materials used in our footwear products are natural andsynthetic rubber, plastic compounds, foam cushioning materials, nylon,leather, canvas, and polyurethane films used to make NIKE Air-Solecushioning components. During fiscal 2014, NIKE IHM, Inc., a wholly-ownedsubsidiary of NIKE, Inc., with facilities near Beaverton, Oregon and inSt. Louis, Missouri, as well as independent contractors in China and Vietnam,were our largest suppliers of the Air-Sole cushioning components used infootwear. The principal materials used in our apparel products are natural andsynthetic fabrics and threads (both virgin and recycled), specializedperformance fabrics designed to efficiently wick moisture away from thebody, retain heat, repel rain and/or snow, as well as plastic and metalhardware. NIKE’s independent contractors and suppliers buy raw materials inbulk for the manufacturing of our footwear, apparel, and equipment products.Most raw materials are available and purchased by those independentcontractors and suppliers in the countries where manufacturing takes place.NIKE’s independent contract manufacturers and suppliers have thus farexperienced little difficulty in satisfying raw material requirements for theproduction of our products.
NIKE, INC. 2014 Annual Report and Notice of Annual Meeting 49
FOR
M10
-K

PART I
Since 1972, Sojitz Corporation of America (“Sojitz America”), a largeJapanese trading company and the sole owner of our redeemable preferredstock, has performed significant import-export financing services for us.During fiscal 2014, Sojitz America provided financing and purchasing servicesfor NIKE Brand products sold in certain NIKE markets including Argentina,Uruguay, Canada, Brazil, India, Indonesia, the Philippines, Malaysia, SouthAfrica, and Thailand, excluding products produced and sold in the samecountry. Approximately 8% of NIKE Brand sales occurred in those countries.
Any failure of Sojitz America to provide these services or any failure of SojitzAmerica’s banks could disrupt our ability to acquire products from oursuppliers and to deliver products to our customers in those markets. Such adisruption could result in canceled orders that would adversely affect salesand profitability. However, we believe that any such disruption would beshort-term in duration due to the ready availability of alternative sources offinancing at competitive rates. Our current agreements with Sojitz Americaexpire on May 31, 2015.
International Operations and Trade
Our international operations and sources of supply are subject to the usualrisks of doing business abroad, such as possible revaluation of currencies,export and import duties, anti-dumping measures, quotas, safeguardmeasures, trade restrictions, restrictions on the transfer of funds, and, incertain parts of the world, political instability and terrorism. We have not, todate, been materially affected by any such risk, but cannot predict thelikelihood of such material effects occurring in the future.
In recent years, uncertain global and regional economic conditions haveaffected international trade and caused a rise in protectionist actions aroundthe world. These trends are affecting many global manufacturing and servicesectors, and the footwear and apparel industries, as a whole, are not immune.Companies in our industry are facing trade protectionism in many differentregions, and in nearly all cases we are working together with industry groupsto address trade issues and reduce the impact to the industry, whileobserving applicable competition laws. Notwithstanding our efforts, suchprotectionist measures, if implemented, could result in increases in the cost ofour products, which may in turn adversely affect our sales or profitability aswell as the imported footwear and apparel industry as a whole.
We monitor protectionist trends and developments throughout the world thatmay materially impact our industry, and we engage in administrative andjudicial processes to mitigate trade restrictions. In Brazil, we are actively
monitoring for dumping investigations against products from China and othercountries that may result in additional anti-dumping measures and couldaffect our industry. We are also monitoring for and advocating against otherimpediments that may increase customs clearance times for imports offootwear, apparel, and equipment. Moreover, with respect to traderestrictions targeting China, which represents an important sourcing andconsumer marketing country for us, we are working with a broad coalition ofglobal businesses and trade associations representing a wide variety ofsectors to help ensure that any legislation enacted and implemented(i) addresses legitimate and core concerns, (ii) is consistent with internationaltrade rules, and (iii) reflects and considers China’s domestic economy and theimportant role it has in the global economic community.
Where trade protection measures are implemented, we believe that we havethe ability to develop, over a period of time, adequate alternative sources ofsupply for the products obtained from our present suppliers. If eventsprevented us from acquiring products from our suppliers in a particularcountry, our operations could be temporarily disrupted and we couldexperience an adverse financial impact. However, we believe we could abateany such disruption, and that much of the adverse impact on supply would,therefore, be of a short-term nature, although alternate sources of supplymight not be as cost-effective and could have an ongoing adverse impact onprofitability.
Competition
The athletic footwear, apparel, and equipment industry is highly competitiveon a worldwide basis. We compete internationally with a significant number ofathletic and leisure footwear companies, athletic and leisure apparelcompanies, sports equipment companies, and large companies havingdiversified lines of athletic and leisure footwear, apparel, and equipment,including adidas, V.F. Corp., Puma, Li Ning, and Under Armour, amongothers. We also compete with a number of vertical retailers such as lululemonathletica and Uniqlo. The intense competition and the rapid changes intechnology and consumer preferences in the markets for athletic and leisurefootwear and apparel, and athletic equipment, constitute significant riskfactors in our operations.
NIKE is the largest seller of athletic footwear, apparel, and equipment in theworld. Important aspects of competition in this industry are:
• product quality; performance and reliability; new product innovation anddevelopment; and consumer price/value;
• consumer connection and affinity for brands and products, developedthrough marketing and promotion; customer support and service;identification with prominent and influential athletes, coaches, teams,colleges, and sports leagues who endorse our brands and use ourproducts; and active engagement through sponsored sporting events andclinics; and
• effective distribution of products, with attractive merchandising andpresentation at retail, both in store and online.
We believe that we are competitive in all of these areas.
Trademarks and Patents
We utilize trademarks on nearly all of our products and believe havingdistinctive marks that are readily identifiable is an important factor in creating amarket for our goods, in identifying our brands and the Company, and indistinguishing our goods from the goods of others. We consider our NIKE andSwoosh Design trademarks to be among our most valuable assets and wehave registered these trademarks in almost 170 jurisdictions. In addition, weown many other trademarks that we utilize in marketing our products. Weown common law rights in the trade dress of several significant shoe designsand elements. For certain trade dress, we have sought and obtained federaltrademark registrations.
NIKE has copyright protection in its design, graphics and other original works.When appropriate, we have sought registrations for this content.
NIKE owns patents, and has a patent license, facilitating its use of “Air”technologies. The “Air” process utilizes pressurized gas encapsulated inpolyurethane. Some of the early NIKE AIR patents have expired, which mayenable competitors to use certain types of similar technology. SubsequentNIKE AIR patents will not expire for several years.
We also file and maintain many U.S. and foreign utility patents, as well asmany U.S. and foreign design patents protecting components,manufacturing techniques, features, and industrial design used in variousathletic and leisure footwear, apparel, athletic equipment, digital devices, andgolf products. These patents expire at various times; and patents issued forapplications filed this calendar year in the United States will last until 2028 fordesign patents and until 2034 for utility patents.
50

PART I
We believe our success depends primarily upon our capabilities in design,research and development, production, and marketing rather than exclusivelyupon our patent position. However, we have followed a policy of filing patent
applications for the United States and select foreign countries on inventions,designs, and improvements that we deem valuable. We continue tovigorously protect our trademarks and patents against infringement.
Employees
As of May 31, 2014, we had approximately 56,500 employees worldwide,including retail and part-time employees. Management considers itsrelationship with employees to be excellent. None of our employees arerepresented by a union, except for certain employees in the EmergingMarkets geography, where local law requires those employees to berepresented by a trade union. Also, in some countries outside of the United
States, local laws require employee representation by works councils (whichmay be entitled to information and consultation on certain Companydecisions) or by organizations similar to a union. In certain Europeancountries, we are required by local law to enter into and/or comply withindustry-wide or national collective bargaining agreements. NIKE has neverexperienced a material interruption of operations due to labor disagreements.
Executive Officers of the Registrant
The executive officers of NIKE, Inc. as of July 18, 2014 are as follows:
Philip H. Knight, Chairman of the Board of Directors — Mr. Knight, 76, adirector since 1968, is a co-founder of NIKE and, except for the period fromJune 1983 through September 1984, served as its President from 1968 to1990 and from June 2000 to December 2004. Prior to 1968, Mr. Knight wasa certified public accountant with Price Waterhouse and Coopers & Lybrandand was an Assistant Professor of Business Administration at Portland StateUniversity.
Mark G. Parker, President and Chief Executive Officer — Mr. Parker, 58,was appointed President and Chief Executive Officer in January 2006. He hasbeen employed by NIKE since 1979 with primary responsibilities in productresearch, design and development, marketing, and brand management.Mr. Parker was appointed divisional Vice President in charge of productdevelopment in 1987, corporate Vice President in 1989, General Manager in1993, Vice President of Global Footwear in 1998, and President of the NIKEBrand in 2001.
David J. Ayre, Executive Vice President, Global Human Resources —Mr. Ayre, 54, joined NIKE as Vice President, Global Human Resources in2007. Prior to joining NIKE, he held a number of senior human resourcepositions with PepsiCo, Inc. since 1990, most recently as head of Talent andPerformance Rewards.
Donald W. Blair, Executive Vice President and Chief Financial Officer —Mr. Blair, 56, joined NIKE in November 1999. Prior to joining NIKE, he held anumber of financial management positions with PepsiCo, Inc., including VicePresident, Finance of Pepsi-Cola Asia, Vice President, Planning of PepsiCo’sPizza Hut Division, and Senior Vice President, Finance of The Pepsi BottlingGroup, Inc. Prior to joining PepsiCo, Mr. Blair was a certified publicaccountant with Deloitte, Haskins & Sells.
Trevor A. Edwards, President, NIKE Brand — Mr. Edwards, 51, joinedNIKE in 1992. He was appointed Marketing Manager, Strategic Accounts forFoot Locker in 1993, Director of Marketing for the Americas Region in 1995,Director of Marketing for Europe in 1997, Vice President, Marketing for theEurope, Middle East and Africa Region in 1999, and Vice President, U.S.Brand Marketing in 2000. Mr. Edwards was appointed corporate VicePresident, Global Brand Management in 2002, Vice President, Global Brandand Category Management in 2006 and President, NIKE Brand in 2013. Priorto NIKE, Mr. Edwards was with the Colgate-Palmolive Company.
Jeanne P. Jackson, President, Product and Merchandising —Ms. Jackson, 62, joined NIKE in 2009. She was appointed President, Direct
to Consumer in 2009 and President, Product and Merchandising in 2013.Ms. Jackson also served as a member of the NIKE, Inc. Board of Directorsfrom 2001 through 2009. She founded and served as Chief Executive Officerof MSP Capital, a private investment company, from 2002 to 2009.Ms. Jackson was Chief Executive Officer of Walmart.com from March 2000 toJanuary 2002. She was with Gap, Inc., as President and Chief ExecutiveOfficer of Banana Republic from 1995 to 2000, also serving as ChiefExecutive Officer of Gap, Inc. Direct from 1998 to 2000. Since 1978, she hasheld various retail management positions with Victoria’s Secret, The WaltDisney Company, Saks Fifth Avenue, and Federated Department Stores.
Hilary K. Krane, Executive Vice President, Chief Administrative Officer andGeneral Counsel — Ms. Krane, 50, joined NIKE as Vice President andGeneral Counsel in April 2010. In 2011, her responsibilities expanded and shebecame Vice President, General Counsel and Corporate Affairs. Ms. Kranewas appointed to Executive Vice President, Chief Administrative Officer andGeneral Counsel in 2013. Prior to joining NIKE, Ms. Krane was GeneralCounsel and Senior Vice President for Corporate Affairs at Levi Strauss & Co.from 2006 to 2010. From 1996 to 2006, she was a partner and assistantgeneral counsel at PricewaterhouseCoopers LLP.
Bernard F. Pliska, Vice President, Corporate Controller — Mr. Pliska, 52,joined NIKE as Corporate Controller in 1995. He was appointed VicePresident, Corporate Controller in 2003. Prior to NIKE, Mr. Pliska was withPrice Waterhouse from 1984 to 1995. Mr. Pliska is a certified publicaccountant.
John F. Slusher, Executive Vice President, Global Sports Marketing —Mr. Slusher, 45, has been employed by NIKE since 1998 with primaryresponsibilities in global sports marketing. Mr. Slusher was appointed Directorof Sports Marketing for the Asia Pacific and Americas Regions in 2006,divisional Vice President of Asia Pacific & Americas Sports Marketing inSeptember 2007, and Vice President, Global Sports Marketing in November2007. Prior to joining NIKE, Mr. Slusher was an attorney at the law firm ofO’Melveny & Myers from 1995 to 1998.
Eric D. Sprunk, Chief Operating Officer — Mr. Sprunk, 50, joined NIKE in1993. He was appointed Finance Director and General Manager of theAmericas Region in 1994, Finance Director for NIKE Europe in 1995, RegionalGeneral Manager of NIKE Europe Footwear in 1998, and Vice President &General Manager of the Americas Region in 2000. Mr. Sprunk was appointedVice President of Global Footwear in 2001, Vice President of Merchandisingand Product in 2009, and Chief Operating Officer in 2013. Prior to joiningNIKE, Mr. Sprunk was a certified public accountant with Price Waterhousefrom 1987 to 1993.
NIKE, INC. 2014 Annual Report and Notice of Annual Meeting 51
FOR
M10
-K

PART I
ITEM 1A. Risk FactorsSpecial Note Regarding Forward-Looking Statements andAnalyst Reports
Certain written and oral statements, other than purely historic information,including estimates, projections, statements relating to NIKE’s businessplans, objectives, and expected operating results, and the assumptions uponwhich those statements are based, made or incorporated by reference fromtime to time by NIKE or its representatives in this report, other reports, filingswith the SEC, press releases, conferences, or otherwise, are “forward-lookingstatements” within the meaning of the Private Securities Litigation Reform Actof 1995 and Section 21E of the Securities Exchange Act of 1934, asamended. Forward-looking statements include, without limitation, anystatement that may predict, forecast, indicate, or imply future results,performance, or achievements, and may contain the words “believe,”“anticipate,” “expect,” “estimate,” “project,” “will be,” “will continue,” “will likelyresult,” or words or phrases of similar meaning. Forward-looking statementsinvolve risks and uncertainties which may cause actual results to differmaterially from the forward-looking statements. The risks and uncertaintiesare detailed from time to time in reports filed by NIKE with the SEC, includingForms 8-K, 10-Q, and 10-K, and include, among others, the following:international, national, and local general economic and market conditions; thesize and growth of the overall athletic footwear, apparel, and equipmentmarkets; intense competition among designers, marketers, distributors, andsellers of athletic footwear, apparel, and equipment for consumers andendorsers; demographic changes; changes in consumer preferences;popularity of particular designs, categories of products, and sports; seasonaland geographic demand for NIKE products; difficulties in anticipating orforecasting changes in consumer preferences, consumer demand for NIKEproducts, and the various market factors described above; difficulties inimplementing, operating, and maintaining NIKE’s increasingly complexinformation systems and controls, including, without limitation, the systemsrelated to demand and supply planning and inventory control; interruptions indata and information technology systems; consumer data security;fluctuations and difficulty in forecasting operating results, including, withoutlimitation, the fact that advance futures orders may not be indicative of futurerevenues due to changes in shipment timing, the changing mix of futures andat-once orders, and discounts, order cancellations, and returns; the ability ofNIKE to sustain, manage, or forecast its growth and inventories; the size,timing, and mix of purchases of NIKE’s products; increases in the cost ofmaterials, labor, and energy used to manufacture products, new productdevelopment, and introduction; the ability to secure and protect trademarks,patents, and other intellectual property; product performance and quality;customer service; adverse publicity; the loss of significant customers orsuppliers; dependence on distributors and licensees; business disruptions;increased costs of freight and transportation to meet delivery deadlines;increases in borrowing costs due to any decline in NIKE’s debt ratings;changes in business strategy or development plans; general risks associatedwith doing business outside the United States, including, without limitation,exchange rate fluctuations, import duties, tariffs, quotas, political andeconomic instability, and terrorism; changes in government regulations; theimpact of, including business and legal developments relating to, climatechange; natural disasters; liability and other claims asserted against NIKE; theability to attract and retain qualified personnel; the effects of NIKE’s decisionto invest in or divest of businesses; and other factors referenced orincorporated by reference in this report and other reports.
The risks included here are not exhaustive. Other sections of this report mayinclude additional factors which could adversely affect NIKE’s business andfinancial performance. Moreover, NIKE operates in a very competitive andrapidly changing environment. New risk factors emerge from time to time andit is not possible for management to predict all such risk factors, nor can itassess the impact of all such risk factors on NIKE’s business or the extent towhich any factor, or combination of factors, may cause actual results to differmaterially from those contained in any forward-looking statements. Giventhese risks and uncertainties, investors should not place undue reliance onforward-looking statements as a prediction of actual results.
Investors should also be aware that while NIKE does, from time to time,communicate with securities analysts, it is against NIKE’s policy to disclose tothem any material non-public information or other confidential commercialinformation. Accordingly, shareholders should not assume that NIKE agreeswith any statement or report issued by any analyst irrespective of the contentof the statement or report. Furthermore, NIKE has a policy against issuing orconfirming financial forecasts or projections issued by others. Thus, to theextent that reports issued by securities analysts contain any projections,forecasts, or opinions, such reports are not the responsibility of NIKE.
Our products face intense competition.
NIKE is a consumer products company and the relative popularity of varioussports and fitness activities and changing design trends affect the demand forour products. The athletic footwear, apparel, and equipment industry is highlycompetitive in the United States and on a worldwide basis. We competeinternationally with a significant number of athletic and leisure footwearcompanies, athletic and leisure apparel companies, sports equipmentcompanies, and large companies having diversified lines of athletic and leisurefootwear, apparel, and equipment. We also compete with other companiesfor the production capacity of independent manufacturers that produce ourproducts.
Product offerings, technologies, marketing expenditures (includingexpenditures for advertising and endorsements), pricing, costs of production,and customer service are areas of intense competition. This, in addition torapid changes in technology and consumer preferences in the markets forathletic and leisure footwear and apparel, and athletic equipment, constitutesignificant risk factors in our operations. If we do not adequately and timelyanticipate and respond to our competitors, our costs may increase or theconsumer demand for our products may decline significantly.
Failure to maintain our reputation and brand image couldnegatively impact our business.
Our iconic brands have worldwide recognition, and our success depends onour ability to maintain and enhance our brand image and reputation.Maintaining, promoting, and growing our brands will depend on our designand marketing efforts, including advertising and consumer campaigns,product innovation, and product quality. Our commitment to productinnovation and quality and our continuing investment in design (includingmaterials) and marketing may not have the desired impact on our brandimage and reputation. We could be adversely impacted if we fail to achieveany of these objectives or if the reputation or image of any of our brands istarnished or receives negative publicity. In addition, adverse publicity aboutregulatory or legal action against us could damage our reputation and brandimage, undermine consumer confidence in us and reduce long-term demandfor our products, even if the regulatory or legal action is unfounded or notmaterial to our operations.
In addition, our success in maintaining, extending, and expanding our brandimage depends on our ability to adapt to a rapidly changing mediaenvironment, including our increasing reliance on social media and onlinedissemination of advertising campaigns. Negative posts or comments aboutus on social networking websites could seriously damage our reputation andbrand image. If we do not maintain, extend, and expand our brand image,then our product sales, financial condition, and results of operations could bematerially and adversely affected.
If we are unable to anticipate consumer preferences anddevelop new products, we may not be able to maintain orincrease our revenues and profits.
Our success depends on our ability to identify, originate, and define producttrends as well as to anticipate, gauge, and react to changing consumerdemands in a timely manner. However, lead times for many of our productsmay make it more difficult for us to respond rapidly to new or changingproduct trends or consumer preferences. All of our products are subject to
52

PART I
changing consumer preferences that cannot be predicted with certainty. Ournew products may not receive consumer acceptance as consumerpreferences could shift rapidly to different types of performance products oraway from these types of products altogether, and our future successdepends in part on our ability to anticipate and respond to these changes. Ifwe fail to anticipate accurately and respond to trends and shifts in consumerpreferences by adjusting the mix of existing product offerings, developing newproducts, designs, styles, and categories, and influencing sports and fitnesspreferences through aggressive marketing, we could experience lower sales,excess inventories, or lower profit margins, any of which could have anadverse effect on our results of operations and financial condition. In addition,we market our products globally through a diverse spectrum of advertisingand promotional programs and campaigns, including social media and onlineadvertising. If we do not successfully market our products or if advertising andpromotional costs increase, these factors could have an adverse effect on ourbusiness, financial condition, and results of operations.
We rely on technical innovation and high-quality productsto compete in the market for our products.
Technical innovation and quality control in the design and manufacturingprocess of footwear, apparel, and athletic equipment is essential to thecommercial success of our products. Research and development plays a keyrole in technical innovation. We rely upon specialists in the fields ofbiomechanics, chemistry, exercise physiology, engineering, industrial design,sustainability, and related fields, as well as research committees and advisoryboards made up of athletes, coaches, trainers, equipment managers,orthopedists, podiatrists, and other experts to develop and test cutting edgeperformance products. While we strive to produce products that help toenhance athletic performance, reduce injury, and maximize comfort, if we failto introduce technical innovation in our products, consumer demand for ourproducts could decline, and if we experience problems with the quality of ourproducts, we may incur substantial expense to remedy the problems.
Failure to continue to obtain high quality endorsers of ourproducts could harm our business.
We establish relationships with professional athletes, sports teams, andleagues to develop, evaluate and promote our products, as well as establishproduct authenticity with consumers. If certain endorsers were to stop usingour products contrary to their endorsement agreements, our business couldbe adversely affected. In addition, actions taken by athletes, teams, orleagues associated with our products that harm the reputations of thoseathletes, teams, or leagues, could also seriously harm our brand image withconsumers and, as a result, could have an adverse effect on our sales andfinancial condition. In addition, poor performance by our endorsers, a failure tocontinue to correctly identify promising athletes to use and endorse ourproducts, or a failure to enter into cost-effective endorsement arrangementswith prominent athletes and sports organizations could adversely affect ourbrand, sales, and profitability.
Currency exchange rate fluctuations could result in lowerrevenues, higher costs, and decreased margins andearnings.
A majority of our products are manufactured and sold outside of the UnitedStates. As a result, we conduct purchase and sale transactions in variouscurrencies, which increases our exposure to fluctuations in foreign currencyexchange rates globally. Our international revenues and expenses generallyare derived from sales and operations in foreign currencies, and theserevenues and expenses could be affected by currency fluctuations, includingamounts recorded in foreign currencies and translated into U.S. Dollars forconsolidated financial reporting, as weakening of foreign currencies relative tothe U.S. Dollar adversely affects the U.S. Dollar value of the Company’sforeign currency-denominated sales and earnings. Currency exchange ratefluctuations could also disrupt the business of the independent manufacturersthat produce our products by making their purchases of raw materials moreexpensive and more difficult to finance. Foreign currency fluctuations haveadversely affected, and could continue to have an adverse effect on ourresults of operations and financial condition.
We may hedge certain foreign currency exposures to lessen and delay, butnot to completely eliminate, the effects of foreign currency fluctuations on ourfinancial results. Since the hedging activities are designed to lessen volatility,they not only reduce the negative impact of a stronger U.S. Dollar or othertrading currency, but they also reduce the positive impact of a weakerU.S. Dollar or other trading currency. Our future financial results could besignificantly affected by the value of the U.S. Dollar in relation to the foreigncurrencies in which we conduct business. The degree to which our financialresults are affected for any given time period will depend in part upon ourhedging activities.
Global economic conditions could have a material adverseeffect on our business, operating results, and financialcondition.
Although the global economy has been showing signs of improvement, itsuncertain state continues to impact businesses around the world, and mostacutely in emerging markets and developing economies. Continuinguncertainty in the global capital and credit markets have led to fluctuations inthe availability of business credit and capital liquidity, a contraction ofconsumer credit, business failures, sustained unemployment at historicallyhigh levels, and declines in consumer confidence and spending in many partsof the world. If global economic and financial market conditions do notimprove or deteriorate, the following factors could have a material adverseeffect on our business, operating results, and financial condition:
• Slower consumer spending may result in reduced demand for ourproducts, reduced orders from retailers for our products, ordercancellations, lower revenues, higher discounts, increased inventories, andlower gross margins.
• In the future, we may be unable to access financing in the credit and capitalmarkets at reasonable rates in the event we find it desirable to do so.
• We conduct transactions in various currencies, which increase ourexposure to fluctuations in foreign currency exchange rates relative to theU.S. Dollar. Continued volatility in the markets and exchange rates forforeign currencies and contracts in foreign currencies could have asignificant impact on our reported financial results and condition.
• Continued volatility in the availability and prices for commodities and rawmaterials we use in our products and in our supply chain (such as cotton orpetroleum derivatives) could have a material adverse effect on our costs,gross margins, and profitability.
• If retailers of our products experience declining revenues, or experiencedifficulty obtaining financing in the capital and credit markets to purchaseour products, this could result in reduced orders for our products, ordercancellations, late retailer payments, extended payment terms, higheraccounts receivable, reduced cash flows, greater expense associated withcollection efforts, and increased bad debt expense.
• If retailers of our products experience severe financial difficulty, some maybecome insolvent and cease business operations, which could negativelyimpact the sale of our products to consumers.
• If contract manufacturers of our products or other participants in our supplychain experience difficulty obtaining financing in the capital and creditmarkets to purchase raw materials or to finance capital equipment andother general working capital needs, it may result in delays or non-delivery ofshipments of our products.
Our business is affected by seasonality, which could resultin fluctuations in our operating results.
We experience moderate fluctuations in aggregate sales volume during theyear. Historically, revenues in the first and fourth fiscal quarters have slightlyexceeded those in the second and third fiscal quarters. However, the mix ofproduct sales may vary considerably from time to time as a result of changesin seasonal and geographic demand for particular types of footwear, apparel,and equipment. In addition, our customers may cancel orders, changedelivery schedules, or change the mix of products ordered with minimalnotice. As a result, we may not be able to accurately predict our quarterly
NIKE, INC. 2014 Annual Report and Notice of Annual Meeting 53
FOR
M10
-K

PART I
sales. Accordingly, our results of operations are likely to fluctuate significantlyfrom period to period. This seasonality, along with other factors that arebeyond our control, including general economic conditions, changes inconsumer preferences, weather conditions, availability of import quotas, andcurrency exchange rate fluctuations, could adversely affect our business andcause our results of operations to fluctuate. Our operating margins are alsosensitive to a number of additional factors that are beyond our control,including manufacturing and transportation costs, shifts in product sales mix,and geographic sales trends, all of which we expect to continue. Results ofoperations in any period should not be considered indicative of the results tobe expected for any future period.
Futures orders may not be an accurate indication of ourfuture revenues.
We make substantial use of our futures ordering program, which allowsretailers to order five to six months in advance of delivery with the commitmentthat their orders will be delivered within a set period of time at a fixed price.Our futures ordering program allows us to minimize the amount of productswe hold in inventory, purchasing costs, the time necessary to fill customerorders, and the risk of non-delivery. We report changes in futures orders in ourperiodic financial reports. Although we believe futures orders are an importantindicator of our future revenues, reported futures orders are not necessarilyindicative of our expectation of changes in revenues for any future period. Thisis because the mix of orders can shift between futures and at-once orders. Inaddition, foreign currency exchange rate fluctuations, order cancellations,shipping timing, returns, and discounts can cause differences in thecomparisons between futures orders and actual revenues. Moreover, asignificant portion of our revenue is not derived from futures orders, includingat-once and closeout sales of NIKE Brand footwear and apparel, sales ofNIKE Brand equipment, sales from our Direct to Consumer operations, andsales from our Converse, Hurley, and NIKE Golf businesses.
Our futures ordering program does not prevent excessinventories or inventory shortages, which could result indecreased operating margins, cash flows and harm to ourbusiness.
We purchase products from manufacturers outside of our futures orderingprogram and in advance of customer orders, which we hold in inventory andresell to customers. There is a risk we may be unable to sell excess productsordered from manufacturers. Inventory levels in excess of customer demandmay result in inventory write-downs, and the sale of excess inventory atdiscounted prices could significantly impair our brand image and have anadverse effect on our operating results and financial condition. Conversely, ifwe underestimate consumer demand for our products or if our manufacturersfail to supply products we require at the time we need them, we mayexperience inventory shortages. Inventory shortages might delay shipmentsto customers, negatively impact retailer and distributor relationships, anddiminish brand loyalty.
The difficulty in forecasting demand also makes it difficult to estimate ourfuture results of operations and financial condition from period to period. Afailure to accurately predict the level of demand for our products couldadversely affect our net revenues and net income, and we are unlikely toforecast such effects with any certainty in advance.
We may be adversely affected by the financial health of ourretailers.
We extend credit to our customers based on an assessment of a customer’sfinancial condition, generally without requiring collateral. To assist in thescheduling of production and the shipping of seasonal products, we offercustomers the ability to place orders five to six months ahead of deliveryunder our futures ordering program. These advance orders may be canceled,and the risk of cancellation may increase when dealing with financially ailingretailers or retailers struggling with economic uncertainty. In the past, somecustomers have experienced financial difficulties, which have had an adverseeffect on our business. When the retail economy weakens, retailers may bemore cautious with orders. A slowing economy in our key markets couldadversely affect the financial health of our customers, which in turn could have
an adverse effect on our results of operations and financial condition. Inaddition, product sales are dependent in part on high quality merchandisingand an appealing store environment to attract consumers, which requirescontinuing investments by retailers. Retailers that experience financialdifficulties may fail to make such investments or delay them, resulting in lowersales and orders for our products.
Consolidation of retailers or concentration of retail marketshare among a few retailers may increase and concentrateour credit risk, and impair our ability to sell products.
The athletic footwear, apparel, and equipment retail markets in somecountries are dominated by a few large athletic footwear, apparel, andequipment retailers with many stores. These retailers have in the pastincreased their market share and may continue to do so in the future byexpanding through acquisitions and construction of additional stores. Thesesituations concentrate our credit risk with a relatively small number of retailers,and, if any of these retailers were to experience a shortage of liquidity, it wouldincrease the risk that their outstanding payables to us may not be paid. Inaddition, increasing market share concentration among one or a few retailersin a particular country or region increases the risk that if any one of themsubstantially reduces their purchases of our products, we may be unable tofind a sufficient number of other retail outlets for our products to sustain thesame level of sales and revenues.
Our Direct to Consumer operations have required and willcontinue to require a substantial investment andcommitment of resources, and are subject to numerousrisks and uncertainties.
Our Direct to Consumer stores have required substantial fixed investment inequipment and leasehold improvements, information systems, inventory, andpersonnel. We have entered into substantial operating lease commitments forretail space. Certain stores have been designed and built to serve as high-profile venues to promote brand awareness and marketing activities.Because of their unique design elements, locations, and size, these storesrequire substantially more investment than other stores. Due to the high fixed-cost structure associated with our Direct to Consumer operations, a decline insales, or the closure or poor performance of individual or multiple stores couldresult in significant lease termination costs, write-offs of equipment andleasehold improvements, and employee-related costs.
Many factors unique to retail operations, some of which are beyond theCompany’s control, pose risks and uncertainties. Risks include, but are notlimited to: credit card fraud; mismanagement of existing retail channelpartners; and inability to manage costs associated with store constructionand operation. In addition, extreme weather conditions in the areas in whichour stores are located could adversely affect our business. Risks specific toour e-commerce business also include diversion of sales from our and ourretailer’s brick and mortar stores, difficulty in recreating the in-storeexperience through direct channels, and liability for online content. Our failureto successfully respond to these risks might adversely affect sales in our e-commerce business, as well as damage our reputation and brands.
Failure to adequately protect or enforce our intellectualproperty rights could adversely affect our business.
We utilize trademarks on nearly all of our products and believe that havingdistinctive marks that are readily identifiable is an important factor in creating amarket for our goods, in identifying us, and in distinguishing our goods fromthe goods of others. We consider our NIKE and Swoosh Design trademarksto be among our most valuable assets and we have registered thesetrademarks in almost 170 jurisdictions. In addition, we own many othertrademarks that we utilize in marketing our products and services.
We believe that our trademarks, patents, trade secrets, and other intellectualproperty rights are important to our brand, our success, and our competitiveposition. We periodically discover products that are counterfeit reproductionsof our products or that otherwise infringe on our intellectual property rights. Ifwe are unsuccessful in challenging a party’s products on the basis of tradesecret misappropriation or trademark, copyright, design patent, utility patent,
54

PART I
or other intellectual property infringement, continued sales of these productscould adversely affect our sales and our brand and result in the shift ofconsumer preference away from our products.
The actions we take to establish and protect trademarks, copyrights, tradesecrets, patents, and other intellectual property rights may not be adequate toprevent imitation of our products by others or to prevent others from seekingto block sales of our products as violations of proprietary rights.
We may be subject to liability if third parties successfully claim that we infringeon their trademarks, copyrights, patents, or other intellectual property rights.Defending infringement claims could be expensive and time-consuming andmight result in our entering into costly license agreements. We also may besubject to significant damages or injunctions against development, use,importation, and/or sale of certain products.
We take various actions to prevent confidential information from unauthorizeduse and/or disclosure. Such actions include contractual measures such asentering into non-disclosure agreements and providing confidentialinformation awareness training. Our controls and efforts to preventunauthorized use and/or disclosure of confidential information might notalways be effective. Confidential information that is related to businessstrategy, new technologies, mergers and acquisitions, unpublished financialresults, or personal data could be prematurely or inadvertently used and/ordisclosed, resulting in a loss of reputation, or a decline in our stock price, or anegative impact on our market position, and could lead to damages, fines,penalties, or injunctions.
In addition, the laws of certain foreign countries may not protect or allowenforcement of intellectual property rights to the same extent as the laws ofthe United States. We may face significant expenses and liability in connectionwith the protection of our intellectual property rights outside the United States,and if we are unable to successfully protect our rights or resolve intellectualproperty conflicts with others, our business or financial condition may beadversely affected.
We are subject to data security and privacy risks that couldnegatively affect our results, operations or reputation.
Hackers and data thieves are increasingly sophisticated and operate large-scale and complex automated attacks. Any breach of our network may resultin the loss of valuable business data, misappropriation of our consumers’ oremployees’ personal information, or a disruption of our business, which couldgive rise to unwanted media attention, materially damage our customerrelationships and reputation, and result in lost sales, fines, or lawsuits.
In addition, we must comply with increasingly complex and rigorousregulatory standards enacted to protect business and personal data. Anyfailure to comply with these regulatory standards could subject us to legal andreputational risks. Misuse of or failure to secure personal information couldalso result in violation of data privacy laws and regulations, proceedingsagainst the Company by governmental entities or others, damage to ourreputation and credibility, and could have a negative impact on revenues andprofits.
Failure of our contractors or our licensees’ contractors tocomply with our code of conduct, local laws, and otherstandards could harm our business.
We work with hundreds of contractors outside of the United States tomanufacture our products, and we also have license agreements that permitunaffiliated parties to manufacture or contract for the manufacture of productsusing our intellectual property. We require the contractors that directlymanufacture our products and our licensees that make products using ourintellectual property (including, indirectly, their contract manufacturers) tocomply with a code of conduct and other environmental, health, and safetystandards for the benefit of workers. We also require these contractors tocomply with applicable standards for product safety. Notwithstanding theircontractual obligations, from time to time contractors may not comply withsuch standards or applicable local law or our licensees may fail to enforcesuch standards or applicable local law on their contractors. Significant orcontinuing noncompliance with such standards and laws by one or more
contractors could harm our reputation or result in a product recall and, as aresult, could have an adverse effect on our sales and financial condition.
Our international operations involve inherent risks whichcould result in harm to our business.
Virtually all of our athletic footwear and apparel is manufactured outside of theUnited States, and the majority of our products are sold outside of the UnitedStates. Accordingly, we are subject to the risks generally associated withglobal trade and doing business abroad, which include foreign laws andregulations, varying consumer preferences across geographic regions,political unrest, disruptions or delays in cross-border shipments, and changesin economic conditions in countries in which we manufacture or sell products.In addition, disease outbreaks, terrorist acts, and military conflict haveincreased the risks of doing business abroad. These factors, among others,could affect our ability to manufacture products or procure materials, ourability to import products, our ability to sell products in international markets,and our cost of doing business. If any of these or other factors make theconduct of business in a particular country undesirable or impractical, ourbusiness could be adversely affected. In addition, many of our importedproducts are subject to duties, tariffs, or quotas that affect the cost andquantity of various types of goods imported into the United States and othercountries. Any country in which our products are produced or sold mayeliminate, adjust, or impose new quotas, duties, tariffs, safeguard measures,anti-dumping duties, cargo restrictions to prevent terrorism, restrictions onthe transfer of currency, climate change legislation, product safetyregulations, or other charges or restrictions, any of which could have anadverse effect on our results of operations and financial condition.
Changes in tax laws and unanticipated tax liabilities couldadversely affect our effective income tax rate andprofitability.
We are subject to income taxes in the United States and numerous foreignjurisdictions. We earn a substantial portion of our income in foreign countries.If our capital or financing needs in the United States require us to repatriateearnings from foreign jurisdictions above our current levels, our effectiveincome tax rates for the affected periods could be negatively impacted.Current economic and political conditions make tax rules in any jurisdiction,including the United States, subject to significant change. There have beenproposals to reform U.S. and foreign tax laws that could significantly impacthow U.S. multinational corporations are taxed on foreign earnings. Althoughwe cannot predict whether or in what form these proposals will pass, severalof the proposals considered, if enacted into law, could have an adverseimpact on our income tax expense and cash flows.
Our effective income tax rate in the future could be adversely affected by anumber of factors, including changes in the mix of earnings in countries withdiffering statutory tax rates, changes in the valuation of deferred tax assetsand liabilities, changes in tax laws, the outcome of income tax audits invarious jurisdictions around the world, and any repatriation of non-U.S.earnings for which we have not previously provided for U.S. taxes.
We and our subsidiaries are engaged in a number of intercompanytransactions across multiple tax jurisdictions. Although we believe that thesetransactions reflect the accurate economic allocation of profit and that theproper transfer pricing documentation is in place, the profit allocation andtransfer pricing terms and conditions (required to be arm’s length) may bescrutinized by local tax authorities during an audit and any resulting changesmay impact our mix of earnings in countries with differing statutory tax rates.
Portions of our operations are subject to a reduced tax rate or are free of taxunder various tax holidays and rulings that expire in whole or in part from timeto time. These tax holidays and rulings may be extended when certainconditions are met, or terminated if certain conditions are not met. If the taxholidays and rulings are not extended, or if we fail to satisfy the conditions ofthe reduced tax rate, then our effective tax rate would increase in the future.
We are also subject to the examination of our tax returns by the InternalRevenue Service and other tax authorities. We regularly assess all of thesematters to determine the adequacy of our tax provision, which is subject tosignificant discretion. Although we believe our tax provisions are adequate,
NIKE, INC. 2014 Annual Report and Notice of Annual Meeting 55
FOR
M10
-K

PART I
the final determination of tax audits and any related disputes could bematerially different from our historical income tax provisions and accruals. Theresults of audits or related disputes could have an adverse effect on ourfinancial statements for the period or periods for which the applicable finaldeterminations are made.
If one or more of our counterparty financial institutionsdefault on their obligations to us or fail, we may incursignificant losses.
As part of our hedging activities, we enter into transactions involving derivativefinancial instruments, which may include forward contracts, commodityfutures contracts, option contracts, collars, and swaps with various financialinstitutions. In addition, we have significant amounts of cash, cashequivalents, and other investments on deposit or in accounts with banks orother financial institutions in the United States and abroad. As a result, we areexposed to the risk of default by or failure of counterparty financial institutions.The risk of counterparty default or failure may be heightened during economicdownturns and periods of uncertainty in the financial markets. If one of ourcounterparties were to become insolvent or file for bankruptcy, our ability torecover losses incurred as a result of default or our assets that are depositedor held in accounts with such counterparty may be limited by thecounterparty’s liquidity or the applicable laws governing the insolvency orbankruptcy proceedings. In the event of default or failure of one or more of ourcounterparties, we could incur significant losses, which could negativelyimpact our results of operations and financial condition.
We rely on a concentrated source base of contractmanufacturers to supply a significant portion of ourfootwear products.
NIKE is supplied by approximately 150 footwear factories located in 14countries. We do not own or operate any of our own manufacturing facilitiesand depend upon independent contract manufacturers to manufacture all ofthe products we sell. In fiscal 2014, five footwear contract manufacturerseach accounted for greater than 10% of fiscal 2014 footwear production, andin aggregate accounted for approximately 67% of NIKE Brand footwearproduction in fiscal 2014. Our ability to meet our customers’ needs dependson our ability to maintain a steady supply of products from our independentcontract manufacturers. If one or more of our significant suppliers were tosever their relationship with us or significantly alter the terms of ourrelationship, we may not be able to obtain replacement products in a timelymanner, which could have a material adverse effect on our sales, financialcondition, or results of operations. Additionally, if any of our primary contractmanufacturers fail to make timely shipments, do not meet our qualitystandards, or otherwise fail to deliver us product in accordance with our plans,there could be a material adverse effect on our results of operations.
Our products are subject to risks associated with overseassourcing, manufacturing, and financing.
The principal materials used in our apparel products — natural and syntheticfabrics and threads, specialized performance fabrics designed to efficientlywick moisture away from the body, retain heat, or repel rain and/or snow aswell as plastic and metal hardware — are available in countries where ourmanufacturing takes place. The principal materials used in our footwearproducts — natural and synthetic rubber, plastic compounds, foamcushioning materials, nylon, leather, canvas, and polyurethane films — arealso locally available to manufacturers. Both our apparel and footwearproducts are dependent upon the ability of our unaffiliated contractmanufacturers to locate, train, and employ adequate personnel. NIKEcontractors and suppliers buy raw materials in bulk and are subject to wagerates that are oftentimes regulated by the governments of the countries inwhich our products are manufactured.
There could be a significant disruption in the supply of fabrics or raw materialsfrom current sources or, in the event of a disruption, our contractmanufacturers might not be able to locate alternative suppliers of materials ofcomparable quality at an acceptable price, or at all. Further, our unaffiliatedcontract manufacturers have experienced and may continue to experience inthe future, unexpected increases in work wages, whether government
mandated or otherwise. In addition, we cannot be certain that our unaffiliatedmanufacturers will be able to fill our orders in a timely manner. If weexperience significant increases in demand, or reductions in the availability ofmaterials, or need to replace an existing manufacturer, there can be noassurance that additional supplies of fabrics or raw materials or additionalmanufacturing capacity will be available when required on terms that areacceptable to us, or at all, or that any supplier or manufacturer would allocatesufficient capacity to us in order to meet our requirements. In addition, even ifwe are able to expand existing or find new manufacturing or sources ofmaterials, we may encounter delays in production and added costs as aresult of the time it takes to train suppliers and manufacturers in our methods,products, quality control standards, and labor, health, and safety standards.Any delays, interruption, or increased costs in labor or wages, or the supply ofmaterials or manufacture of our products could have an adverse effect on ourability to meet retail customer and consumer demand for our products andresult in lower revenues and net income both in the short- and long- term.
Because independent manufacturers manufacture a majority of our productsoutside of our principal sales markets, our products must be transported bythird parties over large geographic distances. Delays in the shipment ordelivery of our products due to the availability of transportation, workstoppages, port strikes, infrastructure congestion, or other factors, and costsand delays associated with consolidating or transitioning betweenmanufacturers, could adversely impact our financial performance. In addition,manufacturing delays or unexpected demand for our products may require usto use faster, but more expensive, transportation methods such as air freight,which could adversely affect our profit margins. The cost of oil is a significantcomponent in manufacturing and transportation costs, so increases in theprice of petroleum products can adversely affect our profit margins.
In addition, Sojitz America performs significant import-export financing servicesfor the Company. During fiscal 2014, Sojitz America provided financing andpurchasing services for NIKE Brand products sold in certain NIKE marketsincluding Argentina, Uruguay, Canada, Brazil, India, Indonesia, the Philippines,Malaysia, South Africa, and Thailand (collectively the “Sojitz Markets”),excluding products produced and sold in the same country. Any failure of SojitzAmerica to provide these services or any failure of Sojitz America’s banks coulddisrupt our ability to acquire products from our suppliers and to deliverproducts to our customers in the Sojitz Markets. Such a disruption could resultin canceled orders that would adversely affect sales and profitability.
Our success depends on our global distribution facilities.
We distribute our products to customers directly from the factory and throughdistribution centers located throughout the world. Our ability to meetcustomer expectations, manage inventory, complete sales, and achieveobjectives for operating efficiencies and growth, particularly in emergingmarkets, depends on the proper operation of our distribution facilities, thedevelopment or expansion of additional distribution capabilities, and thetimely performance of services by third parties (including those involved inshipping product to and from our distribution facilities). Our distributionfacilities could be interrupted by information technology problems anddisasters such as earthquakes or fires. Any significant failure in our distributionfacilities could result in an adverse effect on our business. We maintainbusiness interruption insurance, but it may not adequately protect us fromadverse effects that could be caused by significant disruptions in ourdistribution facilities.
We rely significantly on information technology to operateour business, including our supply chain and retailoperations, and any failure, inadequacy, or interruption ofthat technology could harm our ability to effectivelyoperate our business.
We are heavily dependent on information technology systems and networks,including the Internet and third-party hosted services (“information technologysystems”), across our supply chain, including product design, production,forecasting, ordering, manufacturing, transportation, sales, and distribution,as well as for processing financial information for external and internalreporting purposes, retail operations, and other business activities. Our abilityto effectively manage and maintain our inventory and to ship products to
56
PART I
customers on a timely basis depends significantly on the reliability of theseinformation technology systems. Over a number of years, we haveimplemented information technology systems in all of the geographicalregions in which we operate. Our work to integrate and enhance thesesystems and related processes in our global operations is ongoing. The failureof these systems to operate effectively or problems with transitioning toupgraded or replacement systems could cause delays in product fulfillmentand reduced efficiency of our operations, could require significant capitalinvestments to remediate the problem, and may have an adverse effect onour results of operations and financial condition.
We also use information technology systems to process financial informationand results of operations for internal reporting purposes and to comply withregulatory financial reporting, legal, and tax requirements. If our informationtechnology systems suffer severe damage, disruption, or shutdown and ourbusiness continuity plans do not effectively resolve the issues in a timelymanner, we could experience delays in reporting our financial results, whichcould result in lost revenues and profits, as well as reputational damage.Furthermore, we depend on information technology systems and personaldata collection and use for digital marketing, digital commerce, and themarketing and use of our Digital Sport products. We also engage in electroniccommunications throughout the world between and among our employeesas well as with other third parties, including customers, suppliers, vendors,and consumers. Our information technology systems are critical to many ofour operating activities and our business processes and may be negativelyimpacted by any service interruption or shutdown.
The market for prime real estate is competitive.
Our ability to effectively obtain real estate to open new retail stores andotherwise conduct our operations, both domestically and internationally,depends on the availability of real estate that meets our criteria for traffic,square footage, co-tenancies, lease economics, demographics, and otherfactors. We also must be able to effectively renew our existing real estateleases. In addition, from time to time, we seek to downsize, consolidate,reposition, or close some of our real estate locations, which may requiremodification of an existing lease. Failure to secure adequate new locations orsuccessfully modify leases for existing locations, or failure to effectivelymanage the profitability of our existing fleet of retail stores, could have anadverse effect on our operating results and financial condition.
Additionally, the economic environment may at times make it difficult todetermine the fair market rent of real estate properties domestically andinternationally. This could impact the quality of our decisions to exercise leaseoptions at previously negotiated rents and to renew expiring leases atnegotiated rents. Any adverse effect on the quality of these decisions couldimpact our ability to retain real estate locations adequate to meet our targetsor efficiently manage the profitability of our existing fleet of stores, which couldhave an adverse effect on our operating results and financial condition.
Extreme weather conditions and natural disasters couldnegatively impact our operating results and financialcondition.
Extreme weather conditions in the areas in which our retail stores, suppliers,customers, and vendors are located could adversely affect our operatingresults and financial condition. Moreover, natural disasters such asearthquakes, hurricanes, and tsunamis, whether occurring in the UnitedStates or abroad, and their related consequences and effects, includingenergy shortages and public health issues, could disrupt our operations, theoperations of our vendors and other suppliers, or result in economic instabilitythat may negatively impact our operating results and financial condition.
Our financial results may be adversely affected ifsubstantial investments in businesses and operations failto produce expected returns.
From time to time, we may invest in business infrastructure, new businesses,product offering and manufacturing innovation, and expansion of existingbusinesses, such as our retail operations, which require substantial cashinvestments and management attention. We believe cost-effectiveinvestments are essential to business growth and profitability. However,significant investments are subject to typical risks and uncertainties inherent in
developing a new business or expanding an existing business. The failure ofany significant investment to provide expected returns or profitability couldhave a material adverse effect on our financial results and divert managementattention from more profitable business operations.
We are subject to periodic litigation and other regulatoryproceedings, which could result in unexpected expense oftime and resources.
From time to time we are called upon to defend ourselves against lawsuitsand regulatory actions relating to our business. Due to the inherentuncertainties of litigation and regulatory proceedings, we cannot accuratelypredict the ultimate outcome of any such proceedings. An unfavorableoutcome could have an adverse impact on our business, financial conditionand results of operations. In addition, any significant litigation in the future,regardless of its merits, could divert management’s attention from ouroperations and result in substantial legal fees.
We depend on key personnel, the loss of whom wouldharm our business.
Our future success will depend in part on the continued service of keyexecutive officers and personnel. The loss of the services of any key individualcould harm our business. Our future success also depends on our ability torecruit, retain, and motivate our personnel sufficiently, both to maintain ourcurrent business and to execute our strategic initiatives. Competition foremployees in our industry is intense and we may not be successful inattracting and retaining such personnel.
The sale of a large number of shares held by our Chairmancould depress the market price of our common stock.
As of June 30, 2014, Philip H. Knight, Co-founder and Chairman of our Boardof Directors, beneficially owned more than 75.1% of our Class A CommonStock. If on June 30, 2014 all of his Class A Common Stock were convertedinto Class B Common Stock, Mr. Knight would have owned more than16.2% of our Class B Common Stock. These shares are available for resale,subject to the requirements of the U.S. securities laws. The sale or prospect ofthe sale of a substantial number of these shares could have an adverse effecton the market price of our common stock.
Changes in our credit ratings or macroeconomicconditions may affect our liquidity, increasing borrowingcosts and limiting our financing options.
Our long-term debt is currently rated investment grade by Standard & Poor’sand Moody’s Investors Service. If our credit ratings are lowered, borrowingcosts for future long-term debt or short-term credit facilities may increase andour financing options, including our access to the unsecured credit market,could be limited. We may also be subject to restrictive covenants that wouldreduce our flexibility. In addition, macroeconomic conditions, such asincreased volatility or disruption in the credit markets, could adversely affectour ability to refinance existing debt or obtain additional financing to supportoperations or to fund new initiatives.
Anti-takeover provisions may impair an acquisition of theCompany or reduce the price of our common stock.
There are provisions of our articles of incorporation and Oregon law that areintended to protect shareholder interests by providing the Board of Directorsa means to attempt to deny coercive takeover attempts or to negotiate with apotential acquirer in order to obtain more favorable terms. Such provisionsinclude a control share acquisition statute, a freeze-out statute, two classes ofstock that vote separately on certain issues, and the fact that holders ofClass A Common Stock elect three-quarters of the Board of Directorsrounded down to the next whole number. However, such provisions coulddiscourage, delay or prevent an unsolicited merger, acquisition, or otherchange in control of our company that some shareholders might believe to bein their best interests or in which shareholders might receive a premium fortheir common stock over the prevailing market price. These provisions couldalso discourage proxy contests for control of the Company.
NIKE, INC. 2014 Annual Report and Notice of Annual Meeting 57
FOR
M10
-K

PART I
We may fail to meet market expectations, which couldcause the price of our stock to decline.
Our Class B Common Stock is traded publicly, and at any given time varioussecurities analysts follow our financial results and issue reports on us. Thesereports include information about our historical financial results as well asanalysts’ estimates of our future performance. Analysts’ estimates are basedupon their own opinions and are often different from our estimates or
expectations. If our operating results are below the estimates or expectationsof public market analysts and investors, our stock price could decline. In thepast, securities class action litigation has been brought against NIKE andother companies following a decline in the market price of their securities. Ifour stock price is volatile, we may become involved in this type of litigation inthe future. Any litigation could result in substantial costs and a diversion ofmanagement’s attention and resources that are needed to successfully runour business.
58

PART I
ITEM 1B. Unresolved Staff CommentsNot applicable.
ITEM 2. PropertiesThe following is a summary of principal properties owned or leased by NIKE.
The NIKE World Campus, owned by NIKE and located near Beaverton,Oregon, USA, is a 270-acre facility of 38 buildings which, together withadjacent leased properties, functions as our world headquarters and isoccupied by more than 8,500 employees engaged in management, research,design, development, marketing, finance, and other administrative functionsserving nearly all of our divisions. We also lease various office facilities in thesurrounding metropolitan area. We lease a similar, but smaller, administrativefacility in Hilversum, the Netherlands, which serves as the headquarters for theWestern Europe and Central & Eastern Europe geographies, and managescertain brand management functions for our non-U.S. operations. We alsolease an office complex in Shanghai, China, our headquarters for GreaterChina, occupied by employees focused on implementing our wholesale, DTCand merchandising strategies in the region, among other functions. In theUnited States, there are five significant distribution centers in Memphis,Tennessee; two are owned and three are leased. NIKE Brand apparel and
equipment are also shipped from our Foothill Ranch, California distributioncenter, which we lease. Smaller leased distribution facilities for non-NIKEBrand businesses are located in various parts of the United States. We alsoown or lease distribution and customer service facilities outside the UnitedStates. The most significant are the distribution facilities located in Laakdal,Belgium; Taicang, China; and Tomisato, Japan; all of which we own.
NIKE IHM, Inc. manufactures Air-Sole cushioning components at NIKE-owned facilities located near Beaverton, Oregon and in St. Charles, Missouri.We also manufacture and sell small amounts of various other plastic productsto other manufacturers through NIKE IHM, Inc.
Aside from the principal properties described above, we lease approximately111 sales offices and approximately 110 administrative offices worldwide. Welease more than 850 retail stores worldwide, which consist primarily of factoryoutlet stores. See “United States Market” and “International Markets” in Part 1of this Report. Our leases expire at various dates through the year 2033.
ITEM 3. Legal ProceedingsThere are no material pending legal proceedings, other than ordinary routine litigation incidental to our business, to which we are a party or of which any of ourproperty is the subject.
ITEM 4. Mine Safety DisclosuresNot applicable.
NIKE, INC. 2014 Annual Report and Notice of Annual Meeting 59
FOR
M10
-K

PART II
PART II
ITEM 5. Market for Registrant’s Common Equity,Related Stockholder Matters and IssuerPurchases of Equity Securities
NIKE’s Class B Common Stock is listed on the New York Stock Exchangeand trades under the symbol NKE. At July 18, 2014, there were 32,758holders of record of our Class B Common Stock and 21 holders of record ofour Class A Common Stock. These figures do not include beneficial ownerswho hold shares in nominee name. The Class A Common Stock is notpublicly traded but each share is convertible upon request of the holder intoone share of Class B Common Stock. The following tables set forth, for each
of the quarterly periods indicated, the high and low sales prices for the Class BCommon Stock as reported on the New York Stock Exchange CompositeTape and dividends declared on the Class A and Class B Common Stock. Allshare and per share amounts presented are reflective of the two-for-onestock split that began trading at the split adjusted price on December 26,2012.
Fiscal 2014 (June 1, 2013 — May 31, 2014) High LowDividendsDeclared
First quarter $ 66.85 $ 59.11 $ 0.21Second quarter 79.87 63.50 0.24Third quarter 80.26 69.85 0.24Fourth quarter 80.09 70.60 0.24
Fiscal 2013 (June 1, 2012 — May 31, 2013) High LowDividendsDeclared
First quarter $ 54.32 $ 43.89 $ 0.18Second quarter 50.42 45.30 0.21Third quarter 55.55 48.46 0.21Fourth quarter 65.91 53.49 0.21
The following table presents a summary of share repurchases made by NIKE during the quarter ended May 31, 2014. During the second quarter of fiscal 2013,the Company completed the previous four-year, $5 billion share repurchase program approved by our Board of Directors in September 2008. During the priorprogram, the Company purchased a total of 118.8 million shares at an average price of $42.08 per share. Following the completion of this program, the Companybegan repurchases under the four-year, $8 billion share repurchase program approved by the Board in September 2012.
PeriodTotal Number of
Shares PurchasedAverage PricePaid per Share
Total Number of SharesPurchased as Part of PubliclyAnnounced Plans or Programs
Maximum Number (or ApproximateDollar Value) of Shares that May
Yet Be Purchased Under thePlans or Programs
(In millions)
March 1 — March 31, 2014 2,775,000 $ 77.68 2,775,000 $ 5,280April 1 — April 30, 2014 4,797,224 $ 73.16 4,797,224 $ 4,929May 1 — May 31, 2014 4,709,740 $ 73.40 4,709,740 $ 4,583
12,281,964 $ 74.27 12,281,964
60

PART II
Performance Graph
The following graph demonstrates a five-year comparison of cumulative totalreturns for NIKE’s Class B Common Stock, the Standard & Poor’s 500 StockIndex, the Standard & Poor’s Apparel, Accessories & Luxury Goods Index,and the Dow Jones U.S. Footwear Index. The graph assumes an investmentof $100 on May 31, 2009 in each of our Class B Common Stock, and the
stocks comprising the Standard & Poor’s 500 Stock Index, the Standard &Poor’s Apparel, Accessories & Luxury Goods Index, and the Dow Jones U.S.Footwear Index. Each of the indices assumes that all dividends werereinvested on the day of issuance.
COMPARISON OF 5-YEAR CUMULATIVE TOTAL RETURN AMONG NIKE, INC.; S&P 500 INDEX; S&P APPAREL, ACCESSORIES &LUXURY GOODS INDEX; AND THE DOW JONES U.S. FOOTWEAR INDEX
$320
$220$200$180$160$140$120$100$80$60$40$20$0
2009 2010 2011 2012 2013 2014
$240$260$280$300
NIKE, Inc.
S&P 500 INDEX - TOTAL RETURNS
DOW JONES US FOOTWEAR INDEX
S&P 500 APPAREL, ACCESSORIES & LUXURY GOODS INDEX
The Dow Jones U.S. Footwear Index consists of NIKE, Deckers OutdoorCorp., Wolverine World Wide, Inc., Iconix Brand Group, Inc., Crocs, Inc., andSteven Madden, Ltd. Because NIKE is part of the Dow Jones U.S. FootwearIndex, the price and returns of NIKE stock have a substantial effect on thisindex. The Standard & Poor’s Apparel, Accessories & Luxury Goods Indexconsists of V.F. Corp., Coach, Inc., Polo Ralph Lauren Corporation, andFossil Group, Inc. The Dow Jones U.S. Footwear Index and the Standard &Poor’s Apparel, Accessories, and Luxury Goods Index include companies intwo major lines of business in which the Company competes. The indices donot encompass all of the Company’s competitors, nor all product categoriesand lines of business in which the Company is engaged.
The stock performance shown on the performance graph above is notnecessarily indicative of future performance. The Company will not make orendorse any predictions as to future stock performance.
The performance graph above is being furnished solely to accompany thisReport pursuant to Item 201(e) of Regulation S-K, and is not being filed forpurposes of Section 18 of the Securities Exchange Act of 1934, as amended,and is not to be incorporated by reference into any filing of the Company,whether made before or after the date hereof, regardless of any generalincorporation language in such filing.
NIKE, INC. 2014 Annual Report and Notice of Annual Meeting 61
FOR
M10
-K

PART II
ITEM 6. Selected Financial DataUnless otherwise indicated, the following disclosures reflect the Company’s continuing operations; refer to Note 15 — Discontinued Operations in theaccompanying Notes to the Consolidated Financial Statements for additional information regarding discontinued operations. All per share amounts are reflectiveof the two-for-one stock split that began trading at the split-adjusted price on December 26, 2012.
(Dollars in millions, except per share data and financial ratios)
Financial History2014 2013(1) 2012(1) 2011(1) 2010(1)
Year Ended May 31,Revenues $ 27,799 $ 25,313 $ 23,331 $ 20,117 $ 18,324Gross profit 12,446 11,034 10,148 9,202 8,498Gross margin % 44.8% 43.6% 43.5% 45.7% 46.4%Net income from continuing operations 2,693 2,451 2,257 2,163 1,916Net income (loss) from discontinued operations — 21 (46) (39) (16)Net income 2,693 2,472 2,211 2,124 1,900Earnings per share from continuing operations:
Basic earnings per common share 3.05 2.74 2.45 2.27 1.98Diluted earnings per common share 2.97 2.68 2.40 2.23 1.94
Earnings per share from discontinued operations:Basic earnings per common share — 0.02 (0.05) (0.04) (0.02)Diluted earnings per common share — 0.02 (0.05) (0.04) (0.02)
Weighted average common shares outstanding 883.4 897.3 920.0 951.1 971.0Diluted weighted average common sharesoutstanding 905.8 916.4 939.6 971.3 987.8Cash dividends declared per common share 0.93 0.81 0.70 0.60 0.53Cash flow from operations, inclusive of discontinuedoperations 3,003 2,968 1,824 1,796 3,167Price range of common stock:
High 80.26 65.91 57.20 46.15 39.28Low 59.11 43.89 39.29 33.61 25.08
At May 31,Cash and equivalents $ 2,220 $ 3,337 $ 2,254 $ 1,877 $ 3,026Short-term investments 2,922 2,628 1,503 2,661 2,120Inventories 3,947 3,484 3,251 2,630 1,953Working capital, excluding assets and liabilities ofdiscontinued operations(2)(3) 8,669 9,686 7,531 7,275 7,518Total assets, excluding assets of discontinuedoperations(2) 18,594 17,545 14,804 14,398 13,852Long-term debt 1,199 1,210 228 276 446Capital lease obligations 74 81 — — —Redeemable preferred stock 0.3 0.3 0.3 0.3 0.3Shareholders’ equity 10,824 11,081 10,319 9,793 9,713Year-end stock price 76.91 61.66 54.09 42.23 36.19Market capitalization 66,921 55,124 49,546 39,523 35,032Financial Ratios:Return on equity 24.6% 23.1% 22.0% 21.8% 20.7%Return on assets 14.9% 15.3% 15.1% 15.0% 14.3%Inventory turns 4.1 4.2 4.5 4.8 4.7Current ratio at May 31 2.7 3.5 3.0 2.9 3.3Price/Earnings ratio at May 31 25.9 22.8 23.0 19.3 18.8
(1) Prior year amounts have been revised to correct immaterial misstatements, as described in Note 1 — Summary of Significant Accounting Policies in the accompanying Notes to theConsolidated Financial Statements. Shareholders’ equity for fiscal year 2010 includes a decrease to beginning Retained earnings of $34 million for the cumulative effect of the revision tocorrectly expense internally developed patent and trademark costs as incurred.
(2) Assets of discontinued operations were $0 million, $0 million, $615 million, $560 million, and $530 million for the years ended May 31, 2014, 2013, 2012, 2011, and 2010, respectively.
(3) Liabilities of discontinued operations were $0 million, $18 million, $170 million, $184 million, and $182 million for the years ended May 31, 2014, 2013, 2012, 2011, and 2010, respectively.
62

PART II
Selected Quarterly Financial Data
(Unaudited)(Dollars in millions, except per share data)
1st Quarter 2nd Quarter 3rd Quarter 4th Quarter2014(1) 2013(1) 2014(1) 2013(1) 2014(1) 2013(1) 2014 2013(1)
Revenues $ 6,971 $ 6,474 $ 6,431 $ 5,955 $ 6,972 $ 6,187 $7,425 $ 6,697Gross profit 3,132 2,828 2,826 2,530 3,103 2,736 3,385 2,940Gross margin % 44.9% 43.7% 43.9% 42.5% 44.5% 44.2% 45.6% 43.9%Net income from continuing operations 779 582 534 519 682 660 698 690Net income (loss) from discontinuedoperations — (18) — (137) — 204 — (28)Net income 779 564 534 382 682 864 698 662Earnings per share from continuingoperations:Basic earnings per common share 0.88 0.64 0.60 0.58 0.77 0.74 0.80 0.77Diluted earnings per common share 0.86 0.63 0.59 0.57 0.75 0.72 0.78 0.76Earnings per share from discontinuedoperations:Basic earnings per common share — (0.03) — (0.15) — 0.23 — (0.03)Diluted earnings per common share — (0.02) — (0.15) — 0.22 — (0.03)Weighted average common sharesoutstanding 889.4 905.6 888.0 897.0 882.3 893.9 873.7 892.6Diluted weighted average common sharesoutstanding 910.7 922.8 910.6 913.1 904.8 911.7 895.2 913.4Cash dividends declared per common share 0.21 0.18 0.24 0.21 0.24 0.21 0.24 0.21Price range of common stock
High 66.85 54.32 79.87 50.42 80.26 55.55 80.09 65.91Low 59.11 43.89 63.50 45.30 69.85 48.46 70.60 53.49
(1) Amounts presented have been revised from what was previously filed to correctly expense internally developed patent and trademark costs as incurred. As a result of this revision, Netincome as previously presented for the three months ended August 31, 2013, November 30, 2013 and February 28, 2014 decreased by $1 million, $3 million and $3 million, respectively.Net income as previously presented for the three months ended August 31, 2012, November 30, 2012, February 28, 2013 and May 31, 2013 decreased by $3 million, $2 million, $2 millionand $6 million, respectively. The Company plans to reflect the revised amounts in its quarterly Condensed Consolidated Financial Statements for fiscal 2014 in future filings containing suchinformation. Refer to Note 1 — Summary of Significant Accounting Policies in the accompanying Notes to the Consolidated Financial Statements.
NIKE, INC. 2014 Annual Report and Notice of Annual Meeting 63
FOR
M10
-K

PART II
ITEM 7. Management’s Discussion and Analysis ofFinancial Condition and Results of Operations
NIKE designs, develops, markets, and sells athletic footwear, apparel,equipment, accessories, and services worldwide. We are the largest seller ofathletic footwear and apparel in the world. We sell our products to retailaccounts, as well as through NIKE-owned in-line and factory retail stores andNIKE-owned internet websites (which we refer to as our “Direct to Consumer”or “DTC” operations), and through a mix of independent distributors,licensees, and sales representatives in virtually all countries around the world.Our goal is to deliver value to our shareholders by building a profitable globalportfolio of branded footwear, apparel, equipment, and accessoriesbusinesses. Our strategy is to achieve long-term revenue growth by creatinginnovative, “must have” products, building deep personal consumerconnections with our brands, and delivering compelling consumerexperiences at retail and online.
In addition to achieving long-term, sustainable revenue growth, we continueto strive to deliver shareholder value by driving operational excellence inseveral key areas:
• Expanding gross margin by:
– Delivering innovative, premium products that command higher priceswhile maintaining a strong consumer price-to-value proposition;
– Reducing product costs through a continued focus on manufacturingefficiency, product design, and innovation; and
– Making our supply chain a competitive advantage.
• Improving selling and administrative expense productivity by focusing oninvestments that drive economic returns in the form of incremental revenueand gross profit, and leveraging existing infrastructure across our portfolio ofbusinesses to eliminate duplicative costs;
• Improving working capital efficiency; and
• Deploying capital effectively.
Through execution of this strategy, our long-term financial goals continue tobe:
• High single-digit revenue growth,
• Mid-teens earnings per share growth,
• Consistent return on invested capital and accelerated cash flows, and
• Steady results through effective management of our diversified portfolio ofbusinesses.
Over the past ten years, we have achieved many of these financial goals.During this time, revenues and diluted earnings per common share for NIKE,Inc., inclusive of both continuing and discontinued operations, have grown9% and 13%, respectively, on an annual compounded basis. Our return oninvested capital has increased from 22% to 25% and we expanded grossmargins by approximately 190 basis points.
On November 15, 2012, we announced a two-for-one stock split of bothClass A and Class B Common shares. The stock split was in the form of a 100percent stock dividend payable on December 24, 2012 to shareholders ofrecord at the close of business December 10, 2012. Common stock begantrading at the split-adjusted price on December 26, 2012. All share numbersand per share amounts presented reflect the stock split.
Our fiscal 2014 results from continuing operations demonstrated the power ofthe NIKE, Inc. portfolio to deliver consistent growth in revenues, earnings, andcash returns to shareholders, while investing for long-term growth. Despitesignificant foreign currency headwinds, we delivered record revenues andearnings per share in fiscal 2014. Our revenues grew 10% to $27.8 billion, netincome from continuing operations increased 10% to $2.7 billion, and wedelivered diluted earnings per common share of $2.97, an 11% increase fromfiscal 2013.
Earnings before interest and income taxes (“EBIT”) from continuing operationsincreased 10% for fiscal 2014, driven by revenue growth and improved grossmargin, which more than offset higher selling and administrative expense. Theincrease in revenues was driven by growth across nearly all NIKE Brandgeographies, key categories, and product types. This growth was primarilyfueled by:
• Innovative performance and sportswear products, incorporating proprietarytechnology platforms such as NIKE AIR, Lunar, Shox, Free, Flywire, Dri-Fit,Flyknit, NIKE+, and NIKE Fuel;
• Deep brand connections to consumers through a category lens, reinforcedby investments in endorsements by high-profile athletes and teams, high-impact marketing around global sporting events (such as the World Cup,Olympics, and NFL Super Bowl) and digital marketing; and
• Strong category retail presentation online and at NIKE-owned and retailpartner stores.
We also delivered strong results for Converse, with revenue and EBIT growthof 16% and 17%, respectively.
Our gross margins improved largely due to the positive impact of higheraverage selling prices and contribution from our higher margin DTC business,partially offset by higher product input costs, due primarily to labor costinflation in our product costs, and foreign currency headwinds.
For fiscal 2014, the growth of our net income from continuing operations waspositively affected by a year-over-year decrease in our effective tax rate. Inaddition, diluted earnings per common share grew at a higher rate than netincome due to a 1% decrease in the weighted average number of dilutedcommon shares outstanding as a result of share repurchases.
During the second quarter of fiscal 2013, we completed the sale of certainassets of the Umbro brand and recorded a loss on the sale of these assets of$107 million, net of tax. During the third quarter of fiscal 2013, we completedthe sale of Cole Haan and recorded a gain on sale of $231 million, net of tax.As of May 31, 2013, the Company had substantially completed all transitionservices related to the sale of both businesses. Unless otherwise indicated,the following disclosures reflect the Company’s continuing operations; refer toour “Discontinued Operations” section for additional information regarding ourdiscontinued operations.
While macroeconomic uncertainties in the global economy are likely topersist, we continue to see opportunities to drive future growth and remaincommitted to effectively managing our business to achieve our financial goalsover the long term by executing against the operational strategies outlinedabove.
64

PART II
Results of OperationsUnless otherwise indicated, the following disclosures reflect the Company’s continuing operations.
(Dollars in millions, except per share data) Fiscal 2014 Fiscal 2013(1) % Change Fiscal 2012(1) % ChangeRevenues $ 27,799 $ 25,313 10% $ 23,331 8%Cost of sales 15,353 14,279 8% 13,183 8%
Gross profit 12,446 11,034 13% 10,148 9%Gross margin % 44.8% 43.6% 43.5%
Demand creation expense 3,031 2,745 10% 2,607 5%Operating overhead expense 5,735 5,051 14% 4,472 13%
Total selling and administrative expense 8,766 7,796 12% 7,079 10%% of Revenues 31.5% 30.8% 30.3%
Interest expense (income), net 33 (3) — 4 —Other expense (income), net 103 (15) — 54 —Income before income taxes 3,544 3,256 9% 3,011 8%Income tax expense 851 805 6% 754 7%
Effective tax rate 24.0% 24.7% 25.0%Net income from continuing operations 2,693 2,451 10% 2,257 9%Net income (loss) from discontinued operations — 21 — (46) —
Net income $ 2,693 $ 2,472 9% $ 2,211 12%Diluted earnings per share — continuingoperations $ 2.97 $ 2.68 11% $ 2.40 12%Diluted earnings per share — discontinuedoperations $ — $ 0.02 — $ (0.05) —
(1) Prior year amounts have been revised to correctly expense internally developed patent and trademark costs as incurred. Refer to Note 1 — Summary of Significant Accounting Policies inthe accompanying Notes to the Consolidated Financial Statements.
NIKE, INC. 2014 Annual Report and Notice of Annual Meeting 65
FOR
M10
-K

PART II
Consolidated Operating Results
Revenues
(Dollars in millions) Fiscal 2014 Fiscal 2013(1) % Change
% ChangeExcludingCurrency
Changes(2) Fiscal 2012(1) % Change
% ChangeExcludingCurrency
Changes(2)
NIKE, Inc. Revenues:NIKE Brand Revenues by:
Footwear $ 16,208 $ 14,635 11% 12% $ 13,513 8% 11%Apparel 8,109 7,491 8% 10% 6,958 8% 10%Equipment 1,670 1,640 2% 4% 1,429 15% 17%Global Brand Divisions(3) 125 115 9% 6% 111 4% 7%
Total NIKE Brand Revenues 26,112 23,881 9% 11% 22,011 8% 11%Converse 1,684 1,449 16% 15% 1,324 9% 10%Corporate(4) 3 (17) — — (4) — —TOTAL NIKE, INC. REVENUES $ 27,799 $ 25,313 10% 11% $ 23,331 8% 11%Supplemental NIKE Brand RevenuesDetails:NIKE Brand Revenues by:Sales to Wholesale Customers $ 20,683 $ 19,401 7% 8% $ 18,335 6% 8%Sales Direct to Consumer 5,304 4,365 22% 22% 3,565 22% 24%Global Brand Divisions(3) 125 115 9% 6% 111 4% 7%TOTAL NIKE BRAND REVENUES $ 26,112 $ 23,881 9% 11% $ 22,011 8% 11%NIKE Brand Revenues on a WholesaleEquivalent Basis:(5)
Sales to Wholesale Customers $ 20,683 $ 19,401 7% 8% $ 18,335 6% 8%Sales from our Wholesale Operations to Direct toConsumer Operations 3,107 2,499 24% 25% 2,027 23% 25%TOTAL NIKE BRAND WHOLESALEEQUIVALENT REVENUES $ 23,790 $ 21,900 9% 10% $ 20,362 8% 10%NIKE Brand Wholesale EquivalentRevenues by:(5)
Men’s $ 14,001 $ 13,073 7% 9% $ 12,269 7% 9%Women’s 4,971 4,494 11% 12% 4,221 6% 9%Young Athletes’ 3,737 3,251 15% 16% 3,004 8% 11%Others(6) 1,081 1,082 0% 1% 868 25% 27%TOTAL NIKE BRAND WHOLESALEEQUIVALENT REVENUES $ 23,790 $ 21,900 9% 10% $ 20,362 8% 10%NIKE Brand Wholesale EquivalentRevenues by:(5)
Running $ 4,623 $ 4,274 8% 10% $ 3,694 16% 18%Basketball 3,119 2,629 19% 19% 2,169 21% 22%Football (Soccer) 2,270 1,930 18% 21% 1,862 4% 9%Men’s Training 2,479 2,391 4% 5% 2,072 15% 17%Women’s Training 1,149 1,067 8% 10% 1,011 6% 8%Action Sports 738 683 8% 9% 664 3% 5%Sportswear 5,877 5,569 6% 7% 5,764 -3% -1%Golf 789 792 0% 1% 726 9% 10%Others(7) 2,746 2,565 7% 8% 2,400 7% 9%TOTAL NIKE BRAND WHOLESALEEQUIVALENT REVENUES $ 23,790 $ 21,900 9% 10% $ 20,362 8% 10%
(1) Certain prior year amounts have been reclassified to conform to fiscal 2014 presentation. These changes had no impact on previously reported results of operations or shareholders’equity.
(2) Results have been restated using actual exchange rates in use during the comparative period to enhance the visibility of the underlying business trends by excluding the impact oftranslation arising from foreign currency exchange rate fluctuations.
(3) Global Brand Divisions revenues primarily represent NIKE Brand licensing businesses that are not part of a geographic operating segment.
(4) Corporate revenues primarily consist of foreign currency revenue-related hedge gains and losses generated by entities within the NIKE Brand geographic operating segments andConverse through our centrally managed foreign exchange risk management program.
(5) References to NIKE Brand wholesale equivalent revenues are intended to provide context as to the total size of our NIKE Brand market footprint if we had no Direct to Consumeroperations. NIKE Brand wholesale equivalent revenues consist of (1) sales to external wholesale customers, and (2) internal sales from our wholesale operations to our Direct to Consumeroperations which are charged at prices that are comparable to prices charged to external wholesale customers.
(6) Others include all unisex products, equipment, and other products not allocated to Men’s, Women’s, and Young Athletes’, as well as certain adjustments that are not allocated to productsdesignated by gender or age.
(7) Others include all other categories and certain adjustments that are not allocated at the category level.
66

PART II
Fiscal 2014 Compared to Fiscal 2013
On a currency neutral basis, revenues from NIKE, Inc. continuing operationsgrew 11% for fiscal 2014, driven by increases in revenues for both the NIKEBrand and Converse. Every NIKE Brand geography delivered higher revenuesfor fiscal 2014. North America contributed 5 percentage points of the increasein NIKE, Inc. revenues, while Western Europe and Emerging Markets eachcontributed 2 percentage points and Central & Eastern Europe and Converseeach contributed 1 percentage point.
On a currency neutral basis, NIKE Brand footwear and apparel revenuesincreased 12% and 10%, respectively, while NIKE Brand equipmentrevenues increased 4% during fiscal 2014. The increase in NIKE Brandfootwear revenues for fiscal 2014 was mainly due to growth in our Basketball,Sportswear, Running, and Football (Soccer) categories. The growth of NIKEfootwear revenues continued to be fueled by increased demand forperformance products, including NIKE and Brand Jordan Basketball styles;Running models with NIKE Free, Air Max, Lunar, and Flyknit technologies;and performance Football (Soccer) products. Footwear unit sales in fiscal2014 increased approximately 7% and the average selling price per pairincreased approximately 5%, driven nearly equally by price increases and ashift in mix to higher priced products.
For NIKE Brand apparel, the increase in revenues for fiscal 2014 was drivenby growth in all key categories, most notably our Football (Soccer), Running,and Women’s Training categories. In fiscal 2014, unit sales of apparelincreased approximately 6% and the average selling price per unit increasedapproximately 4%, driven by price increases, and to a lesser extent, a shift inmix to higher priced products.
While wholesale revenues remain the largest component of overall NIKEBrand revenues, we continue to expand our DTC businesses in each of ourgeographies. Our NIKE Brand DTC operations include NIKE-owned in-lineand factory stores, as well as online sales through NIKE-owned websites. Forfiscal 2014, DTC revenues represented approximately 20% of our total NIKEBrand revenues compared to 18% in fiscal 2013. On a currency neutral basis,DTC revenues grew 22% for fiscal 2014, as comparable store sales grew10% and we continued to open new stores and expand our e-commercebusiness. Comparable store sales include revenues from NIKE-owned in-lineand factory stores for which all three of the following requirements have beenmet: (1) the store has been open at least one year, (2) square footage has notchanged by more than 15% within the past year, and (3) the store has notbeen permanently repositioned within the past year. Online sales throughNIKE-owned websites, which are not included in comparable store sales,grew 42% in fiscal 2014. Online sales represented approximately 15% of ourtotal NIKE Brand DTC revenues for fiscal 2014, compared to 12% for fiscal2013.
On a wholesale equivalent basis and excluding the effects of changes incurrency exchange rates, fiscal 2014 NIKE Brand Men’s revenues increased9% mainly as a result of strong growth in our Basketball, Football (Soccer),Running, and Sportswear categories. Women’s revenues increased 12% inlarge part due to increases in our Running, Sportswear, and Women’sTraining categories. The 16% increase in the Young Athletes’ business wasdriven by increases in the Basketball and Football (Soccer) categories in partdue to our expanded footwear and apparel offerings for this age group.
Fiscal 2013 Compared to Fiscal 2012
On a currency neutral basis, revenues from our NIKE, Inc. continuingoperations grew 11% for fiscal 2013, driven by increases in revenues for boththe NIKE Brand and Converse. Every NIKE Brand geography except GreaterChina delivered higher revenues for fiscal 2013. North America contributed 7percentage points of the increase in NIKE, Inc. revenues, while EmergingMarkets contributed 2 percentage points and Western and Central & EasternEurope each contributed 1 percentage point. Greater China’s results reducedNIKE, Inc. revenue growth by 1 percentage point. Revenues for Conversecontributed 1 percentage point to our consolidated revenue growth.
Excluding the effects of changes in currency exchange rates, NIKE Brandfootwear and apparel revenues increased 11% and 10%, respectively, whileNIKE Brand equipment revenues increased 17% during fiscal 2013. Theincrease in NIKE Brand footwear revenues for fiscal 2013 was attributable togrowth across our Running, Basketball, Football (Soccer), and Sportswearcategories. The growth of NIKE footwear revenues continued to be fueled byincreased demand for performance products, including Running models withNIKE Free and Lunar technologies, NIKE and Brand Jordan Basketball styles,and performance Football (Soccer) products. In fiscal 2013, unit sales offootwear increased approximately 7% and the average selling price per pairincreased approximately 4%, driven equally by price increases and a shift inmix to higher priced products.
For NIKE Brand apparel, the increase in revenues for fiscal 2013 was drivenby our Men’s Training category (which includes the NFL licensed business), inaddition to strong demand for Running and Basketball products. Apparel unitsales in fiscal 2013 increased approximately 7% and the average selling priceper unit increased approximately 3%, reflecting a favorable mix of higherpriced products, such as performance Running, Basketball, and NFL licensedapparel; and to a lesser extent, higher selling prices.
For fiscal 2013, DTC channels represented approximately 18% of overallNIKE Brand revenues compared to 16% in fiscal 2012. On a currency neutralbasis, DTC revenues grew 24% for fiscal 2013, as comparable store salesgrew 14% and we continued to expand our store network and e-commercebusinesses. Online sales through NIKE-owned websites grew 32% in fiscal2013 and represented approximately 12% of our total NIKE Brand DTCrevenues for fiscal 2013.
On a wholesale equivalent and currency neutral basis, fiscal 2013 NIKE BrandMen’s revenues increased 9% due primarily to growth in our Running, Men’sTraining, and Basketball categories. Women’s revenues increased 9% drivenprimarily by an increase in Running and Women’s Training. The 11% increasein the Young Athletes’ business was due primarily to increases in Basketball.
Futures Orders
Futures orders for NIKE Brand footwear and apparel scheduled for deliveryfrom June through November 2014 were 11% higher than the ordersreported for the comparable prior year period. The U.S. Dollar futures orderamount is calculated based upon our internal forecast of the currencyexchange rates under which our revenues will be translated during thisperiod. Excluding the impact of currency changes, futures orders increased12%, with unit orders and average selling price per unit contributingapproximately 8 and 4 percentage points of growth, respectively.
By geography, futures orders growth was as follows:
Reported FuturesOrders Growth
Futures Orders ExcludingCurrency Changes(1)
North America 11% 11%Western Europe 25% 22%Central & Eastern Europe 10% 14%Greater China 6% 6%Japan -6% 0%Emerging Markets 2% 9%Total NIKE Brand futures orders 11% 12%
(1) Growth rates have been restated using constant exchange rates for the comparative period to enhance the visibility of the underlying business trends excluding the impact of foreigncurrency exchange rate fluctuations.
NIKE, INC. 2014 Annual Report and Notice of Annual Meeting 67
FOR
M10
-K

PART II
The reported futures orders growth is not necessarily indicative of ourexpectation of revenue growth during this period. This is due to year-over-year changes in shipment timing, changes in the mix of orders betweenfutures and at-once orders, and the fulfillment of certain orders may falloutside of the schedule noted above. In addition, exchange rate fluctuationsas well as differing levels of order cancellations, discounts, and returns can
cause differences in the comparisons between futures orders and actualrevenues. Moreover, a portion of our revenue is not derived from futuresorders, including sales of at-once and closeout NIKE Brand footwear andapparel, NIKE Brand equipment, DTC operation sales, and sales fromConverse, NIKE Golf, and Hurley.
Gross Margin(Dollars in millions) Fiscal 2014 Fiscal 2013 % Change Fiscal 2012 % ChangeGross profit $ 12,446 $ 11,034 13% $ 10,148 9%Gross margin % 44.8% 43.6% 120 bps 43.5% 10 bps
Fiscal 2014 Compared to Fiscal 2013
For fiscal 2014, our consolidated gross margin was 120 basis points higherthan fiscal 2013, primarily driven by higher NIKE Brand average selling prices(increasing gross margin approximately 160 basis points), attributable to bothprice increases and a shift in mix to higher priced products. Gross margin wasalso positively impacted by growth in our higher margin DTC business(increasing gross margin approximately 40 basis points) and improvedmargins due to cleaner closeout inventories (increasing margin approximately20 basis points). These increases in gross margin were partially offset byhigher product costs (decreasing gross margin approximately 50 basispoints), primarily due to a shift in mix to higher cost products, as well asproduct labor input cost inflation. Gross margins were also negativelyimpacted by unfavorable foreign currency exchange rate movements(decreasing gross margin approximately 50 basis points).
Fiscal 2013 Compared to Fiscal 2012
For fiscal 2013, our consolidated gross margin was 10 basis points higherthan fiscal 2012, primarily driven by higher average selling prices(approximately 160 basis points) that were attributable to higher prices and afavorable sales mix. The positive benefit of higher net average selling priceswas largely offset by higher product costs (approximately 110 basis points),primarily due to higher factory labor costs, and unfavorable foreign currencyexchange rate movements (approximately 40 basis points).
In addition, in fiscal 2013 we experienced significant shifts in the mix ofrevenues from higher to lower margin segments of our business. Whilegrowth in these lower gross margin segments delivered incremental revenueand profits, it had a negative effect on our consolidated gross margin.
Total Selling and Administrative Expense(Dollars in millions) Fiscal 2014 Fiscal 2013 % Change Fiscal 2012 % ChangeDemand creation expense(1) $ 3,031 $ 2,745 10% $ 2,607 5%Operating overhead expense(2) 5,735 5,051 14% 4,472 13%
Total selling and administrativeexpense $ 8,766 $ 7,796 12% $ 7,079 10%
% of Revenues 31.5% 30.8% 70 bps 30.3% 50 bps
(1) Demand creation expense consists of advertising and promotion expenses, including costs of endorsement contracts.
(2) Fiscal 2013 and 2012 amounts have been revised to correctly expense internally developed patent and trademark costs as incurred. Refer to Note 1 — Summary of Significant AccountingPolicies in the accompanying Notes to the Consolidated Financial Statements.
Fiscal 2014 Compared to Fiscal 2013
Demand creation expense increased 10% compared to the prior year, mainlydriven by marketing support for events, including the World Cup, highersports marketing expense, key product launches and initiatives, andinvestments to upgrade the presentation of our products in wholesaleaccounts. For fiscal 2014, changes in foreign currency exchange rates did nothave a material impact on Demand creation expense.
Compared to the prior year, Operating overhead expense increased 14%,primarily attributable to growth in our DTC business driven by new storeopenings, higher personnel costs, and e-commerce launches, as well asincreased investments in our digital capabilities and corporate infrastructure.Changes in foreign currency exchange rates did not have a material impact onOperating overhead expense for fiscal 2014.
Fiscal 2013 Compared to Fiscal 2012
Demand creation expense increased 5% compared to the prior year, mainlydriven by an increase in sports marketing expense, marketing support for keyproduct initiatives, including the NIKE FuelBand and NFL launch, as well as anincreased level of marketing spending around global sporting events such asthe European Football Championships and London Summer Olympics.Excluding the effects of changes in foreign currency exchange rates, Demandcreation expense increased 8%.
Compared to the prior year, Operating overhead expense increased 13%,primarily attributable to increased investments in our DTC operations, higherpersonnel costs, and corporate initiatives to support the growth of our overallbusiness. Excluding the effects of changes in foreign currency exchangerates, the growth in Operating overhead expense was 15%.
68

PART II
Other Expense (Income), Net(In millions) Fiscal 2014 Fiscal 2013 Fiscal 2012Other expense (income), net $ 103 $ (15) $ 54
Other expense (income), net comprises foreign currency conversion gainsand losses from the re-measurement of monetary assets and liabilitiesdenominated in non-functional currencies and the impact of certain foreigncurrency derivative instruments, as well as unusual or non-operatingtransactions that are outside the normal course of business.
Fiscal 2014 Compared to Fiscal 2013
Other expense (income), net shifted from $15 million of other (income), net forfiscal 2013 to $103 million of other expense, net, for fiscal 2014, primarilydriven by a $90 million adverse change in foreign currency conversion gainsand losses as well as an adverse legal judgment in the second quarter of thecurrent year related to a long outstanding bankruptcy case for a formercustomer in Western Europe.
We estimate the combination of the translation of foreign currency-denominated profits from our international businesses and the year-over-year
change in foreign currency related gains and losses included in Otherexpense (income), net had an unfavorable impact on our Income beforeincome taxes of $139 million for fiscal 2014.
Fiscal 2013 Compared to Fiscal 2012
Other expense (income), net shifted from $54 million of other expense, net forfiscal 2012 to $15 million of other (income) net, for fiscal 2013. This changewas primarily driven by a $48 million decrease in foreign currency net lossesas well as the recognition of a $24 million restructuring charge for NIKEBrand’s Western Europe operations in fiscal 2012. These positive impactswere partially offset by smaller net gains from non-operating items.
We estimate the combination of the translation of foreign currency-denominated profits from our international businesses and the year-over-yearchange in foreign currency related gains and losses included in Otherexpense (income), net had an unfavorable impact on our Income beforeincome taxes of $56 million for fiscal 2013.
Income TaxesFiscal 2014 Fiscal 2013 % Change Fiscal 2012 % Change
Effective tax rate 24.0% 24.7% (70) bps 25.0% (30) bps
Fiscal 2014 Compared to Fiscal 2013
The 70 basis point decrease in our effective tax rate for the fiscal year wasprimarily driven by an increase in earnings in lower tax jurisdictions. During thefourth quarter of the fiscal year ended May 31, 2014, we reached a resolutionwith the IRS on an Advanced Pricing Agreement. This agreement did nothave a material impact on our effective tax rate for fiscal 2014. Refer toNote 9 — Income Taxes in the accompanying Notes to the ConsolidatedFinancial Statements for additional disclosure.
Fiscal 2013 Compared to Fiscal 2012
The 30 basis point decrease in our effective tax rate for the fiscal year wasprimarily driven by the U.S. legislative retroactive reinstatement of the research
and development tax credit and a reduction of tax reserves on foreignoperations, partially offset by an increase in the percentage of earnings inhigher tax jurisdictions.
Discontinued OperationsDuring fiscal 2013, we divested of Umbro and Cole Haan, allowing us to focusour resources on driving growth in the NIKE, Jordan, Converse, and Hurleybrands. The results of the divestiture are presented as discontinuedoperations. Please refer to Note 15 — Discontinued Operations in theaccompanying Notes to the Consolidated Financial Statements for moredetail.
Operating Segments
Our reportable operating segments are evidence of the structure of theCompany’s internal organization, which changed beginning in the first quarterof fiscal 2014. The NIKE Brand segments continue to be defined bygeographic regions for operations participating in NIKE Brand sales activity,which now includes the results of NIKE Golf and Hurley. Previously, NIKE Golfand Hurley were combined with Converse and reported as “OtherBusinesses.”
Each NIKE Brand geographic segment operates predominantly in oneindustry: the design, development, marketing, and selling of athletic footwear,apparel, and equipment. The Company’s reportable operating segments forthe NIKE Brand are: North America, Western Europe, Central & EasternEurope, Greater China, Japan, and Emerging Markets. The Company’s NIKEBrand DTC operations are managed within each geographic segment.Converse is also a reportable segment for NIKE, Inc., and operates in one
industry: the design, marketing, licensing, and selling of casual sneakers,apparel, and accessories. Prior year amounts have been restated to conformto fiscal 2014 presentation.
As part of our centrally managed foreign exchange risk managementprogram, standard foreign currency rates are assigned twice per year to eachNIKE Brand entity in our geographic operating segments and Converse.These rates are set approximately nine months in advance of the future sellingseason based on average market spot rates in the calendar month precedingthe date they are established. Inventories and cost of sales for geographicoperating segments and Converse reflect the use of these standard rates torecord non-functional currency product purchases into the entity’s functionalcurrency. Differences between assigned standard foreign currency rates andactual market rates are included in Corporate together with foreign currencyhedge gains and losses generated from our centrally managed foreignexchange risk management program.
NIKE, INC. 2014 Annual Report and Notice of Annual Meeting 69
FOR
M10
-K

PART II
The breakdown of revenues is as follows:
(Dollars in millions) Fiscal 2014 Fiscal 2013(1) % Change
% ChangeExcludingCurrency
Changes(2) Fiscal 2012(1) % Change
% ChangeExcludingCurrency
Changes(2)
North America $ 12,299 $ 11,158 10% 10% $ 9,538 17% 17%Western Europe 4,979 4,193 19% 14% 4,212 0% 5%Central & Eastern Europe 1,387 1,229 13% 15% 1,146 7% 12%Greater China 2,602 2,478 5% 3% 2,561 -3% -5%Japan 771 876 -12% 5% 920 -5% 2%Emerging Markets 3,949 3,832 3% 13% 3,523 9% 16%Global Brand Divisions(3) 125 115 9% 6% 111 4% 7%Total NIKE Brand Revenues 26,112 23,881 9% 11% 22,011 8% 11%Converse 1,684 1,449 16% 15% 1,324 9% 10%Corporate(4) 3 (17) — — (4) — —TOTAL NIKE, INC. REVENUES $ 27,799 $ 25,313 10% 11% $ 23,331 8% 11%
(1) Certain prior year amounts have been reclassified to conform to fiscal 2014 presentation. These changes had no impact on previously reported results of operations or shareholders’equity.
(2) Results have been restated using actual exchange rates in use during the comparative period to enhance the visibility of the underlying business trends by excluding the impact oftranslation arising from foreign currency exchange rate fluctuations.
(3) Global Brand Divisions revenues primarily represent NIKE Brand licensing businesses that are not part of a geographic segment.
(4) Corporate revenues primarily consist of foreign currency revenue-related hedge gains and losses generated by entities within the NIKE Brand geographic operating segments andConverse through our centrally managed foreign exchange risk management program.
The primary financial measure used by the Company to evaluate performanceof individual operating segments is earnings before interest and taxes(commonly referred to as “EBIT”), which represents Net income beforeInterest expense (income), net and Income tax expense in the Consolidated
Statements of Income. As discussed in Note 18 — Operating Segments andRelated Information in the accompanying Notes to the Consolidated FinancialStatements, certain corporate costs are not included in EBIT of our operatingsegments.
The breakdown of earnings before interest and taxes is as follows:
(Dollars in millions) Fiscal 2014 Fiscal 2013(1) % Change Fiscal 2012(1) % Change
North America $ 3,075 $ 2,641 16% $ 2,092 26%Western Europe 855 643 33% 599 7%Central & Eastern Europe 279 234 19% 209 12%Greater China 816 813 0% 913 -11%Japan 131 139 -6% 135 3%Emerging Markets 955 988 -3% 826 20%Global Brand Divisions (2,021) (1,746) -16% (1,479) -18%Total NIKE Brand 4,090 3,712 10% 3,295 13%Converse 496 425 17% 394 8%Corporate(2) (1,009) (884) -14% (674) -31%TOTAL CONSOLIDATED EARNINGSBEFORE INTEREST AND TAXES 3,577 3,253 10% 3,015 8%Interest expense (income), net 33 (3) — 4 —TOTAL CONSOLIDATED INCOMEBEFORE INCOME TAXES $ 3,544 $ 3,256 9% $ 3,011 8%
(1) Certain prior year amounts have been reclassified to conform to fiscal 2014 presentation. These changes had no impact on previously reported results of operations or shareholders’ equity.
(2) Fiscal 2013 and 2012 amounts have been revised to correctly expense internally developed patent and trademark costs as incurred. Refer to Note 1 — Summary of Significant AccountingPolicies in the accompanying Notes to the Consolidated Financial Statements.
70

PART II
North America
(Dollars in millions) Fiscal 2014 Fiscal 2013 % Change
% ChangeExcludingCurrencyChanges Fiscal 2012 % Change
% ChangeExcludingCurrencyChanges
Revenues by:Footwear $ 7,495 $ 6,751 11% 11% $ 5,941 14% 14%Apparel 3,937 3,591 10% 10% 2,993 20% 20%Equipment 867 816 6% 6% 604 35% 35%TOTAL REVENUES $ 12,299 $ 11,158 10% 10% $ 9,538 17% 17%Revenues by:Sales to Wholesale Customers $ 9,296 $ 8,571 8% 9% $ 7,385 16% 16%Sales Direct to Consumer 3,003 2,587 16% 16% 2,153 20% 20%TOTAL REVENUES $ 12,299 $ 11,158 10% 10% $ 9,538 17% 17%EARNINGS BEFORE INTERESTAND TAXES $ 3,075 $ 2,641 16% $ 2,092 26%
Fiscal 2014 Compared to Fiscal 2013
Our continued focus on the category offense drove increased demand forNIKE Brand products across all key categories for fiscal 2014. Our Basketball,Men’s Training, Running, and Sportswear categories fueled the revenuegrowth in fiscal 2014. DTC revenue growth in North America for fiscal 2014was driven by a 7% increase in comparable store sales, the addition of 16 netnew stores, and strong online sales growth.
Footwear revenue growth in North America was driven by higher demand innearly all key categories, led by our Basketball, Running, and Sportswearcategories. For fiscal 2014, unit sales increased 7% and average selling priceper pair increased 4%. The increase in average selling price per pair wasdriven by price increases and shift in mix toward higher priced products innearly equal amounts.
North America apparel revenue growth was fueled by higher demand in allkey categories, most notably our Men’s Training, Women’s Training, andSportswear categories. Both unit sales and average selling price per unitincreased, with unit sales increasing 6% and average selling price per unitincreasing 4%. The increase in average selling price per unit was primarilydriven by price increases, and to a lesser extent, a change in mix to higherpriced products.
North America EBIT increased at a faster rate than revenues due to grossmargin expansion and slight selling and administrative expense leverage.Gross margin increased 120 basis points for fiscal 2014, reflecting pricinginitiatives as well as lower product costs as a result of favorable changes inproduct mix. These gross margin benefits were partially offset by higher off-price mix. Selling and administrative expenses grew in line with revenues as aresult of higher operating overhead costs to support DTC growth and higherdemand creation expense in support of the World Cup and key product andbrand initiatives.
Fiscal 2013 Compared to Fiscal 2012
Our category offense continued to deliver innovative products, deep brandconnections, and compelling retail experiences to consumers in NorthAmerica, driving increased demand for NIKE Brand products across all keycategories except Action Sports. Our Basketball, Men’s Training, Running,and Sportswear categories drove the revenue growth in fiscal 2013. NorthAmerica’s DTC revenue growth for fiscal 2013 was fueled by 15% growth incomparable store sales as well as the addition of new stores and rapid growthin online sales.
North America footwear revenue growth was driven by higher demand in allkey categories, most notably Basketball, Running, and Sportswear. Both unitsales and average selling price per pair increased 7% in fiscal 2013. Theincrease in average selling price per pair was driven approximately equally byprice increases and a favorable mix of higher priced products.
Apparel revenue growth in North America was driven by higher demand in ourMen’s Training category, reflecting the addition of the NFL licensed business,as well as Basketball, Women’s Training, and Running. Unit sales increased9% while average selling price per unit increased 11%, largely driven by afavorable mix of higher priced products.
North America EBIT increased faster than revenues due to gross marginexpansion and selling and administrative expense leverage. Gross marginincreased 50 basis points for fiscal 2013, reflecting the favorable impact ofselling price increases, partially offset by higher product costs, an unfavorablemix of lower margin products, and royalties for the NFL business. Selling andadministrative expenses increased versus fiscal 2012, though at a rate slowerthan revenues; the growth was largely driven by higher demand creationexpense for the Olympics in the first quarter of fiscal 2013 as well as keyproduct initiatives, including the NFL launch, and higher operating overheadcosts to support the expansion of our DTC business and overall growth of thebusiness.
NIKE, INC. 2014 Annual Report and Notice of Annual Meeting 71
FOR
M10
-K

PART II
Western Europe
(Dollars in millions) Fiscal 2014 Fiscal 2013 % Change
% ChangeExcludingCurrencyChanges Fiscal 2012 % Change
% ChangeExcludingCurrencyChanges
Revenues by:Footwear $ 3,299 $ 2,657 24% 20% $ 2,538 5% 10%Apparel 1,427 1,289 11% 7% 1,407 -8% -4%Equipment 253 247 2% -1% 267 -7% -3%TOTAL REVENUES $ 4,979 $ 4,193 19% 14% $ 4,212 0% 5%Revenues by:Sales to Wholesale Customers $ 4,022 $ 3,481 16% 11% $ 3,623 -4% 1%Sales Direct to Consumer 957 712 34% 29% 589 21% 27%TOTAL REVENUES $ 4,979 $ 4,193 19% 14% $ 4,212 0% 5%EARNINGS BEFORE INTEREST AND TAXES $ 855 $ 643 33% $ 599 7%
Fiscal 2014 Compared to Fiscal 2013
The ongoing implementation of the category offense in Western Europeyielded successful results in fiscal 2014. On a currency neutral basis, allterritories in Western Europe reported revenue growth for fiscal 2014, exceptItaly and Iberia, which declined 7% and 1%, respectively. Revenues for theU.K. & Ireland and AGS (Austria, Germany, and Switzerland), our largestterritories in Western Europe, increased 20% and 23%, respectively. On acategory basis, revenue growth in fiscal 2014 was fueled by our Running,Football (Soccer), and Sportswear categories. The growth in DTC revenuesfor fiscal 2014 was driven by 17% growth in comparable store sales, rapidgrowth in online sales, and the addition of 19 net new stores.
Constant currency footwear revenue growth in Western Europe reflectedincreases in every key category, most notably our Sportswear, Running,Football (Soccer), and Basketball categories. Unit sales in fiscal 2014increased 11% and average selling price per pair increased 9%. The increasein average price per pair was primarily the result of price increases, a shift inmix to higher priced products, and lower discounts.
The constant currency increase in Western Europe apparel revenues was dueto increases in Football (Soccer), Running, and Women’s Training, partiallyoffset by a decline in Sportswear. Unit sales increased 3% while averageselling price per unit increased 4%, driven primarily by lower discounts on off-price closeout sales compared to the prior year.
On a reported basis, Western Europe EBIT for fiscal 2014 grew at a faster ratethan revenues as a result of a 150 basis point increase in gross margin andselling and administrative expense leverage. The gross margin increase wasfueled by higher average selling prices, growth in our higher margin DTCbusiness, lower discounts, and lower off-price mix, which more than offsetunfavorable standard foreign currency exchange rates and higher productinput costs. Selling and administrative expense was lower as a percentage ofrevenue despite higher operating overhead costs to support growth in ourDTC business and higher demand creation spending for sports marketing tosupport key events such as the World Cup.
Fiscal 2013 Compared to Fiscal 2012
On a currency neutral basis, most territories in Western Europe reportedrevenue growth for fiscal 2013, which more than offset revenue declines of17% and 18% in Italy and Iberia, respectively, reflecting poor economicconditions in southern Europe. Revenues for the U.K. & Ireland and AGSterritories increased 8% and 12%, respectively. The growth in DTC revenuesreflected 17% growth in comparable store sales, the addition of 19 net newstores and strong growth in online sales. On a category basis, WesternEurope’s revenues growth was largely driven by growth in our Running andBasketball categories.
Constant currency footwear revenue growth in Western Europe was primarilydriven by growth in Running, Sportswear, and Basketball. Unit salesincreased 7% and average selling price per pair increased 3%, the latterprimarily the result of price increases.
The constant currency decrease in Western Europe apparel revenues wasdue to a decline in Sportswear, partially offset by growth in Running, Men’sTraining, and Basketball. Unit sales in fiscal 2013 decreased 1% whileaverage selling price per unit decreased 3%, as higher discounts on closeoutsales more than offset selling price increases.
The EBIT growth in fiscal 2013 was driven by a 200 basis point increase ingross margin, partially offset by higher selling and administrative expenses.The gross margin increase was primarily driven by favorable standard foreigncurrency exchange rates; higher net average selling prices were mostly offsetby higher product costs. The increase in selling and administrative expensewas mainly driven by an increased level of demand creation spending aroundthe European Football Championships and Olympics in the first quarter offiscal 2013, as well as higher sports marketing expense. Additionally,operating overhead costs increased to support the expansion of our DTCbusiness and overall growth of the business. Fiscal 2013 EBIT growth forWestern Europe was also increased by a $24 million, one-time restructuringcharge that was recorded in Other expense (income), net, in the fourth quarterof fiscal 2012.
72

PART II
Central & Eastern Europe
(Dollars in millions) Fiscal 2014 Fiscal 2013 % Change
% ChangeExcludingCurrencyChanges Fiscal 2012 % Change
% ChangeExcludingCurrencyChanges
Revenues by:Footwear $ 763 $ 672 14% 15% $ 631 6% 11%Apparel 532 468 14% 17% 430 9% 14%Equipment 92 89 3% 7% 85 5% 9%TOTAL REVENUES $ 1,387 $ 1,229 13% 15% $ 1,146 7% 12%EARNINGS BEFORE INTEREST AND TAXES $ 279 $ 234 19% $ 209 12%
Fiscal 2014 Compared to Fiscal 2013
On a currency neutral basis, Central & Eastern Europe revenue for fiscal 2014was driven by growth across nearly all territories, particularly Russia, ourlargest territory, which grew 14%, and Turkey, which grew 17%. Revenuegrowth in Central & Eastern Europe was driven by growth in nearly every keycategory, led by Football (Soccer) and Running.
Constant currency footwear revenue growth in fiscal 2014 was driven bygrowth in nearly all categories, most notably Running and Football (Soccer).Unit sales increased 11% while average selling price per pair increased 4%,due primarily to price increases.
Constant currency apparel revenue growth in fiscal 2014 was driven bygrowth in every key category, led by Football (Soccer) and Running. Unit salesincreased 15%, while average selling price per unit increased 2%, driven byprice increases.
On a reported basis, EBIT for Central & Eastern Europe grew faster thanrevenues primarily due to gross margin improvement, partially offset by higherselling and administrative expense. Gross margin increased 180 basis points,primarily driven by price increases, a shift in mix to higher margin products,warehousing efficiencies, and the favorable impact of our higher margin DTCbusiness, partially offset by unfavorable standard foreign currency exchangerates. Selling and administrative expense increased as a result of higherdemand creation expense to support key events as well as higher operatingoverhead to support overall growth, including our expanding DTC business.
Fiscal 2013 Compared to Fiscal 2012
On a currency neutral basis, Central & Eastern Europe revenue for fiscal 2013was driven by growth across most territories, particularly Russia and Turkey,which grew 28% and 19%, respectively. Revenue growth in Central & EasternEurope was driven by growth in all key categories, most notably Running,Football (Soccer), and Sportswear.
Constant currency footwear revenue growth in fiscal 2013 was primarilydriven by growth in Running, Football (Soccer), and Basketball, partially offsetby lower revenues in Sportswear. Unit sales increased 6% while averageselling price per pair increased 5%, primarily driven by price increases.
Constant currency apparel revenue growth in fiscal 2013 was driven bygrowth in nearly all categories, most notably Sportswear, Football (Soccer),and Running. Unit sales increased 16%, while average selling price per unitdecreased 2%, as an unfavorable mix of lower priced products more thanoffset higher selling prices.
EBIT for Central & Eastern Europe grew faster than revenues primarily due togross margin improvement and selling and administrative expense leverage.Gross margin increased 30 basis points, largely driven by price increases andthe favorable impact of our higher margin DTC business, more than offsettinghigher product costs and unfavorable standard foreign currency exchangerates.
Greater China
(Dollars in millions) Fiscal 2014 Fiscal 2013 % Change
% ChangeExcludingCurrencyChanges Fiscal 2012 % Change
% ChangeExcludingCurrencyChanges
Revenues by:Footwear $ 1,600 $ 1,495 7% 5% $ 1,520 -2% -3%Apparel 876 844 4% 1% 910 -7% -8%Equipment 126 139 -9% -11% 131 6% 4%TOTAL REVENUES $ 2,602 $ 2,478 5% 3% $ 2,561 -3% -5%Revenues by:Sales to Wholesale Customers $ 2,041 $ 2,079 -2% -4% $ 2,266 -8% -9%Sales Direct to Consumer 561 399 41% 38% 295 35% 33%TOTAL REVENUES $ 2,602 $ 2,478 5% 3% $ 2,561 -3% -5%EARNINGS BEFORE INTEREST AND TAXES $ 816 $ 813 0% $ 913 -11%
Fiscal 2014 Compared to Fiscal 2013
Excluding changes in currency exchange rates, Greater China revenuesincreased 3% in fiscal 2014, primarily driven by strong growth in our DTCbusiness, which represented 22% of total Greater China revenues for fiscal2014. The growth in DTC revenues reflected a 20% increase in comparablestore sales, the addition of 30 net new stores, as well as online sales growth.The increase in DTC revenues more than offset a 4% decrease in sales in our
wholesale business as we continued to manage the amount of product soldinto the market and worked with our wholesale partners to optimize productmix for the consumer. On a category basis, higher revenues in our Basketball,Sportswear, and Running categories more than offset declines in Men’sTraining, Action Sports, and Women’s Training.
Constant currency footwear revenue growth for Greater China in fiscal 2014was driven by increased sales in our Basketball and Sportswear categories,partially offset by declines in our Men’s Training, Running, and Action Sports
NIKE, INC. 2014 Annual Report and Notice of Annual Meeting 73
FOR
M10
-K

PART II
categories. Unit sales for fiscal 2014 were flat compared to the prior year whileaverage selling price per pair increased 5%, driven by favorable revenue mixresulting from a higher percentage of sales from our higher price DTCbusiness, as well as a shift in mix to higher priced product.
Constant currency apparel revenue growth for fiscal 2014 was driven byincreases in the Running, Sportswear, and Basketball categories, partiallyoffset by decreases in Men’s Training and Women’s Training. Apparel unitsales in fiscal 2014 were 1% higher while average selling price per unit wasflat.
Fiscal 2014 reported EBIT for Greater China was flat compared to the prioryear as reported revenue and gross margin increases were offset by higherselling and administrative expense as a percentage of sales. Gross marginincreased 150 basis points as higher average selling prices, growth in ourhigher margin DTC business, and improved margins on closeout sales morethan offset higher product input costs and unfavorable product mix. Selling andadministrative expense increased due to higher operating overhead costsdriven by increased investments to support DTC growth and our new GreaterChina headquarters in Shanghai, as well as higher demand creation spending.
Fiscal 2013 Compared to Fiscal 2012
On a currency neutral basis, Greater China revenues decreased in fiscal 2013,driven by lower futures orders as well as increased discounts, product returnsand proactive cancellation of orders to manage inventory levels at retail. These
downsides were partially offset by 33% growth in our DTC business driven bycomparable store sales growth of 13% and the addition of 29 net new stores.Fiscal 2013 revenues for most key categories were lower than in fiscal 2012.
For fiscal 2013, constant currency footwear revenues for Greater Chinadeclined, driven by lower sales across most key categories, most notablySportswear, Men’s Training, and Women’s Training; and increased reservesfor product discounts and returns. Unit sales decreased 1%, while averageselling price per pair decreased 2%, reflecting a higher mix of closeout salesand higher discounts.
The decrease in constant currency apparel revenues for fiscal 2013 wasdriven by lower revenues in Sportswear, Men’s Training, and Women’sTraining, partially offset by higher revenues in Basketball. Apparel unit sales infiscal 2013 were 3% lower than the prior year while average selling price perunit was down 5%, reflecting a higher mix of closeout sales and higherdiscounts.
Fiscal 2013 EBIT for Greater China decreased at a faster rate than revenues,driven by lower gross margin and higher selling and administrative expense.Fiscal 2013 gross margin decreased 50 basis points due to a lower averageselling price per unit driven by higher discounts and closeout mix partiallyoffset by favorable standard foreign currency exchange rates. Selling andadministrative expense increased as a percent of revenues, driven primarily bythe increased investment in our DTC business and the decrease in revenues.
Japan
(Dollars in millions) Fiscal 2014 Fiscal 2013 % Change
% ChangeExcludingCurrencyChanges Fiscal 2012 % Change
% ChangeExcludingCurrencyChanges
Revenues by:Footwear $ 409 $ 439 -7% 11% $ 447 -2% 5%Apparel 276 337 -18% -2% 364 -7% -1%Equipment 86 100 -14% 2% 109 -8% 0%TOTAL REVENUES $ 771 $ 876 -12% 5% $ 920 -5% 2%EARNINGS BEFORE INTEREST AND TAXES $ 131 $ 139 -6% $ 135 3%
Fiscal 2014 Compared to Fiscal 2013
On a currency neutral basis, revenues increased 5% for Japan, driven byhigher revenues in Sportswear, Football (Soccer), and Basketball, partiallyoffset by lower revenues in Men’s Training and NIKE Golf.
Fiscal 2014 EBIT for Japan decreased 6% as a 12% decline in reportedrevenues, due to the weaker Yen, was only partially offset by higher grossmargin and selling and administrative expense leverage. Gross marginincreased 20 basis points as higher average selling prices, favorable off-pricemix, and the favorable impact of higher margin DTC revenues were mostlyoffset by unfavorable standard foreign currency exchange rates. Thedecrease in selling and administrative expense in fiscal 2014 was attributableto lower operating overhead and demand creation spending.
Fiscal 2013 Compared to Fiscal 2012
Excluding changes in currency exchange rates, the revenue increase forJapan was driven by higher revenues in Running, Football (Soccer), andBasketball, partially offset by lower revenues in Sportswear, Men’s Training,and Women’s Training.
Fiscal 2013 EBIT for Japan increased as lower reported revenues were morethan offset by gross margin improvement and lower selling and administrativeexpense. The decrease in selling and administrative expense in fiscal 2013was attributable to both lower operating overhead and demand creationspending.
Emerging Markets
(Dollars in millions) Fiscal 2014 Fiscal 2013 % Change
% ChangeExcludingCurrencyChanges Fiscal 2012 % Change
% ChangeExcludingCurrencyChanges
Revenues by:Footwear $ 2,642 $ 2,621 1% 10% $ 2,436 8% 15%Apparel 1,061 962 10% 21% 854 13% 19%Equipment 246 249 -1% 9% 233 7% 13%TOTAL REVENUES $ 3,949 $ 3,832 3% 13% $ 3,523 9% 16%EARNINGS BEFORE INTERESTAND TAXES $ 955 $ 988 -3% $ 826 20%
74

PART II
Fiscal 2014 Compared to Fiscal 2013
Excluding changes in currency exchange rates, fiscal 2014 revenues forEmerging Markets increased 13% as a result of growth across nearly everyterritory. Our largest territory, Brazil, grew 19%, while our SOCO territory(which includes Argentina, Uruguay, and Chile) grew 25%. Mexico revenuesdecreased 3% as a result of shipping delays caused by issues with adistribution center transition in the first half of fiscal 2014. On a category basis,revenues were higher in nearly every category, led by Football (Soccer),Running, and Sportswear.
Constant currency footwear revenue growth for fiscal 2014 was driven bygrowth in nearly every key category, led by Running, Sportswear, Football(Soccer), and Action Sports. Unit sales for fiscal 2014 increased 4% andaverage selling price per pair increased 6%, primarily driven by priceincreases, in part reflecting inflationary conditions in certain Latin Americanterritories, and to a lesser extent, a shift in mix to higher priced product.
Constant currency apparel revenues increased driven by growth in every keycategory, most notably Football (Soccer) and Running. Unit sales increased11% and average selling price per unit increased 10%, primarily due to priceincreases, in part reflecting inflationary conditions in certain Latin Americanterritories.
Fiscal 2014 reported EBIT for Emerging Markets decreased primarily due to adecline in gross margin, higher selling and administrative expense, andweaker currencies in a number of developing markets. Gross margindecreased 30 basis points due primarily to unfavorable foreign currencyexchange rates, higher product costs, higher warehousing costs related todistribution center transition challenges in Mexico, and higher discounts,which more than offset higher average selling prices and a favorable shift tohigher priced products. Selling and administrative expense increased due to
higher operating overhead costs to support the expansion of our DTCbusiness and infrastructure investments to support growth, as well asincreases in demand creation spending to support the World Cup and keyproduct launches.
Fiscal 2013 Compared to Fiscal 2012
For fiscal 2013, constant currency revenue growth for the Emerging Marketsgeography was driven by growth in every key category and territory, led bySOCO, Brazil, and Mexico.
Constant currency footwear revenue growth for fiscal 2013 was driven bygrowth in most key categories, most notably Running, Football (Soccer), andWomen’s Training. Unit sales increased approximately 9% and averageselling price per pair increased 6%, primarily driven by selling price increases.
Fiscal 2013 constant currency apparel revenues were driven by growth inevery key category, led by Football (Soccer), Running, Sportswear, andMen’s Training. Unit sales increased approximately 10% and average sellingprice per unit increased 9%, largely attributable to price increases.
Fiscal 2013 Emerging Markets EBIT grew faster than revenue primarily drivenby gross margin improvement, partially offset by higher selling andadministrative expense as a percent of revenue. Gross margin increased 260basis points due largely to the favorable impact of price increases, theanniversary of a one-time customs duty charge in fiscal 2012, and favorablestandard foreign currency exchange rates, which more than offset theunfavorable impact of higher product costs. As a percent of revenue, sellingand administrative expense was higher due to higher operating overheadcosts to support the expansion of our DTC business and overall growth of thebusiness.
Global Brand Divisions
(Dollars in millions) Fiscal 2014 Fiscal 2013 % Change
% ChangeExcludingCurrencyChanges Fiscal 2012 % Change
% ChangeExcludingCurrencyChanges
Revenues $ 125 $ 115 9% 6% $ 111 4% 7%(Loss) Before Interest and Taxes $ (2,021) $ (1,746) 16% $ (1,479) 18%
Global Brand Divisions primarily represent demand creation, operatingoverhead, and product creation and design expenses that are centrallymanaged for the NIKE Brand. Revenues for Global Brand Divisions areprimarily attributable to NIKE Brand licensing businesses that are not part of ageographic operating segment.
Fiscal 2014 Compared to Fiscal 2013
For fiscal 2014, Global Brand Divisions’ loss before interest and taxesincreased $275 million, primarily driven by an increase in centrally managedproduct costs, increased investments in our digital infrastructure, higherdemand creation spending in the fourth quarter of fiscal 2014 to support theWorld Cup, and product creation and design initiatives.
Fiscal 2013 Compared to Fiscal 2012
For fiscal 2013, Global Brand Divisions’ loss before interest and taxesincreased $267 million, primarily driven by increased investments andmarketing support for our digital business, product creation and designinitiatives, and higher demand creation spending in the first quarter of fiscal2013 around the Olympics and European Football Championships.
Converse
(Dollars in millions) Fiscal 2014 Fiscal 2013 % Change
% ChangeExcludingCurrencyChanges Fiscal 2012 % Change
% ChangeExcludingCurrencyChanges
Revenues $ 1,684 $ 1,449 16% 15% $ 1,324 9% 10%Earnings Before Interest and Taxes $ 496 $ 425 17% $ 394 8%
In territories we define as “direct distribution markets,” Converse designs,markets, and sells products directly to distributors, wholesale customers, andto consumers through DTC operations. The largest direct distribution marketsare the United States, the United Kingdom, and China. Converse does not
own the Converse trademarks in Japan. Territories other than directdistribution markets and Japan are serviced by third-party licensees who payroyalty revenues to Converse for the use of its registered trademarks andother intellectual property rights.
NIKE, INC. 2014 Annual Report and Notice of Annual Meeting 75
FOR
M10
-K

PART II
Fiscal 2014 Compared to Fiscal 2013
Excluding changes in currency exchange rates, revenues for Converseincreased 15% for fiscal 2014. Revenue growth in direct distribution markets,which represent approximately 84% of Converse revenues, contributed 16percentage points to the total increase for fiscal 2014, while licensingrevenues decreased overall revenue by 1 percentage point. Revenues fromour direct distribution markets grew 19% for fiscal 2014 driven by growth in“comparable” direct distribution markets (i.e., markets served under a directdistribution model for comparable periods in the current and prior fiscal years),primarily the United States, China, and the United Kingdom. Comparabledirect distribution markets revenue increased 13%, contributing 12percentage points of direct distribution markets revenues growth for fiscal2014, while conversion of markets from licensed to direct distributioncontributed 7 percentage points. Comparable direct distribution markets unitsales increased 12% and average selling price per unit increased 1% for fiscal2014. The increase in average selling price per unit resulted primarily from afavorable mix of higher priced product. Due to market conversions andbusiness declines in Latin America, licensing revenues decreased 3% forfiscal 2014.
On a reported basis, EBIT at Converse grew 17% for fiscal 2014 as higherrevenues and gross margin were partially offset by higher selling andadministrative expense. Gross margin increased 80 basis points, primarilydue to growth in higher margin territories and products within our directdistribution markets. Selling and administrative expense grew faster thanrevenue for fiscal 2014 due to higher operating overhead to support growthinitiatives and DTC expansion, as well as higher demand creation spending.
Fiscal 2013 Compared to Fiscal 2012
Constant currency revenues for Converse increased 10% for fiscal 2013.Revenue growth in direct distribution markets, which representedapproximately 81% of Converse revenues, contributed 11 percentage pointsto the total increase for fiscal 2013, while licensing revenues decreased overallrevenue growth by 1 percentage point. Revenues from our direct distributionmarkets grew 15% for fiscal 2013 driven by growth in comparable directdistribution markets, primarily the United States, China, and the UnitedKingdom. Comparable direct distribution markets revenues increased 11%,contributing 10 percentage points of direct distribution markets revenuegrowth for fiscal 2013; conversion of markets from licensed to directdistribution contributed 5 percentage points. Comparable direct distributionmarkets unit sales increased 6% and average selling price per unit increased5% for fiscal 2013. The increase in average selling price per unit resultedprimarily from a higher mix of higher priced product. Due to marketconversions and business declines in Latin America, licensing revenuesdecreased 7% for fiscal 2013.
On a reported basis, EBIT for Converse grew 8% for fiscal 2013 as higherrevenues and gross margin were partially offset by higher selling andadministrative expense. Gross margin increased 120 basis points, primarilydue to growth in higher margin territories and products within our directdistribution markets. Selling and administrative expense grew faster thanrevenue for fiscal 2013 due to higher operating overhead to support growthinitiatives and DTC expansion, as well as higher demand creation spending.
Corporate(Dollars in millions) Fiscal 2014 Fiscal 2013 % Change Fiscal 2012 % ChangeRevenues $ 3 $ (17) — $ (4) —(Loss) Before Interest and Taxes $ (1,009) $ (884) 14%$ (674) 31%
Corporate revenues primarily consist of foreign currency hedge gains andlosses related to revenues generated by entities within the NIKE Brandgeographic operating segments and Converse but managed through ourcentral foreign exchange risk management program.
The Corporate loss before interest and taxes consists largely of unallocatedgeneral and administrative expenses, including expenses associated withcentrally managed departments; depreciation and amortization related to ourcorporate headquarters; unallocated insurance, benefit, and compensationprograms, including stock-based compensation; and certain foreign currencygains and losses.
In addition to the foreign currency gains and losses recognized in Corporaterevenues, foreign currency results included in gross margin are gains andlosses resulting from the difference between actual foreign currency rates andstandard rates used to record non-functional currency denominated productpurchases within the NIKE Brand geographic operating segments andConverse; related foreign currency hedge results; conversion gains andlosses arising from re-measurement of monetary assets and liabilities in non-functional currencies; and certain other foreign currency hedge results.
Fiscal 2014 Compared to Fiscal 2013
For fiscal 2014, Corporate’s loss before interest and taxes increased by $125million primarily due to the following:
• a $99 million increase in corporate overhead expense related to corporateinitiatives to support the growth of the business as well as performance-based compensation;
• a $90 million increase in foreign currency net losses, reported as acomponent of Other expense (income), net; and
• a $56 million decrease in foreign exchange losses related to the differencebetween actual foreign currency exchange rates and standard foreigncurrency exchange rates assigned to the NIKE Brand geographic operatingsegments and Converse, net of hedge gains; these losses are reported as acomponent of consolidated gross margin.
Fiscal 2013 Compared to Fiscal 2012
For fiscal 2013, Corporate’s loss before interest and taxes increased by $210million primarily due to the following:
• a $165 million increase in foreign exchange losses related to the differencebetween actual foreign currency exchange rates and standard foreigncurrency exchange rates assigned to the NIKE Brand geographic operatingsegments and Converse, net of hedge gains; these losses are reported as acomponent of consolidated gross margin;
• an $86 million increase in corporate overhead expense related to corporateinitiatives to support the growth of the business and performance-basedcompensation; and
• a $48 million decrease in foreign currency net losses, reported as acomponent of Other expense (income), net.
76

PART II
Foreign Currency Exposures and Hedging Practices
OverviewAs a global company with significant operations outside the United States, inthe normal course of business we are exposed to risk arising from changes incurrency exchange rates. Our primary foreign currency exposures arise fromthe recording of transactions denominated in non-functional currencies andthe translation of foreign currency denominated results of operations, financialposition, and cash flows into U.S. Dollars.
Our foreign exchange risk management program is intended to lessen boththe positive and negative effects of currency fluctuations on our consolidatedresults of operations, financial position, and cash flows. We manage globalforeign exchange risk centrally on a portfolio basis to address those risks thatare material to NIKE, Inc. We manage these exposures by taking advantageof natural offsets and currency correlations that exist within the portfolio and,where practical and material, by hedging a portion of the remaining exposuresusing derivative instruments such as forward contracts and options. Asdescribed below, the implementation of the NIKE Trading Company (“NTC”)and our foreign currency adjustment program enhanced our ability to manageour foreign exchange risk by increasing the natural offsets and currencycorrelation benefits that exist within our portfolio of foreign exchangeexposures. Our hedging policy is designed to partially or entirely offset theimpact of exchange rate changes on the underlying net exposures beinghedged. Where exposures are hedged, our program has the effect ofdelaying the impact of exchange rate movements on our consolidatedfinancial statements; the length of the delay is dependent upon hedgehorizons. We do not hold or issue derivative instruments for trading orspeculative purposes.
Transactional exposuresWe conduct business in various currencies and have transactions whichsubject us to foreign currency risk. Our most significant transactional foreigncurrency exposures are:
• Product Costs — NIKE’s product costs are exposed to fluctuations inforeign currencies in the following ways:
1. Product purchases denominated in currencies other than thefunctional currency of the transacting entity:
a. Some NIKE entities purchase product from the NTC, a wholly-owned sourcing hub that buys NIKE branded products fromthird-party factories, predominantly in U.S. Dollars. The NTC,whose functional currency is the U.S. Dollar, then sells theproducts to NIKE entities in their respective functional currencies.When the NTC sells to a NIKE entity with a different functionalcurrency, the result is a foreign currency exposure for the NTC.
b. Other NIKE entities purchase product directly from third-partyfactories in U.S. Dollars. These purchases generate a foreigncurrency exposure for those NIKE entities with a functionalcurrency other than the U.S. Dollar.
In both purchasing scenarios, a weaker U.S. Dollar decreases theinventory cost incurred by NIKE whereas a stronger U.S. Dollarincreases its cost.
2. Factory input costs: In January 2012, NIKE implemented a foreigncurrency adjustment program with certain factories. The program isdesigned to more effectively manage foreign currency risk byassuming certain of the factories’ foreign currency exposures, someof which are natural offsets to our existing foreign currency exposures.Under this program, our payments to these factories are adjusted forrate fluctuations in the basket of currencies (“factory currencyexposure index”) in which the labor, materials and overhead costsincurred by the factories in the production of NIKE branded products(“factory input costs”) are denominated.
For the currency within the factory currency exposure indices that isthe local or functional currency of the factory, the currency ratefluctuation affecting the product cost is recorded within Inventoriesand is recognized in Cost of sales when the related product is sold to athird-party. All currencies within the indices, excluding the U.S. Dollarand the local or functional currency of the factory, are recognized asembedded derivative contracts and are recorded at fair value throughOther expense (income), net. Refer to Note 17 — Risk Managementand Derivatives in the accompanying Notes to the ConsolidatedFinancial Statements for additional detail.
As an offset to the impacts of the fluctuating U.S. Dollar on our non-functional currency denominated product purchases describedabove, a strengthening U.S. Dollar against the foreign currencieswithin the factory currency exposure indices decreases NIKE’sU.S. Dollar inventory cost. Conversely, a weakening U.S. Dollaragainst the indexed foreign currencies increases our inventory cost.
• Non-Functional Currency Denominated External Sales — A portion of ourWestern Europe and Central & Eastern Europe geography revenues areearned in currencies other than the Euro (e.g. British Pound) but arerecognized at a subsidiary that uses the Euro as its functional currency.These sales generate a foreign currency exposure.
• Other Costs — Non-functional currency denominated costs, such asendorsement contracts, intercompany royalties and other intercompanycharges, also generate foreign currency risk though to a lesser extent.
• Non-Functional Currency Denominated Monetary Assets and Liabilities —Our global subsidiaries have various assets and liabilities, primarilyreceivables and payables, denominated in currencies other than theirfunctional currencies. These balance sheet items are subject to re-measurement, which may create fluctuations in Other expense (income),net within our consolidated results of operations.
Managing transactional exposures
Transactional exposures are managed on a portfolio basis within our foreigncurrency risk management program. We manage these exposures by takingadvantage of natural offsets and currency correlations that exist within theportfolio and may also elect to use currency forward and option contracts tohedge a portion of the remaining effect of exchange rate fluctuations onprobable forecasted future cash flows, including certain product costpurchase exposures, non-functional currency denominated external sales,and other costs described above. Generally, these are accounted for as cashflow hedges in accordance with the accounting standards for derivatives andhedging, except for hedges of the embedded derivatives component of theproduct cost exposures as discussed below.
Certain currency forward contracts used to manage the foreign exchangeexposure of non-functional currency denominated monetary assets andliabilities subject to re-measurement and the embedded derivative contractsdiscussed above are not formally designated as hedging instruments underthe accounting standards for derivatives and hedging. Accordingly, changesin fair value of these instruments are immediately recognized in Other expense(income), net and are intended to offset the foreign currency impact of the re-measurement of the related non-functional currency denominated asset orliability or the embedded derivative contract being hedged.
Refer to Note 6 — Fair Value Measurements and Note 17 – Risk Managementand Derivatives in the accompanying Notes to the Consolidated FinancialStatements for additional description of how the above financial instrumentsare valued and recorded as well as the fair value of outstanding derivatives atperiod end.
NIKE, INC. 2014 Annual Report and Notice of Annual Meeting 77
FOR
M10
-K

PART II
Translational exposuresMany of our foreign subsidiaries operate in functional currencies other thanthe U.S. Dollar. Fluctuations in currency exchange rates create volatility in ourreported results as we are required to translate the balance sheets,operational results, and cash flows of these subsidiaries into U.S. Dollars forconsolidated reporting. The translation of foreign subsidiaries’ non-U.S. Dollardenominated balance sheets into U.S. Dollars for consolidated reportingresults in a cumulative translation adjustment to Other comprehensive incomewithin the Consolidated Statements of Shareholders’ Equity. In the translationof our Consolidated Statements of Income, a weaker U.S. Dollar in relation toforeign functional currencies benefits our consolidated earnings whereas astronger U.S. Dollar reduces our consolidated earnings. The impact of foreignexchange rate fluctuations on the translation of our consolidated Revenueswas a detriment of approximately $288 million and $605 million for the yearsended May 31, 2014 and 2013, respectively. The impact of foreign exchangerate fluctuations on the translation of our Income before income taxes was adetriment of approximately $49 million and $104 million for the years endedMay 31, 2014 and 2013, respectively.
Managing translational exposures
To minimize the impact of translating foreign currency denominated revenuesand expenses into U.S. Dollars for consolidated reporting, certain foreignsubsidiaries use excess cash to purchase U.S. Dollar denominated available-for-sale investments. The variable future cash flows associated with thepurchase and subsequent sale of these U.S. Dollar denominated securities atnon-U.S. Dollar functional currency subsidiaries creates a foreign currencyexposure that qualifies for hedge accounting under the accounting standardsfor derivatives and hedging. We utilize forward contracts and/or options tomitigate the variability of the forecasted future purchases and sales of theseU.S. Dollar investments. The combination of the purchase and sale of theU.S. Dollar investment and the hedging instrument has the effect of partiallyoffsetting the year-over-year foreign currency translation impact on netearnings in the period the investments are sold. Hedges of available-for-saleinvestments are accounted for as cash flow hedges.
Refer to Note 6 — Fair Value Measurements and Note 17 — RiskManagement and Derivatives in the accompanying Notes to the ConsolidatedFinancial Statements for additional description of how the above financialinstruments are valued and recorded as well as the fair value of outstandingderivatives at period end.
We estimate the combination of translation of foreign currency-denominatedprofits from our international businesses and the year-over-year change inforeign currency related gains and losses included in Other expense (income),net had an unfavorable impact of approximately $139 million and $56 millionon our Income before income taxes for the years ended May 31, 2014 and2013, respectively.
Net investments in foreign subsidiariesWe are also exposed to the impact of foreign exchange fluctuations on ourinvestments in wholly-owned foreign subsidiaries denominated in a currencyother than the U.S. Dollar, which could adversely impact the U.S. Dollar valueof these investments and therefore the value of future repatriated earnings.We have hedged and may, in the future, hedge net investment positions incertain foreign subsidiaries to mitigate the effects of foreign exchangefluctuations on these net investments. In accordance with the accountingstandards for derivatives and hedging, the effective portion of the change infair value of the forward contracts designated as net investment hedges isrecorded in the cumulative translation adjustment component ofAccumulated other comprehensive income. Any ineffective portion isimmediately recognized in earnings as a component of Other expense(income), net. The impact of ineffective hedges was immaterial for any periodpresented. To minimize credit risk, we have structured these net investmenthedges to be generally less than six months in duration. Upon maturity, thehedges are settled based on the current fair value of the forward contractswith the realized gain or loss remaining in Other comprehensive income.There were no outstanding net investment hedges as of May 31, 2014 and2013. There were no cash flows from net investment hedge settlements forthe years ended May 31, 2014 and 2013.
Liquidity and Capital Resources
Cash Flow ActivityCash provided by operations was $3,003 million for fiscal 2014 compared to$2,968 million for fiscal 2013. Our primary source of operating cash flow forfiscal 2014 was net income of $2,693 million. Our fiscal 2014 change inworking capital was a net cash outflow of $488 million as compared to a netcash outflow of $78 million for fiscal 2013. Our investments in working capitalincreased due to higher inventory levels to support higher reported futuresorders, growth in accounts receivable reflecting the increase in sales, andhigher prepaid marketing expenses in advance of the World Cup. Theseincreases in working capital were partially offset by increases in accountspayable and accrued liabilities.
Cash used by investing activities was $1,207 million during fiscal 2014,compared to a $940 million use of cash for fiscal 2013. A major driver of thechange was a $282 million increase in additions to property, plant andequipment from $598 million in fiscal 2013 to $880 million in fiscal 2014,reflective of investments in infrastructure to support current and future growth,as well as digital capabilities. In fiscal 2014, we made $328 million in netpurchases of short-term investments (net of sales/maturities) compared to$1,140 million in net purchases (net of sales/maturities) in fiscal 2013. Cashused by investing activities in fiscal 2013 was partially offset by $786 million inproceeds from the sale of Umbro and Cole Haan.
Cash used by financing activities was $2,914 million for fiscal 2014 comparedto $1,045 million for fiscal 2013, an increase of $1,869 million. The increasewas primarily due to a $954 million increase in share repurchases to $2,628million, a $986 million decrease in net proceeds from long term debt issuance(reflecting the issuance of 10- and 30-year notes in April 2013), and a $96
million increase in dividends, partially offset by a year-on-year increase inproceeds from the exercise of stock options.
In fiscal 2014, we purchased 36.6 million shares of NIKE’s Class B CommonStock for $2,628 million, an average price of $71.80. During fiscal 2013, wecompleted the four-year, $5 billion share repurchase program approved byour Board of Directors in September 2008. Under that program, wepurchased a total of 118.8 million shares at an average price of $42.08.Subsequently, we began repurchases under a four-year, $8 billion programapproved by the Board in September 2012. As of the end of fiscal 2014, wehad repurchased 51.9 million shares at an average price of $65.83 for a totalcost of $3,417 million under this current program. We continue to expectfunding of share repurchases will come from operating cash flow, excesscash, and/or debt. The timing and the amount of shares purchased will bedictated by our capital needs and stock market conditions.
Capital ResourcesOn April 23, 2013, we filed a shelf registration statement (the “Shelf”) with theSEC which permits us to issue an unlimited amount of debt securities. TheShelf expires on April 23, 2016. On April 23, 2013, we issued $1.0 billion ofsenior notes with tranches maturing in 2023 and 2043. The 2023 senior noteswere issued in an initial aggregate principal amount of $500 million at a 2.25%fixed, annual interest rate and will mature on May 1, 2023. The 2043 seniornotes were issued in an initial aggregate principal amount of $500 million at a3.625% fixed, annual interest rate and will mature on May 1, 2043. Interest onthe senior notes is payable semi-annually on May 1 and November 1 of eachyear. The issuance resulted in gross proceeds before expenses of $998 million.
78

PART II
On November 1, 2011, we entered into a committed credit facility agreementwith a syndicate of banks which provides for up to $1 billion of borrowingswith the option to increase borrowings to $1.5 billion with lender approval.Following an extension agreement on September 17, 2013 between theCompany and the syndicate of banks, the facility matures November 1, 2017,with a one-year extension option exercisable through October 31, 2014. Noamounts were outstanding under this facility as of May 31, 2014 or 2013.
We currently have long-term debt ratings of AA- and A1 from Standard andPoor’s Corporation and Moody’s Investor Services, respectively. If our long-term debt rating were to decline, the facility fee and interest rate under ourcommitted credit facility would increase. Conversely, if our long-term debtrating were to improve, the facility fee and interest rate would decrease.Changes in our long-term debt rating would not trigger acceleration ofmaturity of any then-outstanding borrowings or any future borrowings underthe committed credit facility. Under this committed revolving credit facility, wehave agreed to various covenants. These covenants include limits on ourdisposal of fixed assets, the amount of debt secured by liens we may incur, aswell as a minimum capitalization ratio. In the event we were to have anyborrowings outstanding under this facility and failed to meet any covenant,and were unable to obtain a waiver from a majority of the banks in thesyndicate, any borrowings would become immediately due and payable. Asof May 31, 2014, we were in full compliance with each of these covenantsand believe it is unlikely we will fail to meet any of these covenants in theforeseeable future.
Liquidity is also provided by our $1 billion commercial paper program. Duringthe year ended May 31, 2014, we did not issue commercial paper, and as ofMay 31, 2014, there were no outstanding borrowings under this program. Wemay continue to issue commercial paper or other debt securities during fiscal2015 depending on general corporate needs. We currently have short-termdebt ratings of A1+ and P1 from Standard and Poor’s Corporation andMoody’s Investor Services, respectively.
As of May 31, 2014, we had cash, cash equivalents, and short-terminvestments totaling $5.1 billion, of which $2.5 billion was held by our foreignsubsidiaries. Cash equivalents and short-term investments consist primarily ofdeposits held at major banks, money market funds, commercial paper,corporate notes, U.S. Treasury obligations, U.S. government sponsored
enterprise obligations, and other investment grade fixed incomesecurities. Our fixed income investments are exposed to both credit andinterest rate risk. All of our investments are investment grade to minimize ourcredit risk. While individual securities have varying durations, as of May 31,2014 the average duration of our short-term investments and cashequivalents portfolio was 126 days.
To date we have not experienced difficulty accessing the credit markets orincurred higher interest costs. Future volatility in the capital markets, however,may increase costs associated with issuing commercial paper or other debtinstruments or affect our ability to access those markets. We believe thatexisting cash, cash equivalents, short-term investments, and cash generatedby operations, together with access to external sources of funds as describedabove, will be sufficient to meet our domestic and foreign capital needs in theforeseeable future.
We utilize a variety of tax planning and financing strategies to manage ourworldwide cash and deploy funds to locations where they are needed. Weroutinely repatriate a portion of our foreign earnings for which U.S. taxes havepreviously been provided. We also indefinitely reinvest a significant portion ofour foreign earnings, and our current plans do not demonstrate a need torepatriate these earnings. Should we require additional capital in the UnitedStates, we may elect to repatriate indefinitely reinvested foreign funds or raisecapital in the United States through debt. If we were to repatriate indefinitelyreinvested foreign funds, we would be required to accrue and pay additionalU.S. taxes less applicable foreign tax credits. If we elect to raise capital in theUnited States through debt, we would incur additional interest expense.
Off-Balance Sheet ArrangementsIn connection with various contracts and agreements, we routinely provideindemnification relating to the enforceability of intellectual property rights,coverage for legal issues that arise and other items where we are acting as theguarantor. Currently, we have several such agreements in place. However,based on our historical experience and the estimated probability of future loss,we have determined that the fair value of such indemnification is not materialto our financial position or results of operations.
Contractual ObligationsOur significant long-term contractual obligations as of May 31, 2014 and significant endorsement contracts entered into through the date of this report are asfollows:
Description of Commitment Cash Payments Due During the Year Ending May 31,(In millions) 2015 2016 2017 2018 2019 Thereafter TotalOperating Leases $ 427 $ 399 $ 366 $ 311 $ 251 $ 1,050 $ 2,804Capital Leases 36 35 1 1 1 — 74Long-term Debt(1) 46 145 79 56 37 1,488 1,851Endorsement Contracts(2) 991 787 672 524 349 1,381 4,704Product Purchase Obligations(3) 3,688 — — — — — 3,688Other(4) 309 108 78 7 3 12 517TOTAL $ 5,497 $ 1,474 $ 1,196 $ 899 $ 641 $ 3,931 $ 13,638
(1) The cash payments due for long-term debt include estimated interest payments. Estimates of interest payments are based on outstanding principal amounts, applicable fixed interest ratesor currently effective interest rates as of May 31, 2014 (if variable), timing of scheduled payments, and the term of the debt obligations.
(2) The amounts listed for endorsement contracts represent approximate amounts of base compensation and minimum guaranteed royalty fees we are obligated to pay athlete and sportteam endorsers of our products. Actual payments under some contracts may be higher than the amounts listed as these contracts provide for bonuses to be paid to the endorsers basedupon athletic achievements and/or royalties on product sales in future periods. Actual payments under some contracts may also be lower as these contracts include provisions for reducedpayments if athletic performance declines in future periods.In addition to the cash payments, we are obligated to furnish our endorsers with NIKE product for their use. It is not possible to determine how much we will spend on this product on anannual basis as the contracts generally do not stipulate a specific amount of cash to be spent on the product. The amount of product provided to the endorsers will depend on manyfactors, including general playing conditions, the number of sporting events in which they participate, and our own decisions regarding product and marketing initiatives. In addition, thecosts to design, develop, source, and purchase the products furnished to the endorsers are incurred over a period of time and are not necessarily tracked separately from similar costsincurred for products sold to customers.
(3) We generally order product at least four to five months in advance of sale based primarily on futures orders received from customers. The amounts listed for product purchase obligationsrepresent agreements (including open purchase orders) to purchase products in the ordinary course of business that are enforceable and legally binding and that specify all significantterms. In some cases, prices are subject to change throughout the production process. The reported amounts exclude product purchase liabilities included in Accounts payable on theConsolidated Balance Sheet as of May 31, 2014.
(4) Other amounts primarily include service and marketing commitments made in the ordinary course of business. The amounts represent the minimum payments required by legally bindingcontracts and agreements that specify all significant terms, including open purchase orders for non-product purchases. The reported amounts exclude those liabilities included inAccounts payable or Accrued liabilities on the Consolidated Balance Sheet as of May 31, 2014.
NIKE, INC. 2014 Annual Report and Notice of Annual Meeting 79
FOR
M10
-K
PART II
The total liability for uncertain tax positions was $506 million, excluding related interest and penalties, at May 31, 2014. We are not able to reasonably estimatewhen or if cash payments of the long-term liability for uncertain tax positions will occur.
We also have the following outstanding short-term debt obligations as of May 31, 2014. Refer to Note 7 — Short-Term Borrowings and Credit Lines in theaccompanying Notes to the Consolidated Financial Statements for further description and interest rates related to the short-term debt obligations listed below.
(In millions)Outstanding asof May 31, 2014
Notes payable, due at mutually agreed-upon dates within one year of issuance or on demand $ 167Payable to Sojitz America for the purchase of inventories, generally due 60 days after shipment of goods from a foreign port 60
As of May 31, 2014, letters of credit of $135 million were outstanding, which were generally issued for the purchase of inventory and as guarantees of theCompany’s performance under certain self-insurance and other programs.
Recently Adopted Accounting Standards
In July 2013, the Financial Accounting Standards Board (“FASB”) issued anaccounting standards update intended to provide guidance on thepresentation of unrecognized tax benefits, reflecting the manner in which anentity would settle, at the reporting date, any additional income taxes thatwould result from the disallowance of a tax position when net operating losscarryforwards, similar tax losses, or tax credit carryforwards exist. Thisaccounting standard is effective for us beginning June 1, 2014 and earlyadoption is permitted. We early adopted this guidance and the adoption didnot have a material impact on our consolidated financial position or results ofoperations.
In July 2012, the FASB issued an accounting standards update intended tosimplify how an entity tests indefinite-lived intangible assets other thangoodwill for impairment by providing entities with an option to perform aqualitative assessment to determine whether further impairment testing is
necessary. This accounting standard update was effective for us beginningJune 1, 2013. The adoption of this standard did not have a material impact onour consolidated financial position or results of operations.
In December 2011, the FASB issued guidance enhancing disclosurerequirements surrounding the nature of an entity’s right to offset and relatedarrangements associated with its financial instruments and derivativeinstruments. This new guidance requires companies to disclose both grossand net information about instruments and transactions eligible for offset inthe statement of financial position and instruments and transactions subjectto master netting arrangements. This new guidance was effective for usbeginning June 1, 2013. As this guidance only requires expandeddisclosures, the adoption had no impact on our consolidated financialposition or results of operations.
Recently Issued Accounting Standards
In May 2014, the FASB issued an accounting standards update that replacesexisting revenue recognition guidance. Among other things, the updatedguidance requires companies to recognize revenue in a way that depicts thetransfer of promised goods or services to customers in an amount thatreflects the consideration to which the entity expects to be entitled in
exchange for those goods or services. The new guidance is effective for theCompany beginning June 1, 2017. We are currently evaluating the effect theguidance will have on the Company’s consolidated financial position or resultsof operations.
Critical Accounting Policies
Our previous discussion and analysis of our financial condition and results ofoperations are based upon our consolidated financial statements, which havebeen prepared in accordance with accounting principles generally acceptedin the United States of America. The preparation of these financial statementsrequires us to make estimates and judgments that affect the reportedamounts of assets, liabilities, revenues and expenses, and related disclosureof contingent assets and liabilities.
We believe that the estimates, assumptions, and judgments involved in theaccounting policies described below have the greatest potential impact onour financial statements, so we consider these to be our critical accountingpolicies. Because of the uncertainty inherent in these matters, actual resultscould differ from the estimates we use in applying the critical accountingpolicies. Certain of these critical accounting policies affect working capitalaccount balances, including the policies for revenue recognition, theallowance for uncollectible accounts receivable, inventory reserves, andcontingent payments under endorsement contracts. These policies requirethat we make estimates in the preparation of our financial statements as of agiven date. However, since our business cycle is relatively short, actual resultsrelated to these estimates are generally known within the six-month periodfollowing the financial statement date. Thus, these policies generally affectonly the timing of reported amounts across two to three fiscal quarters.
Within the context of these critical accounting policies, we are not currentlyaware of any reasonably likely events or circumstances that would result inmaterially different amounts being reported.
Revenue RecognitionWe record wholesale revenues when title passes and the risks and rewards ofownership have passed to the customer, based on the terms of sale. Titlepasses generally upon shipment or upon receipt by the customer dependingon the country of the sale and the agreement with the customer. Retail storerevenues are recorded at the time of sale.
In some instances, we ship product directly from our supplier to the customerand recognize revenue when the product is delivered to and accepted by thecustomer. Our revenues may fluctuate in cases when our customers delayaccepting shipment of product for periods of up to several weeks.
In certain countries outside of the United States, precise information regardingthe date of receipt by the customer is not readily available. In these cases, weestimate the date of receipt by the customer based upon historical deliverytimes by geographic location. On the basis of our tests of actual transactions,we have no indication that these estimates have been materially inaccuratehistorically.
80

PART II
As part of our revenue recognition policy, we record estimated sales returns,discounts, and miscellaneous claims from customers as reductions torevenues at the time revenues are recorded. Our post invoice sales discountsconsist of contractual programs with certain customers or discretionarydiscounts that are expected to be granted to certain customers at a later date.We base our estimates on historical rates of product returns, discounts andclaims, specific identification of outstanding claims and outstanding returnsnot yet received from customers, and estimated returns, discounts, andclaims expected but not yet finalized with our customers. Actual returns,discounts, and claims in any future period are inherently uncertain and thusmay differ from our estimates. If actual or expected future returns, discounts,and claims were significantly greater or lower than the reserves we hadestablished, we would record a reduction or increase to net revenues in theperiod in which we made such determination.
Allowance for Uncollectible AccountsReceivableWe make ongoing estimates relating to the ability to collect our accountsreceivable and maintain an allowance for estimated losses resulting from theinability of our customers to make required payments. In determining theamount of the allowance, we consider our historical level of credit losses andmake judgments about the creditworthiness of significant customers basedon ongoing credit evaluations. Since we cannot predict future changes in thefinancial stability of our customers, actual future losses from uncollectibleaccounts may differ from our estimates. If the financial condition of ourcustomers were to deteriorate, resulting in their inability to make payments, alarger allowance might be required. In the event we determine that a smalleror larger allowance is appropriate, we would record a credit or a charge toOperating overhead expense in the period in which such a determination ismade.
Inventory ReservesWe also make ongoing estimates relating to the net realizable value ofinventories based upon our assumptions about future demand and marketconditions. If we estimate that the net realizable value of our inventory is lessthan the cost of the inventory recorded on our books, we record a reserveequal to the difference between the cost of the inventory and the estimatednet realizable value. This reserve is recorded as a charge to Cost of sales. Ifchanges in market conditions result in reductions in the estimated netrealizable value of our inventory below our previous estimate, we wouldincrease our reserve in the period in which we made such a determination andrecord a charge to Cost of sales.
Contingent Payments under EndorsementContractsA significant portion of our Demand creation expense relates to paymentsunder endorsement contracts. In general, endorsement payments areexpensed uniformly over the term of the contract. However, certain contractelements may be accounted for differently, based upon the facts andcircumstances of each individual contract.
Certain contracts provide for contingent payments to endorsers based uponspecific achievements in their sports (e.g., winning a championship). Werecord demand creation expense for these amounts when the endorserachieves the specific goal.
Certain contracts provide for variable payments based upon endorsersmaintaining a level of performance in their sport over an extended period oftime (e.g., maintaining a specified ranking in a sport for a year). Theseamounts are reported in Demand creation expense when we determine that itis probable that the specified level of performance will be maintainedthroughout the period. In these instances, to the extent that actual paymentsto the endorser differ from our estimate due to changes in the endorser’sperformance, increased or decreased Demand creation expense may bereported in a future period.
Certain contracts provide for royalty payments to endorsers based upon apredetermined percentage of sales of particular products. We expense thesepayments in Cost of sales as the related sales occur. In certain contracts, weoffer minimum guaranteed royalty payments. For contracts for which weestimate we will not meet the minimum guaranteed amount of royalty feesthrough sales of product, we record the amount of the guaranteed payment inexcess of that earned through sales of product in Demand creation expenseuniformly over the remaining guarantee period.
Property, Plant and Equipment and Definite-Lived AssetsProperty, plant and equipment, including buildings, equipment, andcomputer hardware and software are recorded at cost (including, in somecases, the cost of internal labor) and are depreciated over the estimateduseful life. Changes in circumstances (such as technological advances orchanges to our business operations) can result in differences between theactual and estimated useful lives. In those cases where we determine that theuseful life of a long-lived asset should be shortened, we increase depreciationexpense over the remaining useful life to depreciate the asset’s net book valueto its salvage value.
We review the carrying value of long-lived assets or asset groups to be usedin operations whenever events or changes in circumstances indicate that thecarrying amount of the assets might not be recoverable. Factors that wouldnecessitate an impairment assessment include a significant adverse changein the extent or manner in which an asset is used, a significant adversechange in legal factors or the business climate that could affect the value ofthe asset, or a significant decline in the observable market value of an asset,among others. If such facts indicate a potential impairment, we would assessthe recoverability of an asset group by determining if the carrying value of theasset group exceeds the sum of the projected undiscounted cash flowsexpected to result from the use and eventual disposition of the assets over theremaining economic life of the primary asset in the asset group. If therecoverability test indicates that the carrying value of the asset group is notrecoverable, we will estimate the fair value of the asset group usingappropriate valuation methodologies that would typically include an estimateof discounted cash flows. Any impairment would be measured as thedifference between the asset group’s carrying amount and its estimated fairvalue.
Goodwill and Indefinite-Lived Intangible AssetsWe perform annual impairment tests on goodwill and intangible assets withindefinite lives in the fourth quarter of each fiscal year, or when events occur orcircumstances change that would, more likely than not, reduce the fair valueof a reporting unit or an intangible asset with an indefinite life below its carryingvalue. Events or changes in circumstances that may trigger interimimpairment reviews include significant changes in business climate, operatingresults, planned investments in the reporting unit, planned divestitures, or anexpectation that the carrying amount may not be recoverable, among otherfactors. We may first assess qualitative factors to determine whether it is morelikely than not that the fair value of a reporting unit is less than its carryingamount. If, after assessing the totality of events and circumstances, wedetermine that it is more likely than not that the fair value of the reporting unit isgreater than its carrying amount, the two-step impairment test isunnecessary. The two-step impairment test requires us to estimate the fairvalue of our reporting units. If the carrying value of a reporting unit exceeds itsfair value, the goodwill of that reporting unit is potentially impaired and weproceed to step two of the impairment analysis. In step two of the analysis, wemeasure and record an impairment loss equal to the excess of the carryingvalue of the reporting unit’s goodwill over its implied fair value, if any.
We generally base our measurement of the fair value of a reporting unit on ablended analysis of the present value of future discounted cash flows and themarket valuation approach. The discounted cash flows model indicates thefair value of the reporting unit based on the present value of the cash flowsthat we expect the reporting unit to generate in the future. Our significant
NIKE, INC. 2014 Annual Report and Notice of Annual Meeting 81
FOR
M10
-K
PART II
estimates in the discounted cash flows model include: our weighted averagecost of capital; long-term rate of growth and profitability of the reporting unit’sbusiness; and working capital effects. The market valuation approachindicates the fair value of the business based on a comparison of the reportingunit to comparable publicly traded companies in similar lines of business.Significant estimates in the market valuation approach model includeidentifying similar companies with comparable business factors such as size,growth, profitability, risk, and return on investment, and assessingcomparable revenue and operating income multiples in estimating the fairvalue of the reporting unit.
Indefinite-lived intangible assets primarily consist of acquired trade names andtrademarks. We may first perform a qualitative assessment to determinewhether it is more likely than not that an indefinite-lived intangible asset isimpaired. If, after assessing the totality of events and circumstances, wedetermine that it is more likely than not that the indefinite-lived intangible assetis not impaired, no quantitative fair value measurement is necessary. If aquantitative fair value measurement calculation is required for these intangibleassets, we utilize the relief-from-royalty method. This method assumes thattrade names and trademarks have value to the extent that their owner isrelieved of the obligation to pay royalties for the benefits received from them.This method requires us to estimate the future revenue for the related brands,the appropriate royalty rate, and the weighted average cost of capital.
Fair Value MeasurementsFor financial assets and liabilities measured at fair value on a recurring basis,fair value is the price we would receive to sell an asset or pay to transfer aliability in an orderly transaction with a market participant at the measurementdate. In general, and where applicable, we use quoted prices in activemarkets for identical assets or liabilities to determine the fair values of ourfinancial instruments. This pricing methodology applies to our Level 1investments, including U.S. Treasury securities.
In the absence of active markets for identical assets or liabilities, suchmeasurements involve developing assumptions based on market observabledata, including quoted prices for similar assets or liabilities in active marketsand quoted prices for identical or similar assets or liabilities in markets that arenot active. This pricing methodology applies to our Level 2 investments suchas commercial paper and bonds, U.S. Agency securities, and money marketfunds.
Level 3 investments are valued using internally developed models withunobservable inputs. Assets and liabilities measured using unobservableinputs are an immaterial portion of our portfolio.
A majority of our available-for-sale securities are priced by pricing vendors andare generally Level 1 or Level 2 investments as these vendors either provide aquoted market price in an active market or use observable inputs withoutapplying significant adjustments in their pricing. Observable inputs includebroker quotes, interest rates and yield curves observable at commonlyquoted intervals, volatilities, and credit risks. Our fair value processes includecontrols that are designed to ensure appropriate fair values arerecorded. These controls include an analysis of period-over-periodfluctuations and comparison to another independent pricing vendor.
Hedge Accounting for DerivativesWe use forward and option contracts to hedge certain anticipated foreigncurrency exchange transactions as well as certain non-functional currencymonetary assets and liabilities. When the specific criteria to qualify for hedgeaccounting has been met, changes in the fair value of contracts hedgingprobable forecasted future cash flows are recorded in Other comprehensiveincome, rather than Net income, until the underlying hedged transactionaffects Net income. In most cases, this results in gains and losses on hedgederivatives being released from Other comprehensive income into Net incomesometime after the maturity of the derivative. One of the criteria for thisaccounting treatment is that the notional value of forward and optioncontracts should not be in excess of specifically identified anticipatedtransactions. By their very nature, our estimates of anticipated transactions
may fluctuate over time and may ultimately vary from actual transactions.When anticipated transaction estimates or actual transaction amounts declinebelow hedged levels, or if it is no longer probable that a forecasted transactionwill occur by the end of the originally specified time period or within anadditional two-month period of time thereafter, we are required to reclassifythe cumulative change in fair value of the over-hedged portion of the relatedhedge contract from Other comprehensive income to Other expense(income), net during the quarter in which the decrease occurs.
We have used and may in the future use, forward contracts or options tohedge our investment in the net assets of certain international subsidiaries tooffset foreign currency translation related to our net investment in thosesubsidiaries. The change in fair value of the forward contracts or optionshedging our net investments is reported in the cumulative translationadjustment component of Accumulated other comprehensive income withinTotal shareholders’ equity, to the extent effective, to offset the foreigncurrency translation adjustments on those investments. As the value of ourunderlying net investments in wholly-owned international subsidiaries isknown at the time a hedge is placed, the designated hedge is matched to theportion of our net investment at risk. Accordingly, the variability involved in netinvestment hedges is substantially less than that of other types of hedgetransactions and we do not expect any material ineffectiveness. We consider,on a quarterly basis, the need to redesignate existing hedge relationshipsbased on changes in the underlying net investment. Should the level of our netinvestment decrease below hedged levels, the cumulative change in fair valueof the over-hedged portion of the related hedge contract would be reportedas Other expense (income), net during the period in which changes occur.
Stock-based CompensationWe account for stock-based compensation by estimating the fair value ofstock-based compensation on the date of grant using the Black-Scholesoption pricing model. The Black-Scholes option pricing model requires theinput of highly subjective assumptions including volatility. Expected volatility isestimated based on implied volatility in market traded options on our commonstock with a term greater than one year, along with other factors. Our decisionto use implied volatility was based on the availability of actively traded optionson our common stock and our assessment that implied volatility is morerepresentative of future stock price trends than historical volatility. If factorschange and we use different assumptions for estimating stock-basedcompensation expense in future periods, stock-based compensationexpense may differ materially in the future from that recorded in the currentperiod.
Income TaxesWe record valuation allowances against our deferred tax assets, whennecessary. Realization of deferred tax assets (such as net operating losscarry-forwards) is dependent on future taxable earnings and is thereforeuncertain. At least quarterly, we assess the likelihood that our deferred taxasset balance will be recovered from future taxable income. To the extent webelieve that recovery is not likely, we establish a valuation allowance againstour net deferred tax asset, which increases our Income tax expense in theperiod when such determination is made.
In addition, we have not recorded U.S. income tax expense for foreignearnings that we have determined to be indefinitely reinvested outside theUnited States, thus reducing our overall Income tax expense. The amount ofearnings designated as indefinitely reinvested offshore is based upon theactual deployment of such earnings in our offshore assets and ourexpectations of the future cash needs of our U.S. and foreign entities. Incometax considerations are also a factor in determining the amount of foreignearnings to be indefinitely reinvested offshore.
We carefully review all factors that drive the ultimate disposition of foreignearnings determined to be reinvested offshore and apply stringent standardsto overcome the presumption of repatriation. Despite this approach, becausethe determination involves our future plans and expectations of future events,the possibility exists that amounts declared as indefinitely reinvested offshoremay ultimately be repatriated. For instance, the actual cash needs of our U.S.
82

PART II
entities may exceed our current expectations, or the actual cash needs of ourforeign entities may be less than our current expectations. This would result inadditional Income tax expense in the year we determined that amounts wereno longer indefinitely reinvested offshore. Conversely, our approach may alsoresult in a determination that accumulated foreign earnings (for which U.S.income taxes have been provided) will be indefinitely reinvested offshore. Inthis case, our Income tax expense would be reduced in the year of suchdetermination.
On an interim basis, we estimate what our effective tax rate will be for the fullfiscal year. This estimated annual effective tax rate is then applied to the year-to-date Income before income taxes excluding infrequently occurring orunusual items, to determine the year-to-date Income tax expense. Theincome tax effects of infrequent or unusual items are recognized in the interimperiod in which they occur. As the fiscal year progresses, we continually refineour estimate based upon actual events and earnings by jurisdiction during theyear. This continual estimation process periodically results in a change to ourexpected effective tax rate for the fiscal year. When this occurs, we adjust theincome tax provision during the quarter in which the change in estimateoccurs.
On a quarterly basis, we evaluate the probability that a tax position will beeffectively sustained and the appropriateness of the amount recognized foruncertain tax positions based on factors including changes in facts orcircumstances, changes in tax law, settled audit issues, and new auditactivity. Changes in our assessment may result in the recognition of a taxbenefit or an additional charge to the tax provision in the period our
assessment changes. We recognize interest and penalties related to incometax matters in Income tax expense.
Other ContingenciesIn the ordinary course of business, we are involved in legal proceedingsregarding contractual and employment relationships, product liability claims,trademark rights, and a variety of other matters. We record contingentliabilities resulting from claims against us, including related legal costs, when aloss is assessed to be probable and the amount of the loss is reasonablyestimable. Assessing probability of loss and estimating probable lossesrequires analysis of multiple factors, including in some cases judgments aboutthe potential actions of third-party claimants and courts. Recorded contingentliabilities are based on the best information available and actual losses in anyfuture period are inherently uncertain. If future adjustments to estimatedprobable future losses or actual losses exceed our recorded liability for suchclaims, we would record additional charges as Other expense (income), netduring the period in which the actual loss or change in estimate occurred. Inaddition to contingent liabilities recorded for probable losses, we disclosecontingent liabilities when there is a reasonable possibility that the ultimateloss will materially exceed the recorded liability. While we cannot predict theoutcome of pending legal matters with certainty, we do not believe anycurrently identified claim, proceeding, or litigation, either individually or inaggregate, will have a material impact on our results of operations, financialposition, or cash flows.
NIKE, INC. 2014 Annual Report and Notice of Annual Meeting 83
FOR
M10
-K

PART II
ITEM 7A. Quantitative and Qualitative Disclosures aboutMarket Risk
In the normal course of business and consistent with established policies andprocedures, we employ a variety of financial instruments to manage exposureto fluctuations in the value of foreign currencies and interest rates. It is ourpolicy to utilize these financial instruments only where necessary to financeour business and manage such exposures; we do not enter into thesetransactions for trading or speculative purposes.
We are exposed to foreign currency fluctuations, primarily as a result of ourinternational sales, product sourcing, and funding activities. Our foreignexchange risk management program is intended to lessen both the positiveand negative effects of currency fluctuations on our consolidated results ofoperations, financial position, and cash flows. We use forward exchangecontracts and options to hedge certain anticipated but not yet firmlycommitted transactions as well as certain firm commitments and the relatedreceivables and payables, including third-party and intercompanytransactions. We have, and may in the future, also use forward contracts oroptions to hedge our investment in the net assets of certain internationalsubsidiaries to offset foreign currency translation adjustments related to ournet investment in those subsidiaries. Where exposures are hedged, our
program has the effect of delaying the impact of exchange rate movementson our Consolidated Financial Statements.
The timing for hedging exposures, as well as the type and duration of thehedge instruments employed, are guided by our hedging policies anddetermined based upon the nature of the exposure and prevailing marketconditions. Typically, the Company may enter into hedge contracts starting12 to 24 months in advance of the forecasted transaction and may placeincremental hedges up to 100% of the exposure by the time the forecastedtransaction occurs. Hedged transactions are principally denominated inEuros, British Pounds, and Japanese Yen. See section “Foreign CurrencyExposures and Hedging Practices” under Item 7 for additional detail.
Our earnings are also exposed to movements in short- and long-term marketinterest rates. Our objective in managing this interest rate exposure is to limitthe impact of interest rate changes on earnings and cash flows and to reduceoverall borrowing costs. To achieve these objectives, we maintain a mix ofcommercial paper, bank loans, and fixed rate debt of varying maturities andhave entered into receive-fixed, pay-variable interest rate swaps for a portionof our fixed rate debt.
Market Risk Measurement
We monitor foreign exchange risk, interest rate risk, and related derivativesusing a variety of techniques including a review of market value, sensitivityanalysis, and Value-at-Risk (“VaR”). Our market-sensitive derivative and otherfinancial instruments are foreign currency forward contracts, foreign currencyoption contracts, interest rate swaps, intercompany loans denominated innon-functional currencies, fixed interest rate U.S. Dollar denominated debt,and fixed interest rate Japanese Yen denominated debt.
We use VaR to monitor the foreign exchange risk of our foreign currencyforward and foreign currency option derivative instruments only. The VaRdetermines the maximum potential one-day loss in the fair value of theseforeign exchange rate-sensitive financial instruments. The VaR modelestimates assume normal market conditions and a 95% confidence level.There are various modeling techniques that can be used in the VaRcomputation. Our computations are based on interrelationships betweencurrencies and interest rates (a “variance/co-variance” technique). Theseinterrelationships are a function of foreign exchange currency market changesand interest rate changes over the preceding one year period. The value offoreign currency options does not change on a one-to-one basis withchanges in the underlying currency rate. We adjust the potential loss in optionvalue for the estimated sensitivity (the “delta” and “gamma”) to changes in theunderlying currency rate. This calculation reflects the impact of foreigncurrency rate fluctuations on the derivative instruments only and does notinclude the impact of such rate fluctuations on non-functional currencytransactions (such as anticipated transactions, firm commitments, cashbalances, and accounts and loans receivable and payable), including thosewhich are hedged by these instruments.
The VaR model is a risk analysis tool and does not purport to represent actuallosses in fair value that we will incur nor does it consider the potential effect offavorable changes in market rates. It also does not represent the full extent ofthe possible loss that may occur. Actual future gains and losses will differ from
those estimated because of changes or differences in market rates andinterrelationships, hedging instruments and hedge percentages, timing, andother factors.
The estimated maximum one-day loss in fair value on our foreign currencysensitive derivative financial instruments, derived using the VaR model, was$50 million and $34 million at May 31, 2014 and 2013, respectively. The VaRincreased year-over-year as a result of an increase in the total notional value ofour foreign currency derivative portfolio combined with a longer averageduration on our outstanding trades at May 31, 2014. Such a hypothetical lossin the fair value of our derivatives would be offset by increases in the value ofthe underlying transactions being hedged. The average monthly change in thefair values of foreign currency forward and foreign currency option derivativeinstruments was $70 million and $49 million during fiscal 2014 and fiscal2013, respectively.
The instruments not included in the VaR are intercompany loansdenominated in non-functional currencies, fixed interest rate Japanese Yendenominated debt, fixed interest rate U.S. Dollar denominated debt, andinterest rate swaps. Intercompany loans and related interest amounts areeliminated in consolidation. Furthermore, our non-functional currencyintercompany loans are substantially hedged against foreign exchange riskthrough the use of forward contracts, which are included in the VaRcalculation above. Therefore, we consider the interest rate and foreigncurrency market risks associated with our non-functional currencyintercompany loans to be immaterial to our consolidated financial position,results from operations and cash flows.
Details of third-party debt and interest rate swaps are provided in the tablebelow. The table presents principal cash flows and related weighted averageinterest rates by expected maturity dates. Weighted average interest rates forthe fixed rate swapped to floating rate debt reflect the effective interest rates atMay 31, 2014.
84
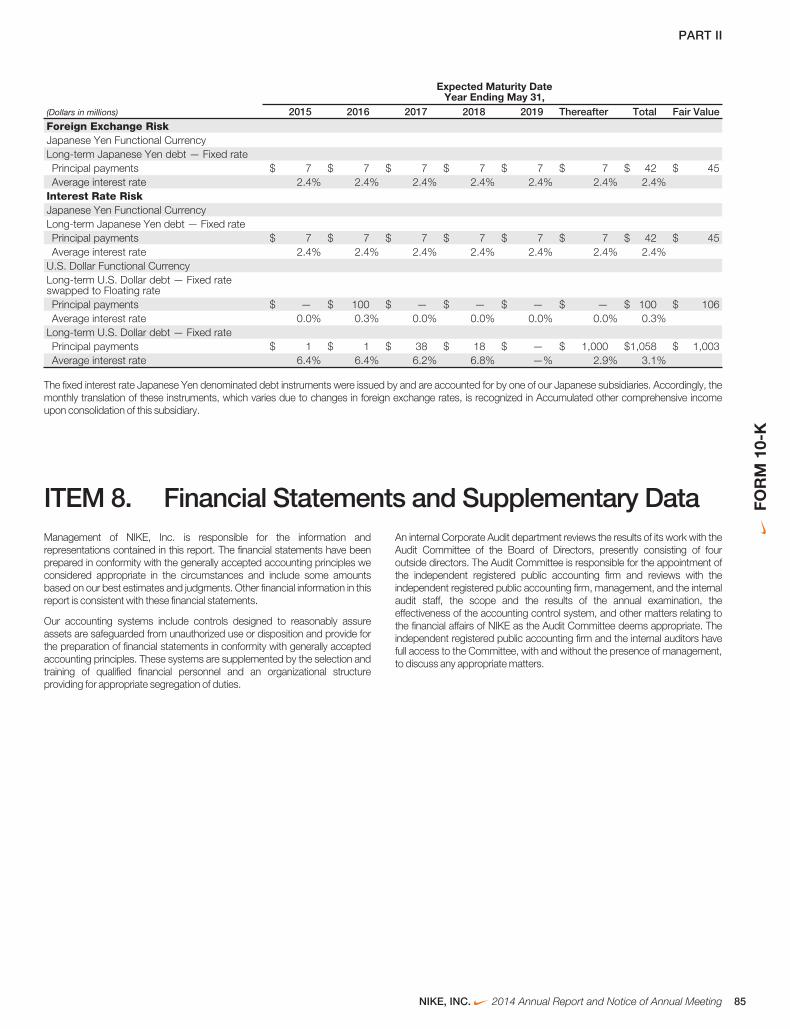
PART II
Expected Maturity DateYear Ending May 31,
(Dollars in millions) 2015 2016 2017 2018 2019 Thereafter Total Fair ValueForeign Exchange RiskJapanese Yen Functional CurrencyLong-term Japanese Yen debt — Fixed ratePrincipal payments $ 7 $ 7 $ 7 $ 7 $ 7 $ 7 $ 42 $ 45Average interest rate 2.4% 2.4% 2.4% 2.4% 2.4% 2.4% 2.4%
Interest Rate RiskJapanese Yen Functional CurrencyLong-term Japanese Yen debt — Fixed ratePrincipal payments $ 7 $ 7 $ 7 $ 7 $ 7 $ 7 $ 42 $ 45Average interest rate 2.4% 2.4% 2.4% 2.4% 2.4% 2.4% 2.4%
U.S. Dollar Functional CurrencyLong-term U.S. Dollar debt — Fixed rateswapped to Floating ratePrincipal payments $ — $ 100 $ — $ — $ — $ — $ 100 $ 106Average interest rate 0.0% 0.3% 0.0% 0.0% 0.0% 0.0% 0.3%
Long-term U.S. Dollar debt — Fixed ratePrincipal payments $ 1 $ 1 $ 38 $ 18 $ — $ 1,000 $1,058 $ 1,003Average interest rate 6.4% 6.4% 6.2% 6.8% —% 2.9% 3.1%
The fixed interest rate Japanese Yen denominated debt instruments were issued by and are accounted for by one of our Japanese subsidiaries. Accordingly, themonthly translation of these instruments, which varies due to changes in foreign exchange rates, is recognized in Accumulated other comprehensive incomeupon consolidation of this subsidiary.
ITEM 8. Financial Statements and Supplementary DataManagement of NIKE, Inc. is responsible for the information andrepresentations contained in this report. The financial statements have beenprepared in conformity with the generally accepted accounting principles weconsidered appropriate in the circumstances and include some amountsbased on our best estimates and judgments. Other financial information in thisreport is consistent with these financial statements.
Our accounting systems include controls designed to reasonably assureassets are safeguarded from unauthorized use or disposition and provide forthe preparation of financial statements in conformity with generally acceptedaccounting principles. These systems are supplemented by the selection andtraining of qualified financial personnel and an organizational structureproviding for appropriate segregation of duties.
An internal Corporate Audit department reviews the results of its work with theAudit Committee of the Board of Directors, presently consisting of fouroutside directors. The Audit Committee is responsible for the appointment ofthe independent registered public accounting firm and reviews with theindependent registered public accounting firm, management, and the internalaudit staff, the scope and the results of the annual examination, theeffectiveness of the accounting control system, and other matters relating tothe financial affairs of NIKE as the Audit Committee deems appropriate. Theindependent registered public accounting firm and the internal auditors havefull access to the Committee, with and without the presence of management,to discuss any appropriate matters.
NIKE, INC. 2014 Annual Report and Notice of Annual Meeting 85
FOR
M10
-K

PART II
Management’s Annual Report on Internal Control Over Financial Reporting
Management is responsible for establishing and maintaining adequate internalcontrol over financial reporting, as such term is defined in Rule 13(a)-15(f) andRule 15(d)-15(f) of the Securities Exchange Act of 1934, as amended. Internalcontrol over financial reporting is a process designed to provide reasonableassurance regarding the reliability of financial reporting and the preparation ofthe financial statements for external purposes in accordance with generallyaccepted accounting principles in the United States of America. Internalcontrol over financial reporting includes those policies and procedures that:(i) pertain to the maintenance of records that, in reasonable detail, accuratelyand fairly reflect the transactions and dispositions of assets of the Company;(ii) provide reasonable assurance that transactions are recorded as necessaryto permit preparation of financial statements in accordance with generallyaccepted accounting principles, and that receipts and expenditures of theCompany are being made only in accordance with authorizations of ourmanagement and directors; and (iii) provide reasonable assurance regardingprevention or timely detection of unauthorized acquisition, use, or dispositionof assets of the Company that could have a material effect on the financialstatements.
While “reasonable assurance” is a high level of assurance, it does not meanabsolute assurance. Because of its inherent limitations, internal control overfinancial reporting may not prevent or detect every misstatement and instance
of fraud. Controls are susceptible to manipulation, especially in instances offraud caused by the collusion of two or more people, including our seniormanagement. Also, projections of any evaluation of effectiveness to futureperiods are subject to the risk that controls may become inadequate becauseof changes in conditions, or that the degree of compliance with the policies orprocedures may deteriorate.
Under the supervision and with the participation of our Chief Executive Officerand Chief Financial Officer, our management conducted an evaluation of theeffectiveness of our internal control over financial reporting based upon theframework in Internal Control — Integrated Framework (1992) issued by theCommittee of Sponsoring Organizations of the Treadway Commission(COSO). Based on the results of our evaluation, our management concludedthat our internal control over financial reporting was effective as of May 31,2014.
PricewaterhouseCoopers LLP, an independent registered public accountingfirm, has audited (1) the Consolidated Financial Statements and (2) theeffectiveness of our internal control over financial reporting as of May 31,2014, as stated in their report herein.
Mark G. Parker Donald W. Blair
President and Chief Executive Officer Chief Financial Officer
86

PART II
Report of Independent Registered Public Accounting Firm
To the Board of Directors and Shareholders of NIKE, Inc.:
In our opinion, the consolidated financial statements listed in the indexappearing under Item 15(a)(1) present fairly, in all material respects, thefinancial position of NIKE, Inc. and its subsidiaries at May 31, 2014 and 2013,and the results of their operations and their cash flows for each of the threeyears in the period ended May 31, 2014 in conformity with accountingprinciples generally accepted in the United States of America. In addition, inour opinion, the financial statement schedule listed in the index appearingunder Item 15(a)(2) presents fairly, in all material respects, the information setforth therein when read in conjunction with the related consolidated financialstatements. Also in our opinion, the Company maintained, in all materialrespects, effective internal control over financial reporting as of May 31, 2014,based on criteria established in Internal Control — Integrated Framework(1992) issued by the Committee of Sponsoring Organizations of theTreadway Commission (COSO). The Company’s management is responsiblefor these financial statements and financial statement schedule, formaintaining effective internal control over financial reporting and for itsassessment of the effectiveness of internal control over financial reporting,included in Management’s Annual Report on Internal Control Over FinancialReporting appearing under Item 8. Our responsibility is to express opinions onthese financial statements, on the financial statement schedule, and on theCompany’s internal control over financial reporting based on our integratedaudits. We conducted our audits in accordance with the standards of thePublic Company Accounting Oversight Board (United States). Thosestandards require that we plan and perform the audits to obtain reasonableassurance about whether the financial statements are free of materialmisstatement and whether effective internal control over financial reportingwas maintained in all material respects. Our audits of the financial statementsincluded examining, on a test basis, evidence supporting the amounts anddisclosures in the financial statements, assessing the accounting principlesused and significant estimates made by management, and evaluating theoverall financial statement presentation. Our audit of internal control over
financial reporting included obtaining an understanding of internal control overfinancial reporting, assessing the risk that a material weakness exists, andtesting and evaluating the design and operating effectiveness of internalcontrol based on the assessed risk. Our audits also included performing suchother procedures as we considered necessary in the circumstances. Webelieve that our audits provide a reasonable basis for our opinions.
A company’s internal control over financial reporting is a process designed toprovide reasonable assurance regarding the reliability of financial reportingand the preparation of financial statements for external purposes inaccordance with generally accepted accounting principles. A company’sinternal control over financial reporting includes those policies and proceduresthat (i) pertain to the maintenance of records that, in reasonable detail,accurately and fairly reflect the transactions and dispositions of the assets ofthe Company; (ii) provide reasonable assurance that transactions arerecorded as necessary to permit preparation of financial statements inaccordance with generally accepted accounting principles, and that receiptsand expenditures of the Company are being made only in accordance withauthorizations of management and directors of the Company; and (iii) providereasonable assurance regarding prevention or timely detection ofunauthorized acquisition, use, or disposition of the Company’s assets thatcould have a material effect on the financial statements.
Because of its inherent limitations, internal control over financial reporting maynot prevent or detect misstatements. Also, projections of any evaluation ofeffectiveness to future periods are subject to the risk that controls maybecome inadequate because of changes in conditions, or that the degree ofcompliance with the policies or procedures may deteriorate.
/S/ PRICEWATERHOUSECOOPERS LLP
Portland, OregonJuly 25, 2014
NIKE, INC. 2014 Annual Report and Notice of Annual Meeting 87
FOR
M10
-K

PART II
NIKE, Inc. Consolidated Statements of Income
Year Ended May 31,(In millions, except per share data) 2014 2013 2012Income from continuing operations:Revenues $ 27,799 $ 25,313 $ 23,331Cost of sales 15,353 14,279 13,183Gross profit 12,446 11,034 10,148Demand creation expense 3,031 2,745 2,607Operating overhead expense 5,735 5,051 4,472Total selling and administrative expense 8,766 7,796 7,079Interest expense (income), net (Notes 6, 7, and 8) 33 (3) 4Other expense (income), net (Note 17) 103 (15) 54Income before income taxes 3,544 3,256 3,011Income tax expense (Note 9) 851 805 754
NET INCOME FROM CONTINUING OPERATIONS 2,693 2,451 2,257NET INCOME (LOSS) FROM DISCONTINUED OPERATIONS — 21 (46)
NET INCOME $ 2,693 $ 2,472 $ 2,211Earnings per share from continuing operations:Basic earnings per common share (Notes 1 and 12) $ 3.05 $ 2.74 $ 2.45Diluted earnings per common share (Notes 1 and 12) $ 2.97 $ 2.68 $ 2.40
Earnings per share from discontinued operations:Basic earnings per common share (Notes 1 and 12) $ — $ 0.02 $ (0.05)Diluted earnings per common share (Notes 1 and 12) $ — $ 0.02 $ (0.05)
Dividends declared per common share $ 0.93 $ 0.81 $ 0.70
The accompanying Notes to Consolidated Financial Statements are an integral part of this statement.
88

PART II
NIKE, Inc. Consolidated Statements of ComprehensiveIncome
Year Ended May 31,(In millions) 2014 2013 2012
Net income $ 2,693 $ 2,472 $ 2,211Other comprehensive income (loss), net of tax:Change in net foreign currency translation adjustment(1) (32) 38 (277)Change in net gains (losses) on cash flow hedges(2) (161) 12 304Change in net gains (losses) on net investment hedges(3) — — 45Change in net gains (losses) on other(4) 4 (8) (18)Change in release of cumulative translation loss related to Umbro(5) — 83 —
Total other comprehensive income (loss), net of tax (189) 125 54TOTAL COMPREHENSIVE INCOME $ 2,504 $ 2,597 $ 2,265
(1) Net of tax benefit (expense) of $0 million, $(13) million, and $0 million, respectively.
(2) Net of tax benefit (expense) of $18 million, $(22) million, and $(22) million, respectively.
(3) Net of tax benefit of $0 million, $0 million, and $0 million, respectively.
(4) Net of tax benefit of $0 million, $1 million, and $0 million, respectively.
(5) Net of tax benefit of $0 million, $47 million, and $0 million, respectively.
The accompanying Notes to Consolidated Financial Statements are an integral part of this statement.
NIKE, INC. 2014 Annual Report and Notice of Annual Meeting 89
FOR
M10
-K

PART II
NIKE, Inc. Consolidated Balance Sheets
May 31,(In millions) 2014 2013
ASSETSCurrent assets:Cash and equivalents $ 2,220 $ 3,337Short-term investments (Note 6) 2,922 2,628Accounts receivable, net (Note 1) 3,434 3,117Inventories (Notes 1 and 2) 3,947 3,484Deferred income taxes (Note 9) 355 308Prepaid expenses and other current assets (Notes 6 and 17) 818 756
Total current assets 13,696 13,630Property, plant and equipment, net (Note 3) 2,834 2,452Identifiable intangible assets, net (Note 4) 282 289Goodwill (Note 4) 131 131Deferred income taxes and other assets (Notes 6, 9, and 17) 1,651 1,043
TOTAL ASSETS $ 18,594 $ 17,545LIABILITIES AND SHAREHOLDERS’ EQUITYCurrent liabilities:Current portion of long-term debt (Note 8) $ 7 $ 57Notes payable (Note 7) 167 98Accounts payable (Note 7) 1,930 1,669Accrued liabilities (Notes 5, 6, and 17) 2,491 2,036Income taxes payable (Note 9) 432 84Liabilities of discontinued operations (Note 15) — 18
Total current liabilities 5,027 3,962Long-term debt (Note 8) 1,199 1,210Deferred income taxes and other liabilities (Notes 6, 9, 13 and 17) 1,544 1,292Commitments and contingencies (Note 16)Redeemable preferred stock (Note 10) — —Shareholders’ equity:Common stock at stated value (Note 11):Class A convertible — 178 and 178 shares outstanding — —Class B — 692 and 716 shares outstanding 3 3
Capital in excess of stated value 5,865 5,184Accumulated other comprehensive income (Note 14) 85 274Retained earnings 4,871 5,620
Total shareholders’ equity 10,824 11,081TOTAL LIABILITIES AND SHAREHOLDERS’ EQUITY $ 18,594 $ 17,545
The accompanying Notes to Consolidated Financial Statements are an integral part of this statement.
90

PART II
NIKE, Inc. Consolidated Statements of Cash Flows
Year Ended May 31,(In millions) 2014 2013 2012Cash provided by operations:Net income $ 2,693 $ 2,472 $ 2,211Income charges (credits) not affecting cash:Depreciation 518 438 373Deferred income taxes (11) 20 (59)Stock-based compensation (Note 11) 177 174 130Amortization and other 114 66 23Net gain on divestitures — (124) —
Changes in certain working capital components and other assets and liabilities:(Increase) decrease in accounts receivable (298) 142 (323)(Increase) in inventories (505) (219) (815)(Increase) in prepaid expenses and other current assets (210) (28) (141)Increase in accounts payable, accrued liabilities and income taxes payable 525 27 425
Cash provided by operations 3,003 2,968 1,824Cash (used) provided by investing activities:Purchases of short-term investments (5,386) (4,133) (3,245)Maturities of short-term investments 3,932 1,663 2,663Sales of short-term investments 1,126 1,330 1,721Additions to property, plant and equipment (880) (598) (563)Disposals of property, plant and equipment 3 14 2Proceeds from divestitures — 786 —Increase in other assets, net of other liabilities (2) (2) (14)Settlement of net investment hedges — — 22
Cash (used) provided by investing activities (1,207) (940) 586Cash used by financing activities:Net proceeds from long-term debt issuance — 986 —Long-term debt payments, including current portion (60) (49) (203)Increase (decrease) in notes payable 75 10 (47)Payments on capital lease obligations (17) — —Proceeds from exercise of stock options and other stock issuances 383 313 468Excess tax benefits from share-based payment arrangements 132 72 115Repurchase of common stock (2,628) (1,674) (1,814)Dividends — common and preferred (799) (703) (619)
Cash used by financing activities (2,914) (1,045) (2,100)Effect of exchange rate changes 1 100 67Net (decrease) increase in cash and equivalents (1,117) 1,083 377Cash and equivalents, beginning of year 3,337 2,254 1,877CASH AND EQUIVALENTS, END OF YEAR $ 2,220 $ 3,337 $ 2,254Supplemental disclosure of cash flow information:Cash paid during the year for:Interest, net of capitalized interest $ 53 $ 20 $ 29Income taxes 856 702 638
Non-cash additions to property, plant and equipment 167 137 99Dividends declared and not paid 209 188 165
The accompanying Notes to Consolidated Financial Statements are an integral part of this statement.
NIKE, INC. 2014 Annual Report and Notice of Annual Meeting 91
FOR
M10
-K

PART II
NIKE, Inc. Consolidated Statements of Shareholders’ Equity
Common Stock Capital inExcess
of StatedValue
AccumulatedOther
ComprehensiveIncome
RetainedEarnings Total
Class A Class B(In millions, except per share data) Shares Amount Shares AmountBalance at May 31, 2011 180 $ — 756 $ 3 $ 3,944 $ 95 $ 5,751 $ 9,793Stock options exercised 18 528 528Repurchase of Class BCommon Stock (40) (12) (1,793) (1,805)Dividends on common stock($0.70 per share) (639) (639)Issuance of shares to employees 2 57 57Stock-based compensation (Note 11) 130 130Forfeiture of shares from employees — (6) (4) (10)Net income 2,211 2,211Other comprehensive income 54 54Balance at May 31, 2012 180 $ — 736 $ 3 $ 4,641 $ 149 $ 5,526 $ 10,319Stock options exercised 10 322 322Conversion to Class B Common Stock (2) 2 —Repurchase of Class B Common Stock (34) (10) (1,647) (1,657)Dividends on common stock ($0.81 per share) (727) (727)Issuance of shares to employees 2 65 65Stock-based compensation (Note 11) 174 174Forfeiture of shares from employees — (8) (4) (12)Net income 2,472 2,472Other comprehensive income 125 125Balance at May 31, 2013 178 $ — 716 $ 3 $ 5,184 $ 274 $ 5,620 $ 11,081Stock options exercised 11 445 445Repurchase of Class B Common Stock (37) (11) (2,617) (2,628)Dividends on common stock ($0.93 per share) (821) (821)Issuance of shares to employees 2 78 78Stock-based compensation (Note 11) 177 177Forfeiture of shares from employees — (8) (4) (12)Net income 2,693 2,693Other comprehensive income (189) (189)Balance at May 31, 2014 178 $ — 692 $ 3 $ 5,865 $ 85 $ 4,871 $ 10,824
The accompanying Notes to Consolidated Financial Statements are an integral part of this statement.
92

PART II
Notes to Consolidated Financial Statements
Note 1 Summary of Significant Accounting Policies . . . . . . . . . . . . . . . . . . . . . . . . . . . . . . . . . . . . . . . . . . . . . . . . . . . . . . . . . . . . . . . . . . . . . . . . . . . . . . 94
Note 2 Inventories . . . . . . . . . . . . . . . . . . . . . . . . . . . . . . . . . . . . . . . . . . . . . . . . . . . . . . . . . . . . . . . . . . . . . . . . . . . . . . . . . . . . . . . . . . . . . . . . . . . . . . . . . . . . . . . . . . . . . . . . . . . .100
Note 3 Property, Plant and Equipment . . . . . . . . . . . . . . . . . . . . . . . . . . . . . . . . . . . . . . . . . . . . . . . . . . . . . . . . . . . . . . . . . . . . . . . . . . . . . . . . . . . . . . . . . . . . . . . .100
Note 4 Identifiable Intangible Assets and Goodwill . . . . . . . . . . . . . . . . . . . . . . . . . . . . . . . . . . . . . . . . . . . . . . . . . . . . . . . . . . . . . . . . . . . . . . . . . . . . . . . .100
Note 5 Accrued Liabilities . . . . . . . . . . . . . . . . . . . . . . . . . . . . . . . . . . . . . . . . . . . . . . . . . . . . . . . . . . . . . . . . . . . . . . . . . . . . . . . . . . . . . . . . . . . . . . . . . . . . . . . . . . . . . . . . . .100
Note 6 Fair Value Measurements . . . . . . . . . . . . . . . . . . . . . . . . . . . . . . . . . . . . . . . . . . . . . . . . . . . . . . . . . . . . . . . . . . . . . . . . . . . . . . . . . . . . . . . . . . . . . . . . . . . . . . . .101
Note 7 Short-Term Borrowings and Credit Lines . . . . . . . . . . . . . . . . . . . . . . . . . . . . . . . . . . . . . . . . . . . . . . . . . . . . . . . . . . . . . . . . . . . . . . . . . . . . . . . . . . .102
Note 8 Long-Term Debt . . . . . . . . . . . . . . . . . . . . . . . . . . . . . . . . . . . . . . . . . . . . . . . . . . . . . . . . . . . . . . . . . . . . . . . . . . . . . . . . . . . . . . . . . . . . . . . . . . . . . . . . . . . . . . . . . . . .103
Note 9 Income Taxes . . . . . . . . . . . . . . . . . . . . . . . . . . . . . . . . . . . . . . . . . . . . . . . . . . . . . . . . . . . . . . . . . . . . . . . . . . . . . . . . . . . . . . . . . . . . . . . . . . . . . . . . . . . . . . . . . . . . . . . .103
Note 10 Redeemable Preferred Stock . . . . . . . . . . . . . . . . . . . . . . . . . . . . . . . . . . . . . . . . . . . . . . . . . . . . . . . . . . . . . . . . . . . . . . . . . . . . . . . . . . . . . . . . . . . . . . . . . . .105
Note 11 Common Stock and Stock-Based Compensation . . . . . . . . . . . . . . . . . . . . . . . . . . . . . . . . . . . . . . . . . . . . . . . . . . . . . . . . . . . . . . . . . . . . . . .106
Note 12 Earnings Per Share . . . . . . . . . . . . . . . . . . . . . . . . . . . . . . . . . . . . . . . . . . . . . . . . . . . . . . . . . . . . . . . . . . . . . . . . . . . . . . . . . . . . . . . . . . . . . . . . . . . . . . . . . . . . . . . .107
Note 13 Benefit Plans . . . . . . . . . . . . . . . . . . . . . . . . . . . . . . . . . . . . . . . . . . . . . . . . . . . . . . . . . . . . . . . . . . . . . . . . . . . . . . . . . . . . . . . . . . . . . . . . . . . . . . . . . . . . . . . . . . . . . . . . .107
Note 14 Accumulated Other Comprehensive Income . . . . . . . . . . . . . . . . . . . . . . . . . . . . . . . . . . . . . . . . . . . . . . . . . . . . . . . . . . . . . . . . . . . . . . . . . . . . . .108
Note 15 Discontinued Operations . . . . . . . . . . . . . . . . . . . . . . . . . . . . . . . . . . . . . . . . . . . . . . . . . . . . . . . . . . . . . . . . . . . . . . . . . . . . . . . . . . . . . . . . . . . . . . . . . . . . . . . . .108
Note 16 Commitments and Contingencies . . . . . . . . . . . . . . . . . . . . . . . . . . . . . . . . . . . . . . . . . . . . . . . . . . . . . . . . . . . . . . . . . . . . . . . . . . . . . . . . . . . . . . . . . . . . .109
Note 17 Risk Management and Derivatives . . . . . . . . . . . . . . . . . . . . . . . . . . . . . . . . . . . . . . . . . . . . . . . . . . . . . . . . . . . . . . . . . . . . . . . . . . . . . . . . . . . . . . . . . . . .109
Note 18 Operating Segments and Related Information . . . . . . . . . . . . . . . . . . . . . . . . . . . . . . . . . . . . . . . . . . . . . . . . . . . . . . . . . . . . . . . . . . . . . . . . . . . .112
NIKE, INC. 2014 Annual Report and Notice of Annual Meeting 93
FOR
M10
-K

PART II
NOTE 1 — Summary of Significant Accounting Policies
Description of BusinessNIKE, Inc. is a worldwide leader in the design, development and worldwidemarketing and selling of athletic footwear, apparel, equipment, accessoriesand services. Wholly-owned NIKE, Inc. subsidiaries include Converse Inc.,which designs, markets and distributes casual sneakers, apparel andaccessories and Hurley International LLC, which designs, markets anddistributes action sports and youth lifestyle footwear, apparel andaccessories.
Basis of ConsolidationThe Consolidated Financial Statements include the accounts of NIKE, Inc.and its subsidiaries (the “Company”). All significant intercompany transactionsand balances have been eliminated.
The Company completed the sale of Cole Haan during the third quarterended February 28, 2013 and completed the sale of Umbro during thesecond quarter ended November 30, 2012. As a result, the Company reportsthe operating results of Cole Haan and Umbro in the Net income (loss) fromdiscontinued operations line in the Consolidated Statements of Income for allperiods presented. In addition, the liabilities associated with these businessesare reported as Liabilities of discontinued operations in the ConsolidatedBalance Sheets (refer to Note 15 — Discontinued Operations). Unlessotherwise indicated, the disclosures accompanying the ConsolidatedFinancial Statements reflect the Company’s continuing operations.
On November 15, 2012, the Company announced a two-for-one split of bothNIKE Class A and Class B Common shares. The stock split was a 100percent stock dividend payable on December 24, 2012 to shareholders ofrecord at the close of business December 10, 2012. Common stock begantrading at the split-adjusted price on December 26, 2012. All share numbersand per share amounts presented reflect the stock split.
ReclassificationsCertain prior year amounts have been reclassified to conform to fiscal 2014presentation.
RevisionsThe Company has historically capitalized costs associated with internallygenerated patents and trademarks, and amortized these assets over the legalterm of the patents and trademarks. During the fourth quarter of fiscal 2014,management determined that these capitalized costs were not accuratelyidentified with specific patent or trademark assets, and therefore, concludedthat amounts previously capitalized should have been expensed as incurred.Accordingly, the Consolidated Financial Statements have been revised tocorrectly expense costs associated with internally developed patents and
trademarks in the period incurred and to reverse expenses for amortization ofpreviously capitalized costs. The revisions resulted in a decrease in Netincome from continuing operations of $13 million and $12 million for the yearsended May 31, 2013 and 2012, respectively. Identifiable intangible assetsdecreased $93 million at May 31, 2013 and Retained earnings at May 31,2013 decreased $75 million as a result of the cumulative adjustment for priorperiods. Cash provided by operations decreased $26 million and $23 millionfor the years ended May 31, 2013 and 2012, respectively, while Cash used byinvesting activities decreased $26 million for the year ended May 31, 2013and Cash provided by investing activities increased by $23 million for the yearended May 31, 2012.
Also, in the fourth quarter of fiscal 2014, the Company revised certain prioryear amounts in the Consolidated Statements of Cash Flows to eliminateintercompany transfers of short-term investments, to correctly reflect thepurchases, sales and maturities of short-term investments related to theCompany’s hedging program involving U.S. Dollar denominated available-for-sale securities, and to correctly classify certain investment holdings as Short-term investments. For the year ended May 31, 2013, the revisions resulted ina net increase in Purchases of short-term investments of $431 million, a netincrease in Maturities of short-term investments of $162 million, and a netincrease in Sales of short-term investments of $332 million, which caused anet decrease of $63 million in Cash used by investing activities. For the yearended May 31, 2012, the revisions resulted in a net increase in Purchases ofshort-term investments of $540 million, a net increase in Maturities of short-term investments of $78 million, and a net increase in Sales of short-terminvestments of $477 million, which caused an increase of $15 million in Cashprovided by investing activities. For the year ended May 31, 2012, theserevisions also resulted in a decrease of $78 million in Cash and equivalents,beginning of year and a $63 million decrease in Cash and equivalents, end ofyear.
Certain prior year amounts have also been revised in the ConsolidatedBalance Sheets to correctly recognize certain inventory amounts held by thirdparties, which were identified during the third quarter of fiscal 2014 andresulted in a $50 million increase to both Inventories and Accrued liabilities atMay 31, 2013. In addition, prior year amounts on the ConsolidatedStatements of Cash Flows were revised to correctly reflect the related cashflow impacts of $22 million and $10 million for the years ended May 31, 2013and 2012, respectively. This revision had no impact on Cash provided byoperations or Net (decrease) increase in cash and equivalents, for any year.
The Company also revised certain prior period amounts in the ConsolidatedStatements of Cash Flows to correctly reflect non-cash additions to property,plant, and equipment, which were identified during the second quarter offiscal 2014. For the year ended May 31, 2013, this revision decreased Cashprovided by operations and decreased Cash used by investing activities,each by $38 million. For the year ended May 31, 2012, this revisiondecreased Cash provided by operations and increased Cash provided byinvesting activities, each by $34 million.
94

PART II
The Company assessed the materiality of these misstatements on priorperiods’ financial statements in accordance with SEC Staff AccountingBulletin (“SAB”) No. 99, Materiality, codified in ASC 250 (“ASC 250”),Presentation of Financial Statements, and concluded that thesemisstatements were not material to any prior annual or interim periods.Accordingly, in accordance with ASC 250 (SAB No. 108, Considering the
Effects of Prior Year Misstatements when Quantifying Misstatements inCurrent Year Financial Statements), the Consolidated Financial Statements asof May 31, 2013 and 2012, and the years then ended, which are presentedherein, have been revised. The following are selected line items from theCompany’s Consolidated Financial Statements illustrating the effect of thesecorrections and the correction of other immaterial errors:
NIKE, Inc. Consolidated Statements of IncomeYear Ended May 31, 2013 Year Ended May 31, 2012
(In millions, except per share data)As
Reported AdjustmentAs
RevisedAs
Reported AdjustmentAs
Revised
Total selling and administrative expense $ 7,780 $ 16 $ 7,796 $ 7,065 $ 14 $ 7,079Income before income taxes 3,272 (16) 3,256 3,025 (14) 3,011Income tax expense 808 (3) 805 756 (2) 754
NET INCOME FROM CONTINUING OPERATIONS 2,464 (13) 2,451 2,269 (12) 2,257NET INCOME $ 2,485 $ (13) $ 2,472 $ 2,223 $ (12) $ 2,211
Earnings per share from continuing operations:Basic earnings per common share $ 2.75 $ (0.01) $ 2.74 $ 2.47 $ (0.02) $ 2.45Diluted earnings per common share $ 2.69 $ (0.01) $ 2.68 $ 2.42 $ (0.02) $ 2.40
Earnings per share for NIKE Inc.Basic earnings per common share $ 2.77 $ (0.01) $ 2.76 $ 2.42 $ (0.02) $ 2.40Diluted earnings per common share $ 2.71 $ (0.01) $ 2.70 $ 2.37 $ (0.02) $ 2.35
NIKE, Inc. Consolidated Statements of Comprehensive IncomeYear Ended May 31, 2013 Year Ended May 31, 2012
(In millions)As
Reported AdjustmentAs
RevisedAs
Reported AdjustmentAs
Revised
Net income $ 2,485 $ (13) $ 2,472 $ 2,223 $ (12) $ 2,211TOTAL COMPREHENSIVE INCOME $ 2,610 $ (13) $ 2,597 $ 2,277 $ (12) $ 2,265
NIKE, Inc. Consolidated Balance SheetMay 31, 2013
(In millions)As
Reported AdjustmentAs
Revised
ASSETSInventories $ 3,434 $ 50 $ 3,484Prepaid expenses and other current assets 802 (46) 756
Total current assets 13,626 4 13,630Identifiable intangible assets, net 382 (93) 289Deferred income taxes and other assets 993 50 1,043
TOTAL ASSETS $ 17,584 $ (39) $17,545LIABILITIES AND SHAREHOLDERS’ EQUITYNotes payable $ 121 $ (23) $ 98Accounts payable 1,646 23 1,669Accrued liabilities 1,986 50 2,036Income taxes payable 98 (14) 84
Total current liabilities 3,926 36 3,962Retained earnings 5,695 (75) 5,620
Total shareholders’ equity 11,156 (75) 11,081TOTAL LIABILITIES AND SHAREHOLDERS’ EQUITY $ 17,584 $ (39) $17,545
NIKE, INC. 2014 Annual Report and Notice of Annual Meeting 95
FOR
M10
-K

PART II
NIKE, Inc. Consolidated Statements of Cash FlowsYear Ended May 31, 2013 Year Ended May 31, 2012
(In millions)As
Reported AdjustmentAs
RevisedAs
Reported AdjustmentAs
RevisedCash provided by operations:Net income $ 2,485 $ (13) $ 2,472 $ 2,223 $ (12) $ 2,211Income charges (credits) not affecting cash:Deferred income taxes 21 (1) 20 (60) 1 (59)Amortization and other 75 (9) 66 32 (9) 23(Increase) in inventories (197) (22) (219) (805) (10) (815)Increase in accounts payable, accrued liabilities and income taxespayable 41 (14) 27 470 (45) 425
Cash provided by operations 3,027 (59) 2,968 1,899 (75) 1,824Cash (used) provided by investing activities:Purchases of short-term investments (3,702) (431) (4,133) (2,705) (540) (3,245)Maturities of short-term investments 1,501 162 1,663 2,585 78 2,663Sales of short-term investments 998 332 1,330 1,244 477 1,721Additions to property, plant and equipment (636) 38 (598) (597) 34 (563)Increase in other assets, net of other liabilities (28) 26 (2) (37) 23 (14)
Cash (used) provided by investing activities (1,067) 127 (940) 514 72 586Cash used by financing activities:Increase (decrease) in notes payable 15 (5) 10 (65) 18 (47)
Cash used by financing activities (1,040) (5) (1,045) (2,118) 18 (2,100)Net (decrease) increase in cash and equivalents 1,020 63 1,083 362 15 377Cash and equivalents, beginning of year 2,317 (63) 2,254 1,955 (78) 1,877CASH AND EQUIVALENTS, END OF YEAR $ 3,337 $ — $ 3,337 $ 2,317 $ (63) $ 2,254
NIKE, Inc. Consolidated Statements of Shareholders’ EquityRetained Earnings Total Shareholders’ Equity
(In millions)As
Reported AdjustmentAs
RevisedAs
Reported AdjustmentAs
Revised
Balance at May 31, 2011 $ 5,801 $ (50) $ 5,751 $ 9,843 $ (50) $ 9,793Net income 2,223 (12) 2,211 2,223 (12) 2,211Balance at May 31, 2012 $ 5,588 $ (62) $ 5,526 $ 10,381 $ (62) $10,319Net income 2,485 (13) 2,472 2,485 (13) 2,472Balance at May 31, 2013 $ 5,695 $ (75) $ 5,620 $ 11,156 $ (75) $11,081
Recognition of RevenuesWholesale revenues are recognized when title and the risks and rewards ofownership have passed to the customer, based on the terms of sale. Thisoccurs upon shipment or upon receipt by the customer depending on thecountry of the sale and the agreement with the customer. Retail storerevenues are recorded at the time of sale. Provisions for post-invoice salesdiscounts, returns and miscellaneous claims from customers are estimatedand recorded as a reduction to revenue at the time of sale. Post-invoice salesdiscounts consist of contractual programs with certain customers ordiscretionary discounts that are expected to be granted to certain customersat a later date. Estimates of discretionary discounts, returns and claims arebased on historical rates, specific identification of outstanding claims andoutstanding returns not yet received from customers, and estimateddiscounts, returns and claims expected but not yet finalized withcustomers. As of May 31, 2014 and 2013, the Company’s reserve balancesfor post-invoice sales discounts, returns and miscellaneous claims were $610million and $531 million, respectively.
Cost of SalesCost of sales consists primarily of inventory costs, as well as warehousingcosts (including the cost of warehouse labor), third-party royalties, certainforeign currency hedge gains and losses, and research, design anddevelopment costs.
Shipping and Handling CostsShipping and handling costs are expensed as incurred and included in Costof sales.
Operating Overhead ExpenseOperating overhead expense consists primarily of payroll and benefit relatedcosts, rent, depreciation and amortization, professional services, andmeetings and travel.
Demand Creation ExpenseDemand creation expense consists of advertising and promotion costs,including costs of endorsement contracts, television, digital and printadvertising, brand events, and retail brand presentation. Advertisingproduction costs are expensed the first time an advertisement is run.Advertising placement costs are expensed in the month the advertisingappears, while costs related to brand events are expensed when the eventoccurs. Costs related to retail brand presentation are expensed when thepresentation is completed and delivered.
A significant amount of the Company’s promotional expenses result frompayments under endorsement contracts. Accounting for endorsementpayments is based upon specific contract provisions. Generally,endorsement payments are expensed on a straight-line basis over the term ofthe contract after giving recognition to periodic performance complianceprovisions of the contracts. Prepayments made under contracts are includedin Prepaid expenses and other current assets or Deferred income taxes andother assets depending on the period to which the prepayment applies.
Certain contracts provide for contingent payments to endorsers based uponspecific achievements in their sports (e.g., winning a championship). TheCompany records Demand creation expense for these amounts when theendorser achieves the specific goal.
96

PART II
Certain contracts provide for variable payments based upon endorsersmaintaining a level of performance in their sport over an extended period oftime (e.g., maintaining a specified ranking in a sport for a year). Theseamounts are recorded in Demand creation expense when the Companydetermines that it is probable that the specified level of performance will bemaintained throughout the period. In these instances, to the extent that actualpayments to the endorser differ from the Company’s estimate due tochanges in the endorser’s performance, increased or decreased Demandcreation expense may be recorded in a future period.
Certain contracts provide for royalty payments to endorsers based upon apredetermined percentage of sales of particular products. The Companyexpenses these payments in Cost of sales as the related sales occur. Incertain contracts, the Company offers minimum guaranteed royaltypayments. For contracts for which the Company estimates it will not meet theminimum guaranteed amount of royalty fees through sales of product, theCompany records the amount of the guaranteed payment in excess of thatearned through sales of product in Demand creation expense uniformly overthe remaining guarantee period.
Through cooperative advertising programs, the Company reimburses retailcustomers for certain costs of advertising the Company’s products. TheCompany records these costs in Demand creation expense at the point intime when it is obligated to its customers for the costs, which is when therelated revenues are recognized. This obligation may arise prior to the relatedadvertisement being run.
Total advertising and promotion expenses were $3,031 million, $2,745million, and $2,607 million for the years ended May 31, 2014, 2013 and 2012,respectively. Prepaid advertising and promotion expenses totaled $516million and $386 million at May 31, 2014 and 2013, respectively, and wererecorded in Prepaid expenses and other current assets and Deferred incometaxes and other assets depending on the period to which the prepaymentapplies.
Cash and EquivalentsCash and equivalents represent cash and short-term, highly liquidinvestments, including commercial paper, U.S. Treasury, U.S. Agency, andcorporate debt securities with maturities of three months or less at date ofpurchase.
Short-Term InvestmentsShort-term investments consist of highly liquid investments, includingcommercial paper, U.S. Treasury, U.S. Agency, and corporate debtsecurities, with maturities over three months from the date of purchase. Debtsecurities that the Company has the ability and positive intent to hold tomaturity are carried at amortized cost. At May 31, 2014 and 2013, theCompany did not hold any short-term investments that were classified astrading or held-to-maturity.
At May 31, 2014 and 2013, Short-term investments consisted of available-for-sale securities. Available-for-sale securities are recorded at fair value withunrealized gains and losses reported, net of tax, in Other comprehensiveincome, unless unrealized losses are determined to be other than temporary.Realized gains and losses on the sale of securities are determined by specificidentification. The Company considers all available-for-sale securities,including those with maturity dates beyond 12 months, as available tosupport current operational liquidity needs and therefore classifies allsecurities with maturity dates beyond three months at the date of purchase ascurrent assets within Short-term investments on the Consolidated BalanceSheets.
Refer to Note 6 — Fair Value Measurements for more information on theCompany’s short-term investments.
Allowance for Uncollectible AccountsReceivableAccounts receivable consists primarily of amounts receivable fromcustomers. The Company makes ongoing estimates relating to thecollectability of its accounts receivable and maintains an allowance forestimated losses resulting from the inability of its customers to make requiredpayments. In determining the amount of the allowance, the Companyconsiders historical levels of credit losses and makes judgments about thecreditworthiness of significant customers based on ongoing creditevaluations. Accounts receivable with anticipated collection dates greaterthan 12 months from the balance sheet date and related allowances areconsidered non-current and recorded in Deferred income taxes and otherassets. The allowance for uncollectible accounts receivable was $78 millionand $104 million at May 31, 2014 and 2013, respectively, of which $37 millionand $54 million, respectively, was classified as long-term and recorded inDeferred income taxes and other assets.
Inventory ValuationInventories are stated at lower of cost or market and valued on either anaverage or specific identification cost basis. For inventories in transit thatrepresent direct shipments to customers, the related inventory and cost ofsales is recognized on a specific identification basis. Inventory costs primarilyconsist of product cost from the Company’s suppliers, as well as freight,import duties, taxes, insurance and logistics and other handling fees.
Property, Plant and Equipment andDepreciationProperty, plant and equipment are recorded at cost. Depreciation isdetermined on a straight-line basis for buildings and leasehold improvementsover 2 to 40 years and for machinery and equipment over 2 to 15 years.
Depreciation and amortization of assets used in manufacturing, warehousingand product distribution are recorded in Cost of sales. Depreciation andamortization of other assets are recorded in Total selling and administrativeexpense.
Software Development CostsInternal Use Software. Expenditures for major software purchases andsoftware developed for internal use are capitalized and amortized over a 2 to10 year period on a straight-line basis. The Company’s policy provides for thecapitalization of external direct costs of materials and services associated withdeveloping or obtaining internal use computer software. In addition, theCompany also capitalizes certain payroll and payroll-related costs foremployees who are directly associated with internal use computer softwareprojects. The amount of capitalizable payroll costs with respect to theseemployees is limited to the time directly spent on such projects. Costsassociated with preliminary project stage activities, training, maintenance andall other post-implementation stage activities are expensed as incurred.
Computer Software to be Sold, Leased or Otherwise Marketed. Developmentcosts of computer software to be sold, leased, or otherwise marketed as anintegral part of a product are subject to capitalization beginning when aproduct’s technological feasibility has been established and ending when aproduct is available for general release to customers. In most instances, theCompany’s products are released soon after technological feasibility hasbeen established. Therefore, software development costs incurredsubsequent to achievement of technological feasibility are usually notsignificant, and generally most software development costs have beenexpensed as incurred.
NIKE, INC. 2014 Annual Report and Notice of Annual Meeting 97
FOR
M10
-K

PART II
Impairment of Long-Lived AssetsThe Company reviews the carrying value of long-lived assets or asset groupsto be used in operations whenever events or changes in circumstancesindicate that the carrying amount of the assets might not be recoverable.Factors that would necessitate an impairment assessment include asignificant adverse change in the extent or manner in which an asset is used,a significant adverse change in legal factors or the business climate that couldaffect the value of the asset, or a significant decline in the observable marketvalue of an asset, among others. If such facts indicate a potential impairment,the Company would assess the recoverability of an asset group bydetermining if the carrying value of the asset group exceeds the sum of theprojected undiscounted cash flows expected to result from the use andeventual disposition of the assets over the remaining economic life of theprimary asset in the asset group. If the recoverability test indicates that thecarrying value of the asset group is not recoverable, the Company willestimate the fair value of the asset group using appropriate valuationmethodologies, which would typically include an estimate of discounted cashflows. Any impairment would be measured as the difference between theasset group’s carrying amount and its estimated fair value.
Goodwill and Indefinite-Lived Intangible AssetsThe Company performs annual impairment tests on goodwill and intangibleassets with indefinite lives in the fourth quarter of each fiscal year, or whenevents occur or circumstances change that would, more likely than not,reduce the fair value of a reporting unit or an intangible asset with an indefinitelife below its carrying value. Events or changes in circumstances that maytrigger interim impairment reviews include significant changes in businessclimate, operating results, planned investments in the reporting unit, planneddivestitures or an expectation that the carrying amount may not berecoverable, among other factors. The Company may first assess qualitativefactors to determine whether it is more likely than not that the fair value of areporting unit is less than its carrying amount. If, after assessing the totality ofevents and circumstances, the Company determines that it is more likely thannot that the fair value of the reporting unit is greater than its carrying amount,the two-step impairment test is unnecessary. The two-step impairment testfirst requires the Company to estimate the fair value of its reporting units. If thecarrying value of a reporting unit exceeds its fair value, the goodwill of thatreporting unit is potentially impaired and the Company proceeds to step twoof the impairment analysis. In step two of the analysis, the Companymeasures and records an impairment loss equal to the excess of the carryingvalue of the reporting unit’s goodwill over its implied fair value, if any.
The Company generally bases its measurement of the fair value of a reportingunit on a blended analysis of the present value of future discounted cash flowsand the market valuation approach. The discounted cash flows modelindicates the fair value of the reporting unit based on the present value of thecash flows that the Company expects the reporting unit to generate in thefuture. The Company’s significant estimates in the discounted cash flowsmodel include: its weighted average cost of capital; long-term rate of growthand profitability of the reporting unit’s business; and working capital effects.The market valuation approach indicates the fair value of the business basedon a comparison of the reporting unit to comparable publicly tradedcompanies in similar lines of business. Significant estimates in the marketvaluation approach model include identifying similar companies withcomparable business factors such as size, growth, profitability, risk and returnon investment, and assessing comparable revenue and operating incomemultiples in estimating the fair value of the reporting unit.
Indefinite-lived intangible assets primarily consist of acquired trade names andtrademarks. The Company may first perform a qualitative assessment todetermine whether it is more likely than not that an indefinite-lived intangibleasset is impaired. If, after assessing the totality of events and circumstances,the Company determines that it is more likely than not that the indefinite-livedintangible asset is not impaired, no quantitative fair value measurement isnecessary. If a quantitative fair value measurement calculation is required forthese intangible assets, the Company utilizes the relief-from-royalty method.
This method assumes that trade names and trademarks have value to theextent that their owner is relieved of the obligation to pay royalties for thebenefits received from them. This method requires the Company to estimatethe future revenue for the related brands, the appropriate royalty rate and theweighted average cost of capital.
Operating LeasesThe Company leases retail store space, certain distribution and warehousefacilities, office space, and other non-real estate assets under operatingleases. Operating lease agreements may contain rent escalation clauses, rentholidays or certain landlord incentives, including tenant improvementallowances. Rent expense for non-cancelable operating leases withscheduled rent increases or landlord incentives are recognized on a straight-line basis over the lease term, beginning with the effective leasecommencement date, which is generally the date in which the Companytakes possession of or controls the physical use of the property. Certainleases also provide for contingent rents, which are determined as apercentage of sales in excess of specified levels. A contingent rent liability isrecognized together with the corresponding rent expense when specifiedlevels have been achieved or when the Company determines that achievingthe specified levels during the period is probable.
Fair Value MeasurementsThe Company measures certain financial assets and liabilities at fair value on arecurring basis, including derivatives and available-for-sale securities. Fairvalue is the price the Company would receive to sell an asset or pay to transfera liability in an orderly transaction with a market participant at themeasurement date. The Company uses a three-level hierarchy established bythe Financial Accounting Standards Board (“FASB”) that prioritizes fair valuemeasurements based on the types of inputs used for the various valuationtechniques (market approach, income approach, and cost approach).
The levels of hierarchy are described below:
• Level 1: Observable inputs such as quoted prices in active markets foridentical assets or liabilities.
• Level 2: Inputs other than quoted prices that are observable for the asset orliability, either directly or indirectly; these include quoted prices for similarassets or liabilities in active markets and quoted prices for identical or similarassets or liabilities in markets that are not active.
• Level 3: Unobservable inputs for which there is little or no market dataavailable, which require the reporting entity to develop its own assumptions.
The Company’s assessment of the significance of a particular input to the fairvalue measurement in its entirety requires judgment and considers factorsspecific to the asset or liability. Financial assets and liabilities are classified intheir entirety based on the most conservative level of input that is significant tothe fair value measurement.
Pricing vendors are utilized for certain Level 1 and Level 2 investments. Thesevendors either provide a quoted market price in an active market or useobservable inputs without applying significant adjustments in their pricing.Observable inputs include broker quotes, interest rates and yield curvesobservable at commonly quoted intervals, volatilities and credit risks. The fairvalue of derivative contracts is determined using observable market inputssuch as the daily market foreign currency rates, forward pricing curves,currency volatilities, currency correlations and interest rates, and considersnonperformance risk of the Company and that of its counterparties.
The Company’s fair value processes include controls that are designed toensure appropriate fair values are recorded. These controls include ananalysis of period-over-period fluctuations and comparison to anotherindependent pricing vendor.
Refer to Note 6 — Fair Value Measurements for additional information.
98

PART II
Foreign Currency Translation and ForeignCurrency TransactionsAdjustments resulting from translating foreign functional currency financialstatements into U.S. Dollars are included in the foreign currency translationadjustment, a component of Accumulated other comprehensive income inTotal shareholders’ equity.
The Company’s global subsidiaries have various assets and liabilities,primarily receivables and payables, which are denominated in currenciesother than their functional currency. These balance sheet items are subject tore-measurement, the impact of which is recorded in Other expense (income),net, within the Consolidated Statements of Income.
Accounting for Derivatives and HedgingActivitiesThe Company uses derivative financial instruments to reduce its exposure tochanges in foreign currency exchange rates and interest rates. All derivativesare recorded at fair value on the Consolidated Balance Sheets and changes inthe fair value of derivative financial instruments are either recognized inAccumulated other comprehensive income (a component of Totalshareholders’ equity), Long-term debt or Net income depending on thenature of the underlying exposure, whether the derivative is formallydesignated as a hedge, and, if designated, the extent to which the hedge iseffective. The Company classifies the cash flows at settlement fromderivatives in the same category as the cash flows from the related hedgeditems. For undesignated hedges and designated cash flow hedges, this iswithin the Cash provided by operations component of the ConsolidatedStatements of Cash Flows. For designated net investment hedges, this isgenerally within the Cash (used) provided by investing activities component ofthe Consolidated Statement of Cash Flows. For the Company’s fair valuehedges, which are interest rate swaps used to mitigate the change in fair valueof its fixed-rate debt attributable to changes in interest rates, the related cashflows from periodic interest payments are reflected within the Cash providedby operations component of the Consolidated Statements of Cash Flows.Refer to Note 17 — Risk Management and Derivatives for more informationon the Company’s risk management program and derivatives.
Stock-Based CompensationThe Company estimates the fair value of options and stock appreciation rightsgranted under the NIKE, Inc. 1990 Stock Incentive Plan (the “1990 Plan”) andemployees’ purchase rights under the Employee Stock Purchase Plans(“ESPPs”) using the Black-Scholes option pricing model. The Companyrecognizes this fair value, net of estimated forfeitures, as Total selling andadministrative expense in the Consolidated Statements of Income over thevesting period using the straight-line method.
Refer to Note 11 — Common Stock and Stock-Based Compensation formore information on the Company’s stock programs.
Income TaxesThe Company accounts for income taxes using the asset and liability method.This approach requires the recognition of deferred tax assets and liabilities forthe expected future tax consequences of temporary differences between thecarrying amounts and the tax basis of assets and liabilities. The Companyrecords a valuation allowance to reduce deferred tax assets to the amountmanagement believes is more likely than not to be realized. United Statesincome taxes are provided currently on financial statement earnings of non-U.S. subsidiaries that are expected to be repatriated. The Companydetermines annually the amount of undistributed non-U.S. earnings to investindefinitely in its non-U.S. operations.
The Company recognizes a tax benefit from uncertain tax positions in thefinancial statements only when it is more likely than not that the position will be
sustained upon examination by relevant tax authorities. The Companyrecognizes interest and penalties related to income tax matters in Income taxexpense.
Refer to Note 9 — Income Taxes for further discussion.
Earnings Per ShareBasic earnings per common share is calculated by dividing Net income by theweighted average number of common shares outstanding during the year.Diluted earnings per common share is calculated by adjusting weightedaverage outstanding shares, assuming conversion of all potentially dilutivestock options and awards.
Refer to Note 12 — Earnings Per Share for further discussion.
Management EstimatesThe preparation of financial statements in conformity with generally acceptedaccounting principles requires management to make estimates, includingestimates relating to assumptions that affect the reported amounts of assetsand liabilities and disclosure of contingent assets and liabilities at the date offinancial statements and the reported amounts of revenues and expensesduring the reporting period. Actual results could differ from these estimates.
Recently Adopted Accounting StandardsIn July 2013, the FASB issued an accounting standards update intended toprovide guidance on the presentation of unrecognized tax benefits, reflectingthe manner in which an entity would settle, at the reporting date, anyadditional income taxes that would result from the disallowance of a taxposition when net operating loss carryforwards, similar tax losses, or tax creditcarryforwards exist. This accounting standard is effective for the Companybeginning June 1, 2014 and early adoption is permitted. Management earlyadopted this guidance and the adoption did not have a material impact on theCompany’s consolidated financial position or results of operations.
In July 2012, the FASB issued an accounting standards update intended tosimplify how an entity tests indefinite-lived intangible assets other thangoodwill for impairment by providing entities with an option to perform aqualitative assessment to determine whether further impairment testing isnecessary. This accounting standard update was effective for us beginningJune 1, 2013. The adoption of this standard did not have a material impact onour consolidated financial position or results of operations.
In December 2011, the FASB issued guidance enhancing disclosurerequirements surrounding the nature of an entity’s right to offset and relatedarrangements associated with its financial instruments and derivativeinstruments. This new guidance requires companies to disclose both grossand net information about instruments and transactions eligible for offset inthe statement of financial position and instruments and transactions subjectto master netting arrangements. This new guidance was effective for theCompany beginning June 1, 2013. As this guidance only requires expandeddisclosures, the adoption had no impact on the Company’s consolidatedfinancial position or results of operations.
Recently Issued Accounting StandardsIn May 2014, the FASB issued an accounting standards update that replacesexisting revenue recognition guidance. Among other things, the updatedguidance requires companies to recognize revenue in a way that depicts thetransfer of promised goods or services to customers in an amount thatreflects the consideration to which the entity expects to be entitled inexchange for those goods or services. The new guidance is effective for theCompany beginning June 1, 2017. The Company is currently evaluating theeffect the guidance will have on the Consolidated Financial Statements.
NIKE, INC. 2014 Annual Report and Notice of Annual Meeting 99
FOR
M10
-K

PART II
NOTE 2 — Inventories
Inventory balances of $3,947 million and $3,484 million at May 31, 2014 and 2013, respectively, were substantially all finished goods.
NOTE 3 — Property, Plant and Equipment
Property, plant and equipment included the following:
As of May 31,(In millions) 2014 2013
Land $ 270 $ 268Buildings 1,261 1,174Machinery, equipment and internal-use software 3,376 2,985Leasehold improvements 1,066 945Construction in process 247 128Total property, plant and equipment, gross 6,220 5,500Less accumulated depreciation 3,386 3,048TOTAL PROPERTY, PLANT AND EQUIPMENT, NET $ 2,834 $ 2,452
Capitalized interest was not material for the years ended May 31, 2014, 2013, and 2012. The Company had $74 million and $81 million in capital lease obligationsas of May 31, 2014 and May 31, 2013, respectively, included in machinery, equipment and internal-use software.
NOTE 4 — Identifiable Intangible Assets and Goodwill
The following table summarizes the Company’s Identifiable intangible asset balances as of May 31, 2014 and 2013:
As of May 31, 2014 As of May 31, 2013
(In millions)Gross Carrying
AmountAccumulatedAmortization
Net CarryingAmount
Gross CarryingAmount
AccumulatedAmortization
Net CarryingAmount
Acquired trademarks and other $ 39 $ (39) $ — $ 43 $ (36) $ 7Indefinite-lived trademarks 282 282IDENTIFIABLE INTANGIBLE ASSETS, NET $ 282 $ 289
Goodwill was $131 million at May 31, 2014 and May 31, 2013; $64 million is included in the Converse segment and the remaining amounts are included in GlobalBrand Divisions for segment reporting purposes. There were no accumulated impairment balances for goodwill as of either period end.
NOTE 5 — Accrued Liabilities
Accrued liabilities included the following:
As of May 31,(In millions) 2014 2013
Compensation and benefits, excluding taxes $ 782 $ 713Endorsement compensation 328 264Dividends payable 209 188Taxes other than income taxes 204 192Advertising and marketing 133 77Import and logistics costs 127 111Fair value of derivatives 85 34Other(1) 623 457TOTAL ACCRUED LIABILITIES $ 2,491 $ 2,036
(1) Other consists of various accrued expenses with no individual item accounting for more than 5% of the total Accrued liabilities balance at May 31, 2014 and 2013.
100

PART II
NOTE 6 — Fair Value Measurements
The following tables present information about the Company’s financial assets and liabilities measured at fair value on a recurring basis as of May 31, 2014 and2013 and indicate the fair value hierarchy of the valuation techniques utilized by the Company to determine such fair value. Refer to Note 1 — Summary ofSignificant Accounting Policies for additional detail regarding the Company’s fair value measurement methodology.
As of May 31, 2014
(In millions)Assets at Fair
ValueCash and Cash
EquivalentsShort-term
InvestmentsOther Long-term
AssetsCash $ 780 $ 780 $ — $ —Level 1:U.S. Treasury securities 1,137 151 986 —
Level 2:Time deposits 227 227 — —U.S. Agency securities 1,027 25 1,002 —Commercial paper and bonds 959 25 934 —Money market funds 1,012 1,012 — —
Total level 2 3,225 1,289 1,936 —Level 3:Non-marketable preferred stock 7 — — 7
TOTAL $ 5,149 $ 2,220 $ 2,922 $ 7
As of May 31, 2013
(In millions)Assets at Fair
ValueCash and Cash
EquivalentsShort-term
InvestmentsOther Long-term
AssetsCash $ 663 $ 663 $ — $ —Level 1:U.S. Treasury securities 2,008 425 1,583 —
Level 2:Time deposits 358 358 — —U.S. Agency securities(1) 1,026 395 631 —Commercial paper and bonds(1) 1,074 660 414 —Money market funds 836 836 — —
Total level 2 3,294 2,249 1,045 —Level 3:Non-marketable preferred stock 5 — — 5
TOTAL $ 5,970 $ 3,337 $ 2,628 $ 5
(1) Amounts have been revised to reflect proper classification between U.S. Agency securities and commercial paper and bonds.
As of May 31, 2014Asset Derivatives Liability Derivatives
(In millions)
Assetsat FairValue
OtherCurrentAssets
OtherLong-term
Assets
Liabilitiesat FairValue
AccruedLiabilities
Other Long-termLiabilities
Level 2:Foreign exchange forwards and options(1) $ 127 $ 101 $ 26 $ 85 $ 84 $ 1Interest rate swap contracts 6 — 6 — — —
TOTAL $ 133 $ 101 $ 32 $ 85 $ 84 $ 1
(1) The Company’s derivative financial instruments are subject to master netting arrangements that allow for the offset of assets and liabilities in the event of default or early termination of thecontract. The Company elects to record the gross assets and liabilities of its derivative financial instruments in the Consolidated Balance Sheets. If the derivative financial instruments hadbeen netted in the Consolidated Balance Sheets, the asset and liability positions each would have been reduced by $63 million. No material amounts of collateral were received or postedon the Company’s derivative assets and liabilities as of May 31, 2014.
As of May 31, 2013Asset Derivatives Liability Derivatives
(In millions)
Assetsat FairValue
OtherCurrentAssets
OtherLong-term
Assets
Liabilitiesat FairValue
AccruedLiabilities
Other Long-termLiabilities
Level 2:Foreign exchange forwards and options(1) $ 278 $ 199 $ 79 $ 34 $ 34 $ —Interest rate swap contracts 11 — 11 — — —
TOTAL $ 289 $ 199 $ 90 $ 34 $ 34 $ —
(1) The Company’s derivative financial instruments are subject to master netting arrangements that allow for the offset of assets and liabilities in the event of default or early termination of thecontract. The Company elects to record the gross assets and liabilities of its derivative financial instruments in the Consolidated Balance Sheets. If the derivative financial instruments hadbeen netted in the Consolidated Balance Sheets, the asset and liability positions each would have been reduced by $34 million. No material amounts of collateral were received or postedon the Company’s derivative assets and liabilities as of May 31, 2013.
NIKE, INC. 2014 Annual Report and Notice of Annual Meeting 101
FOR
M10
-K
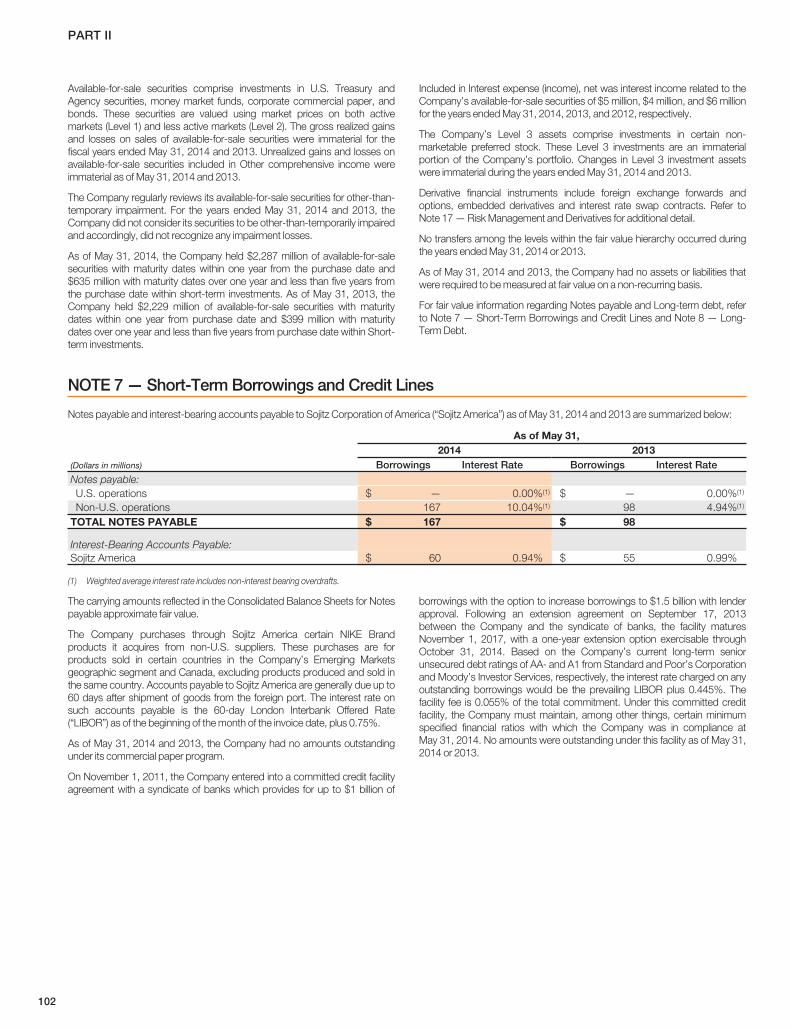
PART II
Available-for-sale securities comprise investments in U.S. Treasury andAgency securities, money market funds, corporate commercial paper, andbonds. These securities are valued using market prices on both activemarkets (Level 1) and less active markets (Level 2). The gross realized gainsand losses on sales of available-for-sale securities were immaterial for thefiscal years ended May 31, 2014 and 2013. Unrealized gains and losses onavailable-for-sale securities included in Other comprehensive income wereimmaterial as of May 31, 2014 and 2013.
The Company regularly reviews its available-for-sale securities for other-than-temporary impairment. For the years ended May 31, 2014 and 2013, theCompany did not consider its securities to be other-than-temporarily impairedand accordingly, did not recognize any impairment losses.
As of May 31, 2014, the Company held $2,287 million of available-for-salesecurities with maturity dates within one year from the purchase date and$635 million with maturity dates over one year and less than five years fromthe purchase date within short-term investments. As of May 31, 2013, theCompany held $2,229 million of available-for-sale securities with maturitydates within one year from purchase date and $399 million with maturitydates over one year and less than five years from purchase date within Short-term investments.
Included in Interest expense (income), net was interest income related to theCompany’s available-for-sale securities of $5 million, $4 million, and $6 millionfor the years ended May 31, 2014, 2013, and 2012, respectively.
The Company’s Level 3 assets comprise investments in certain non-marketable preferred stock. These Level 3 investments are an immaterialportion of the Company’s portfolio. Changes in Level 3 investment assetswere immaterial during the years ended May 31, 2014 and 2013.
Derivative financial instruments include foreign exchange forwards andoptions, embedded derivatives and interest rate swap contracts. Refer toNote 17 — Risk Management and Derivatives for additional detail.
No transfers among the levels within the fair value hierarchy occurred duringthe years ended May 31, 2014 or 2013.
As of May 31, 2014 and 2013, the Company had no assets or liabilities thatwere required to be measured at fair value on a non-recurring basis.
For fair value information regarding Notes payable and Long-term debt, referto Note 7 — Short-Term Borrowings and Credit Lines and Note 8 — Long-Term Debt.
NOTE 7 — Short-Term Borrowings and Credit Lines
Notes payable and interest-bearing accounts payable to Sojitz Corporation of America (“Sojitz America”) as of May 31, 2014 and 2013 are summarized below:
As of May 31,2014 2013
(Dollars in millions) Borrowings Interest Rate Borrowings Interest RateNotes payable:U.S. operations $ — 0.00%(1) $ — 0.00%(1)
Non-U.S. operations 167 10.04%(1) 98 4.94%(1)
TOTAL NOTES PAYABLE $ 167 $ 98
Interest-Bearing Accounts Payable:Sojitz America $ 60 0.94% $ 55 0.99%
(1) Weighted average interest rate includes non-interest bearing overdrafts.
The carrying amounts reflected in the Consolidated Balance Sheets for Notespayable approximate fair value.
The Company purchases through Sojitz America certain NIKE Brandproducts it acquires from non-U.S. suppliers. These purchases are forproducts sold in certain countries in the Company’s Emerging Marketsgeographic segment and Canada, excluding products produced and sold inthe same country. Accounts payable to Sojitz America are generally due up to60 days after shipment of goods from the foreign port. The interest rate onsuch accounts payable is the 60-day London Interbank Offered Rate(“LIBOR”) as of the beginning of the month of the invoice date, plus 0.75%.
As of May 31, 2014 and 2013, the Company had no amounts outstandingunder its commercial paper program.
On November 1, 2011, the Company entered into a committed credit facilityagreement with a syndicate of banks which provides for up to $1 billion of
borrowings with the option to increase borrowings to $1.5 billion with lenderapproval. Following an extension agreement on September 17, 2013between the Company and the syndicate of banks, the facility maturesNovember 1, 2017, with a one-year extension option exercisable throughOctober 31, 2014. Based on the Company’s current long-term seniorunsecured debt ratings of AA- and A1 from Standard and Poor’s Corporationand Moody’s Investor Services, respectively, the interest rate charged on anyoutstanding borrowings would be the prevailing LIBOR plus 0.445%. Thefacility fee is 0.055% of the total commitment. Under this committed creditfacility, the Company must maintain, among other things, certain minimumspecified financial ratios with which the Company was in compliance atMay 31, 2014. No amounts were outstanding under this facility as of May 31,2014 or 2013.
102

PART II
NOTE 8 — Long-Term Debt
Long-term debt, net of unamortized premiums and discounts and swap fair value adjustments, comprises the following:
Book Value OutstandingAs of May 31,
Scheduled Maturity (Dollars and Yen in millions)OriginalPrincipal
InterestRate
InterestPayments 2014 2013
Corporate Bond Payables:(4)
October 1, 2013 $ 50 4.70% Semi-Annually $ — $ 50October 15, 2015(1) $ 100 5.15% Semi-Annually 108 111May 1, 2023(5) $ 500 2.25% Semi-Annually 499 499May 1, 2043(5) $ 500 3.63% Semi-Annually 499 499
Promissory Notes:April 1, 2017 (2) $ 40 6.20% Monthly 39 40January 1, 2018 (2) $ 19 6.79% Monthly 19 19
Japanese Yen Notes:August 20, 2001 through November 20, 2020(3) ¥ 9,000 2.60% Quarterly 29 34August 20, 2001 through November 20, 2020(3) ¥ 4,000 2.00% Quarterly 13 15
Total 1,206 1,267Less current maturities 7 57TOTAL LONG-TERM DEBT $ 1,199 $ 1,210
(1) The Company has entered into interest rate swap agreements whereby the Company receives fixed interest payments at the same rate as the note and pays variable interest paymentsbased on the six-month LIBOR plus a spread. The swaps have the same notional amount and maturity date as the corresponding note. At May 31, 2014, the interest rates payable onthese swap agreements ranged from approximately 0.2% to 0.4%.
(2) On May 30, 2013, the Company assumed a total of $59 million in bonds payable as part of its agreement to purchase certain Corporate properties; this was treated as a non-cashfinancing transaction. The property serves as collateral for the debt. The purchase of these properties was accounted for as a business combination where the total consideration of $85million was allocated to the land and buildings acquired; no other tangible or intangible assets or liabilities resulted from the purchase. The bonds mature in 2017 and 2018 and theCompany does not have the ability to re-negotiate the terms of the debt agreements and would incur significant financial penalties if the notes were paid off prior to maturity.
(3) NIKE Logistics YK assumed a total of ¥13.0 billion in loans as part of its agreement to purchase a distribution center in Japan, which serves as collateral for the loans. These loans mature inequal quarterly installments during the period August 20, 2001 through November 20, 2020.
(4) These senior unsecured obligations rank equally with the Company’s other unsecured and unsubordinated indebtedness.
(5) The bonds are redeemable at the Company’s option prior to February 1, 2023 and November 1, 2042, respectively, at a price equal to the greater of (i) 100% of the aggregate principalamount of the notes to be redeemed and (ii) the sum of the present values of the remaining scheduled payments, plus in each case, accrued and unpaid interest. Subsequent toFebruary 1, 2023 and November 1, 2042, respectively, the bonds also feature a par call provision which allows for the bonds to be redeemed at a price equal to 100% of the aggregateprincipal amount of the notes being redeemed, plus accrued and unpaid interest.
The scheduled maturity of Long-term debt in each of the years endingMay 31, 2015 through 2019 are $7 million, $108 million, $45 million, $25million and $7 million, respectively, at face value.
The fair value of the Company’s Long-term debt, including the currentportion, was approximately $1,154 million at May 31, 2014 and $1,219 millionat May 31, 2013. The fair value of Long-term debt is estimated based uponquoted prices of similar instruments (level 2).
NOTE 9 — Income Taxes
Income before income taxes is as follows:
Year Ended May 31,(In millions) 2014 2013 2012Income before income taxes:United States $ 3,066 $ 1,231 $ 799Foreign 478 2,025 2,212
TOTAL INCOME BEFORE INCOME TAXES $ 3,544 $ 3,256 $ 3,011
NIKE, INC. 2014 Annual Report and Notice of Annual Meeting 103
FOR
M10
-K

PART II
The provision for income taxes is as follows:
Year Ended May 31,(In millions) 2014 2013 2012Current:United StatesFederal $ 371 $ 432 $ 286State 93 69 51
Foreign 398 398 488Total 862 899 825Deferred:United StatesFederal 8 — (47)State (3) (4) 5
Foreign (16) (90) (29)Total (11) (94) (71)TOTAL INCOME TAX EXPENSE $ 851 $ 805 $ 754
A reconciliation from the U.S. statutory federal income tax rate to the effective income tax rate is as follows:
Year Ended May 31,2014 2013 2012
Federal income tax rate 35.0% 35.0% 35.0%State taxes, net of federal benefit 1.8% 1.4% 1.3%Foreign earnings 2.2% -11.8% -11.9%Deferred charge -14.6% 0.0% 0.0%Other, net -0.4% 0.1% 0.6%EFFECTIVE INCOME TAX RATE 24.0% 24.7% 25.0%
The effective tax rate from continuing operations for the year ended May 31,2014 was 70 basis points lower than the effective tax rate from continuingoperations for the year ended May 31, 2013 primarily due to an increase in theamount of earnings from lower tax rate jurisdictions.
During the fourth quarter of the fiscal year ended May 31, 2014, the Companyreached a resolution with the IRS on a U.S. Unilateral Advanced PricingAgreement that covers intercompany transfer pricing for fiscal years 2011through 2020. This agreement resulted in a reduction in the Company’spermanently reinvested foreign earnings, which increased the effectiveincome tax rate and Income taxes payable. The agreement also resulted in areduction of previously unrecognized tax benefits and the creation of a
deferred tax charge, both of which reduced the effective income tax rate. Thenet result of the agreement did not have a material impact on the Company’seffective income tax rate in fiscal 2014.
The effective tax rate from continuing operations for the year ended May 31,2013 was 30 basis points lower than the effective tax rate from continuingoperations for the year ended May 31, 2012 primarily due to tax benefitsreceived from the intercompany sale of intellectual property rights outside ofthe U.S., the retroactive reinstatement of the research and development creditand the intra-period allocation of tax expense between continuing operations,discontinued operations and Other comprehensive income. The decrease inthe effective rate was partially offset by a higher effective tax rate onoperations as a result of an increase in earnings in higher tax jurisdictions.
Deferred tax assets and (liabilities) comprise the following:
As of May 31,(In millions) 2014 2013Deferred tax assets:Allowance for doubtful accounts $ 11 $ 20Inventories 49 40Sales return reserves 113 101Deferred compensation 211 197Stock-based compensation 162 140Reserves and accrued liabilities 95 66Foreign loss carry-forwards 16 19Foreign tax credit carry-forwards — 106Undistributed earnings of foreign subsidiaries 194 147Other 51 47
Total deferred tax assets 902 883Valuation allowance (9) (5)Total deferred tax assets after valuation allowance 893 878Deferred tax liabilities:Property, plant and equipment (237) (241)Intangibles (94) (78)Other (2) (20)
Total deferred tax liability (333) (339)NET DEFERRED TAX ASSET $ 560 $ 539
104

PART II
The following is a reconciliation of the changes in the gross balance of unrecognized tax benefits:
As of May 31,(In millions) 2014 2013 2012Unrecognized tax benefits, as of the beginning of the period $ 447 $ 285 $ 212Gross increases related to prior period tax positions(1) 814 77 48Gross decreases related to prior period tax positions(1) (166) (3) (25)Gross increases related to current period tax positions 125 130 91Gross decreases related to current period tax positions (30) (9) (1)Settlements(1) (676) — (20)Lapse of statute of limitations (4) (21) (9)Changes due to currency translation (4) (12) (11)UNRECOGNIZED TAX BENEFITS, AS OF THE END OF THE PERIOD $ 506 $ 447 $ 285
(1) During the fourth quarter of the fiscal year ended May 31, 2014, the Company reached a resolution with the IRS on a U.S. Unilateral Advanced Pricing Agreement that covers intercompanytransfer pricing for fiscal years 2011 through 2020. As a result, the Company recorded a gross increase in unrecognized tax benefits related to prior period tax positions, a gross decreasein unrecognized tax benefits related to prior period tax positions, and a settlement. The net impact of these items resulted in a decrease to unrecognized tax benefits.
As of May 31, 2014, the total gross unrecognized tax benefits, excludingrelated interest and penalties, were $506 million, $264 million of which wouldaffect the Company’s effective tax rate if recognized in future periods.
The Company recognizes interest and penalties related to income tax mattersin Income tax expense. The liability for payment of interest and penaltiesincreased $55 million, $4 million, and $17 million during the years endedMay 31, 2014, 2013, and 2012, respectively. As of May 31, 2014 and 2013,accrued interest and penalties related to uncertain tax positions were $167million and $112 million, respectively (excluding federal benefit).
The Company is subject to taxation primarily in the United States, China, theNetherlands, and Brazil, as well as various state and other foreignjurisdictions. The Company has concluded substantially all U.S. federalincome tax matters through fiscal 2010. The Company is currently under auditby the Internal Revenue Service for the 2011 through 2014 tax years, andmany issues are at an advanced stage in the examination process. Inaddition, the Company is in appeals regarding the validation of foreign taxcredits taken. The Company’s major foreign jurisdictions, China, theNetherlands and Brazil, have concluded substantially all income tax mattersthrough calendar 2005, fiscal 2008 and calendar 2008, respectively. Althoughthe timing of resolution of audits is not certain, the Company evaluates alldomestic and foreign audit issues in the aggregate, along with the expirationof applicable statutes of limitations, and estimates that it is reasonablypossible the total gross unrecognized tax benefits could decrease by up to$70 million within the next 12 months.
The Company provides for U.S. income taxes on the undistributed earningsof foreign subsidiaries unless they are considered indefinitely reinvested
outside the United States. At May 31, 2014, the indefinitely reinvestedearnings in foreign subsidiaries upon which United States income taxes havenot been provided was approximately $6.6 billion, which includes a reductionof permanently reinvested earnings for the year ended May 31, 2014. If theseundistributed earnings were repatriated to the United States, or if the shares ofthe relevant foreign subsidiaries were sold or otherwise transferred, theywould generate foreign tax credits that would reduce the federal tax liabilityassociated with the foreign dividend or the otherwise taxable transaction.Assuming a full utilization of the foreign tax credits, the potential net deferredtax liability associated with these temporary differences of undistributedearnings would be approximately $2.1 billion at May 31, 2014.
A portion of the Company’s foreign operations are benefiting from a taxholiday, which is set to expire in 2021. This tax holiday may be extended whencertain conditions are met or may be terminated early if certain conditions arenot met. The impact of this tax holiday decreased foreign taxes by $138million, $108 million, and $117 million for the fiscal years ended May 31, 2014,2013, and 2012, respectively. The benefit of the tax holiday on Dilutedearnings per common share was $0.15, $0.12, and $0.12 for the fiscal yearsended May 31, 2014, 2013, and 2012, respectively.
Deferred tax assets at May 31, 2014 and 2013 were reduced by a valuationallowance relating to tax benefits of certain subsidiaries with operating losses.The net change in the valuation allowance was an increase of $4 million, adecrease of $22 million, and an increase of $23 million for the years endedMay 31, 2014, 2013, and 2012, respectively.
The Company has available domestic and foreign loss carry-forwards of $55 million at May 31, 2014. Such losses will expire as follows:
Year Ending May 31,(In millions) 2015 2016 2017 2018 2019-2034 Indefinite TotalNet operating losses $ — $ — $ — $ 6 $ 37 $ 12 $ 55
During the years ended May 31, 2014, 2013, and 2012, income tax benefits attributable to employee stock-based compensation transactions of $135 million,$76 million, and $120 million, respectively, were allocated to Total shareholders’ equity.
NOTE 10 — Redeemable Preferred Stock
Sojitz America is the sole owner of the Company’s authorized Redeemablepreferred stock, $1 par value, which is redeemable at the option of SojitzAmerica or the Company at par value aggregating $0.3 million. A cumulativedividend of $0.10 per share is payable annually on May 31 and no dividendsmay be declared or paid on the common stock of the Company unlessdividends on the Redeemable preferred stock have been declared and paid infull. There have been no changes in the Redeemable preferred stock in thethree years ended May 31, 2014, 2013, and 2012. As the holder of the
Redeemable preferred stock, Sojitz America does not have general votingrights but does have the right to vote as a separate class on the sale of all orsubstantially all of the assets of the Company and its subsidiaries, on merger,consolidation, liquidation or dissolution of the Company or on the sale orassignment of the NIKE trademark for athletic footwear sold in the UnitedStates. The Redeemable preferred stock has been fully issued to SojitzAmerica and is not blank check preferred stock. The Company’s articles ofincorporation do not permit the issuance of additional preferred stock.
NIKE, INC. 2014 Annual Report and Notice of Annual Meeting 105
FOR
M10
-K

PART II
NOTE 11 — Common Stock and Stock-Based Compensation
The authorized number of shares of Class A Common Stock, no par value,and Class B Common Stock, no par value, are 200 million and 1,200 million,respectively. Each share of Class A Common Stock is convertible into oneshare of Class B Common Stock. Voting rights of Class B Common Stock arelimited in certain circumstances with respect to the election of directors. Thereare no differences in the dividend and liquidation preferences or participationrights of the Class A and Class B common shareholders.
In 1990, the Board of Directors adopted, and the shareholders approved, theNIKE, Inc. 1990 Stock Incentive Plan (the “1990 Plan”). The 1990 Plan, asamended, provides for the issuance of up to 326 million previously unissuedshares of Class B Common Stock in connection with stock options and otherawards granted under the plan. The 1990 Plan authorizes the grant of non-statutory stock options, incentive stock options, stock appreciation rights,restricted stock, restricted stock units, and performance-based awards. The
exercise price for stock options and stock appreciation rights may not be lessthan the fair market value of the underlying shares on the date of grant. Acommittee of the Board of Directors administers the 1990 Plan. Thecommittee has the authority to determine the employees to whom awards willbe made, the amount of the awards, and the other terms and conditions ofthe awards. Substantially all stock option grants outstanding under the 1990Plan were granted in the first quarter of each fiscal year, vest ratably over fouryears, and expire 10 years from the date of grant.
The following table summarizes the Company’s total stock-based compensation expense recognized in Total selling and administrative expense:
Year Ended May 31,(In millions) 2014 2013 2012Stock options(1) $ 125 $ 123 $ 96ESPPs 22 19 16Restricted stock 30 32 18TOTAL STOCK-BASED COMPENSATION EXPENSE $ 177 $ 174 $ 130
(1) Expense for stock options includes the expense associated with stock appreciation rights. Accelerated stock option expense is recorded for employees eligible for accelerated stock optionvesting upon retirement. Accelerated stock option expense for years ended May 31, 2014, 2013, and 2012 was $15 million, $22 million, and $17 million, respectively.
As of May 31, 2014, the Company had $179 million of unrecognized compensation costs from stock options, net of estimated forfeitures, to be recognized asselling and administrative expense over a weighted average period of 2.1 years.
The weighted average fair value per share of the options granted during the years ended May 31, 2014, 2013, and 2012, as computed using the Black-Scholespricing model, was $14.89, $12.71, and $11.08, respectively. The weighted average assumptions used to estimate these fair values are as follows:
Year Ended May 31,2014 2013 2012
Dividend yield 1.3% 1.5% 1.4%Expected volatility 27.9% 35.0% 29.5%Weighted average expected life (in years) 5.3 5.3 5.0Risk-free interest rate 1.3% 0.6% 1.4%
The Company estimates the expected volatility based on the implied volatilityin market traded options on the Company’s common stock with a termgreater than 1 year, along with other factors. The weighted average expectedlife of options is based on an analysis of historical and expected future
exercise patterns. The interest rate is based on the U.S. Treasury (constantmaturity) risk-free rate in effect at the date of grant for periods correspondingwith the expected term of the options.
The following summarizes the stock option transactions under the plan discussed above:
Shares(1)Weighted Average
Option Price(In millions)
Options outstanding May 31, 2011 69.6 $ 25.65Exercised (18.0) 22.81Forfeited (1.0) 35.61Granted 13.7 45.87
Options outstanding May 31, 2012 64.3 $ 30.59Exercised (9.9) 24.70Forfeited (1.3) 40.14Granted 14.6 46.55
Options outstanding May 31, 2013 67.7 $ 34.72Exercised (11.0) 28.29Forfeited (1.3) 48.33Granted 8.1 63.54
Options outstanding May 31, 2014 63.5 $ 39.28
Options exercisable at May 31,2012 33.9 $ 24.382013 35.9 27.702014 37.0 31.42
(1) Includes stock appreciation rights transactions.
106

PART II
The weighted average contractual life remaining for options outstanding andoptions exercisable at May 31, 2014 was 6.0 years and 4.6 years,respectively. The aggregate intrinsic value for options outstanding andexercisable at May 31, 2014 was $2,391 million and $1,682 million,respectively. The aggregate intrinsic value was the amount by which themarket value of the underlying stock exceeded the exercise price of theoptions. The total intrinsic value of the options exercised during the yearsended May 31, 2014, 2013, and 2012 was $474 million, $293 million, and$453 million, respectively.
In addition to the 1990 Plan, the Company gives employees the right topurchase shares at a discount to the market price under employee stockpurchase plans (“ESPPs”). Employees are eligible to participate throughpayroll deductions of up to 10% of their compensation. At the end of each six-month offering period, shares are purchased by the participants at 85% of thelower of the fair market value at the beginning or the end of the offering period.Employees purchased 1.4 million, 1.6 million, and 1.7 million shares duringeach of the three years ended May 31, 2014, 2013 and 2012, respectively.
From time to time, the Company grants restricted stock units and restrictedstock to key employees under the 1990 Plan. The number of sharesunderlying such awards granted to employees during the years endedMay 31, 2014, 2013, and 2012 were 0.3 million, 1.6 million, and 0.7 millionwith weighted average values per share of $63.89, $46.86, and $49.49,respectively. Recipients of restricted stock are entitled to cash dividends andto vote their respective shares throughout the period of restriction. Recipientsof restricted stock units are entitled to dividend equivalent cash paymentsupon vesting. The value of all grants of restricted stock and restricted stockunits was established by the market price on the date of grant. During theyears ended May 31, 2014, 2013, and 2012, the aggregate fair value ofrestricted stock and restricted stock units vested was $28 million, $25 million,and $22 million, respectively, determined as of the date of vesting. As ofMay 31, 2014, the Company had $61 million of unrecognized compensationcosts from restricted stock units to be recognized in Total selling andadministrative expense over a weighted average period of 2.7 years.
NOTE 12 — Earnings Per Share
The following is a reconciliation from Basic earnings per common share to Diluted earnings per common share. Options to purchase an additional 0.1 million,0.1 million, and 0.2 million shares of common stock were outstanding at May 31, 2014, 2013, and 2012, respectively, but were not included in the computation ofDiluted earnings per common share because the options were anti-dilutive.
Year Ended May 31,(In millions, except per share data) 2014 2013 2012Determination of shares:Weighted average common shares outstanding 883.4 897.3 920.0Assumed conversion of dilutive stock options and awards 22.4 19.1 19.6DILUTED WEIGHTED AVERAGE COMMON SHARES OUTSTANDING 905.8 916.4 939.6
Earnings per share from continuing operations:Basic earnings per common share $ 3.05 $ 2.74 $ 2.45Diluted earnings per common share $ 2.97 $ 2.68 $ 2.40
Earnings per share from discontinued operations:Basic earnings per common share $ — $ 0.02 $ (0.05)Diluted earnings per common share $ — $ 0.02 $ (0.05)
Basic earnings per common share for NIKE, Inc. $ 3.05 $ 2.76 $ 2.40Diluted earnings per common share for NIKE, Inc. $ 2.97 $ 2.70 $ 2.35
NOTE 13 — Benefit Plans
The Company has a qualified 401(k) Savings and Profit Sharing Plan to whichall U.S. employees who work at least 1,000 hours in a year are able toparticipate. The Company matches a portion of employee contributions.Company contributions to the savings plan were $51 million, $46 million, and$42 million for the years ended May 31, 2014, 2013, and 2012, respectively,and are included in Total selling and administrative expense. The terms of theplan also allow for annual discretionary profit sharing contributions to theaccounts of eligible employees by the Company as determined by the Boardof Directors. Contributions of $49 million, $47 million, and $40 million weremade to the plan and are included in Total selling and administrative expensefor the years ended May 31, 2014, 2013, and 2012, respectively.
The Company also has a Long-Term Incentive Plan (“LTIP”) that was adoptedby the Board of Directors and approved by shareholders in September 1997and later amended in fiscal 2007. The Company recognized $46 million, $50million, and $51 million of Total selling and administrative expense related to
cash awards under the LTIP during the years ended May 31, 2014, 2013, and2012, respectively.
The Company allows certain highly compensated employees and non-employee directors of the Company to defer compensation under anonqualified deferred compensation plan. Deferred compensation planliabilities were $390 million and $326 million at May 31, 2014 and May 31,2013, respectively, and classified as long-term in Deferred income taxes andother liabilities.
The Company has pension plans in various countries worldwide. The pensionplans are only available to local employees and are generally governmentmandated. The liability related to the unfunded pension liabilities of the planswas $100 million and $104 million at May 31, 2014 and May 31, 2013,respectively, which was primarily classified as long-term in Deferred incometaxes and other liabilities.
NIKE, INC. 2014 Annual Report and Notice of Annual Meeting 107
FOR
M10
-K

PART II
NOTE 14 — Accumulated Other Comprehensive Income
The changes in Accumulated other comprehensive income, net of tax, were as follows:
(In millions)
ForeignCurrency
TranslationAdjustment(1)
Cash FlowHedges
Net InvestmentHedges(1) Other Total
Balance at May 31, 2013 $ 41 $ 193 $ 95 $ (55) $274Other comprehensive gains (losses) before reclassifications(2) (32) (134) — — (166)Reclassifications to net income of previously deferred (gains) losses(3) — (27) — 4 (23)Other comprehensive income (loss) (32) (161) — 4 (189)
Balance at May 31, 2014 $ 9 $ 32 $ 95 $ (51) $ 85
(1) The accumulated foreign currency translation adjustment and net investment hedge gains/losses related to an investment in a foreign subsidiary are reclassified to Net income upon sale orupon complete or substantially complete liquidation of the respective entity.
(2) Net of tax benefit of $0 million, $9 million, $0 million, $0 million, and $9 million, respectively.
(3) Net of tax expense of $0 million, $9 million, $0 million, $0 million, and $9 million, respectively.
The following table summarizes the reclassifications from Accumulated other comprehensive income to the Consolidated Statements of Income:
Amount of Gain (Loss)Reclassified from AccumulatedOther Comprehensive Income
into IncomeLocation of Gain (Loss) Reclassified from
Accumulated Other Comprehensive Incomeinto Income(In millions) Year Ended May 31, 2014
Gains on cash flow hedges:Foreign exchange forwards and options $ 14 RevenuesForeign exchange forwards and options 12 Cost of salesForeign exchange forwards and options — Total selling and administrative expenseForeign exchange forwards and options 10 Other expense (income), net
Total before tax 36Tax expense (9)Gain, net of tax 27Losses on other (4) Other expense (income), netTotal before tax (4)Tax expense —Loss, net of tax (4)Total net gain reclassified for the period $ 23
Refer to Note 17— Risk Management and Derivatives for more information on the Company’s risk management program and derivatives.
NOTE 15 — Discontinued Operations
During the year ended May 31, 2013, the Company divested of Umbro andCole Haan, allowing it to focus its resources on driving growth in the NIKE,Jordan, Converse, and Hurley brands.
On February 1, 2013, the Company completed the sale of Cole Haan to ApaxPartners for an agreed upon purchase price of $570 million and received atclosing $561 million, net of $9 million of purchase price adjustments. Thetransaction resulted in a gain on sale of $231 million, net of $137 million inIncome tax expense; this gain is included in the Net income (loss) fromdiscontinued operations line item on the Consolidated Statements of Income.There were no adjustments to these recorded amounts as of May 31, 2014.Beginning November 30, 2012, the Company classified the Cole Haandisposal group as held-for-sale and presented the results of Cole Haan’soperations in the Net income (loss) from discontinued operations line item onthe Consolidated Statements of Income. From this date until the sale, theassets and liabilities of Cole Haan were recorded in the Assets of discontinuedoperations and Liabilities of discontinued operations line items on theConsolidated Balance Sheets, respectively. Previously, these amounts werereported in the Company’s segment presentation as “Other Businesses.”
Under the sale agreement, the Company agreed to provide certain transitionservices to Cole Haan for an expected period of 3 to 9 months from the dateof sale. These services were essentially complete as of May 31, 2013 and theCompany has had no significant involvement with Cole Haan beyond thetransition services. The Company has also licensed NIKE proprietary Air andLunar technologies to Cole Haan for a transition period. The continuing cashflows related to these items are not significant to Cole Haan. Additionally,
preexisting guarantees of certain Cole Haan lease payments remained inplace after the sale; the maximum exposure under the guarantees is $33million at May 31, 2014. The fair value of the guarantees is not material.
On November 30, 2012, the Company completed the sale of certain assets ofUmbro to Iconix Brand Group (“Iconix”) for $225 million. The Umbro disposalgroup was classified as held-for-sale as of November 30, 2012 and theresults of Umbro’s operations are presented in the Net income (loss) fromdiscontinued operations line item on the Consolidated Statements of Income.The liabilities of Umbro were recorded in the Liabilities of discontinuedoperations line items on the Consolidated Balance Sheets. Previously, theseamounts were reported in the Company’s segment presentation as “OtherBusinesses.” Upon meeting the held-for-sale criteria, the Company recordeda loss of $107 million, net of tax, on the sale of Umbro and the loss is includedin the Net income (loss) from discontinued operations line item on theConsolidated Statements of Income. The loss on sale was calculated as thenet sales price less Umbro assets of $248 million, including intangibles,goodwill, and fixed assets, other miscellaneous charges of $22 million, andthe release of the associated cumulative translation adjustment of $129million. The tax benefit on the loss was $67 million. There were noadjustments to these recorded amounts as of May 31, 2014.
Under the sale agreement, the Company provided transition services to Iconixwhile certain markets were transitioned to Iconix-designated licensees. Thesetransition services are complete and the Company has wound down theremaining operations of Umbro.
108
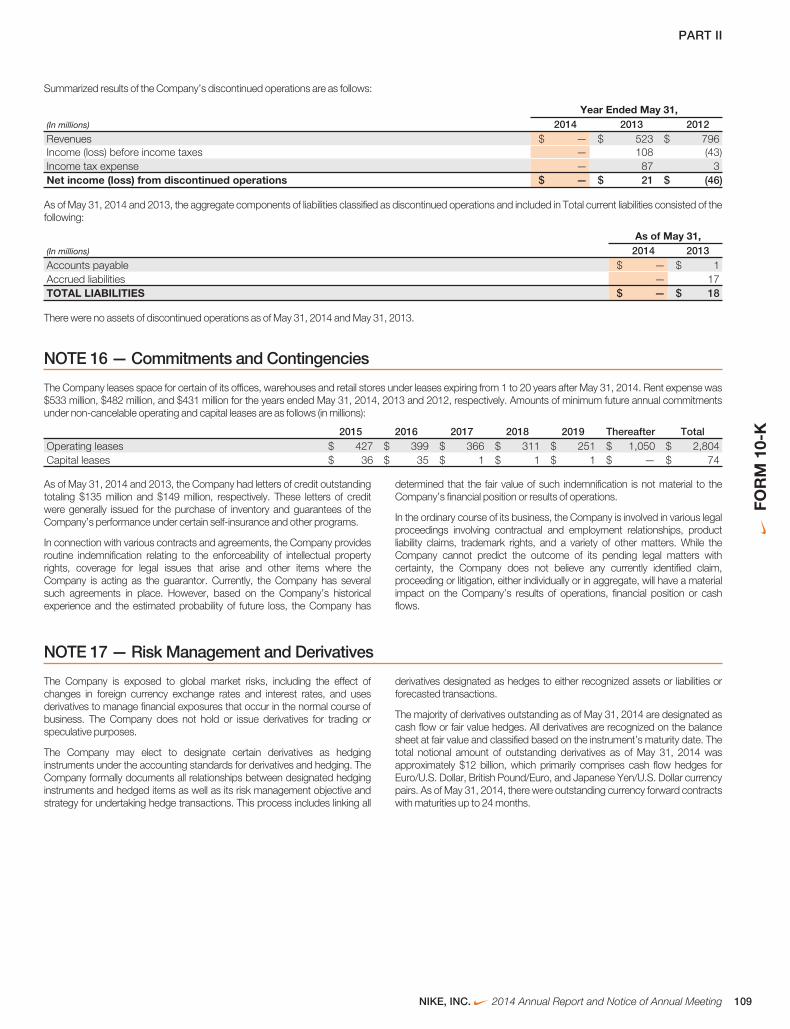
PART II
Summarized results of the Company’s discontinued operations are as follows:
Year Ended May 31,(In millions) 2014 2013 2012Revenues $ — $ 523 $ 796Income (loss) before income taxes — 108 (43)Income tax expense — 87 3Net income (loss) from discontinued operations $ — $ 21 $ (46)
As of May 31, 2014 and 2013, the aggregate components of liabilities classified as discontinued operations and included in Total current liabilities consisted of thefollowing:
As of May 31,(In millions) 2014 2013Accounts payable $ — $ 1Accrued liabilities — 17TOTAL LIABILITIES $ — $ 18
There were no assets of discontinued operations as of May 31, 2014 and May 31, 2013.
NOTE 16 — Commitments and Contingencies
The Company leases space for certain of its offices, warehouses and retail stores under leases expiring from 1 to 20 years after May 31, 2014. Rent expense was$533 million, $482 million, and $431 million for the years ended May 31, 2014, 2013 and 2012, respectively. Amounts of minimum future annual commitmentsunder non-cancelable operating and capital leases are as follows (in millions):
2015 2016 2017 2018 2019 Thereafter TotalOperating leases $ 427 $ 399 $ 366 $ 311 $ 251 $ 1,050 $ 2,804Capital leases $ 36 $ 35 $ 1 $ 1 $ 1 $ — $ 74
As of May 31, 2014 and 2013, the Company had letters of credit outstandingtotaling $135 million and $149 million, respectively. These letters of creditwere generally issued for the purchase of inventory and guarantees of theCompany’s performance under certain self-insurance and other programs.
In connection with various contracts and agreements, the Company providesroutine indemnification relating to the enforceability of intellectual propertyrights, coverage for legal issues that arise and other items where theCompany is acting as the guarantor. Currently, the Company has severalsuch agreements in place. However, based on the Company’s historicalexperience and the estimated probability of future loss, the Company has
determined that the fair value of such indemnification is not material to theCompany’s financial position or results of operations.
In the ordinary course of its business, the Company is involved in various legalproceedings involving contractual and employment relationships, productliability claims, trademark rights, and a variety of other matters. While theCompany cannot predict the outcome of its pending legal matters withcertainty, the Company does not believe any currently identified claim,proceeding or litigation, either individually or in aggregate, will have a materialimpact on the Company’s results of operations, financial position or cashflows.
NOTE 17 — Risk Management and Derivatives
The Company is exposed to global market risks, including the effect ofchanges in foreign currency exchange rates and interest rates, and usesderivatives to manage financial exposures that occur in the normal course ofbusiness. The Company does not hold or issue derivatives for trading orspeculative purposes.
The Company may elect to designate certain derivatives as hedginginstruments under the accounting standards for derivatives and hedging. TheCompany formally documents all relationships between designated hedginginstruments and hedged items as well as its risk management objective andstrategy for undertaking hedge transactions. This process includes linking all
derivatives designated as hedges to either recognized assets or liabilities orforecasted transactions.
The majority of derivatives outstanding as of May 31, 2014 are designated ascash flow or fair value hedges. All derivatives are recognized on the balancesheet at fair value and classified based on the instrument’s maturity date. Thetotal notional amount of outstanding derivatives as of May 31, 2014 wasapproximately $12 billion, which primarily comprises cash flow hedges forEuro/U.S. Dollar, British Pound/Euro, and Japanese Yen/U.S. Dollar currencypairs. As of May 31, 2014, there were outstanding currency forward contractswith maturities up to 24 months.
NIKE, INC. 2014 Annual Report and Notice of Annual Meeting 109
FOR
M10
-K
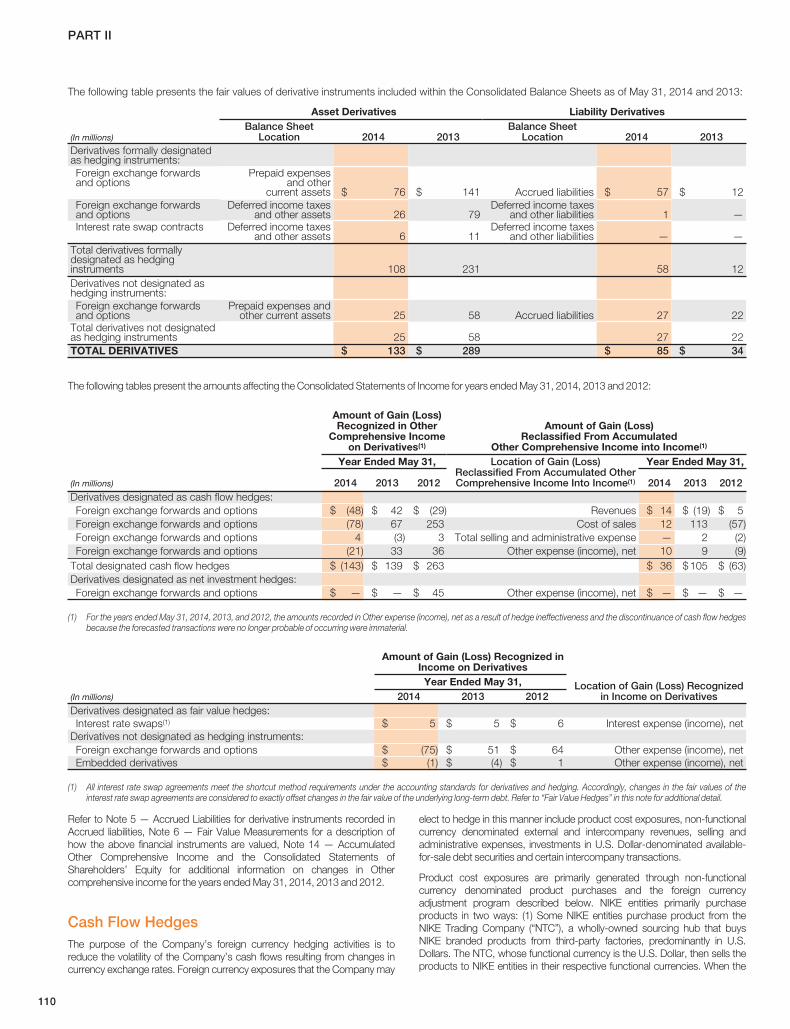
PART II
The following table presents the fair values of derivative instruments included within the Consolidated Balance Sheets as of May 31, 2014 and 2013:
Asset Derivatives Liability Derivatives
(In millions)Balance Sheet
Location 2014 2013Balance Sheet
Location 2014 2013Derivatives formally designatedas hedging instruments:Foreign exchange forwardsand options
Prepaid expensesand other
current assets $ 76 $ 141 Accrued liabilities $ 57 $ 12Foreign exchange forwardsand options
Deferred income taxesand other assets 26 79
Deferred income taxesand other liabilities 1 —
Interest rate swap contracts Deferred income taxesand other assets 6 11
Deferred income taxesand other liabilities — —
Total derivatives formallydesignated as hedginginstruments 108 231 58 12Derivatives not designated ashedging instruments:Foreign exchange forwardsand options
Prepaid expenses andother current assets 25 58 Accrued liabilities 27 22
Total derivatives not designatedas hedging instruments 25 58 27 22TOTAL DERIVATIVES $ 133 $ 289 $ 85 $ 34
The following tables present the amounts affecting the Consolidated Statements of Income for years ended May 31, 2014, 2013 and 2012:
(In millions)
Amount of Gain (Loss)Recognized in Other
Comprehensive Incomeon Derivatives(1)
Amount of Gain (Loss)Reclassified From Accumulated
Other Comprehensive Income into Income(1)
Year Ended May 31, Location of Gain (Loss)Reclassified From Accumulated OtherComprehensive Income Into Income(1)
Year Ended May 31,
2014 2013 2012 2014 2013 2012Derivatives designated as cash flow hedges:Foreign exchange forwards and options $ (48) $ 42 $ (29) Revenues $ 14 $ (19) $ 5Foreign exchange forwards and options (78) 67 253 Cost of sales 12 113 (57)Foreign exchange forwards and options 4 (3) 3 Total selling and administrative expense — 2 (2)Foreign exchange forwards and options (21) 33 36 Other expense (income), net 10 9 (9)
Total designated cash flow hedges $ (143) $ 139 $ 263 $ 36 $105 $ (63)Derivatives designated as net investment hedges:Foreign exchange forwards and options $ — $ — $ 45 Other expense (income), net $ — $ — $ —
(1) For the years ended May 31, 2014, 2013, and 2012, the amounts recorded in Other expense (income), net as a result of hedge ineffectiveness and the discontinuance of cash flow hedgesbecause the forecasted transactions were no longer probable of occurring were immaterial.
Amount of Gain (Loss) Recognized inIncome on Derivatives
Location of Gain (Loss) Recognizedin Income on Derivatives
Year Ended May 31,(In millions) 2014 2013 2012Derivatives designated as fair value hedges:Interest rate swaps(1) $ 5 $ 5 $ 6 Interest expense (income), net
Derivatives not designated as hedging instruments:Foreign exchange forwards and options $ (75) $ 51 $ 64 Other expense (income), netEmbedded derivatives $ (1) $ (4) $ 1 Other expense (income), net
(1) All interest rate swap agreements meet the shortcut method requirements under the accounting standards for derivatives and hedging. Accordingly, changes in the fair values of theinterest rate swap agreements are considered to exactly offset changes in the fair value of the underlying long-term debt. Refer to “Fair Value Hedges” in this note for additional detail.
Refer to Note 5 — Accrued Liabilities for derivative instruments recorded inAccrued liabilities, Note 6 — Fair Value Measurements for a description ofhow the above financial instruments are valued, Note 14 — AccumulatedOther Comprehensive Income and the Consolidated Statements ofShareholders’ Equity for additional information on changes in Othercomprehensive income for the years ended May 31, 2014, 2013 and 2012.
Cash Flow HedgesThe purpose of the Company’s foreign currency hedging activities is toreduce the volatility of the Company’s cash flows resulting from changes incurrency exchange rates. Foreign currency exposures that the Company may
elect to hedge in this manner include product cost exposures, non-functionalcurrency denominated external and intercompany revenues, selling andadministrative expenses, investments in U.S. Dollar-denominated available-for-sale debt securities and certain intercompany transactions.
Product cost exposures are primarily generated through non-functionalcurrency denominated product purchases and the foreign currencyadjustment program described below. NIKE entities primarily purchaseproducts in two ways: (1) Some NIKE entities purchase product from theNIKE Trading Company (“NTC”), a wholly-owned sourcing hub that buysNIKE branded products from third-party factories, predominantly in U.S.Dollars. The NTC, whose functional currency is the U.S. Dollar, then sells theproducts to NIKE entities in their respective functional currencies. When the
110

PART II
NTC sells to a NIKE entity with a different functional currency, the result is aforeign currency exposure for the NTC; (2) Other NIKE entities purchaseproduct directly from third-party factories in U.S. Dollars. These purchasesgenerate a foreign currency exposure for those NIKE entities with a functionalcurrency other than the U.S. Dollar.
In January 2012, the Company implemented a foreign currency adjustmentprogram with certain factories. The program is designed to more effectivelymanage foreign currency risk by assuming certain of the factories’ foreigncurrency exposures, some of which are natural offsets to the Company’sexisting foreign currency exposures. Under this program, the Company’spayments to these factories are adjusted for rate fluctuations in the basket ofcurrencies (“factory currency exposure index”) in which the labor, materialsand overhead costs incurred by the factories in the production of NIKEbranded products (“factory input costs”) are denominated. For the portion ofthe indices denominated in the local or functional currency of the factory, theCompany may elect to place formally designated cash flow hedges. For allcurrencies within the indices, excluding the U.S. Dollar and the local orfunctional currency of the factory, an embedded derivative contract is createdupon the factory’s acceptance of NIKE’s purchase order. Embeddedderivative contracts are separated from the related purchase order and theiraccounting treatment is described further below.
The Company’s policy permits the utilization of derivatives to reduce itsforeign currency exposures where internal netting or other strategies cannotbe effectively employed. Hedged transactions are denominated primarily inEuros, British Pounds and Japanese Yen. Typically the Company may enterinto hedge contracts starting 12 to 24 months in advance of the forecastedtransaction and may place incremental hedges up to 100% of the exposureby the time the forecasted transaction occurs.
All changes in the fair value of derivatives designated as cash flow hedges,excluding any ineffective portion, are recorded in Other comprehensiveincome until Net income is affected by the variability of cash flows of thehedged transaction. In most cases, amounts recorded in Othercomprehensive income will be released to Net income sometime after thematurity of the related derivative. Effective hedge results are classified withinthe Consolidated Statements of Income in the same manner as theunderlying exposure, with the results of hedges of non-functional currencydenominated revenues and product cost exposures, excluding embeddedderivatives as described below, recorded in Revenues or Cost of sales, whenthe underlying hedged transaction affects consolidated Net income. Resultsof hedges of selling and administrative expense are recorded together withthose costs when the related expense is recorded. Results of hedges ofanticipated purchases and sales of U.S. Dollar-denominated available-for-sale securities are recorded in Other expense (income), net when thesecurities are sold. Results of hedges of certain anticipated intercompanytransactions are recorded in Other expense (income), net when thetransaction occurs. The Company classifies the cash flows at settlement fromthese designated cash flow hedge derivatives in the same category as thecash flows from the related hedged items, generally within the Cash providedby operations component of the Consolidated Statement of Cash Flows.
Premiums paid on options are initially recorded as deferred charges. TheCompany assesses the effectiveness of options based on the total cash flowsmethod and records total changes in the options’ fair value to Othercomprehensive income to the degree they are effective.
The Company formally assesses, both at a hedge’s inception and on anongoing basis, whether the derivatives that are used in the hedgingtransaction have been highly effective in offsetting changes in the cash flowsof hedged items and whether those derivatives may be expected to remainhighly effective in future periods. Effectiveness for cash flow hedges isassessed based on changes in forward rates. Ineffectiveness was immaterialfor the years ended May 31, 2014, 2013, and 2012.
The Company discontinues hedge accounting prospectively when (1) itdetermines that the derivative is no longer highly effective in offsetting
changes in the cash flows of a hedged item (including hedged items such asfirm commitments or forecasted transactions); (2) the derivative expires or issold, terminated, or exercised; (3) it is no longer probable that the forecastedtransaction will occur; or (4) management determines that designating thederivative as a hedging instrument is no longer appropriate.
When the Company discontinues hedge accounting because it is no longerprobable that the forecasted transaction will occur in the originally expectedperiod, but is expected to occur within an additional two-month period of timethereafter, the gain or loss on the derivative remains in Accumulated othercomprehensive income and is reclassified to Net income when the forecastedtransaction affects consolidated Net income. However, if it is probable that aforecasted transaction will not occur by the end of the originally specified timeperiod or within an additional two-month period of time thereafter, the gainsand losses that were accumulated in Other comprehensive income will berecognized immediately in Other expense (income), net. In all situations inwhich hedge accounting is discontinued and the derivative remainsoutstanding, the Company will carry the derivative at its fair value on theConsolidated Balance Sheets, recognizing future changes in the fair value inOther expense (income), net. For the years ended May 31, 2014, 2013, and2012, the amounts recorded in Other expense (income), net as a result of thediscontinuance of cash flow hedging because the forecasted transaction wasno longer probable of occurring were immaterial.
As of May 31, 2014, $10 million of deferred net gains (net of tax) on bothoutstanding and matured derivatives accumulated in Other comprehensiveincome are expected to be reclassified to Net income during the next 12months concurrent with the underlying hedged transactions also beingrecorded in Net income. Actual amounts ultimately reclassified to Net incomeare dependent on the exchange rates in effect when derivative contracts thatare currently outstanding mature. As of May 31, 2014, the maximum termover which the Company is hedging exposures to the variability of cash flowsfor its forecasted transactions is 24 months.
Fair Value HedgesThe Company is also exposed to the risk of changes in the fair value of certainfixed-rate debt attributable to changes in interest rates. Derivatives currentlyused by the Company to hedge this risk are receive-fixed, pay-variableinterest rate swaps. As of May 31, 2014, all interest rate swap agreements aredesignated as fair value hedges of the related long-term debt and meet theshortcut method requirements under the accounting standards for derivativesand hedging. Accordingly, changes in the fair values of the interest rate swapagreements are considered to exactly offset changes in the fair value of theunderlying long-term debt. The cash flows associated with the Company’sfair value hedges are periodic interest payments while the swaps areoutstanding, which are reflected within the Cash provided by operationscomponent of the Consolidated Statement of Cash Flows. The Companyrecorded no ineffectiveness from its interest rate swaps designated as fairvalue hedges for the years ended May 31, 2014, 2013, or 2012.
Net Investment HedgesThe Company has hedged and may, in the future, hedge the risk of variabilityin foreign-currency-denominated net investments in wholly-ownedinternational operations. All changes in fair value of the derivatives designatedas net investment hedges, except ineffective portions, are reported in theCumulative translation adjustment component of Other comprehensiveincome along with the foreign currency translation adjustments on thoseinvestments. The Company classifies the cash flows at settlement of its netinvestment hedges within the Cash (used) provided by investing activitiescomponent of the Consolidated Statement of Cash Flows. The Companyassesses hedge effectiveness based on changes in forward rates. TheCompany recorded no ineffectiveness from its net investment hedges for theyears ended May 31, 2014, 2013, or 2012.
NIKE, INC. 2014 Annual Report and Notice of Annual Meeting 111
FOR
M10
-K

PART II
Embedded DerivativesAs part of the foreign currency adjustment program described above, anembedded derivative contract is created upon the factory’s acceptance ofNIKE’s purchase order for currencies within the factory currency exposureindices that are neither the U.S. Dollar nor the local or functional currency ofthe factory. Embedded derivative contracts are treated as foreign currencyforward contracts that are bifurcated from the related purchase order andrecorded at fair value as a derivative asset or liability on the ConsolidatedBalance Sheets with their corresponding change in fair value recognized inOther expense (income), net from the date a purchase order is accepted by afactory through the date the purchase price is no longer subject to foreigncurrency fluctuations. At May 31, 2014, the notional amount of embeddedderivatives was approximately $100 million.
Undesignated Derivative InstrumentsThe Company may elect to enter into foreign exchange forwards to mitigatethe change in fair value of specific assets and liabilities on the ConsolidatedBalance Sheets and/or the embedded derivative contracts explained above.These forwards are not designated as hedging instruments under theaccounting standards for derivatives and hedging. Accordingly, theseundesignated instruments are recorded at fair value as a derivative asset orliability on the Consolidated Balance Sheets with their corresponding changein fair value recognized in Other expense (income), net, together with the re-measurement gain or loss from the hedged balance sheet position orembedded derivative contract. The Company classifies the cash flows atsettlement from undesignated instruments in the same category as the cashflows from the related hedged items, generally within the Cash provided byoperations component of the Consolidated Statement of Cash Flows.
Credit RiskThe Company is exposed to credit-related losses in the event of non-performance by counterparties to hedging instruments. The counterparties toall derivative transactions are major financial institutions with investment gradecredit ratings. However, this does not eliminate the Company’s exposure tocredit risk with these institutions. This credit risk is limited to the unrealizedgains in such contracts should any of these counterparties fail to perform ascontracted. To manage this risk, the Company has established strictcounterparty credit guidelines that are continually monitored.
The Company’s derivative contracts contain credit risk related contingentfeatures designed to protect against significant deterioration in counterparties’creditworthiness and their ultimate ability to settle outstanding derivativecontracts in the normal course of business. The Company’s bilateral creditrelated contingent features generally require the owing entity, either theCompany or the derivative counterparty, to post collateral for the portion ofthe fair value in excess of $50 million should the fair value of outstandingderivatives to either counterparty be greater than $50 million. Additionally, acertain level of decline in credit rating of either the Company or thecounterparty could also trigger collateral requirements. As of May 31, 2014,the Company was in compliance with all credit risk related contingent featuresand the fair value of its derivative instruments with credit risk relatedcontingent features in a net liability position was $22 million. Accordingly, theCompany was not required to post any collateral as a result of thesecontingent features. Further, as of May 31, 2014 those counterparties whichwere required to post collateral complied with such requirements. Given theconsiderations described above, the Company considers the impact of therisk of counterparty default to be immaterial.
NOTE 18 — Operating Segments and Related Information
The Company’s operating segments are evidence of the structure of theCompany’s internal organization. The Company’s operating segments havechanged beginning in the first quarter of fiscal 2014 to mirror the changes inthe structure of the Company’s internal organization that were effective duringthe first quarter of fiscal 2014. The NIKE Brand segments continue to bedefined by geographic regions for operations participating in NIKE Brandsales activity and also include the results of NIKE Golf and Hurley, which arenow managed within the geographies. Previously, NIKE Golf and Hurley werecombined with Converse and reported as “Other Businesses.”
Each NIKE Brand geographic segment operates predominantly in oneindustry: the design, development, marketing and selling of athletic footwear,apparel, and equipment. The Company’s reportable operating segments forthe NIKE Brand are: North America, Western Europe, Central & EasternEurope, Greater China, Japan, and Emerging Markets. The Company’s NIKEBrand Direct to Consumer operations are managed within each geographicoperating segment. Converse is also a reportable segment for NIKE, Inc., andoperates in one industry: the design, marketing, licensing, and selling ofcasual sneakers, apparel, and accessories. Prior period segment informationhas been restated to reflect these changes.
Global Brand Divisions is included within the NIKE Brand for presentationpurposes to align with the way management views the Company. GlobalBrand Divisions primarily represent NIKE Brand licensing businesses that arenot part of a geographic operating segment, Demand creation expense andOperating overhead expense that are centrally managed for the NIKE Brand,and costs associated with product development and supply chainoperations.
Corporate consists largely of unallocated general and administrativeexpenses, including expenses associated with centrally manageddepartments, depreciation and amortization related to the Company’sheadquarters, unallocated insurance and benefit programs, including stock-
based compensation, certain foreign currency gains and losses, includingcertain hedge gains and losses, certain corporate eliminations and otheritems.
The primary financial measure used by the Company to evaluate performanceof individual operating segments is earnings before interest and taxes(commonly referred to as “EBIT”), which represents Net income beforeInterest expense (income), net and Income tax expense in the ConsolidatedStatements of Income. Reconciling items for EBIT represent corporateexpense items that are not allocated to the operating segments formanagement reporting.
As part of the Company’s centrally managed foreign exchange riskmanagement program, standard foreign currency rates are assigned twiceper year to each NIKE Brand entity in the Company’s geographic operatingsegments and to Converse. These rates are set approximately nine months inadvance of the future selling season based on average market spot rates inthe calendar month preceding the date they are established. Inventories andCost of sales for geographic operating segments and Converse reflect use ofthese standard rates to record non-functional currency product purchases inthe entity’s functional currency. Differences between assigned standardforeign currency rates and actual market rates are included in Corporate,together with foreign currency hedge gains and losses generated from theCompany’s centrally managed foreign exchange risk management programand other conversion gains and losses.
Accounts receivable, Inventories and Property, plant and equipment foroperating segments are regularly reviewed by management and are thereforeprovided below. Additions to long-lived assets as presented in the followingtable represent capital expenditures.
Certain prior year amounts have been reclassified to conform to fiscal 2014presentation.
112
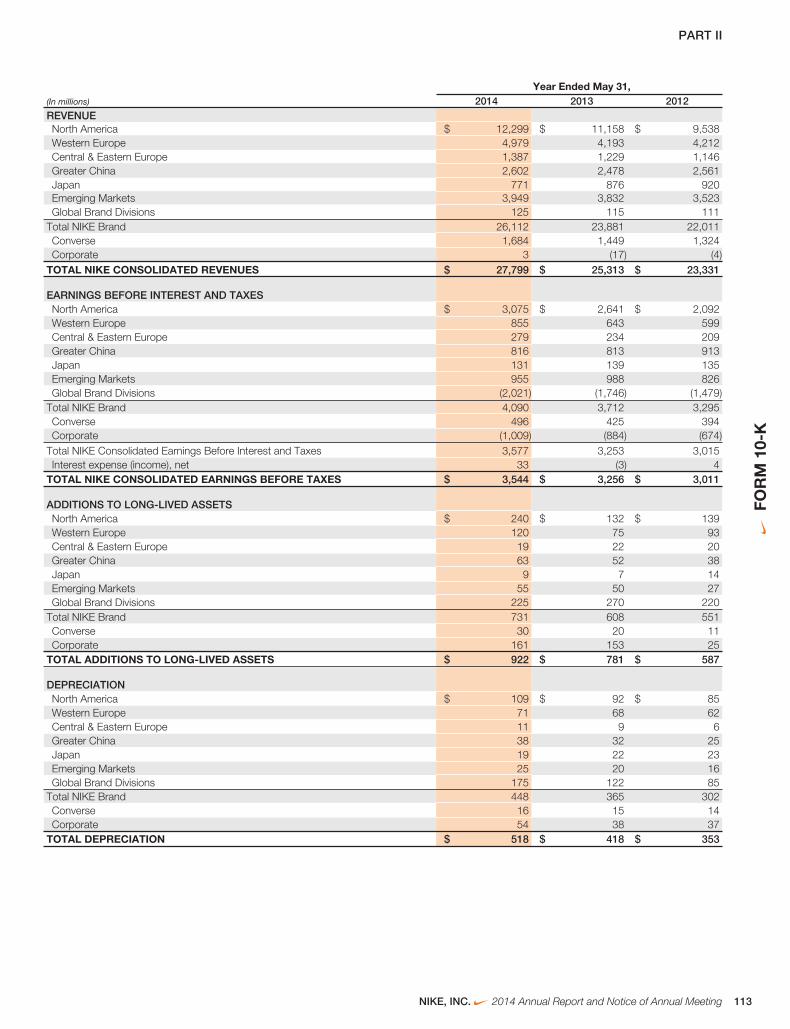
PART II
Year Ended May 31,(In millions) 2014 2013 2012REVENUENorth America $ 12,299 $ 11,158 $ 9,538Western Europe 4,979 4,193 4,212Central & Eastern Europe 1,387 1,229 1,146Greater China 2,602 2,478 2,561Japan 771 876 920Emerging Markets 3,949 3,832 3,523Global Brand Divisions 125 115 111
Total NIKE Brand 26,112 23,881 22,011Converse 1,684 1,449 1,324Corporate 3 (17) (4)
TOTAL NIKE CONSOLIDATED REVENUES $ 27,799 $ 25,313 $ 23,331
EARNINGS BEFORE INTEREST AND TAXESNorth America $ 3,075 $ 2,641 $ 2,092Western Europe 855 643 599Central & Eastern Europe 279 234 209Greater China 816 813 913Japan 131 139 135Emerging Markets 955 988 826Global Brand Divisions (2,021) (1,746) (1,479)
Total NIKE Brand 4,090 3,712 3,295Converse 496 425 394Corporate (1,009) (884) (674)
Total NIKE Consolidated Earnings Before Interest and Taxes 3,577 3,253 3,015Interest expense (income), net 33 (3) 4
TOTAL NIKE CONSOLIDATED EARNINGS BEFORE TAXES $ 3,544 $ 3,256 $ 3,011
ADDITIONS TO LONG-LIVED ASSETSNorth America $ 240 $ 132 $ 139Western Europe 120 75 93Central & Eastern Europe 19 22 20Greater China 63 52 38Japan 9 7 14Emerging Markets 55 50 27Global Brand Divisions 225 270 220
Total NIKE Brand 731 608 551Converse 30 20 11Corporate 161 153 25
TOTAL ADDITIONS TO LONG-LIVED ASSETS $ 922 $ 781 $ 587
DEPRECIATIONNorth America $ 109 $ 92 $ 85Western Europe 71 68 62Central & Eastern Europe 11 9 6Greater China 38 32 25Japan 19 22 23Emerging Markets 25 20 16Global Brand Divisions 175 122 85
Total NIKE Brand 448 365 302Converse 16 15 14Corporate 54 38 37
TOTAL DEPRECIATION $ 518 $ 418 $ 353
NIKE, INC. 2014 Annual Report and Notice of Annual Meeting 113
FOR
M10
-K

PART II
As of May 31,(In millions) 2014 2013ACCOUNTS RECEIVABLE, NETNorth America $ 1,505 $ 1,459Western Europe 341 375Central & Eastern Europe 280 287Greater China 68 56Japan 162 154Emerging Markets 819 574Global Brand Divisions 71 30
Total NIKE Brand 3,246 2,935Converse 171 131Corporate 17 51
TOTAL ACCOUNTS RECEIVABLE, NET $ 3,434 $ 3,117
INVENTORIESNorth America $ 1,758 $ 1,626Western Europe 711 560Central & Eastern Europe 271 207Greater China 221 209Japan 94 69Emerging Markets 633 567Global Brand Divisions 18 30
Total NIKE Brand 3,706 3,268Converse 261 210Corporate (20) 6
TOTAL INVENTORIES $ 3,947 $ 3,484
PROPERTY, PLANT AND EQUIPMENT, NETNorth America $ 545 $ 424Western Europe 384 327Central & Eastern Europe 51 44Greater China 232 213Japan 258 269Emerging Markets 115 89Global Brand Divisions 537 473
Total NIKE Brand 2,122 1,839Converse 70 52Corporate 642 561
TOTAL PROPERTY, PLANT AND EQUIPMENT, NET $ 2,834 $ 2,452
Revenues by Major Product LinesRevenues to external customers for NIKE Brand products are attributable to sales of footwear, apparel and equipment. Other revenues to external customersconsist primarily of sales by Converse.
Year Ended May 31,(In millions) 2014 2013 2012Footwear $ 16,208 $ 14,635 $ 13,513Apparel 8,109 7,491 6,958Equipment 1,670 1,640 1,429Other 1,812 1,547 1,431TOTAL NIKE CONSOLIDATED REVENUES $ 27,799 $ 25,313 $ 23,331
Revenues and Long-Lived Assets byGeographic AreaAfter allocation of revenues for Global Brand Divisions, Converse andCorporate to geographical areas based on the location where the salesoriginated, revenues by geographical area are essentially the same asreported above under operating segments with the exception of the UnitedStates. Revenues derived in the United States were $12,711 million, $11,385million, and $9,793 million for the years ended May 31, 2014, 2013, and2012, respectively. The Company’s largest concentrations of long-livedassets primarily consist of the Company’s world headquarters anddistribution facilities in the United States and distribution facilities in Japan,Belgium and China. Long-lived assets attributable to operations in the
United States, which are primarily composed of net property, plant &equipment, were $1,652 million and $1,374 million at May 31, 2014 and2013, respectively. Long-lived assets attributable to operations in Japan were$258 million and $270 million at May 31, 2014 and 2013, respectively. Long-lived assets attributable to operations in Belgium were $175 million and $157million at May 31, 2014 and 2013, respectively. Long-lived assets attributableto operations in China were $234 million and $212 million at May 31, 2014and 2013, respectively.
Major CustomersNo customer accounted for 10% or more of the Company’s net Revenuesduring the years ended May 31, 2014, 2013, and 2012.
114

PART II
ITEM 9. Changes In and Disagreements withAccountants on Accounting and FinancialDisclosure
There has been no change of accountants nor any disagreements with accountants on any matter of accounting principles or practices or financial statementdisclosure required to be reported under this Item.
ITEM 9A. Controls and ProceduresWe maintain disclosure controls and procedures that are designed to ensureinformation required to be disclosed in our Exchange Act reports is recorded,processed, summarized, and reported within the time periods specified in theSEC’s rules and forms and that such information is accumulated andcommunicated to our management, including our Chief Executive Officer andChief Financial Officer, as appropriate, to allow for timely decisions regardingrequired disclosure. In designing and evaluating the disclosure controls andprocedures, management recognizes that any controls and procedures, nomatter how well designed and operated, can provide only reasonableassurance of achieving the desired control objectives, and management isrequired to apply its judgment in evaluating the cost-benefit relationship ofpossible controls and procedures.
We carry out a variety of ongoing procedures, under the supervision and withthe participation of our management, including our Chief Executive Officer
and Chief Financial Officer, to evaluate the effectiveness of the design andoperation of our disclosure controls and procedures. Based on the foregoing,our Chief Executive Officer and Chief Financial Officer concluded that ourdisclosure controls and procedures were effective at the reasonableassurance level as of May 31, 2014.
“Management’s Annual Report on Internal Control Over Financial Reporting”is included in Item 8 of this Report.
There has been no change in our internal control over financial reportingduring our most recent fiscal quarter that has materially affected, or isreasonable likely to materially affect, our internal control over financialreporting.
ITEM 9B. Other InformationNo disclosure is required under this Item.
NIKE, INC. 2014 Annual Report and Notice of Annual Meeting 115
FOR
M10
-K

PART III
PART III
ITEM 10. Directors, Executive Officers and CorporateGovernance
The information required by Item 401 of Regulation S-K regarding directors isincluded under “Election of Directors” in the definitive Proxy Statement for our2014 Annual Meeting of Shareholders and is incorporated herein byreference. The information required by Item 401 of Regulation S-K regardingexecutive officers is included under “Executive Officers of the Registrant” inItem 1 of this Report. The information required by Item 405 of Regulation S-Kis included under “Election of Directors — Section 16(a) Beneficial OwnershipReporting Compliance” in the definitive Proxy Statement for our 2014 AnnualMeeting of Shareholders and is incorporated herein by reference. The
information required by Item 406 of Regulation S-K is included under“Corporate Governance — Code of Business Conduct and Ethics” in thedefinitive Proxy Statement for our 2014 Annual Meeting of Shareholders andis incorporated herein by reference. The information required byItems 407(d)(4) and (d)(5) of Regulation S-K regarding the Audit Committee ofthe Board of Directors is included under “Corporate Governance — BoardCommittees” in the definitive Proxy Statement for our 2014 Annual Meeting ofShareholders and is incorporated herein by reference.
ITEM 11. Executive CompensationThe information required by Items 402, 407(e)(4), and 407(e)(5) of RegulationS-K regarding executive compensation is included under “Election ofDirectors — Director Compensation for Fiscal 2014,” “CompensationDiscussion and Analysis,” “Executive Compensation,” “Election of Directors
— Compensation Committee Interlocks and Insider Participation,” and“Compensation Committee Report” in the definitive Proxy Statement for our2014 Annual Meeting of Shareholders and is incorporated herein byreference.
ITEM 12. Security Ownership of Certain BeneficialOwners and Management and RelatedStockholder Matters
The information required by Item 201(d) of Regulation S-K is included under“Executive Compensation — Equity Compensation Plans” in the definitiveProxy Statement for our 2014 Annual Meeting of Shareholders and isincorporated herein by reference. The information required by Item 403 of
Regulation S-K is included under “Election of Directors — Stock Holdings ofCertain Owners and Management” in the definitive Proxy Statement for our2014 Annual Meeting of Shareholders and is incorporated herein byreference.
ITEM 13. Certain Relationships and RelatedTransactions, and Director Independence
The information required by Items 404 and 407(a) of Regulation S-K is included under “Election of Directors — Transactions with Related Persons” and“Corporate Governance — Director Independence” in the definitive Proxy Statement for our 2014 Annual Meeting of Shareholders and is incorporated herein byreference.
ITEM 14. Principal Accountant Fees and ServicesThe information required by Item 9(e) of Schedule 14A is included under “Ratification Of Independent Registered Public Accounting Firm” in the definitive ProxyStatement for our 2014 Annual Meeting of Shareholders and is incorporated herein by reference.
116

PART IV
PART IV
ITEM 15. Exhibits and Financial Statement Schedules
(a) The following documents are filed as part of this report:
Form 10-KPage No.
1. Financial Statements:
Report of Independent Registered Public Accounting Firm 87
Consolidated Statements of Income for each of the three years ended May 31, 2014, May 31, 2013,and May 31, 2012
88
Consolidated Statements of Comprehensive Income for each of the three years ended May 31, 2014,May 31, 2013, and May 31, 2012
89
Consolidated Balance Sheets at May 31, 2014 and May 31, 2013 90
Consolidated Statements of Cash Flows for each of the three years ended May 31, 2014, May 31,2013, and May 31, 2012
91
Consolidated Statements of Shareholders’ Equity for each of the three years ended May 31,2014, May 31, 2013, and May 31, 2012
92
Notes to Consolidated Financial Statements 93
2. Financial Statement Schedule:
II — Valuation and Qualifying Accounts 120
All other schedules are omitted because they are not applicable or the required information isshown in the financial statements or notes thereto.
NIKE, INC. 2014 Annual Report and Notice of Annual Meeting 117
FOR
M10
-K

PART IV
3. Exhibits:
3.1 Restated Articles of Incorporation, as amended (incorporated by reference to Exhibit 3.1 to the Company’s Quarterly Report onForm 10-Q for the fiscal quarter ended November 30, 2012).
3.2 Third Restated Bylaws, as amended (incorporated by reference to Exhibit 3.2 to the Company’s Current Report on Form 8-K filedJune 21, 2013).
4.1 Restated Articles of Incorporation, as amended (see Exhibit 3.1).4.2 Third Restated Bylaws, as amended (see Exhibit 3.2).10.1 Form of Non-Statutory Stock Option Agreement for options granted to non-employee directors prior to May 31, 2010 under the
1990 Stock Incentive Plan (incorporated by reference to Exhibit 10.3 to the Company’s Current Report on Form 8-K filed June 21,2005, File No. 1-10635).*
10.2 Form of Non-Statutory Stock Option Agreement for options granted to non-employee directors after May 31, 2010 under the 1990Stock Incentive Plan (incorporated by reference to Exhibit 10.2 to the Company’s Annual Report on Form 10-K for the fiscal yearended May 31, 2010).*
10.3 Form of Non-Statutory Stock Option Agreement for options granted to executives prior to May 31, 2010 under the 1990 StockIncentive Plan (incorporated by reference to Exhibit 10.1 to the Company’s Annual Report on Form 10-K for the fiscal year endedMay 31, 2009, File No. 1-10635).*
10.4 Form of Restricted Stock Agreement for non-employee directors under the 1990 Stock Incentive Plan.*10.5 Form of Non-Statutory Stock Option Agreement for options granted to executives after May 31, 2010 under the 1990 Stock
Incentive Plan (incorporated by reference to Exhibit 10.4 to the Company’s Annual Report on Form 10-K for the fiscal year endedMay 3, 2013).*
10.6 Form of Indemnity Agreement entered into between the Company and each of its officers and directors (incorporated by referenceto Exhibit 10.2 to the Company’s Annual Report on Form 10-K for the fiscal year ended May 31, 2008, File No. 1-10635).*
10.7 NIKE, Inc. 1990 Stock Incentive Plan.*10.8 NIKE, Inc. Executive Performance Sharing Plan (incorporated by reference to Exhibit 10.7 to the Company’s Annual Report on Form
10-K for the fiscal year ended May 31, 2012).*10.9 NIKE, Inc. Long-Term Incentive Plan (incorporated by reference to Exhibit 10.1 to the Company’s Current Report on Form 8-K filed
on September 26, 2012).*10.10 NIKE, Inc. Deferred Compensation Plan (Amended and Restated effective April 1, 2013) (incorporated by reference to Exhibit 10.9
to the Company’s Annual Report on Form 10-K for the fiscal year ended May 31, 2013).*10.11 NIKE, Inc. Deferred Compensation Plan (Amended and Restated effective June 1, 2004) (applicable to amounts deferred before
January 1, 2005) (incorporated by reference to Exhibit 10.6 to the Company’s Annual Report on Form 10-K for the fiscal year endedMay 31, 2004, File No. 1-10635).*
10.12 Amendment No. 1 effective January 1, 2008 to the NIKE, Inc. Deferred Compensation Plan (June 1, 2004 Restatement)(incorporated by reference to Exhibit 10.9 to the Company’s Annual Report on Form 10-K for the fiscal year ended May 31, 2009,File No. 1-10635).*
10.13 NIKE, Inc. Foreign Subsidiary Employee Stock Purchase Plan (incorporated by reference to Exhibit 10.1 to the Company’s QuarterlyReport on Form 10-Q for the fiscal quarter ended November 30, 2008, File No. 1-10635).*
10.14 Amended and Restated Covenant Not To Compete and Non-Disclosure Agreement between NIKE, Inc. and Mark G. Parker datedJuly 24, 2008 (incorporated by reference to Exhibit 10.1 to the Company’s Current Report on Form 8-K filed July 24, 2008, File No.1-10635).*
10.15 Form of Restricted Stock Bonus Agreement under the 1990 Stock Incentive Plan for awards prior to May 31, 2010 (incorporated byreference to Exhibit 10.2 to the Company’s Current Report on Form 8-K filed June 21, 2005, File No. 1-10635).*
10.16 Form of Restricted Stock Agreement under the 1990 Stock Incentive Plan for awards after May 31, 2010 (incorporated by referenceto Exhibit 10.16 to the Company’s Annual Report on Form 10-K for the fiscal year ended May 31, 2013).*
10.17 Form of Restricted Stock Unit Agreement under the 1990 Stock Incentive Plan (incorporated by reference to Exhibit 10.17 to theCompany’s Annual Report on Form 10-K for the fiscal year ended May 31, 2013).*
10.18 Covenant Not to Compete and Non-Disclosure Agreement between NIKE, Inc. and Donald W. Blair dated November 10, 1999(incorporated by reference to Exhibit 10.15 to the Company’s Annual Report on Form 10-K for the fiscal year ended May 31, 2006,File No. 1-10635).*
10.19 Covenant Not to Compete and Non-Disclosure Agreement between NIKE, Inc. and Eric D. Sprunk dated April 18, 2001(incorporated by reference to Exhibit 10.23 to the Company’s Annual Report on Form 10-K for the fiscal year ended May 31,2010).*
10.20 Covenant Not to Compete and Non-Disclosure Agreement between NIKE, Inc. and Trevor A. Edwards dated November 14, 2002(incorporated by reference to Exhibit 10.19 to the Company’s Annual Report on Form 10-K for the fiscal year ended May 31, 2008,File No. 1-10635).*
10.21 Covenant Not to Compete and Non-Disclosure Agreement between NIKE, Inc. and Jeanne Jackson dated March 4, 2009.*10.22 Policy for Recoupment of Incentive Compensation (incorporated by reference to Exhibit 10.3 to the Company’s Current Report on
Form 8-K filed July 20, 2010).*10.23 Credit Agreement dated as of November 1, 2011 among NIKE, Inc., Bank of America, N.A., individually and as Agent and the other
banks party thereto (incorporated by reference to Exhibit 10.1 to the Company’s Current Report on Form 8-K filed November 2,2011).
12.1 Computation of Ratio of Earnings to Fixed Charges.21 Subsidiaries of the Registrant.23 Consent of PricewaterhouseCoopers LLP, Independent Registered Public Accounting Firm (included within this Annual Report on
Form 10-K).
118

PART IV
31.1 Rule 13a-14(a)/15d-14(a) Certification of Chief Executive Officer.31.2 Rule 13a-14(a)/15d-14(a) Certification of Chief Financial Officer.32 Section 1350 Certifications.101.INS XBRL Instance Document101.SCH XBRL Taxonomy Extension Schema101.CAL XBRL Taxonomy Extension Calculation Linkbase101.DEF XBRL Taxonomy Extension Definition Document101.LAB XBRL Taxonomy Extension Label Linkbase101.PRE XBRL Taxonomy Extension Presentation Linkbase
* Management contract or compensatory plan or arrangement.
The Exhibits filed herewith do not include certain instruments with respect to long-term debt of NIKE and its subsidiaries, inasmuch as the total amount of debtauthorized under any such instrument does not exceed 10 percent of the total assets of NIKE and its subsidiaries on a consolidated basis. NIKE agrees, pursuantto Item 601(b)(4)(iii) of Regulation S-K, that it will furnish a copy of any such instrument to the SEC upon request.
Upon written request to Investor Relations, NIKE, Inc., One Bowerman Drive, Beaverton, Oregon 97005-6453, NIKE will furnish shareholders with a copy of anyExhibit upon payment of $0.10 per page, which represents our reasonable expenses in furnishing Exhibits.
NIKE, INC. 2014 Annual Report and Notice of Annual Meeting 119
FOR
M10
-K
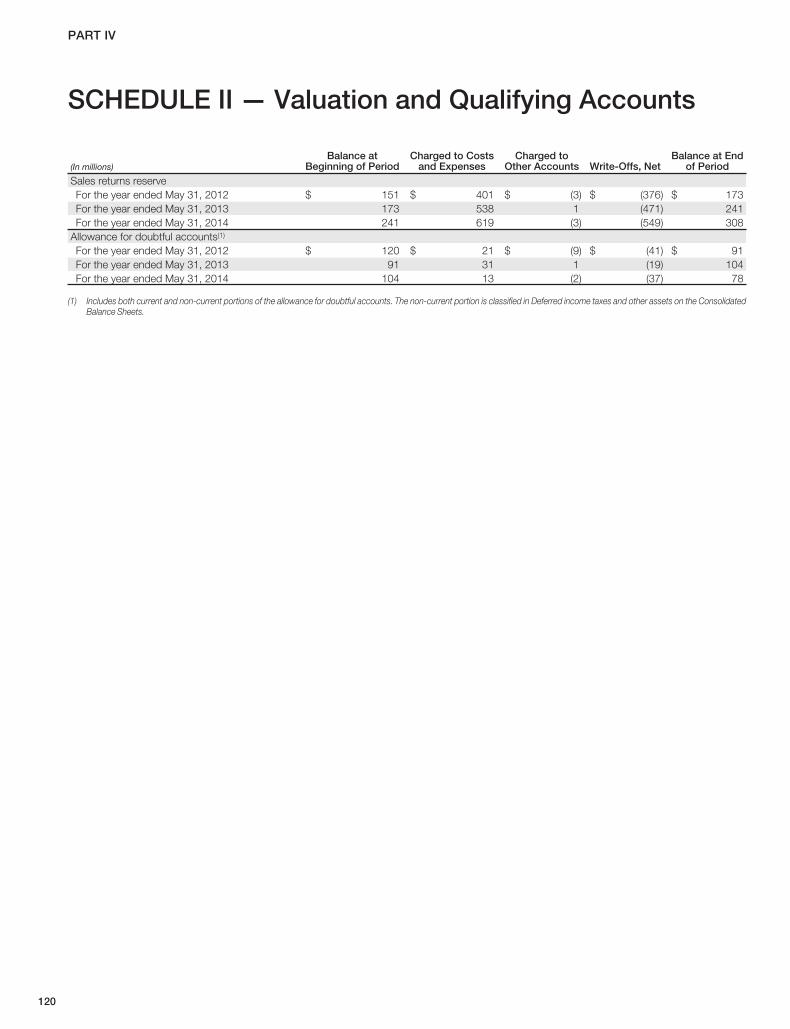
PART IV
SCHEDULE II — Valuation and Qualifying Accounts
(In millions)Balance at
Beginning of PeriodCharged to Costs
and ExpensesCharged to
Other Accounts Write-Offs, NetBalance at End
of PeriodSales returns reserveFor the year ended May 31, 2012 $ 151 $ 401 $ (3) $ (376) $ 173For the year ended May 31, 2013 173 538 1 (471) 241For the year ended May 31, 2014 241 619 (3) (549) 308
Allowance for doubtful accounts(1)
For the year ended May 31, 2012 $ 120 $ 21 $ (9) $ (41) $ 91For the year ended May 31, 2013 91 31 1 (19) 104For the year ended May 31, 2014 104 13 (2) (37) 78
(1) Includes both current and non-current portions of the allowance for doubtful accounts. The non-current portion is classified in Deferred income taxes and other assets on the ConsolidatedBalance Sheets.
120

PART IV
Consent of Independent Registered Public Accounting Firm
We hereby consent to the incorporation by reference in the Registration Statements on Form S-3 (No. 333-188072) and Form S-8 (Nos. 033-63995, 333-63581,333-63583, 333-68864, 333-68886, 333-71660, 333-104822, 333-117059, 333-133360, 333-164248, 333-171647, and 333-173727) of NIKE, Inc. of ourreport dated July 25, 2014 relating to the financial statements, financial statement schedule and the effectiveness of internal control over financial reporting, whichappears in this Form 10-K.
/s/ PRICEWATERHOUSECOOPERS LLP
Portland, Oregon
July 25, 2014
NIKE, INC. 2014 Annual Report and Notice of Annual Meeting 121
FOR
M10
-K

PART IV
SignaturesPursuant to the requirements of Section 13 or 15(d) of the Securities Exchange Act of 1934, the registrant has duly caused this report to be signed on its behalf bythe undersigned, thereunto duly authorized.
NIKE, INC.
By: /s/ MARK G. PARKER
Mark G. ParkerChief Executive Officer and President
Date: July 25, 2014
Pursuant to the requirements of the Securities Exchange Act of 1934, as amended, this report has been signed below by the following persons on behalf of theregistrant and in the capacities and on the dates indicated.
Signature Title Date
PRINCIPAL EXECUTIVE OFFICER AND DIRECTOR:/s/ MARK G. PARKERMark G. Parker Director, Chief Executive Officer and President July 25, 2014PRINCIPAL FINANCIAL OFFICER:/s/ DONALD W. BLAIRDonald W. Blair Chief Financial Officer July 25, 2014PRINCIPAL ACCOUNTING OFFICER:/s/ BERNARD F. PLISKABernard F. Pliska Corporate Controller July 25, 2014DIRECTORS:/s/ PHILIP H. KNIGHTPhilip H. Knight Director, Chairman of the Board July 25, 2014
/s/ ELIZABETH J. COMSTOCKElizabeth J. Comstock Director July 25, 2014
/s/ JOHN G. CONNORSJohn G. Connors Director July 25, 2014
/s/ TIMOTHY D. COOKTimothy D. Cook Director July 25, 2014
/s/ JOHN J. DONAHOE IIJohn J. Donahoe II Director July 25, 2014
/s/ ALAN B. GRAF, JR.Alan B. Graf, Jr. Director July 25, 2014
/s/ DOUGLAS G. HOUSERDouglas G. Houser Director July 25, 2014
/s/ JOHN C. LECHLEITERJohn C. Lechleiter Director July 25, 2014
/s/ MICHELLE A. PELUSOMichelle A. Peluso Director July 25, 2014
/s/ JOHNATHAN A. RODGERSJohnathan A. Rodgers Director July 25, 2014
/s/ ORIN C. SMITHOrin C. Smith Director July 25, 2014
/s/ JOHN R. THOMPSON, JR.John R. Thompson, Jr. Director July 25, 2014
/s/ PHYLLIS M. WISEPhyllis M. Wise Director July 25, 2014
122

PART IV
EXHIBIT 12.1 NIKE, Inc. Computation of Ratio of Earnings to Fixed ChargesThe following disclosure reflects the Company’s continuing operations:
Year Ended May 31,(In millions) 2014 2013 2012 2011 2010Net income from continuing operations $ 2,693 $ 2,451 $ 2,257 $ 2,163 $ 1,916Income taxes 851 805 754 689 612Income before income taxes 3,544 3,256 3,011 2,852 2,528Add fixed chargesInterest expense(1) 58 23 31 32 33Interest component of leases(2) 53 48 42 39 36TOTAL FIXED CHARGES 111 71 73 71 69Earnings before income taxes and fixed charges(3) $ 3,655 $ 3,327 $ 3,084 $ 2,923 $ 2,597Ratio of earnings to total fixed charges 32.9 46.9 42.2 41.2 37.6
(1) Interest expense includes interest both expensed and capitalized.
(2) Interest component of leases includes one-tenth of rental expense which approximates the interest component of operating leases.
(3) Earnings before income taxes and fixed charges are exclusive of capitalized interest.
NIKE, INC. 2014 Annual Report and Notice of Annual Meeting 123
FOR
M10
-K

PART IV
EXHIBIT 21 Subsidiaries of the Registrant
Entity Name Jurisdiction of FormationAir Max Limited BermudaAll Star C.V. NetherlandsAmerican NIKE S.L.U. SpainA.S. Roma Merchandising s.r.l. ItalyBRS NIKE Taiwan Inc. TaiwanConverse (Asia Pacific) Limited Hong KongConverse Canada Corp. CanadaConverse Canada Holding B.V. NetherlandsConverse Europe Limited United KingdomConverse Footwear Technical Service (Zhongshan) Co., Ltd. People’s Republic of ChinaConverse Holdings LLC DelawareConverse Hong Kong Holding Company Limited Hong KongConverse Hong Kong Limited Hong KongConverse Inc. DelawareConverse Korea LLC KoreaConverse Netherlands B.V. NetherlandsConverse Sporting Goods (China) Co., Ltd. People’s Republic of ChinaConverse Trading Company B.V. NetherlandsF.C. Internazionale Merchandising s.r.l. ItalyFrench Football Merchandising S.A.S. FranceFutbol Club Barcelona Merchandising, S.L. SpainHurley 999, S.L.U. SpainHurley Australia Pty. Ltd. AustraliaHurley Fuse B.V. NetherlandsHurley International Holdings B.V. NetherlandsHurley International LLC OregonHurley Phantom C.V. NetherlandsJuventus Merchandising S.r.l. ItalyLATAM Servicos de Licenciamento Esportivo Ltda. BrazilManchester United Merchandising Limited United KingdomNIKE 360 Holding B.V. NetherlandsNIKE Amplify LLC DelawareNIKE Argentina S.R.L. ArgentinaNIKE Asia Holding B.V. NetherlandsNIKE Australia Holding B.V. NetherlandsNIKE Australia Pty. Ltd. AustraliaNIKE CA LLC DelawareNIKE Canada Corp. CanadaNIKE Canada Holding B.V. NetherlandsNIKE Chile B.V. NetherlandsNIKE China Holding HK Limited Hong KongNIKE Codrus Coöperatief U.A. NetherlandsNIKE Commercial (China) Co., Ltd. ChinaNIKE Cortez BermudaNIKE Costa Rica, SRL Costa RicaNIKE CR d.o.o CroatiaNIKE Czech s.r.o. Czech RepublicNIKE de Chile Ltda. ChileNIKE de Mexico S de R.L. de C.V. MexicoNIKE Denmark ApS DenmarkNIKE Deutschland GmbH GermanyNIKE do Brasil Comercio e Participacoes Ltda. BrazilNIKE Drive B.V. NetherlandsNIKE Dunk Holding B.V. NetherlandsNIKE Elevate C.V. NetherlandsNIKE Europe Holding B.V. NetherlandsNIKE European Operations Netherlands B.V. NetherlandsNIKE Finance Ltd. BermudaNIKE Finland OY FinlandNIKE France S.A.S. France
124

PART IV
Entity Name Jurisdiction of FormationNIKE Fuel B.V. NetherlandsNIKE Fundamentals C.V. NetherlandsNIKE Galaxy Holding B.V. NetherlandsNIKE Gesellschaft m.b.H. AustriaNIKE Glide C.V. NetherlandsNIKE Global Holding B.V. NetherlandsNIKE GLOBAL SERVICES PTE. LTD. SingaporeNIKE GLOBAL TRADING PTE. LTD. SingaporeNIKE Group Holding B.V. NetherlandsNIKE Hellas EPE GreeceNIKE Holding, LLC DelawareNIKE Hong Kong Limited Hong KongNIKE Huarache BermudaNIKE Hungary LLC HungaryNIKE Ignite LLC DelawareNIKE IHM, Inc. MissouriNIKE India Holding B.V. NetherlandsNIKE India Private Limited IndiaNIKE Innovate C.V. NetherlandsNIKE International Holding B.V. NetherlandsNIKE International Holding, Inc. DelawareNIKE International LLC DelawareNIKE International Ltd. BermudaNIKE Israel Ltd. IsraelNIKE Italy S.R.L. ItalyNIKE Japan Corp. JapanNIKE Japan Group LLC JapanNIKE Jump Ltd. BermudaNIKE Korea LLC KoreaNIKE Laser Holding B.V. NetherlandsNIKE Licenciamentos Ltda. BrazilNIKE Lightning C.V. NetherlandsNIKE Logistics Yugen Kaisha JapanNIKE Maxim C.V. NetherlandsNIKE Mercurial Corp. DelawareNIKE Mercurial Finance Limited United KingdomNIKE Mercurial Hong Kong Limited Hong KongNIKE Mercurial Licensing Limited United KingdomNIKE Mercurial Ltd. United KingdomNIKE Mercurial I Limited United KingdomNIKE Mercurial II Limited United KingdomNIKE Mexico Holdings, LLC DelawareNIKE New Zealand Company New ZealandNIKE Norway AS NorwayNIKE NZ Holding B.V. NetherlandsNIKE Offshore Holding B.V. NetherlandsNIKE Panama S. de R.L. PanamaNIKE Philippines, Inc. PhilippinesNIKE Poland Sp.zo.o PolandNIKE Retail B.V. NetherlandsNIKE Retail Hellas Ltd. GreeceNIKE Retail Israel Ltd. IsraelNIKE Retail LLC RussiaNIKE Retail Poland sp. z o. o. PolandNIKE Retail Services, Inc. OregonNIKE Retail Turkey TurkeyNIKE Russia LLC RussiaNIKE SALES (MALAYSIA) SDN. BHD. MalaysiaNIKE Servicios de Mexico S. de R.L. de C.V. MexicoNIKE SINGAPORE PTE LTD SingaporeNIKE Slovakia s.r.o. SlovakiaNIKE Sourcing India Private Limited IndiaNIKE Sourcing (Guangzhou) Co., Ltd. China
NIKE, INC. 2014 Annual Report and Notice of Annual Meeting 125
FOR
M10
-K

PART IV
Entity Name Jurisdiction of FormationNIKE South Africa (Proprietary) Limited South AfricaNIKE South Africa Holdings LLC DelawareNIKE Sphere C.V. NetherlandsNIKE Sports (China) Company, Ltd. People’s Republic of ChinaNIKE Sports Korea Co., Ltd. South KoreaNIKE Suzhou Holding HK Limited Hong KongNIKE (Suzhou) Sports Company, Ltd. People’s Republic of ChinaNIKE Sweden AB SwedenNIKE (Switzerland) GmbH SwitzerlandNIKE Taiwan Limited TaiwanNIKE (Thailand) Limited ThailandNIKE TN, Inc. OregonNIKE Trading Company B.V. NetherlandsNIKE trgovina na debelo d.o.o. SloveniaNIKE UK Holding B.V. NetherlandsNIKE (UK) Limited United KingdomNIKE USA, Inc. OregonNIKE Vapor Ltd. United KingdomNIKE Victory Cooperatief U.A. NetherlandsNIKE Vietnam Limited Liability Company VietnamNIKE Vision, Timing and Techlab, LP TexasNIKE Vomero Cooperatief U.A. NetherlandsNIKE Woodside I, LLC OregonNIKE Woodside II, LLC OregonNIKE Woodside I Holdings, Inc. OregonNIKE Woodside II Holdings, Inc. OregonNIKE Zoom LLC DelawarePT Hurley Indonesia IndonesiaPT NIKE Indonesia IndonesiaSavier, Inc. OregonTriax Insurance, Inc. HawaiiTwin Dragons Global Limited Hong KongTwin Dragons Holding B.V. NetherlandsUmbro Asia Sourcing Limited Hong KongYugen Kaisha Hurley Japan Japan
126

D I R E C T O R S C O R P O R A T E O F F I C E R S
Elizabeth J. Comstock(3)(4)
Senior Vice President & Chief Marketing OfficerGeneral Electric CompanyFairfield, Connecticut
John G. Connors(2)(3)
PartnerIgnition Partners LLCBellevue, Washington
Timothy D. Cook(4)(6)
Chief Executive OfficerApple Inc.Cupertino, California
John J. Donahoe IIPresident & Chief Executive OfficereBay Inc.San Jose, California
Alan B. Graf, Jr.(2)(6)
Executive Vice President & Chief Financial OfficerFedEx CorporationMemphis, Tennessee
Douglas G. Houser(1)(5)(6)
Senior CounselBullivant, Houser, Bailey, P.C., AttorneysPortland, Oregon
Philip H. Knight(1)
Chairman of the BoardNIKE, Inc.Beaverton, Oregon
John C. Lechleiter(4)(5)
Chairman of the Board, President & Chief Executive OfficerEli Lilly and CompanyIndianapolis, Indiana
Mark G. Parker(1)
President & Chief Executive OfficerNIKE, Inc.Beaverton, Oregon
Michelle A. Peluso(2)(5)
Chief Executive OfficerGiltNew York, New York
Johnathan A. Rodgers(4)(5)
President & Chief Executive Officer (Retired)TV One, LLCSilver Springs, Maryland
Orin C. Smith(2)(3)
President & Chief Executive Officer (Retired)Starbucks CorporationSeattle, Washington
John R. Thompson, Jr.(5)
Assistant to the President of Georgetown University for Urban AffairsGeorgetown UniversityWashington, D.C.
Phyllis M. Wise(5)(6)
ChancellorUniversity of Illinois, at Urbana-ChampaignUrbana, Illinois
Philip H. KnightChairman of the Board of Directors
Mark G. ParkerPresident & Chief Executive Officer
David J. AyreExecutive Vice President, Global Human Resources
Donald W. BlairExecutive Vice President & Chief Financial Officer
Trevor A. EdwardsPresident, NIKE Brand
Jeanne P. JacksonPresident, Product & Merchandising
Hilary K. KraneExecutive Vice President, Chief Administrative Officer & GeneralCounsel
John F. SlusherExecutive Vice President, Global Sports Marketing
Eric D. SprunkChief Operating Officer
Kelley K. HallVice President, Corporate Finance & Treasurer
John F. Coburn IIIVice President & Corporate Secretary
Jeanine HayesVice President, Intellectual Property & Assistant Secretary
Evan S. ReynoldsSenior Counsel, Corporate Governance & Assistant Secretary
(1) Member — Executive Committee(2) Member — Audit Committee(3) Member — Finance Committee(4) Member — Compensation Committee(5) Member — Corporate Responsibility Committee(6) Member — Nominating and Corporate Governance Committee
130

S U B S I D I A R I E S L O C A T I O N S
James A. Calhoun Jr.Chief Executive Officer
Robert HurleyPresident & Chief Executive Officer
WORLD HEADQUARTERS
One Bowerman DriveBeaverton, Oregon 97005-6453
EUROPEAN HEADQUARTERS
Colosseum 11213 NL HilversumThe Netherlands
CONVERSE INC.
One High StreetNorth Andover, Massachusetts 01845-2601
HURLEY INTERNATIONAL LLC
1945 Placentia AvenueCosta Mesa,
California 92627
S H A R E H O L D E R I N F O R M A T I O N
I N D E P E N D E N T A C C O U N T A N T S
PricewaterhouseCoopers LLP805 SW Broadway, Suite 800Portland, Oregon 97205
R E G I S T R A R A N D S T O C K T R A N S F E R A G E N T
Computershare Trust Company, N.A.P.O. Box 30170College Station, Texas 77842-3170800-756-8200Hearing Impaired #TDD: 800-952-9245http://www.computershare.com
Shareholder Information
NIKE, Inc. common stock is listed on the New York Stock Exchange under trading symbol ‘NKE.’ Copies of the Company’s Form 10-K or Form10-Q reports filed with the Securities and Exchange Commission are available from the Company without charge. To request a copy, please call800-640-8007 or write to NIKE’s Investor Relations Department at NIKE World Headquarters, One Bowerman Drive, Beaverton, Oregon 97005-6453. Copies are available on the investor relations website, http://investors.nikeinc.com.
Dividend Payments
Quarterly dividends on NIKE common stock, when declared by the Board of Directors, are paid on or about July 5, October 5, January 5, and April 5. Additionalfinancial information is available at http://investors.nikeinc.com.
Other Shareholder Assistance
Communications concerning shareholder address changes, stock transfers, changes of ownership, lost stock certificates, payment of dividends, dividend checkreplacements, duplicate mailings, or other account services should be directed to the Company’s Registrar and Stock Transfer Agent at the address or telephonenumber above.
NIKE, the Swoosh Design, and Just Do It are trademarks of NIKE, Inc.

NIKE, INC.One Bowerman DriveBeaverton, OR 97005-6453www.nike.com