nike, inc.d18rn0p25nwr6d.cloudfront.net/cik-0000320187/e73e377b-9ff8-4588... · capital in excess...
TRANSCRIPT
UNITED STATESSECURITIES AND EXCHANGE COMMISSION
WASHINGTON, D.C. 20549
FORM 10-Q(Mark One)
☑ QUARTERLY REPORT PURSUANT TO SECTION 13 OR 15(d) OF THE SECURITIES EXCHANGE ACT OF 1934For the Quarterly Period Ended August 31, 2017
☐ TRANSITION REPORT PURSUANT TO SECTION 13 OR 15(d) OF THE SECURITIES EXCHANGE ACT OF 1934For the transition period from to
Commission File Number: 001-10635
NIKE, Inc.(Exact name of registrant as specified in its charter)
OREGON 93-0584541
(State or other jurisdiction ofincorporation or organization) (I.R.S. Employer
Identification No.)
One Bowerman Drive,Beaverton, Oregon 97005-6453
(Address of principal executive offices) (Zip Code)
Registrant ’ s telephone number, including area code: (503) 671-6453
Indicate by check mark whether the registrant (1) has filed all reports required to be filed by Section 13 or 15(d) of the Securities Exchange Act of 1934 during the preceding 12 months (or forsuch shorter period that the registrant was required to file such reports), and (2) has been subject to such filing requirements for the past 90 days. Yes ☑ No ☐
Indicate by check mark whether the registrant has submitted electronically and posted on its corporate Web site, if any, every Interactive Data File required to be submitted and posted pursuantto Rule 405 of Regulation S-T (§ 232.405 of this chapter) during the preceding 12 months (or for such shorter period that the registrant was required to submit and post such files). Yes ☑ No ☐
Indicate by check mark whether the registrant is a large accelerated filer, an accelerated filer, a non-accelerated filer, a smaller reporting company or an emerging growth company. See thedefinitions of “large accelerated filer,” “accelerated filer,” “smaller reporting company” and “emerging growth company” in Rule 12b-2 of the Exchange Act.
Large accelerated filer ☑ Accelerated filer ☐ Smaller reporting company ☐
Non-accelerated filer ☐ (Do not check if a smaller reporting company) Emerging growth company ☐
If an emerging growth company, indicate by check mark if the registrant has elected not to use the extended transition period for complying with any new or revised financial accountingstandards provided pursuant to Section 13(a) of the Exchange Act. ☐
Indicate by check mark whether the registrant is a shell company (as defined in Rule 12b-2 of the Exchange Act). Yes ☐ No ☑
Shares of Common Stock outstanding as of October 3, 2017 were:
Class A 329,245,752Class B 1,302,272,700 1,631,518,452

Table of Contents
NIKE, INC.FORM 10-QTable of Contents
PART I - FINANCIAL INFORMATION PageITEM 1. Financial Statements 3 Unaudited Condensed Consolidated Balance Sheets 3 Unaudited Condensed Consolidated Statements of Income 4 Unaudited Condensed Consolidated Statements of Comprehensive Income 5 Unaudited Condensed Consolidated Statements of Cash Flows 6 Notes to the Unaudited Condensed Consolidated Financial Statements 7ITEM 2. Management’s Discussion and Analysis of Financial Condition and Results of Operations 20ITEM 3. Quantitative and Qualitative Disclosures about Market Risk 34ITEM 4. Controls and Procedures 34 PART II - OTHER INFORMATION ITEM 1. Legal Proceedings 36ITEM 1A. Risk Factors 36ITEM 2. Unregistered Sales of Equity Securities and Use of Proceeds 36ITEM 6. Exhibits 37 Signatures 39

Table of Contents
PART I - FINANCIAL INFORMATIONITEM 1. Financial Statements
NIKE, Inc. Unaudited Condensed Consolidated Balance Sheets
August 31, May 31,
(In millions) 2017 2017
ASSETS
Current assets:
Cash and equivalents $ 3,413 $ 3,808
Short-term investments 2,106 2,371
Accounts receivable, net 3,871 3,677
Inventories 5,211 5,055
Prepaid expenses and other current assets 1,591 1,150
Total current assets 16,192 16,061
Property, plant and equipment, net 4,086 3,989
Identifiable intangible assets, net 283 283
Goodwill 139 139
Deferred income taxes and other assets 2,947 2,787
TOTAL ASSETS $ 23,647 $ 23,259
LIABILITIES AND SHAREHOLDERS’ EQUITY
Current liabilities:
Current portion of long-term debt $ 7 $ 6
Notes payable 335 325
Accounts payable 2,116 2,048
Accrued liabilities 3,501 3,011
Income taxes payable 97 84
Total current liabilities 6,056 5,474
Long-term debt 3,472 3,471
Deferred income taxes and other liabilities 2,126 1,907
Commitments and contingencies (Note 12)
Redeemable preferred stock — —
Shareholders’ equity:
Common stock at stated value:
Class A convertible — 329 and 329 shares outstanding — —
Class B — 1,308 and 1,314 shares outstanding 3 3
Capital in excess of stated value 8,817 8,638
Accumulated other comprehensive loss (586) (213)
Retained earnings 3,759 3,979
Total shareholders’ equity 11,993 12,407
TOTAL LIABILITIES AND SHAREHOLDERS’ EQUITY $ 23,647 $ 23,259The accompanying Notes to the Unaudited Condensed Consolidated Financial Statements are an integral part of this statement.
3
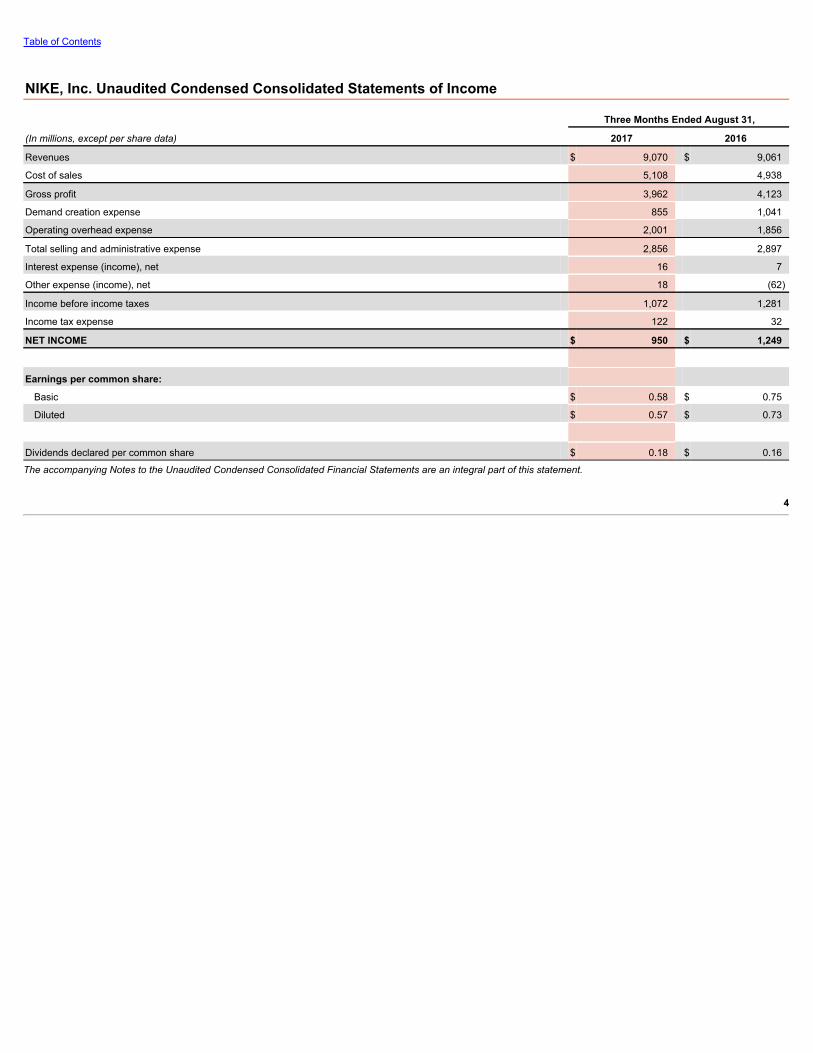
Table of Contents
NIKE, Inc. Unaudited Condensed Consolidated Statements of Income
Three Months Ended August 31,
(In millions, except per share data) 2017 2016
Revenues $ 9,070 $ 9,061
Cost of sales 5,108 4,938
Gross profit 3,962 4,123
Demand creation expense 855 1,041
Operating overhead expense 2,001 1,856
Total selling and administrative expense 2,856 2,897
Interest expense (income), net 16 7
Other expense (income), net 18 (62)
Income before income taxes 1,072 1,281
Income tax expense 122 32
NET INCOME $ 950 $ 1,249
Earnings per common share:
Basic $ 0.58 $ 0.75
Diluted $ 0.57 $ 0.73
Dividends declared per common share $ 0.18 $ 0.16
The accompanying Notes to the Unaudited Condensed Consolidated Financial Statements are an integral part of this statement.
4

Table of Contents
NIKE, Inc. Unaudited Condensed Consolidated Statements of Comprehensive Income
Three Months Ended August 31,
(In millions) 2017 2016
Net income $ 950 $ 1,249
Other comprehensive income (loss), net of tax:
Change in net foreign currency translation adjustment 22 3
Change in net gains (losses) on cash flow hedges (395) (240)
Change in net gains (losses) on other — 4
Total other comprehensive income (loss), net of tax (373) (233)
TOTAL COMPREHENSIVE INCOME $ 577 $ 1,016The accompanying Notes to the Unaudited Condensed Consolidated Financial Statements are an integral part of this statement.
5
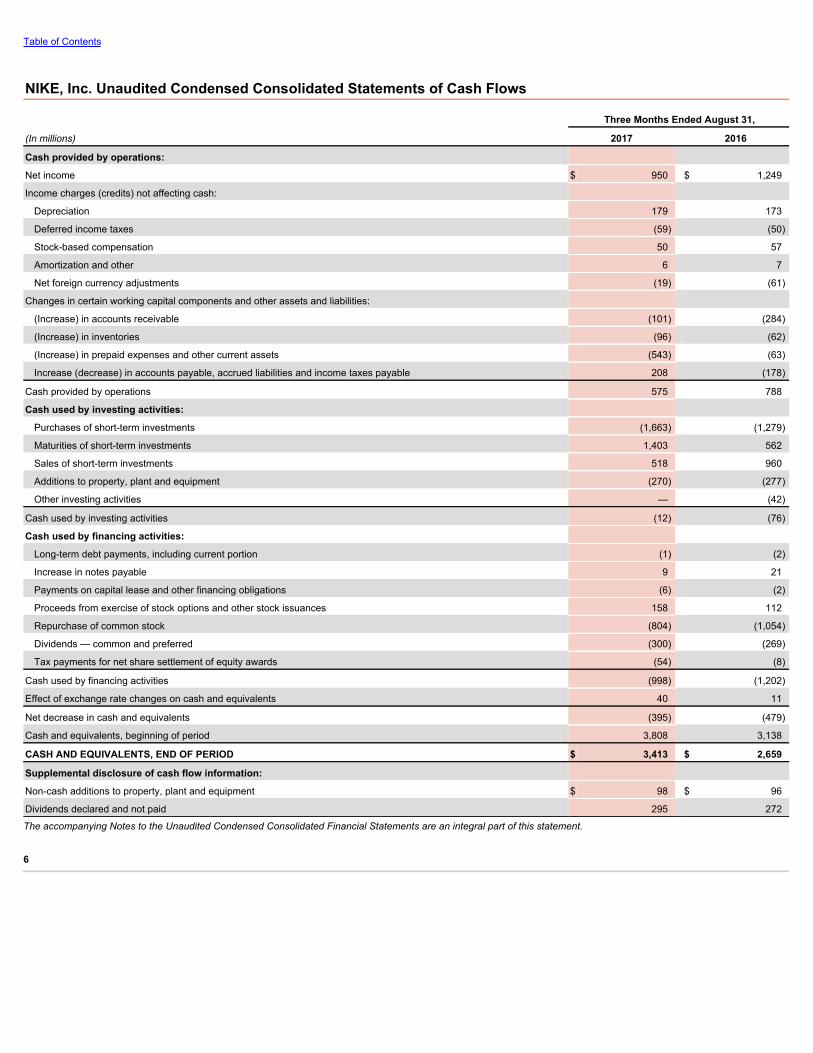
Table of Contents
NIKE, Inc. Unaudited Condensed Consolidated Statements of Cash Flows
Three Months Ended August 31,
(In millions) 2017 2016
Cash provided by operations:
Net income $ 950 $ 1,249
Income charges (credits) not affecting cash:
Depreciation 179 173
Deferred income taxes (59) (50)
Stock-based compensation 50 57
Amortization and other 6 7
Net foreign currency adjustments (19) (61)
Changes in certain working capital components and other assets and liabilities:
(Increase) in accounts receivable (101) (284)
(Increase) in inventories (96) (62)
(Increase) in prepaid expenses and other current assets (543) (63)
Increase (decrease) in accounts payable, accrued liabilities and income taxes payable 208 (178)
Cash provided by operations 575 788
Cash used by investing activities:
Purchases of short-term investments (1,663) (1,279)
Maturities of short-term investments 1,403 562
Sales of short-term investments 518 960
Additions to property, plant and equipment (270) (277)
Other investing activities — (42)
Cash used by investing activities (12) (76)
Cash used by financing activities:
Long-term debt payments, including current portion (1) (2)
Increase in notes payable 9 21
Payments on capital lease and other financing obligations (6) (2)
Proceeds from exercise of stock options and other stock issuances 158 112
Repurchase of common stock (804) (1,054)
Dividends — common and preferred (300) (269)
Tax payments for net share settlement of equity awards (54) (8)
Cash used by financing activities (998) (1,202)
Effect of exchange rate changes on cash and equivalents 40 11
Net decrease in cash and equivalents (395) (479)
Cash and equivalents, beginning of period 3,808 3,138
CASH AND EQUIVALENTS, END OF PERIOD $ 3,413 $ 2,659
Supplemental disclosure of cash flow information:
Non-cash additions to property, plant and equipment $ 98 $ 96
Dividends declared and not paid 295 272
The accompanying Notes to the Unaudited Condensed Consolidated Financial Statements are an integral part of this statement.
6
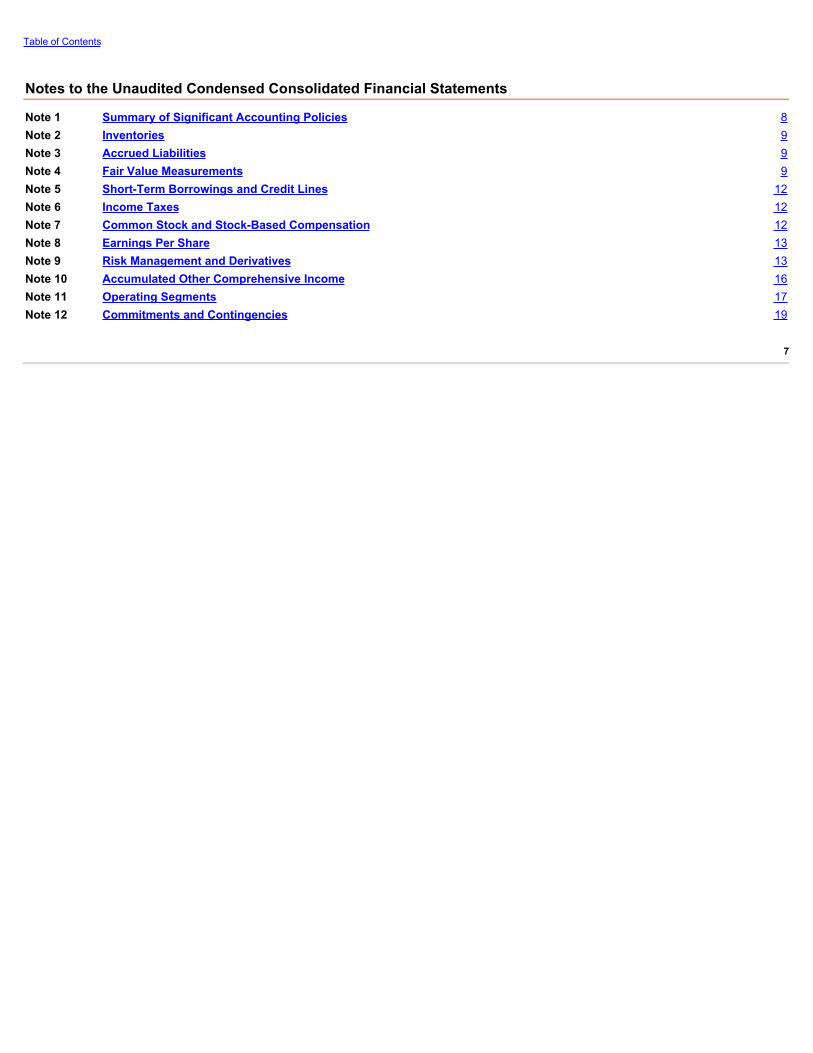
Table of Contents
Notes to the Unaudited Condensed Consolidated Financial Statements
Note 1 Summary of Significant Accounting Policies 8Note 2 Inventories 9Note 3 Accrued Liabilities 9Note 4 Fair Value Measurements 9Note 5 Short-Term Borrowings and Credit Lines 12Note 6 Income Taxes 12Note 7 Common Stock and Stock-Based Compensation 12Note 8 Earnings Per Share 13Note 9 Risk Management and Derivatives 13Note 10 Accumulated Other Comprehensive Income 16Note 11 Operating Segments 17Note 12 Commitments and Contingencies 19
7

Table of Contents
Note 1 — Summary of Significant Accounting Policies
B asis of PresentationThe Unaudited Condensed Consolidated Financial Statements include the accounts of NIKE, Inc. and its subsidiaries (the “Company”) and reflect all normal adjustments whichare, in the opinion of management, necessary for a fair statement of the results of operations for the interim period. The year-end Condensed Consolidated Balance Sheet dataas of May 31, 2017 was derived from audited financial statements, but does not include all disclosures required by accounting principles generally accepted in the UnitedStates of America (“U.S. GAAP”). The interim financial information and notes thereto should be read in conjunction with the Company’s latest Annual Report on Form 10-K.The results of operations for the three months ended August 31, 2017 are not necessarily indicative of results to be expected for the entire year.
ReclassificationsCertain prior year amounts have been reclassified to conform to fiscal 2018 presentation, including reclassified geographic operating segment data to reflect the changes in theCompany’s operating structure, which became effective on June 1, 2017. Refer to Note 11 — Operating Segments for additional information.
Recently Adopted Accounting StandardsIn March 2016, the Financial Accounting Standards Board (FASB) issued Accounting Standards Update (ASU) No. 2016-09, Compensation — Stock Compensation (Topic718): Improvements to Employee Share-Based Payment Accounting , which changes how companies account for certain aspects of share-based payment awards toemployees. The Company adopted the ASU in the first quarter of fiscal 2018. The updated guidance requires excess tax benefits and deficiencies from share-based paymentawards to be recorded in income tax expense in the income statement. Previously, excess tax benefits and deficiencies were recognized in shareholders’ equity on the balancesheet. This change is required to be applied prospectively. During the first quarter of fiscal 2018, the Company recognized $88 million of excess tax benefits related to share-based payment awards in Income tax expense in the Unaudited Condensed Consolidated Statements of Income.
Additionally, ASU 2016-09 modified the classification of certain share-based payment activities within the statement of cash flows, which the Company applied retrospectively.As a result, for the three months ended August 31, 2016, the Company reclassified a cash inflow of $59 million related to excess tax benefits from share-based paymentawards from Cash used by financing activities to Cash provided by operations , and reclassified a cash outflow of $8 million related to tax payments for the net settlement ofshare-based payment awards from Cash provided by operations to Cash used by financing activities within the Unaudited Condensed Consolidated Statement of Cash Flows.
Recently Issued Accounting StandardsIn August 2017, the FASB issued ASU 2017-12, Derivatives and Hedging (Topic 815): Targeted Improvements to Accounting for Hedging Activities , which expands andrefines hedge accounting for both financial and non-financial risk components, aligns the recognition and presentation of the effects of hedging instruments and hedge items inthe financial statements, and includes certain targeted improvements to ease the application of current guidance related to the assessment of hedge effectiveness. The updateto the standard is effective for the Company June 1, 2019, with early adoption permitted in any interim period. The Company is currently evaluating the effect the guidance willhave on the Consolidated Financial Statements.
In October 2016, the FASB issued ASU No. 2016-16, Income Taxes (Topic 740): Intra-Entity Transfers of Assets Other Than Inventory . The updated guidance requirescompanies to recognize the income tax consequences of an intra-entity transfer of an asset other than inventory when the transfer occurs. Income tax effects of intra-entitytransfers of inventory will continue to be deferred until the inventory has been sold to a third party. The Company will adopt the standard on June 1, 2018, using a modifiedretrospective approach with the cumulative effect recognized through retained earnings at the date of adoption. The Company continues to assess the impact this update willhave on its existing accounting policies and the Consolidated Financial Statements and anticipates the updated guidance could have a material impact on the ConsolidatedFinancial Statements at adoption through the recognition of a cumulative-effect adjustment to retained earnings of previously deferred charges.
In February 2016, the FASB issued ASU No. 2016-02, Leases (Topic 842) , which replaces existing lease accounting guidance. The new standard is intended to provideenhanced transparency and comparability by requiring lessees to record right-of-use assets and corresponding lease liabilities on the balance sheet. The new guidance willrequire the Company to continue to classify leases as either operating or financing, with classification affecting the pattern of expense recognition in the income statement. TheCompany will adopt the standard on June 1, 2019. The ASU is required to be applied using a modified retrospective approach at the beginning of the earliest period presented,with optional practical expedients. The Company continues to assess the effect the guidance will have on its existing accounting policies and the Consolidated FinancialStatements and expects there will be an increase in assets and liabilities on the Consolidated Balance Sheets at adoption due to the recording of right-of-use assets andcorresponding lease liabilities, which may be material. Refer to Note 15 — Commitments and Contingencies of the Annual Report on Form 10-K for the fiscal year ended May31, 2017 for information about the Company ’ s lease obligations.
In January 2016, the FASB issued ASU No. 2016-01, Financial Instruments — Overall (Subtopic 825-10): Recognition and Measurement of Financial Assets and FinancialLiabilities . The updated guidance enhances the reporting model for financial instruments, which includes amendments to address aspects of recognition, measurement,presentation and disclosure. The update to the standard is effective for the Company beginning June 1, 2018. The Company does not expect the adoption to have a materialimpact on the Consolidated Financial Statements.
In May 2014, the FASB issued ASU No. 2014-09, Revenue from Contracts with Customers (Topic 606) , that replaces existing revenue recognition guidance. The updatedguidance requires companies to recognize revenue in a way that depicts the transfer of promised goods or services to customers in an amount that reflects the consideration towhich the entity expects to be entitled in exchange for those goods or services. In addition, the new standard requires that reporting companies disclose the nature, amount,timing and uncertainty of revenue and cash flows arising from contracts with customers. The Company will adopt the standard on June 1, 2018 using a modified retrospectiveapproach with the cumulative effect of initially applying the new standard recognized in retained earnings at the date of adoption. The Company is in the process of evaluatingthe new standard against its existing accounting policies, including the timing of revenue recognition, and its contracts with customers, to determine the effect the guidance willhave on the Consolidated Financial Statements.
8
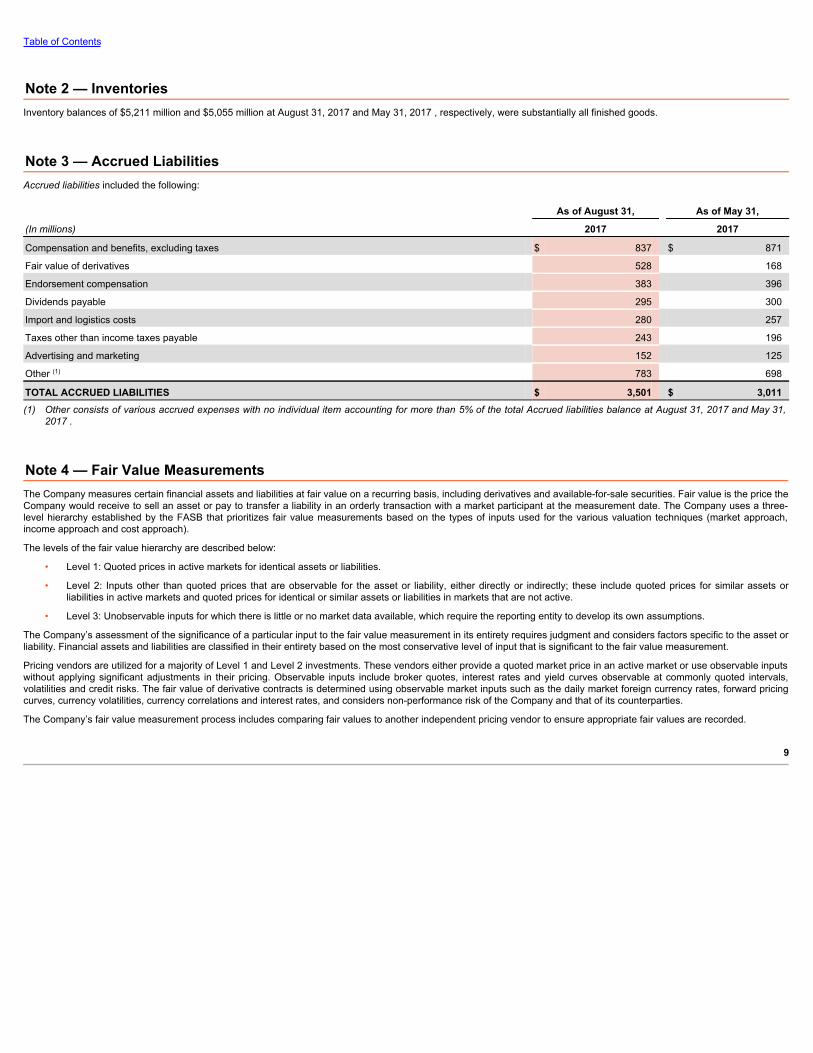
Table of Contents
Note 2 — InventoriesInventory balances of $5,211 million and $5,055 million at August 31, 2017 and May 31, 2017 , respectively, were substantially all finished goods.
Note 3 — Accrued LiabilitiesAccrued liabilities included the following:
As of August 31, As of May 31,
(In millions) 2017 2017
Compensation and benefits, excluding taxes $ 837 $ 871
Fair value of derivatives 528 168
Endorsement compensation 383 396
Dividends payable 295 300
Import and logistics costs 280 257
Taxes other than income taxes payable 243 196
Advertising and marketing 152 125
Other (1) 783 698
TOTAL ACCRUED LIABILITIES $ 3,501 $ 3,011(1) Other consists of various accrued expenses with no individual item accounting for more than 5% of the total Accrued liabilities balance at August 31, 2017 and May 31,
2017 .
Note 4 — Fair Value MeasurementsThe Company measures certain financial assets and liabilities at fair value on a recurring basis, including derivatives and available-for-sale securities. Fair value is the price theCompany would receive to sell an asset or pay to transfer a liability in an orderly transaction with a market participant at the measurement date. The Company uses a three-level hierarchy established by the FASB that prioritizes fair value measurements based on the types of inputs used for the various valuation techniques (market approach,income approach and cost approach).
The levels of the fair value hierarchy are described below:
• Level 1: Quoted prices in active markets for identical assets or liabilities.
• Level 2: Inputs other than quoted prices that are observable for the asset or liability, either directly or indirectly; these include quoted prices for similar assets orliabilities in active markets and quoted prices for identical or similar assets or liabilities in markets that are not active.
• Level 3: Unobservable inputs for which there is little or no market data available, which require the reporting entity to develop its own assumptions.
The Company’s assessment of the significance of a particular input to the fair value measurement in its entirety requires judgment and considers factors specific to the asset orliability. Financial assets and liabilities are classified in their entirety based on the most conservative level of input that is significant to the fair value measurement.
Pricing vendors are utilized for a majority of Level 1 and Level 2 investments. These vendors either provide a quoted market price in an active market or use observable inputswithout applying significant adjustments in their pricing. Observable inputs include broker quotes, interest rates and yield curves observable at commonly quoted intervals,volatilities and credit risks. The fair value of derivative contracts is determined using observable market inputs such as the daily market foreign currency rates, forward pricingcurves, currency volatilities, currency correlations and interest rates, and considers non-performance risk of the Company and that of its counterparties.
The Company’s fair value measurement process includes comparing fair values to another independent pricing vendor to ensure appropriate fair values are recorded.
9

Table of Contents
The following tables present information about the Company’s financial assets measured at fair value on a recurring basis as of August 31, 2017 and May 31, 2017 , andindicate the level in the fair value hierarchy in which the Company classifies the fair value measurement.
As of August 31, 2017
(In millions) Assets at Fair Value Cash and
Equivalents Short-term
Investments Other Long-term
Assets
Cash $ 624 $ 624 $ — $ —
Level 1:
U.S. Treasury securities 1,205 200 1,005 —
Level 2:
Time deposits 901 862 39 —
U.S. Agency securities 354 50 304 —
Commercial paper and bonds 797 39 758 —
Money market funds 1,638 1,638 — —
Total Level 2: 3,690 2,589 1,101 —
Level 3:
Non-marketable preferred stock 10 — — 10
TOTAL $ 5,529 $ 3,413 $ 2,106 $ 10
As of May 31, 2017
(In millions) Assets at Fair Value Cash and
Equivalents Short-term
Investments Other Long-term
Assets
Cash $ 505 $ 505 $ — $ —
Level 1:
U.S. Treasury securities 1,545 159 1,386 —
Level 2:
Time deposits 813 769 44 —
U.S. Agency securities 522 150 372 —
Commercial paper and bonds 820 251 569 —
Money market funds 1,974 1,974 — —
Total Level 2: 4,129 3,144 985 —
Level 3:
Non-marketable preferred stock 10 — — 10
TOTAL $ 6,189 $ 3,808 $ 2,371 $ 10
The Company elects to record the gross assets and liabilities of its derivative financial instruments on the Unaudited Condensed Consolidated Balance Sheets. TheCompany’s derivative financial instruments are subject to master netting arrangements that allow for the offset of assets and liabilities in the event of default or earlytermination of the contract. Any amounts of cash collateral received related to these instruments associated with the Company ’ s credit-related contingent features arerecorded in Cash and equivalents and Accrued liabilities , the latter of which would further offset against the Company’s derivative asset balance. Any amounts of cashcollateral posted related to these instruments associated with the Company ’ s credit-related contingent features are recorded in Prepaid expenses and other current assets ,which would further offset against the Company’s derivative liability balance. Cash collateral received or posted related to the Company ’ s credit-related contingent features ispresented in the Cash provided by operations component of the Unaudited Condensed Consolidated Statements of Cash Flows. Any amounts of non-cash collateral received,such as securities, are not recorded on the Unaudited Condensed Consolidated Balance Sheets pursuant to U.S. GAAP. For further information related to credit risk, refer toNote 9 — Risk Management and Derivatives .
10
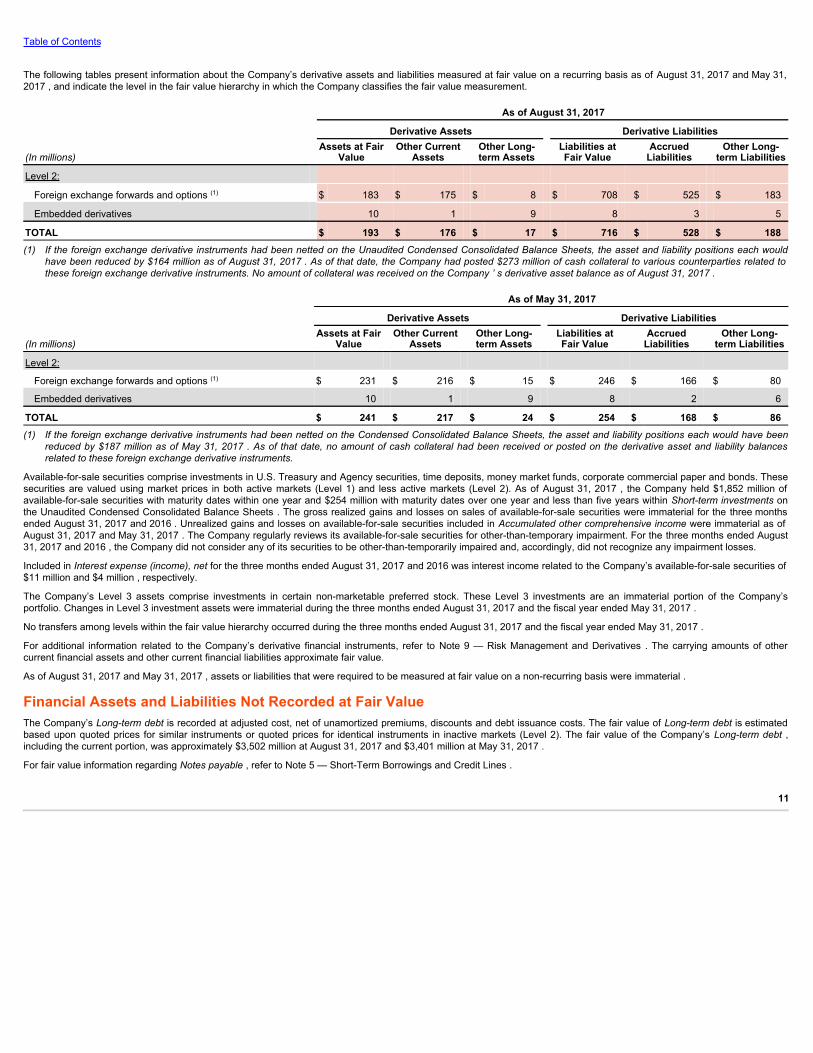
Table of Contents
The following tables present information about the Company’s derivative assets and liabilities measured at fair value on a recurring basis as of August 31, 2017 and May 31,2017 , and indicate the level in the fair value hierarchy in which the Company classifies the fair value measurement.
As of August 31, 2017 Derivative Assets Derivative Liabilities
(In millions) Assets at Fair
Value Other Current
Assets Other Long-term Assets
Liabilities atFair Value
AccruedLiabilities
Other Long-term Liabilities
Level 2:
Foreign exchange forwards and options (1) $ 183 $ 175 $ 8 $ 708 $ 525 $ 183
Embedded derivatives 10 1 9 8 3 5
TOTAL $ 193 $ 176 $ 17 $ 716 $ 528 $ 188(1) If the foreign exchange derivative instruments had been netted on the Unaudited Condensed Consolidated Balance Sheets, the asset and liability positions each would
have been reduced by $164 million as of August 31, 2017 . As of that date, the Company had posted $273 million of cash collateral to various counterparties related tothese foreign exchange derivative instruments. No amount of collateral was received on the Company ’ s derivative asset balance as of August 31, 2017 .
As of May 31, 2017 Derivative Assets Derivative Liabilities
(In millions) Assets at Fair
Value Other Current
Assets Other Long-term Assets
Liabilities atFair Value
AccruedLiabilities
Other Long-term Liabilities
Level 2:
Foreign exchange forwards and options (1) $ 231 $ 216 $ 15 $ 246 $ 166 $ 80
Embedded derivatives 10 1 9 8 2 6
TOTAL $ 241 $ 217 $ 24 $ 254 $ 168 $ 86(1) If the foreign exchange derivative instruments had been netted on the Condensed Consolidated Balance Sheets, the asset and liability positions each would have been
reduced by $187 million as of May 31, 2017 . As of that date, no amount of cash collateral had been received or posted on the derivative asset and liability balancesrelated to these foreign exchange derivative instruments.
Available-for-sale securities comprise investments in U.S. Treasury and Agency securities, time deposits, money market funds, corporate commercial paper and bonds. Thesesecurities are valued using market prices in both active markets (Level 1) and less active markets (Level 2). As of August 31, 2017 , the Company held $1,852 million ofavailable-for-sale securities with maturity dates within one year and $254 million with maturity dates over one year and less than five years within Short-term investments onthe Unaudited Condensed Consolidated Balance Sheets . The gross realized gains and losses on sales of available-for-sale securities were immaterial for the three monthsended August 31, 2017 and 2016 . Unrealized gains and losses on available-for-sale securities included in Accumulated other comprehensive income were immaterial as ofAugust 31, 2017 and May 31, 2017 . The Company regularly reviews its available-for-sale securities for other-than-temporary impairment. For the three months ended August31, 2017 and 2016 , the Company did not consider any of its securities to be other-than-temporarily impaired and, accordingly, did not recognize any impairment losses.
Included in Interest expense (income), net for the three months ended August 31, 2017 and 2016 was interest income related to the Company’s available-for-sale securities of$11 million and $4 million , respectively.
The Company’s Level 3 assets comprise investments in certain non-marketable preferred stock. These Level 3 investments are an immaterial portion of the Company’sportfolio. Changes in Level 3 investment assets were immaterial during the three months ended August 31, 2017 and the fiscal year ended May 31, 2017 .
No transfers among levels within the fair value hierarchy occurred during the three months ended August 31, 2017 and the fiscal year ended May 31, 2017 .
For additional information related to the Company’s derivative financial instruments, refer to Note 9 — Risk Management and Derivatives . The carrying amounts of othercurrent financial assets and other current financial liabilities approximate fair value.
As of August 31, 2017 and May 31, 2017 , assets or liabilities that were required to be measured at fair value on a non-recurring basis were immaterial .
Financial Assets and Liabilities Not Recorded at Fair ValueThe Company’s Long-term debt is recorded at adjusted cost, net of unamortized premiums, discounts and debt issuance costs. The fair value of Long-term debt is estimatedbased upon quoted prices for similar instruments or quoted prices for identical instruments in inactive markets (Level 2). The fair value of the Company’s Long-term debt ,including the current portion, was approximately $3,502 million at August 31, 2017 and $3,401 million at May 31, 2017 .
For fair value information regarding Notes payable , refer to Note 5 — Short-Term Borrowings and Credit Lines .
11
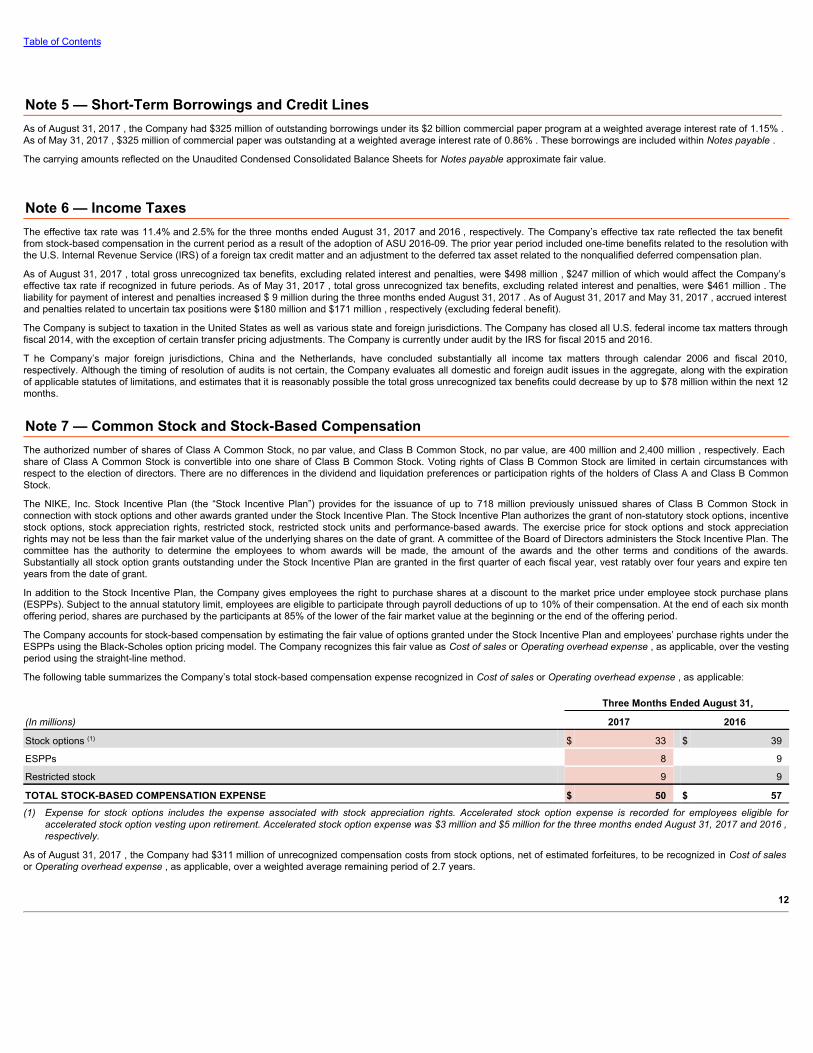
Table of Contents
Note 5 — Short-Term Borrowings and Credit LinesAs of August 31, 2017 , the Company had $325 million of outstanding borrowings under its $2 billion commercial paper program at a weighted average interest rate of 1.15% .As of May 31, 2017 , $325 million of commercial paper was outstanding at a weighted average interest rate of 0.86% . These borrowings are included within Notes payable .
The carrying amounts reflected on the Unaudited Condensed Consolidated Balance Sheets for Notes payable approximate fair value.
Note 6 — Income TaxesThe effective tax rate was 11.4% and 2.5% for the three months ended August 31, 2017 and 2016 , respectively. The Company’s effective tax rate reflected the tax benefitfrom stock-based compensation in the current period as a result of the adoption of ASU 2016-09. The prior year period included one-time benefits related to the resolution withthe U.S. Internal Revenue Service (IRS) of a foreign tax credit matter and an adjustment to the deferred tax asset related to the nonqualified deferred compensation plan.
As of August 31, 2017 , total gross unrecognized tax benefits, excluding related interest and penalties, were $498 million , $247 million of which would affect the Company’seffective tax rate if recognized in future periods. As of May 31, 2017 , total gross unrecognized tax benefits, excluding related interest and penalties, were $461 million . Theliability for payment of interest and penalties increased $ 9 million during the three months ended August 31, 2017 . As of August 31, 2017 and May 31, 2017 , accrued interestand penalties related to uncertain tax positions were $180 million and $171 million , respectively (excluding federal benefit).
The Company is subject to taxation in the United States as well as various state and foreign jurisdictions. The Company has closed all U.S. federal income tax matters throughfiscal 2014, with the exception of certain transfer pricing adjustments. The Company is currently under audit by the IRS for fiscal 2015 and 2016.
T he Company’s major foreign jurisdictions, China and the Netherlands, have concluded substantially all income tax matters through calendar 2006 and fiscal 2010,respectively. Although the timing of resolution of audits is not certain, the Company evaluates all domestic and foreign audit issues in the aggregate, along with the expirationof applicable statutes of limitations, and estimates that it is reasonably possible the total gross unrecognized tax benefits could decrease by up to $78 million within the next 12months.
Note 7 — Common Stock and Stock-Based CompensationThe authorized number of shares of Class A Common Stock, no par value, and Class B Common Stock, no par value, are 400 million and 2,400 million , respectively. Eachshare of Class A Common Stock is convertible into one share of Class B Common Stock. Voting rights of Class B Common Stock are limited in certain circumstances withrespect to the election of directors. There are no differences in the dividend and liquidation preferences or participation rights of the holders of Class A and Class B CommonStock.
The NIKE, Inc. Stock Incentive Plan (the “Stock Incentive Plan”) provides for the issuance of up to 718 million previously unissued shares of Class B Common Stock inconnection with stock options and other awards granted under the Stock Incentive Plan. The Stock Incentive Plan authorizes the grant of non-statutory stock options, incentivestock options, stock appreciation rights, restricted stock, restricted stock units and performance-based awards. The exercise price for stock options and stock appreciationrights may not be less than the fair market value of the underlying shares on the date of grant. A committee of the Board of Directors administers the Stock Incentive Plan. Thecommittee has the authority to determine the employees to whom awards will be made, the amount of the awards and the other terms and conditions of the awards.Substantially all stock option grants outstanding under the Stock Incentive Plan are granted in the first quarter of each fiscal year, vest ratably over four years and expire tenyears from the date of grant.
In addition to the Stock Incentive Plan, the Company gives employees the right to purchase shares at a discount to the market price under employee stock purchase plans(ESPPs). Subject to the annual statutory limit, employees are eligible to participate through payroll deductions of up to 10% of their compensation. At the end of each six monthoffering period, shares are purchased by the participants at 85% of the lower of the fair market value at the beginning or the end of the offering period.
The Company accounts for stock-based compensation by estimating the fair value of options granted under the Stock Incentive Plan and employees’ purchase rights under theESPPs using the Black-Scholes option pricing model. The Company recognizes this fair value as Cost of sales or Operating overhead expense , as applicable, over the vestingperiod using the straight-line method.
The following table summarizes the Company’s total stock-based compensation expense recognized in Cost of sales or Operating overhead expense , as applicable:
Three Months Ended August 31,
(In millions) 2017 2016
Stock options (1) $ 33 $ 39
ESPPs 8 9
Restricted stock 9 9
TOTAL STOCK-BASED COMPENSATION EXPENSE $ 50 $ 57(1) Expense for stock options includes the expense associated with stock appreciation rights. Accelerated stock option expense is recorded for employees eligible for
accelerated stock option vesting upon retirement. Accelerated stock option expense was $3 million and $5 million for the three months ended August 31, 2017 and 2016 ,respectively.
As of August 31, 2017 , the Company had $311 million of unrecognized compensation costs from stock options, net of estimated forfeitures, to be recognized in Cost of salesor Operating overhead expense , as applicable, over a weighted average remaining period of 2.7 years.
12
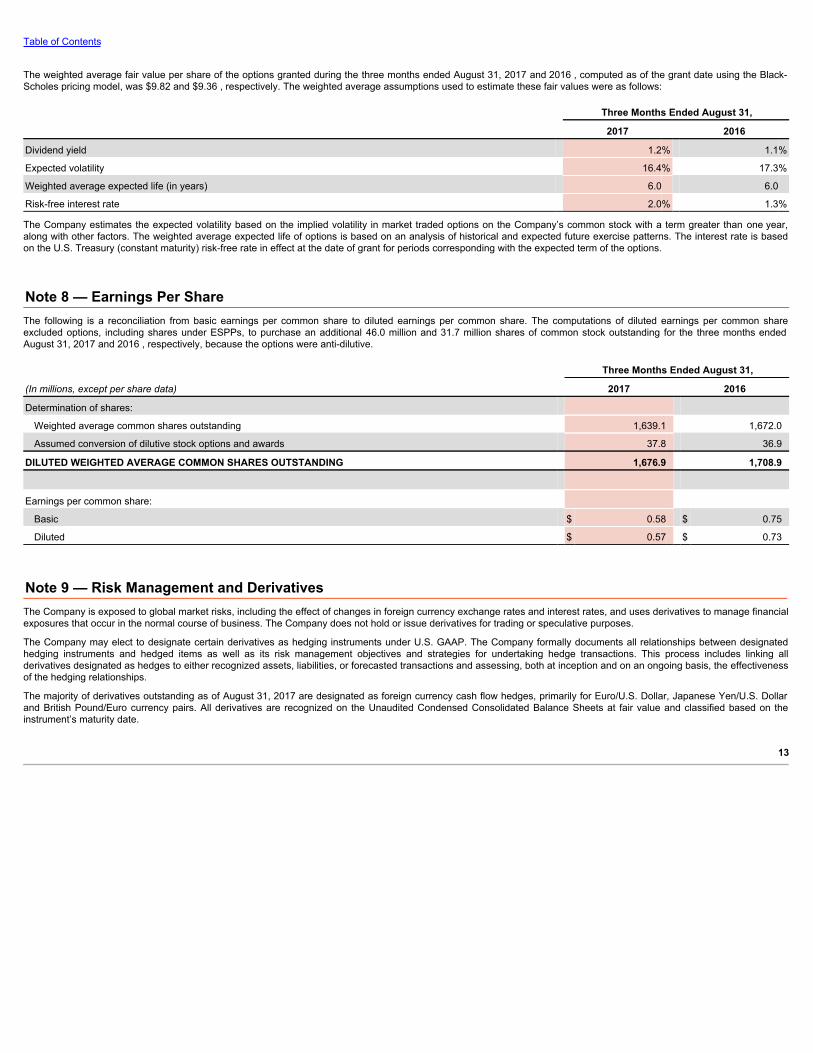
Table of Contents
The weighted average fair value per share of the options granted during the three months ended August 31, 2017 and 2016 , computed as of the grant date using the Black-Scholes pricing model, was $9.82 and $9.36 , respectively. The weighted average assumptions used to estimate these fair values were as follows:
Three Months Ended August 31, 2017 2016
Dividend yield 1.2% 1.1%
Expected volatility 16.4% 17.3%
Weighted average expected life (in years) 6.0 6.0
Risk-free interest rate 2.0% 1.3%
The Company estimates the expected volatility based on the implied volatility in market traded options on the Company’s common stock with a term greater than one year,along with other factors. The weighted average expected life of options is based on an analysis of historical and expected future exercise patterns. The interest rate is basedon the U.S. Treasury (constant maturity) risk-free rate in effect at the date of grant for periods corresponding with the expected term of the options.
Note 8 — Earnings Per ShareThe following is a reconciliation from basic earnings per common share to diluted earnings per common share. The computations of diluted earnings per common shareexcluded options, including shares under ESPPs, to purchase an additional 46.0 million and 31.7 million shares of common stock outstanding for the three months endedAugust 31, 2017 and 2016 , respectively, because the options were anti-dilutive.
Three Months Ended August 31,
(In millions, except per share data) 2017 2016
Determination of shares:
Weighted average common shares outstanding 1,639.1 1,672.0
Assumed conversion of dilutive stock options and awards 37.8 36.9
DILUTED WEIGHTED AVERAGE COMMON SHARES OUTSTANDING 1,676.9 1,708.9
Earnings per common share:
Basic $ 0.58 $ 0.75
Diluted $ 0.57 $ 0.73
Note 9 — Risk Management and DerivativesThe Company is exposed to global market risks, including the effect of changes in foreign currency exchange rates and interest rates, and uses derivatives to manage financialexposures that occur in the normal course of business. The Company does not hold or issue derivatives for trading or speculative purposes.
The Company may elect to designate certain derivatives as hedging instruments under U.S. GAAP. The Company formally documents all relationships between designatedhedging instruments and hedged items as well as its risk management objectives and strategies for undertaking hedge transactions. This process includes linking allderivatives designated as hedges to either recognized assets, liabilities, or forecasted transactions and assessing, both at inception and on an ongoing basis, the effectivenessof the hedging relationships.
The majority of derivatives outstanding as of August 31, 2017 are designated as foreign currency cash flow hedges, primarily for Euro/U.S. Dollar, Japanese Yen/U.S. Dollarand British Pound/Euro currency pairs. All derivatives are recognized on the Unaudited Condensed Consolidated Balance Sheets at fair value and classified based on theinstrument’s maturity date.
13
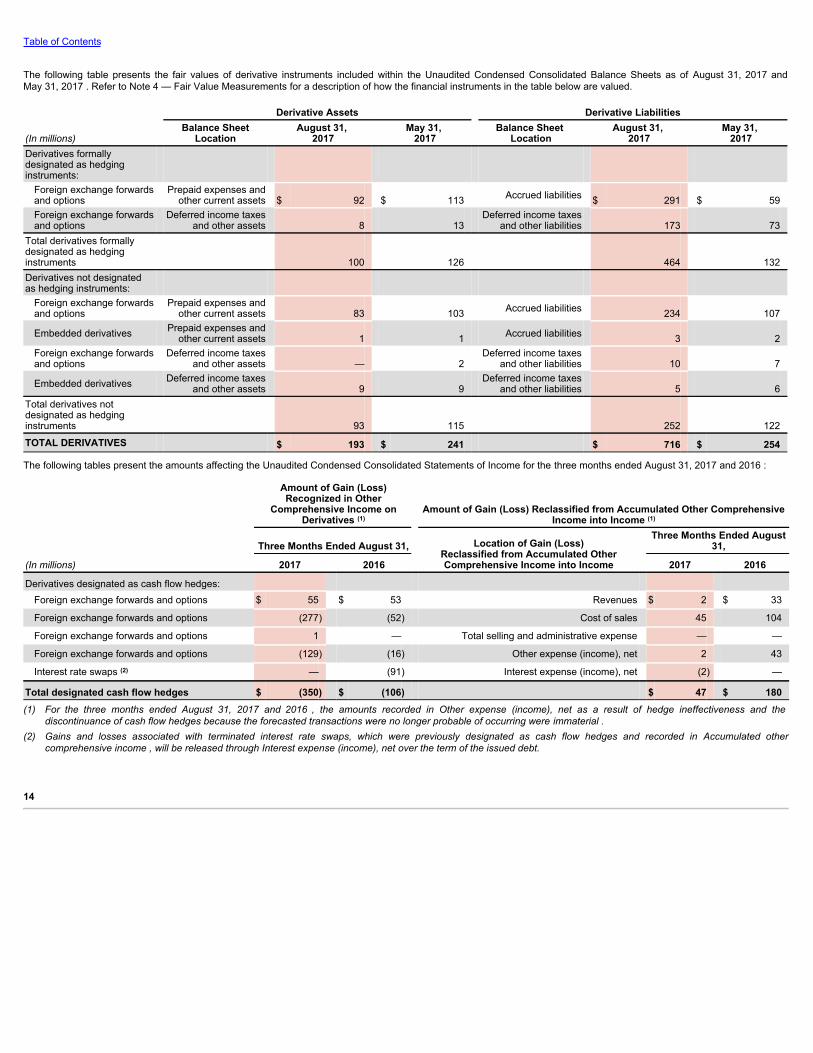
Table of Contents
The following table presents the fair values of derivative instruments included within the Unaudited Condensed Consolidated Balance Sheets as of August 31, 2017 andMay 31, 2017 . Refer to Note 4 — Fair Value Measurements for a description of how the financial instruments in the table below are valued.
Derivative Assets Derivative Liabilities
(In millions) Balance Sheet
Location August 31,
2017 May 31,
2017 Balance Sheet
Location August 31,
2017 May 31,
2017Derivatives formallydesignated as hedginginstruments:
Foreign exchange forwardsand options
Prepaid expenses andother current assets $ 92 $ 113 Accrued liabilities $ 291 $ 59
Foreign exchange forwardsand options
Deferred income taxesand other assets 8 13
Deferred income taxesand other liabilities 173 73
Total derivatives formallydesignated as hedginginstruments
100 126
464 132
Derivatives not designatedas hedging instruments: Foreign exchange forwardsand options
Prepaid expenses andother current assets 83 103 Accrued liabilities 234 107
Embedded derivatives Prepaid expenses andother current assets 1 1 Accrued liabilities 3 2
Foreign exchange forwardsand options
Deferred income taxesand other assets — 2
Deferred income taxesand other liabilities 10 7
Embedded derivatives Deferred income taxes
and other assets 9 9 Deferred income taxes
and other liabilities 5 6Total derivatives notdesignated as hedginginstruments
93 115
252 122
TOTAL DERIVATIVES $ 193 $ 241 $ 716 $ 254
The following tables present the amounts affecting the Unaudited Condensed Consolidated Statements of Income for the three months ended August 31, 2017 and 2016 :
(In millions)
Amount of Gain (Loss)Recognized in Other
Comprehensive Income onDerivatives (1)
Amount of Gain (Loss) Reclassified from Accumulated Other ComprehensiveIncome into Income (1)
Three Months Ended August 31, Location of Gain (Loss)Reclassified from Accumulated OtherComprehensive Income into Income
Three Months Ended August
31,
2017 2016 2017 2016
Derivatives designated as cash flow hedges: Foreign exchange forwards and options $ 55 $ 53 Revenues $ 2 $ 33
Foreign exchange forwards and options (277) (52) Cost of sales 45 104
Foreign exchange forwards and options 1 — Total selling and administrative expense — —
Foreign exchange forwards and options (129) (16) Other expense (income), net 2 43
Interest rate swaps (2) — (91) Interest expense (income), net (2) —
Total designated cash flow hedges $ (350) $ (106) $ 47 $ 180(1) For the three months ended August 31, 2017 and 2016 , the amounts recorded in Other expense (income), net as a result of hedge ineffectiveness and the
discontinuance of cash flow hedges because the forecasted transactions were no longer probable of occurring were immaterial .(2) Gains and losses associated with terminated interest rate swaps, which were previously designated as cash flow hedges and recorded in Accumulated other
comprehensive income , will be released through Interest expense (income), net over the term of the issued debt.
14
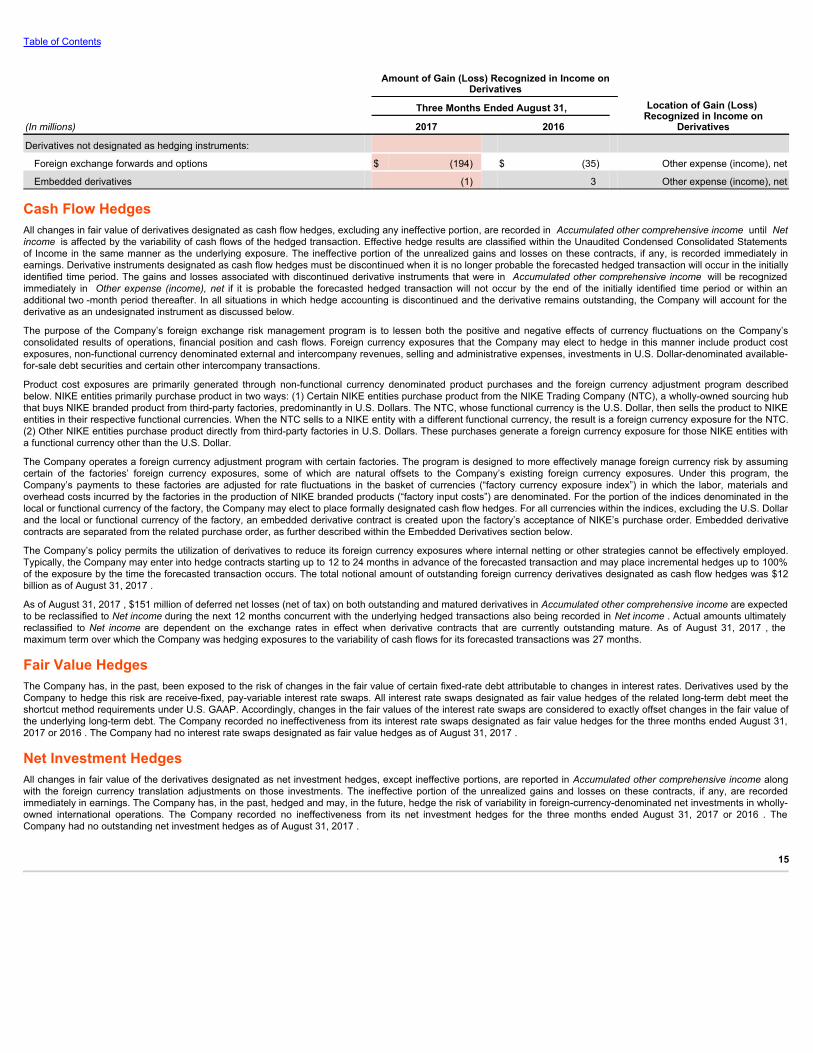
Table of Contents
Amount of Gain (Loss) Recognized in Income on
DerivativesLocation of Gain (Loss)
Recognized in Income onDerivatives
Three Months Ended August 31,
(In millions) 2017 2016
Derivatives not designated as hedging instruments:
Foreign exchange forwards and options $ (194) $ (35) Other expense (income), net
Embedded derivatives (1) 3 Other expense (income), net
Cash Flow HedgesAll changes in fair value of derivatives designated as cash flow hedges, excluding any ineffective portion, are recorded in Accumulated other comprehensive income until Netincome is affected by the variability of cash flows of the hedged transaction. Effective hedge results are classified within the Unaudited Condensed Consolidated Statementsof Income in the same manner as the underlying exposure. The ineffective portion of the unrealized gains and losses on these contracts, if any, is recorded immediately inearnings. Derivative instruments designated as cash flow hedges must be discontinued when it is no longer probable the forecasted hedged transaction will occur in the initiallyidentified time period. The gains and losses associated with discontinued derivative instruments that were in Accumulated other comprehensive income will be recognizedimmediately in Other expense (income), net if it is probable the forecasted hedged transaction will not occur by the end of the initially identified time period or within anadditional two -month period thereafter. In all situations in which hedge accounting is discontinued and the derivative remains outstanding, the Company will account for thederivative as an undesignated instrument as discussed below.
The purpose of the Company’s foreign exchange risk management program is to lessen both the positive and negative effects of currency fluctuations on the Company’sconsolidated results of operations, financial position and cash flows. Foreign currency exposures that the Company may elect to hedge in this manner include product costexposures, non-functional currency denominated external and intercompany revenues, selling and administrative expenses, investments in U.S. Dollar-denominated available-for-sale debt securities and certain other intercompany transactions.
Product cost exposures are primarily generated through non-functional currency denominated product purchases and the foreign currency adjustment program describedbelow. NIKE entities primarily purchase product in two ways: (1) Certain NIKE entities purchase product from the NIKE Trading Company (NTC), a wholly-owned sourcing hubthat buys NIKE branded product from third-party factories, predominantly in U.S. Dollars. The NTC, whose functional currency is the U.S. Dollar, then sells the product to NIKEentities in their respective functional currencies. When the NTC sells to a NIKE entity with a different functional currency, the result is a foreign currency exposure for the NTC.(2) Other NIKE entities purchase product directly from third-party factories in U.S. Dollars. These purchases generate a foreign currency exposure for those NIKE entities witha functional currency other than the U.S. Dollar.
The Company operates a foreign currency adjustment program with certain factories. The program is designed to more effectively manage foreign currency risk by assumingcertain of the factories’ foreign currency exposures, some of which are natural offsets to the Company’s existing foreign currency exposures. Under this program, theCompany’s payments to these factories are adjusted for rate fluctuations in the basket of currencies (“factory currency exposure index”) in which the labor, materials andoverhead costs incurred by the factories in the production of NIKE branded products (“factory input costs”) are denominated. For the portion of the indices denominated in thelocal or functional currency of the factory, the Company may elect to place formally designated cash flow hedges. For all currencies within the indices, excluding the U.S. Dollarand the local or functional currency of the factory, an embedded derivative contract is created upon the factory’s acceptance of NIKE’s purchase order. Embedded derivativecontracts are separated from the related purchase order, as further described within the Embedded Derivatives section below.
The Company’s policy permits the utilization of derivatives to reduce its foreign currency exposures where internal netting or other strategies cannot be effectively employed.Typically, the Company may enter into hedge contracts starting up to 12 to 24 months in advance of the forecasted transaction and may place incremental hedges up to 100%of the exposure by the time the forecasted transaction occurs. The total notional amount of outstanding foreign currency derivatives designated as cash flow hedges was $12billion as of August 31, 2017 .
As of August 31, 2017 , $151 million of deferred net losses (net of tax) on both outstanding and matured derivatives in Accumulated other comprehensive income are expectedto be reclassified to Net income during the next 12 months concurrent with the underlying hedged transactions also being recorded in Net income . Actual amounts ultimatelyreclassified to Net income are dependent on the exchange rates in effect when derivative contracts that are currently outstanding mature. As of August 31, 2017 , themaximum term over which the Company was hedging exposures to the variability of cash flows for its forecasted transactions was 27 months.
Fair Value HedgesThe Company has, in the past, been exposed to the risk of changes in the fair value of certain fixed-rate debt attributable to changes in interest rates. Derivatives used by theCompany to hedge this risk are receive-fixed, pay-variable interest rate swaps. All interest rate swaps designated as fair value hedges of the related long-term debt meet theshortcut method requirements under U.S. GAAP. Accordingly, changes in the fair values of the interest rate swaps are considered to exactly offset changes in the fair value ofthe underlying long-term debt. The Company recorded no ineffectiveness from its interest rate swaps designated as fair value hedges for the three months ended August 31,2017 or 2016 . The Company had no interest rate swaps designated as fair value hedges as of August 31, 2017 .
Net Investment HedgesAll changes in fair value of the derivatives designated as net investment hedges, except ineffective portions, are reported in Accumulated other comprehensive income alongwith the foreign currency translation adjustments on those investments. The ineffective portion of the unrealized gains and losses on these contracts, if any, are recordedimmediately in earnings. The Company has, in the past, hedged and may, in the future, hedge the risk of variability in foreign-currency-denominated net investments in wholly-owned international operations. The Company recorded no ineffectiveness from its net investment hedges for the three months ended August 31, 2017 or 2016 . TheCompany had no outstanding net investment hedges as of August 31, 2017 .
15
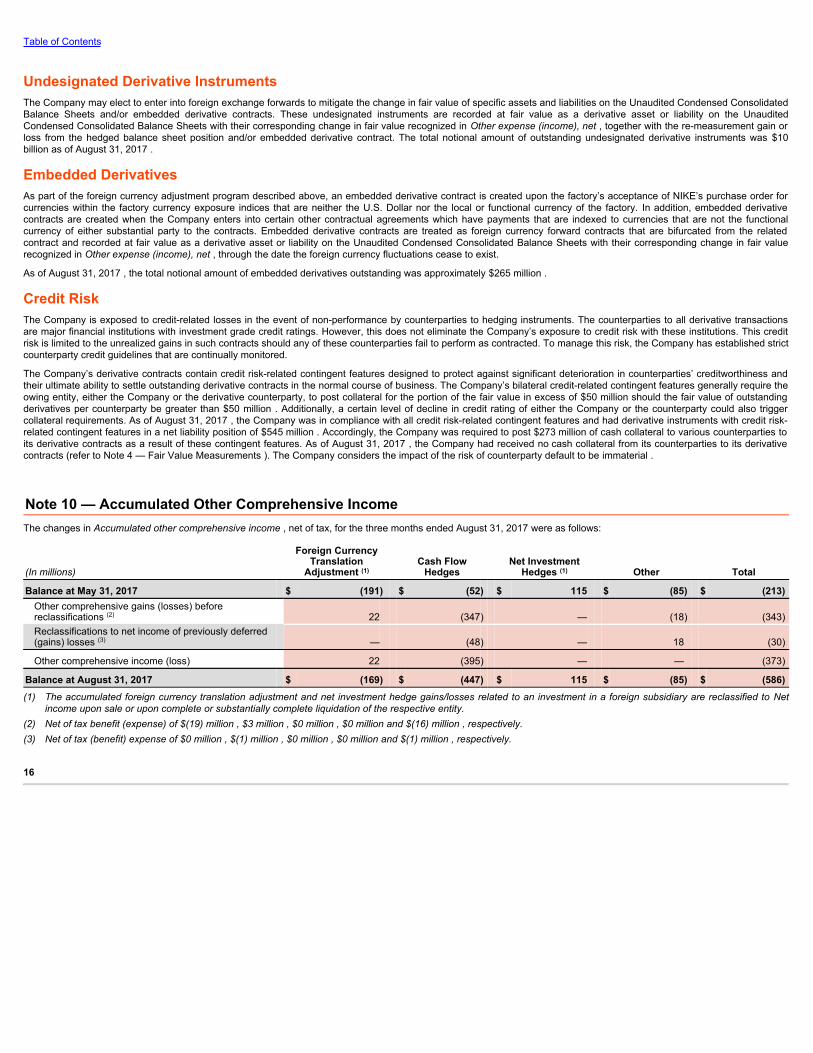
Table of Contents
Undesignated Derivative InstrumentsThe Company may elect to enter into foreign exchange forwards to mitigate the change in fair value of specific assets and liabilities on the Unaudited Condensed ConsolidatedBalance Sheets and/or embedded derivative contracts. These undesignated instruments are recorded at fair value as a derivative asset or liability on the UnauditedCondensed Consolidated Balance Sheets with their corresponding change in fair value recognized in Other expense (income), net , together with the re-measurement gain orloss from the hedged balance sheet position and/or embedded derivative contract. The total notional amount of outstanding undesignated derivative instruments was $10billion as of August 31, 2017 .
Embedded DerivativesAs part of the foreign currency adjustment program described above, an embedded derivative contract is created upon the factory’s acceptance of NIKE’s purchase order forcurrencies within the factory currency exposure indices that are neither the U.S. Dollar nor the local or functional currency of the factory. In addition, embedded derivativecontracts are created when the Company enters into certain other contractual agreements which have payments that are indexed to currencies that are not the functionalcurrency of either substantial party to the contracts. Embedded derivative contracts are treated as foreign currency forward contracts that are bifurcated from the relatedcontract and recorded at fair value as a derivative asset or liability on the Unaudited Condensed Consolidated Balance Sheets with their corresponding change in fair valuerecognized in Other expense (income), net , through the date the foreign currency fluctuations cease to exist.
As of August 31, 2017 , the total notional amount of embedded derivatives outstanding was approximately $265 million .
Credit RiskThe Company is exposed to credit-related losses in the event of non-performance by counterparties to hedging instruments. The counterparties to all derivative transactionsare major financial institutions with investment grade credit ratings. However, this does not eliminate the Company’s exposure to credit risk with these institutions. This creditrisk is limited to the unrealized gains in such contracts should any of these counterparties fail to perform as contracted. To manage this risk, the Company has established strictcounterparty credit guidelines that are continually monitored.
The Company’s derivative contracts contain credit risk-related contingent features designed to protect against significant deterioration in counterparties’ creditworthiness andtheir ultimate ability to settle outstanding derivative contracts in the normal course of business. The Company’s bilateral credit-related contingent features generally require theowing entity, either the Company or the derivative counterparty, to post collateral for the portion of the fair value in excess of $50 million should the fair value of outstandingderivatives per counterparty be greater than $50 million . Additionally, a certain level of decline in credit rating of either the Company or the counterparty could also triggercollateral requirements. As of August 31, 2017 , the Company was in compliance with all credit risk-related contingent features and had derivative instruments with credit risk-related contingent features in a net liability position of $545 million . Accordingly, the Company was required to post $273 million of cash collateral to various counterparties toits derivative contracts as a result of these contingent features. As of August 31, 2017 , the Company had received no cash collateral from its counterparties to its derivativecontracts (refer to Note 4 — Fair Value Measurements ). The Company considers the impact of the risk of counterparty default to be immaterial .
Note 10 — Accumulated Other Comprehensive IncomeThe changes in Accumulated other comprehensive income , net of tax, for the three months ended August 31, 2017 were as follows:
(In millions)
Foreign CurrencyTranslation
Adjustment (1) Cash Flow
Hedges Net Investment
Hedges (1) Other Total
Balance at May 31, 2017 $ (191) $ (52) $ 115 $ (85) $ (213)Other comprehensive gains (losses) beforereclassifications (2) 22 (347) — (18) (343)Reclassifications to net income of previously deferred(gains) losses (3) — (48) — 18 (30)
Other comprehensive income (loss) 22 (395) — — (373)
Balance at August 31, 2017 $ (169) $ (447) $ 115 $ (85) $ (586)(1) The accumulated foreign currency translation adjustment and net investment hedge gains/losses related to an investment in a foreign subsidiary are reclassified to Net
income upon sale or upon complete or substantially complete liquidation of the respective entity.(2) Net of tax benefit (expense) of $(19) million , $3 million , $0 million , $0 million and $(16) million , respectively.(3) Net of tax (benefit) expense of $0 million , $(1) million , $0 million , $0 million and $(1) million , respectively.
16

Table of Contents
The changes in Accumulated other comprehensive income , net of tax, for the three months ended August 31, 2016 were as follows:
(In millions)
Foreign CurrencyTranslation
Adjustment (1) Cash Flow Hedges Net Investment
Hedges (1) Other Total
Balance at May 31, 2016 $ (207) $ 463 $ 115 $ (53) $ 318Other comprehensive gains (losses) beforereclassifications (2) 3 (60) — 13 (44)Reclassifications to net income of previously deferred(gains) losses (3) — (180) — (9) (189)
Other comprehensive income (loss) 3 (240) — 4 (233)
Balance at August 31, 2016 $ (204) $ 223 $ 115 $ (49) $ 85(1) The accumulated foreign currency translation adjustment and net investment hedge gains/losses related to an investment in a foreign subsidiary are reclassified to Net
income upon sale or upon complete or substantially complete liquidation of the respective entity.(2) Net of tax benefit (expense) of $ 0 million , $ 46 million , $ 0 million , $ 1 million and $ 47 million , respectively.(3) Net of tax (benefit) expense of $ 0 million , $ 0 million , $ 0 million , $ (1) million and $ (1) million , respectively.
The following table summarizes the reclassifications from Accumulated other comprehensive income to the Unaudited Condensed Consolidated Statements of Income:
Amount of Gain (Loss) Reclassified fromAccumulated Other Comprehensive Income
into IncomeLocation of Gain (Loss) Reclassified
from Accumulated Other ComprehensiveIncome into Income
Three Months Ended August 31,
(In millions) 2017 2016
Gains (losses) on cash flow hedges:
Foreign exchange forwards and options $ 2 $ 33 Revenues
Foreign exchange forwards and options 45 104 Cost of sales
Foreign exchange forwards and options 2 43 Other expense (income), netInterest rate swaps (2) — Interest expense (income), net
Total before tax 47 180
Tax (expense) benefit 1 —
Gain (loss) net of tax 48 180
Gains (losses) on other (18) 8 Other expense (income), net
Total before tax (18) 8
Tax (expense) benefit — 1
Gain (loss) net of tax (18) 9
Total net gain (loss) reclassified for the period $ 30 $ 189
Note 11 — Operating SegmentsThe Company’s operating segments are evidence of the structure of the Company’s internal organization. The NIKE Brand segments are defined by geographic regions foroperations participating in NIKE Brand sales activity.
Each NIKE Brand geographic segment operates predominantly in one industry: the design, development, marketing and selling of athletic footwear, apparel and equipment. InJune 2017, NIKE, Inc. announced a new company alignment designed to allow NIKE to better serve the consumer personally, at scale. As a result of this organizationalrealignment, the Company’s reportable operating segments for the NIKE Brand are: North America; Europe, Middle East & Africa; Greater China; and Asia Pacific & LatinAmerica, and include results for the NIKE, Jordan and Hurley brands. Certain prior year amounts have been reclassified to conform to fiscal 2018 presentation. This includesreclassified operating segment data to reflect the changes in the Company’s operating structure, which became effective June 1, 2017. These changes had no impact onpreviously reported consolidated statements of income, balance sheets, statements of cash flows or statements of shareholders’ equity.
The Company’s NIKE Direct operations are managed within each geographic operating segment. Converse is also a reportable segment for the Company, and operates in oneindustry: the design, marketing, licensing and selling of casual sneakers, apparel and accessories.
Global Brand Divisions is included within the NIKE Brand for presentation purposes to align with the way management views the Company. Global Brand Divisions primarilyrepresents NIKE Brand licensing businesses that are not part of a geographic operating segment, and demand creation, operating overhead and product creation and designexpenses that are centrally managed for the NIKE Brand.
Corporate consists largely of unallocated general and administrative expenses, including expenses associated with centrally managed departments; depreciation andamortization related to the Company’s headquarters; unallocated insurance, benefit and compensation programs, including stock-based compensation; and certain foreigncurrency gains and losses, including certain hedge gains and losses.
17
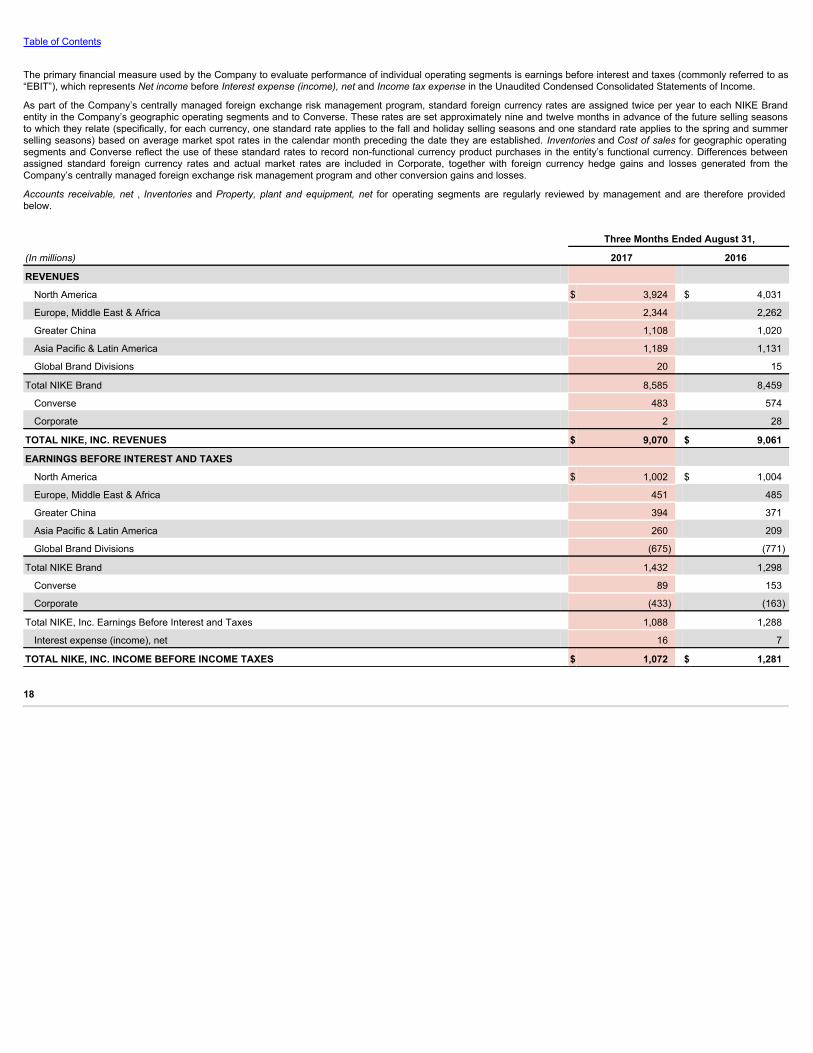
Table of Contents
The primary financial measure used by the Company to evaluate performance of individual operating segments is earnings before interest and taxes (commonly referred to as“EBIT”), which represents Net income before Interest expense (income), net and Income tax expense in the Unaudited Condensed Consolidated Statements of Income.
As part of the Company’s centrally managed foreign exchange risk management program, standard foreign currency rates are assigned twice per year to each NIKE Brandentity in the Company’s geographic operating segments and to Converse. These rates are set approximately nine and twelve months in advance of the future selling seasonsto which they relate (specifically, for each currency, one standard rate applies to the fall and holiday selling seasons and one standard rate applies to the spring and summerselling seasons) based on average market spot rates in the calendar month preceding the date they are established. Inventories and Cost of sales for geographic operatingsegments and Converse reflect the use of these standard rates to record non-functional currency product purchases in the entity’s functional currency. Differences betweenassigned standard foreign currency rates and actual market rates are included in Corporate, together with foreign currency hedge gains and losses generated from theCompany’s centrally managed foreign exchange risk management program and other conversion gains and losses.
Accounts receivable, net , Inventories and Property, plant and equipment, net for operating segments are regularly reviewed by management and are therefore providedbelow.
Three Months Ended August 31,
(In millions) 2017 2016
REVENUES
North America $ 3,924 $ 4,031
Europe, Middle East & Africa 2,344 2,262
Greater China 1,108 1,020
Asia Pacific & Latin America 1,189 1,131
Global Brand Divisions 20 15
Total NIKE Brand 8,585 8,459
Converse 483 574
Corporate 2 28
TOTAL NIKE, INC. REVENUES $ 9,070 $ 9,061
EARNINGS BEFORE INTEREST AND TAXES
North America $ 1,002 $ 1,004
Europe, Middle East & Africa 451 485
Greater China 394 371
Asia Pacific & Latin America 260 209
Global Brand Divisions (675) (771)
Total NIKE Brand 1,432 1,298
Converse 89 153
Corporate (433) (163)
Total NIKE, Inc. Earnings Before Interest and Taxes 1,088 1,288
Interest expense (income), net 16 7
TOTAL NIKE, INC. INCOME BEFORE INCOME TAXES $ 1,072 $ 1,281
18

Table of Contents
As of August 31, As of May 31,
(In millions) 2017 2017
ACCOUNTS RECEIVABLE, NET
North America $ 1,759 $ 1,798
Europe, Middle East & Africa 972 690
Greater China 112 102
Asia Pacific & Latin America 696 693
Global Brand Divisions 88 86
Total NIKE Brand 3,627 3,369
Converse 229 297
Corporate 15 11
TOTAL ACCOUNTS RECEIVABLE, NET $ 3,871 $ 3,677
INVENTORIES
North America $ 2,222 $ 2,218
Europe, Middle East & Africa 1,359 1,327
Greater China 537 463
Asia Pacific & Latin America 769 694
Global Brand Divisions 72 68
Total NIKE Brand 4,959 4,770
Converse 274 286
Corporate (22) (1)
TOTAL INVENTORIES $ 5,211 $ 5,055
PROPERTY, PLANT AND EQUIPMENT, NET
North America $ 827 $ 819
Europe, Middle East & Africa 731 709
Greater China 229 225
Asia Pacific & Latin America 343 340
Global Brand Divisions 543 533
Total NIKE Brand 2,673 2,626
Converse 122 125
Corporate 1,291 1,238
TOTAL PROPERTY, PLANT AND EQUIPMENT, NET $ 4,086 $ 3,989
Note 12 — Commitments and ContingenciesAs of August 31, 2017 , the Company had letters of credit outstanding totaling $143 million . These letters of credit were issued primarily for the purchase of inventory andguarantees of the Company’s performance under certain self-insurance and other programs.
There have been no other significant subsequent developments relating to the commitments and contingencies reported on the Company’s latest Annual Report on Form 10-K.
19
Table of Contents
ITEM 2. Management’s Discussion and Analysis of Financial Conditionand Results of OperationsOverviewNIKE designs, develops, markets and sells athletic footwear, apparel, equipment, accessories and services worldwide. We are the largest seller of athletic footwear andapparel in the world. We sell our products to retail accounts, through NIKE-owned in-line and factory retail stores and NIKE-owned internet websites and mobile applications(which we refer to collectively as our “NIKE Direct” operations), and through a mix of independent distributors, licensees and sales representatives in virtually all countriesaround the world. Our goal is to deliver value to our shareholders by delivering sustainable, profitable, growth across a global portfolio of branded footwear, apparel, equipmentand accessories businesses. Our strategy is to achieve long-term revenue growth by creating innovative, “must have” products, building deep personal consumer connectionswith our brands and delivering compelling consumer experiences at retail, online and in store.
In the current marketplace environment, we believe there has been a meaningful shift in the way consumers shop for product and make purchasing decisions. Consumers aredemanding a constant flow of fresh and innovative product, have an expectation for superior service and a demand for real-time delivery, all fueled by the shift towards digital.Specifically, in North America we anticipate continued evolution within the retail landscape, driven by shifting consumer traffic patterns across digital and physical channels.The evolution of the North America marketplace has resulted in third-party retail store closures and a promotional environment. In many of our international markets, wecontinue to see momentum fueled by macroeconomic and consumer tailwinds, including strong growth in consumer spending, a rapidly emerging middle class, acceleratingparticipation in sport, along with current marketplace growth driven through NIKE Brand consumer experiences leveraging digital.
In June 2017, we announced the Consumer Direct Offense, a new company alignment designed to allow NIKE to better serve the consumer personally, at scale. Leveragingthe power of digital, NIKE believes it will drive growth—by accelerating innovation and product creation, moving even closer to the consumer through key cities, and deepeningone-to-one connections. As a result of this organizational realignment, beginning in fiscal 2018, the Company’s reportable operating segments for the NIKE Brand are: NorthAmerica; Europe, Middle East & Africa (EMEA); Greater China; and Asia Pacific & Latin America (APLA).
NIKE, Inc. Revenues for the first quarter of fiscal 2018 were flat compared to the first quarter of fiscal 2017 on both a reported and currency-neutral basis. Net income for thefirst quarter of fiscal 2018 was $950 million and diluted earnings per common share was $0.57, 24% and 22% lower than the first quarter of fiscal 2017, respectively.
Income before income taxes declined 16% compared to the first quarter of fiscal 2017 as lower selling and administrative expense was more than offset by gross margincontraction and a shift from other income, net to other expense, net. Revenues for the NIKE Brand, which represents over 90% of NIKE, Inc. Revenues , grew 1% for the firstquarter. On a currency-neutral basis, NIKE Brand revenues grew 2%, driven by higher revenues across all international geographies, footwear and apparel and our Sportswearcategory. Revenues for Converse decreased 16% on both a reported and currency-neutral basis primarily due to lower revenues in direct distribution markets, most notably theUnited States and Europe.
Our effective tax rate was 11.4%, compared to 2.5% for the same period last year, reflecting th e tax benefit from stock-based compensation in the current period as a result ofthe adoption of Accounting Standards Update (ASU) 2016-09. The prior period included one-time benefits related to the resolution with the U.S. Internal Revenue Service(IRS) of a foreign tax credit matter and an adjustment to the deferred tax asset related to our nonqualified deferred compensation plan.
Diluted earnings per common share reflects a 2% decline in the diluted weighted average common shares outstanding, compared to the first quarter of fiscal 2017, driven byour share repurchase program.
Use of Non-GAAP Financial MeasuresThroughout this Quarterly Report on Form 10-Q, we discuss non-GAAP financial measures, including references to wholesale equivalent revenues and currency-neutralrevenues, which should be considered in addition to, and not in lieu of, the financial measures calculated and presented in accordance with accounting principles generallyaccepted in the United States of America (“U.S. GAAP”). References to wholesale equivalent revenues are intended to provide context as to the total size of our NIKE Brandmarket footprint if we had no NIKE Direct operations. NIKE Brand wholesale equivalent revenues consist of (1) sales to external wholesale customers and (2) internal salesfrom our wholesale operations to our NIKE Direct operations, which are charged at prices that are comparable to prices charged to external wholesale customers. Additionally,currency-neutral revenues are calculated using actual exchange rates in use during the comparative prior year period to enhance the visibility of the underlying business trendsexcluding the impact of translation arising from foreign currency exchange rate fluctuations.
Management uses these non-GAAP financial measures when evaluating the Company’s performance, including when making financial and operating decisions. Additionally,management believes these non-GAAP financial measures provide investors with additional financial information that should be considered when assessing our underlyingbusiness performance and trends. However, references to wholesale equivalent revenues and currency-neutral revenues should not be considered in isolation or as asubstitute for other financial measures calculated and presented in accordance with U.S. GAAP and may not be comparable to similarly titled non-GAAP measures used byother companies.
20
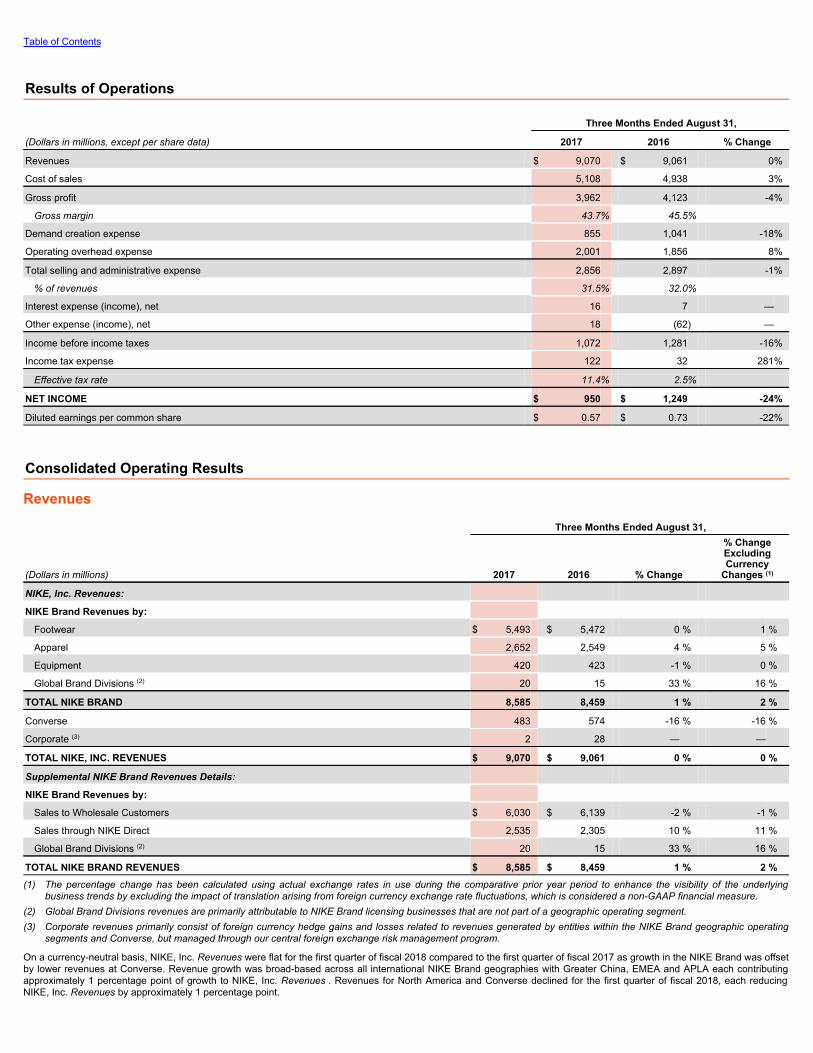
Table of Contents
Results of Operations
Three Months Ended August 31,
(Dollars in millions, except per share data) 2017 2016 % Change
Revenues $ 9,070 $ 9,061 0%
Cost of sales 5,108 4,938 3%
Gross profit 3,962 4,123 -4%
Gross margin 43.7% 45.5%
Demand creation expense 855 1,041 -18%
Operating overhead expense 2,001 1,856 8%
Total selling and administrative expense 2,856 2,897 -1%
% of revenues 31.5% 32.0% Interest expense (income), net 16 7 —
Other expense (income), net 18 (62) —
Income before income taxes 1,072 1,281 -16%
Income tax expense 122 32 281%
Effective tax rate 11.4% 2.5%
NET INCOME $ 950 $ 1,249 -24%
Diluted earnings per common share $ 0.57 $ 0.73 -22%
Consolidated Operating Results
Revenues Three Months Ended August 31,
(Dollars in millions) 2017 2016 % Change
% ChangeExcludingCurrency
Changes (1)
NIKE, Inc. Revenues:
NIKE Brand Revenues by:
Footwear $ 5,493 $ 5,472 0 % 1 %
Apparel 2,652 2,549 4 % 5 %
Equipment 420 423 -1 % 0 %
Global Brand Divisions (2) 20 15 33 % 16 %
TOTAL NIKE BRAND 8,585 8,459 1 % 2 %
Converse 483 574 -16 % -16 %
Corporate (3) 2 28 — —
TOTAL NIKE, INC. REVENUES $ 9,070 $ 9,061 0 % 0 %
Supplemental NIKE Brand Revenues Details:
NIKE Brand Revenues by:
Sales to Wholesale Customers $ 6,030 $ 6,139 -2 % -1 %
Sales through NIKE Direct 2,535 2,305 10 % 11 %
Global Brand Divisions (2) 20 15 33 % 16 %
TOTAL NIKE BRAND REVENUES $ 8,585 $ 8,459 1 % 2 %(1) The percentage change has been calculated using actual exchange rates in use during the comparative prior year period to enhance the visibility of the underlying
business trends by excluding the impact of translation arising from foreign currency exchange rate fluctuations, which is considered a non-GAAP financial measure.(2) Global Brand Divisions revenues are primarily attributable to NIKE Brand licensing businesses that are not part of a geographic operating segment.(3) Corporate revenues primarily consist of foreign currency hedge gains and losses related to revenues generated by entities within the NIKE Brand geographic operating
segments and Converse, but managed through our central foreign exchange risk management program.
On a currency-neutral basis, NIKE, Inc. Revenues were flat for the first quarter of fiscal 2018 compared to the first quarter of fiscal 2017 as growth in the NIKE Brand was offsetby lower revenues at Converse. Revenue growth was broad-based across all international NIKE Brand geographies with Greater China, EMEA and APLA each contributingapproximately 1 percentage point of growth to NIKE, Inc. Revenues . Revenues for North America and Converse declined for the first quarter of fiscal 2018, each reducingNIKE, Inc. Revenues by approximately 1 percentage point.

21
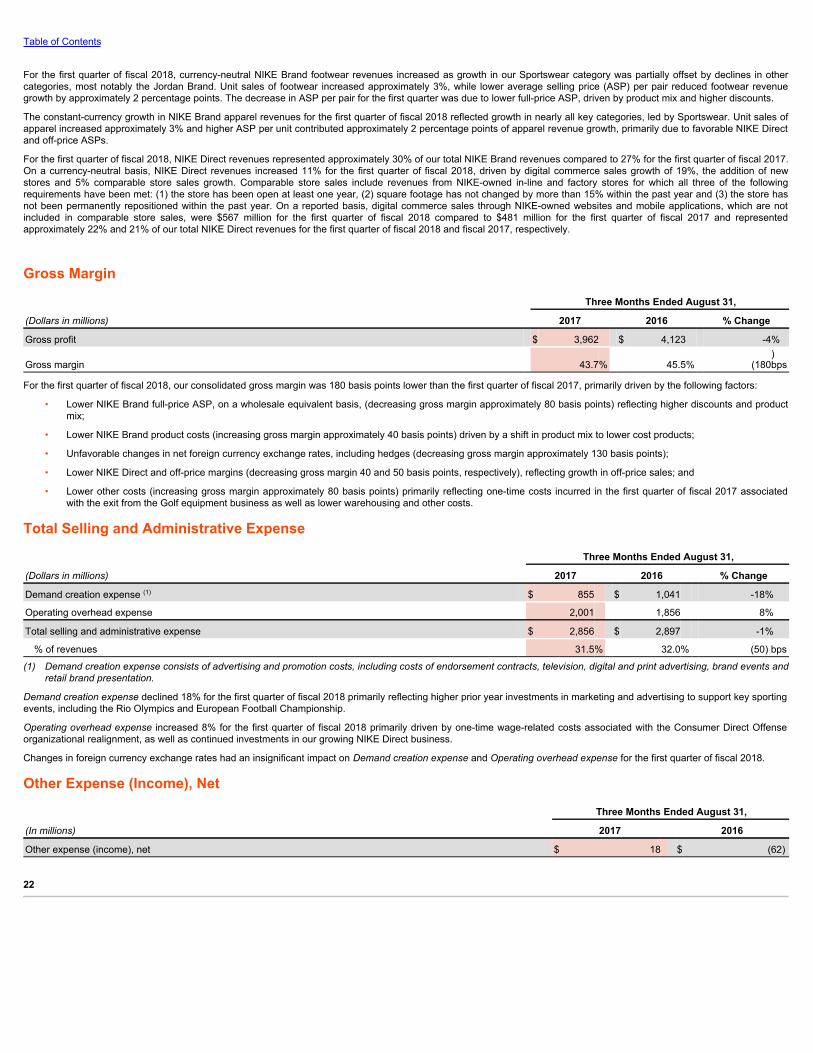
Table of Contents
For the first quarter of fiscal 2018, currency-neutral NIKE Brand footwear revenues increased as growth in our Sportswear category was partially offset by declines in othercategories, most notably the Jordan Brand. Unit sales of footwear increased approximately 3%, while lower average selling price (ASP) per pair reduced footwear revenuegrowth by approximately 2 percentage points. The decrease in ASP per pair for the first quarter was due to lower full-price ASP, driven by product mix and higher discounts.
The constant-currency growth in NIKE Brand apparel revenues for the first quarter of fiscal 2018 reflected growth in nearly all key categories, led by Sportswear. Unit sales ofapparel increased approximately 3% and higher ASP per unit contributed approximately 2 percentage points of apparel revenue growth, primarily due to favorable NIKE Directand off-price ASPs.
For the first quarter of fiscal 2018, NIKE Direct revenues represented approximately 30% of our total NIKE Brand revenues compared to 27% for the first quarter of fiscal 2017.On a currency-neutral basis, NIKE Direct revenues increased 11% for the first quarter of fiscal 2018, driven by digital commerce sales growth of 19%, the addition of newstores and 5% comparable store sales growth. Comparable store sales include revenues from NIKE-owned in-line and factory stores for which all three of the followingrequirements have been met: (1) the store has been open at least one year, (2) square footage has not changed by more than 15% within the past year and (3) the store hasnot been permanently repositioned within the past year. On a reported basis, digital commerce sales through NIKE-owned websites and mobile applications, which are notincluded in comparable store sales, were $567 million for the first quarter of fiscal 2018 compared to $481 million for the first quarter of fiscal 2017 and representedapproximately 22% and 21% of our total NIKE Direct revenues for the first quarter of fiscal 2018 and fiscal 2017, respectively.
Gross Margin Three Months Ended August 31,
(Dollars in millions) 2017 2016 % Change
Gross profit $ 3,962 $ 4,123 -4%
Gross margin 43.7% 45.5% (180)bps
For the first quarter of fiscal 2018, our consolidated gross margin was 180 basis points lower than the first quarter of fiscal 2017, primarily driven by the following factors:
• Lower NIKE Brand full-price ASP, on a wholesale equivalent basis, (decreasing gross margin approximately 80 basis points) reflecting higher discounts and productmix;
• Lower NIKE Brand product costs (increasing gross margin approximately 40 basis points) driven by a shift in product mix to lower cost products;
• Unfavorable changes in net foreign currency exchange rates, including hedges (decreasing gross margin approximately 130 basis points);
• Lower NIKE Direct and off-price margins (decreasing gross margin 40 and 50 basis points, respectively), reflecting growth in off-price sales; and
• Lower other costs (increasing gross margin approximately 80 basis points) primarily reflecting one-time costs incurred in the first quarter of fiscal 2017 associatedwith the exit from the Golf equipment business as well as lower warehousing and other costs.
Total Selling and Administrative Expense Three Months Ended August 31,
(Dollars in millions) 2017 2016 % Change
Demand creation expense (1) $ 855 $ 1,041 -18%
Operating overhead expense 2,001 1,856 8%
Total selling and administrative expense $ 2,856 $ 2,897 -1%
% of revenues 31.5% 32.0% (50) bps
(1) Demand creation expense consists of advertising and promotion costs, including costs of endorsement contracts, television, digital and print advertising, brand events andretail brand presentation.
Demand creation expense declined 18% for the first quarter of fiscal 2018 primarily reflecting higher prior year investments in marketing and advertising to support key sportingevents, including the Rio Olympics and European Football Championship.
Operating overhead expense increased 8% for the first quarter of fiscal 2018 primarily driven by one-time wage-related costs associated with the Consumer Direct Offenseorganizational realignment, as well as continued investments in our growing NIKE Direct business.
Changes in foreign currency exchange rates had an insignificant impact on Demand creation expense and Operating overhead expense for the first quarter of fiscal 2018.
Other Expense (Income), Net Three Months Ended August 31,
(In millions) 2017 2016
Other expense (income), net $ 18 $ (62)
22
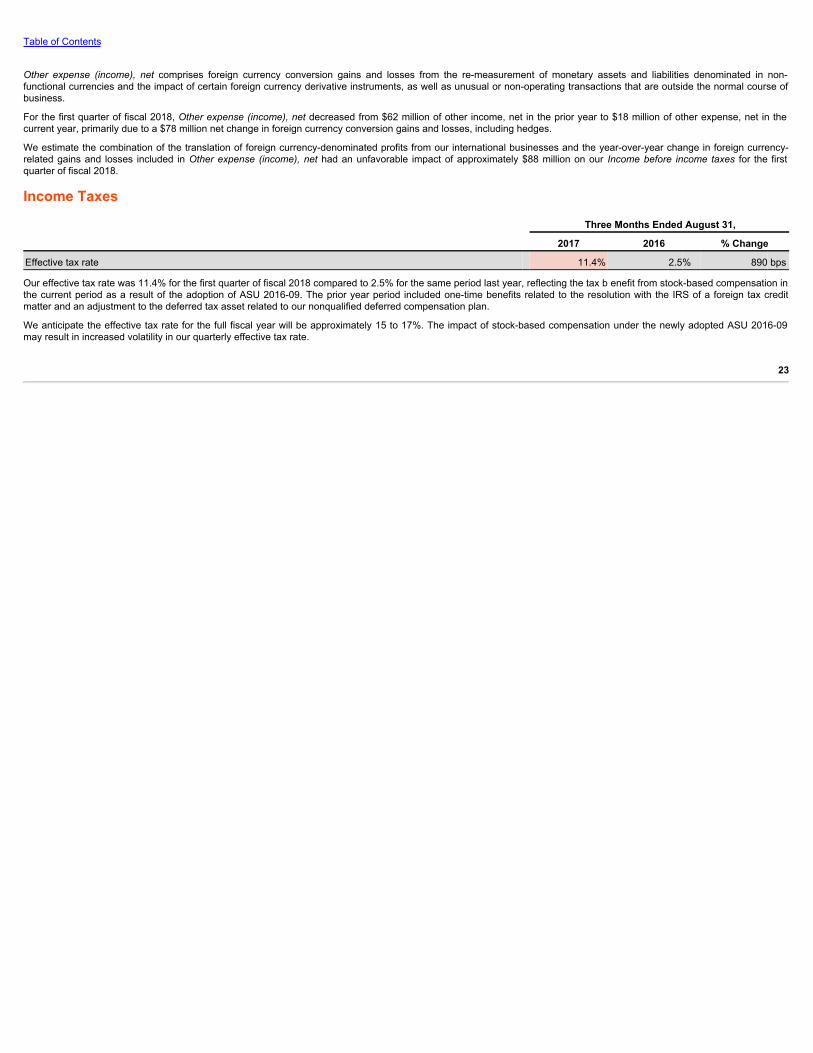
Table of Contents
Other expense (income), net comprises foreign currency conversion gains and losses from the re-measurement of monetary assets and liabilities denominated in non-functional currencies and the impact of certain foreign currency derivative instruments, as well as unusual or non-operating transactions that are outside the normal course ofbusiness.
For the first quarter of fiscal 2018, Other expense (income), net decreased from $62 million of other income, net in the prior year to $18 million of other expense, net in thecurrent year, primarily due to a $78 million net change in foreign currency conversion gains and losses, including hedges.
We estimate the combination of the translation of foreign currency-denominated profits from our international businesses and the year-over-year change in foreign currency-related gains and losses included in Other expense (income), net had an unfavorable impact of approximately $88 million on our Income before income taxes for the firstquarter of fiscal 2018.
Income Taxes Three Months Ended August 31, 2017 2016 % Change
Effective tax rate 11.4% 2.5% 890 bps
Our effective tax rate was 11.4% for the first quarter of fiscal 2018 compared to 2.5% for the same period last year, reflecting the tax b enefit from stock-based compensation inthe current period as a result of the adoption of ASU 2016-09. The prior year period included one-time benefits related to the resolution with the IRS of a foreign tax creditmatter and an adjustment to the deferred tax asset related to our nonqualified deferred compensation plan.
We anticipate the effective tax rate for the full fiscal year will be approximately 15 to 17%. The impact of stock-based compensation under the newly adopted ASU 2016-09may result in increased volatility in our quarterly effective tax rate.
23

Table of Contents
Operating SegmentsOur operating segments are evidence of the structure of the Company’s internal organization. The NIKE Brand segments are defined by geographic regions for operationsparticipating in NIKE Brand sales activity.
Each NIKE Brand geographic segment operates predominantly in one industry: the design, development, marketing and selling of athletic footwear, apparel and equipment.The Company’s reportable operating segments for the NIKE Brand are: North America; Europe, Middle East & Africa; Greater China; and Asia Pacific & Latin America, andinclude results for the NIKE, Jordan and Hurley brands.
The Company’s NIKE Direct operations are managed within each geographic operating segment. Converse is also a reportable segment for the Company, and operates in oneindustry: the design, marketing, licensing and selling of casual sneakers, apparel and accessories.
Certain prior year amounts have been reclassified to conform to fiscal 2018 presentation. This includes reclassified geographic operating segment data to reflect the changesin the Company’s operating structure, which became effective June 1, 2017. These changes had no impact on previously reported consolidated results of operations orshareholders’ equity.
As part of our centrally managed foreign exchange risk management program, standard foreign currency rates are assigned twice per year to each NIKE Brand entity in ourgeographic operating segments and Converse. These rates are set approximately nine and twelve months in advance of the future selling seasons to which they relate(specifically, for each currency, one standard rate applies to the fall and holiday selling seasons and one standard rate applies to the spring and summer selling seasons)based on average market spot rates in the calendar month preceding the date they are established. Inventories and Cost of sales for geographic operating segments andConverse reflect the use of these standard rates to record non-functional currency product purchases into the entity’s functional currency. Differences between assignedstandard foreign currency rates and actual market rates are included in Corporate, together with foreign currency hedge gains and losses generated from our centrallymanaged foreign exchange risk management program and other conversion gains and losses.
24
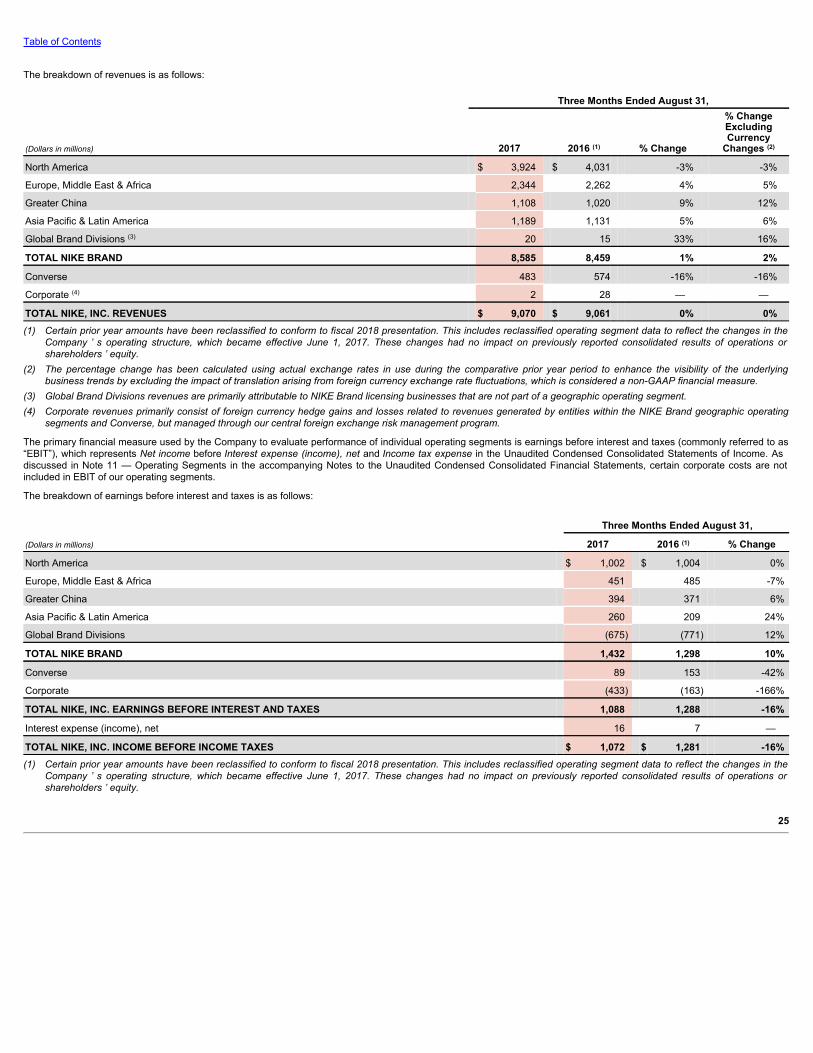
Table of Contents
The breakdown of revenues is as follows:
Three Months Ended August 31,
(Dollars in millions) 2017 2016 (1) % Change
% ChangeExcludingCurrency
Changes (2)
North America $ 3,924 $ 4,031 -3% -3%
Europe, Middle East & Africa 2,344 2,262 4% 5%
Greater China 1,108 1,020 9% 12%
Asia Pacific & Latin America 1,189 1,131 5% 6%
Global Brand Divisions (3) 20 15 33% 16%
TOTAL NIKE BRAND 8,585 8,459 1% 2%
Converse 483 574 -16% -16%
Corporate (4) 2 28 — —
TOTAL NIKE, INC. REVENUES $ 9,070 $ 9,061 0% 0%(1) Certain prior year amounts have been reclassified to conform to fiscal 2018 presentation. This includes reclassified operating segment data to reflect the changes in the
Company ’ s operating structure, which became effective June 1, 2017. These changes had no impact on previously reported consolidated results of operations orshareholders ’ equity.
(2) The percentage change has been calculated using actual exchange rates in use during the comparative prior year period to enhance the visibility of the underlyingbusiness trends by excluding the impact of translation arising from foreign currency exchange rate fluctuations, which is considered a non-GAAP financial measure.
(3) Global Brand Divisions revenues are primarily attributable to NIKE Brand licensing businesses that are not part of a geographic operating segment.(4) Corporate revenues primarily consist of foreign currency hedge gains and losses related to revenues generated by entities within the NIKE Brand geographic operating
segments and Converse, but managed through our central foreign exchange risk management program.
The primary financial measure used by the Company to evaluate performance of individual operating segments is earnings before interest and taxes (commonly referred to as“EBIT”), which represents Net income before Interest expense (income), net and Income tax expense in the Unaudited Condensed Consolidated Statements of Income. Asdiscussed in Note 11 — Operating Segments in the accompanying Notes to the Unaudited Condensed Consolidated Financial Statements, certain corporate costs are notincluded in EBIT of our operating segments.
The breakdown of earnings before interest and taxes is as follows:
Three Months Ended August 31,
(Dollars in millions) 2017 2016 (1) % Change
North America $ 1,002 $ 1,004 0%
Europe, Middle East & Africa 451 485 -7%
Greater China 394 371 6%
Asia Pacific & Latin America 260 209 24%
Global Brand Divisions (675) (771) 12%
TOTAL NIKE BRAND 1,432 1,298 10%
Converse 89 153 -42%
Corporate (433) (163) -166%
TOTAL NIKE, INC. EARNINGS BEFORE INTEREST AND TAXES 1,088 1,288 -16%
Interest expense (income), net 16 7 —
TOTAL NIKE, INC. INCOME BEFORE INCOME TAXES $ 1,072 $ 1,281 -16%(1) Certain prior year amounts have been reclassified to conform to fiscal 2018 presentation. This includes reclassified operating segment data to reflect the changes in the
Company ’ s operating structure, which became effective June 1, 2017. These changes had no impact on previously reported consolidated results of operations orshareholders ’ equity.
25
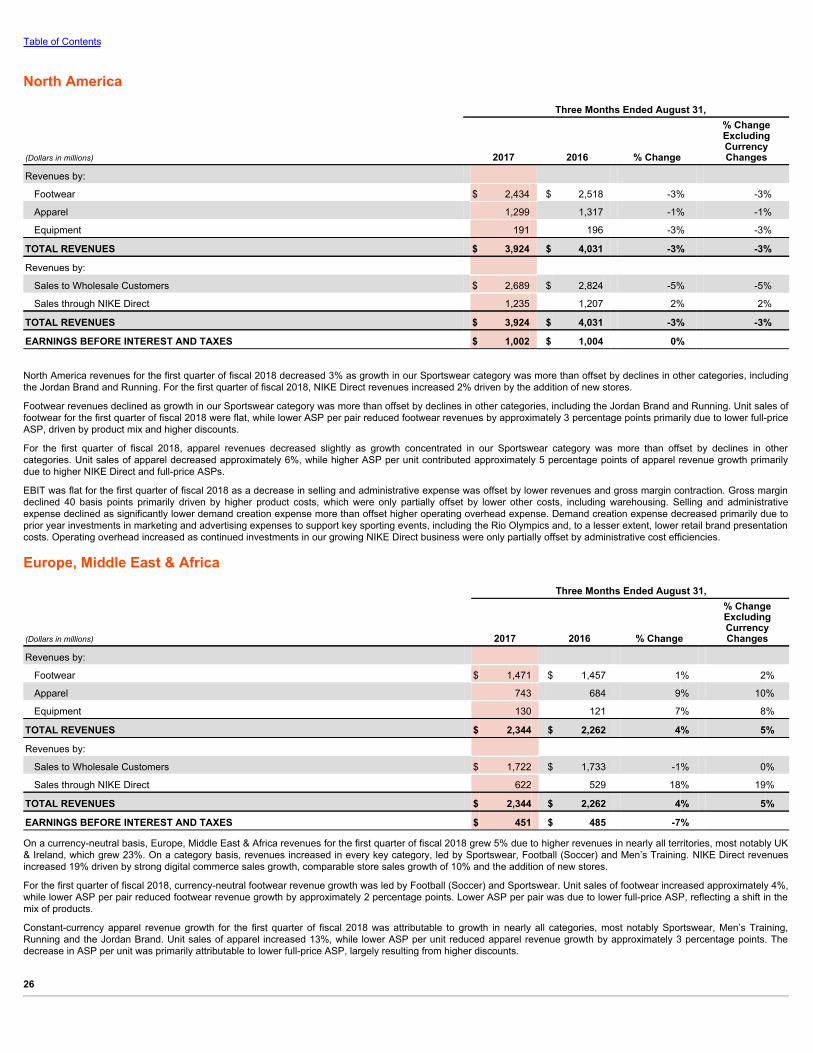
Table of Contents
North America Three Months Ended August 31,
(Dollars in millions) 2017 2016 % Change
% ChangeExcludingCurrencyChanges
Revenues by:
Footwear $ 2,434 $ 2,518 -3% -3%
Apparel 1,299 1,317 -1% -1%
Equipment 191 196 -3% -3%
TOTAL REVENUES $ 3,924 $ 4,031 -3% -3%
Revenues by:
Sales to Wholesale Customers $ 2,689 $ 2,824 -5% -5%
Sales through NIKE Direct 1,235 1,207 2% 2%
TOTAL REVENUES $ 3,924 $ 4,031 -3% -3%
EARNINGS BEFORE INTEREST AND TAXES $ 1,002 $ 1,004 0%
North America revenues for the first quarter of fiscal 2018 decreased 3% as growth in our Sportswear category was more than offset by declines in other categories, includingthe Jordan Brand and Running. For the first quarter of fiscal 2018, NIKE Direct revenues increased 2% driven by the addition of new stores.
Footwear revenues declined as growth in our Sportswear category was more than offset by declines in other categories, including the Jordan Brand and Running. Unit sales offootwear for the first quarter of fiscal 2018 were flat, while lower ASP per pair reduced footwear revenues by approximately 3 percentage points primarily due to lower full-priceASP, driven by product mix and higher discounts.
For the first quarter of fiscal 2018, apparel revenues decreased slightly as growth concentrated in our Sportswear category was more than offset by declines in othercategories. Unit sales of apparel decreased approximately 6%, while higher ASP per unit contributed approximately 5 percentage points of apparel revenue growth primarilydue to higher NIKE Direct and full-price ASPs.
EBIT was flat for the first quarter of fiscal 2018 as a decrease in selling and administrative expense was offset by lower revenues and gross margin contraction. Gross margindeclined 40 basis points primarily driven by higher product costs, which were only partially offset by lower other costs, including warehousing. Selling and administrativeexpense declined as significantly lower demand creation expense more than offset higher operating overhead expense. Demand creation expense decreased primarily due toprior year investments in marketing and advertising expenses to support key sporting events, including the Rio Olympics and, to a lesser extent, lower retail brand presentationcosts. Operating overhead increased as continued investments in our growing NIKE Direct business were only partially offset by administrative cost efficiencies.
Europe, Middle East & Africa Three Months Ended August 31,
(Dollars in millions) 2017 2016 % Change
% ChangeExcludingCurrencyChanges
Revenues by:
Footwear $ 1,471 $ 1,457 1% 2%
Apparel 743 684 9% 10%
Equipment 130 121 7% 8%
TOTAL REVENUES $ 2,344 $ 2,262 4% 5%
Revenues by:
Sales to Wholesale Customers $ 1,722 $ 1,733 -1% 0%
Sales through NIKE Direct 622 529 18% 19%
TOTAL REVENUES $ 2,344 $ 2,262 4% 5%
EARNINGS BEFORE INTEREST AND TAXES $ 451 $ 485 -7%
On a currency-neutral basis, Europe, Middle East & Africa revenues for the first quarter of fiscal 2018 grew 5% due to higher revenues in nearly all territories, most notably UK& Ireland, which grew 23%. On a category basis, revenues increased in every key category, led by Sportswear, Football (Soccer) and Men’s Training. NIKE Direct revenuesincreased 19% driven by strong digital commerce sales growth, comparable store sales growth of 10% and the addition of new stores.
For the first quarter of fiscal 2018, currency-neutral footwear revenue growth was led by Football (Soccer) and Sportswear. Unit sales of footwear increased approximately 4%,while lower ASP per pair reduced footwear revenue growth by approximately 2 percentage points. Lower ASP per pair was due to lower full-price ASP, reflecting a shift in themix of products.
Constant-currency apparel revenue growth for the first quarter of fiscal 2018 was attributable to growth in nearly all categories, most notably Sportswear, Men’s Training,Running and the Jordan Brand. Unit sales of apparel increased 13%, while lower ASP per unit reduced apparel revenue growth by approximately 3 percentage points. Thedecrease in ASP per unit was primarily attributable to lower full-price ASP, largely resulting from higher discounts.
26

Table of Contents
On a reported basis, EBIT decreased 7% for the first quarter of fiscal 2018. Reported revenue growth and selling and administrative expense leverage were more than offsetby lower gross margin. Gross margin declined 270 basis points as lower product costs were more than offset by lower full-price ASP and unfavorable standard foreign currencyexchange rates. S elling and administrative expense increased due to higher operating overhead expense resulting from increased investments in our growing NIKE Directbusiness. Demand creation expense declined primarily due to higher marketing investments in the prior year, largely in support of the Rio Olympics and European FootballChampionship, partially offset by higher sports marketing costs in the first quarter of fiscal 2018.
Greater China Three Months Ended August 31,
(Dollars in millions) 2017 2016 % Change
% ChangeExcludingCurrencyChanges
Revenues by:
Footwear $ 761 $ 710 7% 10%
Apparel 309 269 15% 18%
Equipment 38 41 -7% -3%
TOTAL REVENUES $ 1,108 $ 1,020 9% 12%
Revenues by:
Sales to Wholesale Customers $ 730 $ 695 5% 8%
Sales through NIKE Direct 378 325 16% 20%
TOTAL REVENUES $ 1,108 $ 1,020 9% 12%
EARNINGS BEFORE INTEREST AND TAXES $ 394 $ 371 6%
On a currency-neutral basis, Greater China revenues increased 12% for the first quarter of fiscal 2018, driven by higher revenues in most key categories, led by Sportswear,Running and the Jordan Brand. NIKE Direct revenues increased 20%, fueled by strong digital commerce sales growth, the addition of new stores and 2% comparable storesales growth.
The constant-currency increase in footwear revenues for the first quarter of fiscal 2018 was attributable to increases in several key categories, most notably Sportswear,Running and the Jordan Brand. Unit sales of footwear increased 13%, while lower ASP per pair reduced footwear revenue growth by approximately 3 percentage points as aresult of lower full-price and NIKE Direct ASPs.
Currency-neutral apparel revenue growth for the first quarter of fiscal 2018 was due to higher revenues in all key categories, led by Sportswear, Running and the Jordan Brand.Unit sales of apparel increased 13%, while higher ASP per unit increased apparel revenue growth by approximately 5 percentage points. The increase in ASP per unit wasattributable to higher full-price ASP.
Despite the negative impact of translation , EBIT increased 6% for the first quarter of fiscal 2018. EBIT growth was driven by higher reported revenues and lower selling andadministrative expense, partially offset by a decline in gross margin. Gross margin declined 270 basis points as higher full-price ASP was more than offset by unfavorablestandard foreign currency exchange rates and lower off-price margins, including through our NIKE Direct business. Selling and administrative expense was lower as asignificant decrease in demand creation expense was only partially offset by higher operating overhead expense. The decrease in demand creation expense was attributableto higher prior year marketing and advertising costs to support key sporting events, including the Rio Olympics. Operating overhead increased due to continued investments inour growing NIKE Direct business.
27
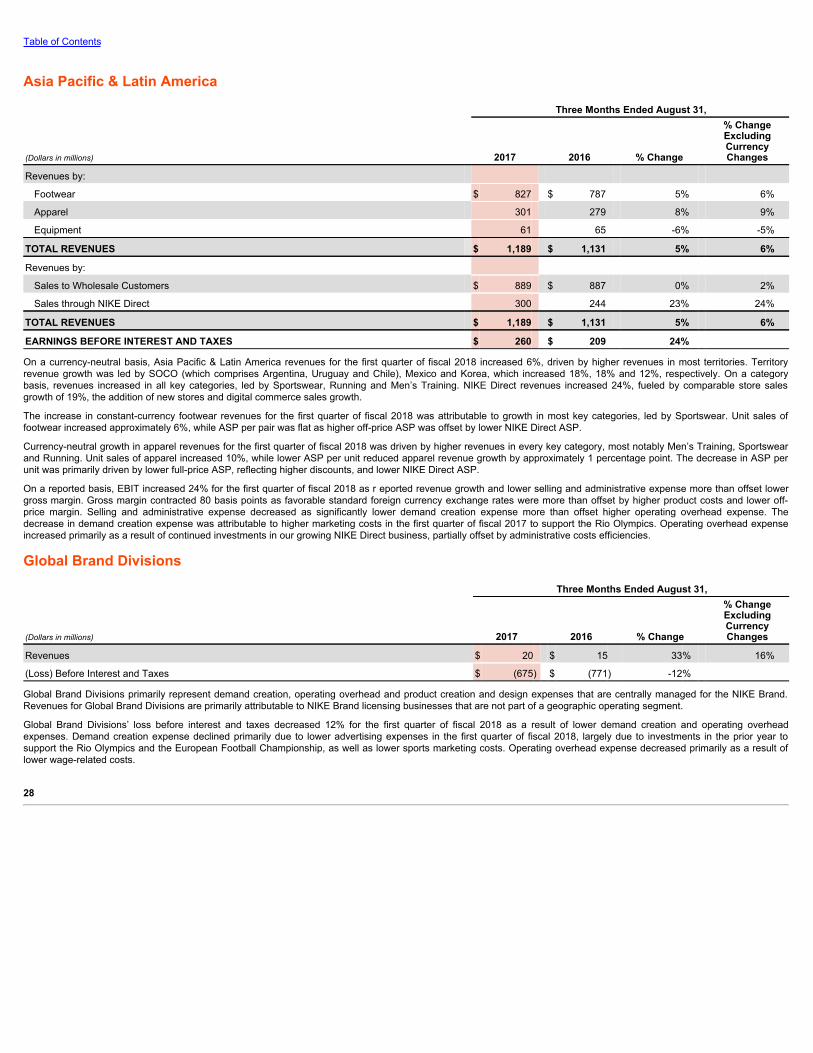
Table of Contents
Asia Pacific & Latin America Three Months Ended August 31,
(Dollars in millions) 2017 2016 % Change
% ChangeExcludingCurrencyChanges
Revenues by:
Footwear $ 827 $ 787 5% 6%
Apparel 301 279 8% 9%
Equipment 61 65 -6% -5%
TOTAL REVENUES $ 1,189 $ 1,131 5% 6%
Revenues by:
Sales to Wholesale Customers $ 889 $ 887 0% 2%
Sales through NIKE Direct 300 244 23% 24%
TOTAL REVENUES $ 1,189 $ 1,131 5% 6%
EARNINGS BEFORE INTEREST AND TAXES $ 260 $ 209 24%
On a currency-neutral basis, Asia Pacific & Latin America revenues for the first quarter of fiscal 2018 increased 6%, driven by higher revenues in most territories. Territoryrevenue growth was led by SOCO (which comprises Argentina, Uruguay and Chile), Mexico and Korea, which increased 18%, 18% and 12%, respectively. On a categorybasis, revenues increased in all key categories, led by Sportswear, Running and Men’s Training. NIKE Direct revenues increased 24%, fueled by comparable store salesgrowth of 19%, the addition of new stores and digital commerce sales growth.
The increase in constant-currency footwear revenues for the first quarter of fiscal 2018 was attributable to growth in most key categories, led by Sportswear. Unit sales offootwear increased approximately 6%, while ASP per pair was flat as higher off-price ASP was offset by lower NIKE Direct ASP.
Currency-neutral growth in apparel revenues for the first quarter of fiscal 2018 was driven by higher revenues in every key category, most notably Men’s Training, Sportswearand Running. Unit sales of apparel increased 10%, while lower ASP per unit reduced apparel revenue growth by approximately 1 percentage point. The decrease in ASP perunit was primarily driven by lower full-price ASP, reflecting higher discounts, and lower NIKE Direct ASP.
On a reported basis, EBIT increased 24% for the first quarter of fiscal 2018 as r eported revenue growth and lower selling and administrative expense more than offset lowergross margin. Gross margin contracted 80 basis points as favorable standard foreign currency exchange rates were more than offset by higher product costs and lower off-price margin. Selling and administrative expense decreased as significantly lower demand creation expense more than offset higher operating overhead expense. Thedecrease in demand creation expense was attributable to higher marketing costs in the first quarter of fiscal 2017 to support the Rio Olympics. Operating overhead expenseincreased primarily as a result of continued investments in our growing NIKE Direct business, partially offset by administrative costs efficiencies.
Global Brand Divisions Three Months Ended August 31,
(Dollars in millions) 2017 2016 % Change
% ChangeExcludingCurrencyChanges
Revenues $ 20 $ 15 33% 16%
(Loss) Before Interest and Taxes $ (675) $ (771) -12%
Global Brand Divisions primarily represent demand creation, operating overhead and product creation and design expenses that are centrally managed for the NIKE Brand.Revenues for Global Brand Divisions are primarily attributable to NIKE Brand licensing businesses that are not part of a geographic operating segment.
Global Brand Divisions’ loss before interest and taxes decreased 12% for the first quarter of fiscal 2018 as a result of lower demand creation and operating overheadexpenses. Demand creation expense declined primarily due to lower advertising expenses in the first quarter of fiscal 2018, largely due to investments in the prior year tosupport the Rio Olympics and the European Football Championship, as well as lower sports marketing costs. Operating overhead expense decreased primarily as a result oflower wage-related costs.
28
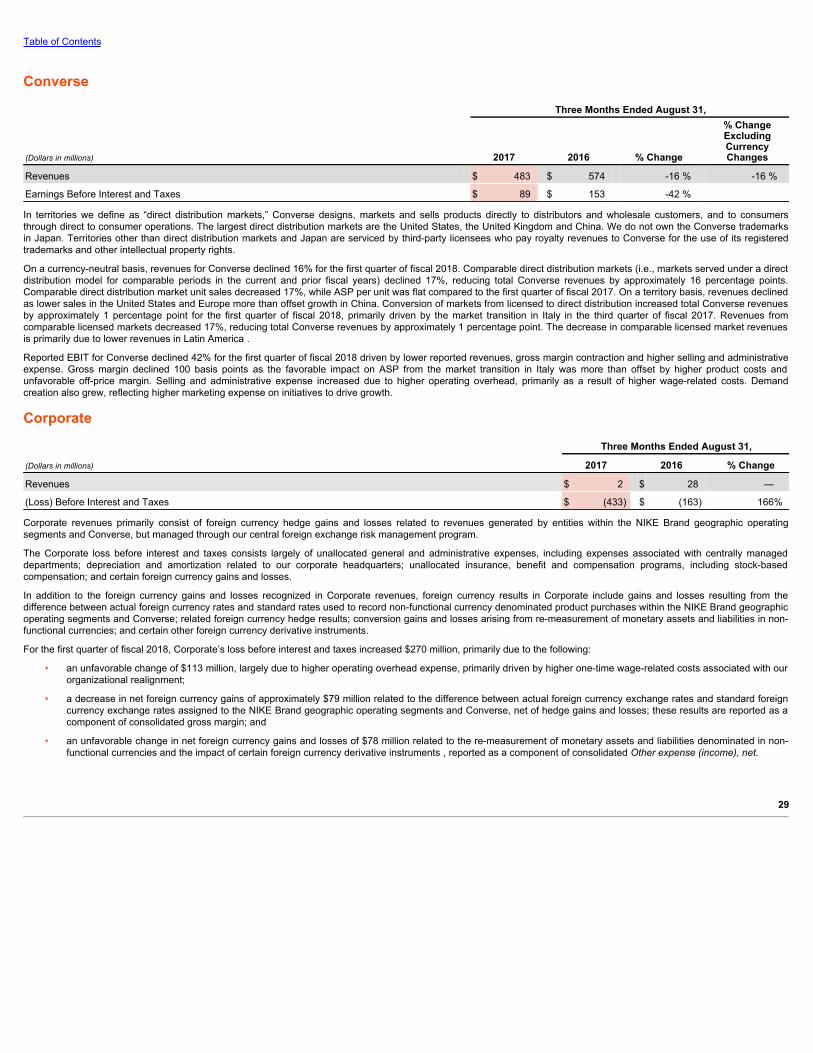
Table of Contents
Converse Three Months Ended August 31,
(Dollars in millions) 2017 2016 % Change
% ChangeExcludingCurrencyChanges
Revenues $ 483 $ 574 -16 % -16 %
Earnings Before Interest and Taxes $ 89 $ 153 -42 %
In territories we define as “direct distribution markets,” Converse designs, markets and sells products directly to distributors and wholesale customers, and to consumersthrough direct to consumer operations. The largest direct distribution markets are the United States, the United Kingdom and China. We do not own the Converse trademarksin Japan. Territories other than direct distribution markets and Japan are serviced by third-party licensees who pay royalty revenues to Converse for the use of its registeredtrademarks and other intellectual property rights.
On a currency-neutral basis, revenues for Converse declined 16% for the first quarter of fiscal 2018. Comparable direct distribution markets (i.e., markets served under a directdistribution model for comparable periods in the current and prior fiscal years) declined 17%, reducing total Converse revenues by approximately 16 percentage points.Comparable direct distribution market unit sales decreased 17%, while ASP per unit was flat compared to the first quarter of fiscal 2017. On a territory basis, revenues declinedas lower sales in the United States and Europe more than offset growth in China. Conversion of markets from licensed to direct distribution increased total Converse revenuesby approximately 1 percentage point for the first quarter of fiscal 2018, primarily driven by the market transition in Italy in the third quarter of fiscal 2017. Revenues fromcomparable licensed markets decreased 17%, reducing total Converse revenues by approximately 1 percentage point. The decrease in comparable licensed market revenuesis primarily due to lower revenues in Latin America .
Reported EBIT for Converse declined 42% for the first quarter of fiscal 2018 driven by lower reported revenues, gross margin contraction and higher selling and administrativeexpense. Gross margin declined 100 basis points as the favorable impact on ASP from the market transition in Italy was more than offset by higher product costs andunfavorable off-price margin. Selling and administrative expense increased due to higher operating overhead, primarily as a result of higher wage-related costs. Demandcreation also grew, reflecting higher marketing expense on initiatives to drive growth.
Corporate Three Months Ended August 31,
(Dollars in millions) 2017 2016 % Change
Revenues $ 2 $ 28 —
(Loss) Before Interest and Taxes $ (433) $ (163) 166%
Corporate revenues primarily consist of foreign currency hedge gains and losses related to revenues generated by entities within the NIKE Brand geographic operatingsegments and Converse, but managed through our central foreign exchange risk management program.
The Corporate loss before interest and taxes consists largely of unallocated general and administrative expenses, including expenses associated with centrally manageddepartments; depreciation and amortization related to our corporate headquarters; unallocated insurance, benefit and compensation programs, including stock-basedcompensation; and certain foreign currency gains and losses.
In addition to the foreign currency gains and losses recognized in Corporate revenues, foreign currency results in Corporate include gains and losses resulting from thedifference between actual foreign currency rates and standard rates used to record non-functional currency denominated product purchases within the NIKE Brand geographicoperating segments and Converse; related foreign currency hedge results; conversion gains and losses arising from re-measurement of monetary assets and liabilities in non-functional currencies; and certain other foreign currency derivative instruments.
For the first quarter of fiscal 2018, Corporate’s loss before interest and taxes increased $270 million, primarily due to the following:
• an unfavorable change of $113 million, largely due to higher operating overhead expense, primarily driven by higher one-time wage-related costs associated with ourorganizational realignment;
• a decrease in net foreign currency gains of approximately $79 million related to the difference between actual foreign currency exchange rates and standard foreigncurrency exchange rates assigned to the NIKE Brand geographic operating segments and Converse, net of hedge gains and losses; these results are reported as acomponent of consolidated gross margin; and
• an unfavorable change in net foreign currency gains and losses of $78 million related to the re-measurement of monetary assets and liabilities denominated in non-functional currencies and the impact of certain foreign currency derivative instruments , reported as a component of consolidated Other expense (income), net.
29
Table of Contents
Foreign Currency Exposures and Hedging Practices
OverviewAs a global company with significant operations outside the United States, in the normal course of business we are exposed to risk arising from changes in currency exchangerates. Our primary foreign currency exposures arise from the recording of transactions denominated in non-functional currencies and the translation of foreign currencydenominated results of operations, financial position and cash flows into U.S. Dollars.
Our foreign exchange risk management program is intended to lessen both the positive and negative effects of currency fluctuations on our consolidated results of operations,financial position and cash flows. We manage global foreign exchange risk centrally on a portfolio basis to address those risks that are material to NIKE, Inc. We manage theseexposures by taking advantage of natural offsets and currency correlations that exist within the portfolio and, where practical and material, by hedging a portion of theremaining exposures using derivative instruments such as forward contracts and options. As described below, the implementation of the NIKE Trading Company (NTC) andour foreign currency adjustment program enhanced our ability to manage our foreign exchange risk by increasing the natural offsets and currency correlation benefits that existwithin our portfolio of foreign exchange exposures. Our hedging policy is designed to partially or entirely offset the impact of exchange rate changes on the underlying netexposures being hedged. Where exposures are hedged, our program has the effect of delaying the impact of exchange rate movements on our Unaudited CondensedConsolidated Financial Statements; the length of the delay is dependent upon hedge horizons. We do not hold or issue derivative instruments for trading or speculativepurposes.
Refer to Note 4 — Fair Value Measurements and Note 9 — Risk Management and Derivatives in the accompanying Notes to the Unaudited Condensed Consolidated FinancialStatements for additional description of how the above financial instruments are valued and recorded, as well as the fair value of outstanding derivatives at each reportedperiod end.
Transactional ExposuresWe conduct business in various currencies and have transactions which subject us to foreign currency risk. Our most significant transactional foreign currency exposures are:
• Product Costs — NIKE’s product costs are exposed to fluctuations in foreign currencies in the following ways:
1. Product purchases denominated in currencies other than the functional currency of the transacting entity:
a. Certain NIKE entities purchase product from the NTC, a wholly-owned sourcing hub that buys NIKE branded products from third-party factories,predominantly in U.S. Dollars. The NTC, whose functional currency is the U.S. Dollar, then sells the products to NIKE entities in their respective functionalcurrencies. When the NTC sells to a NIKE entity with a different functional currency, the result is a foreign currency exposure for the NTC.
b. Other NIKE entities purchase product directly from third-party factories in U.S. Dollars. These purchases generate a foreign currency exposure for thoseNIKE entities with a functional currency other than the U.S. Dollar.
In both purchasing scenarios, a weaker U.S. Dollar reduces the inventory cost incurred by NIKE whereas a stronger U.S. Dollar increases its cost.
2. Factory input costs: NIKE operates a foreign currency adjustment program with certain factories. The program is designed to more effectively manage foreigncurrency risk by assuming certain of the factories’ foreign currency exposures, some of which are natural offsets to our existing foreign currency exposures.Under this program, our payments to these factories are adjusted for rate fluctuations in the basket of currencies (“factory currency exposure index”) in which thelabor, materials and overhead costs incurred by the factories in the production of NIKE branded products (“factory input costs”) are denominated.
For the currency within the factory currency exposure indices that is the local or functional currency of the factory, the currency rate fluctuation affecting theproduct cost is recorded within Inventories and is recognized in Cost of sales when the related product is sold to a third-party. All currencies within the indices,excluding the U.S. Dollar and the local or functional currency of the factory, are recognized as embedded derivative contracts and are recorded at fair valuethrough Other expense (income), net . Refer to Note 9 — Risk Management and Derivatives in the accompanying Notes to the Unaudited CondensedConsolidated Financial Statements for additional detail.
As an offset to the impacts of the fluctuating U.S. Dollar on our non-functional currency denominated product purchases described above, a strengtheningU.S. Dollar against the foreign currencies within the factory currency exposure indices decreases NIKE’s U.S. Dollar inventory cost. Conversely, a weakeningU.S. Dollar against the indexed foreign currencies increases our inventory cost.
• Non-Functional Currency Denominated External Sales — A portion of our NIKE Brand and Converse revenues associated with European operations are earned incurrencies other than the Euro (e.g. the British Pound) but are recognized at a subsidiary that uses the Euro as its functional currency. These sales generate aforeign currency exposure.
• Other Costs — Non-functional currency denominated costs, such as endorsement contracts, also generate foreign currency risk, though to a lesser extent. In certaincases, the Company has also entered into other contractual agreements which have payments that are indexed to foreign currencies and create embeddedderivative contracts that are recorded at fair value through Other expense (income), net . Refer to Note 9 — Risk Management and Derivatives in the accompanyingNotes to the Unaudited Condensed Consolidated Financial Statements for additional detail.
• Non-Functional Currency Denominated Monetary Assets and Liabilities — Our global subsidiaries have various assets and liabilities, primarily receivables andpayables, including intercompany receivables and payables, denominated in currencies other than their functional currencies. These balance sheet items are subjectto re-measurement which may create fluctuations in Other expense (income), net within our consolidated results of operations.
30
Table of Contents
Managing Transactional ExposuresTransactional exposures are managed on a portfolio basis within our foreign currency risk management program. We manage these exposures by taking advantage of naturaloffsets and currency correlations that exist within the portfolio and may also elect to use currency forward and option contracts to hedge the remaining effect of exchange ratefluctuations on probable forecasted future cash flows, including certain product cost exposures, non-functional currency denominated external sales and other costs describedabove. Generally, these are accounted for as cash flow hedges in accordance with U.S. GAAP, except for hedges of the embedded derivative components of the product costexposures and other contractual agreements.
Certain currency forward contracts used to manage the foreign exchange exposure of non-functional currency denominated monetary assets and liabilities subject to re-measurement and embedded derivative contracts are not formally designated as hedging instruments under U.S. GAAP. Accordingly, changes in fair value of theseinstruments are recognized in Other expense (income), net and are intended to offset the foreign currency impact of the re-measurement of the related non-functional currencydenominated asset or liability or the embedded derivative contract being hedged.
Translational ExposuresMany of our foreign subsidiaries operate in functional currencies other than the U.S. Dollar. Fluctuations in currency exchange rates create volatility in our reported results aswe are required to translate the balance sheets, operational results and cash flows of these subsidiaries into U.S. Dollars for consolidated reporting. The translation of foreignsubsidiaries’ non-U.S. Dollar denominated balance sheets into U.S. Dollars for consolidated reporting results in a cumulative translation adjustment to Accumulated othercomprehensive income within Shareholders’ equity . In the translation of our Unaudited Condensed Consolidated Statements of Income, a weaker U.S. Dollar in relation toforeign functional currencies benefits our consolidated earnings whereas a stronger U.S. Dollar reduces our consolidated earnings. The impact of foreign exchange ratefluctuations on the translation of our consolidated Revenues was a detriment of approximately $36 million and $185 million for the three months ended August 31, 2017 and2016, respectively. The impact of foreign exchange rate fluctuations on the translation of our Income before income taxes was a detriment of approximately $10 million and$26 million for the three months ended August 31, 2017 and 2016, respectively.
Managing Translational ExposuresTo minimize the impact of translating foreign currency denominated revenues and expenses into U.S. Dollars for consolidated reporting, certain foreign subsidiaries use excesscash to purchase U.S. Dollar denominated available-for-sale investments. The variable future cash flows associated with the purchase and subsequent sale of theseU.S. Dollar denominated investments at non-U.S. Dollar functional currency subsidiaries creates a foreign currency exposure that qualifies for hedge accounting under U.S.GAAP. We utilize forward contracts and/or options to mitigate the variability of the forecasted future purchases and sales of these U.S. Dollar investments. The combination ofthe purchase and sale of the U.S. Dollar investment and the hedging instrument has the effect of partially offsetting the year-over-year foreign currency translation impact onnet earnings in the period the investments are sold. Hedges of the purchase of U.S. Dollar denominated available-for-sale investments are accounted for as cash flow hedges.
We estimate the combination of translation of foreign currency-denominated profits from our international businesses and the year-over-year change in foreign currency-relatedgains and losses included in Other expense (income), net had an unfavorable impact of approximately $88 million on our Income before income taxes for the three monthsended August 31, 2017 .
Net Investments in Foreign SubsidiariesWe are also exposed to the impact of foreign exchange fluctuations on our investments in wholly-owned foreign subsidiaries denominated in a currency other than theU.S. Dollar, which could adversely impact the U.S. Dollar value of these investments, and therefore the value of future repatriated earnings. We have, in the past, hedged andmay, in the future, hedge net investment positions in certain foreign subsidiaries to mitigate the effects of foreign exchange fluctuations on these net investments. Thesehedges are accounted for as net investment hedges in accordance with U.S. GAAP. There were no outstanding net investment hedges as of August 31, 2017 and 2016 .There were no cash flows from net investment hedge settlements for the three months ended August 31, 2017 and 2016 .
Liquidity and Capital Resources
Cash Flow ActivityCash provided by operations was $575 million for the first three months of fiscal 2018 compared to $788 million for the first three months of fiscal 2017. Net income , adjustedfor non-cash items, generated $ 1,107 million of operating cash flows for the first three months of fiscal 2018 compared to $ 1,375 million for the first three months of fiscal2017. Operating cash flows also decreased due to changes in working capital, which resulted in a cash outflow of $532 million for the first three months of fiscal 2018compared to an outflow of $587 million for the first three months of fiscal 2017. The change in working capital was primarily due to a net change in cash collateral posted withderivative counterparties as a result of hedging activities. For the first three months of fiscal 2018, cash collateral posted with derivative counterparties, which is recorded inPrepaid expenses and other current assets on the Unaudited Condensed Consolidated Balance Sheets, increased $273 million compared to an increase of $136 million duringthe first three months of fiscal 2017. Refer to the Credit Risk section of Note 9 — Risk Management and Derivatives in the accompanying Notes to the Unaudited CondensedConsolidated Financial Statements for additional detail. This increase in cash collateral posted with counterparties was partially offset by a $183 million change in Accountsreceivable, net , driven by the timing of revenues.
Cash used by investing activities was $12 million for the first three months of fiscal 2018 compared to $76 million for the first three months of fiscal 2017 as cash flows relatedto short-term investments, additions to property, plant and equipment and other investing activities were largely unchanged compared to the first quarter of fiscal 2017.
Cash used by financing activities was $998 million for the first three months of fiscal 2018 compared to $1,202 million for the first three months of fiscal 2017. The decrease in Cash used by financing activities was primarily driven by lower share repurchases during the first three months of fiscal 2018 compared to the first three months of fiscal2017.
31

Table of Contents
During the first three months of fiscal 2018, we purchased 15.3 million shares of NIKE’s Class B Common Stock for $849 million (an average price of $55.67 per share) underthe four-year, $12 billion share repurchase program approved by the Board of Directors in November 2015. As of August 31, 2017 , we had repurchased 95.0 million shares ata cost of approximately $5,287 million (an average price of $55.64 per share) under this program. We continue to expect funding of share repurchases will come fromoperating cash flows, excess cash and/or proceeds from debt. The timing and the amount of shares purchased will be dictated by our capital needs and stock marketconditions.
Capital ResourcesOn July 21, 2016, we filed a shelf registration statement (the “Shelf”) with the SEC which permits us to issue an unlimited amount of debt securities. The Shelf expires on July21, 2019. For additional detail refer to Note 8 — Long Term Debt in our Annual Report on Form 10-K for the fiscal year ended May 31, 2017 .
On August 28, 2015, we entered into a committed credit facility agreement with a syndicate of banks, which provides for up to $2 billion of borrowings. The facility maturesAugust 28, 2020, with a one year extension option prior to any anniversary of the closing date, provided that in no event shall it extend beyond August 28, 2022. As of and forthe three month period ended August 31, 2017 , we had no amounts outstanding under the committed credit facility.
We currently have long-term debt ratings of AA- and A1 from Standard and Poor’s Corporation and Moody’s Investor Services, respectively. If our long-term debt ratings wereto decline, the facility fee and interest rate under our committed credit facility would increase. Conversely, if our long-term debt ratings were to improve, the facility fee andinterest rate would decrease. Changes in our long-term debt ratings would not trigger acceleration of maturity of any then-outstanding borrowings or any future borrowingsunder the committed credit facility. Under this committed revolving credit facility, we have agreed to various covenants. These covenants include limits on our disposal of fixedassets and the amount of debt secured by liens we may incur, as well as limits on the indebtedness we can incur relative to our net worth. In the event we were to have anyborrowings outstanding under this facility and failed to meet any covenant, and were unable to obtain a waiver from a majority of the banks in the syndicate, any borrowingswould become immediately due and payable. As of August 31, 2017 , we were in full compliance with each of these covenants and believe it is unlikely we will fail to meet anyof these covenants in the foreseeable future.
Liquidity is also provided by our $2 billion commercial paper program. During the three months ended August 31, 2017 , the maximum amount of commercial paper borrowingsoutstanding at any point was $325 million. As of August 31, 2017 , there were $325 million of outstanding borrowings under this program. We may continue to issuecommercial paper or other debt securities during fiscal 2018 depending on general corporate needs. We currently have short-term debt ratings of A1+ and P1 from Standardand Poor’s Corporation and Moody’s Investor Services, respectively.
As of August 31, 2017 , we had cash, cash equivalents and short-term investments totaling $5.5 billion , of which $4.9 billion was held by our foreign subsidiaries. Cashequivalents and Short-term investments consist primarily of deposits held at major banks, money market funds, commercial paper, corporate notes, U.S. Treasury obligations,U.S. government sponsored enterprise obligations and other investment grade fixed-income securities. Our fixed-income investments are exposed to both credit and interestrate risk. All of our investments are investment grade to minimize our credit risk. While individual securities have varying durations, as of August 31, 2017 , the averageduration of our cash equivalents and short-term investments portfolio was 80 days.
To date we have not experienced difficulty accessing the credit markets or incurred higher interest costs. Future volatility in the capital markets, however, may increase costsassociated with issuing commercial paper or other debt instruments or affect our ability to access those markets. We believe that existing cash, cash equivalents, short-terminvestments and cash generated by operations, together with access to external sources of funds as described above, will be sufficient to meet our domestic andforeign capital needs in the foreseeable future.
We utilize a variety of tax planning and financing strategies to manage our worldwide cash and deploy funds to locations where they are needed. We routinely repatriate aportion of our foreign earnings for which U.S. taxes have previously been provided. We also indefinitely reinvest a significant portion of our foreign earnings, and our currentplans do not demonstrate a need to repatriate these earnings. Should we require additional capital in the United States, we may elect to repatriate indefinitely reinvestedforeign funds or raise capital in the United States through debt. If we were to repatriate indefinitely reinvested foreign funds, we would be required to accrue and pay additionalU.S. taxes less applicable foreign tax credits. If we elect to raise capital in the United States through debt, we would incur additional interest expense .
Contractual ObligationsThere have been no significant changes to the contractual obligations reported in our Annual Report on Form 10-K for the fiscal year ended May 31, 2017 .
Off-Balance Sheet ArrangementsAs of August 31, 2017 , we did not have any off-balance sheet arrangements that have, or are reasonably likely to have, a current or future effect on our financial condition,results of operations, liquidity, capital expenditures or capital resources.
New Accounting PronouncementsRefer to Note 1 — Summary of Significant Accounting Policies in the accompanying Notes to the Unaudited Condensed Consolidated Financial Statements for recentlyadopted and recently issued accounting standards.
32

Table of Contents
Critical Accounting PoliciesOur discussion and analysis of our financial condition and results of operations are based upon our Unaudited Condensed Consolidated Financial Statements, which havebeen prepared in accordance with U.S. GAAP. The preparation of these financial statements requires us to make estimates and judgments that affect the reported amounts ofassets, liabilities, revenues and expenses and related disclosure of contingent assets and liabilities.
We believe that the estimates, assumptions and judgments involved in the accounting policies described in the “Management’s Discussion and Analysis of Financial Conditionand Results of Operations” section of our most recent Annual Report on Form 10-K have the greatest potential impact on our financial statements, so we consider these to beour critical accounting policies. Actual results could differ from the estimates we use in applying our critical accounting policies. We are not currently aware of any reasonablylikely events or circumstances that would result in materially different amounts being reported.
33
Table of Contents
ITEM 3. Quantitative and Qualitative Disclosures about Market RiskThere have been no material changes from the information previously reported under Part II, Item 7A of our Annual Report on Form 10-K for the fiscal year ended May 31,2017 .
ITEM 4. Controls and ProceduresWe maintain disclosure controls and procedures that are designed to provide reasonable assurance that information required to be disclosed in our Securities Exchange Act of1934, as amended (“the Exchange Act”) reports is recorded, processed, summarized and reported within the time periods specified in the Securities and ExchangeCommission’s rules and forms and that such information is accumulated and communicated to our management, including our Chief Executive Officer and Chief FinancialOfficer, as appropriate, to allow for timely decisions regarding required disclosure. In designing and evaluating the disclosure controls and procedures, managementrecognizes that any controls and procedures, no matter how well designed and operated, can provide only reasonable assurance of achieving the desired control objectives,and management is required to apply its judgment in evaluating the cost-benefit relationship of possible controls and procedures.
We carry out a variety of ongoing procedures under the supervision and with the participation of our management, including our Chief Executive Officer and Chief FinancialOfficer, to evaluate the effectiveness of the design and operation of our disclosure controls and procedures. Based on the foregoing, our Chief Executive Officer and ChiefFinancial Officer concluded that our disclosure controls and procedures were effective at the reasonable assurance level as of August 31, 2017 .
We are continuing several transformation initiatives to centralize and simplify our business processes and systems. These are long-term initiatives, which we believe willenhance our internal control over financial reporting due to increased automation and further integration of related processes. We will continue to monitor our internal controlover financial reporting for effectiveness throughout the transformation.
There have not been any other changes in our internal control over financial reporting during our most recent fiscal quarter that have materially affected, or are reasonablylikely to materially affect, our internal control over financial reporting.
34
Table of Contents
Special Note Regarding Forward-LookingStatements and Analyst Reports
Certain written and oral statements, other than purely historic information, including estimates, projections, statements relating to NIKE’s business plans, objectives andexpected operating results and the assumptions upon which those statements are based, made or incorporated by reference from time to time by NIKE or its representatives inthis report, other reports, filings with the Securities and Exchange Commission, press releases, conferences or otherwise, are “forward-looking statements” within the meaningof the Private Securities Litigation Reform Act of 1995 and Section 21E of the Exchange Act. Forward-looking statements include, without limitation, any statement that maypredict, forecast, indicate, or imply future results, performance or achievements, and may contain the words “believe,” “anticipate,” “expect,” “estimate,” “project,” “will be,” “willcontinue,” “will likely result,” or words or phrases of similar meaning. Certain factors, including various risks and uncertainties, may cause actual results to differ materially fromthe forward-looking statements. The risks and uncertainties are detailed from time to time in reports filed by NIKE with the Securities and Exchange Commission, includingreports filed on Forms 8-K, 10-Q and 10-K, and include, among others, the following: international, national and local general economic and market conditions; the size andgrowth of the overall athletic footwear, apparel and equipment markets; intense competition among designers, marketers, distributors and sellers of athletic footwear, appareland equipment for consumers and endorsers; demographic changes; changes in consumer preferences; popularity of particular designs, categories of products and sports;seasonal and geographic demand for NIKE products; difficulties in anticipating or forecasting changes in consumer preferences, consumer demand for NIKE products and thevarious market factors described above; difficulties in implementing, operating and maintaining NIKE’s increasingly complex information systems and controls, including,without limitation, the systems related to demand and supply planning and inventory control; interruptions in data and information technology systems; consumer data security;fluctuations and difficulty in forecasting operating results, due to, among other factors, the timing of at-once orders and discounts, order cancellations and returns, andincreasing online and mobile commercial activity; the ability of NIKE to sustain, manage or forecast its growth and inventories; the size, timing and mix of purchases of NIKE’sproducts; increases in the cost of materials, labor and energy used to manufacture products, new product development and introduction; the ability of NIKE to secure andprotect trademarks, patents and other intellectual property; product performance and quality; customer service; adverse publicity; the loss of significant customers or suppliers;dependence on distributors and licensees; business disruptions; increased costs of freight and transportation to meet delivery deadlines; increases in borrowing costs due toany decline in NIKE’s debt ratings; changes in business strategy or development plans; general risks associated with doing business outside the United States, including,without limitation, exchange rate fluctuations, import duties, tariffs, quotas, political and economic instability and terrorism; changes in government regulations; the impact of,including business and legal developments relating to, climate change; natural disasters; liability and other claims asserted against NIKE; the ability to attract and retainqualified personnel; the effects of NIKE’s decision to invest in or divest of businesses; and other factors referenced or incorporated by reference in this report and other reports.
The risks included here are not exhaustive. Other sections of this report may include additional factors which could adversely affect NIKE’s business and financial performance.Moreover, NIKE operates in a very competitive and rapidly changing environment. New risks emerge from time to time and it is not possible for management to predict all suchrisks, nor can it assess the impact of all such risks on NIKE’s business or the extent to which any risk, or combination of risks, may cause actual results to differ materially fromthose contained in any forward-looking statements. Given these risks and uncertainties, investors should not place undue reliance on forward-looking statements as aprediction of actual results.
Investors should also be aware that while NIKE does, from time to time, communicate with securities analysts, it is against NIKE’s policy to disclose to them any material non-public information or other confidential commercial information. Accordingly, shareholders should not assume that NIKE agrees with any statement or report issued by anyanalyst irrespective of the content of the statement or report. Furthermore, NIKE has a policy against issuing or confirming financial forecasts or projections issued by others.Thus, to the extent that reports issued by securities analysts contain any projections, forecasts or opinions, such reports are not the responsibility of NIKE and may not reflectNIKE’s current views.
35

Table of Contents
PART II - OTHER INFORMATIONITEM 1. Legal ProceedingsThere have been no material developments with respect to the information previously reported under Part I, Item 3 of our Annual Report on Form 10-K for the fiscal year endedMay 31, 2017 .
ITEM 1A. Risk FactorsThere have been no material changes in our risk factors from those disclosed in Part I, Item 1A of our Annual Report on Form 10-K for the fiscal year ended May 31, 2017 .
ITEM 2. Unregistered Sales of Equity Securities and Use of ProceedsIn November 2015, the Board of Directors approved a four-year, $12 billion share repurchase program. As of August 31, 2017 , the Company had repurchased 95.0 millionshares at an average price of $55.64 per share for a total approximate cost of $5.3 billion under this program. We intend to use excess cash, future cash from operationsand/or proceeds from debt to fund repurchases.
The following table presents a summary of share repurchases made by NIKE under this program during the quarter ended August 31, 2017 :
Period Total Number of
Shares Purchased Average PricePaid per Share
Total Number of SharesPurchased as Part of Publicly
Announced Plans orPrograms
Maximum Number (or ApproximateDollar Value) of Shares that May Yet Be
Purchased Under the Plansor Programs (In millions)
June 1 — June 30, 2017 4,814,118 $ 53.01 4,814,118 $ 7,307
July 1 — July 31, 2017 2,494,988 $ 58.29 2,494,988 $ 7,162
August 1 — August 31, 2017 7,947,729 $ 56.46 7,947,729 $ 6,713
15,256,835 $ 55.67 15,256,835
36
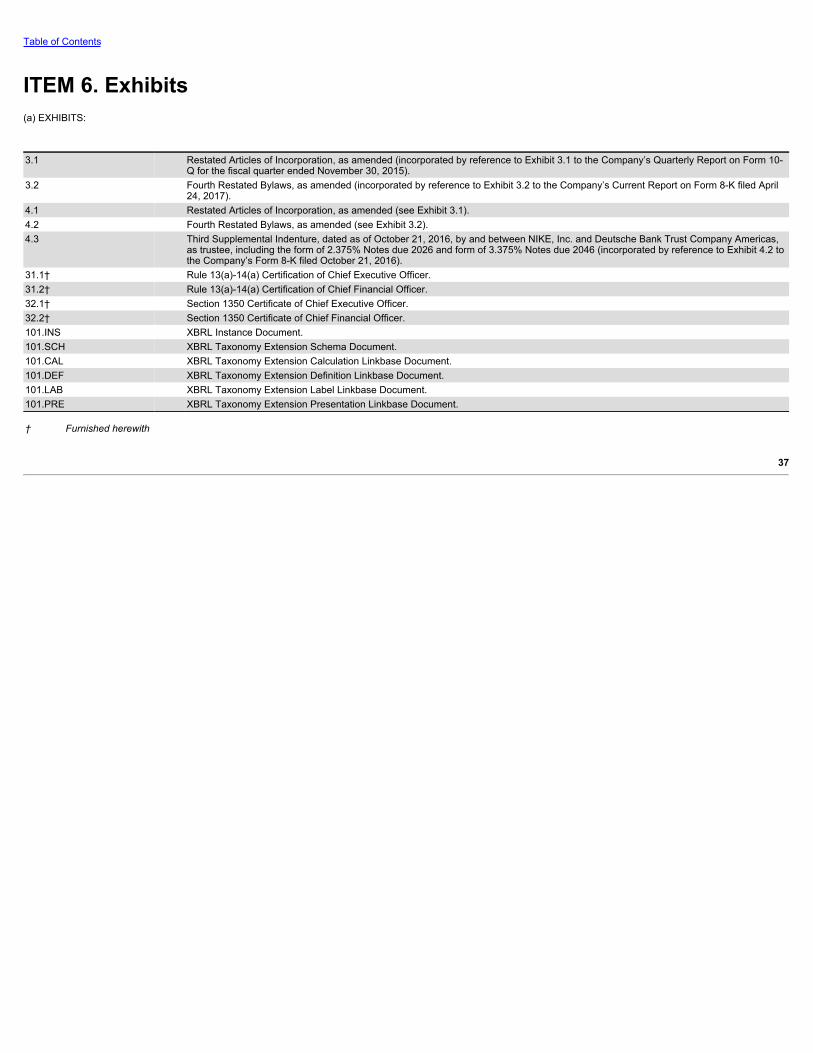
Table of Contents
ITEM 6. Exhibits(a) EXHIBITS:
3.1 Restated Articles of Incorporation, as amended (incorporated by reference to Exhibit 3.1 to the Company’s Quarterly Report on Form 10-
Q for the fiscal quarter ended November 30, 2015).3.2
Fourth Restated Bylaws, as amended (incorporated by reference to Exhibit 3.2 to the Company’s Current Report on Form 8-K filed April24, 2017).
4.1 Restated Articles of Incorporation, as amended (see Exhibit 3.1).4.2 Fourth Restated Bylaws, as amended (see Exhibit 3.2).4.3
Third Supplemental Indenture, dated as of October 21, 2016, by and between NIKE, Inc. and Deutsche Bank Trust Company Americas,as trustee, including the form of 2.375% Notes due 2026 and form of 3.375% Notes due 2046 (incorporated by reference to Exhibit 4.2 tothe Company’s Form 8-K filed October 21, 2016).
31.1† Rule 13(a)-14(a) Certification of Chief Executive Officer.31.2† Rule 13(a)-14(a) Certification of Chief Financial Officer.32.1† Section 1350 Certificate of Chief Executive Officer.32.2† Section 1350 Certificate of Chief Financial Officer.101.INS XBRL Instance Document.101.SCH XBRL Taxonomy Extension Schema Document.101.CAL XBRL Taxonomy Extension Calculation Linkbase Document.101.DEF XBRL Taxonomy Extension Definition Linkbase Document.101.LAB XBRL Taxonomy Extension Label Linkbase Document.101.PRE XBRL Taxonomy Extension Presentation Linkbase Document.
† Furnished herewith
37
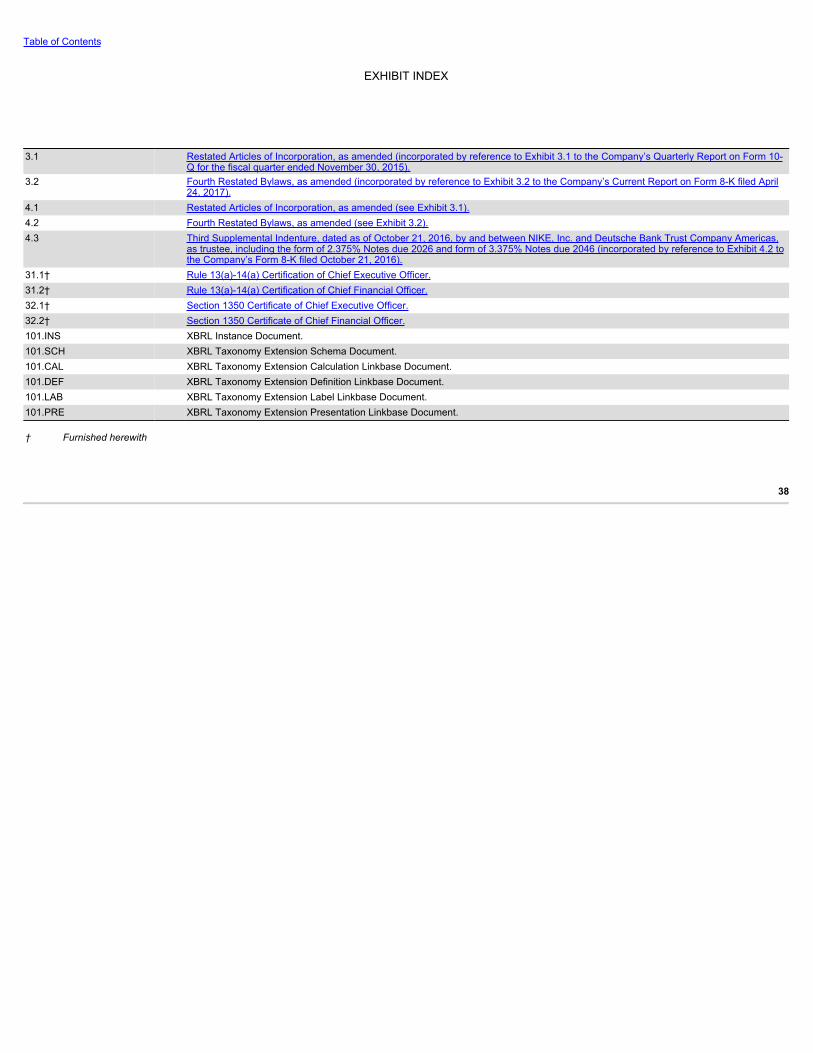
Table of Contents
EXHIBIT INDEX
3.1 Restated Articles of Incorporation, as amended (incorporated by reference to Exhibit 3.1 to the Company’s Quarterly Report on Form 10-
Q for the fiscal quarter ended November 30, 2015).3.2
Fourth Restated Bylaws, as amended (incorporated by reference to Exhibit 3.2 to the Company’s Current Report on Form 8-K filed April24, 2017).
4.1 Restated Articles of Incorporation, as amended (see Exhibit 3.1).4.2 Fourth Restated Bylaws, as amended (see Exhibit 3.2).4.3
Third Supplemental Indenture, dated as of October 21, 2016, by and between NIKE, Inc. and Deutsche Bank Trust Company Americas,as trustee, including the form of 2.375% Notes due 2026 and form of 3.375% Notes due 2046 (incorporated by reference to Exhibit 4.2 tothe Company’s Form 8-K filed October 21, 2016).
31.1† Rule 13(a)-14(a) Certification of Chief Executive Officer.31.2† Rule 13(a)-14(a) Certification of Chief Financial Officer.32.1† Section 1350 Certificate of Chief Executive Officer.32.2† Section 1350 Certificate of Chief Financial Officer.101.INS XBRL Instance Document.101.SCH XBRL Taxonomy Extension Schema Document.101.CAL XBRL Taxonomy Extension Calculation Linkbase Document.101.DEF XBRL Taxonomy Extension Definition Linkbase Document.101.LAB XBRL Taxonomy Extension Label Linkbase Document.101.PRE XBRL Taxonomy Extension Presentation Linkbase Document.
† Furnished herewith
38

Table of Contents
SignaturesPursuant to the requirements of the Securities Exchange Act of 1934, the registrant has duly caused this report to be signed on its behalf by the undersigned thereunto dulyauthorized.
NIKE, Inc.
an Oregon Corporation
/S/ ANDREW CAMPION
Andrew CampionChief Financial Officer and Authorized
Officer
DATED: October 6, 2017
39
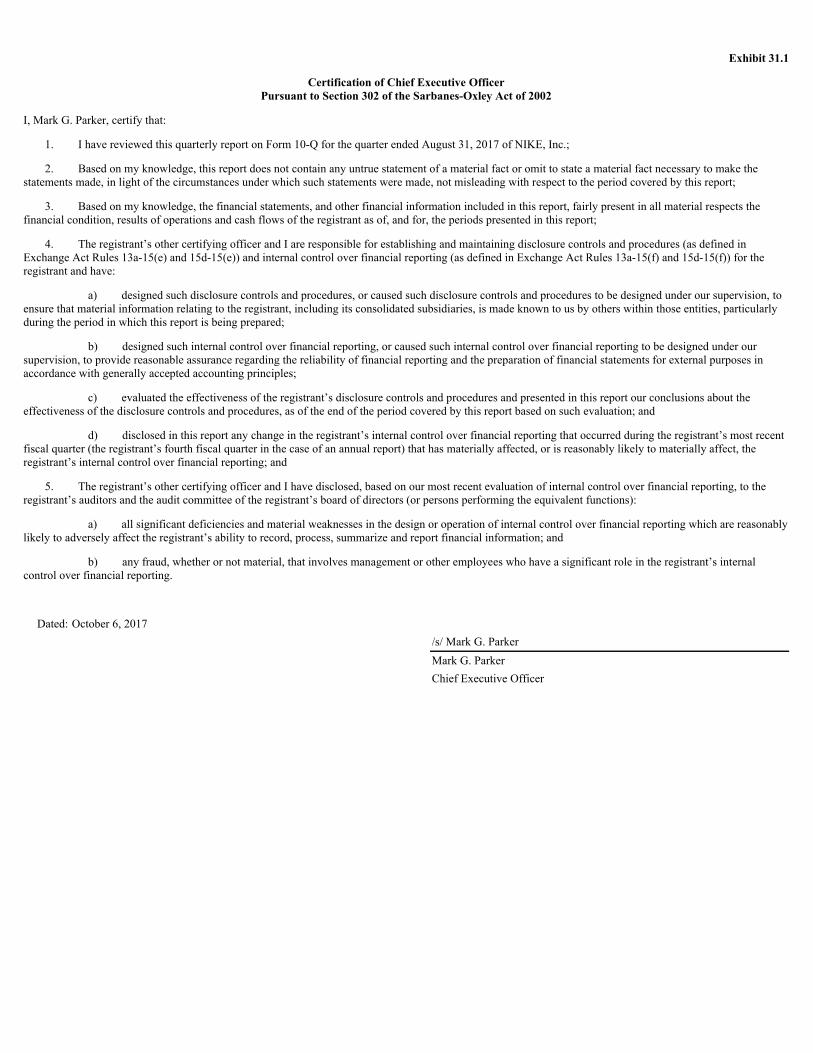
Exhibit 31.1
Certification of Chief Executive OfficerPursuant to Section 302 of the Sarbanes-Oxley Act of 2002
I, Mark G. Parker, certify that:
1. I have reviewed this quarterly report on Form 10-Q for the quarter ended August 31, 2017 of NIKE, Inc.;
2. Based on my knowledge, this report does not contain any untrue statement of a material fact or omit to state a material fact necessary to make thestatements made, in light of the circumstances under which such statements were made, not misleading with respect to the period covered by this report;
3. Based on my knowledge, the financial statements, and other financial information included in this report, fairly present in all material respects thefinancial condition, results of operations and cash flows of the registrant as of, and for, the periods presented in this report;
4. The registrant’s other certifying officer and I are responsible for establishing and maintaining disclosure controls and procedures (as defined inExchange Act Rules 13a-15(e) and 15d-15(e)) and internal control over financial reporting (as defined in Exchange Act Rules 13a-15(f) and 15d-15(f)) for theregistrant and have:
a) designed such disclosure controls and procedures, or caused such disclosure controls and procedures to be designed under our supervision, toensure that material information relating to the registrant, including its consolidated subsidiaries, is made known to us by others within those entities, particularlyduring the period in which this report is being prepared;
b) designed such internal control over financial reporting, or caused such internal control over financial reporting to be designed under oursupervision, to provide reasonable assurance regarding the reliability of financial reporting and the preparation of financial statements for external purposes inaccordance with generally accepted accounting principles;
c) evaluated the effectiveness of the registrant’s disclosure controls and procedures and presented in this report our conclusions about theeffectiveness of the disclosure controls and procedures, as of the end of the period covered by this report based on such evaluation; and
d) disclosed in this report any change in the registrant’s internal control over financial reporting that occurred during the registrant’s most recentfiscal quarter (the registrant’s fourth fiscal quarter in the case of an annual report) that has materially affected, or is reasonably likely to materially affect, theregistrant’s internal control over financial reporting; and
5. The registrant’s other certifying officer and I have disclosed, based on our most recent evaluation of internal control over financial reporting, to theregistrant’s auditors and the audit committee of the registrant’s board of directors (or persons performing the equivalent functions):
a) all significant deficiencies and material weaknesses in the design or operation of internal control over financial reporting which are reasonablylikely to adversely affect the registrant’s ability to record, process, summarize and report financial information; and
b) any fraud, whether or not material, that involves management or other employees who have a significant role in the registrant’s internalcontrol over financial reporting.
Dated: October 6, 2017 /s/ Mark G. Parker Mark G. Parker Chief Executive Officer

Exhibit 31.2
Certification of Chief Financial OfficerPursuant to Section 302 of the Sarbanes-Oxley Act of 2002
I, Andrew Campion, certify that:
1. I have reviewed this quarterly report on Form 10-Q for the quarter ended August 31, 2017 of NIKE, Inc.;
2. Based on my knowledge, this report does not contain any untrue statement of a material fact or omit to state a material fact necessary to make thestatements made, in light of the circumstances under which such statements were made, not misleading with respect to the period covered by this report;
3. Based on my knowledge, the financial statements, and other financial information included in this report, fairly present in all material respects thefinancial condition, results of operations and cash flows of the registrant as of, and for, the periods presented in this report;
4. The registrant’s other certifying officer and I are responsible for establishing and maintaining disclosure controls and procedures (as defined inExchange Act Rules 13a-15(e) and 15d-15(e)) and internal control over financial reporting (as defined in Exchange Act Rules 13a-15(f) and 15d-15(f)) for theregistrant and have:
a) designed such disclosure controls and procedures, or caused such disclosure controls and procedures to be designed under our supervision, toensure that material information relating to the registrant, including its consolidated subsidiaries, is made known to us by others within those entities, particularlyduring the period in which this report is being prepared;
b) designed such internal control over financial reporting, or caused such internal control over financial reporting to be designed under oursupervision, to provide reasonable assurance regarding the reliability of financial reporting and the preparation of financial statements for external purposes inaccordance with generally accepted accounting principles;
c) evaluated the effectiveness of the registrant’s disclosure controls and procedures and presented in this report our conclusions about theeffectiveness of the disclosure controls and procedures, as of the end of the period covered by this report based on such evaluation; and
d) disclosed in this report any change in the registrant’s internal control over financial reporting that occurred during the registrant’s most recentfiscal quarter (the registrant’s fourth fiscal quarter in the case of an annual report) that has materially affected, or is reasonably likely to materially affect, theregistrant’s internal control over financial reporting; and
5. The registrant’s other certifying officer and I have disclosed, based on our most recent evaluation of internal control over financial reporting, to theregistrant’s auditors and the audit committee of the registrant’s board of directors (or persons performing the equivalent functions):
a) all significant deficiencies and material weaknesses in the design or operation of internal control over financial reporting which are reasonablylikely to adversely affect the registrant’s ability to record, process, summarize and report financial information; and
b) any fraud, whether or not material, that involves management or other employees who have a significant role in the registrant’s internalcontrol over financial reporting.
Dated: October 6, 2017 /s/ Andrew Campion Andrew Campion Chief Financial Officer

Exhibit 32
Pursuant to 18 U.S.C. Section 1350, as adopted pursuant to Section 906 of the Sarbanes-Oxley Act of 2002, the following certifications are being made toaccompany the Registrant’s quarterly report on Form 10-Q for the fiscal quarter ended August 31, 2017 .
Certification of Chief Executive Officer
Pursuant to 18 U.S.C. Section 1350, as adopted pursuant to Section 906 of the Sarbanes-Oxley Act of 2002, the undersigned officer of NIKE, Inc. (the“Company”) hereby certifies, to such officer’s knowledge, that:
(i) the Quarterly Report on Form 10-Q of the Company for the fiscal quarter ended August 31, 2017 (the “Report”) fully complies with the requirements ofSection 13(a) or Section 15(d), as applicable, of the Securities Exchange Act of 1934, as amended; and
(ii) the information contained in the Report fairly presents, in all material respects, the financial condition and results of operations of the Company.
Dated: October 6, 2017 /s/ Mark G. Parker Mark G. Parker Chief Executive Officer

Pursuant to 18 U.S.C. Section 1350, as adopted pursuant to Section 906 of the Sarbanes-Oxley Act of 2002, the following certifications are being made toaccompany the Registrant’s quarterly report on Form 10-Q for the fiscal quarter ended August 31, 2017 .
Certification of Chief Financial Officer
Pursuant to 18 U.S.C. Section 1350, as adopted pursuant to Section 906 of the Sarbanes-Oxley Act of 2002, the undersigned officer of NIKE, Inc. (the“Company”) hereby certifies, to such officer’s knowledge, that:
(i) the Quarterly Report on Form 10-Q of the Company for the fiscal quarter ended August 31, 2017 (the “Report”) fully complies with the requirements ofSection 13(a) or Section 15(d), as applicable, of the Securities Exchange Act of 1934, as amended; and
(ii) the information contained in the Report fairly presents, in all material respects, the financial condition and results of operations of the Company.
Dated: October 6, 2017 /s/ Andrew Campion Andrew Campion Chief Financial Officer