nike 2009 annual report
TRANSCRIPT

SECURITIES AND EXCHANGE COMMISSIONWashington, D.C. 20549
Form 10-K(Mark One)
Í ANNUAL REPORT PURSUANT TO SECTION 13 OR 15(d)OF THE SECURITIES EXCHANGE ACT OF 1934
For the fiscal year ended May 31, 2009or
‘ TRANSITION REPORT PURSUANT TO SECTION 13 OR 15(d)OF THE SECURITIES EXCHANGE ACT OF 1934
For the transition period from to .Commission File No. 1-10635
NIKE, Inc.(Exact name of Registrant as specified in its charter)
Oregon 93-0584541(State or other jurisdiction
of incorporation)(IRS Employer
Identification No.)
One Bowerman Drive (503) 671-6453Beaverton, Oregon 97005-6453 (Registrant’s Telephone Number, Including Area Code)
(Address of principal executive offices) (Zip Code)
Securities registered pursuant to Section 12(b) of the Act:Class B Common Stock New York Stock Exchange
(Title of Each Class) (Name of Each Exchange on Which Registered)
Securities registered pursuant to Section 12(g) of the Act:None
Indicate by check mark if the registrant is a well-known seasoned issuer, as defined in Rule 405 of the SecuritiesAct. Yes Í No ‘
Indicate by check mark if the registrant is not required to file reports pursuant to Section 13 or Section 15(d) of theAct. Yes ‘ No Í
Indicate by check mark whether the Registrant (1) has filed all reports required to be filed by Section 13 or 15(d) of theSecurities Exchange Act of 1934 during the preceding 12 months (or for such shorter period that the Registrant was required to filesuch reports), and (2) has been subject to such filing requirements for the past 90 days. Yes Í No ‘
Indicate by check mark whether the registrant has submitted electronically and posted on its corporate Website, if any, everyInteractive Data File required to be submitted and posted pursuant to Rule 405 of Regulation S-T (§229.405 of this chapter) during thepreceding 12 months (or for such shorter period that the registrant was required to submit and post such files). Yes ‘ No ‘
Indicate by check mark if disclosure of delinquent filers pursuant to Item 405 of Regulation S-K (§229.405 of this chapter) isnot contained herein, and will not be contained, to the best of Registrant’s knowledge, in definitive proxy or information statementsincorporated by reference in Part III of this Form 10-K or any amendment to this Form 10-K. Í
Indicate by check mark whether the Registrant is a large accelerated filer, an accelerated filer, a non-accelerated filer, or asmaller reporting company. See definitions of “large accelerated filer,” “accelerated filer” “non-accelerated filer” and “smallerreporting company” in Rule 12b-2 of the Exchange Act.
Large accelerated filer Í Accelerated filer ‘Non-accelerated filer ‘ Smaller Reporting Company ‘
Indicate by check mark whether the registrant is a shell company (as defined in Rule 12b-2 of the Act). Yes ‘ No Í
As of November 30, 2008, the aggregate market value of the Registrant’s Class A Common Stock held by nonaffiliates of theRegistrant was $221,932,688 and the aggregate market value of the Registrant’s Class B Common Stock held by nonaffiliates ofthe Registrant was $20,688,140,567.
As of July 24, 2009, the number of shares of the Registrant’s Class A Common Stock outstanding was 95,299,318 and thenumber of shares of the Registrant’s Class B Common Stock outstanding was 390,631,331.
DOCUMENTS INCORPORATED BY REFERENCE:Parts of Registrant’s Proxy Statement for the annual meeting of shareholders to be held on September 21, 2009 are
incorporated by reference into Part III of this Report.

NIKE, INC.
ANNUAL REPORT ON FORM 10-K
TABLE OF CONTENTS
Page
PART IItem 1. Business . . . . . . . . . . . . . . . . . . . . . . . . . . . . . . . . . . . . . . . . . . . . . . . . . . . . . . . . . . . . . . . . . . . 1
General . . . . . . . . . . . . . . . . . . . . . . . . . . . . . . . . . . . . . . . . . . . . . . . . . . . . . . . . . . . . . . . . . . . . 1Products . . . . . . . . . . . . . . . . . . . . . . . . . . . . . . . . . . . . . . . . . . . . . . . . . . . . . . . . . . . . . . . . . . . 1Sales and Marketing . . . . . . . . . . . . . . . . . . . . . . . . . . . . . . . . . . . . . . . . . . . . . . . . . . . . . . . . . . 2United States Market . . . . . . . . . . . . . . . . . . . . . . . . . . . . . . . . . . . . . . . . . . . . . . . . . . . . . . . . . 2International Markets . . . . . . . . . . . . . . . . . . . . . . . . . . . . . . . . . . . . . . . . . . . . . . . . . . . . . . . . . 3Significant Customer . . . . . . . . . . . . . . . . . . . . . . . . . . . . . . . . . . . . . . . . . . . . . . . . . . . . . . . . . 4Orders . . . . . . . . . . . . . . . . . . . . . . . . . . . . . . . . . . . . . . . . . . . . . . . . . . . . . . . . . . . . . . . . . . . . . 4Product Research and Development . . . . . . . . . . . . . . . . . . . . . . . . . . . . . . . . . . . . . . . . . . . . . . 4Manufacturing . . . . . . . . . . . . . . . . . . . . . . . . . . . . . . . . . . . . . . . . . . . . . . . . . . . . . . . . . . . . . . 4International Operations and Trade . . . . . . . . . . . . . . . . . . . . . . . . . . . . . . . . . . . . . . . . . . . . . . 5Competition . . . . . . . . . . . . . . . . . . . . . . . . . . . . . . . . . . . . . . . . . . . . . . . . . . . . . . . . . . . . . . . . 6Trademarks and Patents . . . . . . . . . . . . . . . . . . . . . . . . . . . . . . . . . . . . . . . . . . . . . . . . . . . . . . . 7Employees . . . . . . . . . . . . . . . . . . . . . . . . . . . . . . . . . . . . . . . . . . . . . . . . . . . . . . . . . . . . . . . . . 7Executive Officers of the Registrant . . . . . . . . . . . . . . . . . . . . . . . . . . . . . . . . . . . . . . . . . . . . . 7
Item 1A. Risk Factors . . . . . . . . . . . . . . . . . . . . . . . . . . . . . . . . . . . . . . . . . . . . . . . . . . . . . . . . . . . . . . . . 9Item 1B. Unresolved Staff Comments . . . . . . . . . . . . . . . . . . . . . . . . . . . . . . . . . . . . . . . . . . . . . . . . . . . 17Item 2. Properties . . . . . . . . . . . . . . . . . . . . . . . . . . . . . . . . . . . . . . . . . . . . . . . . . . . . . . . . . . . . . . . . . . 17Item 3. Legal Proceedings . . . . . . . . . . . . . . . . . . . . . . . . . . . . . . . . . . . . . . . . . . . . . . . . . . . . . . . . . . . 18Item 4. Submission of Matters to a Vote of Security Holders . . . . . . . . . . . . . . . . . . . . . . . . . . . . . . . . 18
PART IIItem 5. Market for Registrant’s Common Equity, Related Stockholder Matters and Issuer Purchases
of Equity Securities . . . . . . . . . . . . . . . . . . . . . . . . . . . . . . . . . . . . . . . . . . . . . . . . . . . . . . . . . . 19Item 6. Selected Financial Data . . . . . . . . . . . . . . . . . . . . . . . . . . . . . . . . . . . . . . . . . . . . . . . . . . . . . . . 21Item 7. Management’s Discussion and Analysis of Financial Condition and Results of Operations . . 22Item 7A. Quantitative and Qualitative Disclosures about Market Risk . . . . . . . . . . . . . . . . . . . . . . . . . . 48Item 8. Financial Statements and Supplemental Data . . . . . . . . . . . . . . . . . . . . . . . . . . . . . . . . . . . . . . 50Item 9. Changes in and Disagreements with Accountants on Accounting and Financial Disclosure . . 88Item 9A. Controls and Procedures . . . . . . . . . . . . . . . . . . . . . . . . . . . . . . . . . . . . . . . . . . . . . . . . . . . . . . . 88Item 9B. Other Information . . . . . . . . . . . . . . . . . . . . . . . . . . . . . . . . . . . . . . . . . . . . . . . . . . . . . . . . . . . . 88
PART III(Except for the information set forth under “Executive Officers of the Registrant” in Item 1above, Part III is incorporated by reference from the Proxy Statement for the NIKE, Inc.2009 annual meeting of shareholders.)
Item 10. Directors, Executive Officers and Corporate Governance . . . . . . . . . . . . . . . . . . . . . . . . . . . . . 89Item 11. Executive Compensation . . . . . . . . . . . . . . . . . . . . . . . . . . . . . . . . . . . . . . . . . . . . . . . . . . . . . . 89Item 12. Security Ownership of Certain Beneficial Owners and Management and Related Stockholder
Matters . . . . . . . . . . . . . . . . . . . . . . . . . . . . . . . . . . . . . . . . . . . . . . . . . . . . . . . . . . . . . . . . . . . . 89Item 13. Certain Relationships and Related Transactions, and Director Independence . . . . . . . . . . . . . . 89Item 14. Principal Accountant Fees and Services . . . . . . . . . . . . . . . . . . . . . . . . . . . . . . . . . . . . . . . . . . 89
PART IVItem 15. Exhibits, Financial Statement Schedules . . . . . . . . . . . . . . . . . . . . . . . . . . . . . . . . . . . . . . . . . . 90
Signatures . . . . . . . . . . . . . . . . . . . . . . . . . . . . . . . . . . . . . . . . . . . . . . . . . . . . . . . . . . . . . . . . . . S-1

PART I
Item 1. Business
General
NIKE, Inc. was incorporated in 1968 under the laws of the state of Oregon. As used in this report, the terms“we”, “us”, “NIKE” and the “Company” refer to NIKE, Inc. and its predecessors, subsidiaries and affiliates,unless the context indicates otherwise. Our Internet address is www.nike.com. On our NIKE Corporate web site,located at www.nikebiz.com, we post the following filings as soon as reasonably practicable after they areelectronically filed with or furnished to the Securities and Exchange Commission: our annual report onForm 10-K, our quarterly reports on Form 10-Q, our current reports on Form 8-K and any amendments to thosereports filed or furnished pursuant to Section 13(a) or 15(d) of the Securities and Exchange Act of 1934, asamended. All such filings on our NIKE Corporate web site are available free of charge. Also available on theNIKE Corporate web site are the charters of the committees of our board of directors, as well as our corporategovernance guidelines and code of ethics; copies of any of these documents will be provided in print to anyshareholder who submits a request in writing to NIKE Investor Relations, One Bowerman Drive, Beaverton,Oregon 97005-6453.
Our principal business activity is the design, development and worldwide marketing of high qualityfootwear, apparel, equipment, and accessory products. NIKE is the largest seller of athletic footwear and athleticapparel in the world. We sell our products to retail accounts, through NIKE-owned retail including stores andinternet sales, and through a mix of independent distributors and licensees, in over 170 countries around theworld. Virtually all of our products are manufactured by independent contractors. Virtually all footwear andapparel products are produced outside the United States, while equipment products are produced both in theUnited States and abroad.
Products
NIKE’s athletic footwear products are designed primarily for specific athletic use, although a largepercentage of the products are worn for casual or leisure purposes. We place considerable emphasis on highquality construction and innovation in products designed for men, women and children. Running, training,basketball, soccer, sport-inspired casual shoes, and kids’ shoes are currently our top-selling footwear categoriesand we expect them to continue to lead in product sales in the near future. We also market footwear designed foraquatic activities, baseball, cheerleading, football, golf, lacrosse, outdoor activities, skateboarding, tennis,volleyball, walking, wrestling, and other athletic and recreational uses.
We sell sports apparel and accessories covering most of the above categories, sports-inspired lifestyleapparel, as well as athletic bags and accessory items. NIKE apparel and accessories are designed to complementour athletic footwear products, feature the same trademarks and are sold through the same marketing anddistribution channels. We often market footwear, apparel and accessories in “collections” of similar design or forspecific purposes. We also market apparel with licensed college and professional team and league logos.
We sell a line of performance equipment under the NIKE brand name, including bags, socks, sport balls,eyewear, timepieces, electronic devices, bats, gloves, protective equipment, golf clubs, and other equipmentdesigned for sports activities. We also sell small amounts of various plastic products to other manufacturersthrough our wholly-owned subsidiary, NIKE IHM, Inc.
In addition to the products we sell directly to customers, we have entered into license agreements that permitunaffiliated parties to manufacture and sell various apparel, equipment and accessory items, such as swimwear,children’s apparel, training equipment, eyewear, electronic devices and golf accessories.
Our wholly-owned subsidiary, Cole Haan (“Cole Haan”), headquartered in Yarmouth, Maine, designs anddistributes dress and casual footwear, apparel and accessories for men and women under the brand names ColeHaan® and Bragano®.
1
Our wholly-owned subsidiary, Converse Inc. (“Converse”), headquartered in North Andover,Massachusetts, designs, distributes, and licenses athletic and casual footwear, apparel and accessories under theConverse®, Chuck Taylor®, All Star®, One Star®, and Jack Purcell® trademarks.
Our wholly-owned subsidiary, Hurley International LLC (“Hurley”), headquartered in Costa Mesa,California, designs and distributes a line of action sports apparel for surfing, skateboarding, and snowboarding,youth lifestyle apparel, and accessories under the Hurley® trademark.
Our wholly-owned subsidiary, Umbro Ltd. (“Umbro”), headquartered in Manchester, England, designs,distributes and licenses athletic and casual footwear, apparel and equipment, primarily for the sport of soccer,under the Umbro® trademarks.
Sales and Marketing
Financial information about geographic and segment operations appears in Note 19 of the accompanyingconsolidated financial statements on page 85.
We experience moderate fluctuations in aggregate sales volume during the year. Historically, revenues inthe first and fourth fiscal quarters have slightly exceeded those in the second and third quarters. However, themix of product sales may vary considerably as a result of changes in seasonal and geographic demand forparticular types of footwear, apparel and equipment.
Because NIKE is a consumer products company, the relative popularity of various sports and fitnessactivities and changing design trends affect the demand for our products. We must therefore respond to trendsand shifts in consumer preferences by adjusting the mix of existing product offerings, developing new products,styles and categories, and influencing sports and fitness preferences through aggressive marketing. Failure torespond in a timely and adequate manner could have a material adverse effect on our sales and profitability. Thisis a continuing risk.
We report our NIKE brand operations based on our internal geographic organization. Each NIKE brandgeography operates predominantly in one industry: the design, production, marketing and selling of sports andfitness footwear, apparel, and equipment. The geographic organization consists of the following fourregions: U.S., Europe, Middle East and Africa (collectively, “EMEA”), Asia Pacific, and Americas. Aspreviously announced, in the fourth quarter of fiscal 2009, we initiated a reorganization of the NIKE brand into anew model consisting of six geographies. As a result of the reorganization, beginning in the first quarter of fiscal2010, our new organizational structure will consist of the following geographies: North America, WesternEurope, Central/Eastern Europe, Greater China, Japan, and Emerging Markets.
United States Market
In fiscal 2009, sales in the United States including U.S. sales of our Other businesses accounted forapproximately 42% of total revenues, compared to 43% in fiscal 2008 and 47% in fiscal 2007. For fiscal 2009,our Other businesses were primarily comprised of Cole Haan, Converse, Hurley, NIKE Golf and Umbro (whichwas acquired on March 3, 2008). For fiscal 2008 and 2007, our Other businesses were primarily comprised ofCole Haan, Converse, Exeter (whose primary business was the Starter brand business which was sold onDecember 17, 2007), Hurley, NIKE Bauer Hockey (which was sold on April 17, 2008), NIKE Golf and Umbro.We estimate that we sell to more than 23,000 retail accounts in the United States. The NIKE brand domesticretail account base includes a mix of footwear stores, sporting goods stores, athletic specialty stores, departmentstores, skate, tennis and golf shops, and other retail accounts. During fiscal 2009, our three largest customersaccounted for approximately 25% of sales in the United States.
We make substantial use of our “futures” ordering program, which allows retailers to order five tosix months in advance of delivery with the commitment that their orders will be delivered within a set time
2

period at a fixed price. In fiscal 2009, 89% of our U.S. wholesale footwear shipments (excluding our Otherbusinesses) were made under the futures program, compared to 90% in fiscal 2008 and fiscal 2007. In fiscal2009, 60% of our U.S. wholesale apparel shipments (excluding our Other businesses) were made under thefutures program, compared to 62% in fiscal 2008 and 65% in fiscal 2007.
We utilize 20 NIKE sales offices to solicit sales in the United States. We also utilize 5 independent salesrepresentatives to sell specialty products for golf, and 3 for skateboarding and outdoor products. In addition, wesell NIKE brand products through our internet website, www.nikestore.com, and we operate the following retailoutlets in the United States:
U.S. Retail Stores Number
NIKE factory stores (which carry primarily overstock and close-out merchandise) . . . . . . . . 140NIKE stores (including one NIKE Women store) . . . . . . . . . . . . . . . . . . . . . . . . . . . . . . . . . . . 16NIKETOWNs (designed to showcase NIKE products) . . . . . . . . . . . . . . . . . . . . . . . . . . . . . . . 11NIKE employee-only stores . . . . . . . . . . . . . . . . . . . . . . . . . . . . . . . . . . . . . . . . . . . . . . . . . . . . 3Cole Haan stores (including factory stores) . . . . . . . . . . . . . . . . . . . . . . . . . . . . . . . . . . . . . . . . 111Converse factory stores . . . . . . . . . . . . . . . . . . . . . . . . . . . . . . . . . . . . . . . . . . . . . . . . . . . . . . . 43Hurley stores (including factory and employee stores) . . . . . . . . . . . . . . . . . . . . . . . . . . . . . . . 14
Total . . . . . . . . . . . . . . . . . . . . . . . . . . . . . . . . . . . . . . . . . . . . . . . . . . . . . . . . . . . . . . 338
NIKE’s three United States distribution centers for footwear are located in Memphis, Tennessee. Appareland equipment products are shipped from our Memphis, Tennessee, and Foothill Ranch, California distributioncenters. Cole Haan products are distributed primarily from Greenland, New Hampshire, Converse products areshipped primarily from Ontario, California, and Hurley products are distributed from Irvine, California.
International Markets
In fiscal 2009, non-U.S. sales (including non-U.S. sales of our Other businesses) accounted for 58% of totalrevenues, compared to 57% in fiscal 2008 and 53% in fiscal 2007. We sell our products to retail accounts,through NIKE-owned retail stores, and through a mix of independent distributors and licensees around the world.We estimate that we sell to more than 28,000 retail accounts outside the United States, excluding sales byindependent distributors and licensees. We operate 14 distribution centers outside of the United States. In manycountries and regions, including Canada, Asia, some Latin American countries, and Europe, we have a futuresordering program for retailers similar to the United States futures program described above. NIKE’s three largestcustomers outside of the U.S. accounted for approximately 11% of total non-U.S. sales.
We operate the following retail outlets outside the United States:
Non-U.S. Retail Stores Number
NIKE factory stores . . . . . . . . . . . . . . . . . . . . . . . . . . . . . . . . . . . . . . . . . . . . . . . . . . . . . . . . . . 184NIKE stores . . . . . . . . . . . . . . . . . . . . . . . . . . . . . . . . . . . . . . . . . . . . . . . . . . . . . . . . . . . . . . . . 61NIKETOWNs . . . . . . . . . . . . . . . . . . . . . . . . . . . . . . . . . . . . . . . . . . . . . . . . . . . . . . . . . . . . . . 4NIKE employee-only stores . . . . . . . . . . . . . . . . . . . . . . . . . . . . . . . . . . . . . . . . . . . . . . . . . . . . 12Cole Haan stores . . . . . . . . . . . . . . . . . . . . . . . . . . . . . . . . . . . . . . . . . . . . . . . . . . . . . . . . . . . . 74Hurley stores . . . . . . . . . . . . . . . . . . . . . . . . . . . . . . . . . . . . . . . . . . . . . . . . . . . . . . . . . . . . . . . 1
Total . . . . . . . . . . . . . . . . . . . . . . . . . . . . . . . . . . . . . . . . . . . . . . . . . . . . . . . . . . . . . . 336
International branch offices and subsidiaries of NIKE are located in Argentina, Australia, Austria, Belgium,Bermuda, Brazil, Canada, Chile, Croatia, Cyprus, the Czech Republic, Denmark, Finland, France, Germany,Greece, Hong Kong, Hungary, Indonesia, India, Ireland, Israel, Italy, Japan, Korea, Lebanon, Macau, Malaysia,
3

Mexico, New Zealand, the Netherlands, Norway, the People’s Republic of China, the Philippines, Poland,Portugal, Russia, Singapore, Slovakia, Slovenia, South Africa, Spain, Sri Lanka, Sweden, Switzerland, Taiwan,Thailand, Turkey, the United Arab Emirates, the United Kingdom, Uruguay and Vietnam.
Significant Customer
No customer accounted for 10% or more of our net sales during fiscal 2009.
Orders
Worldwide futures and advance orders for NIKE brand athletic footwear and apparel, scheduled for deliveryfrom June through November 2009, were $7.8 billion compared to $8.8 billion for the same period last year. Thisfutures and advance order amount is calculated based upon our forecast of the actual exchange rates under whichour revenues will be translated during this period, which approximate current spot rates. Reported futures andadvance orders are not necessarily indicative of our expectation of revenues for this period. This is because themix of orders can shift between advance/futures and at-once orders and the fulfillment of certain of theseadvance/futures orders may fall outside of the scheduled time period noted above. In addition, foreign currencyexchange rate fluctuations as well as differing levels of order cancellations and discounts can cause differences inthe comparisons between futures and advance orders and actual revenues. Moreover, a significant portion of ourrevenue is not derived from futures and advance orders, including at-once and close-out sales of NIKE footwearand apparel, wholesale sales of equipment, Cole Haan, Converse, Hurley, Umbro, NIKE Golf, and retail salesacross all brands.
Product Research and Development
We believe our research and development efforts are a key factor in our past and future success. Technicalinnovation in the design of footwear, apparel, and athletic equipment receive continued emphasis as NIKE strivesto produce products that help to reduce injury, enhance athletic performance and maximize comfort.
In addition to NIKE’s own staff of specialists in the areas of biomechanics, chemistry, exercise physiology,engineering, industrial design and related fields, we also utilize research committees and advisory boards madeup of athletes, coaches, trainers, equipment managers, orthopedists, podiatrists and other experts who consultwith us and review designs, materials and concepts for product improvement. Employee athletes, athletesengaged under sports marketing contracts and other athletes wear-test and evaluate products during the designand development process.
Manufacturing
Virtually all of our footwear is produced outside of the United States. In fiscal 2009, contract suppliers inChina, Vietnam, Indonesia and Thailand manufactured 36%, 36%, 22% and 6% of total NIKE brand footwear,respectively. We also have manufacturing agreements with independent factories in Argentina, Brazil, India, andMexico to manufacture footwear for sale primarily within those countries. Our largest single footwear factoryaccounted for approximately 5% of total fiscal 2009 footwear production.
Almost all of NIKE brand apparel is manufactured outside of the United States by independent contractmanufacturers located in 34 countries. Most of this apparel production occurred in China, Thailand, Indonesia,Malaysia, Vietnam, Turkey, Sri Lanka, Cambodia, Taiwan, El Salvador, Mexico, India and Israel. Our largestsingle apparel factory accounted for approximately 5% of total fiscal 2009 apparel production.
The principal materials used in our footwear products are natural and synthetic rubber, plastic compounds,foam cushioning materials, nylon, leather, canvas and polyurethane films used to make Air-Sole cushioningcomponents. During fiscal 2009, NIKE IHM, Inc. and NIKE (Suzhou) Sports Company, Ltd., both
4

wholly-owned subsidiaries of NIKE, and independent contractors in China and Taiwan, were our largestsuppliers of the Air-Sole cushioning components used in footwear. The principal materials used in our apparelproducts are natural and synthetic fabrics and threads, plastic and metal hardware, and specialized performancefabrics designed to repel rain, retain heat, or efficiently transport body moisture. NIKE’s contractors andsuppliers buy raw materials in bulk. Most raw materials are available in the countries where manufacturing takesplace. We have thus far experienced little difficulty in satisfying our raw material requirements.
Since 1972, Sojitz Corporation of America (“Sojitz America”), a large Japanese trading company, hasperformed significant import-export financing services for us. During fiscal 2009, Sojitz America providedfinancing and purchasing services for NIKE brand products sold in Argentina, Uruguay, Canada, Chile, Brazil,India, Indonesia, the Philippines, Malaysia, South Africa, China, Korea, and Thailand, excluding productsproduced and sold in the same country. Approximately 16% of NIKE brand sales occurred in those countries.Any failure of Sojitz America to provide these services or any failure of Sojitz America’s banks could disrupt ourability to acquire products from our suppliers and to deliver products to our customers outside of the UnitedStates, EMEA and Japan. Such a disruption could result in cancelled orders that would adversely affect sales andprofitability. However, we believe that any such disruption would be short-term in duration due to the readyavailability of alternative sources of financing at competitive rates. Our current agreements with Sojitz Americaexpire in 2011.
International Operations and Trade
Our international operations and sources of supply are subject to the usual risks of doing business abroad,such as possible revaluation of currencies, export and import duties, anti-dumping measures, quotas, safeguardmeasures, trade restrictions, restrictions on the transfer of funds and, in certain parts of the world, politicalinstability and terrorism. We have not, to date, been materially affected by any such risk, but cannot predict thelikelihood of such developments occurring.
The global economic crisis has resulted in a significant slow down in international trade and a sharp rise inprotectionist actions around the world. These trends are affecting many global manufacturing and service sectors,and the footwear and apparel industries, as a whole, are not immune. Companies in our industry are facing tradeprotectionist challenges in many different regions, and in nearly all cases we are working together to addresstrade issues to reduce the impact to the industry, while observing applicable competition laws. Notwithstandingour efforts, such actions, if implemented, could result in increases in the cost of our products, which couldadversely affect our sales or profitability and the imported footwear and apparel industry as a whole.Accordingly, we are actively monitoring the developments described below.
Footwear Imports into the European Union
In 2005, at the request of the European domestic footwear industry, the European Commission (“EC”)initiated investigations into leather footwear imported from China and Vietnam. Together with other companiesin our industry, we took the position that Special Technology Athletic Footwear (STAF) (i) should not be withinthe scope of the investigation, and (ii) does not meet the legal requirements of injury and price in an anti-dumping investigation. Our arguments were successful and the EU agreed in October 2006 on definitive duties of16.5% for China and 10% for Vietnam for non-STAF leather footwear, but excluded STAF from the finalmeasures. Prior to the scheduled expiration in October 2008 of the measures imposed on the non-STAF footwear,the domestic industry requested and the EC agreed to review a petition to extend these restrictions on non-STAFleather footwear. We are working in broad coalition with other companies in our industry to challenge thisrequest for extension, and we expect a decision by the end of calendar year 2009 or early 2010.
Footwear Imports into Brazil and Argentina
At the request of certain domestic footwear industries, both Brazil and Argentina have initiated independentanti-dumping investigations against footwear made in China. We are working in broad coalition with othercompanies in our industry to challenge these cases on the basis that the athletic footwear being imported from
5

China (i) should not be within the scope of the investigation, and (ii) does not meet the legal requirements ofinjury and price in an anti-dumping investigation. We anticipate final decisions in both cases will be made in late2009.
Footwear Imports into Turkey
In 2006, Turkey introduced a safeguard measure on all imported footwear into Turkey with the goal ofprotecting its local shoe manufacturing industry until August 2009. In June 2009, Turkish shoe-manufacturerssubmitted, and the Turkish Government agreed to review, a request for extension of the safeguard measuresclaiming that the rehabilitation process of the local Turkish industry was interrupted due to the continuingincrease of footwear imports. We are working in broad coalition with other companies in our industry to opposethe continuation of these safeguard measures. We anticipate a final decision in this review will be made in earlyfall 2009.
Trade Relations with China
China represents an important sourcing and marketing country for us. Many governments around the worldare concerned about China’s growing and fast-paced economy, compliance with World Trade Organization rules,currency valuation, and high trade surpluses. As a result, a wide range of legislative proposals have beenintroduced to address these concerns. While some of these concerns may be justified, we are working with broadcoalitions of global businesses and trade associations representing a wide variety of sectors (e.g., services,manufacturing, and agriculture) to help ensure any legislation enacted and implemented (i) addresses legitimateand core concerns, (ii) is consistent with international trade rules, and (iii) reflects and considers China’sdomestic economy and the important role it has in the global economic community. We believe other companiesin our industry as well as most other multi-national companies are in a similar position regarding these trademeasures.
In the event any of these trade protection measures were implemented, we believe that we have the ability todevelop, over a period of time, adequate alternative sources of supply for the products obtained from our presentsuppliers. If events prevented us from acquiring products from our suppliers in a particular country, ouroperations could be temporarily disrupted and we could experience an adverse financial impact. However, webelieve that we could abate any such disruption, and that much of the adverse impact on supply would, therefore,be of a short-term nature. We believe our principal competitors are subject to similar risks.
Competition
The athletic footwear, apparel and equipment industry is keenly competitive in the United States and on aworldwide basis. We compete internationally with a significant number of athletic and leisure shoe companies,athletic and leisure apparel companies, sports equipment companies, and large companies having diversifiedlines of athletic and leisure shoes, apparel and equipment, including Adidas, Puma, and others. The intensecompetition and the rapid changes in technology and consumer preferences in the markets for athletic and leisurefootwear and apparel, and athletic equipment, constitute significant risk factors in our operations.
NIKE is the largest seller of athletic footwear and athletic apparel in the world. Performance and reliabilityof shoes, apparel, and equipment, new product development, price, product identity through marketing andpromotion, and customer support and service are important aspects of competition in the athletic footwear,apparel and equipment industry. To help market our products, we contract with prominent and influentialathletes, coaches, teams, colleges and sports leagues to endorse our brands and use our products, and we activelysponsor sporting events and clinics. We believe that we are competitive in all of these areas.
6

Trademarks and Patents
We utilize trademarks on nearly all of our products and believe that having distinctive marks that are readilyidentifiable is an important factor in creating a market for our goods, in identifying the Company, and indistinguishing our goods from the goods of others. We consider our NIKE® and Swoosh Design® trademarks tobe among our most valuable assets and we have registered these trademarks in over 150 countries. In addition,we own many other trademarks that we utilize in marketing our products. We continue to vigorously protect ourtrademarks against infringement.
NIKE has an exclusive, worldwide license to make and sell footwear using patented “Air” technology. Theprocess utilizes pressurized gas encapsulated in polyurethane. Some of the early NIKE AIR® patents haveexpired, which may enable competitors to use certain types of similar technology. Subsequent NIKE AIR®
patents will not expire for several years. We also have hundreds of U.S. and foreign utility patents, and thousandsof U.S. and foreign design patents covering components and features used in various athletic and leisure shoes,apparel, and equipment. These patents expire at various times, and patents issued for applications filed this yearwill have a remaining duration of from now to 2023 for design patents, and from now to 2029 for utility patents.We believe that our success depends primarily upon skills in design, research and development, production andmarketing rather than upon our patent position. However, we have followed a policy of filing applications forUnited States and foreign patents on inventions, designs and improvements that we deem valuable.
Employees
We had approximately 34,300 employees at May 31, 2009. Management considers its relationship withemployees to be excellent. None of our employees is represented by a union, except for certain employees in theAmericas Region, where local law requires those employees to be represented by a trade union. Also, in somecountries outside of the United States, local laws require representation for employees by works councils (such asin the European Union, in which they are entitled to information and consultation on certain Company decisions)or other representation by an organization similar to a union, although collective bargaining agreements are notinvolved. There has never been a material interruption of operations due to labor disagreements.
Executive Officers of the Registrant
The executive officers of NIKE as of July 24, 2009 are as follows:
Philip H. Knight, Chairman of the Board — Mr. Knight, 71, a director since 1968, is a co-founder of NIKEand, except for the period from June 1983 through September 1984, served as its President from 1968 to 1990,and from June 2000 to December 2004. Prior to 1968, Mr. Knight was a certified public accountant with PriceWaterhouse and Coopers & Lybrand and was an Assistant Professor of Business Administration at Portland StateUniversity.
Mark G. Parker, Chief Executive Officer and President — Mr. Parker, 53, was appointed CEO andPresident in January 2006. He has been employed by NIKE since 1979 with primary responsibilities in productresearch, design and development, marketing, and brand management. Mr. Parker was appointed divisionalVice President in charge of development in 1987, corporate Vice President in 1989, General Manager in 1993,Vice President of Global Footwear in 1998, and President of the NIKE Brand in 2001.
David J. Ayre, Vice President, Global Human Resources — Mr. Ayre, 49, joined NIKE as Vice President,Global Human Resources in July 2007. Prior to joining NIKE, he held a number of senior human resourcepositions with PepsiCo, Inc. since 1990, most recently as head of Talent and Performance Rewards.
Donald W. Blair, Vice President and Chief Financial Officer — Mr. Blair, 51, joined NIKE in November1999. Prior to joining NIKE, he held a number of financial management positions with PepsiCo, Inc., includingVice President, Finance of Pepsi-Cola Asia, Vice President, Planning of PepsiCo’s Pizza Hut Division, and
7

Senior Vice President, Finance of The Pepsi Bottling Group, Inc. Prior to joining PepsiCo, Mr. Blair was acertified public accountant with Deloitte, Haskins, and Sells.
Charles D. Denson, President of the NIKE Brand — Mr. Denson, 53, has been employed by NIKE since1979. Mr. Denson held several management positions within the Company, including his appointments asDirector of USA Apparel Sales in 1994, divisional Vice President, U.S. Sales in 1994, divisional Vice PresidentEuropean Sales in 1997, divisional Vice President and General Manager, NIKE Europe in 1998, Vice Presidentand General Manager of NIKE USA in 2000, and President of the NIKE Brand in 2001.
Gary M. DeStefano, President, Global Operations — Mr. DeStefano, 52, has been employed by NIKE since1982, with primary responsibilities in sales and regional administration. Mr. DeStefano was appointed Directorof Domestic Sales in 1990, divisional Vice President in charge of domestic sales in 1992, Vice President ofGlobal Sales in 1996, Vice President and General Manager of Asia Pacific in 1997, President of USA Operationsin 2001, President of Global Operations in 2006.
Trevor Edwards, Vice President, Global Brand and Category Management — Mr. Edwards, 46, joinedNIKE in 1992. He was appointed Marketing Manager, Strategic Accounts, Foot Locker in 1993, Director ofMarketing, the Americas in 1995, Director of Marketing, Europe in 1997, Vice President, Marketing for Europe,Middle East and Africa in 1999, and Vice President, U.S. Brand Marketing in 2000. Mr. Edwards was appointedcorporate Vice President, Global Brand Management in 2002 and Vice President, Global Brand and CategoryManagement in 2006. Prior to NIKE, Mr. Edwards was with the Colgate-Palmolive Company.
Jeanne P. Jackson, President, Direct to Consumer — Ms. Jackson, 57, served as a member of the NIKE,Inc. Board of Directors from 2001 through March 2009, when she resigned from our Board and was appointedPresident, Direct to Consumer. She is founder and CEO of MSP Capital, a private investment company.Ms. Jackson was CEO of Walmart.com from March 2000 to January 2002. She was with Gap, Inc., as Presidentand CEO of Banana Republic from 1995-2000, also serving as CEO of Gap, Inc. Direct from 1998-2000. Since1978, she has held various retail management positions with Victoria’s Secret, The Walt Disney Company, SaksFifth Avenue, and Federated Department Stores. Ms. Jackson is the President of the United States Ski andSnowboard Foundation Board of Trustees, and serves on the Board of Advisors of the University of California,Irvine. She is also a director of McDonald’s Corporation, Nordstrom, Inc., and Harrah’s Entertainment, Inc.
P. Eunan McLaughlin, President, Affiliates — Mr. McLaughlin, 51, joined NIKE as Director of Sales,NIKE Europe in 1999, and was appointed Vice President Commercial Sales and Retail in 2000, Vice President,Asia Pacific in 2001, Vice President, Europe, Middle East & Africa in May 2004, and President of Affiliates inApril 2009. Prior to joining NIKE, he was Partner and Vice President of Consumer & Retail Practices Division,Korn/Ferry International from 1996 to 1999. From 1983 to 1996, Mr. McLaughlin held various positions withMars, Inc. in finance, sales, marketing and general management.
Bernard F. Pliska, Vice President, Corporate Controller — Mr. Pliska, 47, joined NIKE as CorporateController in 1995. He was appointed Vice President, Corporate Controller in 2003. Prior to NIKE, Mr. Pliskawas with Price Waterhouse from 1984 to 1995. Mr. Pliska is a certified public accountant.
John F. Slusher, Vice President, Global Sports Marketing — Mr. Slusher, 40, has been employed by NIKEsince 1998 with primary responsibilities in global sports marketing. Mr. Slusher was appointed Director of SportsMarketing for the Asia Pacific and Americas Regions in 2006, divisional Vice President, Asia Pacific &Americas Sports Marketing in September 2007 and Vice President, Global Sports Marketing in November 2007.Prior to joining NIKE, Mr. Slusher was an attorney at the law firm of O’Melveny & Myers from 1995 to 1998.
Eric D. Sprunk, Vice President, Merchandising and Product — Mr. Sprunk, 45, joined NIKE in 1993. Hewas appointed Finance Director and General Manager of the Americas in 1994, Finance Director, NIKE Europein 1995, Regional General Manager, NIKE Europe Footwear in 1998, and Vice President & General Manager of
8

the Americas in 2000. Mr. Sprunk was appointed corporate Vice President, Global Footwear in 2001 and VicePresident, Merchandising and Product in 2009. Prior to joining NIKE, Mr. Sprunk was a certified publicaccountant with Price Waterhouse from 1987 to 1993.
Hans van Alebeek, Vice President, Global Operations and Technology — Mr. van Alebeek, 43, joined NIKEas Director of Operations of Europe in 1999, and was appointed Vice President, Operations & Administration inEMEA in 2001, Vice President, Global Operations in 2003, Vice President, Global Operations & Technology in2004, and Corporate Vice President in November 2005. Prior to joining NIKE, Mr. van Alebeek worked forMcKinsey & Company as a management consultant, and at N.V. Indivers in business development.
Item 1A. Risk Factors
Special Note Regarding Forward-Looking Statements and Analyst Reports
Certain written and oral statements, other than purely historical information, including estimates,projections, statements relating to NIKE’s business plans, objectives and expected operating results, and theassumptions upon which those statements are based, made or incorporated by reference from time to time byNIKE or its representatives in this report, other reports, filings with the Securities and Exchange Commission,press releases, conferences, or otherwise, are “forward-looking statements” within the meaning of the PrivateSecurities Litigation Reform Act of 1995 and Section 21E of the Securities Exchange Act of 1934, as amended.Forward-looking statements include, without limitation, any statement that may predict, forecast, indicate, orimply future results, performance, or achievements, and may contain the words “believe,” “anticipate,” “expect,”“estimate,” “project,” “will be,” “will continue,” “will likely result,” or words or phrases of similar meaning.Forward-looking statements involve risks and uncertainties which may cause actual results to differ materiallyfrom the forward-looking statements. The risks and uncertainties are detailed from time to time in reports filed byNIKE with the Securities and Exchange Commission, including Forms 8-K, 10-Q, and 10-K, and include, amongothers, the following: international, national and local general economic and market conditions; the size andgrowth of the overall athletic footwear, apparel, and equipment markets; intense competition among designers,marketers, distributors and sellers of athletic footwear, apparel, and equipment for consumers and endorsers;demographic changes; changes in consumer preferences; popularity of particular designs, categories of products,and sports; seasonal and geographic demand for NIKE products; difficulties in anticipating or forecastingchanges in consumer preferences, consumer demand for NIKE products, and the various market factors describedabove; difficulties in implementing, operating, and maintaining NIKE’s increasingly complex informationsystems and controls, including, without limitation, the systems related to demand and supply planning, andinventory control; interruptions in data and communications systems; fluctuations and difficulty in forecastingoperating results, including, without limitation, the fact that advance “futures” orders may not be indicative offuture revenues due to changes in shipment timing, and the changing mix of futures and at-once orders and ordercancellations; the ability of NIKE to sustain, manage or forecast its growth and inventories; the size, timing andmix of purchases of NIKE’s products; increases in the cost of materials and energy used to manufacture products,new product development and introduction; the ability to secure and protect trademarks, patents, and otherintellectual property; performance and reliability of products; customer service; adverse publicity; the loss ofsignificant customers or suppliers; dependence on distributors; business disruptions; increased costs of freightand transportation to meet delivery deadlines; increases in borrowing costs due to any decline in our debt ratings;changes in business strategy or development plans; general risks associated with doing business outside theUnited States, including, without limitation, exchange rate fluctuations, import duties, tariffs, quotas, politicaland economic instability, and terrorism; changes in government regulations; liability and other claims assertedagainst NIKE; the ability to attract and retain qualified personnel; and other factors referenced or incorporated byreference in this report and other reports.
The risks included here are not exhaustive. Other sections of this report may include additional factorswhich could adversely affect NIKE’s business and financial performance. Moreover, NIKE operates in a verycompetitive and rapidly changing environment. New risk factors emerge from time to time and it is not possible
9

for management to predict all such risk factors, nor can it assess the impact of all such risk factors on NIKE’sbusiness or the extent to which any factor, or combination of factors, may cause actual results to differ materiallyfrom those contained in any forward-looking statements. Given these risks and uncertainties, investors should notplace undue reliance on forward-looking statements as a prediction of actual results.
Investors should also be aware that while NIKE does, from time to time, communicate with securitiesanalysts, it is against NIKE’s policy to disclose to them any material non-public information or other confidentialcommercial information. Accordingly, shareholders should not assume that NIKE agrees with any statement orreport issued by any analyst irrespective of the content of the statement or report. Furthermore, NIKE has apolicy against issuing or confirming financial forecasts or projections issued by others. Thus, to the extent thatreports issued by securities analysts contain any projections, forecasts or opinions, such reports are not theresponsibility of NIKE.
Our products face intense competition.
NIKE is a consumer products company and the relative popularity of various sports and fitness activitiesand changing design trends affect the demand for our products. The athletic footwear, apparel and equipmentindustry is keenly competitive in the United States and on a worldwide basis. We compete internationally with asignificant number of athletic and leisure shoe companies, athletic and leisure apparel companies, sportsequipment companies, and large companies having diversified lines of athletic and leisure shoes, apparel andequipment. We also compete with other companies for the production capacity of independent manufacturers thatproduce our products and for import quota capacity.
Our competitors’ product offerings, technologies, marketing expenditures (including expenditures foradvertising and endorsements), pricing, costs of production, and customer service are areas of intensecompetition. This, in addition to rapid changes in technology and consumer preferences in the markets forathletic and leisure footwear and apparel, and athletic equipment, constitute significant risk factors in ouroperations. If we do not adequately and timely anticipate and respond to our competitors, our costs may increaseor the consumer demand for our products may decline significantly.
If we are unable to anticipate consumer preferences and develop new products, we may not be able tomaintain or increase our net revenues and profits.
Our success depends on our ability to identify, originate and define product trends as well as to anticipate,gauge and react to changing consumer demands in a timely manner. All of our products are subject to changingconsumer preferences that cannot be predicted with certainty. Our new products may not receive consumeracceptance as consumer preferences could shift rapidly to different types of performance or other sports apparelor away from these types of products altogether, and our future success depends in part on our ability toanticipate and respond to these changes. If we fail to anticipate accurately and respond to trends and shifts inconsumer preferences by adjusting the mix of existing product offerings, developing new products, designs,styles and categories, and influencing sports and fitness preferences through aggressive marketing, we couldexperience lower sales, excess inventories and lower profit margins, any of which could have an adverse effecton our results of operations and financial condition.
We rely on technical innovation and high quality products to compete in the market for our products.
Although design and aesthetics of our products appear to be the most important factor for consumeracceptance of our products, technical innovation and quality control in the design of footwear, apparel, andathletic equipment is also essential to the commercial success of our products. Research and development plays akey role in technical innovation. We rely upon specialists in the fields of biomechanics, exercise physiology,engineering, industrial design and related fields, as well as research committees and advisory boards made up ofathletes, coaches, trainers, equipment managers, orthopedists, podiatrists and other experts to develop and test
10

cutting edge performance products. While we strive to produce products that help to reduce injury, enhanceathletic performance and maximize comfort, if we fail to introduce technical innovation in our products theconsumer demand for our products could decline, and if we experience problems with the quality of our products,we may incur substantial expense to remedy the problems.
Failure to continue to obtain high quality endorsers of our products could harm our business.
We establish relationships with professional athletes, sports teams and leagues to evaluate, promote, andestablish product authenticity with consumers. If certain endorsers were to stop using our products contrary totheir endorsement agreements, our business could be adversely affected. In addition, actions taken by athletes,teams or leagues associated with our products that harm the reputations of those athletes, teams or leagues couldalso harm our brand image with consumers and, as a result, could have an adverse effect on our sales andfinancial condition. In addition, poor performance by our endorsers, a failure to continue to correctly identifypromising athletes to use and endorse our products, or a failure to enter into cost effective endorsementarrangements with prominent athletes and sports organizations could adversely affect our brand and result indecreased sales of our products.
Failure of our contractors to comply with our code of conduct, local laws, and other standards could harm ourbusiness.
We contract with hundreds of contractors outside of the United States to manufacture our products, and weimpose on those contractors a code of conduct and other environmental, health, and safety standards for thebenefit of workers. However, from time to time contractors may not comply with such standards or applicablelocal law. Significant or continuing noncompliance with such standards and laws by one or more contractorscould harm our reputation and, as a result, could have an adverse effect on our sales and financial condition.
Global capital and credit market conditions, and resulting declines in consumer confidence and spending,could have a material adverse effect on our business, operating results, and financial condition.
Volatility and disruption in the global capital and credit markets in 2008 and 2009 have led to a tighteningof business credit and liquidity, a contraction of consumer credit, business failures, higher unemployment, anddeclines in consumer confidence and spending in the United States and internationally. If global economic andfinancial market conditions deteriorate or remain weak for an extended period of time, the following factorscould have a material adverse effect on our business, operating results, and financial condition:
• Slower consumer spending may result in reduced demand for our products, reduced orders fromretailers for our products, order cancellations, lower revenues, increased inventories, and lower grossmargins.
• We may be unable to find suitable investments that are safe, liquid, and provide a reasonablereturn. This could result in lower interest income or longer investment horizons. Disruptions to capitalmarkets or the banking system may also impair the value of investments or bank deposits we currentlyconsider safe or liquid.
• We may be unable to access financing in the credit and capital markets at reasonable rates in the eventwe find it desirable to do so.
• The failure of financial institution counterparties to honor their obligations to us under credit andderivative instruments could jeopardize our ability to rely on and benefit from those instruments. Ourability to replace those instruments on the same or similar terms may be limited under poor marketconditions.
• We conduct transactions in various currencies, which increases our exposure to fluctuations in foreigncurrency exchange rates relative to the U.S. dollar. Continued volatility in the markets and exchangerates for foreign currencies and contracts in foreign currencies could have a significant impact on ourreported financial results and condition.
11

• Continued volatility in the markets and prices for commodities and raw materials we use in ourproducts and in our supply chain (such as petroleum) could have a material adverse effect on our costs,gross margins, and profitability.
• If retailers of our products experience declining revenues, or retailers experience difficulty obtainingfinancing in the capital and credit markets to purchase our products, this could result in reduced ordersfor our products, order cancellations, inability of retailers to timely meet their payment obligations tous, extended payment terms, higher accounts receivable, reduced cash flows, greater expenseassociated with collection efforts, and increased bad debt expense.
• If retailers of our products experience severe financial difficulty, some may become insolvent andcease business operations, which could reduce the availability of our products to consumers.
• If contract manufacturers of our products or other participants in our supply chain experience difficultyobtaining financing in the capital and credit markets to purchase raw materials or to finance generalworking capital needs, it may result in delays or non-delivery of shipments of our products.
Our business is affected by seasonality, which could result in fluctuations in our operating results and stockprice.
We experience moderate fluctuations in aggregate sales volume during the year. Historically, revenues inthe first and fourth fiscal quarters have slightly exceeded those in the second and third fiscal quarters. However,the mix of product sales may vary considerably from time to time as a result of changes in seasonal andgeographic demand for particular types of footwear, apparel and equipment. In addition, our customers maycancel orders, change delivery schedules or change the mix of products ordered with minimal notice. As a result,we may not be able to accurately predict our quarterly sales. Accordingly, our results of operations are likely tofluctuate significantly from period to period. This seasonality, along with other factors that are beyond ourcontrol, including general economic conditions, changes in consumer preferences, weather conditions,availability of import quotas and currency exchange rate fluctuations, could adversely affect our business andcause our results of operations to fluctuate. Our operating margins are also sensitive to a number of factors thatare beyond our control, including shifts in product sales mix, geographic sales trends, and currency exchange ratefluctuations, all of which we expect to continue. Results of operations in any period should not be consideredindicative of the results to be expected for any future period.
“Futures” orders may not be an accurate indication of our future revenues.
We make substantial use of our “futures” ordering program, which allows retailers to order five to sixmonths in advance of delivery with the commitment that their orders will be delivered within a set period at afixed price. Our futures ordering program allows us to minimize the amount of products we hold in inventory,purchasing costs, the time necessary to fill customer orders, and the risk of non-delivery. We report changes infutures orders in our periodic financial reports. Although we believe futures orders are an important indicator ofour future revenues, reported futures orders are not necessarily indicative of our expectation of changes inrevenues for any future period. This is because the mix of orders can shift between advance/futures and at-onceorders. In addition, foreign currency exchange rate fluctuations, order cancellations, returns, and discounts cancause differences in the comparisons between futures orders and actual revenues. Moreover, a significant portionof our revenue is not derived from futures orders, including at-once close-out sales of NIKE footwear andapparel, wholesale sales of equipment, Cole Haan, Converse, Hurley, NIKE Golf and Umbro, and retail salesacross all brands.
Our “futures” ordering program does not prevent excess inventories or inventory shortages, which couldresult in decreased operating margins and harm to our business.
We purchase products from manufacturers outside of our futures ordering program and in advance ofcustomer orders, which we hold in inventory and resell to customers. There is a risk we may be unable to sell
12

excess products ordered from manufacturers. Inventory levels in excess of customer demand may result ininventory write-downs, and the sale of excess inventory at discounted prices could significantly impair our brandimage and have an adverse effect on our operating results and financial condition. Conversely, if weunderestimate consumer demand for our products or if our manufacturers fail to supply products we require atthe time we need them, we may experience inventory shortages. Inventory shortages might delay shipments tocustomers, negatively impact retailer and distributor relationships, and diminish brand loyalty.
The difficulty in forecasting demand also makes it difficult to estimate our future results of operations andfinancial condition from period to period. A failure to accurately predict the level of demand for our productscould adversely affect our net revenues and net income, and we are unlikely to forecast such effects with anycertainty in advance.
We may be adversely affected by the financial health of our retailers.
We extend credit to our customers based on an assessment of a customer’s financial condition, generallywithout requiring collateral. To assist in the scheduling of production and the shipping of seasonal products, weoffer customers the ability to place orders five to six months ahead of delivery under our “futures” orderingprogram. These advance orders may be cancelled, and the risk of cancellation may increase when dealing withfinancially ailing retailers or retailers struggling with economic uncertainty. In the past, some customers haveexperienced financial difficulties, which have had an adverse effect on our business. As a result, retailers may bemore cautious than usual with orders as a result of weakness in the retail economy. A slowing economy in ourkey markets could have an adverse effect on the financial health of our customers, which in turn could have anadverse effect on our results of operations and financial condition. In addition, product sales are dependent inpart on high quality merchandising and an appealing store environment to attract consumers, which requirescontinuing investments by retailers. Retailers who experience financial difficulties may fail to make suchinvestments or delay them, resulting in lower sales and orders for our products.
Consolidation of retailers or concentration of retail market share among a few retailers may increase andconcentrate our credit risk, and impair our ability to sell our products.
The athletic footwear, apparel, and equipment retail markets in some countries are dominated by a few largeathletic footwear, apparel, and equipment retailers with many stores. These retailers have in the past increasedtheir market share and may continue to do so in the future by expanding through acquisitions and construction ofadditional stores. These situations concentrate our credit risk with a relatively small number of retailers, and, ifany of these retailers were to experience a shortage of liquidity, it would increase the risk that their outstandingpayables to us may not be paid. In addition, increasing market share concentration among one or a few retailersin a particular country or region increases the risk that if any one of them substantially reduces their purchases ofour products, we may be unable to find a sufficient number of other retail outlets for our products to sustain thesame level of sales and revenues.
Failure to adequately protect our intellectual property rights could adversely affect our business.
We utilize trademarks on nearly all of our products and believe that having distinctive marks that are readilyidentifiable is an important factor in creating a market for our goods, in identifying us, and in distinguishing ourgoods from the goods of others. We consider our NIKE® and Swoosh Design® trademarks to be among our mostvaluable assets and we have registered these trademarks in over 150 countries. In addition, we own many othertrademarks that we utilize in marketing our products. We believe that our trademarks, patents, and otherintellectual property rights are important to our brand, our success and our competitive position. We periodicallydiscover products that are counterfeit reproductions of our products or that otherwise infringe on our intellectualproperty rights. If we are unsuccessful in challenging a party’s products on the basis of trademark or design orutility patent infringement, continued sales of these products could adversely affect our sales and our brand andresult in the shift of consumer preference away from our products. The actions we take to establish and protect
13

trademarks, patents, and other intellectual property rights may not be adequate to prevent imitation of ourproducts by others or to prevent others from seeking to block sales of our products as violations of proprietaryrights.
In addition, the laws of certain foreign countries may not protect intellectual property rights to the sameextent as the laws of the United States. We may face significant expenses and liability in connection with theprotection of our intellectual property rights outside the United States, and if we are unable to successfullyprotect our rights or resolve intellectual property conflicts with others, our business or financial condition may beadversely affected.
We are subject to periodic litigation and other regulatory proceedings, which could result in unexpectedexpense of time and resources.
From time to time we are called upon to defend ourselves against lawsuits and regulatory actions relating toour business. Due to the inherent uncertainties of litigation and regulatory proceedings, we cannot accuratelypredict the ultimate outcome of any such proceedings. An unfavorable outcome could have an adverse impact onour business, financial condition and results of operations. In addition, any significant litigation in the future,regardless of its merits, could divert management’s attention from our operations and result in substantial legalfees.
Our international operations involve inherent risks which could result in harm to our business.
Virtually all of our athletic footwear and apparel is manufactured outside of the United States, and themajority of our products are sold outside of the United States. Accordingly, we are subject to the risks generallyassociated with global trade and doing business abroad, which include foreign laws and regulations, varyingconsumer preferences across geographic regions, political unrest, disruptions or delays in cross-border shipmentsand changes in economic conditions in countries in which we manufacture or sell products. In addition, diseaseoutbreaks, terrorist acts and military conflict have increased the risks of doing business abroad. These factors,among others, could affect our ability to manufacture products or procure materials, our ability to importproducts, our ability to sell products in international markets, and our cost of doing business. If any of these orother factors make the conduct of business in a particular country undesirable or impractical, our business couldbe adversely affected. In addition, many of our imported products are subject to duties, tariffs or quotas thataffect the cost and quantity of various types of goods imported into the United States and other countries. Anycountry in which our products are produced or sold may eliminate, adjust or impose new quotas, duties, tariffs,safeguard measures, anti-dumping duties, cargo restrictions to prevent terrorism, restrictions on the transfer ofcurrency, or other charges or restrictions, any of which could have an adverse effect on our results of operationsand financial condition.
Changes in tax laws and unanticipated tax liabilities could adversely affect our effective income tax rate andprofitability.
We are subject to income taxes in the United States and numerous foreign jurisdictions. Our effectiveincome tax rate in the future could be adversely affected by a number of factors, including: changes in the mix ofearnings in countries with differing statutory tax rates, changes in the valuation of deferred tax assets andliabilities, changes in tax laws, the outcome of income tax audits in various jurisdictions around the world, andany repatriation of non-US earnings for which we have not previously provided for U.S. taxes. We regularlyassess all of these matters to determine the adequacy of our tax provision, which is subject to significantdiscretion. Recently, the Obama administration proposed legislation that would change how U.S. multinationalcorporations are taxed on their foreign income. If such legislation is enacted, it may have a material adverseimpact to our tax rate and in turn, our profitability.
14

Currency exchange rate fluctuations could result in higher costs and decreased margins.
A majority of our products are sold outside of the United States. As a result, we conduct transactions invarious currencies, which increases our exposure to fluctuations in foreign currency exchange rates relative to theU.S. dollar. Our international revenues and expenses generally are derived from sales and operations in foreigncurrencies, and these revenues and expenses could be affected by currency fluctuations, including amountsrecorded in foreign currencies and translated into U.S. dollars for consolidated financial reporting. Currencyexchange rate fluctuations could also disrupt the business of the independent manufacturers that produce ourproducts by making their purchases of raw materials more expensive and more difficult to finance. Foreigncurrency fluctuations could have an adverse effect on our results of operations and financial condition.
Our hedging activities (see Note 18, Risk Management and Derivatives on the accompanying note to theconsolidated financial statement), which are designed to minimize and delay, but not to completely eliminate, theeffects of foreign currency fluctuations may not sufficiently mitigate the impact of foreign currencies on ourfinancial results. Factors that could affect the effectiveness of our hedging activities include accuracy of salesforecasts, volatility of currency markets, and the availability of hedging instruments. Since the hedging activitiesare designed to minimize volatility, they not only reduce the negative impact of a stronger U.S. dollar, but theyalso reduce the positive impact of a weaker U.S. dollar. Our future financial results could be significantlyaffected by the value of the U.S. dollar in relation to the foreign currencies in which we conduct business. Thedegree to which our financial results are affected for any given time period will depend in part upon our hedgingactivities.
Our products are subject to risks associated with overseas sourcing, manufacturing, and financing.
The principal materials used in our apparel products — natural and synthetic fabrics and threads, plastic andmetal hardware, and specialized performance fabrics designed to repel rain, retain heat, or efficiently transportbody moisture — are available in countries where our manufacturing takes place. The principal materials used inour footwear products — natural and synthetic rubber, plastic compounds, foam cushioning materials, nylon,leather, canvas and polyurethane films — are also locally available to manufacturers. NIKE contractors andsuppliers buy raw materials in bulk.
There could be a significant disruption in the supply of fabrics or raw materials from current sources or, inthe event of a disruption, we might not be able to locate alternative suppliers of materials of comparable qualityat an acceptable price, or at all. In addition, we cannot be certain that our unaffiliated manufacturers will be ableto fill our orders in a timely manner. If we experience significant increases in demand, or need to replace anexisting manufacturer, there can be no assurance that additional supplies of fabrics or raw materials or additionalmanufacturing capacity will be available when required on terms that are acceptable to us, or at all, or that anysupplier or manufacturer would allocate sufficient capacity to us in order to meet our requirements. In addition,even if we are able to expand existing or find new manufacturing or sources of materials, we may encounterdelays in production and added costs as a result of the time it takes to train suppliers and manufacturers in ourmethods, products, quality control standards, and labor, health and safety standards. Any delays, interruption orincreased costs in the supply of materials or manufacture of our products could have an adverse effect on ourability to meet retail customer and consumer demand for our products and result in lower revenues and netincome both in the short and long term.
Because independent manufacturers manufacture a majority of our products outside of our principal salesmarkets, our products must be transported by third parties over large geographic distances. Delays in theshipment or delivery of our products due to the availability of transportation, work stoppages, port strikes,infrastructure congestion, or other factors, and costs and delays associated with consolidating or transitioningbetween manufacturers, could adversely impact our financial performance. In addition, manufacturing delays orunexpected demand for our products may require us to use faster, but more expensive, transportation methodssuch as aircraft, which could adversely affect our profit margins. The cost of fuel is a significant component inmanufacturing and transportation costs, so increases in the price of petroleum products can adversely affect ourprofit margins.
15

In addition, Sojitz America performs significant import-export financing services for most of the NIKEbrand products sold outside of the United States, Europe, Middle East, Africa and Japan, excluding productsproduced and sold in the same country. Any failure of Sojitz America to provide these services or any failure ofSojitz America’s banks could disrupt our ability to acquire products from our suppliers and to deliver products toour customers outside of the United States, Europe, Middle East, Africa, and Japan. Such a disruption couldresult in cancelled orders that would adversely affect sales and profitability.
Our success depends on our global distribution facilities.
We distribute our products to customers directly from the factory and through distribution centers locatedthroughout the world. Our ability to meet customer expectations, manage inventory, complete sales and achieveobjectives for operating efficiencies depends on the proper operation of our distribution facilities, thedevelopment or expansion of additional distribution capabilities, and the timely performance of services by thirdparties (including those involved in shipping product to and from our distribution facilities). Our distributionfacilities could be interrupted by information technology problems and disasters such as earthquakes or fires.Any significant failure in our distribution facilities could result in an adverse affect on our business. We maintainbusiness interruption insurance, but it may not adequately protect us from adverse effects that could be caused bysignificant disruptions in our distribution facilities.
We rely significantly on information technology in our supply chain, and any failure, inadequacy,interruption or security failure of that technology could harm our ability to effectively operate our business.
We are heavily dependent on information technology systems across our supply chain, including productdesign, production, forecasting, ordering, manufacturing, transportation, sales, and distribution. Our ability toeffectively manage and maintain our inventory and to ship products to customers on a timely basis dependssignificantly on the reliability of these supply chain systems. Over the last several years, as part of the ongoinginitiative to upgrade our worldwide supply chain, we have implemented new systems in all of our geographicalregions in which we operate. Over the next few years, we will work to continue to enhance the systems andrelated processes in our global operations. The failure of these systems to operate effectively, problems withtransitioning to upgraded or replacement systems, or a breach in security of these systems could cause delays inproduct fulfillment and reduced efficiency of our operations, and could require significant capital investments toremediate the problem, and may have an adverse effect on our results of operations and financial condition.
Our financial results may be adversely affected if substantial investments in businesses and operations fail toproduce expected returns.
From time to time, we may invest in business infrastructure, acquisitions of new businesses, and expansionof existing businesses, such as our retail operations, which require substantial cash investments and managementattention. We believe cost effective investments are essential to business growth and profitability. However,significant investments are subject to typical risks and uncertainties inherent in acquiring or expanding abusiness. The failure of any significant investment to provide the returns or profitability we expect could have amaterial adverse effect on our financial results and divert management attention from more profitable businessoperations.
We depend on key personnel, the loss of whom would harm our business.
Our future success will depend in part on the continued service of key executive officers and personnel. Theloss of the services of any key individual could harm us. Our future success also depends on our ability toidentify, attract and retain additional qualified personnel. Competition for employees in our industry is intenseand we may not be successful in attracting and retaining such personnel.
16

The sale of a large number of shares held by our Chairman could depress the market price of our commonstock.
Philip H. Knight, Co-founder and Chairman of our Board of Directors, beneficially owns over 96% of ourClass A Common Stock. If all of his Class A Common Stock were converted into Class B Common Stock,Mr. Knight would own over 19% of our Class B Common Stock. These shares are available for resale, subject tothe requirements of the U.S. securities laws. The sale or prospect of the sale of a substantial number of theseshares could have an adverse effect on the market price of our common stock.
Anti-takeover provisions may impair an acquisition of the Company or reduce the price of our common stock.
There are provisions of our articles of incorporation and Oregon law that are intended to protect shareholderinterests by providing the Board of Directors a means to attempt to deny coercive takeover attempts or tonegotiate with a potential acquirer in order to obtain more favorable terms. Such provisions include a controlshare acquisition statute, a freezeout statute, two classes of stock that vote separately on certain issues, and thefact holders of Class A Common Stock shares elect three-fourths of the Board of Directors rounded down to thenext whole number. However, such provisions could discourage, delay or prevent an unsolicited merger,acquisition or other change in control of our company that some shareholders might believe to be in their bestinterests or in which shareholders might receive a premium for their common stock over the prevailing marketprice. These provisions could also discourage proxy contests for control of the Company.
We may fail to meet analyst expectations, which could cause the price of our stock to decline.
Our common stock is traded publicly, and at any given time various securities analysts follow our financialresults and issue reports on us. These reports include information about our historical financial results as well asthe analysts’ estimates of our future performance. The analysts’ estimates are based upon their own opinions andare often different from our estimates or expectations. If our operating results are below the estimates orexpectations of public market analysts and investors, our stock price could decline. In the past, securities classaction litigation has been brought against NIKE and other companies following a decline in the market price oftheir securities. If our stock price is volatile, we may become involved in this type of litigation in the future. Anylitigation could result in substantial costs and a diversion of management’s attention and resources that areneeded to successfully run our business.
Item 1B. Unresolved Staff Comments
Not applicable.
Item 2. Properties
The following is a summary of principal properties owned or leased by NIKE.
The NIKE World Campus, owned by NIKE and located in Beaverton, Oregon, USA, is a 176 acre facility of18 buildings which functions as our world headquarters and is occupied by almost 5,700 employees engaged inmanagement, research, design, development, marketing, finance, and other administrative functions from nearlyall of our divisions. We also lease various office facilities in the surrounding metropolitan area. We lease asimilar, but smaller, administrative facility in Hilversum, the Netherlands, which serves as the headquarters forthe EMEA Region.
There are three significant distribution and customer service facilities for NIKE brand products in theUnited States. All three of them are located in Memphis, Tennessee, one of which is leased. Cole Haan alsooperates a distribution facility in Greenland, New Hampshire, which we lease. Smaller leased distributionfacilities for other brands and non-NIKE brand businesses are located in various parts of the United States. We
17

also own or lease distribution and customer service facilities in many parts of the world, the most significant ofwhich are the distribution facilities located in Tomisatomachi, Japan, and in Laakdal, Belgium, both of which weown.
We manufacture Air-Sole cushioning materials and components at NIKE IHM, Inc. manufacturing facilitieslocated in Beaverton, Oregon and St. Charles, Missouri, which we own. We also manufacture and sell smallamounts of various plastic products to other manufacturers through NIKE IHM, Inc.
Aside from the principal properties described above, we lease three production offices outside the UnitedStates, over 100 sales offices and showrooms worldwide, and approximately 60 administrative officesworldwide. We lease more than 600 retail stores worldwide, which consist primarily of factory outlet stores. See“United States Market” and “International Markets” starting on page 2 of this Report. Our leases expire atvarious dates through the year 2034.
Item 3. Legal Proceedings
There are no material pending legal proceedings, other than ordinary routine litigation incidental to ourbusiness, to which we are a party or of which any of our property is the subject.
Item 4. Submission of Matters to a Vote of Security Holders
No matter was submitted during the fourth quarter of the 2009 fiscal year to a vote of security holders,through the solicitation of proxies or otherwise.
18

PART II
Item 5. Market for Registrant’s Common Equity, Related Stockholder Matters and Issuer Purchases ofEquity Securities
NIKE’s Class B Common Stock is listed on the New York Stock Exchange and trades under the symbolNKE. At July 24, 2009, there were 20,672 holders of record of our Class B Common Stock and 16 holders ofrecord of our Class A Common Stock. These figures do not include beneficial owners who hold shares innominee name. The Class A Common Stock is not publicly traded but each share is convertible upon request ofthe holder into one share of Class B Common Stock. The following tables set forth, for each of the quarterlyperiods indicated, the high and low sales prices for the Class B Common Stock as reported on the New YorkStock Exchange Composite Tape and dividends declared on the Class A and Class B Common Stock.
Fiscal 2009 (June 1, 2008 — May 31, 2009) High LowDividendsDeclared
First Quarter . . . . . . . . . . . . . . . . . . . . . . . . . . . . . . . . . . . . . . . . . . . . . . . . . . . . . . . . . $70.28 $54.64 $ 0.23Second Quarter . . . . . . . . . . . . . . . . . . . . . . . . . . . . . . . . . . . . . . . . . . . . . . . . . . . . . . 68.00 42.68 0.25Third Quarter . . . . . . . . . . . . . . . . . . . . . . . . . . . . . . . . . . . . . . . . . . . . . . . . . . . . . . . . 57.33 40.08 0.25Fourth Quarter . . . . . . . . . . . . . . . . . . . . . . . . . . . . . . . . . . . . . . . . . . . . . . . . . . . . . . . 57.14 38.24 0.25
Fiscal 2008 (June 1, 2007 — May 31, 2008) High LowDividendsDeclared
First Quarter . . . . . . . . . . . . . . . . . . . . . . . . . . . . . . . . . . . . . . . . . . . . . . . . . . . . . . . . . $60.35 $51.87 $0.185Second Quarter . . . . . . . . . . . . . . . . . . . . . . . . . . . . . . . . . . . . . . . . . . . . . . . . . . . . . . 66.57 54.15 0.23Third Quarter . . . . . . . . . . . . . . . . . . . . . . . . . . . . . . . . . . . . . . . . . . . . . . . . . . . . . . . . 67.93 51.50 0.23Fourth Quarter . . . . . . . . . . . . . . . . . . . . . . . . . . . . . . . . . . . . . . . . . . . . . . . . . . . . . . . 70.60 56.70 0.23
No share repurchases were made by NIKE during the fourth quarter ended May 31, 2009 under the four-year $3.0 billion share repurchase program authorized by our Board of Directors and announced in June 2006. Asof May 31, 2009, the maximum dollar value of shares available for repurchase under this program is $300.2million. In September 2008, our Board of Directors approved a new $5 billion share repurchase program. Thisnew program will commence upon completion of our current $3 billion share repurchase program.
19

Performance Graph
The following graph demonstrates a five-year comparison of cumulative total returns for NIKE’s Class BCommon Stock, the Standard & Poor’s 500 Stock Index, the Standard & Poor’s Apparel, Accessories & LuxuryGoods Index, and the Dow Jones U.S. Footwear Index. The graph assumes an investment of $100 on May 31,2004 in each of our Class B Common Stock, and the stocks comprising the Standard & Poor’s 500 Stock Index,the Standard & Poor’s Apparel, Accessories & Luxury Goods Index, and the Dow Jones U.S. Footwear Index.Each of the indices assumes that all dividends were reinvested.
COMPARISON OF 5-YEAR CUMULATIVE TOTAL RETURN AMONG NIKE, INC., S&P 500INDEX, S&P APPAREL, ACCESSORIES & LUXURY GOODS INDEX,
AND THE DOW JONES U.S. FOOTWEAR INDEX
20082007200620052004 2009
DOLLARS
50
100
150
200
250NIKE INC-B
S&P 500 INDEX - TOTAL RETURNS
DOW JONES U.S. FOOTWEAR INDEX
S&P 500 APPAREL, ACCESSORIES & LUXURY GOODS
The Dow Jones U.S. Footwear Index consists of NIKE, Deckers Outdoor Corp., Timberland Co., WolverineWorld Wide, Inc., and Crocs, Inc. Because NIKE is part of the Dow Jones U.S. Footwear Index, the price andreturns of NIKE stock have a substantial effect on this index. The Standard & Poor’s Apparel, Accessories &Luxury Goods Index consists of VF Corp., Coach, Inc., and Polo Ralph Lauren Corporation. The Dow Jones U.S.Footwear Index and the Standard & Poor’s Apparel, Accessories, and Luxury Goods Index include companies intwo major lines of business in which the Company competes. The indices do not encompass all of the Company’scompetitors, nor all product categories and lines of business in which the Company is engaged.
The stock performance shown on the performance graph above is not necessarily indicative of futureperformance. The Company will not make nor endorse any predictions as to future stock performance.
The performance graph above is being furnished solely to accompany this Report pursuant to Item 201(e) ofRegulation S-K, and is not being filed for purposes of Section 18 of the Securities Exchange Act of 1934, asamended, and is not to be incorporated by reference into any filing of the Company, whether made before or afterthe date hereof, regardless of any general incorporation language in such filing.
20

Item 6. Selected Financial Data
Financial History
2009 2008 2007 2006 2005
(In millions, except per share data and financial ratios)(1)
Year Ended May 31,Revenues . . . . . . . . . . . . . . . . . . . . . . . . . . . . . . . . . $19,176.1 $18,627.0 $16,325.9 $14,954.9 $13,739.7Gross margin . . . . . . . . . . . . . . . . . . . . . . . . . . . . . . 8,604.4 8,387.4 7,160.5 6,587.0 6,115.4Gross margin % . . . . . . . . . . . . . . . . . . . . . . . . . . . . 44.9% 45.0% 43.9% 44.0% 44.5%Restructuring charges . . . . . . . . . . . . . . . . . . . . . . . 195.0 — — — —Goodwill impairment . . . . . . . . . . . . . . . . . . . . . . . 199.3 — — — —Intangible and other asset impairment . . . . . . . . . . 202.0 — — — —Net income . . . . . . . . . . . . . . . . . . . . . . . . . . . . . . . 1,486.7 1,883.4 1,491.5 1,392.0 1,211.6Basic earnings per common share . . . . . . . . . . . . . . 3.07 3.80 2.96 2.69 2.31Diluted earnings per common share . . . . . . . . . . . . 3.03 3.74 2.93 2.64 2.24Weighted average common shares outstanding . . . 484.9 495.6 503.8 518.0 525.2Diluted weighted average common shares
outstanding . . . . . . . . . . . . . . . . . . . . . . . . . . . . . 490.7 504.1 509.9 527.6 540.6Cash dividends declared per common share . . . . . . 0.98 0.875 0.71 0.59 0.475Cash flow from operations . . . . . . . . . . . . . . . . . . . 1,736.1 1,936.3 1,878.7 1,667.9 1,570.7Price range of common stock
High . . . . . . . . . . . . . . . . . . . . . . . . . . . . . . . . . 70.28 70.60 57.12 45.77 46.22Low . . . . . . . . . . . . . . . . . . . . . . . . . . . . . . . . . 38.24 51.50 37.76 38.27 34.31
At May 31,Cash and equivalents . . . . . . . . . . . . . . . . . . . . . . . . $ 2,291.1 $ 2,133.9 $ 1,856.7 $ 954.2 $ 1,388.1Short-term investments . . . . . . . . . . . . . . . . . . . . . . 1,164.0 642.2 990.3 1,348.8 436.6Inventories . . . . . . . . . . . . . . . . . . . . . . . . . . . . . . . . 2,357.0 2,438.4 2,121.9 2,076.7 1,811.1Working capital . . . . . . . . . . . . . . . . . . . . . . . . . . . . 6,457.0 5,517.8 5,492.5 4,733.6 4,339.7Total assets . . . . . . . . . . . . . . . . . . . . . . . . . . . . . . . 13,249.6 12,442.7 10,688.3 9,869.6 8,793.6Long-term debt . . . . . . . . . . . . . . . . . . . . . . . . . . . . 437.2 441.1 409.9 410.7 687.3Redeemable Preferred Stock . . . . . . . . . . . . . . . . . . 0.3 0.3 0.3 0.3 0.3Shareholders’ equity . . . . . . . . . . . . . . . . . . . . . . . . 8,693.1 7,825.3 7,025.4 6,285.2 5,644.2Year-end stock price . . . . . . . . . . . . . . . . . . . . . . . . 57.05 68.37 56.75 40.16 41.10Market capitalization . . . . . . . . . . . . . . . . . . . . . . . . 27,697.8 33,576.5 28,472.3 20,564.5 21,462.3
Financial Ratios:Return on equity . . . . . . . . . . . . . . . . . . . . . . . . . . . 18.0% 25.4% 22.4% 23.3% 23.2%Return on assets . . . . . . . . . . . . . . . . . . . . . . . . . . . . 11.6% 16.3% 14.5% 14.9% 14.5%Inventory turns . . . . . . . . . . . . . . . . . . . . . . . . . . . . 4.4 4.5 4.4 4.3 4.4Current ratio at May 31 . . . . . . . . . . . . . . . . . . . . . . 3.0 2.7 3.1 2.8 3.2Price/Earnings ratio at May 31 . . . . . . . . . . . . . . . . 18.8 18.3 19.4 15.2 18.3
(1) All share and per share information has been restated to reflect a two-for-one stock split affected in the formof a 100% common stock dividend distributed on April 2, 2007.
21

Selected Quarterly Financial Data
1st Quarter 2nd Quarter 3rd Quarter 4th Quarter
2009 2008 2009 2008 2009 2008 2009 2008
(Unaudited)(In millions, except per share data)
Revenues . . . . . . . . . . . . . . . . . . . . . . . . . . . . . . . . . . . . . . $5,432.2 $4,655.1 $4,590.1 $4,339.5 $4,440.8 $4,544.4 $4,713.0 $5,088.0Gross margin . . . . . . . . . . . . . . . . . . . . . . . . . . . . . . . . . . . 2,562.1 2,087.0 2,050.0 1,921.1 1,948.5 2,047.9 2,043.8 2,331.4Gross margin % . . . . . . . . . . . . . . . . . . . . . . . . . . . . . . . . . 47.2% 44.8% 44.7% 44.3% 43.9% 45.1% 43.4% 45.8%Restructuring charges . . . . . . . . . . . . . . . . . . . . . . . . . . . . — — — — — — 195.0 —Goodwill impairment . . . . . . . . . . . . . . . . . . . . . . . . . . . . — — — — 199.3 — — —Intangible and other asset impairment . . . . . . . . . . . . . . . — — — — 202.0 — — —Net income . . . . . . . . . . . . . . . . . . . . . . . . . . . . . . . . . . . . 510.5 569.7 391.0 359.4 243.8 463.8 341.4 490.5Basic earnings per common share . . . . . . . . . . . . . . . . . . . 1.05 1.14 0.81 0.72 0.50 0.94 0.70 1.00Diluted earnings per common share . . . . . . . . . . . . . . . . . 1.03 1.12 0.80 0.71 0.50 0.92 0.70 0.98Weighted average common shares outstanding . . . . . . . . 487.2 499.4 483.7 497.6 484.0 493.9 484.8 491.4Diluted weighted average common shares outstanding . . 494.9 507.3 489.8 506.2 488.1 502.5 489.4 500.1Cash dividends declared per common share . . . . . . . . . . . 0.23 0.185 0.25 0.23 0.25 0.23 0.25 0.23Price range of common stock
High . . . . . . . . . . . . . . . . . . . . . . . . . . . . . . . . . . . . . . . . 70.28 60.35 68.00 66.57 57.33 67.93 57.14 70.60Low . . . . . . . . . . . . . . . . . . . . . . . . . . . . . . . . . . . . . . . . 54.64 51.87 42.68 54.15 40.08 51.50 38.24 56.70
Item 7. Management’s Discussion and Analysis of Financial Condition and Results of Operations
Overview
NIKE designs, develops and markets high quality footwear, apparel, equipment and accessory productsworldwide. We are the largest seller of athletic footwear and apparel in the world and sell our products primarilythrough a combination of retail accounts, NIKE-owned retail, including stores and e-commerce, independentdistributors, franchisees and licensees worldwide. Our goal is to deliver value to our shareholders by building aprofitable global portfolio of branded footwear, apparel, equipment and accessories businesses. Our strategy is toachieve long-term revenue growth by creating innovative, “must have” products; building deep personalconsumer connections with our brands; and delivering compelling retail presentation and experiences.
We strive to convert revenue growth to shareholder value by driving operating excellence in several keyareas:
• Making our supply chain a competitive advantage, through operational discipline
• Reducing product costs through a continued focus on lean manufacturing and product design thatstrives to eliminate waste
• Improving selling and administrative expense productivity by focusing on investments that driveeconomic returns in the form of incremental revenue and gross margin, and leveraging existinginfrastructure across our portfolio of brands to eliminate duplicative costs
• Improving working capital efficiency
• Deploying capital effectively to create value for our shareholders
Through execution of this strategy, our long-term financial goal is to achieve:
• High single-digit revenue growth
• Mid-teens earnings per share growth
• Increased return on invested capital and accelerated cash flows, and
• Consistent results through effective management of our diversified portfolio of businesses
22

Since the adoption of this long-term strategy in 2001, on an annual compounded basis, NIKE, Inc.’srevenues and earnings per share have grown 9% and 14%, respectively. During the same period, our return oninvested capital increased from 14% to 18%. In fiscal 2009, deteriorating macroeconomic conditions causedsignificant volatility in global financial markets and put significant pressure on discretionary consumer spendingworldwide. NIKE’s fiscal 2009 revenues grew 3% to $19.2 billion, net income decreased 21% to $1.5 billion,and we delivered diluted earnings per share of $3.03, a 19% decrease versus fiscal 2008. Our fiscal 2009 reportedresults also contain significant non-comparable transactions, including after-tax charges of $144.5 million for ourrestructuring activities, which were completed in the fourth quarter of fiscal 2009, and $240.7 million for theimpairment of goodwill, intangible and other assets of Umbro, which was recorded in the third quarter of fiscal2009. Our fiscal 2008 reported results include combined gains from the sale of our Starter Brand and NIKEBauer Hockey businesses of $35.4 million, net of tax, and a one-time tax benefit of $105.4 million. Excludingthese non-comparable items, net income would have increased 7% to $1.9 billion and diluted earnings per sharewould have increased 10% to $3.81 compared to fiscal 2008 (see Reconciliation of Net Income and DilutedEarnings Per Share Excluding Non-Comparable items below). The increase in our net income excludingnon-comparable items was higher than our rate of revenue growth in fiscal 2009 due primarily to an increase inother (income) expense, net, which included foreign currency conversion gains of $43.4 million compared toforeign currency conversion losses of $76.6 million in fiscal 2008, and the recognition of licensing income of$24.0 million related to our fiscal 2008 sale of the NIKE Bauer Hockey business. Excluding non-comparableitems, our earnings per share for the year grew at a higher rate than net income given lower outstanding sharesdue to repurchases made under our share repurchase program in the first half of fiscal 2009. Our cash flows fromoperations and return on invested capital both declined as compared to fiscal 2008.
During fiscal 2009, we took steps we believe prudent and necessary to identify and manage potentialexposures and to position ourselves for sustainable, profitable long-term growth. In the fourth quarter of fiscal2009, we executed a plan of restructuring the organization to streamline our management structure, enhanceconsumer focus, drive innovation more quickly to market, and establish a more scalable cost structure. As aresult of these actions, we reduced our global workforce by approximately 5% and incurred pre-tax restructuringcharges of $195 million, primarily consisting of cash charges related to severance costs. As part of thisrestructuring plan, we also initiated a reorganization of the NIKE brand business into a new operating modelconsisting of six geographies. As a result of the reorganization, beginning in the first quarter of fiscal 2010, ournew organizational structure will consist of the following geographies: North America, Western Europe, Central/Eastern Europe, Greater China, Japan, and Emerging Markets.
Other steps taken in fiscal 2009 included reductions in planned selling and administrative expenses,including the implementation of a hiring freeze, reductions in planned spending for travel, meetings and demandcreation, as well as tighter inventory purchasing and working capital management. We also placed increasedfocus on monitoring the financial health of suppliers and customers and continued to take proactive measures toconsolidate production with our strongest, most efficient and innovative manufacturing contractors to ensure wemaintain a healthy production base for the present and the future. These capacity consolidation actions couldresult in additional costs associated with production and logistics as well as supply chain disruptions in the firsthalf of fiscal year 2010 as we transition production between manufacturing contractors; however, we do notbelieve these potential additional costs will have a material impact on our operating results.
We continue to believe that the Company is well positioned from a business and financial perspective, butwe are not immune to the current challenging global economic conditions. These conditions could continue toaffect our business in a number of direct and indirect ways, including lower revenue from slowing consumer/customer demand for our products, reduced profit margins and/or increased costs, changes in interest andcurrency exchange rates, lack of credit availability and business disruptions due to difficulties experiences bysuppliers and customers. Our future performance is subject to the inherent uncertainty presented by the evolvingmacroeconomic conditions and our continued actions to respond to these conditions.
23

Results of Operations
Fiscal 2009 Fiscal 2008
FY09 vs.FY08
% Change Fiscal 2007
FY08 vs.FY07
% Change
(In millions, except per share data)
Revenues . . . . . . . . . . . . . . . . . . . . . $19,176.1 $18,627.0 3% $16,325.9 14%Cost of sales . . . . . . . . . . . . . . . . . . . 10,571.7 10,239.6 3% 9,165.4 12%Gross margin . . . . . . . . . . . . . . . . . . 8,604.4 8,387.4 3% 7,160.5 17%
Gross margin % . . . . . . . . . . . . 44.9% 45.0% 43.9%Selling and administrative
expense . . . . . . . . . . . . . . . . . . . . . 6,149.6 5,953.7 3% 5,028.7 18%% of Revenues . . . . . . . . . . . . . 32.1% 32.0% 30.8%
Restructuring charges . . . . . . . . . . . . 195.0 — — — —Goodwill impairment . . . . . . . . . . . . 199.3 — — — —Intangible and other asset
impairment . . . . . . . . . . . . . . . . . . 202.0 — — — —Income before income taxes . . . . . . . 1,956.5 2,502.9 -22% 2,199.9 14%Net income . . . . . . . . . . . . . . . . . . . . 1,486.7 1,883.4 -21% 1,491.5 26%Diluted earnings per share . . . . . . . . 3.03 3.74 -19% 2.93 28%
Reconciliation of Net Income and Diluted Earnings Per Share Excluding Non-Comparable Items(1)
Fiscal 2009 Fiscal 2008
FY09 vs.FY08
Change
(In millions, except per share data)
Net income, as reported . . . . . . . . . . . . . . . . . . . . . . . . . . . . . . . . . $1,486.7 $1,883.4 -21%Add:
Restructuring charges, net of tax(2) . . . . . . . . . . . . . . . . . . . . . 144.5 —Umbro impairment of goodwill, intangible and other assets,
net of tax(3) . . . . . . . . . . . . . . . . . . . . . . . . . . . . . . . . . . . . . 240.7 —Gain recognized on sale of NIKE Bauer Hockey, net of
tax . . . . . . . . . . . . . . . . . . . . . . . . . . . . . . . . . . . . . . . . . . . . — (17.7)Gain recognized on sale of Starter Business, net of tax . . . . . — (17.7)One-time tax benefits(4) . . . . . . . . . . . . . . . . . . . . . . . . . . . . . . — (105.4)
Net income, excluding non-comparable items . . . . . . . . . . . . . . . . $1,871.9 $1,742.6 7%
Diluted earnings per share, as reported . . . . . . . . . . . . . . . . . . . . . . $ 3.03 $ 3.74 -19%Add:
Restructuring charges, net of tax(2) . . . . . . . . . . . . . . . . . . . . . 0.29 —Umbro impairment of goodwill, intangible and other assets,
net of tax(3) . . . . . . . . . . . . . . . . . . . . . . . . . . . . . . . . . . . . . 0.49 —Gain recognized on sale of NIKE Bauer Hockey,
net of tax . . . . . . . . . . . . . . . . . . . . . . . . . . . . . . . . . . . . . . . — (0.04)Gain recognized on sale of Starter Business, net of tax . . . . . — (0.04)One-time tax benefits(4) . . . . . . . . . . . . . . . . . . . . . . . . . . . . . . — (0.21)
Diluted earnings per share, excluding non-comparable items . . . . $ 3.81 $ 3.45 10%
Diluted weighted average common shares outstanding . . . . . . . . . 490.7 504.1
(1) This schedule is intended to satisfy the quantitative reconciliation for non-GAAP financial measures inaccordance with Regulation G and Item 10(e) of Regulation S-K of the Securities and ExchangeCommission. In addition, this schedule is provided to enhance the visibility of the underlying businesstrends excluding these non-comparable items for the years ended May 31, 2009 and 2008.
24

(2) In the fourth quarter of fiscal 2009, we took necessary steps to streamline our management structure,enhance consumer focus, drive innovation more quickly to market, and establish a more scalable, long-termcost structure. As a result, we incurred a $195 million pre-tax restructuring charge primarily consisting ofseverance costs related to the workforce reduction.
(3) We recorded a non-cash impairment charge during the third quarter of fiscal 2009 to reduce the carryingvalue of Umbro’s goodwill, indefinite-lived trademark and other assets. The impairment charge is a result ofboth the deteriorating global consumer markets, particularly in Umbro’s primary market, the UnitedKingdom, and management’s decision to adjust planned investment in the brand. In addition, thedeterioration of the financial markets has reduced both the present value of future cash flows and the marketvalue of comparable businesses.
(4) The tax benefit realized during fiscal 2008 relates to steps taken to realize losses generated by severalinternational entities for which we had not previously recognized the offsetting tax benefit because therealization of those benefits had been uncertain. The necessary steps to realize those tax benefits were takenduring fiscal 2008 resulting in a one-time reduction of the effective tax rate.
Consolidated Operating Results
Revenues
Fiscal 2009 Fiscal 2008
FY09 vs.FY08
% Change Fiscal 2007
FY08 vs.FY07
% Change
(In millions)
Revenues . . . . . . . . . . . . . . . . . . . . . $19,176.1 $18,627.0 3% $16,325.9 14%
Fiscal 2009 Compared to Fiscal 2008
During fiscal 2009, changes in foreign currency exchange rates decreased revenues by 1 percentage point.The U.S. Region contributed nearly 1 percentage point of the consolidated revenue growth for fiscal 2009.Excluding the effects of changes in currency exchange rates, our international regions contributed over 3percentage points of the consolidated revenue growth for fiscal 2009, as all of our international regions postedhigher revenues on a currency neutral basis. By product group, our worldwide NIKE brand footwear businessreported revenue growth of 6% and contributed $575 million of incremental revenue for fiscal 2009. WorldwideNIKE branded apparel revenues were in line with the prior year, while equipment revenues declined 2% or $20million.
Our Other businesses, comprised primarily of results from Cole Haan, Converse Inc., Hurley InternationalLLC, NIKE Golf, and Umbro in fiscal 2009, constituted the remaining revenue. In fiscal 2008, our Otherbusinesses also included Exeter Brands Group (whose primary business was the Starter brand business whichwas sold on December 17, 2007) and NIKE Bauer Hockey (which was sold on April 17, 2008). Umbro wasacquired on March 3, 2008. Revenues for these businesses declined 1% or $17 million.
Fiscal 2008 Compared to Fiscal 2007
During fiscal 2008, changes in foreign currency exchange rates contributed 5 percentage points ofconsolidated revenue growth. Strong demand for NIKE brand products continued to drive revenue growth, as allfour of our geographic regions and, on a consolidated basis, all three of our product business units deliveredrevenue growth. The U.S. Region contributed nearly 2 percentage points of the consolidated revenue growth forfiscal 2008. Excluding the effects of changes in currency exchange rates, our international regions contributednearly 7 percentage points of the consolidated revenue growth for fiscal 2008, as all of our international regionsposted higher revenues. Our Other businesses contributed the remaining consolidated constant-currency revenuegrowth, as Cole Haan, Converse, Hurley and NIKE Golf posted higher year-over-year revenues.
25

By product group, worldwide NIKE brand footwear revenue grew 14% and contributed more than $1.2billion of incremental revenue for fiscal 2008. Worldwide NIKE branded apparel and equipment businessesreported revenue growth of 14% and 6% for the year, respectively, and combined added approximately $750million of incremental revenue in fiscal 2008. Our Other businesses reported revenue growth of 17% andcombined added more than $360 million of incremental revenue.
Gross Margin
Fiscal 2009 Fiscal 2008
FY09 vs.FY08
% Change Fiscal 2007
FY08 vs.FY07
% Change
(In millions)
Gross Margin . . . . . . . . . . . . . . . . . . . $8,604.4 $8,387.4 3% $7,160.5 17%Gross Margin % . . . . . . . . . . . . . 44.9% 45.0% (10 bps) 43.9% 110 bps
Fiscal 2009 Compared to Fiscal 2008
During fiscal 2009, the primary factors contributing to the 10 basis point decline in consolidated grossmargin percentage versus the prior year were lower gross pricing margins and increased discounts which, whencombined, decreased consolidated gross margins by approximately 60 basis points. This decrease was partiallyoffset by improved hedge rates relative to the prior year, primarily in the Europe, Middle East and Africa(“EMEA”) Region. Gross pricing margins were lower, primarily driven by higher product input costs, mostnotably for footwear products. Higher levels of discounts were provided across all businesses in fiscal 2009 tomanage inventory levels.
We anticipate our gross margins in fiscal 2010 will be negatively impacted by hedge rates that areunfavorable in comparison to the prior year.
Fiscal 2008 Compared to Fiscal 2007
During fiscal 2008, the primary factors contributing to the 110 basis point increase in the consolidated grossmargin percentage versus the prior year included: higher footwear in-line gross pricing margins, most notably inthe U.S. Region, primarily due to strategic price increases; improved currency hedge rates relative to the prioryear, primarily in the EMEA Region; and higher footwear close-out net pricing margins, most notably in theEMEA Region, primarily due to better inventory management. The factors driving an increased gross marginpercentage were partially offset by lower apparel in-line gross pricing margins primarily driven by higherproduct costs, most notably in the U.S. and EMEA regions, and increased apparel close-out sales, primarily in theU.S. Region.
Selling and Administrative Expense
Fiscal 2009 Fiscal 2008
FY09 vs.FY08
% Change Fiscal 2007
FY08 vs.FY07
% Change
(In millions)
Operating overhead expense . . . . . . . . $3,798.2 $3,645.4 4% $3,116.3 17%Demand creation expense(1) . . . . . . . . 2,351.4 2,308.3 2% 1,912.4 21%
Selling and administrativeexpense . . . . . . . . . . . . . . . . . . $6,149.6 $5,953.7 3% $5,028.7 18%
% of Revenues . . . . . . . . . . 32.1% 32.0% 10 bps 30.8% 120 bps
(1) Demand creation consists of advertising and promotion expenses, including costs of endorsement contracts.
26

Fiscal 2009 Compared to Fiscal 2008
Changes in foreign currency exchange rates decreased selling and administrative expense by 2 percentagepoints in fiscal 2009. Excluding changes in exchange rates, operating overhead increased 6% during fiscal 2009.The increase in operating overhead in fiscal 2009 was primarily attributable to investments in growth driverssuch as NIKE-owned retail in the U.S., EMEA and Asia Pacific regions, infrastructure for emerging markets inthe EMEA and Asia Pacific regions and non-NIKE brand businesses, which more than offset the steps taken toreduce operating overhead spending including implementation of a hiring freeze and reductions in spending fortravel and meetings.
On a constant-currency basis, demand creation expense increased 3% during fiscal 2009. Demand creationspending decreased in the second half of fiscal 2009 as a result of actions taken to reduce spending across nearlyall demand creation related activities, most notably traditional media and print advertising. The increase indemand creation the first half of fiscal 2009 was primarily attributable to strategic investments in demandcreation, including first quarter spending around the Beijing Summer Olympics and the European FootballChampionships, and increased investments in athlete and team endorsements across all regions.
In fiscal 2010, we intend to reduce selling and administrative spending while shifting resources to fundinitiatives that are critical to the achievement of our long-term growth goals. We expect our selling andadministrative expenses to decline in the first half of fiscal 2010 compared to the same period in the prior year,reflecting both lower operating overhead and demand creation spending, with the latter driven partially by thecomparison to the significant prior year demand creation investment around the Beijing Summer Olympics andEuropean Football Championships. Future selling and administrative expense may vary from our currentexpectations due to changes in the rapidly evolving macroeconomic environment and our reaction to thosechanges.
Fiscal 2008 Compared to Fiscal 2007
In fiscal 2008, selling and administrative expenses increased as a percentage of revenues by 120 basispoints, driven primarily by strategic investments in both demand creation and operating overhead. Changes incurrency exchange rates increased selling and administrative expense growth by 4 percentage points.
On a constant-currency basis, demand creation expense increased 15% versus the prior year. The year-over-year increase was primarily attributable to investments in athlete and sport team endorsers of our products,spending around major sporting events including the European Football Championships and the Beijing SummerOlympics, key product initiatives such as Men’s Training in the U.S. and retail presentation.
Excluding the effects of changes in exchange rates, operating overhead increased 14% versus the prior year.The increase in operating overhead was attributable to investments in growth drivers such as NIKE-owned retail,non-NIKE brand businesses, emerging markets and normal wage inflation and performance-based compensation.
Restructuring Charges
During the fourth quarter of fiscal 2009, we executed a plan to restructure the organization to streamline ourmanagement structure, enhance consumer focus, drive innovation more quickly to market and establish a morescalable cost structure. As a result of these actions, we reduced our global workforce by approximately 5% andincurred pre-tax restructuring charges of $195 million, primarily consisting of cash charges related to severancecosts. These charges are included in our “Corporate” category for segment reporting purposes.
Goodwill, Intangible and Other Asset Impairment
In the third quarter of fiscal 2009, we recognized a $401.3 million pre-tax non-cash impairment charge toreduce the carrying value of Umbro’s goodwill, intangible and other assets. Although Umbro’s financial
27

performance for fiscal 2009 was slightly better than we had originally expected, projected future cash flows hadfallen below the levels we expected at the time of acquisition. This erosion is a result of both the unprecedenteddecline in global consumer markets, particularly in the United Kingdom, and our decision to adjust the level ofinvestment in the business.
We measured the fair value of Umbro by using an equal weighting of the fair value implied by a discountedcash flow analysis and by comparisons with the market values of similar publicly traded companies. We believethe blended use of both models compensates for the inherent risk associated with either model if used on a stand-alone basis, and this combination is indicative of the factors a market participant would consider whenperforming a similar valuation. The fair value of Umbro’s indefinite-lived trademark was estimated using therelief from royalty method, which assumes that the trademark has value to the extent that Umbro is relieved ofthe obligation to pay royalties for the benefits received from the trademark. Our assessments have resulted in therecognition of impairment charges of $199.3 million and $181.3 million related to Umbro’s goodwill andtrademark, respectively, in fiscal 2009. In addition to the impairment analysis, we determined an equityinvestment held by Umbro was impaired, and recognized a charge of $20.7 million related to the impairment ofthis investment. These charges are included in our “Other” category for segment reporting purposes.
For additional information about our impairment charges, see Note 4 — Acquisition, Identifiable IntangibleAssets, Goodwill and Umbro Impairment in the accompanying notes to the consolidated financial statements.
Other (Income) Expense, net
Fiscal 2009 Compared to Fiscal 2008
For fiscal 2009, other (income) expense, net was a gain of $88.5 million compared to a loss of $7.9 millionin fiscal 2008. Other (income) expense, net is primarily comprised of foreign currency conversion gains andlosses from the remeasurement of monetary assets and liabilities in non-functional currencies and results offoreign currency derivative instruments, as well as disposals of fixed assets and other unusual or non-recurringtransactions that are outside the normal course of business. For fiscal 2009, other (income) expense, net wasprimarily comprised of $43.4 million of foreign currency conversion gains and the recognition of $24.0 millionof licensing income related to our fiscal 2008 sale of the NIKE Bauer Hockey business. For fiscal 2008, other(income) expense, net was primarily comprised of a $32.0 million gain on the sale of NIKE Bauer Hockey and a$28.6 million gain on the sale of the Starter brand business, as well as foreign currency conversion losses of$76.6 million.
Foreign currency conversion gains and losses reported in other (income) expense, net, with the exception ofgains and losses generated by the EMEA Region and Other businesses, are reflected in the Corporate line in oursegment presentation of pre-tax income in the accompanying notes to the consolidated financial statements(Note 19 — Operating Segments and Related Information).
For fiscal 2009, we estimate that the combination of foreign currency conversion gains in other (income)expense, net and the modestly favorable translation of foreign currency-denominated profits from ourinternational businesses resulted in a year-over-year increase in consolidated income before income taxes ofapproximately $124 million.
Fiscal 2008 Compared to Fiscal 2007
For fiscal 2008, other (income) expense, net was a loss of $7.9 million compared to a gain of $0.9 million infiscal 2007. In fiscal 2008, other (income) expense, net included foreign currency conversion losses that werepartially offset by the $32.0 million gain on the sale of NIKE Bauer Hockey and the $28.6 million gain on thesale of the Starter brand business. Other (income) expense, net in fiscal 2007 is primarily comprised of the $14.7million gain on the sale-leaseback of our Oregon footwear distribution center and the $14.2 million benefit fromthe settlement of the Converse arbitration, partially offset by foreign currency conversion losses.
28

In fiscal 2008, we estimate that the combination of favorable translation of foreign currency-denominatedprofits from international businesses and the foreign currency conversion losses included in other (income)expense, net resulted in a year-over-year increase in consolidated income before income taxes of approximately$122 million.
Income Taxes
Fiscal 2009 Fiscal 2008
FY09 vs.FY08
% Change Fiscal 2007
FY08 vs.FY07
% Change
Effective tax rate . . . . . . . . . . . . . . . . . 24.0% 24.8% (80) bps 32.2% (740) bps
Fiscal 2009 Compared to Fiscal 2008
Our effective tax rate for fiscal 2009 was 80 basis points lower than the effective tax rate for fiscal 2008 dueprimarily to the tax benefit related to the impairment of goodwill, intangible and other assets of Umbro that had afavorable impact of 250 basis points. Profits earned outside of the U.S., the impact of the resolution of foreignaudit items and the retroactive reinstatement of the research and development tax credit also favorably impactedour fiscal 2009 effective tax rate. Reflected in the effective tax rate for fiscal 2008 was a one-time tax benefit of$105.4 million, which had a favorable impact of 420 basis points on our effective tax rate. We estimate that oureffective tax rate for fiscal year 2010 will be approximately 25.5%.
Fiscal 2008 Compared to Fiscal 2007
Our effective tax rate for fiscal 2008 was 24.8%, 740 basis points lower than the prior year. Over the lastfew years, several of our international entities generated losses for which we did not recognize the correspondingtax benefits, as the realization of those benefits was uncertain. In the first quarter of fiscal 2008, we took stepsnecessary to realize these benefits, resulting in a one-time tax benefit of $105.4 million. Also reflected in theyear-over-year effective tax rate improvement was a reduction in our on-going effective tax rate resulting fromour profits earned outside the United States; our effective tax rates for these operations are generally lower thanthe U.S. statutory rate.
Futures Orders
Worldwide futures and advance orders for footwear and apparel scheduled for delivery from June throughNovember 2009 declined 12% compared to orders reported for the comparable period of fiscal 2009. This futuresgrowth rate is calculated based upon our forecasts of the actual exchange rates under which our revenues will betranslated during this period, which approximate current spot rates. The net effect from changes in currencyexchange rates contributed approximately 7 percentage points to this reported futures decline versus the sameperiod in the prior year. Excluding this currency impact, lower apparel orders drove most of the decline in overallfutures and advance orders.
The reported futures and advance orders are not necessarily indicative of our expectation of revenue growthduring this period. This is because the mix of orders can shift between advance/futures and at-once orders andthat the fulfillment of certain orders may fall outside of the scheduled noted above. In addition, exchange ratefluctuations as well as differing levels of order cancellations and discounts can cause differences in thecomparisons between futures and advance orders, and actual revenues. Moreover, a significant portion of ourrevenue is not derived from futures and advance orders, including at-once and close-out sales of NIKE footwearand apparel, wholesale sales of equipment, Cole Haan, Converse, Hurley, Umbro, NIKE Golf and retail salesacross all brands.
29

Operating Segments
The breakdown of revenues follows:
Fiscal 2009 Fiscal 2008(1)
FY09 vs.FY08
% Change Fiscal 2007(1)
FY08 vs.FY07
% Change
(In millions)
U.S. Region . . . . . . . . . . . . . . . . . . $ 6,542.9 $ 6,414.5 2% $ 6,131.7 5%EMEA Region . . . . . . . . . . . . . . . . 5,512.2 5,629.2 -2% 4,764.1 18%Asia Pacific Region . . . . . . . . . . . . 3,322.0 2,887.6 15% 2,295.7 26%Americas Region . . . . . . . . . . . . . . 1,284.7 1,164.7 10% 966.7 20%
Total NIKE Brand Revenues . . . . 16,661.8 16,096.0 4% 14,158.2 14%Other . . . . . . . . . . . . . . . . . . . . . . . 2,514.3 2,531.0 -1% 2,167.7 17%
Total NIKE, Inc. Revenues . . . . . . $19,176.1 $18,627.0 3% $16,325.9 14%
(1) Certain prior year amounts have been reclassified to conform to fiscal year 2009 presentation. Thesechanges had no impact on previously reported results of operations or shareholders’ equity.
The breakdown of income before income taxes (“pre-tax income”) follows:
Fiscal 2009 Fiscal 2008(1)
FY09 vs.FY08
% Change Fiscal 2007(1)
FY08 vs.FY07
% Change
(In millions)
U.S. Region . . . . . . . . . . . . . . . . . . $ 1,337.9 $ 1,402.0 -5% $ 1,386.1 1%EMEA Region . . . . . . . . . . . . . . . . 1,316.9 1,281.9 3% 1,050.1 22%Asia Pacific Region . . . . . . . . . . . . 853.4 694.2 23% 515.4 35%Americas Region . . . . . . . . . . . . . . 274.1 242.3 13% 199.3 22%Other . . . . . . . . . . . . . . . . . . . . . . . (196.7) 364.9 -154% 299.7 22%Corporate Expense . . . . . . . . . . . . . (1,629.1) (1,482.4) -10% (1,250.7) -19%
Total Pre-tax Income . . . . . . . . . . . $ 1,956.5 $ 2,502.9 -22% $ 2,199.9 14%
(1) Certain prior year amounts have been reclassified to conform to fiscal year 2009 presentation. Thesechanges had no impact on previously reported results of operations or shareholders’ equity.
The following discussion includes disclosure of pre-tax income for our operating segments. We havereported pre-tax income for each of our operating segments in accordance with Statement of FinancialAccounting Standard (“SFAS”) No. 131, “Disclosures about Segments of an Enterprise and RelatedInformation.” As discussed in Note 19 — Operating Segments and Related Information in the accompanyingnotes to the consolidated financial statements, certain corporate costs are not included in pre-tax income of ouroperating segments.
U.S. Region
Fiscal 2009 Fiscal 2008
FY09 vs.FY08
% Change Fiscal 2007
FY08 vs.FY07
% Change
(In millions)
RevenuesFootwear . . . . . . . . . . . . . . . . . . . $4,550.8 $4,326.8 5% $4,067.2 6%Apparel . . . . . . . . . . . . . . . . . . . . 1,664.4 1,745.1 -5% 1,716.1 2%Equipment . . . . . . . . . . . . . . . . . . 327.7 342.6 -4% 348.4 -2%
Total Revenues . . . . . . . . . . $6,542.9 $6,414.5 2% $6,131.7 5%
Pre-tax Income . . . . . . . . . . . . . . . . . . $1,337.9 $1,402.0 -5% $1,386.1 1%
30

Fiscal 2009 Compared to Fiscal 2008
During fiscal 2009, the increase in U.S. footwear revenue was the result of low-single digit growth in bothunit sales and average selling price per pair. The growth in unit sales was primarily driven by higher demand forour Jordan brand, action sports and kids’ products. The increase in average selling price per pair was attributableto selective price increases, primarily during the first half of fiscal 2009, and increased sales mix of higher pricedJordan brand products, partially offset by increased sales mix of kids’ products which are lower priced.
The year-over-year decrease in U.S. apparel revenues during fiscal 2009 reflected a mid-single digitdecrease in unit sales, primarily driven by a reduction in products sold to value channel retailers and generallysofter demand in the overall apparel market. Average selling prices increased slightly as a result of the reductionin products sold to value retailers, mostly offset by an increased mix of close-out sales and higher levels ofdiscounts provided retailers to manage inventory levels.
Pre-tax income for the U.S. Region declined in fiscal 2009 as a result of higher operating overhead expensesand lower gross margins. The increase in operating overhead was attributable to investments in NIKE-ownedretail. Gross margins decreased as a result of higher warehousing costs, higher retail inventory markdowns andincreased customer discounts provided to manage inventory levels.
Fiscal 2008 Compared to Fiscal 2007
During fiscal 2008, the increase in U.S. footwear revenue was the result of low-single digit growth in unitsales and a slight increase in the average selling price per pair. The growth in unit sales and average selling priceper pair was driven by higher demand for our NIKE brand sportswear products and Jordan brand products,partially offset by a decrease in demand for our NIKE brand basketball products. The increase in average sellingprice per pair was also attributable to strategic price increases and an increased sales mix of higher priced NIKEbrand sportswear and Jordan brand products.
The year-over-year increase in U.S. apparel revenues during fiscal 2008 reflected an increase in unit sales,mostly offset by lower average selling prices. The increase in unit sales was primarily driven by higher close-outsales and increased demand for NIKE brand sports performance products, partially offset by lower unit sales ofsportswear and Jordan brand products. Average selling prices decreased primarily as a result of a higher mix ofclose-out sales.
The year-over-year decrease in U.S. equipment revenues during fiscal 2008 was primarily the result oflower unit sales of accessory products and fewer close-out sales.
Pre-tax income for the U.S. Region grew at a slower rate than revenue in fiscal 2008 as a result of higherdemand creation and operating overhead expenses, partially offset by higher gross margins, driven by footwear.The increase in demand creation was driven by higher sports marketing expenses and investments in the retailpresentation of our key wholesale customers. The increase in operating overhead was attributable to investmentsin NIKE-owned retail and normal wage inflation.
31

EMEA Region
Fiscal 2009 Fiscal 2008
FY09 vs.FY08
% Change Fiscal 2007
FY08 vs.FY07
% Change
(In millions)
RevenuesFootwear . . . . . . . . . . . . . . . . . . . $3,136.7 $3,112.6 1% $2,608.0 19%Apparel . . . . . . . . . . . . . . . . . . . . 1,970.2 2,083.5 -5% 1,757.2 19%Equipment . . . . . . . . . . . . . . . . . . 405.3 433.1 -6% 398.9 9%
Total Revenues . . . . . . . . . . $5,512.2 $5,629.2 -2% $4,764.1 18%
Pre-tax Income . . . . . . . . . . . . . . . . . . $1,316.9 $1,281.9 3% $1,050.1 22%
Fiscal 2009 Compared to Fiscal 2008
For the EMEA Region, changes in currency exchange rates negatively impacted revenue growth byapproximately 2 percentage points in fiscal 2009. Excluding changes in currency exchange rates, a number ofmarkets within the region experienced lower revenues, reflecting a more difficult retail environment in thesemarkets. The U.K. remained flat for fiscal 2009 while the emerging markets in the region grew 14%, driven bystronger results in Russia during the first half of fiscal 2009. These results were offset by lower revenues inSouthern European markets, including Spain, Italy and France.
Excluding changes in exchange rates, footwear revenues increased 4 percentage points during fiscal 2009.The increase in footwear revenue was attributable to mid single-digit growth in unit sales, partially offset by alow single-digit decrease in the average selling price per pair. The growth in unit sales was driven primarily byhigher demand for NIKE brand sportswear and kids’ products. The decrease in average selling price per pair wasmainly attributable to higher customer discounts and a shift in product mix to lower priced product models, mostnotably higher volume of kids’ products.
On a currency neutral basis, EMEA apparel revenue decreased 4 percentage points during fiscal 2009,primarily driven by lower average selling prices resulting from a higher mix of close-out sales and higher levelsof discounts provided retailers to manage inventory levels, which more than offset a mid single-digit increase inunit sales.
The year-over-year increase in pre-tax income for the EMEA Region during fiscal 2009 was primarilydriven by a higher gross margin percentage, partially offset by slightly higher selling and administrative expensesas a percentage of revenues. The gross margin improvement in fiscal 2009 was primarily attributable to improvedyear-over-year currency hedge rates which more than offset higher warehousing costs and discounts on in-lineproducts. The increase in selling and administrative expenses was mainly driven by retail expansion across theregion.
Fiscal 2008 Compared to Fiscal 2007
For the EMEA Region, changes in currency exchange rates contributed 11 percentage points of the revenuegrowth during fiscal 2008. Nearly all markets within the region increased revenues during the year. Theemerging markets in the region grew nearly 25%, driven by strong results in Russia, Turkey and South Africa.Increases in Northern Europe and the U.K. also contributed significantly to the revenue growth.
Excluding changes in exchange rates, footwear revenues increased 8 percentage points during fiscal 2008compared to the prior year. The increase in footwear revenue was attributable to double-digit growth in unitsales, partially offset by a low single-digit decrease in the average selling price per pair. The growth in unit saleswas driven primarily by higher demand for our NIKE brand soccer and sportswear products. The decrease in
32

average selling price per pair resulted from a shift in product mix from higher priced to lower priced productmodels, most notably within our NIKE brand sportswear product lines.
On a currency neutral basis, EMEA apparel revenue increased 8 percentage points during fiscal 2008compared to the prior year, primarily as a result of increased unit sales and a slight increase in average sellingprices. The increase in unit sales was driven primarily by increased demand for sports performance products,most notably soccer.
The increase in pre-tax income for the EMEA Region during fiscal 2008 compared to the prior year wasprimarily driven by the increase in revenues, favorable foreign currency translation and a higher gross marginpercentage, partially offset by higher selling and administrative expenses as a percentage of revenues. The grossmargin improvement in fiscal 2008 was primarily attributable to improved year-over-year hedge rates andimproved margins on close-out product. The increase in selling and administrative expenses was driven by anincrease in demand creation spending, primarily attributable to spending around the European FootballChampionships. As a result of retail expansion and overall business growth across the region, operating overheadexpenses increased for the year, but at a slower rate than revenue growth.
Asia Pacific Region
Fiscal 2009 Fiscal 2008
FY09 vs.FY08
% Change Fiscal 2007
FY08 vs.FY07
% Change
(In millions)
RevenuesFootwear . . . . . . . . . . . . . . . . . . . $1,727.1 $1,499.5 15% $1,159.2 29%Apparel . . . . . . . . . . . . . . . . . . . . 1,322.3 1,140.0 16% 909.3 25%Equipment . . . . . . . . . . . . . . . . . . 272.6 248.1 10% 227.2 9%
Total Revenues . . . . . . . . . . $3,322.0 $2,887.6 15% $2,295.7 26%
Pre-tax Income . . . . . . . . . . . . . . . . . . $ 853.4 $ 694.2 23% $ 515.4 35%
Fiscal 2009 Compared to Fiscal 2008
In the Asia Pacific Region, changes in currency exchange rates contributed 3 percentage points of revenuegrowth for fiscal 2009. Excluding changes in currency exchange rates, all countries across the region deliveredrevenue growth. China continues to be the primary driver of growth within the region as fiscal 2009 revenuesincreased 22% on a currency-neutral basis, driven by expansion in both the number of stores selling NIKEproducts and sales through existing stores. China’s rate of revenue growth slowed to 6% in the fourth quarter offiscal 2009 as we lapped very strong growth in the fourth quarter of fiscal 2008. On a currency neutral basis,revenues in Japan were up 1% compared to fiscal 2008.
Footwear and apparel revenue growth for fiscal 2009 were driven primarily by an increase in unit sales,most notably in China. The growth in unit sales was slightly offset by a low-single digit reduction in averageselling prices in fiscal 2009 resulting primarily from increased discounts on in-line products provided retailers tomanage inventory levels.
The increase in pre-tax income for the Asia Pacific Region for fiscal 2009 was driven by higher revenuesand improved gross margins, which more than offset higher selling and administrative expenses. Gross marginsimproved versus the prior year, primarily driven by improved year-over-year standard foreign currency rates andreduced warehousing costs, which more than offset increased product discounts. Selling and administrativeexpenses increased, but represented a lower percentage of revenues in fiscal 2009 versus fiscal 2008. Theincrease in selling and administrative expenses during fiscal 2009 was primarily due to retail and infrastructureexpansion, primarily in China, and spending around brand events.
33

Fiscal 2008 Compared to Fiscal 2007
In the Asia Pacific Region, changes in currency exchange rates contributed 6 percentage points of revenuegrowth for fiscal 2008. Nearly all countries across the region delivered revenue growth on a currency neutralbasis. China continues to be the primary driver of growth within the region as fiscal 2008 revenues increased50% on a currency-neutral basis, driven by the expansion in both the number of stores selling NIKE products andsales through existing stores. Constant-currency revenues in Japan increased 2% during fiscal 2008.
Footwear revenue growth for fiscal 2008 reflected increased unit sales, most notably in China, partiallyoffset by lower average selling prices driven primarily by a shift in mix from higher priced to lower pricedmodels. The year-over-year increase in apparel revenue was driven by increased demand in China.
The increase in pre-tax income for the Asia Pacific Region for fiscal 2008 was driven by higher revenues,improved gross margins and favorable foreign currency translation, which more than offset slightly higher sellingand administrative expenses as a percentage of revenue. The gross margin improvement versus the prior year wasprimarily driven by reduced warehousing costs, improved year-over-year standard currency rates and improvedmargins on close-out product. The increase in selling and administrative expenses during fiscal 2008 wasprimarily attributable to spending around the Beijing Summer Olympics. Overall business growth across theregion combined with retail expansion, primarily in China, also contributed to an increase in operating overheadexpenses, which grew slightly slower than revenues.
Americas Region
Fiscal 2009 Fiscal 2008
FY09 vs.FY08
% Change Fiscal 2007
FY08 vs.FY07
% Change
(In millions)
RevenuesFootwear . . . . . . . . . . . . . . . . . . . $ 892.1 $ 792.7 13% $679.6 17%Apparel . . . . . . . . . . . . . . . . . . . . 287.8 265.4 8% 193.9 37%Equipment . . . . . . . . . . . . . . . . . . 104.8 106.6 -2% 93.2 14%
Total Revenues . . . . . . . . . . $1,284.7 $1,164.7 10% $966.7 20%
Pre-tax Income . . . . . . . . . . . . . . . . . . $ 274.1 $ 242.3 13% $199.3 22%
Fiscal 2009 Compared to Fiscal 2008
In the Americas Region, changes in currency exchange rates negatively impacted revenue growth byapproximately 9 percentage points in fiscal 2009. Excluding changes in foreign currency exchange rates, theAmericas Region reported growth in all markets, led by Brazil, Argentina and Mexico.
The increase in pre-tax income for fiscal 2009 was primarily attributable to higher revenues and selling andadministrative expense leverage, which more than offset lower gross margins. Selling and administrativeexpenses were higher than fiscal 2008, but represented a lower percentage of revenues for fiscal 2009. Theincrease in selling and administrative expense was due to increases in both demand creation and operatingoverhead expenses mainly driven by spending around retail marketing programs, brand events and normal wageinflation. The slight decrease in gross margin percentage in fiscal 2009 was mainly due to a higher sales mix oflower margin footwear products and higher import costs, which more than offset improved year-on-year standardforeign currency rates.
Fiscal 2008 Compared to Fiscal 2007
In the Americas Region, changes in currency exchange rates contributed 7 percentage points of revenuegrowth for fiscal 2008. Excluding changes in foreign currency exchange rates, the Americas Region reportedgrowth in all markets, led by Argentina, Mexico and Brazil.
34
The increase in pre-tax income for fiscal 2008 versus the prior year was primarily attributable to higherrevenues, improved gross margins and operating overhead leverage, combined with favorable foreign currencytranslation. These factors were partially offset by higher demand creation spending as a percentage of revenue.The gross margin improvement was driven primarily by higher in-line net pricing margins resulting from a bettermix of products sold and fewer discounts offered in fiscal 2008 compared to fiscal 2007. The increase in demandcreation spending during fiscal 2008 was primarily attributable to investments in sports marketing, most notablyin soccer, brand events and investments in our retail presentation.
Other Businesses
Fiscal 2009 Fiscal 2008
FY09 vs.FY08
% Change Fiscal 2007
FY08 vs.FY07
% Change
(In millions)
RevenuesConverse . . . . . . . . . . . . . . . . . . . $ 915.3 $ 729.0 26% $ 563.8 29%NIKE Golf . . . . . . . . . . . . . . . . . 648.3 725.2 -11% 646.3 12%Cole Haan . . . . . . . . . . . . . . . . . . 471.6 496.2 -5% 468.6 6%Hurley . . . . . . . . . . . . . . . . . . . . . 202.9 171.1 19% 150.6 14%Umbro . . . . . . . . . . . . . . . . . . . . . 174.0 53.9 223% — —Bauer . . . . . . . . . . . . . . . . . . . . . . — 201.9 -100% 166.1 22%Exeter . . . . . . . . . . . . . . . . . . . . . — 35.1 -100% 67.7 -48%Other . . . . . . . . . . . . . . . . . . . . . . 102.2 118.6 -14% 104.6 13%
Revenues . . . . . . . . . . . . . . . . . . . . . . . $2,514.3 $2,531.0 -1% $2,167.7 17%
Pre-tax Income . . . . . . . . . . . . . . . . . . $ (196.7) $ 364.9 -154% $ 299.7 22%
Fiscal 2009 Compared to Fiscal 2008
For fiscal 2009, our Other businesses were primarily comprised of Cole Haan, Converse, Hurley, NIKEGolf and Umbro. For fiscal 2008, our Other businesses were primarily comprised of Cole Haan, Converse,Exeter (whose primary business was the Starter brand business which was sold on December 17, 2007), Hurley,NIKE Bauer Hockey (which was sold on April 17, 2008), NIKE Golf and Umbro (which was acquired onMarch 3, 2008).
The slight decrease in Other businesses revenues for fiscal 2009 was primarily attributable to the loss ofrevenue from NIKE Bauer Hockey and the Starter brand business. Excluding the loss of revenue from NIKEBauer Hockey and the Starter brand business and the addition of Umbro, Other businesses revenues for fiscal2009 would have increased 5%, driven by the strong performance from Converse and Hurley, offset by salesdecreases at NIKE Golf and Cole Haan, due to reductions in consumer discretionary spending in their respectivemarkets.
Pre-tax income for Other businesses declined for fiscal 2009 primarily as a result of a $401.3 million pre-taxnon-cash impairment charge to reduce the carrying value of Umbro’s goodwill, intangible and other assets.Excluding the impairment charge, the loss of income from NIKE Bauer Hockey and the Starter brand businessalong with the dilutive impact of Umbro, pre-tax income for Other businesses would have decreased by 28%,driven by declines in operating results at NIKE Golf and Cole Haan.
For additional information about our impairment charges, see Note 4 — Acquisition, Identifiable IntangibleAssets, Goodwill and Umbro Impairment in the accompanying notes to the consolidated financial statements.
35
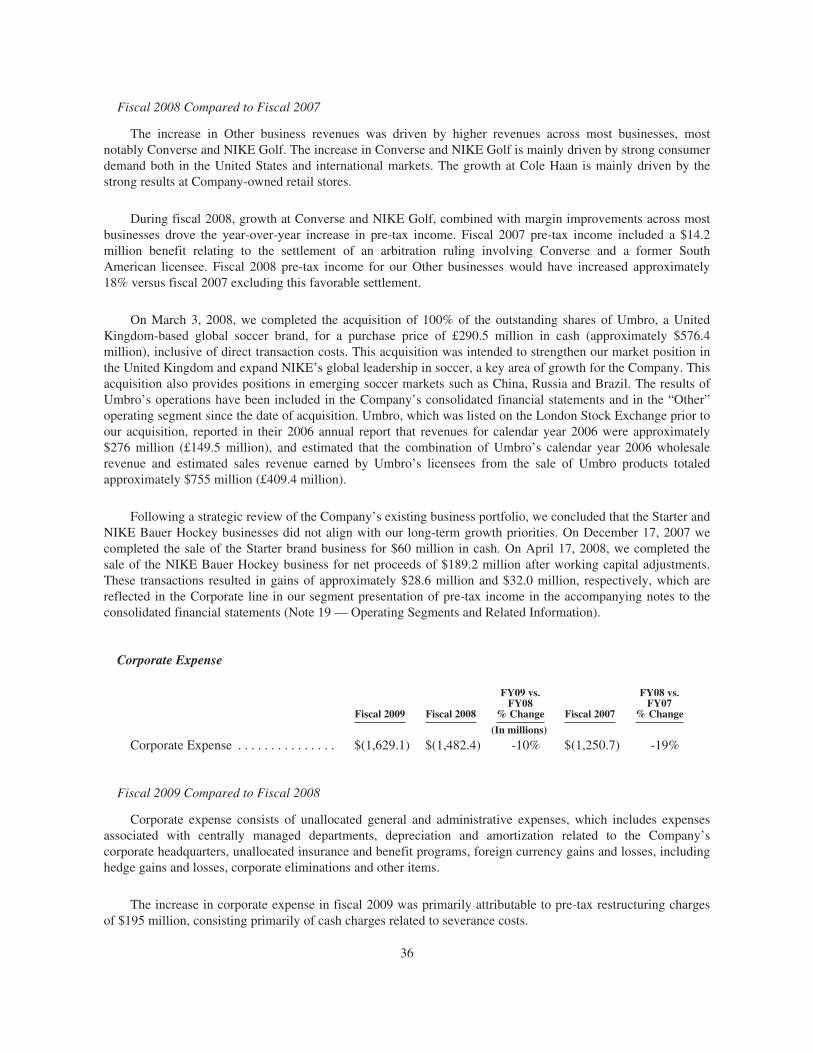
Fiscal 2008 Compared to Fiscal 2007
The increase in Other business revenues was driven by higher revenues across most businesses, mostnotably Converse and NIKE Golf. The increase in Converse and NIKE Golf is mainly driven by strong consumerdemand both in the United States and international markets. The growth at Cole Haan is mainly driven by thestrong results at Company-owned retail stores.
During fiscal 2008, growth at Converse and NIKE Golf, combined with margin improvements across mostbusinesses drove the year-over-year increase in pre-tax income. Fiscal 2007 pre-tax income included a $14.2million benefit relating to the settlement of an arbitration ruling involving Converse and a former SouthAmerican licensee. Fiscal 2008 pre-tax income for our Other businesses would have increased approximately18% versus fiscal 2007 excluding this favorable settlement.
On March 3, 2008, we completed the acquisition of 100% of the outstanding shares of Umbro, a UnitedKingdom-based global soccer brand, for a purchase price of £290.5 million in cash (approximately $576.4million), inclusive of direct transaction costs. This acquisition was intended to strengthen our market position inthe United Kingdom and expand NIKE’s global leadership in soccer, a key area of growth for the Company. Thisacquisition also provides positions in emerging soccer markets such as China, Russia and Brazil. The results ofUmbro’s operations have been included in the Company’s consolidated financial statements and in the “Other”operating segment since the date of acquisition. Umbro, which was listed on the London Stock Exchange prior toour acquisition, reported in their 2006 annual report that revenues for calendar year 2006 were approximately$276 million (£149.5 million), and estimated that the combination of Umbro’s calendar year 2006 wholesalerevenue and estimated sales revenue earned by Umbro’s licensees from the sale of Umbro products totaledapproximately $755 million (£409.4 million).
Following a strategic review of the Company’s existing business portfolio, we concluded that the Starter andNIKE Bauer Hockey businesses did not align with our long-term growth priorities. On December 17, 2007 wecompleted the sale of the Starter brand business for $60 million in cash. On April 17, 2008, we completed thesale of the NIKE Bauer Hockey business for net proceeds of $189.2 million after working capital adjustments.These transactions resulted in gains of approximately $28.6 million and $32.0 million, respectively, which arereflected in the Corporate line in our segment presentation of pre-tax income in the accompanying notes to theconsolidated financial statements (Note 19 — Operating Segments and Related Information).
Corporate Expense
Fiscal 2009 Fiscal 2008
FY09 vs.FY08
% Change Fiscal 2007
FY08 vs.FY07
% Change
(In millions)
Corporate Expense . . . . . . . . . . . . . . . $(1,629.1) $(1,482.4) -10% $(1,250.7) -19%
Fiscal 2009 Compared to Fiscal 2008
Corporate expense consists of unallocated general and administrative expenses, which includes expensesassociated with centrally managed departments, depreciation and amortization related to the Company’scorporate headquarters, unallocated insurance and benefit programs, foreign currency gains and losses, includinghedge gains and losses, corporate eliminations and other items.
The increase in corporate expense in fiscal 2009 was primarily attributable to pre-tax restructuring chargesof $195 million, consisting primarily of cash charges related to severance costs.
36

Foreign currency gains and losses include conversion gains and losses generated by our centrally managedforeign currency hedging program and other conversion gains and losses. Foreign currency gains and losses alsoinclude gains and losses resulting from the difference between actual foreign currency rates and standard ratesassigned to our regions. With the exception of foreign currency gains and losses generated by the EMEA Regionand Other businesses, which are reported within their respective operating results, substantially all of theCompany’s remaining conversion gains and losses as well as standard to actual foreign currency gains and lossesreside at Corporate. In fiscal 2009, foreign currency conversion gains (losses) reported in Corporate expense totaled$45.9 million compared to ($76.3) million in fiscal 2008, which was primarily driven by a net gain from currencyhedges in fiscal 2009 versus a net hedge loss in fiscal 2008.
Fiscal 2008 Compared to Fiscal 2007
The increase in corporate expense from fiscal 2007 to fiscal 2008 was primarily driven by increased employeecompensation expense due to the increase in centralized corporate functions, higher performance-basedcompensation as well as increased investments in demand creation, including other spending around the BeijingSummer Olympics.
In fiscal 2008, foreign currency conversion loss reported in Corporate expense totaled $76.3 millioncompared to $31.7 million in fiscal 2007, which was primarily driven by a larger net loss from currency hedgesin fiscal 2008 versus 2007.
Foreign Currency Exposures and Hedging Practices
Overview
As a global company with significant operations outside the U.S., in the normal course of business we areexposed to risk arising from changes in currency exchange rates. Foreign currency fluctuations affect therecording of transactions, such as sales, purchases and intercompany transactions denominated in non-functionalcurrencies and the translation of foreign currency denominated results of operations, financial position and cashflows into U.S. dollars for consolidated reporting. Our primary foreign currency exposures are related to U.S.dollar transactions at wholly-owned foreign subsidiaries, as well as transactions and translation of resultsdenominated in the Euro, British pound, Chinese renminbi and Japanese yen.
Our foreign exchange risk management program is intended to minimize both the positive and negativeeffects of currency fluctuations on our reported consolidated results of operations, financial position and cashflows. This also has the effect of delaying the impact of current market rates on our consolidated financialstatements, dependent upon hedge horizons. We manage global foreign exchange risk centrally on a portfoliobasis, to manage those risks that are material to NIKE, Inc. on a consolidated basis. We manage these exposuresby taking advantage of natural offsets and currency correlations that exist within the portfolio, and by hedgingremaining material exposures, where practical, using derivative instruments such as forward contracts andoptions. The Company’s hedging policies are designed to partially or entirely offset changes in the underlyingexposures being hedged. We account for derivative financial instruments in accordance with SFAS No. 133,“Accounting for Derivative Instruments and Hedging Activities,” as issued and amended (“FAS 133”). We donot hold or issue derivative financial instruments for speculative trading purposes.
Transactional exposures
We transact business in various currencies and have significant revenues and costs denominated incurrencies other than the functional currency of the relevant subsidiary, which subjects us to foreign currencyrisk. Our most significant transactional foreign currency exposures are:
1. Inventory Purchases — Most of our inventory purchases around the world are denominated in U.S.dollars. This generates foreign currency exposures for all subsidiaries with a functional currency other
37

than the U.S. dollar. A weaker U.S. dollar reduces the inventory cost in the purchasing subsidiary’sfunctional currency whereas a stronger U.S. dollar increases the inventory cost.
2. Non-Functional Currency Revenues — A portion of our EMEA Region revenues are earned incurrencies other than the Euro (e.g. British pound), but are recognized at a subsidiary that uses the Euroas its functional currency, generating foreign currency exposures.
3. Other Revenues and Costs — Non-functional currency revenues and costs, such as endorsementcontracts, intercompany royalties and other payments, generate foreign currency risk to a lesser extent.
4. Non-functional currency asset and liabilities — Our global subsidiaries have various assets andliabilities, primarily receivables and payables, that are denominated in currencies other than theirfunctional currency. These balance sheet items are subject to remeasurement under SFAS No. 52,“Foreign Currency Translation,” (“FAS 52”), which may create fluctuations in other (income) expensewithin our consolidated results of operations.
Managing transactional exposures
Transactional exposures are managed on a portfolio basis within our foreign currency risk managementprogram. We use currency forward contracts and options with maturities up to 23 months to hedge the effect ofexchange rate fluctuations on probable forecasted future cash flows, including non-functional currency revenuesand expenses. These are accounted for as cash flow hedges in accordance with FAS 133. The fair value of theseinstruments at May 31, 2009 and 2008 was $248.0 million and $95.3 million in assets and $12.2 million and$149.8 million in liabilities, respectively. The effective portion of the changes in fair value of these instruments isreported in other comprehensive income (“OCI”), a component of shareholders’ equity, and reclassified intoearnings in the same financial statement line item and in the same period or periods during which the relatedhedged transactions affect earnings. The ineffective portion, which was not material for any year presented, isimmediately recognized in earnings as a component of other (income) expense, net.
Certain currency forward contracts used to manage foreign exchange exposure of non-functional currencyassets and liabilities subject to remeasurement are not designated as hedges under FAS 133. In these cases, thechange in value of the instruments is intended to offset the foreign currency impact of the remeasurement of therelated asset or liability. The fair value of these instruments at May 31, 2009 and 2008, was $13.2 million and$34.2 million in assets and $34.3 million and $7.3 million in liabilities, respectively. The change in value of theseinstruments is immediately recognized in earnings. The impact of such instruments is included in other (income)expense, net and aims to offset foreign currency remeasurement gains and losses of the exposures being hedged.
Refer to Note 18 — Risk Management and Derivatives in the accompanying notes to the consolidatedfinancial statements for additional quantitative detail.
Translational exposures
Substantially all of our foreign subsidiaries operate in functional currencies other than the U.S. dollar.Fluctuations in currency exchange rates create volatility in our reported results as we are required to translate thebalance sheets and operational results of these foreign currency denominated subsidiaries into U.S. dollars forconsolidated reporting. The translation of foreign subsidiaries non-U.S. dollar balance sheets into U.S. dollars forconsolidated reporting results in a cumulative translation adjustment to OCI within shareholders’ equity. Inpreparing our consolidated statements of income, foreign exchange rate fluctuations impact our operating results asthe revenues and expenses of our foreign operations are translated into U.S. dollars. In translation, a weakerU.S. dollar in relation to foreign functional currencies benefits our consolidated earnings whereas a strongerU.S. dollar reduces our consolidated earnings. The impact of foreign exchange rate fluctuations on the translation ofour consolidated revenues and pre-tax income was a net translation benefit (detriment) of ($199.4) million and $4.0million, respectively, for the twelve months ended May 31, 2009.
38

Managing translational exposures
To minimize the impact of translating foreign currency denominated revenues and expenses into U.S.dollars for consolidated reporting, certain foreign subsidiaries use excess cash to purchase U.S. dollardenominated available-for-sale investments. The variable future cash flows associated with the purchase andsubsequent sale of these U.S. dollar denominated securities at non-U.S. dollar functional currency subsidiariescreates a foreign currency exposure that qualifies for hedge accounting under FAS 133. We utilize forwardcontracts and options to partially, or entirely, hedge the variability of the forecasted future purchases and sales ofthese U.S. dollar investments. This has the effect of partially offsetting the year-over-year foreign currencytranslation impact on net earnings in the period the investments are sold. Hedges of available-for-saleinvestments are accounted for as cash flow hedges. The fair value of instruments used in this manner at May 31,2009 and 2008 was $103.6 million and $7.8 million in assets and $0 and $14.4 million in liabilities, respectively.The effective portion of the changes in fair value of these instruments is reported in OCI and reclassified intoearnings in other (income) expense, net in the period during which the hedged available-for-sale investment issold and affects earnings. Any ineffective portion, which was not material for any year presented, is immediatelyrecognized in earnings as a component of other (income) expense, net.
For fiscal 2009, we estimate that the combination of foreign currency conversion gains in other (income)expense, net and the modestly favorable translation of foreign currency-denominated profits from ourinternational businesses resulted in a year-over-year increase in consolidated income before income taxes ofapproximately $124 million.
Refer to Note 18 — Risk Management and Derivatives in the accompanying notes to the consolidatedfinancial statements for additional quantitative detail.
Net investments in foreign subsidiaries
We are also exposed to the impact of foreign exchange fluctuations on our investments in wholly-ownedforeign subsidiaries denominated in a currency other than the U.S. dollar, which could adversely impact theU.S. dollar value of these investments and therefore the value of future repatriated earnings. During fiscal 2008,we began to hedge certain net investment positions in Euro-functional currency foreign subsidiaries to mitigatethe effects of foreign exchange fluctuations on net investments, with the effect of preserving the value of futurerepatriated earnings. In accordance with FAS 133, the effective portion of the change in fair value of the forwardcontracts designated as net investment hedges is recorded in the cumulative translation adjustment component ofaccumulated other comprehensive income. Any ineffective portion, which was not material for any yearpresented, is immediately recognized in earnings as a component of other (income) expense, net. To minimizecredit risk, we have structured these net investment hedges to be generally less than six months in duration. Uponmaturity, the hedges are settled based on the current fair value of the forward contracts with the realized gain orloss remaining in OCI; concurrent with settlement, we enter into new forward contracts at the current marketrate. The impact of net investment hedges reflected in OCI was a pre-tax gain (loss) of $161.4 million and($68.6) million in 2009 and 2008, respectively. Cash flows from net investment hedge settlements totaled $191.3million and ($76.0) million in 2009 and 2008, respectively.
Liquidity and Capital Resources
Cash Flow Activity
Cash provided by operations was $1.7 billion for fiscal 2009 compared to $1.9 billion for fiscal 2008. Thisdecrease was mainly due to an increase in cash used for our working capital as a result of lower accounts payableand a higher accounts receivable balance. The decrease in accounts payable was primarily due to lower purchasesof inventory as well as a reduction in overall spending. The higher accounts receivable balance is a result of alonger collection cycle, reflecting a more challenging retail environment experienced by our customers in theEMEA and U.S. regions.
39

Cash used by investing activities was $0.8 billion during fiscal 2009 compared to $0.5 billion in fiscal 2008.The year-over-year increase was primarily due to a net increase in short-term investments purchased in fiscal2009. The increase in net purchases of short-term investments in fiscal 2009 was partially offset by proceedsfrom settlement of net investment hedges of $191.3 million. During the second half of fiscal 2008, we began touse net investment hedges to mitigate the risk of variability in foreign-currency-denominated net investments incertain wholly-owned international subsidiaries.
Cash used in financing activities was $0.7 billion during fiscal 2009, compared to $1.2 billion in fiscal2008. The decrease in fiscal 2009 was primarily due to a decrease in share repurchases to preserve liquidity giventhe current financial market conditions.
In fiscal 2009, we purchased approximately 10.6 million shares of NIKE’s Class B Common Stock for$639.0 million. As of the end of fiscal 2009, we have repurchased 49.2 million shares for $2.7 billion under the$3 billion program approved by our Board of Directors in June 2006. In September 2008, our Board of Directorsapproved a new $5 billion share repurchase program. The new program will commence upon completion of ourcurrent $3 billion share repurchase program. We expect to fund share repurchases from operating cash flow,excess cash, and/or debt. The timing and the amount of shares purchased will be dictated by our capital needs andstock market conditions.
Off-Balance Sheet Arrangements
In connection with various contracts and agreements, we provide routine indemnifications relating to theenforceability of intellectual property rights, coverage for legal issues that arise and other items that fall underthe scope of Financial Accounting Standards Board (“FASB”) Interpretation No. 45, “Guarantor’s Accountingand Disclosure Requirements for Guarantees, Including Indirect Guarantees of Indebtedness of Others.”Currently, we have several such agreements in place. However, based on our historical experience and theestimated probability of future loss, we have determined that the fair value of such indemnifications is notmaterial to our financial position or results of operations.
Contractual Obligations
Our significant long-term contractual obligations as of May 31, 2009, and significant endorsement contractsentered into through the date of this report are as follows:
Cash Payments Due During the Year Ending May 31,
Description of Commitment 2010 2011 2012 2013 2014 Thereafter Total
(In millions)
Operating Leases . . . . . . . . . . . . . . . . $ 330.2 $ 281.3 $ 233.6 $195.6 $168.6 $ 588.5 $1,797.8Long-term Debt . . . . . . . . . . . . . . . . . 32.0 6.9 167.1 46.9 56.9 144.6 $ 454.4Endorsement Contracts(1) . . . . . . . . . . 711.7 654.6 601.0 509.7 431.0 1,293.9 $4,201.9Product Purchase Obligations(2) . . . . . 1,985.7 — — — — — $1,985.7Other(3) . . . . . . . . . . . . . . . . . . . . . . . . 247.1 106.3 67.8 78.0 3.0 2.0 $ 504.2
Total . . . . . . . . . . . . . . . . . . . . . . $3,306.7 $1,049.1 $1,069.5 $830.2 $659.5 $2,029.0 $8,944.0
(1) The amounts listed for endorsement contracts represent approximate amounts of base compensation andminimum guaranteed royalty fees we are obligated to pay athlete and sport team endorsers of our products.Actual payments under some contracts may be higher than the amounts listed as these contracts provide forbonuses to be paid to the endorsers based upon athletic achievements and/or royalties on product sales infuture periods. Actual payments under some contracts may also be lower as these contracts includeprovisions for reduced payments if athletic performance declines in future periods.
In addition to the cash payments, we are obligated to furnish our endorsers with NIKE product for their use.It is not possible to determine how much we will spend on this product on an annual basis as the contractsgenerally do not stipulate a specific amount of cash to be spent on the product. The amount of
40

product provided to the endorsers will depend on many factors including general playing conditions, thenumber of sporting events in which they participate, and our own decisions regarding product and marketinginitiatives. In addition, the costs to design, develop, source, and purchase the products furnished to theendorsers are incurred over a period of time and are not necessarily tracked separately from similar costsincurred for products sold to customers.
(2) We generally order product at least four to five months in advance of sale based primarily on advancedfutures orders received from customers. The amounts listed for product purchase obligations representagreements (including open purchase orders) to purchase products in the ordinary course of business, thatare enforceable and legally binding and that specify all significant terms. In some cases, prices are subject tochange throughout the production process. The reported amounts exclude product purchase liabilitiesincluded in accounts payable on the consolidated balance sheet as of May 31, 2009.
(3) Other amounts primarily include service and marketing commitments made in the ordinary course ofbusiness. The amounts represent the minimum payments required by legally binding contracts andagreements that specify all significant terms, including open purchase orders for non-product purchases. Thereported amounts exclude those liabilities included in accounts payable or accrued liabilities on theconsolidated balance sheet as of May 31, 2009.
The total liability for uncertain tax positions was $273.9 million, excluding related interest and penalties, atMay 31, 2009. We are not able to reasonably estimate when or if cash payments of the long-term liability foruncertain tax positions will occur.
We also have the following outstanding short-term debt obligations as of May 31, 2009. Please refer to theaccompanying notes to the consolidated financial statements (Note 7 — Short-Term Borrowings and CreditLines) for further description and interest rates related to the short-term debt obligations listed below.
Outstanding as ofMay 31, 2009
(In millions)
Notes payable, due at mutually agreed-upon dates within one year of issuance or ondemand . . . . . . . . . . . . . . . . . . . . . . . . . . . . . . . . . . . . . . . . . . . . . . . . . . . . . . . . . . . $342.9
Payable to Sojitz America for the purchase of inventories, generally due 60 daysafter shipment of goods from a foreign port . . . . . . . . . . . . . . . . . . . . . . . . . . . . . . . $ 78.5
As of May 31, 2009, letters of credit of $154.8 million were outstanding, generally for the purchase ofinventory.
Capital Resources
In December 2008, we filed a shelf registration statement with the Securities and Exchange Commissionunder which $760 million in debt securities may be issued. As of May 31, 2009, no debt securities had beenissued under this shelf registration. We may issue debt securities under the shelf registration in fiscal 2010depending on general corporate needs.
As of May 31, 2009, we had no amounts outstanding under our multi-year, $1 billion revolving creditfacility in place with a group of banks. The facility matures in December 2012. Based on our current long-termsenior unsecured debt ratings of A+ and A1 from Standard and Poor’s Corporation and Moody’s InvestorServices, respectively, the interest rate charged on any outstanding borrowings would be the prevailing LondonInterbank Offer Rate (“LIBOR”) plus 0.15%. The facility fee is 0.05% of the total commitment.
If our long-term debt rating were to decline, the facility fee and interest rate under our committed creditfacility would increase. Conversely, if our long-term debt rating were to improve, the facility fee and interest ratewould decrease. Changes in our long-term debt rating would not trigger acceleration of maturity of any thenoutstanding borrowings or any future borrowings under the committed credit facility. Under this committedcredit facility, we have agreed to various covenants. These covenants include limits on our disposal of fixedassets and the amount of debt secured by liens we may incur as well as a minimum capitalization ratio. In the
41

event we were to have any borrowings outstanding under this facility, failed to meet any covenant, and wereunable to obtain a waiver from a majority of the banks, any borrowings would become immediately due andpayable. As of May 31, 2009, we were in full compliance with each of these covenants and believe it is unlikelywe will fail to meet any of these covenants in the foreseeable future.
Liquidity is also provided by our $1 billion commercial paper program. As of May 31, 2009, $100 millionwas outstanding under this program at a weighted average interest rate of 0.40%. This borrowing was repaidsubsequent to May 31, 2009. We may issue commercial paper from time to time during fiscal 2010 depending ongeneral corporate needs. We currently have short-term debt ratings of A1 and P1 from Standard and Poor’sCorporation and Moody’s Investor Services, respectively.
Despite recent uncertainties in the financial markets, to date we have not experienced difficulty accessingthe credit markets or incurred higher interest costs. Continuing volatility in the capital markets, however, mayincrease costs associated with issuing commercial paper or other debt instruments or affect our ability to accessthose markets. Notwithstanding these adverse market conditions, we believe that current cash and short-terminvestment balances and cash generated by operations, together with access to external sources of funds asdescribed above, will be sufficient to meet our operating and capital needs in the foreseeable future.
Recently Adopted Accounting Standards
On December 1, 2008, we adopted SFAS No. 161, “Disclosures about Derivative Instruments and HedgingActivities — an amendment of FASB Statement No. 133” (“FAS 161”), which provides revised guidance forenhanced disclosures about how and why an entity uses derivative instruments, how derivative instruments andthe related hedged items are accounted for under FAS 133, and how derivative instruments and the relatedhedged items affect an entity’s financial position, financial performance and cash flows. The adoption of FAS161 did not have an impact on our consolidated financial position or results of operations. For additionalinformation, see Note 18 — Risk Management and Derivatives in the accompanying notes to the consolidatedfinancial statements.
On June 1, 2008, we adopted SFAS No. 157, “Fair Value Measurements” (“FAS 157”) for financial assetsand liabilities, which clarifies the meaning of fair value, establishes a framework for measuring fair value andexpands disclosures about fair value measurements. Fair value is defined under FAS 157 as the exchange pricethat would be received for an asset or paid to transfer a liability in the principal or most advantageous market forthe assets or liability in an orderly transaction between market participants on the measurement date. Subsequentchanges in fair value of these financial assets and liabilities are recognized in earnings or other comprehensiveincome when they occur. The effective date of the provisions of FAS 157 for non-financial assets and liabilities,except for items recognized at fair value on a recurring basis, was deferred by FASB Staff Position FAS 157-2(“FSP FAS 157-2”) and is effective for the fiscal year beginning June 1, 2009. The adoption of FAS 157 forfinancial assets and liabilities did not have an impact on our consolidated financial position or results ofoperations. The adoption of FAS 157 for non-financial assets and liabilities is not expected to have a significantimpact on our consolidated financial position or results of operations. See Note 6 — Fair Value Measurements inthe accompanying notes to the consolidated financial statements for further discussion.
Also effective June 1, 2008, we adopted SFAS No. 159, “The Fair Value Option for Financial Assets andFinancial Liabilities” (“FAS 159”), which allows an entity the irrevocable option to elect fair value for the initialand subsequent measurement for certain financial assets and liabilities on a contract-by-contract basis. As ofMay 31, 2009, we have not elected the fair value option for any additional financial assets and liabilities beyondthose already prescribed by accounting principles generally accepted in the United States.
In October 2008, the FASB issued Staff Position No. FAS 157-3, “Determining the Fair Value of aFinancial Asset in a Market That Is Not Active” (“FSP FAS 157-3”). FSP FAS 157-3 clarifies the application ofFAS 157 in a market that is not active and defines additional key criteria in determining the fair value of a
42

financial asset when the market for that financial asset is not active. FSP FAS 157-3 applies to financial assetswithin the scope of accounting pronouncements that require or permit fair value measurements in accordancewith FAS 157. FSP FAS 157-3 was effective upon issuance and the application of FSP FAS 157-3 did not have amaterial impact on our consolidated financial statements.
Recently Issued Accounting Standards
In May 2009, the FASB issued SFAS No. 165, “Subsequent Events” (“FAS 165”), which establishesgeneral standards of accounting and disclosure for events that occur after the balance sheet date but beforefinancial statements are issued. The provisions of FAS 165 are effective for the quarter ending August 31, 2009.We do not expect the adoption will have a material impact on our consolidated financial position or results ofoperations.
In April 2009, the FASB issued Staff Position No. FAS 107-1 and APB 28-1, “Interim Disclosures aboutFair Value of Financial Instruments” (“FSP FAS 107-1 and APB 28-1”), which amends SFAS No. 107,“Disclosures about Fair Value of Financial Instruments”, and APB Opinion No. 28, “Interim FinancialReporting,” to require disclosures about fair value of financial instruments in interim and annual reportingperiods. The provisions of FSP FAS 107-1 and APB 28-1 are effective for the quarter ending August 31, 2009.We do not expect the adoption will have an impact on our consolidated financial position or results of operations.
In December 2007, the FASB issued SFAS No. 141 (revised 2007), “Business Combinations” (“FAS141(R)”) and SFAS No. 160, “Noncontrolling Interests in Consolidated Financial Statements” (“FAS 160”).These standards aim to improve, simplify, and converge international standards of accounting for businesscombinations and the reporting of noncontrolling interests in consolidated financial statements. The provisions ofFAS 141(R) are effective for business combinations for which the acquisition date is on or after June 1, 2009.Generally, the effects of FAS 141(R) will depend on future acquisitions. The provisions of FAS No. 160 areeffective for the Company beginning June 1, 2009. We do not expect that the adoption of FAS 160 will have amaterial impact on the Company’s consolidated financial position or results of operations.
In April 2008, the FASB issued Staff Position No. FAS 142-3, “Determination of the Useful Life ofIntangible Assets” (“FSP FAS 142-3”). FSP FAS 142-3 amends the factors that should be considered indeveloping renewal or extension assumptions used to determine the useful life of a recognized intangible assetunder SFAS No. 142, “Goodwill and Other Intangible Assets.” The intent of the position is to improve theconsistency between the useful life of a recognized intangible asset under SFAS No. 142 and the period ofexpected cash flows used to measure the fair value of the asset under FAS 141(R), and other U.S. generallyaccepted accounting principles. The provisions of FSP FAS 142-3 are effective for the fiscal year beginningJune 1, 2009. We do not expect the adoption of FSP FAS 142-3 will have a material impact on our consolidatedfinancial position or results of operations.
Critical Accounting Policies
Our previous discussion and analysis of our financial condition and results of operations are based upon ourconsolidated financial statements, which have been prepared in accordance with accounting principles generallyaccepted in the United States of America. The preparation of these financial statements requires us to makeestimates and judgments that affect the reported amounts of assets, liabilities, revenues and expenses, and relateddisclosure of contingent assets and liabilities.
We believe that the estimates, assumptions and judgments involved in the accounting policies describedbelow have the greatest potential impact on our financial statements, so we consider these to be our criticalaccounting policies. Because of the uncertainty inherent in these matters, actual results could differ from theestimates we use in applying the critical accounting policies. Certain of these critical accounting policies affect
43

working capital account balances, including the policies for revenue recognition, the allowance for uncollectibleaccounts receivable, inventory reserves, and contingent payments under endorsement contracts. These policiesrequire that we make estimates in the preparation of our financial statements as of a given date. However, sinceour business cycle is relatively short, actual results related to these estimates are generally known within thesix-month period following the financial statement date. Thus, these policies generally affect only the timing ofreported amounts across two to three fiscal quarters.
Within the context of these critical accounting policies, we are not currently aware of any reasonably likelyevents or circumstances that would result in materially different amounts being reported.
Revenue Recognition
We record wholesale revenues when title passes and the risks and rewards of ownership have passed to thecustomer, based on the terms of sale. Title passes generally upon shipment or upon receipt by the customerdepending on the country of the sale and the agreement with the customer. Retail store revenues are recorded atthe time of sale.
In some instances, we ship product directly from our supplier to the customer and recognize revenue whenthe product is delivered to and accepted by the customer. Our revenues may fluctuate in cases when ourcustomers delay accepting shipment of product for periods up to several weeks.
In certain countries outside of the U.S., precise information regarding the date of receipt by the customer isnot readily available. In these cases, we estimate the date of receipt by the customer based upon historicaldelivery times by geographic location. On the basis of our tests of actual transactions, we have no indication thatthese estimates have been materially inaccurate historically.
As part of our revenue recognition policy, we record estimated sales returns and miscellaneous claims fromcustomers as reductions to revenues at the time revenues are recorded. We base our estimates on historical ratesof product returns and claims, and specific identification of outstanding claims and outstanding returns not yetreceived from customers. Actual returns and claims in any future period are inherently uncertain and thus maydiffer from our estimates. If actual or expected future returns and claims were significantly greater or lower thanthe reserves we had established, we would record a reduction or increase to net revenues in the period in whichwe made such determination.
Allowance for Uncollectible Accounts Receivable
We make ongoing estimates relating to the ability to collect our accounts receivable and maintain anallowance for estimated losses resulting from the inability of our customers to make required payments. Indetermining the amount of the allowance, we consider our historical level of credit losses and make judgmentsabout the creditworthiness of significant customers based on ongoing credit evaluations. Since we cannot predictfuture changes in the financial stability of our customers, actual future losses from uncollectible accounts maydiffer from our estimates. If the financial condition of our customers were to deteriorate, resulting in theirinability to make payments, a larger allowance might be required. In the event we determine that a smaller orlarger allowance is appropriate, we would record a credit or a charge to selling and administrative expense in theperiod in which such a determination is made.
Inventory Reserves
We also make ongoing estimates relating to the net realizable value of inventories, based upon ourassumptions about future demand and market conditions. If we estimate that the net realizable value of ourinventory is less than the cost of the inventory recorded on our books, we record a reserve equal to the differencebetween the cost of the inventory and the estimated net realizable value. This reserve is recorded as a charge to
44

cost of sales. If changes in market conditions result in reductions in the estimated net realizable value of ourinventory below our previous estimate, we would increase our reserve in the period in which we made such adetermination and record a charge to cost of sales.
Contingent Payments under Endorsement Contracts
A significant portion of our demand creation expense relates to payments under endorsement contracts. Ingeneral, endorsement payments are expensed uniformly over the term of the contract. However, certain contractelements may be accounted for differently, based upon the facts and circumstances of each individual contract.
Some of the contracts provide for contingent payments to endorsers based upon specific achievements intheir sports (e.g., winning a championship). We record selling and administrative expense for these amountswhen the endorser achieves the specific goal.
Some of the contracts provide for payments based upon endorsers maintaining a level of performance intheir sport over an extended period of time (e.g., maintaining a top ranking in a sport for a year). These amountsare reported in selling and administrative expense when we determine that it is probable that the specified levelof performance will be maintained throughout the period. In these instances, to the extent that actual payments tothe endorser differ from our estimate due to changes in the endorser’s athletic performance, increased ordecreased selling and administrative expense may be reported in a future period.
Some of the contracts provide for royalty payments to endorsers based upon a predetermined percentage ofsales of particular products. We expense these payments in cost of sales as the related sales occur. In certaincontracts, we offer minimum guaranteed royalty payments. For contractual obligations for which we estimatethat we will not meet the minimum guaranteed amount of royalty fees through sales of product, we record theamount of the guaranteed payment in excess of that earned through sales of product in selling and administrativeexpense uniformly over the remaining guarantee period.
Property, Plant and Equipment and Definite-Lived Assets
Property, plant and equipment, including buildings, equipment, and computer hardware and software arerecorded at cost (including, in some cases, the cost of internal labor) and are depreciated over the estimateduseful life. Changes in circumstances (such as technological advances or changes to our business operations) canresult in differences between the actual and estimated useful lives. In those cases where we determine that theuseful life of a long-lived asset should be shortened, we increase depreciation expense over the remaining usefullife to depreciate the asset’s net book value to its salvage value.
We review the carrying value of long-lived assets or asset groups to be used in operations whenever eventsor changes in circumstances indicate that the carrying amount of the assets might not be recoverable. Factors thatwould necessitate an impairment assessment include a significant adverse change in the extent or manner inwhich an asset is used, a significant adverse change in legal factors or the business climate that could affect thevalue of the asset, or a significant decline in the observable market value of an asset, among others. If such factsindicate a potential impairment, we would assess the recoverability of an asset group by determining if thecarrying value of the asset group exceeds the sum of the projected undiscounted cash flows expected to resultfrom the use and eventual disposition of the assets over the remaining economic life of the primary asset in theasset group. If the recoverability test indicates that the carrying value of the asset group is not recoverable, wewill estimate the fair value of the asset group using appropriate valuation methodologies which would typicallyinclude an estimate of discounted cash flows. Any impairment would be measured as the difference between theasset groups carrying amount and its estimated fair value.
45

Goodwill and Indefinite-Lived Intangible Assets
In accordance with SFAS No. 142 “Goodwill and Other Intangible Assets” (“FAS 142”), we perform annualimpairment tests on goodwill and intangible assets with indefinite lives in the fourth quarter of each fiscal year,or when events occur or circumstances change that would, more likely than not, reduce the fair value of areporting unit or an intangible asset with an indefinite life below its carrying value. Events or changes incircumstances that may trigger interim impairment reviews include significant changes in business climate,operating results, planned investments in the reporting unit, or an expectation that the carrying amount may notbe recoverable, among other factors. The impairment test requires us to estimate the fair value of our reportingunits. If the carrying value of a reporting unit exceeds its fair value, the goodwill of that reporting unit ispotentially impaired and we proceed to step two of the impairment analysis. In step two of the analysis, wemeasure and record an impairment loss equal to the excess of the carrying value of the reporting unit’s goodwillover its implied fair value should such a circumstance arise.
We generally base our measurement of the fair value of a reporting unit on a blended analysis of the presentvalue of future discounted cash flows and the market valuation approach. The discounted cash flows modelindicates the fair value of the reporting unit based on the present value of the cash flows that we expect thereporting unit to generate in the future. Our significant estimates in the discounted cash flows model include: ourweighted average cost of capital; long-term rate of growth and profitability of the reporting unit’s business; andworking capital effects. The market valuation approach indicates the fair value of the business based on acomparison of the reporting unit to comparable publicly traded firms in similar lines of business. Significantestimates in the market valuation approach model include identifying similar companies with comparablebusiness factors such as size, growth, profitability, risk and return on investment and assessing comparablerevenue and operating income multiples in estimating the fair value of the reporting unit.
We believe the weighted use of discounted cash flows and the market valuation approach is the best methodfor determining the fair value of our reporting units because these are the most common valuation methodologiesused within our industry; and the blended use of both models compensates for the inherent risks associated witheither model if used on a stand-alone basis.
Indefinite-lived intangible assets primarily consist of acquired trade names and trademarks. In measuring thefair value for these intangible assets, we utilize the relief-from-royalty method. This method assumes that tradenames and trademarks have value to the extent that their owner is relieved of the obligation to pay royalties forthe benefits received from them. This method requires us to estimate the future revenue for the related brands, theappropriate royalty rate and the weighted average cost of capital.
Hedge Accounting for Derivatives
We use forward exchange contracts and option contracts to hedge certain anticipated foreign currencyexchange transactions, as well as any resulting receivable or payable balance. When specific criteria required bySFAS No. 133, “Accounting for Derivative and Hedging Activities,” as amended and interpreted (“FAS 133”),have been met, changes in fair values of hedge contracts relating to anticipated transactions are recorded in othercomprehensive income rather than net income until the underlying hedged transaction affects net income. In mostcases, this results in gains and losses on hedge derivatives being released from other comprehensive income intonet income some time after the maturity of the derivative. One of the criteria for this accounting treatment is thatthe forward exchange contract amount should not be in excess of specifically identified anticipated transactions.By their very nature, our estimates of anticipated transactions may fluctuate over time and may ultimately varyfrom actual transactions. When anticipated transaction estimates or actual transaction amounts decrease belowhedged levels, or when the timing of transactions changes beyond the threshold allowed by FAS 133, we arerequired to reclassify at least a portion of the cumulative changes in fair values of the related hedge contractsfrom other comprehensive income to other (income) expense, net during the quarter in which such changes
46

occur. Once an anticipated transaction estimate or actual transaction amount decreases below hedged levels, wemake adjustments to the related hedge contract in order to reduce the amount of the hedge contract to that of therevised anticipated transaction.
We use forward contracts to hedge our investment in the net assets of certain international subsidiaries tooffset foreign currency translation and economic exposures related to our net investment in those subsidiaries.When appropriately designated as a hedge in accordance with FAS 133, the change in fair value of the forwardcontracts hedging our net investments is reported in the cumulative translation adjustment component ofaccumulated other comprehensive income within stockholders’ equity to offset the foreign currency translationadjustments on those investments.
As the value of our underlying net investments in wholly-owned international subsidiaries is known at thetime a hedge is placed, the designated hedge is matched to the portion of our net investment at risk. Accordingly,the variability involved in net investment hedges is substantially less than that of other types of hedgetransactions and we do not expect any material ineffectiveness. In accordance with FAS 133, we consider, on aquarterly basis, the need to redesignate existing hedge relationships based on changes in the underlying netinvestment. Should the level of our net investment decrease below hedged levels, any resulting ineffectivenesswould be reported directly to earnings in the period incurred.
Stock-based Compensation
As of the first quarter of fiscal 2007, we account for stock-based compensation in accordance with SFASNo. 123R “Share-Based Payment” (“FAS 123R”). Under the provisions of FAS 123R, the fair value of stock-based compensation is estimated on the date of grant using the Black-Scholes option pricing model. The Black-Scholes option pricing model requires the input of highly subjective assumptions including volatility. Expectedvolatility is estimated based on implied volatility in market traded options on our common stock with a termgreater than one year, along with other factors. Our decision to use implied volatility was based on theavailability of actively traded options on our common stock and our assessment that implied volatility is morerepresentative of future stock price trends than historical volatility. If factors change and we use differentassumptions for estimating stock-based compensation expense in future periods, stock-based compensationexpense may differ materially in the future from that recorded in the current period.
Taxes
We record valuation allowances against our deferred tax assets, when necessary, in accordance withSFAS No. 109, “Accounting for Income Taxes” (“FAS 109”). Realization of deferred tax assets (such as netoperating loss carry-forwards) is dependent on future taxable earnings and is therefore uncertain. At leastquarterly, we assess the likelihood that our deferred tax asset balance will be recovered from future taxableincome. To the extent we believe that recovery is not likely, we establish a valuation allowance against ourdeferred tax asset, which increases our income tax expense in the period when such determination is made.
In addition, we have not recorded U.S. income tax expense for foreign earnings that we have determined tobe indefinitely reinvested offshore, thus reducing our overall income tax expense. The amount of earningsdesignated as indefinitely reinvested offshore is based upon the actual deployment of such earnings in ouroffshore assets and our expectations of the future cash needs of our U.S. and foreign entities. Income taxconsiderations are also a factor in determining the amount of foreign earnings to be indefinitely reinvestedoffshore.
We carefully review all factors that drive the ultimate disposition of foreign earnings determined to bereinvested offshore, and apply stringent standards to overcoming the presumption of repatriation. Despite thisapproach, because the determination involves our future plans and expectations of future events, the possibilityexists that amounts declared as indefinitely reinvested offshore may ultimately be repatriated. For instance, the
47

actual cash needs of our U.S. entities may exceed our current expectations, or the actual cash needs of our foreignentities may be less than our current expectations. This would result in additional income tax expense in the yearwe determined that amounts were no longer indefinitely reinvested offshore. Conversely, our approach may alsoresult in a determination that accumulated foreign earnings (for which U.S. income taxes have been provided)will be indefinitely reinvested offshore. In this case, our income tax expense would be reduced in the year of suchdetermination.
On an interim basis, we estimate what our effective tax rate will be for the full fiscal year. The estimatedannual effective tax rate is then applied to the year-to-date pre-tax income excluding infrequently occurring orunusual items, to determine the year-to-date tax expense. The income tax effects of infrequent or unusual itemsare recognized in the interim period in which they occur. As the fiscal year progresses, we continually refine ourestimate based upon actual events and earnings by jurisdiction during the year. This continual estimation processperiodically results in a change to our expected effective tax rate for the fiscal year. When this occurs, we adjustthe income tax provision during the quarter in which the change in estimate occurs so that the year-to-dateprovision equals the expected annual rate.
We account for uncertain tax positions in accordance with FASB Interpretation No. 48, “Accounting forUncertainty in Income Taxes” (“FIN 48”). On a quarterly basis, we reevaluate the probability that a tax positionwill be effectively sustained and the appropriateness of the amount recognized for uncertain tax positions basedon factors including changes in facts or circumstances, changes in tax law, settled audit issues and new auditactivity. Changes in our assessment may result in the recognition of a tax benefit or an additional charge to thetax provision in the period our assessment changes. We recognize interest and penalties related to income taxmatters in income tax expense.
Other Contingencies
In the ordinary course of business, we are involved in legal proceedings regarding contractual andemployment relationships, product liability claims, trademark rights, and a variety of other matters. We recordcontingent liabilities resulting from claims against us, including related legal costs, when a loss is assessed to beprobable and the amount of the loss is reasonably estimable. Assessing probability of loss and estimatingprobable losses requires analysis of multiple factors, including in some cases judgments about the potentialactions of third party claimants and courts. Recorded contingent liabilities are based on the best informationavailable and actual losses in any future period are inherently uncertain. If future adjustments to estimatedprobable future losses or actual losses exceed our recorded liability for such claims, we would record additionalcharges as other (income) expense, net during the period in which the actual loss or change in estimate occurred.In addition to contingent liabilities recorded for probable losses, we disclose contingent liabilities when there is areasonable possibility that the ultimate loss will materially exceed the recorded liability. Currently, we do notbelieve that any of our pending legal proceedings or claims will have a material impact on our financial positionor results of operations.
Item 7A. Quantitative and Qualitative Disclosures about Market Risk
In the normal course of business and consistent with established policies and procedures, we employ avariety of financial instruments to manage exposure to fluctuations in the value of foreign currencies and interestrates. It is our policy to utilize these financial instruments only where necessary to finance our business andmanage such exposures; we do not enter into these transactions for speculative purposes.
We are exposed to foreign currency fluctuation as a result of our international sales, product sourcing andfunding activities. Our foreign exchange risk management program is intended to minimize both the positive ornegative effects of currency fluctuations on our consolidated results of operations, financial position and cashflows. This also has the effect of delaying the impact of current market rates on our consolidated financialstatements dependent upon hedge horizons. We use forward exchange contracts and options to hedge certain
48

anticipated but not yet firmly committed transactions as well as certain firm commitments and the relatedreceivables and payables, including third party and intercompany transactions. We also use forward contracts tohedge our investment in the net assets of certain international subsidiaries to offset foreign currency translationand economic exposures related to our net investment in those subsidiaries.
When we begin hedging exposures, the type and duration of each hedge depends on the nature of theexposure and market conditions. Generally, all anticipated and firmly committed transactions that are hedged areto be recognized within twelve to eighteen months, although at May 31, 2009 we had forward contracts hedginganticipated transactions that will be recognized in as many as 23 months. The majority of the contracts expiringin more than twelve months relate to the anticipated purchase of inventory by one of our European subsidiaries.When intercompany loans are hedged, it is typically for their expected duration. Hedged transactions areprincipally denominated in Euro, Japanese yen and British pound. See Section “Foreign Currency Exposures andHedging Practices” under Item 7 for additional detail.
Our earnings are also exposed to movements in short and long-term market interest rates. Our objective inmanaging this interest rate exposure is to limit the impact of interest rate changes on earnings and cash flows andto reduce overall borrowing costs. To achieve these objectives, we maintain a mix of commercial paper, bankloans and fixed rate debt of varying maturities and have entered into receive-fixed, pay-variable interest rateswaps.
Market Risk Measurement
We monitor foreign exchange risk, interest rate risk and related derivatives using a variety of techniquesincluding a review of market value, sensitivity analysis, and Value-at-Risk (“VaR”). Our market-sensitivederivative and other financial instruments are foreign currency forward contracts, foreign currency optioncontracts, interest rate swaps, intercompany loans denominated in non-functional currencies, fixed interest rateU.S. dollar denominated debt, and fixed interest rate Japanese yen denominated debt.
We use VaR to monitor the foreign exchange risk of our foreign currency forward and foreign currencyoption derivative instruments only. The VaR determines the maximum potential one-day loss in the fair value ofthese foreign exchange rate-sensitive financial instruments. The VaR model estimates assume normal marketconditions and a 95% confidence level. There are various modeling techniques that can be used in the VaRcomputation. Our computations are based on interrelationships between currencies and interest rates(a “variance/co-variance” technique). These interrelationships are a function of foreign exchange currencymarket changes and interest rate changes over the preceding one year period. The value of foreign currencyoptions does not change on a one-to-one basis with changes in the underlying currency rate. We adjusted thepotential loss in option value for the estimated sensitivity (the “delta” and “gamma”) to changes in the underlyingcurrency rate. This calculation reflects the impact of foreign currency rate fluctuations on the derivativeinstruments only, and does not include the impact of such rate fluctuations on non-functional currencytransactions (such as anticipated transactions, firm commitments, cash balances, and accounts and loansreceivable and payable), including those which are hedged by these instruments.
The VaR model is a risk analysis tool and does not purport to represent actual losses in fair value that wewill incur, nor does it consider the potential effect of favorable changes in market rates. It also does not representthe full extent of the possible loss that may occur. Actual future gains and losses will differ from those estimatedbecause of changes or differences in market rates and interrelationships, hedging instruments and hedgepercentages, timing and other factors.
The estimated maximum one-day loss in fair value on our foreign currency sensitive derivative financialinstruments, derived using the VaR model, was $67.8 million and $34.9 million at May 31, 2009 and May 31,2008, respectively. The VaR increased, despite a reduction in the total notional value of our foreign currencyderivative instruments, as a result of increased foreign currency volatilities at May 31, 2009 as compared to
49

May 31, 2008. Such a hypothetical loss in fair value of our derivatives would be offset by increases in the valueof the underlying transactions being hedged. The average monthly change in the fair values of foreign currencyforward and foreign currency option derivative instruments was $207.4 million and $32.3 million during fiscal2009 and fiscal 2008, respectively.
The instruments not included in the VaR are intercompany loans denominated in non-functional currencies,fixed interest rate Japanese yen denominated debt, fixed interest rate U.S. dollar denominated debt and interestrate swaps. Intercompany loans and related interest amounts are eliminated in consolidation. Furthermore, ournon-functional currency intercompany loans are substantially hedged against foreign exchange risk through theuse of forward contracts, which are included in the VaR calculation above. We, therefore, consider the interestrate and foreign currency market risks associated with our non-functional currency intercompany loans to beimmaterial to our consolidated financial position, results from operations and cash flows.
Details of third party debt and interest rate swaps are provided in the table below. The table presentsprincipal cash flows and related weighted average interest rates by expected maturity dates. Weighted averageinterest rates for the fixed rate swapped to floating rate debt reflect the effective interest rates as of May 31, 2009.
Expected Maturity DateYear Ended May 31,
2010 2011 2012 2013 2014 Thereafter Total Fair Value
(In millions, except interest rates)Foreign Exchange RiskJapanese Yen Functional Currency
Long Term Japanese yen debt — Fixed ratePrincipal payments . . . . . . . . . . . . . . . . . $ 6.9 $6.9 $167.1 $ 6.9 $6.9 $ 44.7 $239.4 $235.9Average interest rate . . . . . . . . . . . . . . . . 2.4% 2.4% 3.4% 2.4% 2.4% 2.4% 2.5%
Interest Rate RiskJapanese Yen Functional Currency
Long-term Japanese yen debt — Fixed ratePrincipal payments . . . . . . . . . . . . . . . . . $ 6.9 $6.9 $167.1 $ 6.9 $6.9 $ 44.7 $239.4 $235.9Average interest rate . . . . . . . . . . . . . . . . 2.4% 2.4% 3.4% 2.4% 2.4% 2.4% 2.5%
U.S. Dollar Functional CurrencyLong-term U.S. dollar debt — Fixed rate
swapped to Floating ratePrincipal payments . . . . . . . . . . . . . . . . . $25.0 $ — $ — $40.0 $ — $100.0 $165.0 $169.0Average interest rate . . . . . . . . . . . . . . . . 3.1% — — 3.1% — 1.6% 2.2%
Long-term U.S. dollar debt — Fixed ratePrincipal payments . . . . . . . . . . . . . . . . . $ — $ — $ — $ — $ — $ 50.0 $ 50.0 $ 51.5Average interest rate . . . . . . . . . . . . . . . . — — — — — 4.7% 4.7%
The fixed interest rate Japanese yen denominated debts were issued by and are accounted for by one of ourJapanese subsidiaries. Accordingly, the monthly re-measurement of these instruments due to changes in foreignexchange rates is recognized in accumulated other comprehensive income upon the consolidation of thissubsidiary.
In fiscal 2003, we entered into a receive-floating, pay-fixed interest rate swap related to a Japanese yendenominated intercompany loan with one of our Japanese subsidiaries. This interest rate swap was not designatedas a hedge instrument under FAS 133. Accordingly, changes in the fair value of the swap were recorded toconsolidated net income each period. The change in fair value of the swap was not material for the years endedMay 31, 2009, 2008 and 2007. Both the intercompany loan and the related interest rate swap matured duringfiscal 2009.
Item 8. Financial Statements and Supplemental Data
Management of NIKE, Inc. is responsible for the information and representations contained in this report.The financial statements have been prepared in conformity with the generally accepted accounting principles weconsidered appropriate in the circumstances and include some amounts based on our best estimates andjudgments. Other financial information in this report is consistent with these financial statements.
50

Our accounting systems include controls designed to reasonably assure assets are safeguarded fromunauthorized use or disposition and provide for the preparation of financial statements in conformity withgenerally accepted accounting principles. These systems are supplemented by the selection and training ofqualified financial personnel and an organizational structure providing for appropriate segregation of duties.
An Internal Audit department reviews the results of its work with the Audit Committee of the Board ofDirectors, presently consisting of three outside directors. The Audit Committee is responsible for theappointment of the independent registered public accounting firm and reviews with the independent registeredpublic accounting firm, management and the internal audit staff, the scope and the results of the annualexamination, the effectiveness of the accounting control system and other matters relating to the financial affairsof NIKE as they deem appropriate. The independent registered public accounting firm and the internal auditorshave full access to the Committee, with and without the presence of management, to discuss any appropriatematters.
Management’s Annual Report on Internal Control Over Financial Reporting
Management is responsible for establishing and maintaining adequate internal control over financialreporting, as such term is defined in Rule 13a-15(f) and Rule 15d-15(f) of the Securities Exchange Act of 1934,as amended. Internal control over financial reporting is a process designed to provide reasonable assuranceregarding the reliability of financial reporting and the preparation of the financial statements for externalpurposes in accordance with generally accepted accounting principles in the United States of America. Internalcontrol over financial reporting includes those policies and procedures that: (i) pertain to the maintenance ofrecords that, in reasonable detail, accurately and fairly reflect the transactions and dispositions of assets of thecompany; (ii) provide reasonable assurance that transactions are recorded as necessary to permit preparation offinancial statements in accordance with generally accepted accounting principles, and that receipts andexpenditures of the company are being made only in accordance with authorizations of our management anddirectors; and (iii) provide reasonable assurance regarding prevention or timely detection of unauthorizedacquisition, use or disposition of assets of the company that could have a material effect on the financialstatements.
While “reasonable assurance” is a high level of assurance, it does not mean absolute assurance. Because ofits inherent limitations, internal control over financial reporting may not prevent or detect every misstatementand instance of fraud. Controls are susceptible to manipulation, especially in instances of fraud caused by thecollusion of two or more people, including our senior management. Also, projections of any evaluation ofeffectiveness to future periods are subject to the risk that controls may become inadequate because of changes inconditions, or that the degree of compliance with the policies or procedures may deteriorate.
Under the supervision and with the participation of our Chief Executive Officer and Chief Financial Officer,our management conducted an evaluation of the effectiveness of our internal control over financial reportingbased upon the framework in Internal Control — Integrated Framework issued by the Committee of SponsoringOrganizations of the Treadway Commission (COSO). Based on the results of our evaluation, our managementconcluded that our internal control over financial reporting was effective as of May 31, 2009.
PricewaterhouseCoopers LLP, an independent registered public accounting firm, has audited (1) theconsolidated financial statements and (2) the effectiveness of our internal control over financial reporting as ofMay 31, 2009, as stated in their report herein.
Mark G. Parker Donald W. BlairChief Executive Officer and President Chief Financial Officer
51

REPORT OF INDEPENDENT REGISTERED PUBLIC ACCOUNTING FIRM
To the Board of Directors andShareholders of NIKE, Inc.:
In our opinion, the consolidated financial statements listed in the index appearing under Item 15(a)(1)present fairly, in all material respects, the financial position of NIKE, Inc. and its subsidiaries at May 31, 2009and 2008, and the results of their operations and their cash flows for each of the three years in the period endedMay 31, 2009 in conformity with accounting principles generally accepted in the United States of America. Inaddition, in our opinion, the financial statement schedule listed in the appendix appearing under Item 15(a)(2)presents fairly, in all material respects, the information set forth therein when read in conjunction with the relatedconsolidated financial statements. Also in our opinion, the Company maintained, in all material respects,effective internal control over financial reporting as of May 31, 2009, based on criteria established in InternalControl — Integrated Framework issued by the Committee of Sponsoring Organizations of the TreadwayCommission (COSO). The Company’s management is responsible for these financial statements and financialstatement schedule, for maintaining effective internal control over financial reporting and for its assessment ofthe effectiveness of internal control over financial reporting, included in Management’s Annual Report onInternal Control Over Financial Reporting appearing under Item 8. Our responsibility is to express opinions onthese financial statements, on the financial statement schedule, and on the Company’s internal control overfinancial reporting based on our integrated audits. We conducted our audits in accordance with the standards ofthe Public Company Accounting Oversight Board (United States). Those standards require that we plan andperform the audits to obtain reasonable assurance about whether the financial statements are free of materialmisstatement and whether effective internal control over financial reporting was maintained in all materialrespects. Our audits of the financial statements included examining, on a test basis, evidence supporting theamounts and disclosures in the financial statements, assessing the accounting principles used and significantestimates made by management, and evaluating the overall financial statement presentation. Our audit of internalcontrol over financial reporting included obtaining an understanding of internal control over financial reporting,assessing the risk that a material weakness exists, and testing and evaluating the design and operatingeffectiveness of internal control based on the assessed risk. Our audits also included performing such otherprocedures as we considered necessary in the circumstances. We believe that our audits provide a reasonablebasis for our opinions.
A company’s internal control over financial reporting is a process designed to provide reasonable assuranceregarding the reliability of financial reporting and the preparation of financial statements for external purposes inaccordance with generally accepted accounting principles. A company’s internal control over financial reportingincludes those policies and procedures that (i) pertain to the maintenance of records that, in reasonable detail,accurately and fairly reflect the transactions and dispositions of the assets of the company; (ii) provide reasonableassurance that transactions are recorded as necessary to permit preparation of financial statements in accordancewith generally accepted accounting principles, and that receipts and expenditures of the company are being madeonly in accordance with authorizations of management and directors of the company; and (iii) provide reasonableassurance regarding prevention or timely detection of unauthorized acquisition, use, or disposition of thecompany’s assets that could have a material effect on the financial statements.
Because of its inherent limitations, internal control over financial reporting may not prevent or detectmisstatements. Also, projections of any evaluation of effectiveness to future periods are subject to the risk thatcontrols may become inadequate because of changes in conditions, or that the degree of compliance with thepolicies or procedures may deteriorate.
/s/ PRICEWATERHOUSECOOPERS LLP
Portland, OregonJuly 27, 2009
52

NIKE, INC.
CONSOLIDATED STATEMENTS OF INCOME
Year Ended May 31,
2009 2008 2007
(In millions, except per share data)
Revenues . . . . . . . . . . . . . . . . . . . . . . . . . . . . . . . . . . . . . . . . . . . . . . . . . . . . . $19,176.1 $18,627.0 $16,325.9Cost of sales . . . . . . . . . . . . . . . . . . . . . . . . . . . . . . . . . . . . . . . . . . . . . . . . . . 10,571.7 10,239.6 9,165.4
Gross margin . . . . . . . . . . . . . . . . . . . . . . . . . . . . . . . . . . . . . . . . . . . . . . . . . . 8,604.4 8,387.4 7,160.5Selling and administrative expense . . . . . . . . . . . . . . . . . . . . . . . . . . . . . . . . . 6,149.6 5,953.7 5,028.7Restructuring charges (Note 16) . . . . . . . . . . . . . . . . . . . . . . . . . . . . . . . . . . . 195.0 — —Goodwill impairment (Note 4) . . . . . . . . . . . . . . . . . . . . . . . . . . . . . . . . . . . . 199.3 — —Intangible and other asset impairment (Note 4) . . . . . . . . . . . . . . . . . . . . . . . 202.0 — —Interest income, net (Notes 1, 7 and 8) . . . . . . . . . . . . . . . . . . . . . . . . . . . . . . (9.5) (77.1) (67.2)Other (income) expense, net (Notes 17 and 18) . . . . . . . . . . . . . . . . . . . . . . . (88.5) 7.9 (0.9)
Income before income taxes . . . . . . . . . . . . . . . . . . . . . . . . . . . . . . . . . . . . . . 1,956.5 2,502.9 2,199.9Income taxes (Note 9) . . . . . . . . . . . . . . . . . . . . . . . . . . . . . . . . . . . . . . . . . . . 469.8 619.5 708.4
Net income . . . . . . . . . . . . . . . . . . . . . . . . . . . . . . . . . . . . . . . . . . . . . . . . . . . 1,486.7 1,883.4 1,491.5
Basic earnings per common share (Note 12) . . . . . . . . . . . . . . . . . . . . . . . . . $ 3.07 $ 3.80 $ 2.96
Diluted earnings per common share (Note 12) . . . . . . . . . . . . . . . . . . . . . . . . $ 3.03 $ 3.74 $ 2.93
Dividends declared per common share . . . . . . . . . . . . . . . . . . . . . . . . . . . . . . $ 0.98 $ 0.875 $ 0.71
The accompanying notes to consolidated financial statements are an integral part of this statement.
53

NIKE, INC.
CONSOLIDATED BALANCE SHEETS
May 31,
2009 2008
(In millions)
ASSETSCurrent assets:
Cash and equivalents . . . . . . . . . . . . . . . . . . . . . . . . . . . . . . . . . . . . . . . . . . . . . . . . . . $ 2,291.1 $ 2,133.9Short-term investments . . . . . . . . . . . . . . . . . . . . . . . . . . . . . . . . . . . . . . . . . . . . . . . . 1,164.0 642.2Accounts receivable, net (Note 1) . . . . . . . . . . . . . . . . . . . . . . . . . . . . . . . . . . . . . . . . 2,883.9 2,795.3Inventories (Notes 1 and 2) . . . . . . . . . . . . . . . . . . . . . . . . . . . . . . . . . . . . . . . . . . . . . 2,357.0 2,438.4Deferred income taxes (Note 9) . . . . . . . . . . . . . . . . . . . . . . . . . . . . . . . . . . . . . . . . . 272.4 227.2Prepaid expenses and other current assets . . . . . . . . . . . . . . . . . . . . . . . . . . . . . . . . . 765.6 602.3
Total current assets . . . . . . . . . . . . . . . . . . . . . . . . . . . . . . . . . . . . . . . . . . . . . . . 9,734.0 8,839.3
Property, plant and equipment, net (Note 3) . . . . . . . . . . . . . . . . . . . . . . . . . . . . . . . . . . . . 1,957.7 1,891.1Identifiable intangible assets, net (Note 4) . . . . . . . . . . . . . . . . . . . . . . . . . . . . . . . . . . . . . 467.4 743.1Goodwill (Note 4) . . . . . . . . . . . . . . . . . . . . . . . . . . . . . . . . . . . . . . . . . . . . . . . . . . . . . . . . 193.5 448.8Deferred income taxes and other assets (Notes 9 and 18) . . . . . . . . . . . . . . . . . . . . . . . . . 897.0 520.4
Total assets . . . . . . . . . . . . . . . . . . . . . . . . . . . . . . . . . . . . . . . . . . . . . . . . . . . . . $13,249.6 $12,442.7
LIABILITIES AND SHAREHOLDERS’ EQUITYCurrent liabilities:
Current portion of long-term debt (Note 8) . . . . . . . . . . . . . . . . . . . . . . . . . . . . . . . . . $ 32.0 $ 6.3Notes payable (Note 7) . . . . . . . . . . . . . . . . . . . . . . . . . . . . . . . . . . . . . . . . . . . . . . . . 342.9 177.7Accounts payable (Note 7) . . . . . . . . . . . . . . . . . . . . . . . . . . . . . . . . . . . . . . . . . . . . . 1,031.9 1,287.6Accrued liabilities (Notes 5 and 18) . . . . . . . . . . . . . . . . . . . . . . . . . . . . . . . . . . . . . . 1,783.9 1,761.9Income taxes payable (Note 9) . . . . . . . . . . . . . . . . . . . . . . . . . . . . . . . . . . . . . . . . . . 86.3 88.0
Total current liabilities . . . . . . . . . . . . . . . . . . . . . . . . . . . . . . . . . . . . . . . . . . . . 3,277.0 3,321.5
Long-term debt (Note 8) . . . . . . . . . . . . . . . . . . . . . . . . . . . . . . . . . . . . . . . . . . . . . . . . . . . 437.2 441.1Deferred income taxes and other liabilities (Note 9) . . . . . . . . . . . . . . . . . . . . . . . . . . . . . 842.0 854.5Commitments and contingencies (Notes 15 and 18) . . . . . . . . . . . . . . . . . . . . . . . . . . . . . . — —Redeemable Preferred Stock (Note 10) . . . . . . . . . . . . . . . . . . . . . . . . . . . . . . . . . . . . . . . . 0.3 0.3Shareholders’ equity:
Common stock at stated value (Note 11):Class A convertible — 95.3 and 96.8 shares outstanding . . . . . . . . . . . . . . . . . . 0.1 0.1Class B — 390.2 and 394.3 shares outstanding . . . . . . . . . . . . . . . . . . . . . . . . . 2.7 2.7
Capital in excess of stated value . . . . . . . . . . . . . . . . . . . . . . . . . . . . . . . . . . . . . . . . . 2,871.4 2,497.8Accumulated other comprehensive income (Note 14) . . . . . . . . . . . . . . . . . . . . . . . . 367.5 251.4Retained earnings . . . . . . . . . . . . . . . . . . . . . . . . . . . . . . . . . . . . . . . . . . . . . . . . . . . . 5,451.4 5,073.3
Total shareholders’ equity . . . . . . . . . . . . . . . . . . . . . . . . . . . . . . . . . . . . . . . . . . 8,693.1 7,825.3
Total liabilities and shareholders’ equity . . . . . . . . . . . . . . . . . . . . . . . . . . . . . . $13,249.6 $12,442.7
The accompanying notes to consolidated financial statements are an integral part of this statement.
54

NIKE, INC.
CONSOLIDATED STATEMENTS OF CASH FLOWS
Year Ended May 31,
2009 2008 2007
(In millions)Cash provided by operations:Net income . . . . . . . . . . . . . . . . . . . . . . . . . . . . . . . . . . . . . . . . . . . . . . . . . . . . $ 1,486.7 $ 1,883.4 $ 1,491.5Income charges (credits) not affecting cash:
Depreciation . . . . . . . . . . . . . . . . . . . . . . . . . . . . . . . . . . . . . . . . . . . . . . . 335.0 303.6 269.7Deferred income taxes . . . . . . . . . . . . . . . . . . . . . . . . . . . . . . . . . . . . . . . . (294.1) (300.6) 34.1Stock-based compensation (Note 11) . . . . . . . . . . . . . . . . . . . . . . . . . . . . 170.6 141.0 147.7Impairment of goodwill, intangibles and other assets (Note 4) . . . . . . . . 401.3 — —Gain on divestitures (Note 17) . . . . . . . . . . . . . . . . . . . . . . . . . . . . . . . . . — (60.6) —Amortization and other . . . . . . . . . . . . . . . . . . . . . . . . . . . . . . . . . . . . . . . 48.3 17.9 0.5
Changes in certain working capital components and other assets andliabilities excluding the impact of acquisition and divestitures:
Increase in accounts receivable . . . . . . . . . . . . . . . . . . . . . . . . . . . . . . . . . (238.0) (118.3) (39.6)Decrease (increase) in inventories . . . . . . . . . . . . . . . . . . . . . . . . . . . . . . 32.2 (249.8) (49.5)Decrease (increase) in prepaid expenses and other current assets . . . . . . 14.1 (11.2) (60.8)(Decrease) increase in accounts payable, accrued liabilities and income
taxes payable . . . . . . . . . . . . . . . . . . . . . . . . . . . . . . . . . . . . . . . . . . . . . (220.0) 330.9 85.1
Cash provided by operations . . . . . . . . . . . . . . . . . . . . . . . . . . . . . . . 1,736.1 1,936.3 1,878.7
Cash (used) provided by investing activities:Purchases of short-term investments . . . . . . . . . . . . . . . . . . . . . . . . . . . . . . . . . (2,908.7) (1,865.6) (2,133.8)Maturities of short-term investments . . . . . . . . . . . . . . . . . . . . . . . . . . . . . . . . 2,390.0 2,246.0 2,516.2Additions to property, plant and equipment . . . . . . . . . . . . . . . . . . . . . . . . . . . (455.7) (449.2) (313.5)Disposals of property, plant and equipment . . . . . . . . . . . . . . . . . . . . . . . . . . . 32.0 1.9 28.3Increase in other assets, net of other liabilities . . . . . . . . . . . . . . . . . . . . . . . . . (47.0) (21.8) (4.3)Settlement of net investment hedges . . . . . . . . . . . . . . . . . . . . . . . . . . . . . . . . . 191.3 (76.0) —Acquisition of subsidiary, net of cash acquired (Note 4) . . . . . . . . . . . . . . . . . — (571.1) —Proceeds from divestitures (Note 17) . . . . . . . . . . . . . . . . . . . . . . . . . . . . . . . . — 246.0 —
Cash (used) provided by investing activities . . . . . . . . . . . . . . . . . . (798.1) (489.8) 92.9
Cash used by financing activities:Proceeds from issuance of long-term debt . . . . . . . . . . . . . . . . . . . . . . . . . . . . — — 41.8Reductions in long-term debt, including current portion . . . . . . . . . . . . . . . . . (6.8) (35.2) (255.7)Increase in notes payable . . . . . . . . . . . . . . . . . . . . . . . . . . . . . . . . . . . . . . . . . 177.1 63.7 52.6Proceeds from exercise of stock options and other stock issuances . . . . . . . . . 186.6 343.3 322.9Excess tax benefits from share-based payment arrangements . . . . . . . . . . . . . 25.1 63.0 55.8Repurchase of common stock . . . . . . . . . . . . . . . . . . . . . . . . . . . . . . . . . . . . . . (649.2) (1,248.0) (985.2)Dividends — common and preferred . . . . . . . . . . . . . . . . . . . . . . . . . . . . . . . . (466.7) (412.9) (343.7)
Cash used by financing activities . . . . . . . . . . . . . . . . . . . . . . . . . . . (733.9) (1,226.1) (1,111.5)
Effect of exchange rate changes . . . . . . . . . . . . . . . . . . . . . . . . . . . . . . . . . . . . (46.9) 56.8 42.4
Net increase in cash and equivalents . . . . . . . . . . . . . . . . . . . . . . . . . 157.2 277.2 902.5Cash and equivalents, beginning of year . . . . . . . . . . . . . . . . . . . . . . . . . . . . . . 2,133.9 1,856.7 954.2
Cash and equivalents, end of year . . . . . . . . . . . . . . . . . . . . . . . . . . . . . . . . . . . $ 2,291.1 $ 2,133.9 $ 1,856.7
Supplemental disclosure of cash flow information:Cash paid during the year for:
Interest, net of capitalized interest . . . . . . . . . . . . . . . . . . . . . . . . . . . . . . $ 46.7 $ 44.1 $ 60.0Income taxes . . . . . . . . . . . . . . . . . . . . . . . . . . . . . . . . . . . . . . . . . . . . . . . 765.2 717.5 601.1
Dividends declared and not paid . . . . . . . . . . . . . . . . . . . . . . . . . . . . . . . . . . . . 121.4 112.9 92.9
The accompanying notes to consolidated financial statements are an integral part of this statement.
55

NIKE, INC.
CONSOLIDATED STATEMENTS OF SHAREHOLDERS’ EQUITY
Common Stock Capital inExcess of
StatedValue
AccumulatedOther
ComprehensiveIncome
RetainedEarnings Total
Class A Class B
Shares Amount Shares Amount
(In millions, except per share data)Balance at May 31, 2006 . . . . . . . . . . . . . . . . . . . . . . . . . . . . . . . . . . . . 127.8 $0.1 384.2 $2.7 $1,447.3 $ 121.7 $4,713.4 $6,285.2Stock options exercised . . . . . . . . . . . . . . . . . . . . . . . . . . . . . . . . . . . . . . 10.7 349.7 349.7Conversion to Class B Common Stock . . . . . . . . . . . . . . . . . . . . . . . . . . (10.2) 10.2 —Repurchase of Class B Common Stock . . . . . . . . . . . . . . . . . . . . . . . . . (22.1) (13.2) (962.0) (975.2)Dividends on Common stock ($0.71 per share) . . . . . . . . . . . . . . . . . . . (357.2) (357.2)Issuance of shares to employees . . . . . . . . . . . . . . . . . . . . . . . . . . . . . . . 1.2 30.1 30.1Stock-based compensation (Note 11): 147.7 147.7Forfeiture of shares from employees . . . . . . . . . . . . . . . . . . . . . . . . . . . (0.1) (1.6) (0.5) (2.1)Comprehensive income (Note 14):
Net income . . . . . . . . . . . . . . . . . . . . . . . . . . . . . . . . . . . . . . . . . . . . . 1,491.5 1,491.5Other comprehensive income: —
Foreign currency translation and other (net of tax expense of$5.4) . . . . . . . . . . . . . . . . . . . . . . . . . . . . . . . . . . . . . . . . . . . . . . 84.6 84.6
Net loss on cash flow hedges (net of tax benefit of $9.5) . . . . . . . . (38.1) (38.1)Reclassification to net income of previously deferred losses
related to hedge derivatives (net of tax benefit of $3.6) . . . . . . . 21.4 21.4
Comprehensive income . . . . . . . . . . . . . . . . . . . . . . . . . . . . . . . . . . . . . . 67.9 1,491.5 1,559.4Adoption of FAS 158 (net of tax benefit of $5.4) (Note 13): (12.2) (12.2)
Balance at May 31, 2007 . . . . . . . . . . . . . . . . . . . . . . . . . . . . . . . . . . . . 117.6 $0.1 384.1 $2.7 $1,960.0 $ 177.4 $4,885.2 $7,025.4
Stock options exercised . . . . . . . . . . . . . . . . . . . . . . . . . . . . . . . . . . . . . . 9.1 372.2 372.2Conversion to Class B Common Stock . . . . . . . . . . . . . . . . . . . . . . . . . . (20.8) 20.8 —Repurchase of Class B Common Stock . . . . . . . . . . . . . . . . . . . . . . . . . (20.6) (12.3) (1,235.7) (1,248.0)Dividends on Common stock ($0.875 per share) . . . . . . . . . . . . . . . . . . (432.8) (432.8)Issuance of shares to employees . . . . . . . . . . . . . . . . . . . . . . . . . . . . . . . 1.0 39.2 39.2Stock-based compensation (Note 11): 141.0 141.0Forfeiture of shares from employees . . . . . . . . . . . . . . . . . . . . . . . . . . . (0.1) (2.3) (1.1) (3.4)Comprehensive income (Note 14):
Net income . . . . . . . . . . . . . . . . . . . . . . . . . . . . . . . . . . . . . . . . . . . . . 1,883.4 1,883.4Other comprehensive income:
Foreign currency translation and other (net of tax expense of$101.6) . . . . . . . . . . . . . . . . . . . . . . . . . . . . . . . . . . . . . . . . . . . . 211.9 211.9
Realized foreign currency translation gain due to divestiture(Note 17): . . . . . . . . . . . . . . . . . . . . . . . . . . . . . . . . . . . . . . . . . . (46.3) (46.3)
Net loss on cash flow hedges (net of tax benefit of $67.7) . . . . . . . (175.8) (175.8)Net loss on net investment hedges (net of tax benefit of $25.1) . . . (43.5) (43.5)Reclassification to net income of previously deferred losses
related to hedge derivatives (net of tax benefit of $49.6) . . . . . . 127.7 127.7
Comprehensive income . . . . . . . . . . . . . . . . . . . . . . . . . . . . . . . . . . . . . . 74.0 1,883.4 1,957.4Adoption of FIN 48 (Note 9) . . . . . . . . . . . . . . . . . . . . . . . . . . . . . . . . . (15.6) (15.6)Adoption of EITF 06-2 Sabbaticals (net of tax benefit of $6.2) . . . . . . . (10.1) (10.1)
Balance at May 31, 2008 . . . . . . . . . . . . . . . . . . . . . . . . . . . . . . . . . . . . 96.8 $0.1 394.3 $2.7 $2,497.8 $ 251.4 $5,073.3 $7,825.3
Stock options exercised . . . . . . . . . . . . . . . . . . . . . . . . . . . . . . . . . . . . . . 4.0 167.2 167.2Conversion to Class B Common Stock . . . . . . . . . . . . . . . . . . . . . . . . . . (1.5) 1.5 —Repurchase of Class B Common Stock . . . . . . . . . . . . . . . . . . . . . . . . . (10.6) (6.3) (632.7) (639.0)Dividends on Common stock ($0.98 per share) . . . . . . . . . . . . . . . . . . . (475.2) (475.2)Issuance of shares to employees . . . . . . . . . . . . . . . . . . . . . . . . . . . . . . . 1.1 45.4 45.4Stock-based compensation (Note 11): 170.6 170.6Forfeiture of shares from employees . . . . . . . . . . . . . . . . . . . . . . . . . . . (0.1) (3.3) (0.7) (4.0)Comprehensive income (Note 14):
Net income . . . . . . . . . . . . . . . . . . . . . . . . . . . . . . . . . . . . . . . . . . . . . 1,486.7 1,486.7Other comprehensive income:
Foreign currency translation and other (net of tax benefit of$177.5) . . . . . . . . . . . . . . . . . . . . . . . . . . . . . . . . . . . . . . . . . . . . (335.3) (335.3)
Net gain on cash flow hedges (net of tax expense of $167.5) . . . . 453.6 453.6Net gain on net investment hedges (net of tax expense of
$55.4) . . . . . . . . . . . . . . . . . . . . . . . . . . . . . . . . . . . . . . . . . . . . . 106.0 106.0Reclassification to net income of previously deferred net gains
related to hedge derivatives (net of tax expense of $39.6) . . . . . (108.2) (108.2)
Comprehensive income . . . . . . . . . . . . . . . . . . . . . . . . . . . . . . . . . . . . . . 116.1 1,486.7 1,602.8
Balance at May 31, 2009 . . . . . . . . . . . . . . . . . . . . . . . . . . . . . . . . . . . . 95.3 $0.1 390.2 $2.7 $2,871.4 $ 367.5 $5,451.4 $8,693.1
The accompanying notes to consolidated financial statements are an integral part of this statement.
56

NIKE, INC.
NOTES TO CONSOLIDATED FINANCIAL STATEMENTS
Note 1 — Summary of Significant Accounting Policies
Description of Business
NIKE, Inc. is a worldwide leader in the design, marketing and distribution of athletic and sports-inspiredfootwear, apparel, equipment and accessories. Wholly-owned Nike subsidiaries include Cole Haan, whichdesigns, markets and distributes dress and casual shoes, handbags, accessories and coats; Converse Inc., whichdesigns, markets and distributes athletic and causal footwear, apparel and accessories; Hurley International LLC,which designs, markets and distributes action sports and youth lifestyle footwear, apparel and accessories; andUmbro Ltd., which designs, distributes and licenses athletic and casual footwear, apparel and equipment,primarily for the sport of soccer.
Basis of Consolidation
The consolidated financial statements include the accounts of NIKE, Inc. and its subsidiaries(the “Company”). All significant intercompany transactions and balances have been eliminated.
Recognition of Revenues
Wholesale revenues are recognized when the risks and rewards of ownership have passed to the customer,based on the terms of sale. This occurs upon shipment or upon receipt by the customer depending on the countryof the sale and the agreement with the customer. Retail store revenues are recorded at the time of sale. Provisionsfor sales discounts, returns and miscellaneous claims from customers are made at the time of sale.
Shipping and Handling Costs
Shipping and handling costs are expensed as incurred and included in cost of sales.
Advertising and Promotion
Advertising production costs are expensed the first time the advertisement is run. Media (TV and print)placement costs are expensed in the month the advertising appears.
A significant amount of the Company’s promotional expenses result from payments under endorsementcontracts. Accounting for endorsement payments is based upon specific contract provisions. Generally,endorsement payments are expensed on a straight-line basis over the term of the contract after giving recognitionto periodic performance compliance provisions of the contracts. Prepayments made under contracts are includedin prepaid expenses or other assets depending on the period to which the prepayment applies.
Through cooperative advertising programs, the Company reimburses retail customers for certain costs ofadvertising the Company’s products. The Company records these costs in selling and administrative expense atthe point in time when it is obligated to its customers for the costs, which is when the related revenues arerecognized. This obligation may arise prior to the related advertisement being run.
Total advertising and promotion expenses were $2,351.3 million, $2,308.3 million, and $1,912.4 million forthe years ended May 31, 2009, 2008 and 2007, respectively. Prepaid advertising and promotion expensesrecorded in prepaid expenses and other assets totaled $280.0 million and $266.7 million at May 31, 2009 and2008, respectively.
57

NIKE, INC.
NOTES TO CONSOLIDATED FINANCIAL STATEMENTS — (Continued)
Cash and Equivalents
Cash and equivalents represent cash and short-term, highly liquid investments with maturities of threemonths or less at date of purchase. The carrying amounts reflected in the consolidated balance sheet for cash andequivalents approximate fair value.
Short-term Investments
Short-term investments consist of highly liquid investments, primarily commercial paper, U.S. Treasury,U.S. agency, and corporate debt securities, with maturities over three months from the date of purchase. Debtsecurities which the Company has the ability and positive intent to hold to maturity are carried at amortized cost,which approximates fair value. At May 31, 2009, the Company did not hold any short-term investments that wereclassified as held-to-maturity. Short-term investments of $124.9 million as of May 31, 2008 were classified asheld-to-maturity and were primarily comprised of U.S. Treasury and U.S. agency securities.
Available-for-sale debt securities are recorded at fair value with net unrealized gains and losses reported, netof tax, in other comprehensive income, unless unrealized losses are determined to be other than temporary. TheCompany considers all available-for-sale securities, including those with maturity dates beyond 12 months, asavailable to support current operational liquidity needs and therefore classifies these securities as short-terminvestments within current assets on the consolidated balance sheet. As of May 31, 2009, the Company held$1,005.0 million of available-for-sale securities with maturity dates within one year and $159.0 million withmaturity dates over one year and less than five years.
Investments classified as available-for-sale consist of the following at fair value:
As of May 31,
2009 2008
(In millions)
Available-for-sale investments:U.S. treasury and agencies . . . . . . . . . . . . . . . . . . . . . . . . . . . . . . . . . . . . . . . $ 772.8 $194.1Corporate commercial paper and bonds . . . . . . . . . . . . . . . . . . . . . . . . . . . . . 391.2 323.2
Total available-for-sale investments . . . . . . . . . . . . . . . . . . . . . . . . . . . . . . . . . . . $1,164.0 $517.3
Included in interest income, net for the years ended May 31, 2009, 2008, and 2007, was interest income of$49.7 million, $115.8 million and $116.9 million, respectively, related to short-term investments and cash andequivalents.
Allowance for Uncollectible Accounts Receivable
Accounts receivable consists principally of amounts receivable from customers. We make ongoingestimates relating to the collectibility of our accounts receivable and maintain an allowance for estimated lossesresulting from the inability of our customers to make required payments. In determining the amount of theallowance, we consider our historical level of credit losses and make judgments about the creditworthiness ofsignificant customers based on ongoing credit evaluations. Accounts receivable with anticipated collection datesgreater than twelve months from the balance sheet date and related allowances are considered non-current andrecorded in other assets. The allowance for uncollectible accounts receivable was $110.8 million and $78.4million at May 31, 2009 and 2008, respectively, of which $36.9 million and $36.7 million was recorded in otherassets.
58

NIKE, INC.
NOTES TO CONSOLIDATED FINANCIAL STATEMENTS — (Continued)
Inventory Valuation
Inventories related to our wholesale operations are stated at lower of cost or market and valued on a first-in,first-out (“FIFO”) or moving average cost basis. Inventories related to our retail operations are stated at the lowerof average cost or market using the retail inventory method. Under the retail inventory method, the valuation ofinventories at cost is calculated by applying a cost-to-retail ratio to the retail value inventories. Permanent andpoint of sale markdowns, when recorded, reduce both the retail and cost components of inventory on hand so asto maintain the already established cost-to-retail relationship.
Property, Plant and Equipment and Depreciation
Property, plant and equipment are recorded at cost. Depreciation for financial reporting purposes isdetermined on a straight-line basis for buildings and leasehold improvements over 2 to 40 years and formachinery and equipment over 2 to 15 years. Computer software (including, in some cases, the cost of internallabor) is depreciated on a straight-line basis over 3 to 10 years.
Impairment of Long-Lived Assets
The Company reviews the carrying value of long-lived assets or asset groups to be used in operationswhenever events or changes in circumstances indicate that the carrying amount of the assets might not berecoverable. Factors that would necessitate an impairment assessment include a significant adverse change in theextent or manner in which an asset is used, a significant adverse change in legal factors or the business climatethat could affect the value of the asset, or a significant decline in the observable market value of an asset, amongothers. If such facts indicate a potential impairment, the Company would assess the recoverability of an assetgroup by determining if the carrying value of the asset group exceeds the sum of the projected undiscounted cashflows expected to result from the use and eventual disposition of the assets over the remaining economic life ofthe primary asset in the asset group. If the recoverability test indicates that the carrying value of the asset group isnot recoverable, the Company will estimate the fair value of the asset group using appropriate valuationmethodologies which would typically include an estimate of discounted cash flows. Any impairment would bemeasured as the difference between the asset groups carrying amount and its estimated fair value.
Identifiable Intangible Assets and Goodwill
In accordance with SFAS No. 142 “Goodwill and Other Intangible Assets” (“FAS 142”), the Companyperforms annual impairment tests on goodwill and intangible assets with indefinite lives in the fourth quarter ofeach fiscal year, or when events occur or circumstances change that would, more likely than not, reduce the fairvalue of a reporting unit or an intangible asset with an indefinite life below its carrying value. Events or changesin circumstances that may trigger interim impairment reviews include significant changes in business climate,operating results, planned investments in the reporting unit, or an expectation that the carrying amount may notbe recoverable, among other factors. The impairment test requires the Company to estimate the fair value of itsreporting units. If the carrying value of a reporting unit exceeds its fair value, the goodwill of that reporting unitis potentially impaired and the Company proceeds to step two of the impairment analysis. In step two of theanalysis, the Company measures and records an impairment loss equal to the excess of the carrying value of thereporting unit’s goodwill over its implied fair value should such a circumstance arise.
The Company generally bases its measurement of fair value of a reporting unit on a blended analysis of thepresent value of future discounted cash flows and the market valuation approach. The discounted cash flowsmodel indicates the fair value of the reporting unit based on the present value of the cash flows that the Companyexpects the reporting unit to generate in the future. The Company’s significant estimates in the discounted cashflows model include: its weighted average cost of capital; long-term rate of growth and profitability of the
59

NIKE, INC.
NOTES TO CONSOLIDATED FINANCIAL STATEMENTS — (Continued)
reporting unit’s business; and working capital effects. The market valuation approach indicates the fair value ofthe business based on a comparison of the reporting unit to comparable publicly traded companies in similar linesof business. Significant estimates in the market valuation approach model include identifying similar companieswith comparable business factors such as size, growth, profitability, risk and return on investment and assessingcomparable revenue and operating income multiples in estimating the fair value of the reporting unit.
The Company believes the weighted use of discounted cash flows and the market valuation approach is thebest method for determining the fair value of its reporting units because these are the most common valuationmethodologies used within its industry; and the blended use of both models compensates for the inherent risksassociated with either model if used on a stand-alone basis.
Indefinite-lived intangible assets primarily consist of acquired trade names and trademarks. In measuring thefair value for these intangible assets, the Company utilizes the relief-from-royalty method. This method assumesthat trade names and trademarks have value to the extent that their owner is relieved of the obligation to payroyalties for the benefits received from them. This method requires the Company to estimate the future revenuefor the related brands, the appropriate royalty rate and the weighted average cost of capital.
Foreign Currency Translation and Foreign Currency Transactions
Adjustments resulting from translating foreign functional currency financial statements into U.S. dollars areincluded in the foreign currency translation adjustment, a component of accumulated other comprehensiveincome in shareholders’ equity.
The Company’s global subsidiaries have various assets and liabilities, primarily receivables and payables,that are denominated in currencies other than their functional currency. These balance sheet items are subject toremeasurement under SFAS No. 52, “Foreign Currency Translation,” (“FAS 52”), the impact of which isrecorded in other (income) expense, net, within our consolidated statements of income.
Accounting for Derivatives and Hedging Activities
The Company uses derivative financial instruments to limit exposure to changes in foreign currencyexchange rates and interest rates. The Company accounts for derivatives pursuant to SFAS No. 133, “Accountingfor Derivative Instruments and Hedging Activities,” as amended and interpreted (“FAS 133”). FAS 133establishes accounting and reporting standards for derivative instruments and requires all derivatives be recordedat fair value on the balance sheet. Changes in the fair value of derivative financial instruments are eitherrecognized in other comprehensive income (a component of shareholders’ equity), debt or net income dependingon the underlying exposure being hedged and the extent to which the derivative is effective.
See Note 18 — Risk Management and Derivatives for more information on the Company’s riskmanagement program and derivatives.
Stock-Based Compensation
On June 1, 2006, the Company adopted SFAS No. 123R “Share-Based Payment” (“FAS 123R”), whichrequires the Company to record expense for stock-based compensation to employees using a fair value method.Under FAS 123R, the Company estimates the fair value of options granted under the NIKE, Inc. 1990 StockIncentive Plan (the “1990 Plan”) and employees’ purchase rights under the Employee Stock Purchase Plans(“ESPPs”) using the Black-Scholes option pricing model. The Company recognizes this fair value, net ofestimated forfeitures, as selling and administrative expense in the consolidated statements of income over thevesting period using the straight-line method.
60

NIKE, INC.
NOTES TO CONSOLIDATED FINANCIAL STATEMENTS — (Continued)
The Company adopted the modified prospective transition method prescribed by FAS 123R, which does notrequire the restatement of financial results for previous periods. In accordance with this transition method, theCompany’s consolidated statements of income for the years ended May 31, 2009, 2008 and 2007 includes(i) amortization of outstanding stock-based compensation granted prior to, but not vested, as of June 1, 2006,based on the fair value estimated in accordance with the original provisions of SFAS No. 123, “Accounting forStock-Based Compensation” (“FAS 123”) and (ii) amortization of all stock-based awards granted subsequent toJune 1, 2006, based on the fair value estimated in accordance with the provisions of FAS 123R.
To calculate the excess tax benefits available for use in offsetting future tax shortfalls as of the date ofimplementation, the Company is following the alternative transition method discussed in FASB Staff PositionNo. 123R-3, “Transition Election Relating to Accounting for the Tax Effects of Share-Based Payment Awards.”
See Note 11 — Common Stock and Stock-Based Compensation for more information on the Company’sstock programs.
Income Taxes
The Company accounts for income taxes using the asset and liability method. This approach requires therecognition of deferred tax assets and liabilities for the expected future tax consequences of temporarydifferences between the carrying amounts and the tax basis of assets and liabilities. United States income taxesare provided currently on financial statement earnings of non-U.S. subsidiaries that are expected to berepatriated. The Company determines annually the amount of undistributed non-U.S. earnings to investindefinitely in its non-U.S. operations. The Company recognizes interest and penalties related to income taxmatters in income tax expense. See Note 9 — Income Taxes for further discussion.
Earnings Per Share
Basic earnings per common share is calculated by dividing net income by the weighted average number ofcommon shares outstanding during the year. Diluted earnings per common share is calculated by adjustingweighted average outstanding shares, assuming conversion of all potentially dilutive stock options and awards.See Note 12 — Earnings Per Share for further discussion.
Management Estimates
The preparation of financial statements in conformity with generally accepted accounting principles requiresmanagement to make estimates, including estimates relating to assumptions that affect the reported amounts ofassets and liabilities and disclosure of contingent assets and liabilities at the date of financial statements and thereported amounts of revenues and expenses during the reporting period. Actual results could differ from theseestimates.
Reclassifications
Certain prior year amounts have been reclassified to conform to fiscal year 2009 presentation, including areclassification to investing activities for the settlement of net investment hedges in the consolidated statement ofcash flows. These reclassifications had no impact on previously reported results of operations or shareholders’equity and do not affect previously reported cash flows from operations, financing activities or net change in cashand equivalents.
61

NIKE, INC.
NOTES TO CONSOLIDATED FINANCIAL STATEMENTS — (Continued)
Recently Adopted Accounting Standards
On December 1, 2008, the Company adopted Statement of SFAS No. 161, “Disclosures about DerivativeInstruments and Hedging Activities — an amendment of FASB Statement No.133” (“FAS 161”), which providesrevised guidance for enhanced disclosures about how and why an entity uses derivative instruments, howderivative instruments and the related hedged items are accounted for under FAS 133, and how derivativeinstruments and the related hedged items affect an entity’s financial position, financial performance and cashflows. The adoption of FAS 161 did not have an impact on the Company’s consolidated financial position orresults of operations. For additional information, see Note 18 — Risk Management and Derivatives.
On June 1, 2008, the Company adopted SFAS No. 157, “Fair Value Measurements” (“FAS 157”) forfinancial assets and liabilities, which clarifies the meaning of fair value, establishes a framework for measuringfair value and expands disclosures about fair value measurements. Fair value is defined under FAS 157 as theexchange price that would be received for an asset or paid to transfer a liability in the principal or mostadvantageous market for the assets or liabilities in an orderly transaction between market participants on themeasurement date. Subsequent changes in fair value of these financial assets and liabilities are recognized inearnings or other comprehensive income when they occur. The effective date of the provisions of FAS 157 fornon-financial assets and liabilities, except for items recognized at fair value on a recurring basis, was deferred byFinancial Accounting Standards Board (“FASB”) Staff Position FAS 157-2 (“FSP FAS 157-2”) and are effectivefor the fiscal year beginning June 1, 2009. The adoption of FAS 157 for financial assets and liabilities did nothave an impact on the Company’s consolidated financial position or results of operations. The adoption of FAS157 for non-financial assets and liabilities is not expected to have an impact on the Company’s consolidatedfinancial position or results of operations. For additional information on the fair value of financial assets andliabilities, see Note 6 — Fair Value Measurements.
Also effective June 1, 2008, the Company adopted SFAS No. 159, “The Fair Value Option for FinancialAssets and Financial Liabilities” (“FAS 159”), which allows an entity the irrevocable option to elect fair valuefor the initial and subsequent measurement for certain financial assets and liabilities on a contract-by-contractbasis. As of May 31, 2009, the Company has not elected the fair value option for any additional financial assetsand liabilities beyond those already prescribed by accounting principles generally accepted in the United States.
In October 2008, the FASB issued Staff Position No. FAS 157-3, “Determining the Fair Value of aFinancial Asset in a Market That Is Not Active” (“FSP FAS 157-3”). FSP FAS 157-3 clarifies the application ofFAS 157 in a market that is not active and defines additional key criteria in determining the fair value of afinancial asset when the market for that financial asset is not active. FSP FAS 157-3 applies to financial assetswithin the scope of accounting pronouncements that require or permit fair value measurements in accordancewith FAS 157. FSP FAS 157-3 was effective upon issuance and the application of FSP FAS 157-3 did not have amaterial impact on the Company’s consolidated financial statements.
Recently Issued Accounting Standards
In May 2009, the FASB issued SFAS No. 165, “Subsequent Events” (“FAS 165”), which establishesgeneral standards of accounting and disclosure for events that occur after the balance sheet date but beforefinancial statements are issued. The provisions of FAS 165 are effective for the quarter ending August 31, 2009.The Company does not expect the adoption will have a material impact on its consolidated financial position orresults of operations.
In April 2009, the FASB issued Staff Position No. FAS 107-1 and APB 28-1, “Interim Disclosures aboutFair Value of Financial Instruments” (“FSP FAS 107-1 and APB 28-1”), which amends SFAS No. 107,“Disclosures about Fair Value of Financial Instruments”, and APB Opinion No. 28, “Interim Financial
62

NIKE, INC.
NOTES TO CONSOLIDATED FINANCIAL STATEMENTS — (Continued)
Reporting”, to require disclosures about fair value of financial instruments in interim and annual reportingperiods. The provisions of FSP FAS 107-1 and APB 28-1 are effective for the quarter ending August 31, 2009.The Company does not expect the adoption will have an impact on its consolidated financial position or results ofoperations.
In December 2007, the FASB issued SFAS No. 141 (revised 2007), “Business Combinations” (“FAS141(R)”) and SFAS No. 160, “Noncontrolling Interests in Consolidated Financial Statements” (“FAS 160”).These standards aim to improve, simplify, and converge international standards of accounting for businesscombinations and the reporting of noncontrolling interests in consolidated financial statements. FAS 141(R) iseffective for business combinations for which the acquisition date is on or after June 1, 2009. Generally, theeffects of FAS 141(R) will depend on future acquisitions. FAS 160 is effective for the Company beginningJune 1, 2009. The Company does not expect the adoption of FAS 160 will have a material impact on itsconsolidated financial position or results of operations.
In April 2008, the FASB issued Staff Position No. FAS 142-3, “Determination of the Useful Life ofIntangible Assets” (“FSP FAS 142-3”). FSP FAS 142-3 amends the factors that should be considered indeveloping renewal or extension assumptions used to determine the useful life of a recognized intangible assetunder FAS 142. The intent of the position is to improve the consistency between the useful life of a recognizedintangible asset under FAS 142 and the period of expected cash flows used to measure the fair value of the assetunder FAS 141(R), and other U.S. generally accepted accounting principles. The provisions of FSP FAS 142-3are effective for the fiscal year beginning June 1, 2009. The Company does not expect the adoption of FSP FAS142-3 will have a material impact on its consolidated financial position or results of operations.
Note 2 — Inventories
Inventory balances of $2,357.0 million and $2,438.4 million at May 31, 2009 and 2008, respectively, weresubstantially all finished goods.
Note 3 — Property, Plant and Equipment
Property, plant and equipment includes the following:
As of May 31,
2009 2008
(In millions)
Land . . . . . . . . . . . . . . . . . . . . . . . . . . . . . . . . . . . . . . . . . . . . . . . . . . . . . . . . . . . $ 221.6 $ 209.4Buildings . . . . . . . . . . . . . . . . . . . . . . . . . . . . . . . . . . . . . . . . . . . . . . . . . . . . . . . 974.0 934.6Machinery and equipment . . . . . . . . . . . . . . . . . . . . . . . . . . . . . . . . . . . . . . . . . . 2,094.3 2,005.0Leasehold improvements . . . . . . . . . . . . . . . . . . . . . . . . . . . . . . . . . . . . . . . . . . . 802.0 757.3Construction in process . . . . . . . . . . . . . . . . . . . . . . . . . . . . . . . . . . . . . . . . . . . . 163.8 196.7
4,255.7 4,103.0Less accumulated depreciation . . . . . . . . . . . . . . . . . . . . . . . . . . . . . . . . . . . . . . 2,298.0 2,211.9
$1,957.7 $1,891.1
Capitalized interest was not material for the years ended May 31, 2009, 2008 and 2007.
63

NIKE, INC.
NOTES TO CONSOLIDATED FINANCIAL STATEMENTS — (Continued)
Note 4 — Acquisition, Identifiable Intangible Assets, Goodwill and Umbro Impairment
Acquisition
On March 3, 2008, the Company completed its acquisition of 100% of the outstanding shares of Umbro, aleading United Kingdom-based global soccer brand, for a purchase price of 290.5 million British pounds sterlingin cash (approximately $576.4 million), inclusive of direct transaction costs. This acquisition is intended tostrengthen the Company’s market position in the United Kingdom and expand NIKE’s global leadership insoccer, a key area of growth for the Company. This acquisition also provides positions in emerging soccermarkets such as China, Russia and Brazil. The results of Umbro’s operations have been included in theCompany’s consolidated financial statements since the date of acquisition as part of the Company’s “Other”operating segment.
The acquisition of Umbro was accounted for as a purchase business combination in accordance with SFASNo. 141 “Business Combinations.” The purchase price was allocated to tangible and identifiable intangible assetsacquired and liabilities assumed based on their respective estimated fair values on the date of acquisition, withthe remaining purchase price recorded as goodwill.
Based on our preliminary purchase price allocation at May 31, 2008, identifiable intangible assets andgoodwill relating to the purchase approximated $419.5 million and $319.2 million, respectively. Goodwillrecognized in this transaction is deductible for tax purposes. Identifiable intangible assets include $378.4 millionfor trademarks that have an indefinite life, and $41.1 million for other intangible assets consisting of Umbro’ssourcing network, established customer relationships, and the United Soccer League Franchise. These intangibleassets will be amortized on a straight line basis over estimated lives of 12 to 20 years.
During the quarter ended February 28, 2009, the Company finalized the purchase-price accounting forUmbro and made revisions to preliminary estimates, including valuations of tangible and intangible assets andcertain contingencies, as further evaluations were completed and information was received from third partiessubsequent to the acquisition date. These revisions to preliminary estimates resulted in a $12.4 million decreasein the value of identified intangible assets, primarily Umbro’s sourcing network, and an $11.2 million increase innon-current liabilities, primarily related to liabilities assumed for certain contingencies and adjustments made todeferred taxes related to the fair value of assets acquired. These changes in assets acquired and liabilitiesassumed affect the amount of goodwill recorded.
The following table summarizes the allocation of the purchase price, including transaction costs of theacquisition, to the assets acquired and liabilities assumed at the date of acquisition based on their estimated fairvalues, including final purchase accounting adjustments (in millions):
May 31, 2008Preliminary Adjustments
May 31, 2009Final
Current assets . . . . . . . . . . . . . . . . . . . . . . . . . . . . . . . . . . . $ 87.2 — $ 87.2Non-current assets . . . . . . . . . . . . . . . . . . . . . . . . . . . . . . . . 90.2 — 90.2Identified intangible assets . . . . . . . . . . . . . . . . . . . . . . . . . 419.5 (12.4) 407.1Goodwill . . . . . . . . . . . . . . . . . . . . . . . . . . . . . . . . . . . . . . . 319.2 23.6 342.8Current liabilities . . . . . . . . . . . . . . . . . . . . . . . . . . . . . . . . . (60.3) — (60.3)Non-current liabilities . . . . . . . . . . . . . . . . . . . . . . . . . . . . . (279.4) (11.2) (290.6)
Net assets acquired . . . . . . . . . . . . . . . . . . . . . . . . . . . $ 576.4 $ — $ 576.4
The pro forma effect of the acquisition on the combined results of operations for fiscal 2008 was notmaterial.
64

NIKE, INC.
NOTES TO CONSOLIDATED FINANCIAL STATEMENTS — (Continued)
Umbro Impairment
In accordance with FAS 142 “Goodwill and Other Intangible Assets,” the Company performs annualimpairment tests on goodwill and intangible assets with indefinite lives in the fourth quarter of each fiscal year,or when events occur or circumstances change that would, more likely than not, reduce the fair value of areporting unit or intangible assets with an indefinite life below its carrying value. As a result of a significantdecline in global consumer demand and continued weakness in the macroeconomic environment, as well asdecisions by Company management to adjust planned investment in the Umbro brand, the Company concludedthat sufficient indicators of impairment existed to require the performance of an interim assessment of Umbro’sgoodwill and indefinite lived intangible assets as of February 1, 2009. Accordingly, the Company performed thefirst step of the goodwill impairment assessment for Umbro by comparing the estimated fair value of Umbro toits carrying amount, and determined there was a potential impairment of goodwill as the carrying amountexceeded the estimated fair value. Therefore, the Company performed the second step of the assessment whichcompared the implied fair value of Umbro’s goodwill to the book value of goodwill. The implied fair value ofgoodwill is determined by allocating the estimated fair value of Umbro to all of its assets and liabilities,including both recognized and unrecognized intangibles, in the same manner as goodwill was determined in theoriginal business combination.
The Company measured the fair value of Umbro by using an equal weighting of the fair value implied by adiscounted cash flow analysis and by comparisons with the market values of similar publicly traded companies.The Company believes the blended use of both models compensates for the inherent risk associated with eithermodel if used on a stand-alone basis, and this combination is indicative of the factors a market participant wouldconsider when performing a similar valuation. The fair value of Umbro’s indefinite-lived trademark wasestimated using the relief from royalty method, which assumes that the trademark has value to the extent thatUmbro is relieved of the obligation to pay royalties for the benefits received from the trademark. Theassessments of the Company resulted in the recognition of impairment charges of $199.3 million and $181.3million related to Umbro’s goodwill and trademark, respectively, during the third quarter ended February 28,2009. A deferred tax benefit of $54.5 million was recognized as a result of the trademark impairment charge. Inaddition to the above impairment analysis, the Company determined an equity investment held by Umbro wasimpaired, and recognized a charge of $20.7 million related to the impairment of this investment. These chargesare included in the Company’s “Other” category for segment reporting purposes.
The discounted cash flow analysis calculated the fair value of Umbro using management’s business plansand projections as the basis for expected cash flows for the next twelve years and a 3% residual growth ratethereafter. The Company used a weighted average discount rate of 14% in its analysis, which was derivedprimarily from published sources as well as our adjustment for increased market risk given current marketconditions. Other significant estimates used in the discounted cash flow analysis include the rates of projectedgrowth and profitability of Umbro’s business and working capital effects. The market valuation approachindicates the fair value of Umbro based on a comparison of Umbro to publicly traded companies in similar linesof business. Significant estimates in the market valuation approach include identifying similar companies withcomparable business factors such as size, growth, profitability, mix of revenue generated from licensed and directdistribution and risk of return on investment.
Holding all other assumptions constant at the test date, a 100 basis point increase in the discount rate wouldreduce the adjusted carrying value of Umbro’s net assets by 12%.
65

NIKE, INC.
NOTES TO CONSOLIDATED FINANCIAL STATEMENTS — (Continued)
Identified Intangible Assets and Goodwill
All goodwill balances are included in the Company’s “Other” category for segment reporting purposes. Thefollowing table summarizes the Company’s goodwill balance as of May 31, 2009 and 2008 (in millions):
Goodwill, May 31, 2007 . . . . . . . . . . . . . . . . . . . . . . . . . . . . . . . . . . . . . . . . . . . . . . . . . . . . . . $ 130.8Acquisition of Umbro Plc . . . . . . . . . . . . . . . . . . . . . . . . . . . . . . . . . . . . . . . . . . . . . . . . . . . . . 319.2Other(1) . . . . . . . . . . . . . . . . . . . . . . . . . . . . . . . . . . . . . . . . . . . . . . . . . . . . . . . . . . . . . . . . . . . (1.2)
Goodwill, May 31, 2008 . . . . . . . . . . . . . . . . . . . . . . . . . . . . . . . . . . . . . . . . . . . . . . . . . . . . . . 448.8Purchase price adjustments . . . . . . . . . . . . . . . . . . . . . . . . . . . . . . . . . . . . . . . . . . . . . . . . . . . . 23.6Impairment charge . . . . . . . . . . . . . . . . . . . . . . . . . . . . . . . . . . . . . . . . . . . . . . . . . . . . . . . . . . (199.3)Other(1) . . . . . . . . . . . . . . . . . . . . . . . . . . . . . . . . . . . . . . . . . . . . . . . . . . . . . . . . . . . . . . . . . . . (79.6)
Goodwill, May 31, 2009 . . . . . . . . . . . . . . . . . . . . . . . . . . . . . . . . . . . . . . . . . . . . . . . . . . . . . . $ 193.5
(1) Other consists of foreign currency translation adjustments on Umbro goodwill.
The following table summarizes the Company’s identifiable intangible asset balances as of May 31, 2009and 2008.
May 31, 2009 May 31, 2008
GrossCarryingAmount
AccumulatedAmortization
NetCarryingAmount
GrossCarryingAmount
AccumulatedAmortization
NetCarryingAmount
(In millions)
Amortized intangible assets:Patents . . . . . . . . . . . . . . . . . . . . $ 56.6 $(17.2) $ 39.4 $ 47.5 $(14.4) $ 33.1Trademarks . . . . . . . . . . . . . . . . 37.5 (10.9) 26.6 13.2 (7.8) 5.4Other . . . . . . . . . . . . . . . . . . . . . 40.0 (19.6) 20.4 65.2 (19.7) 45.5
Total . . . . . . . . . . . . . . . . . $134.1 $(47.7) $ 86.4 $125.9 $(41.9) $ 84.0
Unamortized intangible assets —Trademarks . . . . . . . . . . . . . . . . . . $381.0 $659.1
Identifiable intangible assets, net . . . $467.4 $743.1
The effect of foreign exchange fluctuations for the year ended May 31, 2009 reduced unamortizedintangible assets by approximately $98.2 million, resulting from the strengthening of the U.S. dollar in relation tothe British pound sterling.
Amortization expense, which is included in selling and administrative expense, was $11.9 million, $9.2million and $9.9 million for the years ended May 31, 2009, 2008, and 2007, respectively. The estimatedamortization expense for intangible assets subject to amortization for each of the years ending May 31, 2010through May 31, 2014 are as follows: 2010: $12.6 million; 2011: $12.2 million; 2012: $11.5 million; 2013: $9.6million; 2014: $7.6 million.
During the year ended May 31, 2008, the gross carrying amount of unamortized and amortized trademarkswere reduced by $59.6 million and $37.5 million, respectively, as a result of the Company’s divestitures of theStarter brand business and NIKE Bauer Hockey during the year ended May 31, 2008. SeeNote 17 — Divestitures for more information the Company’s divestitures.
66

NIKE, INC.
NOTES TO CONSOLIDATED FINANCIAL STATEMENTS — (Continued)
Note 5 — Accrued Liabilities
Accrued liabilities include the following:
May 31,
2009 2008
(In millions)
Compensation and benefits, excluding taxes . . . . . . . . . . . . . . . . . . . . . . . . . . . $ 491.9 $ 538.0Endorser compensation . . . . . . . . . . . . . . . . . . . . . . . . . . . . . . . . . . . . . . . . . . . . 237.1 203.5Taxes other than income taxes . . . . . . . . . . . . . . . . . . . . . . . . . . . . . . . . . . . . . . 161.9 147.6Restructuring charges(1) . . . . . . . . . . . . . . . . . . . . . . . . . . . . . . . . . . . . . . . . . . . 149.6 —Dividends payable . . . . . . . . . . . . . . . . . . . . . . . . . . . . . . . . . . . . . . . . . . . . . . . . 121.4 112.9Advertising and marketing . . . . . . . . . . . . . . . . . . . . . . . . . . . . . . . . . . . . . . . . . 97.6 121.4Fair value of derivatives . . . . . . . . . . . . . . . . . . . . . . . . . . . . . . . . . . . . . . . . . . . 68.9 173.3Import and logistics costs . . . . . . . . . . . . . . . . . . . . . . . . . . . . . . . . . . . . . . . . . . 59.4 78.8Other(2) . . . . . . . . . . . . . . . . . . . . . . . . . . . . . . . . . . . . . . . . . . . . . . . . . . . . . . . . . 396.1 386.4
$1,783.9 $1,761.9
(1) Accrued restructuring charges primarily consist of severance costs relating to the Company’s restructuringactivities that took place during the fourth quarter of fiscal 2009. See Note 16 — Restructuring Charges formore information.
(2) Other consists of various accrued expenses and no individual item accounted for more than 5% of thebalance at May 31, 2009 or 2008.
Note 6 — Fair Value Measurements
Effective June 1, 2008, the Company adopted FAS 157, “Fair Value Measurements” for financial assets andliabilities. FAS 157 establishes a hierarchy that prioritizes fair value measurements based on the types of inputsused for the various valuation techniques (market approach, income approach, and cost approach). FAS 157 isapplied under existing accounting pronouncements that require or permit fair value measurements and,accordingly, does not require any new fair value measurements.
The levels of hierarchy are described below:
• Level 1: Observable inputs such as quoted prices in active markets for identical assets or liabilities.
• Level 2: Inputs other than quoted prices that are observable for the asset or liability, either directly orindirectly; these include quoted prices for similar assets or liabilities in active markets and quotedprices for identical or similar assets or liabilities in markets that are not active.
• Level 3: Unobservable inputs in which there is little or no market data available, which require thereporting entity to develop its own assumptions.
The Company’s assessment of the significance of a particular input to the fair value measurement in itsentirety requires judgment and considers factors specific to the asset or liability. Financial assets and liabilitiesare classified in their entirety based on the most stringent level of input that is significant to the fair valuemeasurement.
The following table presents information about the Company’s financial assets and liabilities measured atfair value on a recurring basis as of May 31, 2009 and indicates the fair value hierarchy of the valuationtechniques utilized by the Company to determine such fair value.
67

NIKE, INC.
NOTES TO CONSOLIDATED FINANCIAL STATEMENTS — (Continued)
Fair Value Measurements Using Assets /Liabilities atFair Value Balance Sheet ClassificationLevel 1 Level 2 Level 3
(In millions)
AssetsDerivatives . . . . . . . . . . . $ — $ 378.7 $ — $ 378.7 Other current assets
and other long-termassets
Available-for-salesecurities . . . . . . . . . . 240.0 1,314.8 — 1,554.8 Cash equivalents
Available-for-salesecurities . . . . . . . . . . 467.9 696.1 — 1,164.0 Short-term investments
Total assets . . . . . . $707.9 $2,389.6 $ — $ 3,097.5
LiabilitiesDerivatives . . . . . . . . . . . $ — $ 68.9 $ — $ 68.9 Accrued liabilities and
other long-termliabilities
Total Liabilities . . $ — $ 68.9 $ — $ 68.9
Derivative financial instruments include foreign currency forwards, option contracts and interest rateswaps. The fair value of these derivatives contracts is determined using observable market inputs such as theforward pricing curve, currency volatilities, currency correlations, and interest rates, and considersnonperformance risk of the Company and that of its counterparties. Adjustments relating to these risks were notmaterial for the year ended May 31, 2009.
Available-for-sale securities are primarily comprised of investments in U.S. Treasury and agency securities,corporate commercial paper and bonds. These securities are valued using market prices on both active markets(level 1) and less active markets (level 2). Level 1 instrument valuations are obtained from real-time quotes fortransactions in active exchange markets involving identical assets. Level 2 instrument valuations are obtainedfrom readily-available pricing sources for comparable instruments.
The Company had no material Level 3 measurements as of May 31, 2009.
In accordance with the requirements of SFAS No. 107, “Disclosures about Fair Value of FinancialInstruments”, the Company annually discloses the fair value of its debt, which is recorded on the consolidatedbalance sheets at adjusted cost. Refer to Note 8 — Long-Term Debt for additional detail.
68

NIKE, INC.
NOTES TO CONSOLIDATED FINANCIAL STATEMENTS — (Continued)
Note 7 — Short-Term Borrowings and Credit Lines
Notes payable to banks and interest-bearing accounts payable to Sojitz Corporation of America (“SojitzAmerica”) as of May 31, 2009 and 2008, are summarized below:
May 31,
2009 2008
BorrowingsInterest
Rate BorrowingsInterest
Rate
(In millions)
Notes payable:Commercial Paper . . . . . . . . . . . . . . . . . . . . . . . . . $100.0 0.40% $ — —U.S. operations . . . . . . . . . . . . . . . . . . . . . . . . . . . . 31.2 1.81%(1) 18.6 0.00%(1)
Non-U.S. operations . . . . . . . . . . . . . . . . . . . . . . . . 211.7 4.15%(1) 159.1 6.80%(1)
$342.9 $177.7
Sojitz America . . . . . . . . . . . . . . . . . . . . . . . . . . . . . . . . $ 78.5 1.57% $ 65.9 3.51%
(1) Weighted average interest rate includes non-interest bearing overdrafts.
The carrying amounts reflected in the consolidated balance sheet for notes payable approximate fair value.
The Company purchases through Sojitz America certain athletic footwear, apparel and equipment it acquiresfrom non-U.S. suppliers. These purchases are for the Company’s operations outside of the United States, theEurope, Middle East, and Africa Region and Japan. Accounts payable to Sojitz America are generally due up to60 days after shipment of goods from the foreign port. The interest rate on such accounts payable is the 60-dayLondon Interbank Offered Rate (“LIBOR”) as of the beginning of the month of the invoice date, plus 0.75%.
As of May 31, 2009, the Company had $100.0 million outstanding under its commercial paper program at aweighted average interest rate of 0.40%. No borrowings were outstanding at May 31, 2008.
In December 2006, the Company entered into a $1 billion revolving credit facility with a group of banks.The facility matures in December 2012. Based on the Company’s current long-term senior unsecured debt ratingsof A+ and A1 from Standard and Poor’s Corporation and Moody’s Investor Services, respectively, the interestrate charged on any outstanding borrowings would be the prevailing LIBOR plus 0.15%. The facility fee is0.05% of the total commitment. Under this agreement, the Company must maintain, among other things, certainminimum specified financial ratios with which the Company was in compliance at May 31, 2009. No amountswere outstanding under this facility as of May 31, 2009 or 2008.
69

NIKE, INC.
NOTES TO CONSOLIDATED FINANCIAL STATEMENTS — (Continued)
Note 8 — Long-Term Debt
Long-term debt, net of unamortized premiums and discounts and swap fair value adjustments, is comprisedof the following:
May 31,
2009 2008
(In millions)
5.375% Corporate Bond, payable July 8, 2009 . . . . . . . . . . . . . . . . . . . . . . . . . . . . . . . $ 25.1 $ 25.55.66% Corporate Bond, payable July 23, 2012 . . . . . . . . . . . . . . . . . . . . . . . . . . . . . . . 27.4 26.15.4% Corporate Bond, payable August 7, 2012 . . . . . . . . . . . . . . . . . . . . . . . . . . . . . . . 16.2 15.44.7% Corporate Bond, payable October 1, 2013 . . . . . . . . . . . . . . . . . . . . . . . . . . . . . . 50.0 50.05.15% Corporate Bonds, payable October 15, 2015 . . . . . . . . . . . . . . . . . . . . . . . . . . . . 111.1 104.54.3% Japanese yen note, payable June 26, 2011 . . . . . . . . . . . . . . . . . . . . . . . . . . . . . . 108.5 99.61.5% Japanese yen note, payable February 14, 2012 . . . . . . . . . . . . . . . . . . . . . . . . . . . 51.7 47.42.6% Japanese yen note, maturing August 20, 2001 through November 20, 2020 . . . . 54.7 54.52.0% Japanese yen note, maturing August 20, 2001 through November 20, 2020 . . . . 24.5 24.4
Total . . . . . . . . . . . . . . . . . . . . . . . . . . . . . . . . . . . . . . . . . . . . . . . . . . . . . . . . 469.2 447.4Less current maturities . . . . . . . . . . . . . . . . . . . . . . . . . . . . . . . . . . . . . . . . . . . . . . . . . . 32.0 6.3
$437.2 $441.1
The scheduled maturity of long-term debt in each of the years ending May 31, 2010 through 2014 are$32.0 million, $6.9 million, $167.1 million, $46.9 million and $56.9 million, at face value, respectively.
The fair value of long-term debt is estimated based upon quoted prices for similar instruments. The fairvalue of the Company’s long-term debt, including the current portion, was approximately $456.4 million atMay 31, 2009 and $450.8 million at May 31, 2008.
In fiscal years 2003 and 2004, the Company issued a total of $240 million in medium-term notes of which$215 million, at face value, were outstanding at May 31, 2009 and 2008. The outstanding notes have couponrates that range from 4.70% to 5.66% and maturity dates ranging from July 2009 to October 2015. For each ofthese notes, except the $50 million note maturing in October 2013, the Company has entered into interest rateswap agreements whereby the Company receives fixed interest payments at the same rate as the notes and paysvariable interest payments based on the three-month or six-month LIBOR plus a spread. Each swap has the samenotional amount and maturity date as the corresponding note. At May 31, 2009, the interest rates payable onthese swap agreements ranged from approximately 1.5% to 3.2%.
In June 1996, one of the Company’s Japanese subsidiaries, NIKE Logistics YK, borrowed ¥10.5 billion(approximately $108.5 million as of May 31, 2009) in a private placement with a maturity of June 26, 2011.Interest is paid semi-annually. The agreement provides for early retirement of the borrowing.
In July 1999, NIKE Logistics YK assumed a total of ¥13.0 billion in loans as part of its agreement topurchase a distribution center in Japan, which serves as collateral for the loans. These loans mature in equalquarterly installments during the period August 20, 2001 through November 20, 2020. Interest is also paidquarterly. As of May 31, 2009, ¥7.7 billion (approximately $79.2 million) in loans remain outstanding.
In February 2007, NIKE Logistics YK entered into a ¥5.0 billion (approximately $51.7 million as ofMay 31, 2009) term loan that replaced certain intercompany borrowings and matures on February 14, 2012. Theinterest rate on the loan is approximately 1.5% and interest is paid semi-annually.
70

NIKE, INC.
NOTES TO CONSOLIDATED FINANCIAL STATEMENTS — (Continued)
Note 9 — Income Taxes
Income before income taxes is as follows:
Year Ended May 31,
2009 2008 2007
(In millions)
Income before income taxes:United States . . . . . . . . . . . . . . . . . . . . . . . . . . . . . . . . . . . . . . $ 845.7 $ 713.0 $ 805.1Foreign . . . . . . . . . . . . . . . . . . . . . . . . . . . . . . . . . . . . . . . . . . 1,110.8 1,789.9 1,394.8
$1,956.5 $2,502.9 $2,199.9
The provision for income taxes is as follows:
Year Ended May 31,
2009 2008 2007
(In millions)Current:
United StatesFederal . . . . . . . . . . . . . . . . . . . . . . . . . . . . . . . . . . . . . . . . . . $ 410.1 $ 469.9 $352.6State . . . . . . . . . . . . . . . . . . . . . . . . . . . . . . . . . . . . . . . . . . . . 46.1 58.4 59.6
Foreign . . . . . . . . . . . . . . . . . . . . . . . . . . . . . . . . . . . . . . . . . . . . . . 307.7 391.8 261.9
763.9 920.1 674.1
Deferred:United States
Federal . . . . . . . . . . . . . . . . . . . . . . . . . . . . . . . . . . . . . . . . . . (251.4) (273.0) 38.7State . . . . . . . . . . . . . . . . . . . . . . . . . . . . . . . . . . . . . . . . . . . . (7.9) (5.0) (4.8)
Foreign . . . . . . . . . . . . . . . . . . . . . . . . . . . . . . . . . . . . . . . . . . . . . . (34.8) (22.6) 0.4
(294.1) (300.6) 34.3
$ 469.8 $ 619.5 $708.4
71

NIKE, INC.
NOTES TO CONSOLIDATED FINANCIAL STATEMENTS — (Continued)
Deferred tax assets and (liabilities) are comprised of the following:
May 31,
2009 2008
(In millions)
Deferred tax assets:Allowance for doubtful accounts . . . . . . . . . . . . . . . . . . . . . . . . . . . . . . . . . . $ 17.9 $ 13.1Inventories . . . . . . . . . . . . . . . . . . . . . . . . . . . . . . . . . . . . . . . . . . . . . . . . . . . 52.8 49.2Sales return reserves . . . . . . . . . . . . . . . . . . . . . . . . . . . . . . . . . . . . . . . . . . . . 52.8 49.2Deferred compensation . . . . . . . . . . . . . . . . . . . . . . . . . . . . . . . . . . . . . . . . . . 160.9 158.4Stock-based compensation . . . . . . . . . . . . . . . . . . . . . . . . . . . . . . . . . . . . . . . 93.7 55.2Reserves and accrued liabilities . . . . . . . . . . . . . . . . . . . . . . . . . . . . . . . . . . . 66.7 57.0Property, plant, and equipment . . . . . . . . . . . . . . . . . . . . . . . . . . . . . . . . . . . . — 7.9Foreign loss carry-forwards . . . . . . . . . . . . . . . . . . . . . . . . . . . . . . . . . . . . . . 31.9 40.1Foreign tax credit carry-forwards . . . . . . . . . . . . . . . . . . . . . . . . . . . . . . . . . . 32.7 91.9Hedges . . . . . . . . . . . . . . . . . . . . . . . . . . . . . . . . . . . . . . . . . . . . . . . . . . . . . . 1.1 42.9Undistributed earnings of foreign subsidiaries . . . . . . . . . . . . . . . . . . . . . . . . 272.9 —Other . . . . . . . . . . . . . . . . . . . . . . . . . . . . . . . . . . . . . . . . . . . . . . . . . . . . . . . . 46.2 40.5
Total deferred tax assets . . . . . . . . . . . . . . . . . . . . . . . . . . . . . . . . . . . . . 829.6 605.4
Valuation allowance . . . . . . . . . . . . . . . . . . . . . . . . . . . . . . . . . . . . . . . . . . . . . . . . (26.0) (40.7)
Total deferred tax assets after valuation allowance . . . . . . . . . . . . . . . . 803.6 564.7
Deferred tax liabilities:Undistributed earnings of foreign subsidiaries . . . . . . . . . . . . . . . . . . . . . . . . — (113.2)Property, plant and equipment . . . . . . . . . . . . . . . . . . . . . . . . . . . . . . . . . . . . (92.2) (67.4)Intangibles . . . . . . . . . . . . . . . . . . . . . . . . . . . . . . . . . . . . . . . . . . . . . . . . . . . (100.7) (214.2)Hedges . . . . . . . . . . . . . . . . . . . . . . . . . . . . . . . . . . . . . . . . . . . . . . . . . . . . . . (86.6) (1.3)Other . . . . . . . . . . . . . . . . . . . . . . . . . . . . . . . . . . . . . . . . . . . . . . . . . . . . . . . . (4.2) (0.7)
Total deferred tax liability . . . . . . . . . . . . . . . . . . . . . . . . . . . . . . . . . . . (283.7) (396.8)
Net deferred tax asset . . . . . . . . . . . . . . . . . . . . . . . . . . . . . . . . . . . . . . . . . . . . . . . $ 519.9 $ 167.9
At the end of fiscal 2009, the Company reported a net deferred tax asset of $272.9 million associated withits investment in certain non-U.S. subsidiaries. Prior to fiscal 2009, the Company reported a net deferred taxliability for book to tax differences in its investment in non-U.S. subsidiaries. The change to a deferred tax assetposition at the end of fiscal 2009 is due primarily to the impact of the impairment of Umbro’s goodwill,intangible and other assets as described in Note 4 — Acquisition, Identifiable Intangible Assets, Goodwill andUmbro Impairment.
A reconciliation from the U.S. statutory federal income tax rate to the effective income tax rate follows:
Year Ended May 31,
2009 2008 2007
Federal income tax rate . . . . . . . . . . . . . . . . . . . . . . . . . . . . . . . . . . . . . . . . . . . 35.0% 35.0% 35.0%State taxes, net of federal benefit . . . . . . . . . . . . . . . . . . . . . . . . . . . . . . . . . . . 1.2% 1.4% 1.6%Foreign earnings . . . . . . . . . . . . . . . . . . . . . . . . . . . . . . . . . . . . . . . . . . . . . . . . -14.9% -12.9% -4.1%Other, net . . . . . . . . . . . . . . . . . . . . . . . . . . . . . . . . . . . . . . . . . . . . . . . . . . . . . . 2.7% 1.3% -0.3%
Effective income tax rate . . . . . . . . . . . . . . . . . . . . . . . . . . . . . . . . . . . . . . . . . . 24.0% 24.8% 32.2%
72
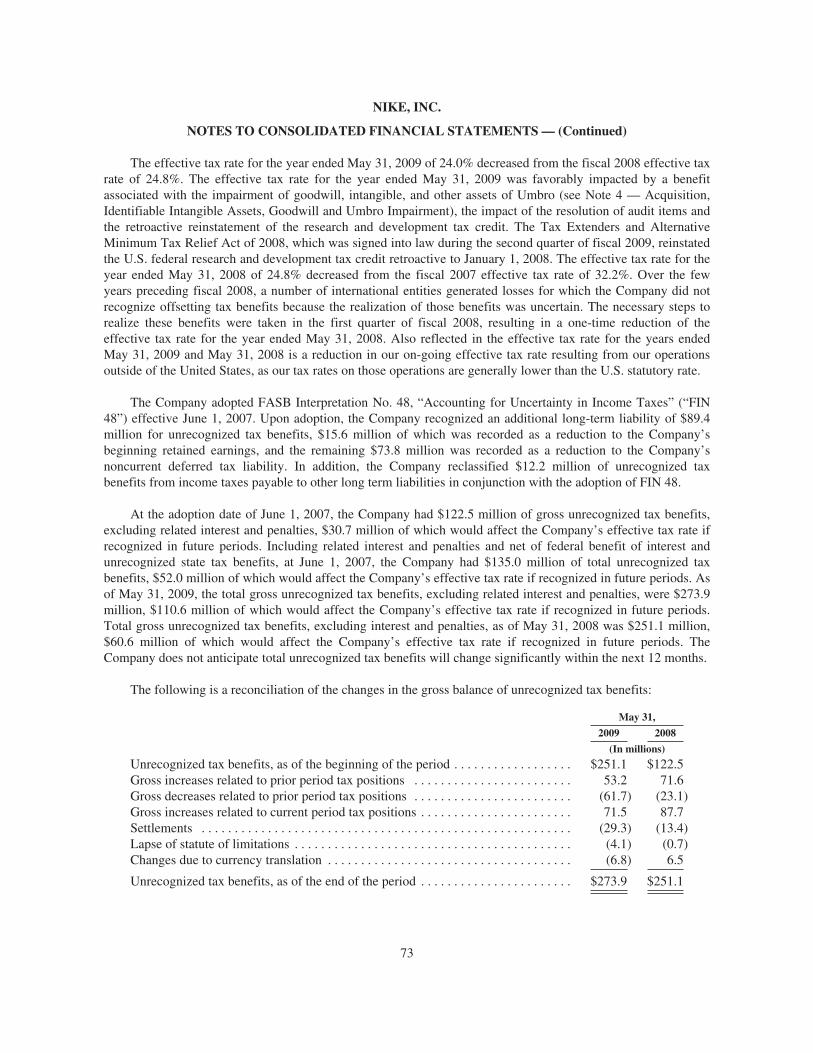
NIKE, INC.
NOTES TO CONSOLIDATED FINANCIAL STATEMENTS — (Continued)
The effective tax rate for the year ended May 31, 2009 of 24.0% decreased from the fiscal 2008 effective taxrate of 24.8%. The effective tax rate for the year ended May 31, 2009 was favorably impacted by a benefitassociated with the impairment of goodwill, intangible, and other assets of Umbro (see Note 4 — Acquisition,Identifiable Intangible Assets, Goodwill and Umbro Impairment), the impact of the resolution of audit items andthe retroactive reinstatement of the research and development tax credit. The Tax Extenders and AlternativeMinimum Tax Relief Act of 2008, which was signed into law during the second quarter of fiscal 2009, reinstatedthe U.S. federal research and development tax credit retroactive to January 1, 2008. The effective tax rate for theyear ended May 31, 2008 of 24.8% decreased from the fiscal 2007 effective tax rate of 32.2%. Over the fewyears preceding fiscal 2008, a number of international entities generated losses for which the Company did notrecognize offsetting tax benefits because the realization of those benefits was uncertain. The necessary steps torealize these benefits were taken in the first quarter of fiscal 2008, resulting in a one-time reduction of theeffective tax rate for the year ended May 31, 2008. Also reflected in the effective tax rate for the years endedMay 31, 2009 and May 31, 2008 is a reduction in our on-going effective tax rate resulting from our operationsoutside of the United States, as our tax rates on those operations are generally lower than the U.S. statutory rate.
The Company adopted FASB Interpretation No. 48, “Accounting for Uncertainty in Income Taxes” (“FIN48”) effective June 1, 2007. Upon adoption, the Company recognized an additional long-term liability of $89.4million for unrecognized tax benefits, $15.6 million of which was recorded as a reduction to the Company’sbeginning retained earnings, and the remaining $73.8 million was recorded as a reduction to the Company’snoncurrent deferred tax liability. In addition, the Company reclassified $12.2 million of unrecognized taxbenefits from income taxes payable to other long term liabilities in conjunction with the adoption of FIN 48.
At the adoption date of June 1, 2007, the Company had $122.5 million of gross unrecognized tax benefits,excluding related interest and penalties, $30.7 million of which would affect the Company’s effective tax rate ifrecognized in future periods. Including related interest and penalties and net of federal benefit of interest andunrecognized state tax benefits, at June 1, 2007, the Company had $135.0 million of total unrecognized taxbenefits, $52.0 million of which would affect the Company’s effective tax rate if recognized in future periods. Asof May 31, 2009, the total gross unrecognized tax benefits, excluding related interest and penalties, were $273.9million, $110.6 million of which would affect the Company’s effective tax rate if recognized in future periods.Total gross unrecognized tax benefits, excluding interest and penalties, as of May 31, 2008 was $251.1 million,$60.6 million of which would affect the Company’s effective tax rate if recognized in future periods. TheCompany does not anticipate total unrecognized tax benefits will change significantly within the next 12 months.
The following is a reconciliation of the changes in the gross balance of unrecognized tax benefits:
May 31,
2009 2008
(In millions)
Unrecognized tax benefits, as of the beginning of the period . . . . . . . . . . . . . . . . . . $251.1 $122.5Gross increases related to prior period tax positions . . . . . . . . . . . . . . . . . . . . . . . . 53.2 71.6Gross decreases related to prior period tax positions . . . . . . . . . . . . . . . . . . . . . . . . (61.7) (23.1)Gross increases related to current period tax positions . . . . . . . . . . . . . . . . . . . . . . . 71.5 87.7Settlements . . . . . . . . . . . . . . . . . . . . . . . . . . . . . . . . . . . . . . . . . . . . . . . . . . . . . . . . (29.3) (13.4)Lapse of statute of limitations . . . . . . . . . . . . . . . . . . . . . . . . . . . . . . . . . . . . . . . . . . (4.1) (0.7)Changes due to currency translation . . . . . . . . . . . . . . . . . . . . . . . . . . . . . . . . . . . . . (6.8) 6.5
Unrecognized tax benefits, as of the end of the period . . . . . . . . . . . . . . . . . . . . . . . $273.9 $251.1
73
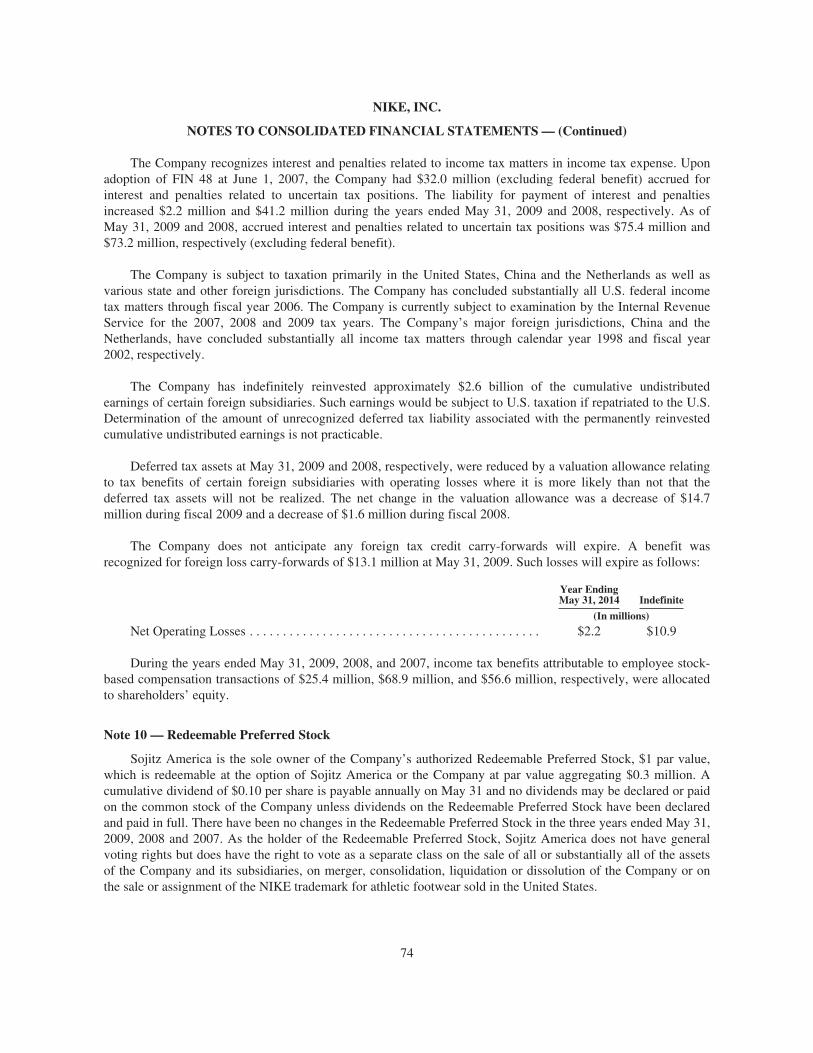
NIKE, INC.
NOTES TO CONSOLIDATED FINANCIAL STATEMENTS — (Continued)
The Company recognizes interest and penalties related to income tax matters in income tax expense. Uponadoption of FIN 48 at June 1, 2007, the Company had $32.0 million (excluding federal benefit) accrued forinterest and penalties related to uncertain tax positions. The liability for payment of interest and penaltiesincreased $2.2 million and $41.2 million during the years ended May 31, 2009 and 2008, respectively. As ofMay 31, 2009 and 2008, accrued interest and penalties related to uncertain tax positions was $75.4 million and$73.2 million, respectively (excluding federal benefit).
The Company is subject to taxation primarily in the United States, China and the Netherlands as well asvarious state and other foreign jurisdictions. The Company has concluded substantially all U.S. federal incometax matters through fiscal year 2006. The Company is currently subject to examination by the Internal RevenueService for the 2007, 2008 and 2009 tax years. The Company’s major foreign jurisdictions, China and theNetherlands, have concluded substantially all income tax matters through calendar year 1998 and fiscal year2002, respectively.
The Company has indefinitely reinvested approximately $2.6 billion of the cumulative undistributedearnings of certain foreign subsidiaries. Such earnings would be subject to U.S. taxation if repatriated to the U.S.Determination of the amount of unrecognized deferred tax liability associated with the permanently reinvestedcumulative undistributed earnings is not practicable.
Deferred tax assets at May 31, 2009 and 2008, respectively, were reduced by a valuation allowance relatingto tax benefits of certain foreign subsidiaries with operating losses where it is more likely than not that thedeferred tax assets will not be realized. The net change in the valuation allowance was a decrease of $14.7million during fiscal 2009 and a decrease of $1.6 million during fiscal 2008.
The Company does not anticipate any foreign tax credit carry-forwards will expire. A benefit wasrecognized for foreign loss carry-forwards of $13.1 million at May 31, 2009. Such losses will expire as follows:
Year EndingMay 31, 2014 Indefinite
(In millions)
Net Operating Losses . . . . . . . . . . . . . . . . . . . . . . . . . . . . . . . . . . . . . . . . . . . . $2.2 $10.9
During the years ended May 31, 2009, 2008, and 2007, income tax benefits attributable to employee stock-based compensation transactions of $25.4 million, $68.9 million, and $56.6 million, respectively, were allocatedto shareholders’ equity.
Note 10 — Redeemable Preferred Stock
Sojitz America is the sole owner of the Company’s authorized Redeemable Preferred Stock, $1 par value,which is redeemable at the option of Sojitz America or the Company at par value aggregating $0.3 million. Acumulative dividend of $0.10 per share is payable annually on May 31 and no dividends may be declared or paidon the common stock of the Company unless dividends on the Redeemable Preferred Stock have been declaredand paid in full. There have been no changes in the Redeemable Preferred Stock in the three years ended May 31,2009, 2008 and 2007. As the holder of the Redeemable Preferred Stock, Sojitz America does not have generalvoting rights but does have the right to vote as a separate class on the sale of all or substantially all of the assetsof the Company and its subsidiaries, on merger, consolidation, liquidation or dissolution of the Company or onthe sale or assignment of the NIKE trademark for athletic footwear sold in the United States.
74

NIKE, INC.
NOTES TO CONSOLIDATED FINANCIAL STATEMENTS — (Continued)
Note 11 — Common Stock and Stock-Based Compensation
The authorized number of shares of Class A Common Stock, no par value, and Class B Common Stock, nopar value, are 175 million and 750 million, respectively. Each share of Class A Common Stock is convertible intoone share of Class B Common Stock. Voting rights of Class B Common Stock are limited in certaincircumstances with respect to the election of directors.
In 1990, the Board of Directors adopted, and the shareholders approved, the NIKE, Inc. 1990 StockIncentive Plan (the “1990 Plan”). The 1990 Plan provides for the issuance of up to 132 million previouslyunissued shares of Class B Common Stock in connection with stock options and other awards granted under theplan. The 1990 Plan authorizes the grant of non-statutory stock options, incentive stock options, stockappreciation rights, stock bonuses and the issuance and sale of restricted stock. The exercise price fornon-statutory stock options, stock appreciation rights and the grant price of restricted stock may not be less than75% of the fair market value of the underlying shares on the date of grant. The exercise price for incentive stockoptions may not be less than the fair market value of the underlying shares on the date of grant. A committee ofthe Board of Directors administers the 1990 Plan. The committee has the authority to determine the employees towhom awards will be made, the amount of the awards, and the other terms and conditions of the awards. Thecommittee has granted substantially all stock options at 100% of the market price on the date of grant.Substantially all stock option grants outstanding under the 1990 plan were granted in the first quarter of eachfiscal year, vest ratably over four years, and expire 10 years from the date of grant.
The following table summarizes the Company’s total stock-based compensation expense recognized inselling and administrative expense:
Year Ended May 31,
2009 2008 2007
(In millions)
Stock options(1) . . . . . . . . . . . . . . . . . . . . . . . . . . . . . . . . . . . . . . . . . . . . . $128.8 $127.0 $134.9ESPPs . . . . . . . . . . . . . . . . . . . . . . . . . . . . . . . . . . . . . . . . . . . . . . . . . . . . 14.4 7.2 7.0Restricted stock . . . . . . . . . . . . . . . . . . . . . . . . . . . . . . . . . . . . . . . . . . . . 7.9 6.8 5.8
Subtotal . . . . . . . . . . . . . . . . . . . . . . . . . . . . . . . . . . . . . . . . . . . . . . . 151.1 141.0 147.7Stock options and restricted stock expense — restructuring(2) . . . . . . . . 19.5 — —
Total stock-based compensation expense . . . . . . . . . . . . . . . . . . . . . . . . $170.6 $141.0 $147.7
(1) In accordance with FAS 123R, stock-based compensation expense reported during the years ended May 31,2009, 2008 and 2007 includes $56.3 million, $40.7 million and $36.3 million, respectively, of acceleratedstock-based compensation expense recorded for employees eligible for stock option vesting uponretirement.
(2) In connection with the restructuring activities that took place during the fourth quarter of fiscal 2009, theCompany recognized stock-based compensation expense relating to the modification of stock optionagreements, allowing for an extended post-termination exercise period, and accelerated vesting of restrictedstock as part of severance packages. See Note 16 — Restructuring Charges for further details.
As of May 31, 2009, the Company had $82.3 million of unrecognized compensation costs from stockoptions, net of estimated forfeitures, to be recognized as selling and administrative expense over a weightedaverage period of 2.0 years.
75

NIKE, INC.
NOTES TO CONSOLIDATED FINANCIAL STATEMENTS — (Continued)
The weighted average fair value per share of the options granted during the years ended May 31, 2009, 2008and 2007, as computed using the Black-Scholes pricing model, was $17.13, $13.87 and $8.80, respectively. Theweighted average assumptions used to estimate these fair values are as follows:
Year Ended May 31,
2009 2008 2007
Dividend yield . . . . . . . . . . . . . . . . . . . . . . . . . . . . . . . . . . . . . . . . . . . . . . . . . . . 1.5% 1.4% 1.6%Expected volatility . . . . . . . . . . . . . . . . . . . . . . . . . . . . . . . . . . . . . . . . . . . . . . . . 32.5% 20.0% 19.0%Weighted average expected life (in years) . . . . . . . . . . . . . . . . . . . . . . . . . . . . . . 5.0 5.0 5.0Risk-free interest rate . . . . . . . . . . . . . . . . . . . . . . . . . . . . . . . . . . . . . . . . . . . . . . 3.4% 4.8% 5.0%
The Company estimates the expected volatility based on the implied volatility in market traded options onthe Company’s common stock with a term greater than one year, along with other factors. The weighted averageexpected life of options is based on an analysis of historical and expected future exercise patterns. The interestrate is based on the U.S. Treasury (constant maturity) risk-free rate in effect at the date of grant for periodscorresponding with the expected term of the options.
The following summarizes the stock option transactions under the plan discussed above:
Shares
WeightedAverageOptionPrice
(In millions)
Options outstanding May 31, 2006 . . . . . . . . . . . . . . . . . . . . . . . . . . . . . . . . . . 40.4 $32.31Exercised . . . . . . . . . . . . . . . . . . . . . . . . . . . . . . . . . . . . . . . . . . . . . . . . . . (10.7) 27.55Forfeited . . . . . . . . . . . . . . . . . . . . . . . . . . . . . . . . . . . . . . . . . . . . . . . . . . (1.6) 37.17Granted . . . . . . . . . . . . . . . . . . . . . . . . . . . . . . . . . . . . . . . . . . . . . . . . . . . 11.6 39.54
Options outstanding May 31, 2007 . . . . . . . . . . . . . . . . . . . . . . . . . . . . . . . . . . 39.7 $35.50Exercised . . . . . . . . . . . . . . . . . . . . . . . . . . . . . . . . . . . . . . . . . . . . . . . . . . (9.1) 33.45Forfeited . . . . . . . . . . . . . . . . . . . . . . . . . . . . . . . . . . . . . . . . . . . . . . . . . . (0.9) 44.44Granted . . . . . . . . . . . . . . . . . . . . . . . . . . . . . . . . . . . . . . . . . . . . . . . . . . . 6.9 58.50
Options outstanding May 31, 2008 . . . . . . . . . . . . . . . . . . . . . . . . . . . . . . . . . . 36.6 $40.14Exercised . . . . . . . . . . . . . . . . . . . . . . . . . . . . . . . . . . . . . . . . . . . . . . . . . . (4.0) 35.70Forfeited . . . . . . . . . . . . . . . . . . . . . . . . . . . . . . . . . . . . . . . . . . . . . . . . . . (1.3) 51.19Granted . . . . . . . . . . . . . . . . . . . . . . . . . . . . . . . . . . . . . . . . . . . . . . . . . . . 7.5 58.17
Options outstanding May 31, 2009 . . . . . . . . . . . . . . . . . . . . . . . . . . . . . . . . . . 38.8 $43.69Options exercisable at May 31,
2007 . . . . . . . . . . . . . . . . . . . . . . . . . . . . . . . . . . . . . . . . . . . . . . . . . . . . . . 15.3 $29.522008 . . . . . . . . . . . . . . . . . . . . . . . . . . . . . . . . . . . . . . . . . . . . . . . . . . . . . . 16.2 32.352009 . . . . . . . . . . . . . . . . . . . . . . . . . . . . . . . . . . . . . . . . . . . . . . . . . . . . . . 21.4 36.91
The weighted average contractual life remaining for options outstanding and options exercisable at May 31,2009 was 6.3 years and 5.0 years, respectively. The aggregate intrinsic value for options outstanding andexercisable at May 31, 2009 was $535.6 million and $433.5 million, respectively. The aggregate intrinsic valuewas the amount by which the market value of the underlying stock exceeded the exercise price of the options.The total intrinsic value of the options exercised during the years ended May 31, 2009, 2008 and 2007 was$108.4 million, $259.4 million and $204.9 million, respectively.
76
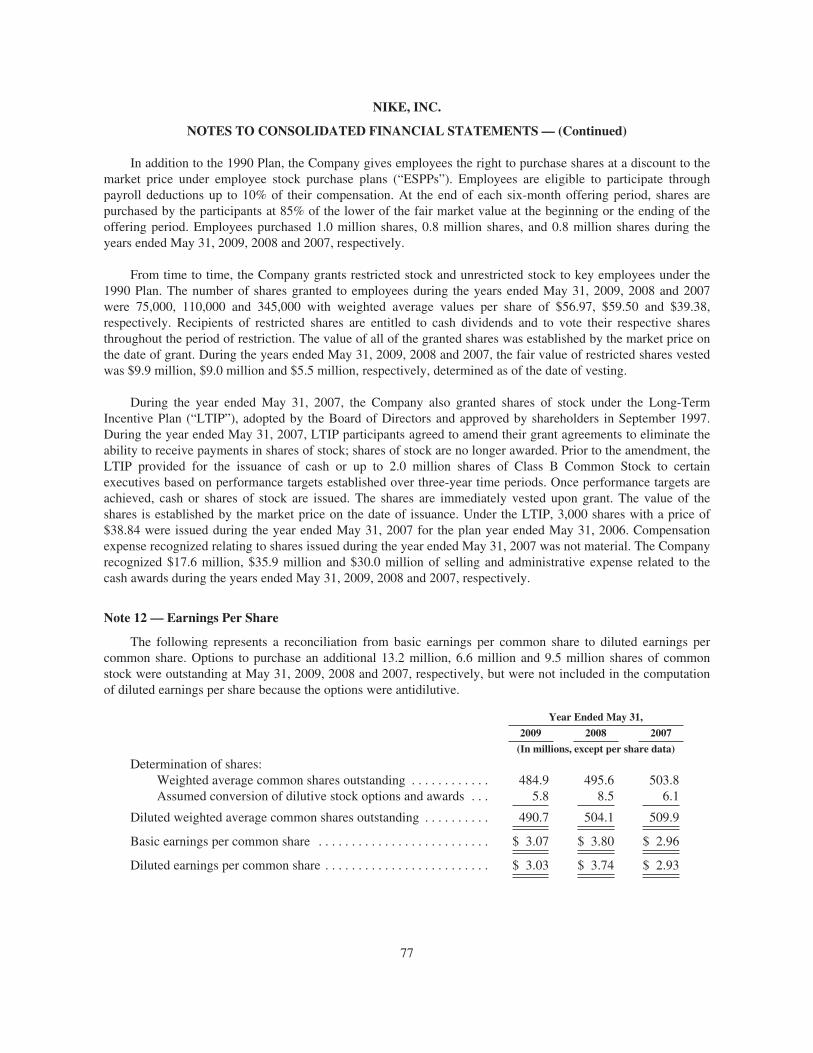
NIKE, INC.
NOTES TO CONSOLIDATED FINANCIAL STATEMENTS — (Continued)
In addition to the 1990 Plan, the Company gives employees the right to purchase shares at a discount to themarket price under employee stock purchase plans (“ESPPs”). Employees are eligible to participate throughpayroll deductions up to 10% of their compensation. At the end of each six-month offering period, shares arepurchased by the participants at 85% of the lower of the fair market value at the beginning or the ending of theoffering period. Employees purchased 1.0 million shares, 0.8 million shares, and 0.8 million shares during theyears ended May 31, 2009, 2008 and 2007, respectively.
From time to time, the Company grants restricted stock and unrestricted stock to key employees under the1990 Plan. The number of shares granted to employees during the years ended May 31, 2009, 2008 and 2007were 75,000, 110,000 and 345,000 with weighted average values per share of $56.97, $59.50 and $39.38,respectively. Recipients of restricted shares are entitled to cash dividends and to vote their respective sharesthroughout the period of restriction. The value of all of the granted shares was established by the market price onthe date of grant. During the years ended May 31, 2009, 2008 and 2007, the fair value of restricted shares vestedwas $9.9 million, $9.0 million and $5.5 million, respectively, determined as of the date of vesting.
During the year ended May 31, 2007, the Company also granted shares of stock under the Long-TermIncentive Plan (“LTIP”), adopted by the Board of Directors and approved by shareholders in September 1997.During the year ended May 31, 2007, LTIP participants agreed to amend their grant agreements to eliminate theability to receive payments in shares of stock; shares of stock are no longer awarded. Prior to the amendment, theLTIP provided for the issuance of cash or up to 2.0 million shares of Class B Common Stock to certainexecutives based on performance targets established over three-year time periods. Once performance targets areachieved, cash or shares of stock are issued. The shares are immediately vested upon grant. The value of theshares is established by the market price on the date of issuance. Under the LTIP, 3,000 shares with a price of$38.84 were issued during the year ended May 31, 2007 for the plan year ended May 31, 2006. Compensationexpense recognized relating to shares issued during the year ended May 31, 2007 was not material. The Companyrecognized $17.6 million, $35.9 million and $30.0 million of selling and administrative expense related to thecash awards during the years ended May 31, 2009, 2008 and 2007, respectively.
Note 12 — Earnings Per Share
The following represents a reconciliation from basic earnings per common share to diluted earnings percommon share. Options to purchase an additional 13.2 million, 6.6 million and 9.5 million shares of commonstock were outstanding at May 31, 2009, 2008 and 2007, respectively, but were not included in the computationof diluted earnings per share because the options were antidilutive.
Year Ended May 31,
2009 2008 2007
(In millions, except per share data)
Determination of shares:Weighted average common shares outstanding . . . . . . . . . . . . 484.9 495.6 503.8Assumed conversion of dilutive stock options and awards . . . 5.8 8.5 6.1
Diluted weighted average common shares outstanding . . . . . . . . . . 490.7 504.1 509.9
Basic earnings per common share . . . . . . . . . . . . . . . . . . . . . . . . . . $ 3.07 $ 3.80 $ 2.96
Diluted earnings per common share . . . . . . . . . . . . . . . . . . . . . . . . . $ 3.03 $ 3.74 $ 2.93
77
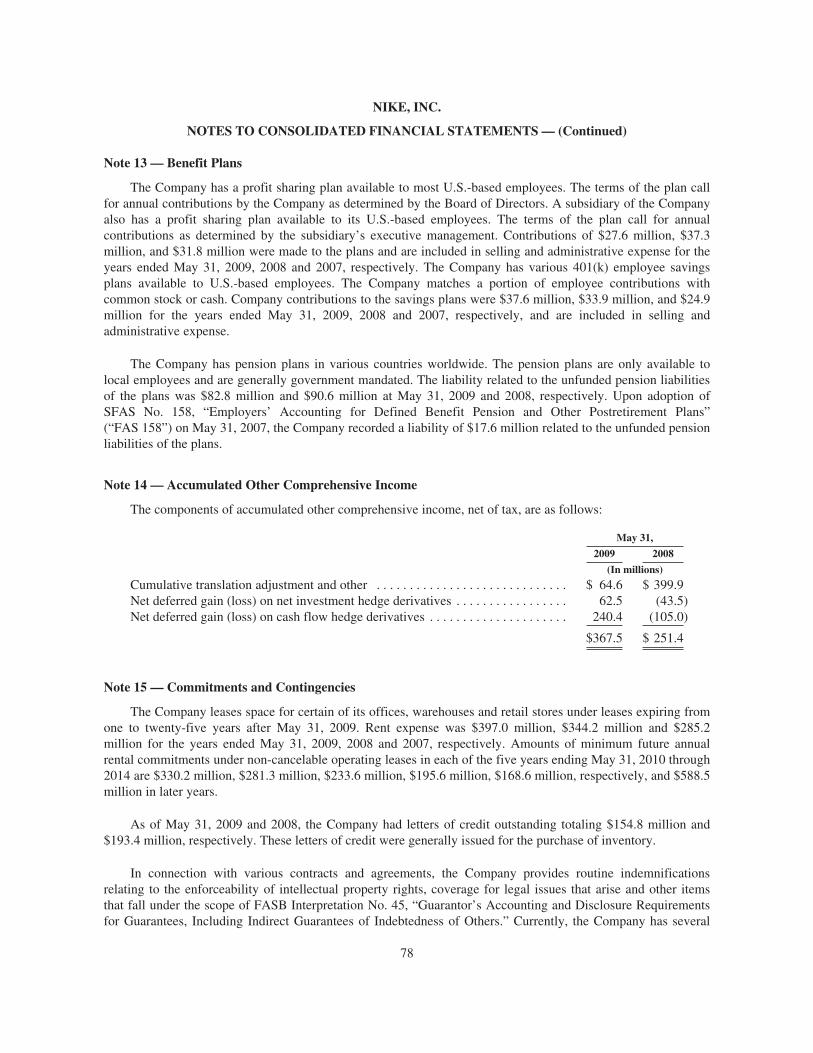
NIKE, INC.
NOTES TO CONSOLIDATED FINANCIAL STATEMENTS — (Continued)
Note 13 — Benefit Plans
The Company has a profit sharing plan available to most U.S.-based employees. The terms of the plan callfor annual contributions by the Company as determined by the Board of Directors. A subsidiary of the Companyalso has a profit sharing plan available to its U.S.-based employees. The terms of the plan call for annualcontributions as determined by the subsidiary’s executive management. Contributions of $27.6 million, $37.3million, and $31.8 million were made to the plans and are included in selling and administrative expense for theyears ended May 31, 2009, 2008 and 2007, respectively. The Company has various 401(k) employee savingsplans available to U.S.-based employees. The Company matches a portion of employee contributions withcommon stock or cash. Company contributions to the savings plans were $37.6 million, $33.9 million, and $24.9million for the years ended May 31, 2009, 2008 and 2007, respectively, and are included in selling andadministrative expense.
The Company has pension plans in various countries worldwide. The pension plans are only available tolocal employees and are generally government mandated. The liability related to the unfunded pension liabilitiesof the plans was $82.8 million and $90.6 million at May 31, 2009 and 2008, respectively. Upon adoption ofSFAS No. 158, “Employers’ Accounting for Defined Benefit Pension and Other Postretirement Plans”(“FAS 158”) on May 31, 2007, the Company recorded a liability of $17.6 million related to the unfunded pensionliabilities of the plans.
Note 14 — Accumulated Other Comprehensive Income
The components of accumulated other comprehensive income, net of tax, are as follows:
May 31,
2009 2008
(In millions)
Cumulative translation adjustment and other . . . . . . . . . . . . . . . . . . . . . . . . . . . . . $ 64.6 $ 399.9Net deferred gain (loss) on net investment hedge derivatives . . . . . . . . . . . . . . . . . 62.5 (43.5)Net deferred gain (loss) on cash flow hedge derivatives . . . . . . . . . . . . . . . . . . . . . 240.4 (105.0)
$367.5 $ 251.4
Note 15 — Commitments and Contingencies
The Company leases space for certain of its offices, warehouses and retail stores under leases expiring fromone to twenty-five years after May 31, 2009. Rent expense was $397.0 million, $344.2 million and $285.2million for the years ended May 31, 2009, 2008 and 2007, respectively. Amounts of minimum future annualrental commitments under non-cancelable operating leases in each of the five years ending May 31, 2010 through2014 are $330.2 million, $281.3 million, $233.6 million, $195.6 million, $168.6 million, respectively, and $588.5million in later years.
As of May 31, 2009 and 2008, the Company had letters of credit outstanding totaling $154.8 million and$193.4 million, respectively. These letters of credit were generally issued for the purchase of inventory.
In connection with various contracts and agreements, the Company provides routine indemnificationsrelating to the enforceability of intellectual property rights, coverage for legal issues that arise and other itemsthat fall under the scope of FASB Interpretation No. 45, “Guarantor’s Accounting and Disclosure Requirementsfor Guarantees, Including Indirect Guarantees of Indebtedness of Others.” Currently, the Company has several
78

NIKE, INC.
NOTES TO CONSOLIDATED FINANCIAL STATEMENTS — (Continued)
such agreements in place. However, based on the Company’s historical experience and the estimated probabilityof future loss, the Company has determined that the fair value of such indemnifications is not material to theCompany’s financial position or results of operations.
In the ordinary course of its business, the Company is involved in various legal proceedings involvingcontractual and employment relationships, product liability claims, trademark rights, and a variety of othermatters. The Company does not believe there are any pending legal proceedings that will have a material impacton the Company’s financial position or results of operations.
Note 16 — Restructuring Charges
During the fourth quarter of fiscal 2009, the Company took necessary steps to streamline its managementstructure, enhance consumer focus, drive innovation more quickly to market and establish a more scalable,long-term cost structure. As a result, the Company reduced its global workforce by approximately 5% andincurred pre-tax restructuring charges of $195 million, primarily consisting of severance costs related to theworkforce reduction. As nearly all of the restructuring activities were completed in the fourth quarter of fiscal2009, the Company does not expect to recognize additional costs in future periods relating to these actions. Therestructuring charge is reflected in the corporate expense line in the segment presentation of pre-tax income inNote 19 — Operating Segments and Related Information.
The activity in the restructuring accrual for the year ended May 31, 2009 is as follows (in millions):
Restructuring accrual — June 1, 2008 . . . . . . . . . . . . . . . . . . . . . . . . . . . . . . . . . . . . . . . . . . . . $ —Severance and related costs . . . . . . . . . . . . . . . . . . . . . . . . . . . . . . . . . . . . . . . . . . . . . . . . . . . . 195.0Cash payments . . . . . . . . . . . . . . . . . . . . . . . . . . . . . . . . . . . . . . . . . . . . . . . . . . . . . . . . . . . . . . (29.4)Non-cash stock option and restricted stock expense . . . . . . . . . . . . . . . . . . . . . . . . . . . . . . . . . (19.5)Foreign currency translation and other . . . . . . . . . . . . . . . . . . . . . . . . . . . . . . . . . . . . . . . . . . . 3.5
Restructuring accrual — May 31, 2009 . . . . . . . . . . . . . . . . . . . . . . . . . . . . . . . . . . . . . . . . . . . $149.6
The accrual balance as of May 31, 2009 will be relieved throughout fiscal year 2010 and early 2011, asseverance payments are completed. The restructuring accrual is included in Accrued liabilities in theConsolidated Balance Sheet.
As part of its restructuring activities, the Company reorganized its NIKE brand operations geographicstructure. In fiscal 2009, 2008 and 2007, NIKE brand operations were organized into the following fourgeographic regions: U.S., Europe, Middle East and Africa (collectively, “EMEA”), Asia Pacific, andAmericas. In the fourth quarter of 2009, the Company initiated a reorganization of the NIKE Brand business intoa new operating model. As a result of this reorganization, beginning in the first quarter of fiscal 2010, the NIKEbrand operations will consist of the following six geographies: North America, Western Europe, Central/EasternEurope, Greater China, Japan, and Emerging Markets.
Note 17 — Divestitures
On December 17, 2007, the Company completed the sale of the Starter brand business to Iconix BrandGroup, Inc. for $60.0 million in cash. This transaction resulted in a gain of $28.6 million during the year endedMay 31, 2008.
79

NIKE, INC.
NOTES TO CONSOLIDATED FINANCIAL STATEMENTS — (Continued)
On April 17, 2008, the Company completed the sale of NIKE Bauer Hockey for $189.2 million in cash to agroup of private investors (“the Buyer”). The sale resulted in a net gain of $32.0 million recorded in the fourthquarter of the year ended May 31, 2008. This gain included the recognition of a $46.3 million cumulative foreigncurrency translation adjustment previously included in accumulated other comprehensive income. As part of theterms of the sale agreement, the Company granted the Buyer a royalty free limited license for the use of certainNIKE trademarks for a transitional period of approximately two years. The Company deferred $41.0 million ofthe sale proceeds related to this license agreement, to be recognized over the license period.
The gains resulting from these divestitures are reflected in other (income) expense, net and in the corporateexpense line in the segment presentation of pre-tax income in Note 19 — Operating Segments and RelatedInformation.
Note 18 — Risk Management and Derivatives
The Company is exposed to global market risks, including the effect of changes in foreign currencyexchange rates and interest rates, and uses derivatives to manage financial exposures that occur in the normalcourse of business. The Company does not hold or issue derivatives for trading purposes.
The Company formally documents all relationships between hedging instruments and hedged items, as wellas its risk management objective and strategy for undertaking hedge transactions. This process includes linkingall derivatives to either specific firm commitments, forecasted transactions or net investments. The Company alsoenters into foreign exchange forwards to mitigate the change in fair value of specific assets and liabilities on thebalance sheet; these are not designated as hedging instruments under FAS 133. Accordingly, changes in the fairvalue of hedges of recorded balance sheet positions are recognized immediately in other (income) expense, net,on the income statement together with the transaction gain or loss from the hedged balance sheet position.
Substantially all derivatives outstanding as of May 31, 2009 are designated as either cash flow, fair value ornet investment hedges. All derivatives are recognized on the balance sheet at their fair value and classified basedon the instrument’s maturity date. The total notional amount of outstanding derivatives as of May 31, 2009 was$7.1 billion, which is primarily comprised of cash flow hedges denominated in Euro, Japanese yen and Britishpound.
80
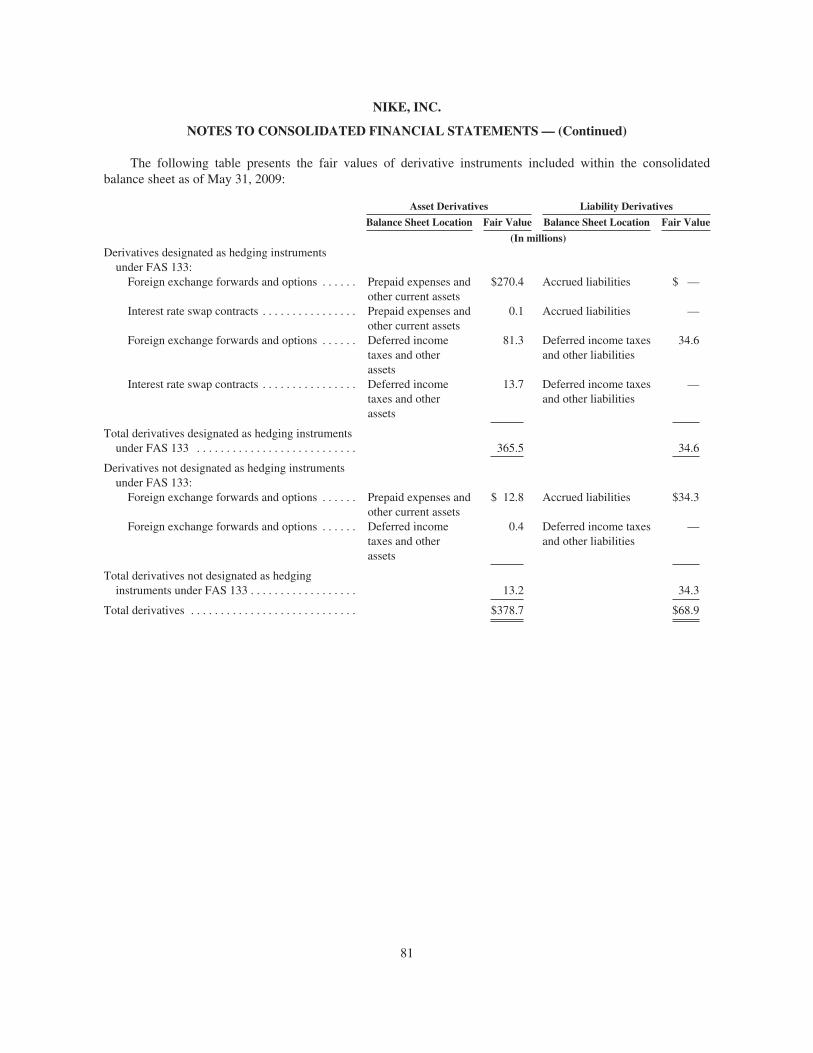
NIKE, INC.
NOTES TO CONSOLIDATED FINANCIAL STATEMENTS — (Continued)
The following table presents the fair values of derivative instruments included within the consolidatedbalance sheet as of May 31, 2009:
Asset Derivatives Liability Derivatives
Balance Sheet Location Fair Value Balance Sheet Location Fair Value
(In millions)Derivatives designated as hedging instruments
under FAS 133:Foreign exchange forwards and options . . . . . . Prepaid expenses and
other current assets$270.4 Accrued liabilities $ —
Interest rate swap contracts . . . . . . . . . . . . . . . . Prepaid expenses andother current assets
0.1 Accrued liabilities —
Foreign exchange forwards and options . . . . . . Deferred incometaxes and otherassets
81.3 Deferred income taxesand other liabilities
34.6
Interest rate swap contracts . . . . . . . . . . . . . . . . Deferred incometaxes and otherassets
13.7 Deferred income taxesand other liabilities
—
Total derivatives designated as hedging instrumentsunder FAS 133 . . . . . . . . . . . . . . . . . . . . . . . . . . . 365.5 34.6
Derivatives not designated as hedging instrumentsunder FAS 133:
Foreign exchange forwards and options . . . . . . Prepaid expenses andother current assets
$ 12.8 Accrued liabilities $34.3
Foreign exchange forwards and options . . . . . . Deferred incometaxes and otherassets
0.4 Deferred income taxesand other liabilities
—
Total derivatives not designated as hedginginstruments under FAS 133 . . . . . . . . . . . . . . . . . . 13.2 34.3
Total derivatives . . . . . . . . . . . . . . . . . . . . . . . . . . . . $378.7 $68.9
81

NIKE, INC.
NOTES TO CONSOLIDATED FINANCIAL STATEMENTS — (Continued)
The following tables present the amounts affecting the consolidated statement of income for year endedMay 31, 2009:
Amount of Gain(Loss)
Recognized inOther Comprehensive
Income onDerivatives(1)
Amount of Gain (Loss) ReclassifiedFrom Accumulated Other
Comprehensive Income into Income(1)
Derivatives designated under FAS 133Year Ended May 31,
2009
Location of Gain (Loss) ReclassifiedFrom Accumulated Other
Comprehensive IncomeInto Income(1)
Year Ended May 31,2009
(In millions)Derivatives designated as cash flow
hedges:Foreign exchange forwards and
options . . . . . . . . . . . . . . . . . . . $106.3 Revenue $ 92.7Foreign exchange forwards and
options . . . . . . . . . . . . . . . . . . . 350.1 Cost of sales (13.5)Foreign exchange forwards and
options . . . . . . . . . . . . . . . . . . .(0.4)
Selling andadministrativeexpense 0.8
Foreign exchange forwards andoptions . . . . . . . . . . . . . . . . . . . 165.1
Other income(expense) 67.8
Total designated cash flow hedges . . . $621.1 $147.8Derivatives designated as net
investment hedges:Foreign exchange forwards and
options . . . . . . . . . . . . . . . . . . . $161.4Other income(expense) $ —
(1) For the year ended May 31, 2009, the Company recorded in other (income) expense, net an immaterialamount of ineffectiveness from cash flow hedges.
Amount of Gain(Loss) recognized in
Income onDerivatives
Year Ended May 31,2009
Location of Gain (Loss) Recognizedin Income on Derivatives
(In millions)Derivatives designated as fair value hedges:
Interest rate swaps(1) . . . . . . . . . . . . . . . . . . . . . . . . . . . . $ 1.5 Interest income (expense)Derivatives not designated as hedging instruments under
FAS 133:Foreign exchange forwards and options . . . . . . . . . . . . . $(83.0) Other income (expense)
(1) Substantially all interest rate swap agreements meet the shortcut method requirements under FAS 133;accordingly, changes in the fair values of the interest rate swap agreements are exactly offset by changes inthe fair value of the underlying long-term debt. Refer to section “Fair Value Hedges” for additional detail.
Refer to Note 5 — Accrued Liabilities for derivative instruments recorded in accrued liabilities, Note 6 — FairValue Measurements for a description of how the above financial instruments are valued in accordance with FAS157, Note 14 — Accumulated Other Comprehensive Income and the Consolidated Statement of Shareholders’Equity for additional information on changes in other comprehensive income for the year ended May 31, 2009.
82

NIKE, INC.
NOTES TO CONSOLIDATED FINANCIAL STATEMENTS — (Continued)
Cash Flow Hedges
The purpose of the Company’s foreign currency hedging activities is to protect the Company from the riskthat the eventual cash flows resulting from transactions in foreign currencies, including revenues, product costs,selling and administrative expenses, investments in U.S. dollar-denominated available-for-sale debt securitiesand payments related to intercompany transactions, will be adversely affected by changes in exchange rates. It isthe Company’s policy to utilize derivatives to reduce foreign exchange risks where internal netting strategiescannot be effectively employed. Hedged transactions are denominated primarily in Euro, Japanese yen andBritish pound. The Company hedges up to 100% of anticipated exposures typically twelve to eighteen months inadvance, but has hedged as much as 34 months in advance.
All changes in fair values of outstanding cash flow hedge derivatives, except the ineffective portion, arerecorded in other comprehensive income, until net income is affected by the variability of cash flows of thehedged transaction. In most cases, amounts recorded in other comprehensive income will be released to netincome some time after the maturity of the related derivative. The consolidated statement of incomeclassification of effective hedge results is the same as that of the underlying exposure. Results of hedges ofrevenue and product costs are recorded in revenue and cost of sales, respectively, when the underlying hedgedtransaction affects net income. Results of hedges of selling and administrative expense are recorded together withthose costs when the related expense is recorded. Results of hedges of anticipated purchases and sales of U.S.dollar-denominated available-for-sale securities are recorded in other (income) expense, net when the securitiesare sold. Results of hedges of anticipated intercompany transactions are recorded in other (income) expense, netwhen the transaction occurs.
Premiums paid on options are initially recorded as deferred charges. The Company assesses theeffectiveness of options based on the total cash flows method and records total changes in the options’ fair valueto other comprehensive income to the degree they are effective.
As of May 31, 2009, $132.0 million of deferred net gains (net of tax) on both outstanding and maturedderivatives accumulated in other comprehensive income are expected to be reclassified to net income during thenext twelve months as a result of underlying hedged transactions also being recorded in net income. Actualamounts ultimately reclassified to net income are dependent on the exchange rates in effect when derivativecontracts that are currently outstanding mature. As of May 31, 2009, the maximum term over which theCompany is hedging exposures to the variability of cash flows for its forecasted and recorded transactions is 23months.
The Company formally assesses both at a hedge’s inception and on an ongoing basis, whether thederivatives that are used in the hedging transaction have been highly effective in offsetting changes in the cashflows of hedged items and whether those derivatives may be expected to remain highly effective in futureperiods. Effectiveness for cash flow hedges is assessed based on forward rates. When it is determined that aderivative is not, or has ceased to be, highly effective as a hedge, the Company discontinues hedge accountingprospectively.
The Company discontinues hedge accounting prospectively when (i) it determines the derivative is nolonger highly effective in offsetting changes in the cash flows of a hedged item (including hedged items such asfirm commitments or forecasted transactions); (ii) the derivative expires or is sold, terminated, or exercised;(iii) it is no longer probable that the forecasted transaction will occur; or (iv) management determines thatdesignating the derivative as a hedging instrument is no longer appropriate.
83

NIKE, INC.
NOTES TO CONSOLIDATED FINANCIAL STATEMENTS — (Continued)
When the Company discontinues hedge accounting because it is no longer probable that the forecastedtransaction will occur in the originally expected period, the gain or loss on the derivative remains in accumulatedother comprehensive income and is reclassified to net income when the forecasted transaction affects net income.However, if it is probable that a forecasted transaction will not occur by the end of the originally specified timeperiod or within an additional two-month period of time thereafter, the gains and losses that were accumulated inother comprehensive income will be recognized immediately in net income. In all situations in which hedgeaccounting is discontinued and the derivative remains outstanding, the Company will carry the derivative at itsfair value on the balance sheet, recognizing future changes in the fair value in other (income) expense, net. Forthe years ended May 31, 2009, 2008 and 2007, the Company recorded in other (income) expense an immaterialamount of ineffectiveness from cash flow hedges.
Fair Value Hedges
The Company is also exposed to the risk of changes in the fair value of certain fixed-rate debt attributable tochanges in interest rates. Derivatives currently used by the Company to hedge this risk are receive-fixed,pay-variable interest rate swaps. As of May 31, 2009, all interest rate swap agreements are designated as fairvalue hedges of the related long-term debt and meet the shortcut method requirements under FAS 133.Accordingly, changes in the fair values of the interest rate swap agreements are exactly offset by changes in thefair value of the underlying long-term debt. No ineffectiveness has been recorded to net income related to interestrate swaps designated as fair value hedges for the years ended May 31, 2009, 2008 and 2007.
In fiscal 2003, the Company entered into a receive-floating, pay-fixed interest rate swap agreement relatedto a Japanese yen denominated intercompany loan with one of the Company’s Japanese subsidiaries. This interestrate swap was not designated as a hedge under FAS 133. Accordingly, changes in the fair value of the swap wererecorded to net income each period through maturity as a component of interest (income) expense, net. Both theintercompany loan and the related interest rate swap matured during fiscal 2009.
Net Investment Hedges
The Company also hedges the risk of variability in foreign-currency-denominated net investments inwholly-owned international subsidiaries. All changes in fair value of the derivatives designated as net investmenthedges, except ineffective portions, are reported in the cumulative translation adjustment component of othercomprehensive income along with the foreign currency translation adjustments on those investments. TheCompany assesses hedge effectiveness based on changes in forward rates. The Company recorded noineffectiveness from its net investment hedges for the years ended May 31, 2009 and 2008.
Credit Risk
The Company is exposed to credit-related losses in the event of non-performance by counterparties tohedging instruments. This credit risk is limited to the unrealized gains in such instruments should any of thesecounterparties fail to perform as contracted. The counterparties to all derivative transactions are major financialinstitutions with investment grade credit ratings. However, this does not eliminate the Company’s exposure tocredit risk with these institutions. To manage this risk, the Company has established strict counterparty creditguidelines that are continually monitored and reported to senior management according to prescribed guidelines.The Company utilizes a portfolio of financial institutions either headquartered or operating in the same countriesthe Company conducts its business. As a result of the above considerations, the Company considers the risk ofcounterparty default to be immaterial.
84

NIKE, INC.
NOTES TO CONSOLIDATED FINANCIAL STATEMENTS — (Continued)
Certain of the Company’s derivative instruments contain credit risk related contingent features. As ofMay 31, 2009, the Company was in compliance with all such credit risk related contingent features. Theaggregate fair value of derivative instruments with credit risk related contingent features that are in a net liabilityposition at May 31, 2009 was $15.2 million. The Company was not required to post any collateral as a result ofthese contingent features.
Note 19 — Operating Segments and Related Information
Operating Segments. The Company’s operating segments are evidence of the structure of the Company’sinternal organization. The major segments are defined by geographic regions for operations participating inNIKE brand sales activity excluding NIKE Golf and NIKE Bauer Hockey. Each NIKE brand geographic segmentoperates predominantly in one industry: the design, production, marketing and selling of sports and fitnessfootwear, apparel, and equipment. The “Other” category shown below represents activities of Cole Haan,Converse, Exeter Brands Group (whose primary business was the Starter brand business which was sold onDecember 17, 2007), Hurley, NIKE Bauer Hockey (through April 16, 2008), NIKE Golf, and Umbro (beginningMarch 3, 2008) which are considered immaterial for individual disclosure based on the aggregation criteria inSFAS No. 131 “Disclosures about Segments of an Enterprise and Related Information.”
Net revenues as shown below represent sales to external customers for each segment. Intercompanyrevenues have been eliminated and are immaterial for separate disclosure. The Company evaluates performanceof individual operating segments based on pre-tax income. On a consolidated basis, this amount representsincome before income taxes as shown in the Consolidated Statements of Income. Reconciling items for pre-taxincome represent corporate expense items that are not allocated to the operating segments for managementreporting. Corporate expense consists of unallocated general and administrative expenses, which includesexpenses associated with centrally managed departments, depreciation and amortization related to theCompany’s corporate headquarters, unallocated insurance and benefit programs, foreign currency gains andlosses, including hedge gains and losses, corporate eliminations and other items.
Additions to long-lived assets as presented in the following table represent capital expenditures.
Accounts receivable, inventories and property, plant and equipment for operating segments are regularlyreviewed by management and are therefore provided below.
Certain prior year amounts have been reclassed to conform to fiscal 2009 presentation.
85
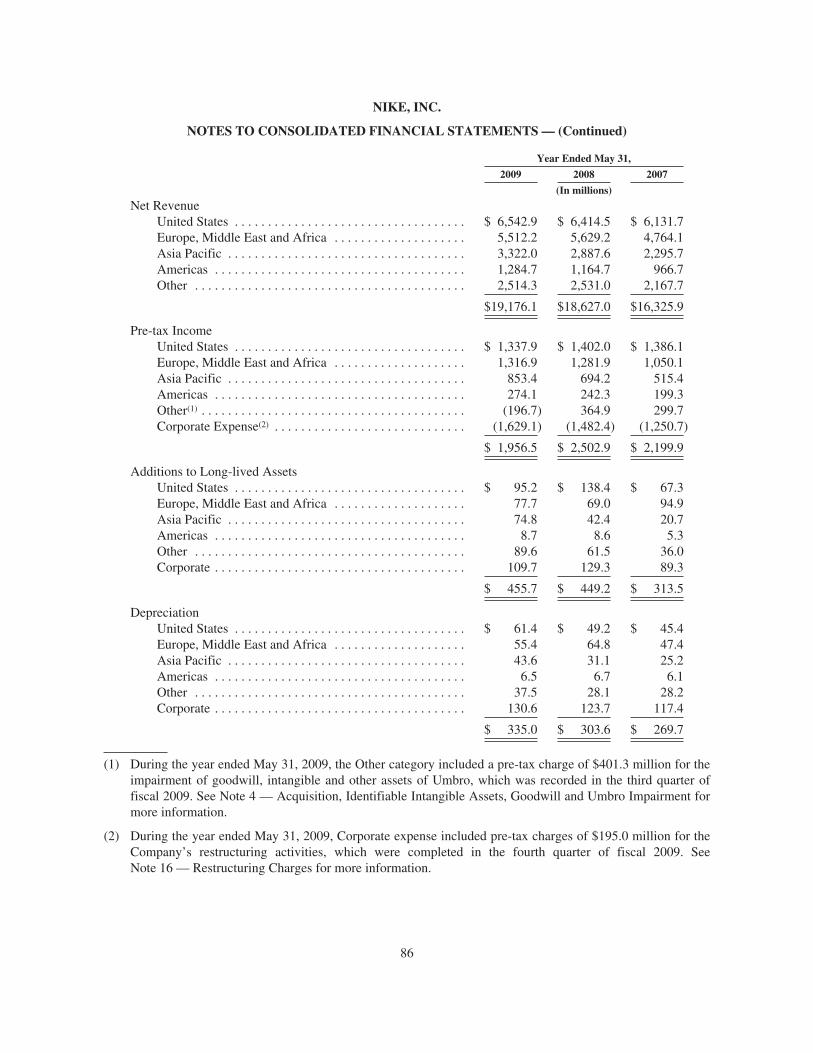
NIKE, INC.
NOTES TO CONSOLIDATED FINANCIAL STATEMENTS — (Continued)
Year Ended May 31,
2009 2008 2007
(In millions)
Net RevenueUnited States . . . . . . . . . . . . . . . . . . . . . . . . . . . . . . . . . . . $ 6,542.9 $ 6,414.5 $ 6,131.7Europe, Middle East and Africa . . . . . . . . . . . . . . . . . . . . 5,512.2 5,629.2 4,764.1Asia Pacific . . . . . . . . . . . . . . . . . . . . . . . . . . . . . . . . . . . . 3,322.0 2,887.6 2,295.7Americas . . . . . . . . . . . . . . . . . . . . . . . . . . . . . . . . . . . . . . 1,284.7 1,164.7 966.7Other . . . . . . . . . . . . . . . . . . . . . . . . . . . . . . . . . . . . . . . . . 2,514.3 2,531.0 2,167.7
$19,176.1 $18,627.0 $16,325.9
Pre-tax IncomeUnited States . . . . . . . . . . . . . . . . . . . . . . . . . . . . . . . . . . . $ 1,337.9 $ 1,402.0 $ 1,386.1Europe, Middle East and Africa . . . . . . . . . . . . . . . . . . . . 1,316.9 1,281.9 1,050.1Asia Pacific . . . . . . . . . . . . . . . . . . . . . . . . . . . . . . . . . . . . 853.4 694.2 515.4Americas . . . . . . . . . . . . . . . . . . . . . . . . . . . . . . . . . . . . . . 274.1 242.3 199.3Other(1) . . . . . . . . . . . . . . . . . . . . . . . . . . . . . . . . . . . . . . . . (196.7) 364.9 299.7Corporate Expense(2) . . . . . . . . . . . . . . . . . . . . . . . . . . . . . (1,629.1) (1,482.4) (1,250.7)
$ 1,956.5 $ 2,502.9 $ 2,199.9
Additions to Long-lived AssetsUnited States . . . . . . . . . . . . . . . . . . . . . . . . . . . . . . . . . . . $ 95.2 $ 138.4 $ 67.3Europe, Middle East and Africa . . . . . . . . . . . . . . . . . . . . 77.7 69.0 94.9Asia Pacific . . . . . . . . . . . . . . . . . . . . . . . . . . . . . . . . . . . . 74.8 42.4 20.7Americas . . . . . . . . . . . . . . . . . . . . . . . . . . . . . . . . . . . . . . 8.7 8.6 5.3Other . . . . . . . . . . . . . . . . . . . . . . . . . . . . . . . . . . . . . . . . . 89.6 61.5 36.0Corporate . . . . . . . . . . . . . . . . . . . . . . . . . . . . . . . . . . . . . . 109.7 129.3 89.3
$ 455.7 $ 449.2 $ 313.5
DepreciationUnited States . . . . . . . . . . . . . . . . . . . . . . . . . . . . . . . . . . . $ 61.4 $ 49.2 $ 45.4Europe, Middle East and Africa . . . . . . . . . . . . . . . . . . . . 55.4 64.8 47.4Asia Pacific . . . . . . . . . . . . . . . . . . . . . . . . . . . . . . . . . . . . 43.6 31.1 25.2Americas . . . . . . . . . . . . . . . . . . . . . . . . . . . . . . . . . . . . . . 6.5 6.7 6.1Other . . . . . . . . . . . . . . . . . . . . . . . . . . . . . . . . . . . . . . . . . 37.5 28.1 28.2Corporate . . . . . . . . . . . . . . . . . . . . . . . . . . . . . . . . . . . . . . 130.6 123.7 117.4
$ 335.0 $ 303.6 $ 269.7
(1) During the year ended May 31, 2009, the Other category included a pre-tax charge of $401.3 million for theimpairment of goodwill, intangible and other assets of Umbro, which was recorded in the third quarter offiscal 2009. See Note 4 — Acquisition, Identifiable Intangible Assets, Goodwill and Umbro Impairment formore information.
(2) During the year ended May 31, 2009, Corporate expense included pre-tax charges of $195.0 million for theCompany’s restructuring activities, which were completed in the fourth quarter of fiscal 2009. SeeNote 16 — Restructuring Charges for more information.
86

NIKE, INC.
NOTES TO CONSOLIDATED FINANCIAL STATEMENTS — (Continued)
Year Ended May 31,
2009 2008
(In millions)
Accounts Receivable, netUnited States . . . . . . . . . . . . . . . . . . . . . . . . . . . . . . . . . . . . . . . . . . . . . . . . $ 837.2 $ 823.9Europe, Middle East and Africa . . . . . . . . . . . . . . . . . . . . . . . . . . . . . . . . . 877.1 843.0Asia Pacific . . . . . . . . . . . . . . . . . . . . . . . . . . . . . . . . . . . . . . . . . . . . . . . . . 394.6 406.1Americas . . . . . . . . . . . . . . . . . . . . . . . . . . . . . . . . . . . . . . . . . . . . . . . . . . . 263.6 246.0Other . . . . . . . . . . . . . . . . . . . . . . . . . . . . . . . . . . . . . . . . . . . . . . . . . . . . . . 439.8 424.0Corporate . . . . . . . . . . . . . . . . . . . . . . . . . . . . . . . . . . . . . . . . . . . . . . . . . . . 71.6 52.3
$2,883.9 $2,795.3
InventoriesUnited States . . . . . . . . . . . . . . . . . . . . . . . . . . . . . . . . . . . . . . . . . . . . . . . . $ 831.8 $ 834.0Europe, Middle East and Africa . . . . . . . . . . . . . . . . . . . . . . . . . . . . . . . . . 619.7 705.7Asia Pacific . . . . . . . . . . . . . . . . . . . . . . . . . . . . . . . . . . . . . . . . . . . . . . . . . 295.8 280.9Americas . . . . . . . . . . . . . . . . . . . . . . . . . . . . . . . . . . . . . . . . . . . . . . . . . . . 205.5 181.1Other . . . . . . . . . . . . . . . . . . . . . . . . . . . . . . . . . . . . . . . . . . . . . . . . . . . . . . 371.8 396.6Corporate . . . . . . . . . . . . . . . . . . . . . . . . . . . . . . . . . . . . . . . . . . . . . . . . . . . 32.4 40.1
$2,357.0 $2,438.4
Property, Plant and Equipment, netUnited States . . . . . . . . . . . . . . . . . . . . . . . . . . . . . . . . . . . . . . . . . . . . . . . . $ 345.2 $ 318.4Europe, Middle East and Africa . . . . . . . . . . . . . . . . . . . . . . . . . . . . . . . . . 341.5 370.5Asia Pacific . . . . . . . . . . . . . . . . . . . . . . . . . . . . . . . . . . . . . . . . . . . . . . . . . 434.0 375.6Americas . . . . . . . . . . . . . . . . . . . . . . . . . . . . . . . . . . . . . . . . . . . . . . . . . . . 18.8 20.4Other . . . . . . . . . . . . . . . . . . . . . . . . . . . . . . . . . . . . . . . . . . . . . . . . . . . . . . 163.7 126.9Corporate . . . . . . . . . . . . . . . . . . . . . . . . . . . . . . . . . . . . . . . . . . . . . . . . . . . 654.5 679.3
$1,957.7 $1,891.1
Revenues by Major Product Lines. Revenues to external customers for NIKE brand products areattributable to sales of footwear, apparel and equipment. Other revenues to external customers primarily includeexternal sales by Cole Haan, Converse, Exeter (whose primary business was the Starter brand business whichwas sold December 17, 2007), Hurley, NIKE Bauer Hockey (through April 16, 2008), NIKE Golf, and Umbro(beginning March 3, 2008).
Year Ended May 31,
2009 2008 2007
(In millions)
Footwear . . . . . . . . . . . . . . . . . . . . . . . . . . . . . . . . . . . . . . . . . . $10,306.7 $ 9,731.6 $ 8,514.0Apparel . . . . . . . . . . . . . . . . . . . . . . . . . . . . . . . . . . . . . . . . . . . 5,244.7 5,234.0 4,576.5Equipment . . . . . . . . . . . . . . . . . . . . . . . . . . . . . . . . . . . . . . . . . 1,110.4 1,130.4 1,067.7Other . . . . . . . . . . . . . . . . . . . . . . . . . . . . . . . . . . . . . . . . . . . . . 2,514.3 2,531.0 2,167.7
$19,176.1 $18,627.0 $16,325.9
Revenues and Long-Lived Assets by Geographic Area. Geographical area information is similar to whatwas shown previously under operating segments with the exception of the Other activity, which has beenallocated to the geographical areas based on the location where the sales originated. Revenues derived in the
87

NIKE, INC.
NOTES TO CONSOLIDATED FINANCIAL STATEMENTS — (Continued)
United States were $8,019.8 million, $7,938.5 million, and $7,593.7 million, for the years ended May 31, 2009,2008, and 2007, respectively. The Company’s largest concentrations of long-lived assets primarily consist of theCompany’s world headquarters and distribution facilities in the United States and distribution facilities in Japanand Belgium. Long-lived assets attributable to operations in the United States, which are comprised of netproperty, plant & equipment, were $1,142.6 million, $1,109.9 million, and $991.3 million at May 31, 2009, 2008,and 2007, respectively. Long-lived assets attributable to operations in Japan were $322.3 million, $303.8 million,and $260.6 million at May 31, 2009, 2008, and 2007, respectively. Long-lived assets attributable to operations inBelgium were $191.0 million, $219.1 million and $198.3 million at May 31, 2009, 2008, and 2007, respectively.
Major Customers. Revenues derived from Foot Locker, Inc. represented 9% of the Company’sconsolidated revenues for the years ended May 31, 2009 and 2008, and 10% for the year ended May 31, 2007.Sales to this customer are included in all segments of the Company.
Item 9. Changes In and Disagreements with Accountants on Accounting and Financial Disclosure
There has been no change of accountants nor any disagreements with accountants on any matter ofaccounting principles or practices or financial statement disclosure required to be reported under this Item.
Item 9A. Controls and Procedures
We maintain disclosure controls and procedures that are designed to ensure that information required to bedisclosed in our Exchange Act reports is recorded, processed, summarized and reported within the time periodsspecified in the Securities and Exchange Commission’s rules and forms and that such information is accumulatedand communicated to our management, including our Chief Executive Officer and Chief Financial Officer, asappropriate, to allow for timely decisions regarding required disclosure. In designing and evaluating thedisclosure controls and procedures, management recognizes that any controls and procedures, no matter how welldesigned and operated, can provide only reasonable assurance of achieving the desired control objectives, andmanagement is required to apply its judgment in evaluating the cost-benefit relationship of possible controls andprocedures.
We carry out a variety of on-going procedures, under the supervision and with the participation of ourmanagement, including our Chief Executive Officer and Chief Financial Officer, to evaluate the effectiveness ofthe design and operation of our disclosure controls and procedures. Based on the foregoing, our Chief ExecutiveOfficer and Chief Financial Officer concluded that our disclosure controls and procedures were effective at thereasonable assurance level as of May 31, 2009.
“Management’s Annual Report on Internal Control Over Financial Reporting” is included in Item 8 on page51 of this Report.
There has been no change in our internal control over financial reporting during our most recent fiscalquarter that has materially affected, or is reasonable likely to materially affect, our internal control over financialreporting.
Item 9B. Other Information
No disclosure is required under this Item.
88

PART III
Item 10. Directors, Executive Officers and Corporate Governance
The information required by Item 401 of Regulation S-K regarding directors is included under “Election ofDirectors” in the definitive Proxy Statement for our 2009 Annual Meeting of Shareholders and is incorporatedherein by reference. The information required by Item 401 of Regulation S-K regarding executive officers isincluded under “Executive Officers of the Registrant” in Item 1 of this Report. The information required byItem 405 of Regulation S-K is included under “Section 16(a) Beneficial Ownership Reporting Compliance” inthe definitive Proxy Statement for our 2009 Annual Meeting of Shareholders and is incorporated herein byreference. The information required by Item 406 of Regulation S-K is included under “Code of Business Conductand Ethics” in the definitive Proxy Statement for our 2009 Annual Meeting of Shareholders and is incorporatedherein by reference. The information required by Items 407(d)(4) and (d)(5) of Regulation S-K regarding theAudit Committee of the Board of Directors is included under “Board of Directors and Committees” in thedefinitive Proxy Statement for our 2009 Annual Meeting of Shareholders and is incorporated herein by reference.
Item 11. Executive Compensation
The information required by Items 402, 407(e)(4) and 407(e)(5) of Regulation S-K regarding executivecompensation is included under “Director Compensation for Fiscal 2009,” “Executive Compensation,”“Compensation Discussion and Analysis,” “Compensation Committee Interlocks and Insider Participation” and“Compensation Committee Report” in the definitive Proxy Statement for our 2009 Annual Meeting ofShareholders and is incorporated herein by reference.
Item 12. Security Ownership of Certain Beneficial Owners and Management and Related StockholderMatters
The information required by Item 201(d) of Regulation S-K is included under “Equity Compensation Plans”in the definitive Proxy Statement for our 2009 Annual Meeting of Shareholders and is incorporated herein byreference. The information required by Item 403 of Regulation S-K is included under “Stock Holdings of CertainOwners and Management” in the definitive Proxy Statement for our 2009 Annual Meeting of Shareholders and isincorporated herein by reference.
Item 13. Certain Relationships and Related Transactions, and Director Independence
The information required by Items 404 and 407(a) of Regulation S-K is included under “Transactions withRelated Persons” and “Board of Directors and Committees” in the definitive Proxy Statement for our 2009Annual Meeting of Shareholders and is incorporated herein by reference.
Item 14. Principal Accountant Fees and Services
The information required by Item 9(e) of Schedule 14A is included under “Ratification Of IndependentRegistered Public Accounting Firm” in the definitive Proxy Statement for our 2009 Annual Meeting ofShareholders and is incorporated herein by reference.
89

PART IV
Item 15. Exhibits and Financial Statement Schedules
(a) The following documents are filed as part of this report:
Form 10-KPage No.
1. FINANCIAL STATEMENTS:
Report of Independent Registered Public Accounting Firm . . . . . . . . . . . . . . . . . . . . . 52
Consolidated Statements of Income for each of the three years ended May 31, 2009,May 31, 2008 and May 31, 2007 . . . . . . . . . . . . . . . . . . . . . . . . . . . . . . . . . . . . . . . . . 53
Consolidated Balance Sheets at May 31, 2009 and May 31, 2008 . . . . . . . . . . . . . . . . 54
Consolidated Statements of Cash Flows for each of the three years ended May 31,2009, May 31, 2008 and May 31, 2007 . . . . . . . . . . . . . . . . . . . . . . . . . . . . . . . . . . . . 55
Consolidated Statements of Shareholders’ Equity for each of the three years endedMay 31, 2009, May 31, 2008 and May 31, 2007 . . . . . . . . . . . . . . . . . . . . . . . . . . . . . 56
Notes to Consolidated Financial Statements . . . . . . . . . . . . . . . . . . . . . . . . . . . . . . . . . 57
2. FINANCIAL STATEMENT SCHEDULE:
II — Valuation and Qualifying Accounts . . . . . . . . . . . . . . . . . . . . . . . . . . . . . . . . . . F-1
All other schedules are omitted because they are not applicable or the required information is shown in thefinancial statements or notes thereto.
3. EXHIBITS:
2.1 Implementation Agreement, dated October 23, 2007, between Umbro Plc, NIKE Vapor Ltd., and NIKE,Inc. (incorporated by reference to Exhibit 2.1 to the Company’s Current Report on Form 8-K filedOctober 25, 2007).*
3.1 Restated Articles of Incorporation, as amended (incorporated by reference to Exhibit 3.1 to theCompany’s Quarterly Report on Form 10-Q for the fiscal quarter ended August 31, 2005).
3.2 Third Restated Bylaws, as amended (incorporated by reference to Exhibit 3.2 to the Company’s CurrentReport on Form 8-K filed February 20, 2007).
4.1 Restated Articles of Incorporation, as amended (see Exhibit 3.1).
4.2 Third Restated Bylaws, as amended (see Exhibit 3.2).
4.3 Indenture dated as of December 13, 1996 between the Company and Bank One Trust Company,National Association (successor in interest to The First National Bank of Chicago), as Trustee(incorporated by reference to Exhibit 4.01 to Amendment No. 1 to Registration Statement No. 333-15953 filed by the Company on November 26, 1996).
4.4 Form of Officers’ Certificate relating to the Company’s Fixed Rate Medium-Term Notes and theCompany’s Floating Rate Medium-Term Notes, form of Fixed Rate Note and form of Floating RateNote (incorporated by reference to Exhibits 4.2, 4.3 and 4.4 of the Company’s Current Report onForm 8-K filed May 29, 2002).
90
4.5 Credit Agreement dated as of December 1, 2006 among NIKE, Inc., Bank of America, N.A.,individually and as Agent, and the other banks party thereto (incorporated by reference to Exhibit 4.01to the Company’s Current Report on Form 8-K filed December 6, 2006).
4.6 First Amendment to the Credit Agreement, dated August 24, 2007, among NIKE, Inc., Bank ofAmerica, N.A., as Administrative Agent, Citicorp USA, Inc., as Syndication Agent, and HSBC BankUSA, N.A., The Bank of Tokyo Mitsubishi UFG, Ltd. and Deutsche Bank Securities Inc., as Co-Documentation Agents, and the other Banks named therein (incorporated by reference to Exhibit 10.1to the Company’s Quarterly Report on Form 10-Q for the fiscal quarter ended February 29, 2008).
4.7 Extension and Second Amendment to the Credit Agreement, dated November 1, 2007, among NIKE,Inc., Bank of America, N.A., as Administrative Agent, Citicorp USA, Inc., as Syndication Agent, andHSBC Bank USA, N.A., The Bank of Tokyo Mitsubishi UFG, Ltd. and Deutsche Bank Securities Inc.,as Co-Documentation Agents, and the other Banks named therein. (incorporated by reference toExhibit 10.2 to the Company’s Quarterly Report on Form 10-Q for the fiscal quarter endedFebruary 29, 2008).
10.1 Form of Non-Statutory Stock Option Agreement for options granted to executives under the 1990Stock Incentive Plan (applicable to option grants on or after July 17, 2009).*
10.2 Form of Non-Statutory Stock Option Agreement for options granted to non-U.S. executives under the1990 Stock Incentive Plan (applicable to option grants on or after July 17, 2009).*
10.3 Form of Indemnity Agreement entered into between the Company and each of its officers anddirectors (incorporated by reference to Exhibit 10.2 to the Company’s Annual Report on Form 10-Kfor the fiscal year ended May 31, 2008).*
10.4 NIKE, Inc. 1990 Stock Incentive Plan (incorporated by reference to Exhibit 10.3 to the Company’sAnnual Report on Form 10-K for the fiscal year ended May 31, 2007).*
10.5 NIKE, Inc. Executive Performance Sharing Plan (incorporated by reference to Exhibit 10.4 to theCompany’s Annual Report on Form 10-K for the fiscal year ended May 31, 2007).*
10.6 NIKE, Inc. Long-Term Incentive Plan (incorporated by reference to Exhibit 10.5 to the Company’sAnnual Report on Form 10-K for the fiscal year ended May 31, 2008).*
10.7 NIKE, Inc. Deferred Compensation Plan (Amended and Restated effective January 1, 2009).*
10.8 NIKE, Inc. Deferred Compensation Plan (Amended and Restated effective June 1, 2004) (applicable toamounts deferred before January 1, 2005) (incorporated by reference to Exhibit 10.6 to the Company’sAnnual Report on Form 10-K for the fiscal year ended May 31, 2004).
10.9 Amendment No. 1 effective January 1, 2008 to the NIKE, Inc. Deferred Compensation Plan (June 1,2004 Restatement).*
10.10 NIKE, Inc. Foreign Subsidiary Employee Stock Purchase Plan (incorporated by reference toExhibit 10.1 to the Company’s Quarterly Report on Form 10-Q for the fiscal quarter ended November30, 2008).*
10.11 Amended and Restated Covenant Not To Compete And Non-Disclosure Agreement between NIKE,Inc. and Mark G. Parker dated July 24, 2008 (incorporated by reference to Exhibit 10.1 to theCompany’s Current Report on Form 8-K filed July 24, 2008).*
10.12 Amended and Restated Covenant Not to Compete and Non-Disclosure Agreement between NIKE, Inc.and Charles D. Denson dated July 24, 2008 (incorporated by reference to Exhibit 10.2 to theCompany’s Current Report on Form 8-K filed July 24, 2008).*
91

10.13 Form of Long-Term Incentive Award Agreement under the Long-Term Incentive Plan (incorporatedby reference to Exhibit 10.1 to the Company’s Current Report on Form 8-K filed February 20, 2007).*
10.14 Form of Restricted Stock Bonus Agreement under the 1990 Stock Incentive Plan (incorporated byreference to Exhibit 10.2 to the Company’s Current Report on Form 8-K filed June 21, 2005).*
10.15 Commercial Paper Agreement between NIKE, Inc., as Issuer, and Goldman, Sachs & Co., as Dealer(incorporated by reference to Exhibit 10.3 to the Company’s Quarterly Report on Form 10-Q for thefiscal quarter ended February 28, 2007).
10.16 Commercial Paper Agreement between NIKE, Inc., as Issuer, and Merrill Lynch Money Markets Inc.and Merrill Lynch, Pierce, Fenner & Smith Incorporated, as Dealer (incorporated by reference toExhibit 10.4 to the Company’s Quarterly Report on Form 10-Q for the fiscal quarter ended February28, 2007).
10.17 Commercial Paper Agreement between NIKE, Inc., as Issuer, and Wells Fargo Brokerage Services,LLC, as Dealer (incorporated by reference to Exhibit 10.5 to the Company’s Quarterly Report onForm 10-Q for the fiscal quarter ended February 28, 2007).
10.18 Covenant Not to Compete and Non-Disclosure Agreement between NIKE, Inc. and Donald W. Blairdated November 10, 1999 (incorporated by reference to Exhibit 10.15 to the Company’s AnnualReport on Form 10-K for the fiscal year ended May 31, 2006).*
10.19 Covenant Not to Compete and Non-Disclosure Agreement between NIKE, Inc. and Gary DeStefano(incorporated by reference to Exhibit 10.1 to the Company’s Current Report on Form 8-K filedAugust 11, 2006).*
10.20 Covenant Not to Compete and Non-Disclosure Agreement between NIKE, Inc. and Trevor A.Edwards dated November 14, 2002. (incorporated by reference to Exhibit 10.19 to the Company’sAnnual Report on Form 10-K for the fiscal year ended May 31, 2008).*
12.1 Computation of Ratio of Earnings to Fixed Charges.
21 Subsidiaries of the Registrant.
23 Consent of PricewaterhouseCoopers LLP, Independent Registered Public Accounting Firm (set forthon page F-2 of this Annual Report on Form 10-K).
31.1 Rule 13a-14(a)/15d-14(a) Certification of Chief Executive Officer.
31.2 Rule 13a-14(a)/15d-14(a) Certification of Chief Financial Officer.
32 Section 1350 Certifications.
* Management contract or compensatory plan or arrangement.
The exhibits filed herewith do not include certain instruments with respect to long-term debt of NIKE andits subsidiaries, inasmuch as the total amount of debt authorized under any such instrument does not exceed 10percent of the total assets of NIKE and its subsidiaries on a consolidated basis. NIKE agrees, pursuant toItem 601(b)(4)(iii) of Regulation S-K, that it will furnish a copy of any such instrument to the SEC upon request.
Upon written request to Investor Relations, NIKE, Inc., One Bowerman Drive, Beaverton, Oregon 97005-6453, NIKE will furnish shareholders with a copy of any Exhibit upon payment of $.10 per page, whichrepresents our reasonable expenses in furnishing Exhibits.
92

SCHEDULE II
VALUATION AND QUALIFYING ACCOUNTS
Balance atBeginningof Period
Charged toCosts andExpenses
Charged toOther
Accounts
Write-OffsNet of
Recoveries
Balance atEnd ofPeriod
(In millions)
Allowance for doubtful accounts (current andnon-current)(1)
For the year ended May 31, 2007 . . . . . . . . . . . . . . . $67.6 $18.5 $ 1.8 $(16.2) $ 71.7For the year ended May 31, 2008 . . . . . . . . . . . . . . . 71.7 25.7 4.0 (23.0) 78.4For the year ended May 31, 2009 . . . . . . . . . . . . . . . 78.4 62.4 (11.7) (18.3) 110.8
(1) The non-current portion of the allowance for doubtful accounts is classified in deferred income taxes andother assets on the consolidated balance sheet.
F-1

CONSENT OF INDEPENDENT REGISTERED PUBLIC ACCOUNTING FIRM
We hereby consent to the incorporation by reference in the Registration Statements on Form S-3(No. 333-156406) and Form S-8 (Nos. 033-63995, 333-63581, 333-63583, 333-68864, 333-68886, 333-71660,333-104822, 333-117059, and 333-133360) of NIKE, Inc. of our report dated July 27, 2009 relating to thefinancial statements, financial statement schedule and the effectiveness of internal control over financialreporting, which appears in this Form 10-K.
/s/ PRICEWATERHOUSECOOPERS LLP
Portland, OregonJuly 27, 2009
F-2

SIGNATURES
Pursuant to the requirements of Section 13 or 15(d) of the Securities Exchange Act of 1934, the registranthas duly caused this report to be signed on its behalf by the undersigned, thereunto duly authorized.
NIKE, INC.
By: /s/ MARK G. PARKER
Mark G. ParkerChief Executive Officer and President
Date: July 27, 2009
Pursuant to the requirements of the Securities Exchange Act of 1934, as amended, this report has beensigned below by the following persons on behalf of the registrant and in the capacities and on the dates indicated.
Signature Title Date
Principal Executive Officer and Director:
/s/ MARK G. PARKER
Mark G. Parker
Director, Chief Executive Officer andPresident
July 27, 2009
Principal Financial Officer:
/s/ DONALD W. BLAIR
Donald W. Blair
Chief Financial Officer July 27, 2009
Principal Accounting Officer:
/s/ BERNARD F. PLISKA
Bernard F. Pliska
Corporate Controller July 27, 2009
Directors:
/s/ PHILIP H. KNIGHT
Philip H. Knight
Director, Chairman of the Board July 27, 2009
/s/ JOHN G. CONNORS
John G. Connors
Director July 27, 2009
/s/ JILL K. CONWAY
Jill K. Conway
Director July 27, 2009
/s/ TIMOTHY D. COOK
Timothy D. Cook
Director July 27, 2009
/s/ RALPH D. DENUNZIO
Ralph D. DeNunzio
Director July 27, 2009
S-1

Signature Title Date
/s/ ALAN B. GRAF, JR.
Alan B. Graf, Jr.
Director July 27, 2009
/s/ DOUGLAS G. HOUSER
Douglas G. Houser
Director July 27, 2009
/s/ JOHN C. LECHLEITER
John C. Lechleiter
Director July 27, 2009
/s/ JOHNATHAN A. RODGERS
Johnathan A. Rodgers
Director July 27, 2009
/s/ ORIN C. SMITH
Orin C. Smith
Director July 27, 2009
/s/ JOHN R. THOMPSON, JR.
John R. Thompson, Jr.
Director July 27, 2009
S-2

EXHIBIT 12.1
NIKE, INC. COMPUTATION OF RATIO OF EARNINGS TO FIXED CHARGES
Year Ended May 31,
2009 2008 2007 2006 2005
(In millions)
Net income . . . . . . . . . . . . . . . . . . . . . . . . . . . . . . . . . . . . $1,486.7 $1,883.4 $1,491.5 $1,392.0 $1,211.6Income taxes . . . . . . . . . . . . . . . . . . . . . . . . . . . . . . . . . . . 469.8 619.5 708.4 749.6 648.2
Income before income taxes . . . . . . . . . . . . . . . . . . . . . . . 1,956.5 2,502.9 2,199.9 2,141.6 1,859.8
Add fixed chargesInterest expense(1) . . . . . . . . . . . . . . . . . . . . . . . . . . . 40.3 40.7 49.7 50.5 39.7Interest component of leases(2) . . . . . . . . . . . . . . . . . 39.7 34.4 28.5 25.2 23.3
Total fixed charges . . . . . . . . . . . . . . . . . . . . . . 80.0 75.1 78.2 75.7 63.0
Earnings before income taxes and fixed charges(3) . . . . . . $2,036.5 $2,578.0 $2,278.1 $2,217.3 $1,922.8
Ratio of earnings to total fixed charges . . . . . . . . . . . . . . . 25.5 34.3 29.1 29.3 30.5
(1) Interest expense includes interest both expensed and capitalized.
(2) Interest component of leases includes one-tenth of rental expense which approximates the interestcomponent of operating leases.
(3) Earnings before income taxes and fixed charges is exclusive of capitalized interest.

EXHIBIT 21
SUBSIDIARIES OF THE REGISTRANT
Entity Name Jurisdiction of Formation
American NIKE S.L. SpainBragano Trading S.r.l. ItalyBRS NIKE Taiwan, Inc. TaiwanCole Haan MaineCole Haan Company Store MaineCole Haan Hong Kong Limited Hong KongCole Haan Japan JapanConverse (Asia Pacific) Limited Hong KongConverse Canada Corp. CanadaConverse Canada Holding B.V. NetherlandsConverse Footwear Technical Service (Zhongshan) Co., Ltd. People’s Republic of ChinaConverse Hong Kong Holding Company Limited Hong KongConverse Hong Kong Limited Hong KongConverse Inc. DelawareConverse Netherlands B.V. NetherlandsConverse Sporting Goods (China) Co., Ltd. People’s Republic of ChinaConverse Trading Company B.V. NetherlandsExeter Brands Group LLC OregonExeter Hong Kong Limited Hong KongFutbol Club Barcelona, S.L. SpainHurley 999, S.L. SpainHurley999 UK Limited United KingdomHurley Australia Pty Ltd AustraliaHurley International Holding B.V. NetherlandsHurley International LLC OregonJuventus Merchandising S.r.l. ItalyManchester United Merchandising Limited United KingdomNIKE 360 Holding B.V. NetherlandsNIKE Africa Ltd. BermudaNIKE Argentina Srl ArgentinaNIKE Asia Holding B.V. NetherlandsNIKE Australia Holding B.V. NetherlandsNIKE Australia Pty. Ltd. AustraliaNIKE BH B.V. NetherlandsNIKE CA LLC DelawareNIKE Canada Corp. CanadaNIKE Canada Holding B.V. NetherlandsNIKE Chile B.V. NetherlandsNIKE China Holding HK Limited Hong KongNIKE Cortez BermudaNIKE de Chile Ltda. ChileNIKE de Mexico S de R.L. de C.V. MexicoNIKE Denmark ApS DenmarkNIKE Deutschland GmbH GermanyNIKE do Brasil Comercio e Participacoes Ltda. BrazilNIKE Dunk Holding B.V. NetherlandsNIKE Europe Holding B.V. NetherlandsNIKE European Operations Netherlands B.V. NetherlandsNIKE Finance Ltd. Bermuda

SUBSIDIARIES OF THE REGISTRANT—(Continued)
Entity Name Jurisdiction of Formation
NIKE Finland OY FinlandNIKE Flight BermudaNIKE France S.A.S. FranceNIKE Galaxy Holding B.V. NetherlandsNIKE Global Holding B.V. NetherlandsNIKE Global Services PTE. LTD. SingaporeNIKE Global Trading PTE. LTD. SingaporeNIKE GmbH. AustriaNIKE Group Holding B.V. NetherlandsNIKE Hellas EPE GreeceNIKE Holding, LLC DelawareNIKE Hong Kong Limited Hong KongNIKE Huarache BermudaNIKE IHM, Inc. MissouriNIKE India Holding B.V. NetherlandsNIKE India Private Limited IndiaNIKE International Holding B.V. NetherlandsNIKE International Holding, Inc. DelawareNIKE International LLC DelawareNIKE International Ltd. BermudaNIKE Israel Ltd. IsraelNIKE Italy S.R.L. ItalyNIKE Japan Corp. JapanNIKE Jump Ltd. BermudaNIKE Laser Holding B.V. NetherlandsNIKE Lavadome BermudaNIKE Licenciamentos do Brasil, Ltda. BrazilNIKE Logistics Yugen Kaisha JapanNIKE Max LLC DelawareNIKE Mexico Holdings, LLC DelawareNIKE New Zealand Company New ZealandNIKE NZ Holding B.V. NetherlandsNIKE Offshore Holding B.V. NetherlandsNIKE Pegasus BermudaNIKE Philippines, Inc. PhilippinesNIKE Poland Sp.zo.o PolandNIKE Retail B.V. NetherlandsNIKE Retail LLC RussiaNIKE Retail Poland sp. z o. o. PolandNIKE Retail Services, Inc. OregonNIKE Russia LLC RussiaNIKE SALES (MALAYSIA) SDN. BHD. MalaysiaNIKE Servicios de Mexico S. de R.L. de C.V. MexicoNIKE SINGAPORE PTE LTD SingaporeNIKE Sourcing India Private Limited IndiaNIKE South Africa (Proprietary) Limited South AfricaNIKE South Africa Holdings LLC DelawareNIKE Sports (China) Company, Ltd. People’s Republic of ChinaNIKE Sports Korea Co., Ltd. South KoreaNIKE Suzhou Holding HK Limited Hong KongNIKE (Suzhou) Sports Company, Ltd. People’s Republic of China

SUBSIDIARIES OF THE REGISTRANT—(Continued)
Entity Name Jurisdiction of Formation
NIKE Sweden AB SwedenNIKE (Switzerland) GmbH SwitzerlandNIKE Tailwind BermudaNIKE (Thailand) Limited ThailandNIKE TN, Inc. OregonNIKE Trading Company B.V. NetherlandsNIKE UK Holding B.V. NetherlandsNIKE (UK) Limited United KingdomNIKE USA, Inc. OregonNIKE Vapor Ltd. United KingdomNIKE Vietnam Limited Liability Company VietnamNIKE Vision, Timing and Techlab, LP TexasNIKE Waffle BermudaNIKE Zoom LLC DelawarePMG International Limited United KingdomPT Hurley Indonesia IndonesiaPT NIKE Indonesia IndonesiaSavier, Inc. OregonTriax Insurance, Inc. HawaiiTwin Dragons Global Limited Hong KongTwin Dragons Holding B.V. NetherlandsUmbro Asia Sourcing Limited Hong KongUmbro Corp. DelawareUmbro Finance Limited United KingdomUmbro HK Limited Hong KongUmbro International Holdings Limited United KingdomUmbro International JV DelawareUmbro International Limited United KingdomUmbro JV Limited United KingdomUmbro Licensing Limited United KingdomUmbro Ltd. United KingdomUmbro Schweiz Limited United KingdomUmbro Sportwear Limited United KingdomUmbro Worldwide Limited United KingdomUmbro.com United KingdomUSISL, Inc. DelawareYugen Kaisha Hurley Japan Japan

DIRECTORS CORPORATE OFFICERSJohn G. Connors(2)(3)
Partner — Ignition Partners LLCBellevue, Washington
Jill K. Conway(5)(6)
Visiting ScholarMassachusetts Institute of TechnologyBoston, Massachusetts
Timothy D. Cook(4)
Chief Operating OfficerApple Inc.Cupertino, California
Ralph D. DeNunzio(3)(4)(6)
President, Harbor Point Associates, Inc.,private investment and consulting firmRye Brook, New York
Alan B. Graf, Jr.(2)
Executive Vice President & CFO,FedEx CorporationMemphis, Tennessee
Douglas G. Houser(1)(5)(6)
Partner — Bullivant, Houser, Bailey, P.C., AttorneysPortland, Oregon
John C. Lechleiter(4)(5)
President & Chief Executive OfficerEli Lilly and CompanyIndianapolis, Indiana
Philip H. Knight(1)
Chairman of the Board,NIKE, Inc.Beaverton, Oregon
Mark G. Parker(1)
Chief Executive Officer & President,NIKE, Inc.Beaverton, Oregon
Johnathan A. Rodgers(5)
President & CEO,TV One, LLCSilver Springs, Maryland
Orin C. Smith(2)(3)
Chief Executive Officer (Retired)Starbucks CorporationSeattle, Washington
John R. Thompson, Jr.(5)
Former Head Basketball CoachGeorgetown UniversityWashington, D.C.
Philip H. KnightChairman of the Board of Directors
Mark G. ParkerPresident & Chief Executive Officer
David J. AyreVice President, Global Human Resources
Donald W. BlairVice President & Chief Financial Officer
Alexander W. BodeckerVice President, NIKE Global Design & Action Sports
Craig R. CheekVice President, North America
Thomas E. ClarkePresident, New Business Development
Charles D. DensonPresident, NIKE Brand
Gary M. DeStefanoPresident, Global Operations
Trevor A. EdwardsVice President, Global Brand & Category Management
Joaquin D. HidalgoVice President, Brand Marketing
Elliott J. HillVice President, Global Retail
Jeanne P. JacksonPresident, Direct to Consumer
Hannah C. JonesVice President, Sustainable Business & Government Affairs
P. Eunan McLaughlinPresident, Affiliates
Jan E. SingerVice President, Global Footwear
John F. SlusherVice President, Global Sports Marketing
Eric D. SprunkVice President, Merchandising & Product
Jill StantonVice President, Global Apparel
Hans van AlebeekVice President, Global Operations & Technology
Roger S. WyettVice President & Chief Executive Officer, Hurley International
Robert W. WoodruffVice President & Treasurer
John F. Coburn IIISecretary
Peter H. KoehlerAssistant Secretary
(1) Member — Executive Committee
(2) Member — Audit Committee
(3) Member — Finance Committee
(4) Member — Compensation Committee
(5) Member — Corporate Responsibility Committee
(6) Member — Nominating and Corporate Governance Committee

DIVISIONAL VICE PRESIDENTS
James AllakerVice President & GeneralManager,UK & IrelandDoxford, United Kingdom
Kris D. AmanVice President, Global CategoryAthletic TrainingBeaverton, Oregon
Thomas D. ArndorferVice President & Chief FinancialOfficer,NIKE BrandBeaverton, Oregon
Nicholas C. AthanasokosVice President, GlobalSourcing &ManufacturingBeaverton, Oregon
Jack A. BoysVice President & Chief ExecutiveOfficer,Converse Inc.North Andover, Massachusetts
Michael D. BrewerVice President, North AmericaSupplyChain OpsBeaverton, Oregon
Martin BrokVice President, Western EuropeRetailHilversum, The Netherlands
Andrew CampionVice President, GlobalPlanning & DevelopmentBeaverton, Oregon
Oscar E. CardonaVice President, Global HumanResources,Infrastructure & Shared ServicesBeaverton, Oregon
Pamela M. CatlettVice President, Investor RelationsBeaverton, Oregon
Simon ClarkVice President, Western EuropeSalesHilversum, The Netherlands
Dermott V. ClearyVice President, Global CategoryNSWBeaverton, Oregon
Steve ConroyVice President, Brand HumanResourcesBeaverton, Oregon
Matthew CookPresident & Chief ExecutiveOfficer of Umbro Ltd.Cheshire, United Kingdom
Andrea CorreaniVice President, FootwearSportswearBeaverton, Oregon
Diana J. CristVice President, Apparel ProductCreationBeaverton, Oregon
Cynthia L. DavisVice President, President NIKEGolfBeaverton, Oregon
Shelley K. DeweyVice President, Category ProjectLeaderBeaverton, Oregon
Kenneth E. Dice IIIVice President, Marketing NorthAmericaBeaverton, Oregon
Maria S. EitelPresident, NIKE FoundationBeaverton, Oregon
James T. GodboutVice President & GeneralManager,NIKE JapanShinagawa, Tokyo
Davide GrassoVice President, Global CategoryMarketing, FootballBeaverton, Oregon
Ralph E. Greene, Jr.Vice President, North AmericaNSWBeaverton, Oregon
Willem H. HaitinkVice President & GeneralManager,Greater ChinaShanghai, China
Clare HamillVice President, CommerceAffiliatesBeaverton, Oregon
Tinker L. HatfieldVice President, Creative DesignBeaverton, Oregon
Timothy J. HersheyVice President, North AmericaRetailBeaverton, Oregon
Gregory J. HoffmanVice President, Global BrandCreativeBeaverton, Oregon
John R. Hoke IIIVice President, Global FootwearConverse Inc.North Andover, Massachusetts
Keith J. HoulemardPresident, Brand JordanBeaverton, Oregon
Hubertus HoytVice President, CategoryFootballBeaverton, Oregon
Peter A. HudsonVice President, Footwear DesignBeaverton, Oregon
Robert M. HurleyChairman, Hurley InternationalLLCCosta Mesa, California
Daniel W. JonesVice President, North AmericaBasketballBeaverton, Oregon
Leslie C. LaneVice President, Global CategoryRunningBeaverton, Oregon
Christopher J. LindgrenVice President, SportPerformance FootwearBeaverton, Oregon
Jayme V. MartinVice President & GeneralManager, Emerging MarketsBeaverton, Oregon
Monique S. MathesonVice President, North AmericaHRBeaverton, Oregon
Joseph P. MonahanVice President, North AmericaSalesBeaverton, Oregon
Heidi L. O’NeillVice President, Global CategoryWomen’s TrainingBeaverton, Oregon
Roland H.M. PaanakkerVice President, Lean BusinessSolutionsBeaverton, Oregon
Bernard F. PliskaVice President, CorporateControllerBeaverton, Oregon
Nigel A. PowellVice President, CorporateCommunicationsBeaverton, Oregon
Fiona ReekieVice President, Western EuropeMerchandisingHilversum, The Netherlands
Mark T. RileyVice President, North AmericaAthletic TrainingBeaverton, Oregon
Gerry G. RogersVice President, Logistics &Geographic OperationsHilversum, The Netherlands
Ernie A. RoseVice President, Manufacturing& SourcingBeaverton, Oregon
Brent J. ScrimshawVice President, GeneralManager WesternEuropeHilversum, The Netherlands
Joseph F. SerinoVice President, North AmericaMerchandisingBeaverton, Oregon
James C. SeussVice President, Chief ExecutiveOfficerCole HaanYarmouth, Maine
Chris L. ShimojimaVice President, E-CommerceBeaverton, Oregon
Dirk-Jean van HamerenVice President, Western EuropeMarketing
Marc van PappelendamVice President & GeneralManager,Central & Eastern EuropeHilversum, The Netherlands
Dennis van OossanenVice President, GlobalMerchandisingHilversum, The Netherlands
Gina A. WarrenVice President, Global Diversity& InclusionBeaverton, Oregon
Carol L. WelchVice President, Corporate AuditBeaverton, Oregon
Amy C. WhiteVice President, North AmericaRunningBeaverton, Oregon
Howard L. WhiteVice President, SportsMarketingBrand JordanBeaverton, Oregon
Roland P. WolframVice President, Global SalesBeaverton, Oregon
Robert C. WoodPresident, SPARQ/SSTBeaverton, Oregon
Craig G. ZanonVice President, Global CategoryBasketballBeaverton, Oregon
Brian K. ZappitelloVice President, ApparelSportswearBeaverton, Oregon
Patricia L. ZeedickVice President & GeneralManager,Category KidsBeaverton, Oregon
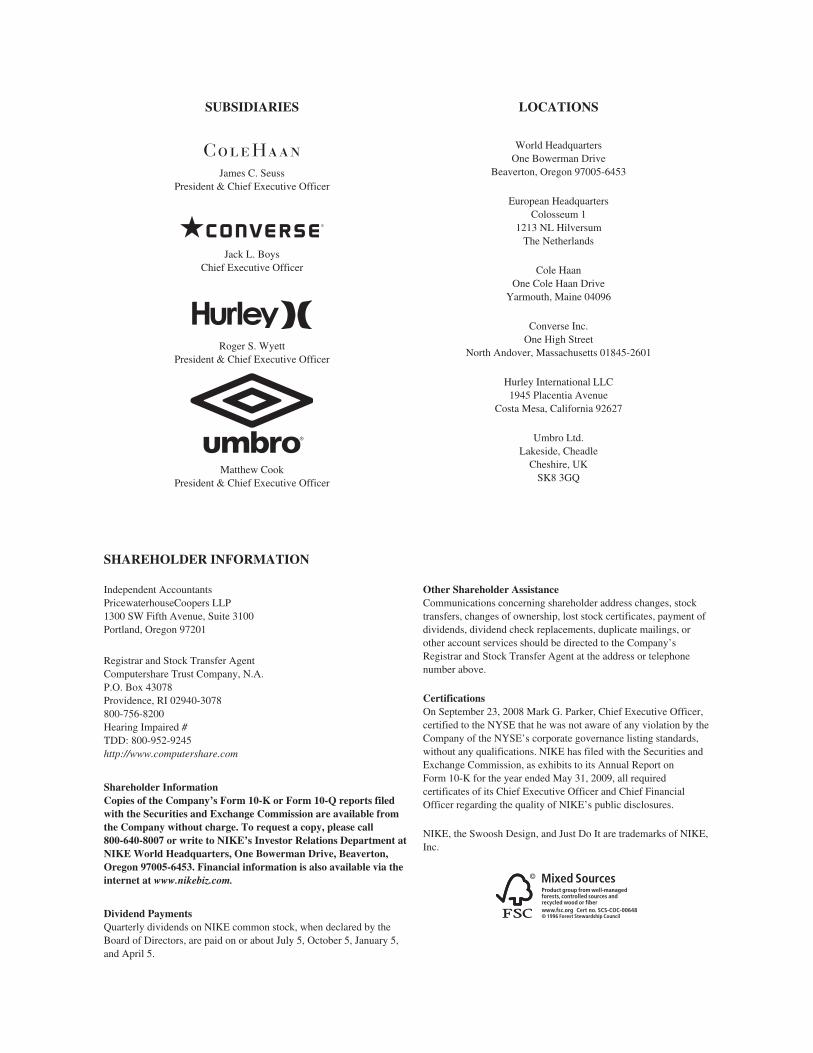
SUBSIDIARIES LOCATIONS
World HeadquartersOne Bowerman Drive
Beaverton, Oregon 97005-6453
European HeadquartersColosseum 1
1213 NL HilversumThe Netherlands
Cole HaanOne Cole Haan Drive
Yarmouth, Maine 04096
Converse Inc.One High Street
North Andover, Massachusetts 01845-2601
Hurley International LLC1945 Placentia Avenue
Costa Mesa, California 92627
Umbro Ltd.Lakeside, Cheadle
Cheshire, UKSK8 3GQ
James C. SeussPresident & Chief Executive Officer
Jack L. BoysChief Executive Officer
Roger S. WyettPresident & Chief Executive Officer
Matthew CookPresident & Chief Executive Officer
SHAREHOLDER INFORMATION
Independent AccountantsPricewaterhouseCoopers LLP1300 SW Fifth Avenue, Suite 3100Portland, Oregon 97201
Registrar and Stock Transfer AgentComputershare Trust Company, N.A.P.O. Box 43078Providence, RI 02940-3078800-756-8200Hearing Impaired #TDD: 800-952-9245http://www.computershare.com
Shareholder InformationCopies of the Company’s Form 10-K or Form 10-Q reports filedwith the Securities and Exchange Commission are available fromthe Company without charge. To request a copy, please call800-640-8007 or write to NIKE’s Investor Relations Department atNIKE World Headquarters, One Bowerman Drive, Beaverton,Oregon 97005-6453. Financial information is also available via theinternet at www.nikebiz.com.
Dividend PaymentsQuarterly dividends on NIKE common stock, when declared by theBoard of Directors, are paid on or about July 5, October 5, January 5,and April 5.
Other Shareholder AssistanceCommunications concerning shareholder address changes, stocktransfers, changes of ownership, lost stock certificates, payment ofdividends, dividend check replacements, duplicate mailings, orother account services should be directed to the Company’sRegistrar and Stock Transfer Agent at the address or telephonenumber above.
CertificationsOn September 23, 2008 Mark G. Parker, Chief Executive Officer,certified to the NYSE that he was not aware of any violation by theCompany of the NYSE’s corporate governance listing standards,without any qualifications. NIKE has filed with the Securities andExchange Commission, as exhibits to its Annual Report onForm 10-K for the year ended May 31, 2009, all requiredcertificates of its Chief Executive Officer and Chief FinancialOfficer regarding the quality of NIKE’s public disclosures.
NIKE, the Swoosh Design, and Just Do It are trademarks of NIKE,Inc.
Cert no. SCS-COC-00648