nieir construction update december 2014
TRANSCRIPT

Queensland and Queensland
region construction activity:
Quarterly projection update –
December quarter 2014
A report for the
DEPARTMENT OF HOUSING AND PUBLIC WORKS
Prepared by the
National Institute of Economic and Industry Research (NIEIR)
ABN: 72 006 234 626
416 Queens Parade, Clifton Hill, Victoria, 3068
Telephone: (03) 9488 8444; Facsimile: (03) 9482 3262
Email: [email protected]
January 2015
PJB1161-QDH&PW-December quarter/QldDPW/2014/December
While the National Institute endeavours to provide reliable forecasts and believes the material is accurate it will not be liable for any claim by any party acting on such information.

Contents
Page no.
1. Introduction 1
1.1 Revisions to data and price base 1 1.2 The world and Australian economy 1 1.3 The national economy 2 1.4 The Queensland economy 3 1.5 Queensland construction forecasts 4
2. Private residential construction 8
2.1 Dwelling investment 8
3. Non-residential building 14
4. Engineering construction 19
5. Total construction activity and the regional pattern 22
6. Prices and labour shortages 25
7. The regional dimension 27
7.1 Regional construction activity profile – Brisbane 27 7.2 Regional construction activity profile – Gold Coast 27 7.3 Regional construction activity profile – Sunshine Coast 28 7.4 Regional construction activity profile – West Moreton 28 7.5 Regional construction activity profile – Darling Downs 29 7.6 Regional construction activity profile – Northern region 29 7.7 Regional construction activity profile – the Far North region 30 7.8 Regional construction activity profile – Wide Bay Burnett region 30
Appendix A: Detailed tables – 2009.3 to 2016.2 38

List of tables
Page no.
1. Queensland construction industry – real quarterly price growth 5 2. Contribution to growth 6 3. Total construction – average annual growth rates by Queensland regions 6 4. Drivers of construction growth by Queensland region 2012-2015 6 5. Queensland construction – Annual growth and % contribution to construction activity by major construction segment 7 6. Queensland population by region 7 7. Value of work done: Residential new construction (including major additions) by region 11 8. Value of work done: Residential other renovations by region 12 9. Value of work done: Private residential building by region 13 10. Value of work done: Non-residential building by region 18 11. Value of work done: Total engineering construction activity by region 21 12. Value of work done: Total construction activity by region ($ million) 23 13. Value of work done: Total construction activity by region 24 14. Queensland construction industry – real quarterly price growth at annual rates 26 15. Shortage of construction labour by Queensland region 26 16. Formation of construction in Brisbane 31 17. Formation of construction in Gold Coast 31 18. Formation of construction in Sunshine Coast 32 19. Formation of construction in West Moreton 32 20. Formation of construction in Wide Bay Burnett 33 21. Formation of construction in Darling Downs 33 22. Formation of construction in South West 34 23. Formation of construction in Fitzroy 34 24. Formation of construction in Central West 35 25. Formation of construction in Mackay 35 26. Formation of construction in Northern 36 27. Formation of construction in Far North 36 28. Formation of construction in North West 37 29. Formation of construction in Queensland 37
A.1 Private dwelling value of work done: new construction (including alterations and additions) 39 A.2 Private dwelling: other value of work done 40 A.3 Private dwelling: total value of work done 41 A.4 Private non-residential building value of work done 42 A.5 Public non-residential building value of work done 43 A.6 Total non-residential building value of work done 44 A.7 Public sector engineering value of work done 45 A.8 Private sector engineering value of work done 46 A.9 Total engineering value of work done 47 A.10 Public dwelling value of work done 48 A.11 Total construction: value of work done 49

List of figures
Page no.
1. Australia – Short-term international borrowing requirement to GDP ratio 2
2. Australia and Queensland GDP growth 3
3. Queensland dwelling – new construction approvals 8
4. Queensland established house prices 9
5. Queensland housing rental vacancy rate 9
6. Queensland – new dwellings 10
7. Queensland non-residential projects under construction, committed and under consideration 15
8. Queensland non-residential building approvals and work done 15
9. Queensland private non-residential building 16
10. Queensland public non-residential building 16
11. Queensland total non-residential building construction approvals 17
12. Queensland engineering projects under construction, committed and under consideration 20
13. Queensland total engineering – work yet to be done 20
14. Queensland total construction activity and Queensland construction industry 25

Queensland and Queensland region construction activity: Quarterly projection update –
December quarter 2014
1
1. Introduction
This update is for the September quarter 2014. There is a complete set of data available for the September quarter 2014 for all building data and Engineering construction data. All years are in fiscal years so for example 2014 would refer to the 2013-14 fiscal year.
1.1 Revisions to data and price base
It should not be assumed that just because the data is available to the June quarter that this will represent the final estimate. Preliminary estimates are continually being revised, especially over the next two to three quarters and, from time to time, the historical data can be significantly revised.
It should also be noted that the price base is the 2012-13 year.
1.2 The world, Australian and Queensland economies
The downside economic risks facing the World economy have not been as great since the start of the Great Financial Crises (GFC) in 2007. There are three “wars” proceeding simultaneously. Firstly there is a currency war where countries are adopting large scale liquidity injections in order to drive down medium to long term bond rates and to encourage capital outflows to drive down their currencies. The second “war” is akin to a real war by other means. This is the economic sanctions imposed on Russia because of the conflict in the Ukraine. One of the weapons in this conflict would be for a low oil price coupled with denial of access of Russia to Western capital markets. The third “war” is an energy resource “war” where the traditional oil producers are driving down the oil price to maintain long run market share by reducing the rate of growth of non-conventional energy such as the North American oil shale based supply.
In 2014 Japan decided to follow the US in returning to large scale quantitative easing (or liquidity injection policies) and in early 2015 the Euro Zone adopted the same policies. The problem is that over the last three years the quantitative easing polices of the United States resulted is a very large outflow of capital to emerging economies which has the potential to spark another World financial crisis when the money flows out of emerging markets when interest rates increase in developed markets in general and the United States in particular. This is because of the high debt levels that now apply in emerging markets that would trigger banking/exchange rate crises in several major emerging economies when the funds flow out.
In terms of the Ukraine given Russia’s high level of foreign reserves the Russian economy could stand another 2 to 4 years of financial sanctions and low oil prices. If of course the major oil producers are being subject to United States pressure to maintain world oil production and hence low world oil prices it is in conflict with the United States own narrow economic interests. This is because the major world oil producers are following their own interests to reduce the rate of investment in alternative oil supplies which will directly affect adversely one of the key drivers of US economic growth since the GFC. In any case it will also require a number of years of low oil prices to change long run expectations and significantly curtail the rate of expansion of alternative oil supplies.
This coupled with the oversupply in world oiI in all markets and the adoption of aggressive environmental policies in China to curtail coal consumption has resulted in the last six months in a

Queensland and Queensland region construction activity: Quarterly projection update –
December quarter 2014
2
perfect storm in Australian commodity markets with across-the-board actual or shortly to be realised falling commodity prices for Australian major commodity exports.
Although the major projects under construction will proceed, the cash flow squeeze will undoubtedly have an impact in the short term in reducing to some degree investment expenditures. This has been incorporated to some extent in the latest revisions.
There are some positives however. Interest rates are likely to remain lower for longer than previously expected than previously expected allowing the housing recovery to proceed with its current momentum at least into 2016. Also the low oil prices will increase real consumer incomes partially offsetting the deflationary effects in the resource sector
Nevertheless the short-term picture is one of underperforming economies both at the international level were world growth over the next 12 to 18 months is likely to be at best around 3% per annum with Australian growth being near 2.5% which is its current growth rate.
The Queensland economy is also currently growing at a rate near the national average. This is a little less than what was previously expected.

Queensland and Queensland region construction activity: Quarterly projection update –
December quarter 2014
3
1.5 Queensland construction forecasts
Based on the latest data, total Queensland construction activity increased by 5.0% over 2013-14.
In the September quarter 2014 Queensland construction expenditure declined by 6.3% compared to the June quarter 2014 after declining by 2.4% in the June quarter compared to the March quarter 2014. The projection for the December quarter 2014 indicates total construction expenditure of $14.9 billion an increase of 4.3% compared to the September quarter 2014. Residential construction remained steady, non-residential construction expenditure declined by 5.1% and engineering construction declined by 8.9% in the September quarter 2014 compared to the June quarter 2014. The projection for the December quarter shows residential construction growing at 3.5%, non-residential construction growing at 6.4% and engineering construction increasing by 4.3%.
Non-residential expenditures are projected to decline by $187 million over 2015, for 2016 the decline in non-residential expenditures is 0.9% compared to 2015 representing $63 million. For private residential construction an increase of $1.5 billion in 2015 is followed by a further increase of $1.1 billion in 2016. A $7.5 billion decrease in engineering construction expenditure for 2015 is followed in 2016 by a further decline of $3.0 billion in 2016.
Over the 2015 and 2016 fiscal years Queensland construction activity is projected to decline by $8.1 billion. The average annual growth rate for total construction from 2012 to 2016 is projected at a decline of 1.4%, significantly lower than the average annual growth of 6.0% for the 1993 to 2012.
Compared to the previous report there is a 0.7% downward revision to the level of Queensland construction activity in 2015, which is consistent with the downward adjustment to the 2015 growth rate of 0.3%. For 2016 there is a downward adjustment to the growth rate of 2.5%.
Table 2 outlines the contribution of the various construction sectors to construction growth. The main driver for construction growth over 2013-14 was engineering construction with a $2.0 billion increase in expenditure. This represents 67% of total construction growth. Dwellings increase total construction expenditure by $0.6 billion and Non-residential construction increased total construction growth by $0.3 billion in 2013-14. In 2014-15 dwelling construction increases total construction by $1.5 billion whilst engineering construction reduces total construction by $7.5 billion. For 2015-16 dwelling construction contributes over $1.1 billion to total construction growth whilst the contribution of non-residential construction is a negative contribution of $63 million and engineering construction has a negative contribution of $3.0 billion, resulting in a total decline of $1.9 billion in 2015-16.
Construction prices grew by 0.06% over the September quarter this followed growth of just 0.12% for the June quarter 2014. Prices are projected to on average decline by just 0.1% through the projection period. Construction prices for housing grew by 0.4% for the June and September quarters. Over the projection period prices for residential construction will rise by an average of 0.2%. Non-residential construction prices declined for the September quarter, the average decline in non-residential prices over the projection period is 0.1%. Engineering construction price growth has been negative in each of the last two quarters, on average over the projection period a slight decline of 0.4% is projected.
Queensland population has been growing at an average of 20,000 persons over the last eight quarters. In contrast the next eight quarters are projected to average 23,600 persons. Queensland population is projected to grow by just under 2% from June 2014 through to June 2015. The fastest growing regions are Mackay at 2.8% and West Moreton at 2.6%. However the regions with the largest increase are Brisbane with 41,000 and Gold Coast with a 13,000 increase in population.

Queensland and Queensland region construction activity: Quarterly projection update – December quarter 2014 4
Table 1 Queensland construction industry – real quarterly price changes (%)
2013-14 Sep.
2013-14 Dec.
2013-14 Mar.
2013-14 Jun.
2014-15 Sep.
2014-15 Dec.
2014-15 Mar.
2014-15 Jun.
2015-16 Sep.
2015-16 Dec.
2015-16 Mar.
2015-16 Jun.
Actual Forecast
Houses 0.8 -0.1 0.4 0.4 0.4 0.3 0.3 0.3 0.2 0.2 0.2 0.1
Non-residential building 0.4 -0.4 0.0 0.0 -0.3 -0.1 0.0 0.1 -0.3 -0.1 -0.1 0.1
Engineering 1.0 0.5 0.6 -0.2 -0.3 -0.6 -0.6 -0.4 -0.4 -0.3 -0.3 -0.3
Total 0.8 0.0 0.4 0.1 0.1 0.0 0.0 0.1 -0.1 0.0 0.0 0.0

Queensland and Queensland region construction activity: Quarterly projection update –
December quarter 2014
5 5 5
5
Table 2 Contribution to growth
Dwelling Non-residential Engineering Total
Change $m
2012-13 -1609 -680 4307 1915
2013-14 620 332 2045 3041
2014-15 1507 -187 -7484 -6182
2015-16 1127 -63 -3035 -1951
Contribution to growth %
2012-13 -84 -36 225 100
2013-14 20 11 67 100
2014-15 -24 3 121 100
2015-16 -58 3 156 100
Table 3 Total construction – average annual growth rates by Queensland regions
1993-2013 2012-2016
Brisbane 4.8 -7.5
Gold Coast 3.8 0.4
Sunshine Coast 4.0 0.3
West Moreton 2.5 -2.3
Wide Bay/Burnett 1.7 -1.5
Darling Downs 8.2 1.7
South West 21.1 -29.4
Fitzroy 12.6 6.2
Central West 6.2 8.5
Mackay 10.0 2.6
Northern 5.1 2.7
Far North 3.0 -3.2
North West 10.4 5.1
Queensland 6.4 -1.4
Table 4 Drivers of construction growth by Queensland region 2012-2016 (average annual $m change for span years)
Dwelling Non-residential Engineering Total
Brisbane 95 -230 -938 -1074
Gold Coast 43 -55 -124 -136
Sunshine Coast 30 98 -250 -122
West Moreton 0 0 -25 -25
Wide Bay/Burnett -29 -3 -20 -52
Darling Downs -17 9 153 145
South West 3 0 -73 -70
Fitzroy 28 32 2257 2316
Central West 1 -4 37 34
Mackay -3 -71 166 92
Northern 8 -17 101 91
Far North 10 -34 18 -6
North West 2 0 91 93
Queensland 170 -276 1393 1287

Queensland and Queensland region construction activity: Quarterly projection update – December quarter 2014 6
Table 5 Queensland construction – Annual growth and % contribution to construction activity by major construction segment
2002 2003 2004 2005 2006 2007 2008 2009 2010 2011 2012 2013 2014 2015 2016
Annual percentage rate of change
Dwellings 30.1 18.3 8.7 5.9 2.8 5.4 -0.7 -8.1 -1.3 -8.2 -4.5 -11.0 4.8 10.3 7.2
Total non-residential building 3.6 -4.4 10.3 5.8 24.8 16.5 5.1 8.5 4.2 6.2 -9.5 -9.1 4.9 -2.6 -0.9
Total engineering construction -4.3 16.7 -4.0 20.9 28.3 20.4 22.3 19.0 -5.1 22.0 44.5 11.9 5.1 -17.6 -8.7
Total construction 13.5 14.1 5.2 9.9 13.4 12.1 8.5 5.5 -2.2 7.7 19.4 3.2 5.0 -9.6 -3.4
Contribution to total construction growth
Dwellings 16.5 10.3 5.1 3.3 1.4 2.6 -0.3 -3.1 -0.5 -2.7 -1.2 -2.5 1.1 2.8 2.2
Total non-residential building 0.6 -0.6 1.5 0.8 3.8 2.6 0.8 1.4 0.7 1.0 -1.2 -1.0 0.5 -0.3 -0.1
Total engineering construction -1.3 4.9 -1.1 6.2 9.5 7.4 9.1 8.7 -2.3 11.1 27.2 7.9 3.3 -10.6 -4.9
Table 6 Queensland population by region (‘000)
2014.2 2014.3 2014.4 2015.1 2015.2 2015.3 2015.4 2016.1 2016.2
Brisbane 2201 2211 2221 2232 2242 2252 2262 2273 2283
Gold Coast 547 550 553 556 560 563 566 569 573
Sunshine Coast 335 337 339 341 343 345 346 348 350
West Moreton 101 102 102 103 104 104 105 106 107
Wide Bay/Burnett 290 292 293 294 295 297 298 299 301
Darling Downs 243 244 245 246 247 249 250 251 252
South West 27 27 27 27 27 27 27 27 27
Fitzroy 233 234 236 237 238 240 241 242 243
Central West 13 13 13 13 13 13 13 13 13
Mackay 183 185 186 187 189 190 191 192 194
Northern 237 239 240 241 243 244 245 246 248
Far North 276 277 278 279 280 282 283 284 285
North West 36 36 36 36 36 36 36 36 36
Queensland 4722 4746 4769 4793 4816 4840 4863 4887 4911

Queensland and Queensland region construction activity: Quarterly projection update –
December quarter 2014
7 7 7
2. Private residential construction
2.1 Dwelling investment
The latest data indicates that for 2014 total private Queensland residential construction activity increased by 4.5%. This was the first positive growth after four years of negative growth. The decline for 2013 was 10.4%.
For private dwelling expenditure remained steady over the September quarter 2014. The September quarter level was $3,763 million just above the average for the first three quarters for the 2014 calendar year. For December quarter 2014 growth of 3.8% is projected.
In 2015 private dwelling activity is projected to exhibit growth of 10.4%. This is followed in 2016 with growth of 7.1%. As discussed in previous reports a contributor to this will be the ongoing low interest rates. There is a downward revision in projected dwelling activity in Queensland for 2015 of 0.6%. For 2016 the projection for Queensland dwelling activity has been revised downwards by 1.9%.
In the June quarter 2014 new private dwelling construction decreased by 4.2% compared to the March quarter 2014, for the September quarter new private construction declined by 0.6% whilst other work done decreased by 1.8% for the June quarter and fell by a further 0.3% for the September quarter 2014.
Overall for 2014 other work done showed growth of 2.3% and the outlook for 2015 is further growth for renovation expenditures of 2.0% and for 2016 steady growth of 3.4% is projected. The new construction profile shows growth of 15.2% for 2015 and 8.9% for 2016.
Figure 3: Queensland dwelling – new construction approvals
500
1000
1500
2000
2500
3000
3500
40002012-13 $ million

Queensland and Queensland region construction activity: Quarterly projection update –
December quarter 2014
8 8 8
Figure 4: Queensland established house prices
Figure 5: Queensland housing rental vacancy rate

Queensland and Queensland region construction activity: Quarterly projection update –
December quarter 2014
9 9 9
Figure 6: Queensland – new dwellings

Queensland and Queensland region construction activity: Quarterly projection update – December quarter 2014 10
Table 7 Value of work done: Residential new construction (including major additions) by region– chain volume measure 2012-13 reference year ($ million)
2013-14
Sep. 2013-14
Dec. 2013-14
Mar. 2013-14
Jun. 2014-15
Sep. 2014-15
Dec. 2014-15
Mar. 2014-15
Jun. 2015-16
Sep. 2015-16
Dec. 2015-16
Mar. 2015-16
Jun.
Annual growth rate
2014-15 2015-16
Actual Forecast
Brisbane 963 1109 1243 1332 1379 1480 1484 1503 1406 1420 1427 1441 25.8 -2.6
Gold Coast 194 220 225 267 260 275 309 341 341 364 382 400 30.9 25.4
Sunshine Coast 148 177 190 208 222 246 255 267 256 265 272 279 36.7 8.4
West Moreton 36 37 40 44 38 40 46 51 52 56 59 63 11.4 30.9
Wide Bay/Burnett 78 81 91 93 91 92 103 114 114 122 128 132 16.9 23.7
Darling Downs 104 106 114 114 111 100 107 115 113 118 122 126 -1.3 10.7
South West 11 8 6 6 6 6 7 8 8 9 9 10 -17.5 36.9
Fitzroy 212 171 138 116 93 81 98 114 117 128 137 146 -39.5 36.6
Central West 2 1 1 1 1 2 3 3 4 4 5 5 69.3 100.6
Mackay 187 162 137 106 79 72 84 95 97 105 110 115 -44.3 29.2
Northern 103 102 109 112 104 108 120 132 131 139 145 151 8.8 22.0
Far North 68 71 72 66 67 78 93 107 110 120 128 134 24.3 42.5
North West 5 6 6 6 4 4 5 6 7 8 9 9 -12.5 73.5
Queensland 2113 2253 2372 2470 2456 2582 2715 2856 2754 2858 2932 3010 15.2 8.9

Queensland and Queensland region construction activity: Quarterly projection update – December quarter 2014 11
Table 8 Value of work done: Residential other renovations by region – chain volume measure 2012-13 reference year ($ million)
2013-14
Sep. 2013-14
Dec. 2013-14
Mar. 2013-14
Jun. 2014-15
Sep. 2014-15
Dec. 2014-15
Mar. 2014-15
Jun. 2015-16
Sep. 2015-16
Dec. 2015-16
Mar. 2015-16
Jun.
Annual growth rate
2014-15 2015-16
Actual Forecast
Brisbane 555 553 576 567 567 576 585 593 599 604 608 612 3.1 4.4
Gold Coast 215 213 221 216 215 216 218 220 221 222 222 223 0.4 2.1
Sunshine Coast 139 138 143 140 139 141 142 144 145 145 146 146 1.1 2.8
West Moreton 24 24 25 24 24 25 25 25 25 25 26 26 1.6 3.2
Wide Bay/Burnett 72 72 74 73 72 73 73 74 74 75 75 75 0.6 2.1
Darling Downs 47 47 49 48 48 49 49 50 50 51 51 51 3.1 3.9
South West 4 5 5 5 5 5 5 5 5 5 5 5 4.5 5.7
Fitzroy 48 49 51 51 51 51 52 52 53 53 53 54 3.5 3.5
Central West 2 2 2 2 2 2 2 2 2 2 2 2 1.8 7.7
Mackay 46 47 49 49 48 49 49 50 50 51 51 51 3.2 2.9
Northern 61 61 63 62 62 62 63 64 64 65 65 65 1.8 3.3
Far North 73 72 75 73 72 73 73 74 74 74 74 75 0.0 1.8
North West 2 2 2 2 2 2 2 2 2 2 2 2 3.5 5.4
Queensland 1288 1283 1334 1311 1307 1323 1339 1353 1364 1374 1379 1387 2.0 3.4

Queensland and Queensland region construction activity: Quarterly projection update – December quarter 2014 12
Table 9 Value of work done: Private residential building by region – chain volume measure 2012-13 reference year ($ million)
2013-14
Sep. 2013-14
Dec. 2013-14
Mar. 2013-14
Jun. 2014-15
Sep. 2014-15
Dec. 2014-15
Mar. 2014-15
Jun. 2015-16
Sep. 2015-16
Dec. 2015-16
Mar. 2015-16
Jun.
Annual growth rate
2014-15 2015-16
Actual Forecast
Brisbane 1519 1663 1819 1900 1946 2056 2069 2096 2005 2025 2035 2053 18.4 -0.6
Gold Coast 409 433 446 483 475 492 527 561 562 586 604 622 16.0 15.5
Sunshine Coast 287 315 333 348 361 387 398 410 401 411 418 426 21.2 6.4
West Moreton 60 61 65 68 62 65 71 76 77 81 85 88 7.6 20.9
Wide Bay/Burnett 151 153 165 165 164 165 177 188 189 197 202 207 9.4 14.6
Darling Downs 151 153 163 162 159 148 157 165 163 169 173 177 0.0 8.6
South West 16 13 11 11 11 10 11 13 13 14 14 15 -9.4 23.7
Fitzroy 260 220 189 167 144 132 150 166 170 181 190 199 -29.3 25.1
Central West 3 3 3 3 3 3 4 5 5 6 6 7 32.5 61.7
Mackay 234 209 186 154 128 121 133 145 147 155 161 166 -32.7 19.4
Northern 164 163 172 174 166 170 183 195 195 204 210 216 6.3 15.4
Far North 141 143 147 139 139 150 166 181 184 194 202 209 11.8 23.9
North West 7 8 8 8 6 6 7 8 9 10 11 12 -8.2 52.7
Queensland 3401 3536 3706 3781 3763 3905 4054 4208 4118 4231 4311 4397 10.4 7.1
Queensland and Queensland region construction activity: Quarterly projection update –
December quarter 2014
13 13
3. Non-residential building
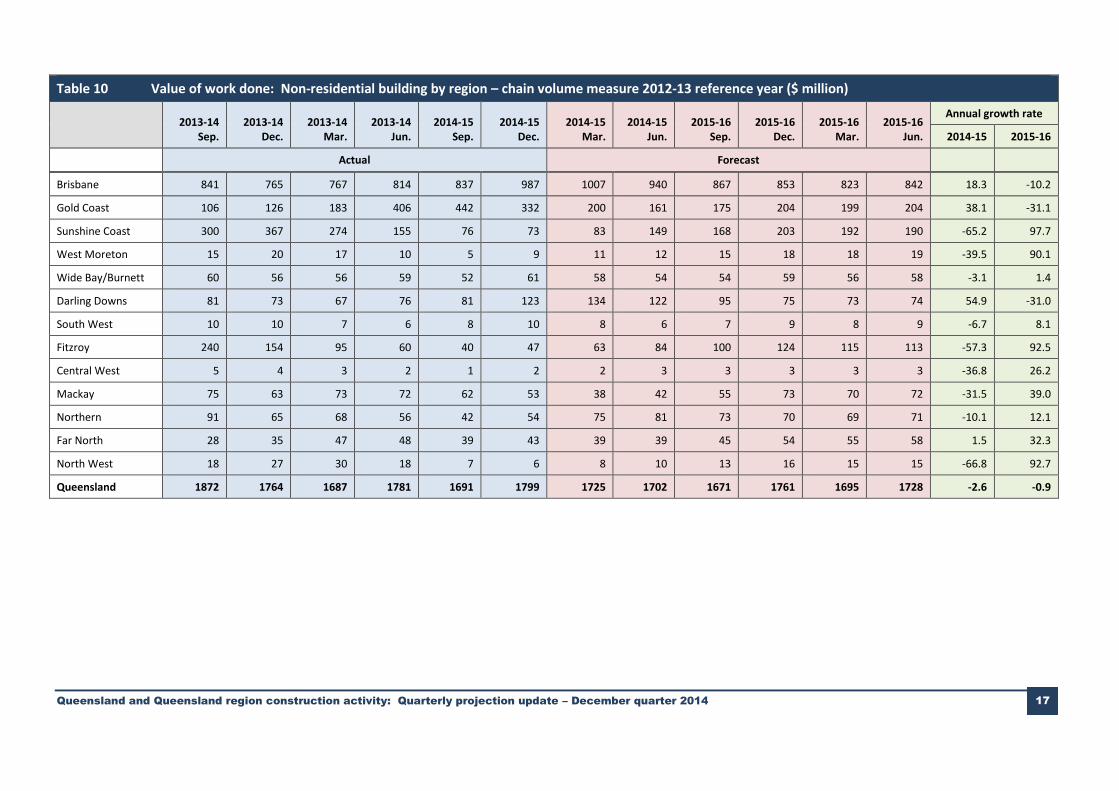
Based on the most recent data for 2014, total Queensland non-residential construction activity increased by 4.9%.
For the June quarter 2014, the level of activity for the total sector was 5.6% above the March quarter 2014, for the September quarter this was almost reversed with a decline of 5.1% two of the last three quarter had negative growth for non-residential construction work done. Private non-residential construction increased by 7.1% over the June quarter 2014 compared to March 2014, limited growth over the September quarter 2104 meant non-residential construction levels remained steady over September 2014.
Falling confidence due to external factors such as falling coal and oil prices as well as the winding down of the construction phase of the LNG projects will affect the levels on non-residential construction over the projection period. Queensland’s non-residential building activity is projected to decline by 2.6% over 2015 with a further decline of 0.9% projected for the following fiscal year. This is fairly conservative, and it may be that the timing and depth of the declines are different, depending on how world events unfold. Over the two years to 2016 public sector expenditure will decline by $213 million, private sector non-residential construction expenditure will decrease by $37 million.
There has been a downward revision to non-residential total building activity of 2.3% in 2015. There has been a downward revision of 5.9% in the projected level of activity for the 2016 fiscal year. These revisions are due to the changes mentioned above in coal and oil prices and general instability in confidence levels around the world.
Major projects currently under construction are; the $1.9 billion Sunshine Coast University hospital at Kawana, the $1.4 million construction of Queensland Children’s Hospital and the $1 billion ICON Ipswich. New projects under construction include; the $450 million BTP Northshore Hamilton business park, the $90 million BTP Westlink Green business park and the $85 million Mater Private Hospital at Springfield.
In real terms over the last six months the value of non-residential building projects under construction or committed have risen by 0.6% or $13 million, projects under consideration have declined by 3.8% or $24 million.
Over the three months to September the value of non-residential projects listed as completed was $167 million. There value of new projects under construction was $700 million, giving a net increase of $533 million in projects currently under construction.
The major non-residential projects completed over the September quarter are the University of Queensland’s; the $135 million advanced engineering build and the $32 million global change institute.

Queensland and Queensland region construction activity: Quarterly projection update –
December quarter 2014
14 14
Figure 7: Queensland non-residential projects under construction, committed and under consideration (at quarterly construction rates) – $ million
Figure 8: Queensland non-residential building approvals and work done

Queensland and Queensland region construction activity: Quarterly projection update –
December quarter 2014
15 15
Figure 9: Queensland private non-residential building
Figure 10: Queensland public non-residential building

Queensland and Queensland region construction activity: Quarterly projection update –
December quarter 2014
16 16
Figure 11: Queensland total non-residential building construction approvals
500
1000
1500
2000
2500
3000
3500
40002012-13 $ million
Queensland and Queensland region construction activity: Quarterly projection update – December quarter 2014 17
Table 10 Value of work done: Non-residential building by region – chain volume measure 2012-13 reference year ($ million)
2013-14
Sep. 2013-14
Dec. 2013-14
Mar. 2013-14
Jun. 2014-15
Sep. 2014-15
Dec. 2014-15
Mar. 2014-15
Jun. 2015-16
Sep. 2015-16
Dec. 2015-16
Mar. 2015-16
Jun.
Annual growth rate
2014-15 2015-16
Actual Forecast
Brisbane 841 765 767 814 837 987 1007 940 867 853 823 842 18.3 -10.2
Gold Coast 106 126 183 406 442 332 200 161 175 204 199 204 38.1 -31.1
Sunshine Coast 300 367 274 155 76 73 83 149 168 203 192 190 -65.2 97.7
West Moreton 15 20 17 10 5 9 11 12 15 18 18 19 -39.5 90.1
Wide Bay/Burnett 60 56 56 59 52 61 58 54 54 59 56 58 -3.1 1.4
Darling Downs 81 73 67 76 81 123 134 122 95 75 73 74 54.9 -31.0
South West 10 10 7 6 8 10 8 6 7 9 8 9 -6.7 8.1
Fitzroy 240 154 95 60 40 47 63 84 100 124 115 113 -57.3 92.5
Central West 5 4 3 2 1 2 2 3 3 3 3 3 -36.8 26.2
Mackay 75 63 73 72 62 53 38 42 55 73 70 72 -31.5 39.0
Northern 91 65 68 56 42 54 75 81 73 70 69 71 -10.1 12.1
Far North 28 35 47 48 39 43 39 39 45 54 55 58 1.5 32.3
North West 18 27 30 18 7 6 8 10 13 16 15 15 -66.8 92.7
Queensland 1872 1764 1687 1781 1691 1799 1725 1702 1671 1761 1695 1728 -2.6 -0.9

Queensland and Queensland region construction activity: Quarterly projection update –
December quarter 2014
18 18 18 18 18 18
4. Engineering construction
Based on 2014 data, total Queensland engineering construction activity increased by 5.1% over the previous fiscal year.
For 2015 it is projected that there will be a decline of 17.6% followed by a further decline of 8.7% in 2016. There is a downward revision in expenditure of 0.6% for 2014-15 compared to the level of activity expected in the previous bulletin and a downward revision of 3.2% for 2016. Declining coal and oil prices have a two-fold effect – reducing confidence and reducing the revenues that available to fund investment.
In the September quarter 2014 the level of private engineering construction expenditure was $8.0 billion. For the 2014 year the growth was 6.8%. In 2014 public sector engineering expenditures declined by 9.1%. The profile over the next two years is one where private engineering expenditure is projected to decrease by 18.7% for 2015 and decline by 11.4% over 2016, and public sector engineering expenditure is projected to decrease by 7.4% over 2015 and increase by 14.5% over 2016.
Major new projects include; the $450 million BTP Northshore Hamilton business park, the $90 million BTP Westlink Green business park and the $85 million Mater Private Hospital at Springfield.
In the September quarter the major projects under construction were; the $24.7 billion 'Australia Pacific LNG, the $19.6 billion Curtis LNG project QCLNG and the $19.0 billion Gladstone LNG (GLNG) project.
The new major construction project commenced over the September quarter was the Shorncliffe Pier Renewal Project with a value of $20 million.
In real terms over the last six months the value of engineering projects under construction or committed have declined by 1.2% or $162 million, projects under consideration have declined by 0.3% or $31 million.
Over the September quarter the value of engineering projects listed as completed was $2.82 billion and the value of new projects under construction or committed was $20 million, giving a net decrease of $2.8 billion.
The major engineering projects that have been completed over the June quarter are; the $1.9 billion Extension of the Kestrel longwall mine and the $879 million Broadmeadow coal extension project.

Queensland and Queensland region construction activity: Quarterly projection update –
December quarter 2014
19 19 19 19 19 19
Figure 12: Queensland engineering projects under construction, committed and under consideration (at quarterly construction rates) – $ million
Figure 13: Queensland total engineering – work yet to be done

Queensland and Queensland region construction activity: Quarterly projection update – December quarter 2014 20
Table 11 Value of work done: Total engineering construction activity by region – chain volume measure 2012-13 reference year ($ million)
2013-14
Sep. 2013-14
Dec. 2013-14
Mar. 2013-14
Jun. 2014-15
Sep. 2014-15
Dec. 2014-15
Mar. 2014-15
Jun. 2015-16
Sep. 2015-16
Dec. 2015-16
Mar. 2015-16
Jun.
Annual growth rate
2014-15 2015-16
Actual Forecast
Brisbane 1791 1740 1553 1481 1397 1463 1256 1114 915 824 722 741 -20.3 -38.8
Gold Coast 382 360 324 314 309 334 281 238 204 200 195 208 -15.8 -30.6
Sunshine Coast 249 261 239 232 220 242 212 188 168 169 168 170 -12.2 -21.6
West Moreton 62 68 60 58 57 56 50 44 37 37 34 37 -16.8 -30.0
Wide Bay/Burnett 153 146 131 117 78 144 140 124 105 92 75 78 -11.3 -27.9
Darling Downs 989 1002 1009 969 646 598 579 595 751 789 730 736 -39.1 24.3
South West 745 781 628 463 442 371 299 245 201 190 169 138 -48.1 -48.5
Fitzroy 4153 4018 3788 3495 3158 3579 3471 3604 4112 4116 3939 3645 -10.6 14.5
Central West 112 104 96 75 72 64 53 44 37 36 33 202 -39.7 32.1
Mackay 1811 1793 1654 1756 1791 1653 1650 1612 1169 896 789 778 -4.4 -45.8
Northern 280 247 225 219 212 244 217 193 173 410 455 478 -10.8 75.2
Far North 221 179 268 319 362 335 191 171 152 177 173 176 7.2 -36.0
North West 415 408 311 251 139 177 167 140 270 303 273 307 -55.1 85.3
Queensland 11364 11104 10286 9748 8883 9261 8564 8311 8296 8238 7755 7696 -17.6 -8.7

Queensland and Queensland region construction activity: Quarterly projection update –
December quarter 2014
21 21 21 21 21 21
5. Total construction activity and the regional pattern
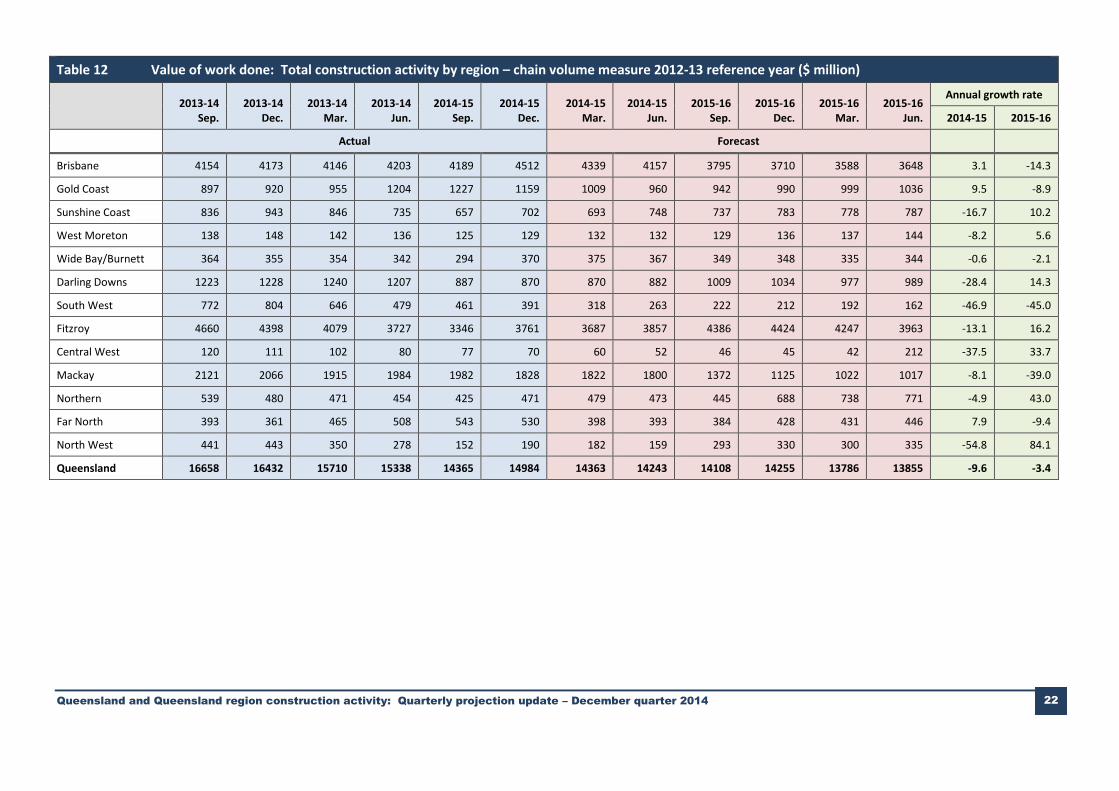
Total construction activity was just over $64 billion in the 2014 fiscal year and is projected to average just under $57 billion over the next two years.
Over 2015, total construction activity in Brisbane is projected to grow by 3.1%, a strong decline of 14.3% is projected for 2016. In the Gold Coast there is a projected 9.5% increase for 2015, followed by negative growth of 8.9% in 2016. For the Sunshine Coast a decline of 16.7% over 2015 is followed by growth of 10.2% over the following year. West Moreton shows an average annual decline of 1.3% for the next two years, while Wide Bay-Burnett is projected to decline by an average of 1.4% over the two years to 2016. The decline over the next two years for the Darling Downs averages 7.1%, whilst South West, Central West, Far North and Mackay regions are all projected to exhibit a decline over the two fiscal years to 2016. The Fitzroy, Northern, Far North and North West regions are projected to have positive growth over the next two years.
Queensland and Queensland region construction activity: Quarterly projection update – December quarter 2014 22
Table 12 Value of work done: Total construction activity by region – chain volume measure 2012-13 reference year ($ million)
2013-14
Sep. 2013-14
Dec. 2013-14
Mar. 2013-14
Jun. 2014-15
Sep. 2014-15
Dec. 2014-15
Mar. 2014-15
Jun. 2015-16
Sep. 2015-16
Dec. 2015-16
Mar. 2015-16
Jun.
Annual growth rate
2014-15 2015-16
Actual Forecast
Brisbane 4154 4173 4146 4203 4189 4512 4339 4157 3795 3710 3588 3648 3.1 -14.3
Gold Coast 897 920 955 1204 1227 1159 1009 960 942 990 999 1036 9.5 -8.9
Sunshine Coast 836 943 846 735 657 702 693 748 737 783 778 787 -16.7 10.2
West Moreton 138 148 142 136 125 129 132 132 129 136 137 144 -8.2 5.6
Wide Bay/Burnett 364 355 354 342 294 370 375 367 349 348 335 344 -0.6 -2.1
Darling Downs 1223 1228 1240 1207 887 870 870 882 1009 1034 977 989 -28.4 14.3
South West 772 804 646 479 461 391 318 263 222 212 192 162 -46.9 -45.0
Fitzroy 4660 4398 4079 3727 3346 3761 3687 3857 4386 4424 4247 3963 -13.1 16.2
Central West 120 111 102 80 77 70 60 52 46 45 42 212 -37.5 33.7
Mackay 2121 2066 1915 1984 1982 1828 1822 1800 1372 1125 1022 1017 -8.1 -39.0
Northern 539 480 471 454 425 471 479 473 445 688 738 771 -4.9 43.0
Far North 393 361 465 508 543 530 398 393 384 428 431 446 7.9 -9.4
North West 441 443 350 278 152 190 182 159 293 330 300 335 -54.8 84.1
Queensland 16658 16432 15710 15338 14365 14984 14363 14243 14108 14255 13786 13855 -9.6 -3.4

Queensland and Queensland region construction activity: Quarterly projection update – December quarter 2014 23
Table 13 Value of work done: Total construction activity by region – chain volume measure 2012-13 reference year – Qtr. 3 2013-14 = 100
2013-14
Sep. 2013-14
Dec. 2013-14
Mar. 2013-14
Jun. 2014-15
Sep. 2014-15
Dec. 2014-15
Mar. 2014-15
Jun. 2015-16
Sep. 2015-16
Dec. 2015-16
Mar. 2015-16
Jun.
Actual Forecast
Brisbane 100 101 100 101 101 109 105 100 92 89 87 88
Gold Coast 94 96 100 126 128 121 106 101 99 104 105 108
Sunshine Coast 99 112 100 87 78 83 82 88 87 93 92 93
West Moreton 97 104 100 96 88 91 93 93 91 96 96 101
Wide Bay/Burnett 103 100 100 97 83 105 106 104 99 99 95 97
Darling Downs 99 99 100 97 72 70 70 71 81 83 79 80
South West 119 124 100 74 71 61 49 41 34 33 30 25
Fitzroy 114 108 100 91 82 92 90 95 108 108 104 97
Central West 118 110 100 79 75 69 59 51 45 44 42 209
Mackay 111 108 100 104 104 95 95 94 72 59 53 53
Northern 114 102 100 96 90 100 102 100 95 146 157 164
Far North 85 78 100 109 117 114 86 84 83 92 93 96
North West 126 127 100 80 43 54 52 45 84 94 86 96
Queensland 106 105 100 98 91 95 91 91 90 91 88 88

Queensland and Queensland region construction activity: Quarterly projection update –
December quarter 2014
24 24
6. Prices and labour shortages
Recent growth in the labour-intensive dwelling construction sector has resulted in only modest improvements to the labour supply. The declines in total construction activity over the next two years will mean that there will continue to be a construction labour surplus over the projection period. For the September 2014 quarter Queensland had a construction labour surplus of around 10,000 workers. The labour surplus projected for 2015 is around 5,000, whilst the average surplus for 2016 is 13,000.
The continued over-supply of construction labour supply will ensure that construction prices will continue flat and in the case of the engineering sector decline over the projection period.
Based on the latest available Australian Bureau of Statistics figures it is estimated that for the September quarter 2014 there are 8,600 unemployed construction workers in Queensland, this was down 14% on the figure for same period in 2013. Just before the GFC in December 2007 the number of unemployed construction workers was around 3,700. Since then the number has ranged between 5,000 and 14,000.
The number employed in the construction industry in the December quarter 2008 was 246,000 the low point was the March quarter 2012 when 222,000 were employed in the construction industry in Queensland. The latest estimate for the September quarter 2014 is for around 230,000.
The implied unemployment rate for the construction industry for September quarter 2014 is 5.9%.
Figure 14: Queensland total construction activity and Queensland construction industry
Rea
l qu
arte
rly
pri
ce g
row
th (
%)

Queensland and Queensland region construction activity: Quarterly projection update – December quarter 2014 25
Table 14 Queensland construction industry – real quarterly price growth at annual rates (%)
2013-14
September 2013-14
December 2013-14
March 2013-14
June 2014-15
September 2014-15
December 2014-15
March 2014-15 June 2015-16
September
Average 2013-14 and
2015-16
Actual Forecast
Non-residential building 0.2 0.0 -1.3 -0.3 -0.1 0.4 -1.0 -0.5 -0.6 -0.5
Residential building 1.8 1.4 1.8 1.4 1.2 1.4 0.8 0.9 0.8 1.0
Engineering construction 2.4 -0.8 -1.2 -2.5 -2.4 -1.7 -1.7 -1.2 -1.2 0.0
Total construction 1.6 0.5 0.3 -0.1 -0.2 0.3 -0.3 0.0 -0.1 0.4
Note: Real price/cost growth is the nominal rate of increase less the increase in the Queensland financial demand implicit deflator.
Table 15 Shortage of construction labour by Queensland region – number ‘000 (shortage is donated by (+) and surplus (-))
Mar-14 Jun-14 Sep-14 Dec-14 Mar-15 Jun-15 Sep-15 Dec-15 Mar-16 Jun-16
Brisbane -1.8 -1.1 -0.4 0.3 -3.0 -6.3 -9.5 -12.8 -11.7 -10.6
Gold Coast -2.0 -1.2 -0.4 0.4 -0.4 -1.2 -2.0 -2.9 -2.1 -1.4
Sunshine Coast 1.6 0.6 -0.3 -1.3 -0.9 -0.6 -0.2 0.2 0.4 0.6
West Moreton -1.4 -1.5 -1.6 -1.6 -1.6 -1.6 -1.6 -1.6 -1.5 -1.4
Wide Bay/Burnett -1.1 -1.1 -1.1 -1.1 -1.1 -1.1 -1.1 -1.2 -1.0 -0.9
Darling Downs -0.6 -1.2 -1.7 -2.3 -2.0 -1.8 -1.5 -1.2 -1.4 -1.5
South West 0.5 0.3 0.1 -0.1 -0.3 -0.5 -0.6 -0.8 -0.9 -0.9
Fitzroy 1.0 0.8 0.7 0.5 1.6 2.7 3.7 4.8 4.1 3.4
Central West 0.1 0.1 0.0 -0.1 -0.1 0.0 0.0 0.0 0.4 0.8
Mackay 3.9 3.7 3.5 3.3 1.6 0.0 -1.7 -3.4 -4.1 -4.8
Northern -0.3 -0.5 -0.6 -0.8 0.5 1.9 3.3 4.6 5.9 7.1
Far North -1.3 -0.8 -0.4 0.1 -0.4 -0.8 -1.3 -1.8 -1.5 -1.2
North West 1.1 0.7 0.3 0.0 0.0 0.1 0.2 0.2 0.3 0.3
Queensland -0.5 -1.2 -2.0 -2.8 -6.0 -9.3 -12.6 -15.8 -13.1 -10.5
Trend Queensland construction workers unemployed (‘000) 12.1 13.8 14.4 14.5 14.9 15.6 16.2 18.3 16.3 16.6

Queensland and Queensland region construction activity: Quarterly projection update –
December quarter 2014
26 26
7. The regional dimension
The previous annual report gave a detailed analysis of the regional dynamics of Queensland construction activity. This update summarises those findings.
7.1 Regional construction activity profile – Brisbane
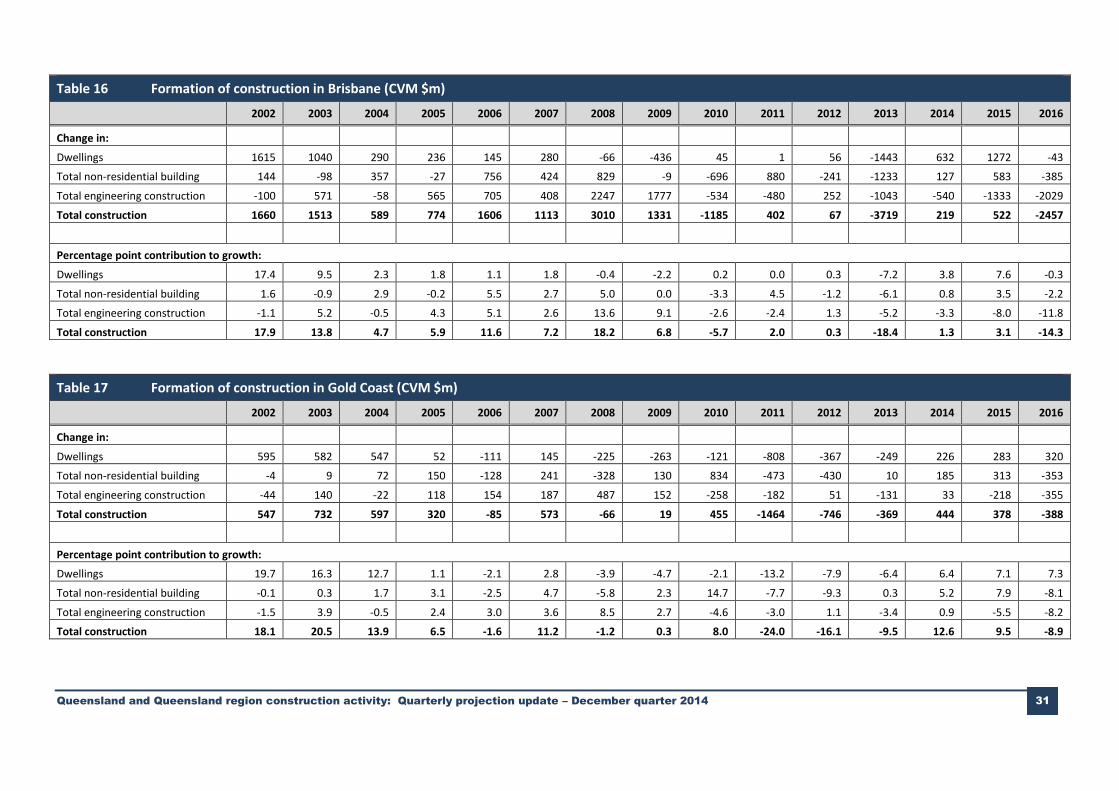
Table 16 indicates that, for the Brisbane region, since the beginning of the GFC in 2008, total dwelling construction fell by a cumulative total of $1.8 billion by 2013. This trend has now reversed, over 2014 total dwelling construction for Brisbane increased by $0.6 billion. The next two years should see a cumulative increase of $1.2 billion.
Over the next two years, from Table 6, Brisbane's population is expected to increase by 82,000. This accumulating pressure on the existing housing stock plus the fact that the Brisbane region is in balance in terms of housing affordability (defined as the ability of the average household to generate income from work sufficient to support a mortgage on new dwelling construction) has enabled the sharp increase in dwelling expenditure. As a result, there is a recovery of dwelling expenditure in 2014 of $630 million and an average of $614million over the next two years.
The average contribution of total dwelling construction to Brisbane’s total construction growth rate will be 3.7 percentage points over 2015 and 2016.
Over the five fiscal years 2008-09 to 2012-13, Brisbane’s non-residential building expenditures fell by a cumulative $1.3 billion. The fall would have been greater if not for the public sector non-residential stimulus. The fall was driven by office project completions and for 2012 the winding back of the stimulus. In 2014 non-residential construction in Brisbane grew by $127 million, the first positive contribution in three years, adding just 0.8 percentage points to total Brisbane construction growth. The average contribution of non-residential construction to total construction in Brisbane over the next two years is 0.6 percentage points.
Engineering construction in Brisbane has been in decline since 2010, with a cumulative total fall of $2.3 billion, reducing total construction growth by an average 2.4 percentage points. Looking forward it is projected that the continued decline in engineering construction will outstrip the losses of the last 5 years, a further cumulative fall of $3.4 billion is projected over 2015 and 2016.
7.2 Regional construction activity profile – Gold Coast
From Table 17 it can be seen that the average annual decline in total dwelling construction expenditure over 2009 to 2013 was over $0.4 billion. This reduced Gold Coast construction growth by an average of 6.9 percentage points per year. Population is expected to grow by 26,000 over the next two years, this pressure has resulted in an increase of $226 million in dwelling expenditure over 2014 and should induce an increase in dwelling construction expenditure of around $300 million over each of the 2015 and 2016 fiscal years, contributing 7.1 percentage points to total construction growth in 2015 and 7.3 percentage points in 2016.

Queensland and Queensland region construction activity: Quarterly projection update –
December quarter 2014
27 27
Over the fiscal years 2009 to 2013, total non-residential construction grew by a cumulative $71 million. However two of those five years showed significant declines in construction growth, 2010 with almost a billion dollars of mostly stimulus expenditure in non-residential construction completely countered the losses of the other years. Non-residential construction in the Gold Coast grew by $185 million in 2014, contributing 5.2 percentage points to total construction growth for the Gold Coast. For 2015 and 2016 the cumulative total decline for non-residential construction will be in the order of $40 million reducing total Gold Coast construction growth by an average 6.8 percentage points.
Engineering construction reduced total construction activity by $368 million over the 2009 to 2013 period. In 2014 engineering construction contributed 0.9 percentage points to the growth in total construction, with engineering growth declining over the 2015 and 2016 fiscal years, the contribution of engineering expenditure to total growth will be -5.5 percentage points for 2015 and -8.2 percentage points 2016.
Total expenditure will increase by 9.5% for 2015, as the increases in dwelling expenditure and non-residential building expenditure counters the decline in engineering construction. In 2016 the growth in dwelling construction is not large enough to continue to outweigh the further declines in the other sectors, leading to a decline in total construction of 8.9% for the 2016 fiscal year.
7.3 Regional construction activity profile – Sunshine Coast
The past performance and future outlook for the Sunshine Coast is similar to the Gold Coast at least in terms of dwelling expenditures. Between 2009 and 2013 total dwelling construction activity decreased by a cumulative $866 million. This reduced total construction growth by an average 5.5 percentage points annually. Over this period the population increase was almost 20,000. Hence for 2014 dwelling construction returned to growth with a $138 million increase in expenditure. The next two years will also have positive growth and contribute an average 5.8 percentage points to total construction growth.
The average annual contribution of non-residential construction to total construction over the 2009 to 2013 fiscal years was -0.7 percentage points. For 2014 non-residential construction contributed 37.7 percentage points to total construction growth, or $856 million more than the previous year. The next two years will decline by a cumulative $342 million reducing total construction growth for the Sunshine Coast by an average of 4.0 percentage points per year.
The profile for engineering construction in the Sunshine coast is that for the 2009 to 2013 period engineering construction grew by an average of $40 million per year, contributing an average 2.0 percentage points to total construction per year over that period. For 2014 engineering construction contributed 4.2 percentage points to total construction. However the next two years will see a return to declining engineering expenditures with a cumulative $305 million decline for 2015 and 2016.
For 2015 total construction for the Sunshine Coast will decline by 16.7 percent and for 2016 the growth in dwellings and the non-residential sector result in growth for total construction of 10.2%.

Queensland and Queensland region construction activity: Quarterly projection update –
December quarter 2014
28 28
7.4 Regional construction activity profile – West Moreton
Population growth in West Moreton has historically been small in comparison to the rest of the state, with an average annual growth of just under 2000 per annum for the period 2009 to 2013, this growth is accelerating and will average closer to 2900 per annum for the 2014 to 2016 period. Consequently dwelling expenditures will grow by a cumulative $29 million over the 2014 to 2016 period.
In non-residential construction the growth in 2014 was $12 million this was the first year of positive growth since the stimulus year of 2009. The cumulative growth over the next two years is just $9 million. This contributes an average of 1.1 percentage points to total construction for the region over 2015 and 2016. Engineering construction grew by $15 million in 2014, contributing 2.6 percentage points to total construction growth. The average contribution of engineering to construction growth over the next two years is -9.7 percentage points.
In spite of the large contribution of the stimulus package in 2009, total construction in West Moreton declined by a cumulative total of $25 million over the 2009 to 2013 period. For 2014 the declines in dwelling expenditure were partially offset by gains in non-residential and engineering construction resulting in an overall $20 million decline. The next two years will average decline of around 1.3% per annum as the residential sector picks up in 2015 and non-residential building returns to positive growth in 2016.
7.5 Regional construction activity profile – Darling Downs
The Darling Downs, in comparison with the other regions, has a unique profile, both in terms of the immediate past and the immediate future. The dwelling and private non-residential building cycle has been, and will be to 2014, more stable than the larger neighbouring regions. All sectors average positive growth over the 2009 to 2013 period.
The average annual percentage point contribution of total dwelling construction expenditures to total Darling Downs construction activity over the period 2014 to 2016 is estimated at 0.4 percentage points.
Non-residential construction will have an average annual percentage point contribution of 0.3 to total construction over 2014 to 2016.
The construction of LNG infrastructure has impacted heavily with an average contribution to total construction growth of 21.2 percentage points for 2011 to 2014. The contribution to total construction decline for the final two years is an average of -7.4 percentage points
Total construction in Darling Downs is projected to grow by an average 7.1% over 2015 and 2016.
7.6 Regional construction activity profile – Northern region
Unlike Darling Downs, the impact of the dwelling cycle has been severe. The six years to 2014 have all had negative growth. The cumulative decline has been $342 million. The cumulative fall in total dwelling construction over 2009 to 2014 period has resulted in an average of -2.3 percentage points of total Northern region construction decline. However a return to growth in dwelling expenditure occurs in the two projection years with a cumulative growth of $151 million.

Queensland and Queensland region construction activity: Quarterly projection update –
December quarter 2014
29 29
The completion of engineering projects lead to a negative 0.4 percentage point contribution to total Northern region construction activity in 2014 from engineering construction. Engineering construction should provide a positive contribution to total construction on average over the 2015 and 2016 projection years.
In the 2014 fiscal year non-residential construction contributed -18.5 percentage points to total construction in the Northern region. For 2015 and 2016 an average of 0.1 percentage point contribution to the total growth rate is projected as declines in 2015 are largely reversed in 2016 resulting in average non-residential construction activity contribution of $2 million to construction levels over those two years.
Total construction in the Northern region declined by 19.5% in the 2014 fiscal year, for 2015 the decline is 4.9% and for 2016 as the engineering sector improves, there will be an increase of 43.0% in total construction expenditure.
7.7 Regional construction activity profile – the Far North region
The far North region in terms of its economic base has been significantly adversely affected by the impact of the GFC in the so-called Dutch disease where the high exchange rate has adversely impacted on its non-mining trade exposed industries. As a result from 2009 to 2013 the average annual decline in total construction activity in the far North region is estimated at just over 5.7% per annum, an average of over $124 million per year. A return to growth occurred in 2014 and should continue into 2015 with average growth for total construction over these two years of 7.6%. However 2016 should decline by 9.4%.
Dwelling construction declined by $71 million in 2014 reducing total construction by 4.4 percentage points. Over the next two years dwelling construction will grow by a cumulative $217 million, contributing an average 6.0 percentage points to total construction growth. Non-residential construction also declined over 2014 reducing total construction by 1.7 percentage points. Non-residential construction will grow by a total of $54 million over 2015 and 2016.
Engineering construction grew by a total of $445 million from 2011 to 2014, contributing an average 6.6 percentage points to total construction growth in the Far North region. The next two years, however will have an average annual decline of $155 million. In 2016 engineering is entirely responsible for the declines in total construction.
7.8 Regional construction activity profile – Wide Bay Burnett region
Cumulatively, construction activity in Wide Bay Burnett declined by $475 million from 2009 to 2013. Falls in dwelling construction and non-residential construction contributed an average of -6.6 percentage points and -1.0 percentage points per annum to the overall decline. These were partially offset by the growth in engineering construction over this period which reduced the overall decline by an average of 2.5 percentage points.
In 2014 there was a 4.1% decline in total construction expenditure. Non-residential building was the only sector to show growth in 2014 and contributed 8.2 percentage points to the total. This growth was reversed by the declines in dwellings and engineering construction with negative contributions of 1.4 percentage points for dwellings and 10.9 percentage points for non-residential construction.

Queensland and Queensland region construction activity: Quarterly projection update –
December quarter 2014
30 30
The average decline in construction activity over 2015 and 2016 will be in the order of 1.4%. Dwelling construction is the only sector with positive growth over 2015 and 2016 contributing on average 5.8 percentage points to total construction growth. Non-residential construction dwelling construction will make a small negative contribution to total construction over the next two years. The large declines in engineering will not be able to offset the growth in the residential sector.
Queensland and Queensland region construction activity: Quarterly projection update – December quarter 2014 31
Table 16 Formation of construction in Brisbane (CVM $m)
2002 2003 2004 2005 2006 2007 2008 2009 2010 2011 2012 2013 2014 2015 2016
Change in:
Dwellings 1615 1040 290 236 145 280 -66 -436 45 1 56 -1443 632 1272 -43
Total non-residential building 144 -98 357 -27 756 424 829 -9 -696 880 -241 -1233 127 583 -385
Total engineering construction -100 571 -58 565 705 408 2247 1777 -534 -480 252 -1043 -540 -1333 -2029
Total construction 1660 1513 589 774 1606 1113 3010 1331 -1185 402 67 -3719 219 522 -2457
Percentage point contribution to growth:
Dwellings 17.4 9.5 2.3 1.8 1.1 1.8 -0.4 -2.2 0.2 0.0 0.3 -7.2 3.8 7.6 -0.3
Total non-residential building 1.6 -0.9 2.9 -0.2 5.5 2.7 5.0 0.0 -3.3 4.5 -1.2 -6.1 0.8 3.5 -2.2
Total engineering construction -1.1 5.2 -0.5 4.3 5.1 2.6 13.6 9.1 -2.6 -2.4 1.3 -5.2 -3.3 -8.0 -11.8
Total construction 17.9 13.8 4.7 5.9 11.6 7.2 18.2 6.8 -5.7 2.0 0.3 -18.4 1.3 3.1 -14.3
Table 17 Formation of construction in Gold Coast (CVM $m)
2002 2003 2004 2005 2006 2007 2008 2009 2010 2011 2012 2013 2014 2015 2016
Change in:
Dwellings 595 582 547 52 -111 145 -225 -263 -121 -808 -367 -249 226 283 320
Total non-residential building -4 9 72 150 -128 241 -328 130 834 -473 -430 10 185 313 -353
Total engineering construction -44 140 -22 118 154 187 487 152 -258 -182 51 -131 33 -218 -355
Total construction 547 732 597 320 -85 573 -66 19 455 -1464 -746 -369 444 378 -388
Percentage point contribution to growth:
Dwellings 19.7 16.3 12.7 1.1 -2.1 2.8 -3.9 -4.7 -2.1 -13.2 -7.9 -6.4 6.4 7.1 7.3
Total non-residential building -0.1 0.3 1.7 3.1 -2.5 4.7 -5.8 2.3 14.7 -7.7 -9.3 0.3 5.2 7.9 -8.1
Total engineering construction -1.5 3.9 -0.5 2.4 3.0 3.6 8.5 2.7 -4.6 -3.0 1.1 -3.4 0.9 -5.5 -8.2
Total construction 18.1 20.5 13.9 6.5 -1.6 11.2 -1.2 0.3 8.0 -24.0 -16.1 -9.5 12.6 9.5 -8.9

Queensland and Queensland region construction activity: Quarterly projection update – December quarter 2014 32
Table 18 Formation of construction in Sunshine Coast (CVM $m)
2002 2003 2004 2005 2006 2007 2008 2009 2010 2011 2012 2013 2014 2015 2016
Change in:
Dwellings 355 355 278 66 -217 2 31 -151 -121 -230 -197 -166 138 273 99
Total non-residential building -5 -6 70 -86 145 -52 -41 -7 5 -60 108 -131 856 -715 372
Total engineering construction -7 109 7 63 87 -200 233 159 135 946 -559 -479 96 -120 -186
Total construction 343 458 355 43 16 -249 223 1 18 656 -647 -776 1090 -561 286
Percentage point contribution to growth:
Dwellings 19.4 16.3 10.6 2.2 -7.2 0.1 1.1 -5.0 -4.0 -7.6 -5.3 -5.4 6.1 8.1 3.5
Total non-residential building -0.3 -0.3 2.7 -2.9 4.8 -1.7 -1.5 -0.2 0.2 -2.0 2.9 -4.3 37.7 -21.3 13.3
Total engineering construction -0.4 5.0 0.3 2.1 2.9 -6.6 8.3 5.3 4.5 31.2 -15.1 -15.7 4.2 -3.6 -6.6
Total construction 18.7 21.1 13.5 1.4 0.5 -8.2 8.0 0.0 0.6 21.6 -17.5 -25.5 48.0 -16.7 10.2
Table 19 Formation of construction in West Moreton (CVM $m)
2002 2003 2004 2005 2006 2007 2008 2009 2010 2011 2012 2013 2014 2015 2016
Change in:
Dwellings 42 27 25 52 18 0 -21 30 32 -31 -33 1 -47 19 57
Total non-residential building -1 -5 3 -2 55 9 -25 231 -166 -61 -18 -2 12 -24 33
Total engineering construction -7 12 -9 24 69 14 13 25 13 -12 -21 -13 15 -42 -62
Total construction 34 34 19 74 142 23 -33 286 -121 -103 -72 -14 -20 -46 29
Percentage point contribution to growth:
Dwellings 13.3 7.7 6.6 12.9 3.8 0.1 -3.2 4.9 3.6 -4.0 -4.9 0.2 -8.1 3.4 11.1
Total non-residential building -0.2 -1.4 0.7 -0.6 11.5 1.5 -3.9 37.9 -18.5 -7.8 -2.7 -0.4 2.0 -4.2 6.4
Total engineering construction -2.3 3.3 -2.4 5.9 14.4 2.2 2.1 4.1 1.4 -1.5 -3.2 -2.2 2.6 -7.4 -11.9
Total construction 10.8 9.6 4.9 18.3 29.7 3.8 -5.1 46.9 -13.5 -13.3 -10.8 -2.4 -3.5 -8.2 5.6

Queensland and Queensland region construction activity: Quarterly projection update – December quarter 2014 33
Table 20 Formation of construction in Wide Bay Burnett (CVM $m)
2002 2003 2004 2005 2006 2007 2008 2009 2010 2011 2012 2013 2014 2015 2016
Change in:
Dwellings 116 123 130 148 106 109 -25 -145 -30 -99 -168 -118 -20 61 102
Total non-residential building 42 -23 -1 47 103 -76 4 -20 172 -107 -108 -25 121 -7 3
Total engineering construction -62 70 -16 74 73 -58 -1 -71 -26 13 103 155 -161 -62 -135
Total construction 96 171 113 269 281 -25 -22 -236 116 -194 -173 12 -60 -8 -30
Percentage point contribution to growth:
Dwellings 10.9 10.6 9.7 10.2 6.2 5.5 -1.2 -7.4 -1.8 -5.4 -10.2 -8.1 -1.4 4.3 7.3
Total non-residential building 3.9 -2.0 -0.1 3.3 6.0 -3.8 0.2 -1.0 10.0 -5.9 -6.6 -1.7 8.2 -0.5 0.2
Total engineering construction -5.8 6.0 -1.2 5.1 4.2 -2.9 -0.1 -3.7 -1.5 0.7 6.3 10.6 -10.9 -4.4 -9.6
Total construction 9.0 14.7 8.4 18.6 16.4 -1.3 -1.1 -12.1 6.7 -10.6 -10.6 0.8 -4.1 -0.6 -2.1
Table 21 Formation of construction in Darling Downs (CVM $m)
2002 2003 2004 2005 2006 2007 2008 2009 2010 2011 2012 2013 2014 2015 2016
Change in:
Dwellings 79 73 0 74 89 36 -93 -66 127 89 -54 -68 -16 -2 55
Total non-residential building 6 -5 -14 31 36 43 -70 -16 107 26 -59 12 70 163 -143
Total engineering construction -10 -8 -39 215 318 680 28 -98 -289 874 573 394 763 -1550 588
Total construction 75 59 -54 320 443 759 -135 -181 -55 990 459 337 817 -1390 500
Percentage point contribution to growth:
Dwellings 7.4 6.4 0.0 6.5 6.1 1.9 -3.5 -2.6 5.4 3.9 -1.6 -1.8 -0.4 0.0 1.6
Total non-residential building 0.6 -0.5 -1.2 2.7 2.5 2.3 -2.6 -0.7 4.6 1.1 -1.8 0.3 1.7 3.3 -4.1
Total engineering construction -0.9 -0.7 -3.3 18.8 21.7 35.7 1.0 -3.9 -12.3 38.1 17.4 10.5 18.7 -31.6 16.8
Total construction 7.0 5.2 -4.5 28.0 30.3 39.8 -5.1 -7.1 -2.3 43.1 14.0 9.0 20.0 -28.4 14.3

Queensland and Queensland region construction activity: Quarterly projection update – December quarter 2014 34
Table 22 Formation of construction in South West (CVM $m)
2002 2003 2004 2005 2006 2007 2008 2009 2010 2011 2012 2013 2014 2015 2016
Change in:
Dwellings 3 6 -3 2 4 5 0 -4 3 1 9 14 -14 -5 11
Total non-residential building 5 -2 -4 2 17 -11 6 -9 22 5 -4 21 -20 -2 2
Total engineering construction -10 -12 -17 4 6 110 418 59 -325 684 2032 289 -766 -1260 -658
Total construction -2 -8 -24 8 27 104 423 46 -300 690 2038 324 -799 -1267 -645
Percentage point contribution to growth:
Dwellings 1.8 3.5 -1.6 1.4 3.0 3.1 -0.1 -0.6 0.4 0.3 0.8 0.4 -0.4 -0.2 0.8
Total non-residential building 2.7 -1.4 -2.4 1.6 11.4 -6.1 2.0 -1.3 2.9 1.1 -0.3 0.7 -0.6 -0.1 0.2
Total engineering construction -5.7 -6.9 -10.7 3.0 4.0 62.9 150.0 8.5 -43.4 153.0 178.6 9.1 -21.9 -46.7 -45.9
Total construction -1.2 -4.8 -14.7 6.0 18.5 59.8 151.9 6.6 -40.1 154.3 179.1 10.2 -22.8 -46.9 -45.0
Table 23 Formation of construction in Fitzroy (CVM $m)
2002 2003 2004 2005 2006 2007 2008 2009 2010 2011 2012 2013 2014 2015 2016
Change in:
Dwellings 66 81 29 9 83 166 54 -142 -82 30 120 215 -92 -256 151
Total non-residential building -23 -32 -27 -2 52 55 -34 70 -22 77 79 551 -372 -315 217
Total engineering construction -26 97 -31 313 594 746 -435 1063 59 1533 7754 2179 991 -1642 2000
Total construction 18 147 -30 320 728 968 -415 991 -45 1641 7954 2945 527 -2213 2369
Percentage point contribution to growth:
Dwellings 5.9 7.2 2.3 0.7 5.3 7.2 1.7 -5.0 -2.1 0.8 2.2 1.6 -0.6 -1.5 1.0
Total non-residential building -2.0 -2.8 -2.1 -0.1 3.3 2.4 -1.0 2.5 -0.6 2.0 1.5 4.1 -2.3 -1.9 1.5
Total engineering construction -2.3 8.6 -2.4 25.0 37.8 32.5 -13.3 37.3 1.5 40.4 142.6 16.3 6.1 -9.7 13.7
Total construction 1.6 13.0 -2.3 25.6 46.4 42.1 -12.7 34.8 -1.2 43.2 146.3 22.0 3.2 -13.1 16.2

Queensland and Queensland region construction activity: Quarterly projection update – December quarter 2014 35
Table 24 Formation of construction in Central West (CVM $m)
2002 2003 2004 2005 2006 2007 2008 2009 2010 2011 2012 2013 2014 2015 2016
Change in:
Dwellings 6 0 -6 1 2 -1 2 0 1 3 6 -5 -8 4 9
Total non-residential building -6 -1 1 1 -1 -4 4 -2 4 23 -20 3 -2 -5 2
Total engineering construction 3 -14 -15 6 5 5 8 0 -1 30 88 145 30 -154 75
Total construction 3 -16 -20 8 5 1 14 -2 4 57 74 143 21 -155 87
Percentage point contribution to growth:
Dwellings 5.3 -0.3 -5.4 0.7 1.7 -0.6 1.9 -0.2 1.0 2.7 3.7 -2.1 -2.0 1.0 3.7
Total non-residential building -5.2 -0.8 0.7 1.5 -1.4 -4.1 4.2 -1.4 3.5 19.7 -11.6 1.1 -0.4 -1.3 0.9
Total engineering construction 2.4 -11.4 -13.8 6.6 4.8 5.4 7.7 0.2 -1.3 25.6 50.0 58.2 7.7 -37.2 29.1
Total construction 2.4 -12.6 -18.5 8.8 5.1 0.6 13.8 -1.4 3.3 48.0 42.1 57.3 5.3 -37.5 33.7
Table 25 Formation of construction in Mackay (CVM $m)
2002 2003 2004 2005 2006 2007 2008 2009 2010 2011 2012 2013 2014 2015 2016
Change in:
Dwellings 38 51 22 110 137 82 37 -122 74 -93 -34 228 -55 -258 103
Total non-residential building 37 -3 -20 22 93 22 7 46 99 246 -370 218 -189 -89 76
Total engineering construction -11 65 -15 80 219 395 192 442 173 878 429 2569 1214 -307 -3074
Total construction 64 112 -13 212 450 500 237 366 347 1032 24 3014 971 -655 -2895
Percentage point contribution to growth:
Dwellings 4.9 6.1 2.3 11.8 12.0 5.2 1.8 -5.2 2.8 -3.0 -0.8 5.6 -0.8 -3.2 1.4
Total non-residential building 4.9 -0.4 -2.1 2.4 8.2 1.4 0.4 2.0 3.7 8.1 -9.1 5.3 -2.7 -1.1 1.0
Total engineering construction -1.4 7.8 -1.6 8.6 19.2 24.8 9.2 19.0 6.4 28.8 10.5 62.6 17.1 -3.8 -41.4
Total construction 8.3 13.5 -1.3 22.8 39.3 31.3 11.3 15.7 12.9 33.9 0.6 73.5 13.6 -8.1 -39.0

Queensland and Queensland region construction activity: Quarterly projection update – December quarter 2014 36
Table 26 Formation of construction in Northern (CVM $m)
2002 2003 2004 2005 2006 2007 2008 2009 2010 2011 2012 2013 2014 2015 2016
Change in:
Dwellings 128 26 -10 139 119 66 52 -25 -40 -166 -55 -41 -15 37 114
Total non-residential building -112 -14 -55 48 23 252 -146 -5 185 -174 216 141 -446 -28 30
Total engineering construction -15 95 -30 115 327 8 106 -131 100 -55 31 -63 -11 -105 651
Total construction 1 108 -95 301 470 326 12 -161 245 -394 192 36 -472 -96 795
Percentage point contribution to growth:
Dwellings 9.3 1.9 -0.7 10.0 7.1 3.1 2.1 -1.0 -1.7 -6.4 -2.5 -1.7 -0.6 1.9 6.2
Total non-residential building -8.1 -1.0 -3.7 3.4 1.3 11.7 -5.9 -0.2 7.9 -6.7 9.9 5.9 -18.5 -1.5 1.6
Total engineering construction -1.1 6.9 -2.0 8.2 19.4 0.4 4.3 -5.2 4.3 -2.1 1.4 -2.7 -0.4 -5.4 35.2
Total construction 0.0 7.8 -6.4 21.7 27.8 15.1 0.5 -6.5 10.5 -15.3 8.8 1.5 -19.5 -4.9 43.0
Table 27 Formation of construction in Far North (CVM $m)
2002 2003 2004 2005 2006 2007 2008 2009 2010 2011 2012 2013 2014 2015 2016
Change in:
Dwellings 50 79 82 117 127 109 115 -259 -132 -149 -23 -72 -71 64 154
Total non-residential building 46 7 15 74 -43 12 120 191 -246 64 76 -274 -27 2 52
Total engineering construction -28 50 -48 79 85 -28 7 13 -42 44 152 35 213 71 -380
Total construction 68 136 49 270 170 94 242 -54 -420 -41 205 -311 116 137 -175
Percentage point contribution to growth:
Dwellings 4.1 6.2 5.8 8.0 7.4 5.8 5.8 -11.6 -6.0 -8.5 -1.4 -3.7 -4.4 3.7 8.3
Total non-residential building 3.8 0.6 1.1 5.0 -2.5 0.6 6.0 8.6 -11.3 3.7 4.4 -14.3 -1.7 0.1 2.8
Total engineering construction -2.3 4.0 -3.4 5.4 4.9 -1.5 0.4 0.6 -1.9 2.5 8.8 1.8 13.3 4.1 -20.4
Total construction 5.6 10.7 3.5 18.5 9.8 4.9 12.2 -2.4 -19.3 -2.3 11.9 -16.2 7.2 7.9 -9.4

Queensland and Queensland region construction activity: Quarterly projection update – December quarter 2014 37
Table 28 Formation of construction in North West (CVM $m)
2002 2003 2004 2005 2006 2007 2008 2009 2010 2011 2012 2013 2014 2015 2016
Change in:
Dwellings 5 -1 -11 2 6 1 9 0 1 2 -1 -7 5 -3 15
Total non-residential building 11 -3 -1 -10 4 9 4 -14 17 31 -13 30 16 -62 29
Total engineering construction -4 11 -33 8 79 249 2 59 -100 231 251 270 166 -763 531
Total construction 12 7 -44 0 89 259 15 45 -82 264 237 293 187 -828 575
Percentage point contribution to growth:
Dwellings 2.1 -0.2 -4.2 0.8 2.9 0.3 1.5 0.1 0.1 0.4 -0.1 -0.7 0.4 -0.2 2.2
Total non-residential building 4.6 -1.3 -0.2 -4.8 1.9 3.0 0.7 -2.5 2.8 5.7 -1.6 2.9 1.2 -4.1 4.2
Total engineering construction -1.6 4.4 -13.2 4.1 38.2 84.3 0.4 10.4 -16.3 43.5 31.5 26.1 12.5 -50.5 77.7
Total construction 5.0 2.9 -17.6 0.1 42.9 87.6 2.6 8.0 -13.4 49.7 29.9 28.3 14.1 -54.8 84.1
Table 29 Formation of construction in Queensland (CVM $m)
2002 2003 2004 2005 2006 2007 2008 2009 2010 2011 2012 2013 2014 2015 2016
Change in:
Dwellings 3098 2443 1375 1007 509 1003 -130 -1584 -243 -1450 -740 -1711 664 1489 1147
Total non-residential building 140 -176 396 247 1112 926 330 586 315 478 -783 -680 332 -187 -63
Total engineering construction -322 1185 -328 1664 2720 2516 3306 3449 -1096 4507 11135 4307 2045 -7484 -3035
Total construction 2916 3452 1443 2919 4341 4445 3506 2451 -1023 3535 9613 1915 3041 -6182 -1951
Percentage point contribution to growth:
Dwellings 14.4 10.0 4.9 3.4 1.6 2.7 -0.3 -3.6 -0.5 -3.1 -1.5 -2.9 1.1 2.3 2.0
Total non-residential building 0.6 -0.7 1.4 0.8 3.4 2.5 0.8 1.3 0.7 1.0 -1.6 -1.1 0.5 -0.3 -0.1
Total engineering construction -1.5 4.8 -1.2 5.7 8.4 6.9 8.0 7.7 -2.3 9.8 22.5 7.3 3.3 -11.7 -5.2
Total construction 13.5 14.1 5.2 9.9 13.4 12.1 8.5 5.5 -2.2 7.7 19.4 3.2 5.0 -9.6 -3.4

Queensland and Queensland region construction activity: Quarterly projection update –
December quarter 2014
38 38 38 38 38 38
Appendix A
Detailed tables – 2009.3 to 2016.2
Queensland and Queensland region construction activity: Quarterly projection update – December quarter 2014 39
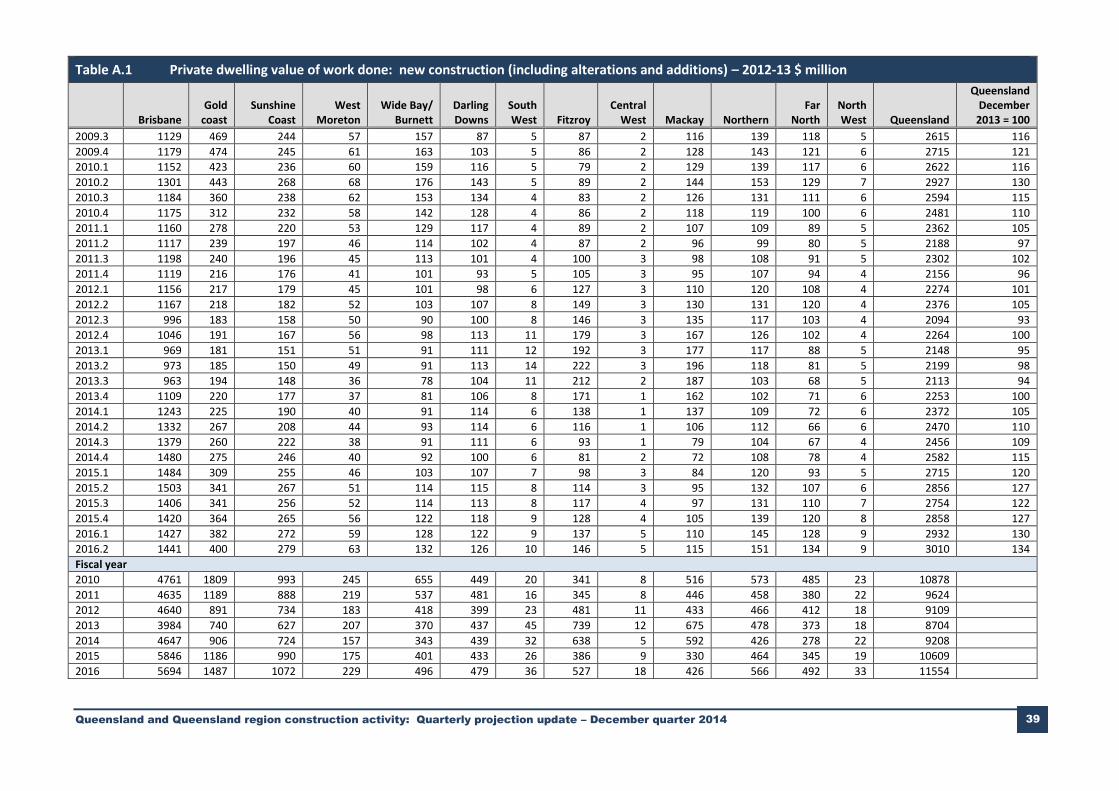
Table A.1 Private dwelling value of work done: new construction (including alterations and additions) – 2012-13 $ million
Brisbane Gold
coast Sunshine
Coast West
Moreton Wide Bay/
Burnett Darling Downs
South West Fitzroy
Central West Mackay Northern
Far North
North West Queensland
Queensland December
2013 = 100
2009.3 1129 469 244 57 157 87 5 87 2 116 139 118 5 2615 116
2009.4 1179 474 245 61 163 103 5 86 2 128 143 121 6 2715 121
2010.1 1152 423 236 60 159 116 5 79 2 129 139 117 6 2622 116
2010.2 1301 443 268 68 176 143 5 89 2 144 153 129 7 2927 130
2010.3 1184 360 238 62 153 134 4 83 2 126 131 111 6 2594 115
2010.4 1175 312 232 58 142 128 4 86 2 118 119 100 6 2481 110
2011.1 1160 278 220 53 129 117 4 89 2 107 109 89 5 2362 105
2011.2 1117 239 197 46 114 102 4 87 2 96 99 80 5 2188 97
2011.3 1198 240 196 45 113 101 4 100 3 98 108 91 5 2302 102
2011.4 1119 216 176 41 101 93 5 105 3 95 107 94 4 2156 96
2012.1 1156 217 179 45 101 98 6 127 3 110 120 108 4 2274 101
2012.2 1167 218 182 52 103 107 8 149 3 130 131 120 4 2376 105
2012.3 996 183 158 50 90 100 8 146 3 135 117 103 4 2094 93
2012.4 1046 191 167 56 98 113 11 179 3 167 126 102 4 2264 100
2013.1 969 181 151 51 91 111 12 192 3 177 117 88 5 2148 95
2013.2 973 185 150 49 91 113 14 222 3 196 118 81 5 2199 98
2013.3 963 194 148 36 78 104 11 212 2 187 103 68 5 2113 94
2013.4 1109 220 177 37 81 106 8 171 1 162 102 71 6 2253 100
2014.1 1243 225 190 40 91 114 6 138 1 137 109 72 6 2372 105
2014.2 1332 267 208 44 93 114 6 116 1 106 112 66 6 2470 110
2014.3 1379 260 222 38 91 111 6 93 1 79 104 67 4 2456 109
2014.4 1480 275 246 40 92 100 6 81 2 72 108 78 4 2582 115
2015.1 1484 309 255 46 103 107 7 98 3 84 120 93 5 2715 120
2015.2 1503 341 267 51 114 115 8 114 3 95 132 107 6 2856 127
2015.3 1406 341 256 52 114 113 8 117 4 97 131 110 7 2754 122
2015.4 1420 364 265 56 122 118 9 128 4 105 139 120 8 2858 127
2016.1 1427 382 272 59 128 122 9 137 5 110 145 128 9 2932 130
2016.2 1441 400 279 63 132 126 10 146 5 115 151 134 9 3010 134
Fiscal year
2010 4761 1809 993 245 655 449 20 341 8 516 573 485 23 10878
2011 4635 1189 888 219 537 481 16 345 8 446 458 380 22 9624
2012 4640 891 734 183 418 399 23 481 11 433 466 412 18 9109
2013 3984 740 627 207 370 437 45 739 12 675 478 373 18 8704
2014 4647 906 724 157 343 439 32 638 5 592 426 278 22 9208
2015 5846 1186 990 175 401 433 26 386 9 330 464 345 19 10609
2016 5694 1487 1072 229 496 479 36 527 18 426 566 492 33 11554

Queensland and Queensland region construction activity: Quarterly projection update – December quarter 2014 40
Table A.2 Private dwelling: other value of work done – 2012-13 $ million
Brisbane Gold
coast Sunshine
Coast West
Moreton Wide Bay/
Burnett Darling Downs
South West Fitzroy
Central West Mackay Northern
Far North
North West Queensland
Queensland December
2013 = 100
2009.3 625 262 167 26 84 50 4 51 1 47 69 88 2 1478 115
2009.4 702 294 187 30 95 56 5 57 2 53 77 98 2 1660 129
2010.1 696 291 185 30 94 56 5 57 2 53 76 97 2 1643 128
2010.2 716 299 190 31 97 58 5 58 2 55 79 99 2 1690 132
2010.3 672 280 177 29 91 54 5 55 2 52 74 93 2 1585 124
2010.4 671 279 176 29 91 55 5 54 2 52 74 92 2 1581 123
2011.1 701 198 126 26 80 75 7 57 3 38 53 65 2 1429 111
2011.2 774 197 125 28 84 87 8 63 3 38 53 65 2 1526 119
2011.3 844 209 133 31 91 96 8 68 4 40 56 69 2 1651 129
2011.4 750 214 137 28 85 79 7 61 3 42 58 71 2 1537 120
2012.1 760 247 158 30 91 74 7 62 3 48 67 82 2 1630 127
2012.2 685 230 147 27 83 65 6 56 2 45 63 76 2 1487 116
2012.3 612 199 128 24 74 59 5 50 2 40 55 66 2 1316 103
2012.4 595 206 132 24 73 55 5 49 2 42 57 69 2 1312 102
2013.1 536 196 126 22 68 47 4 45 2 40 55 66 2 1209 94
2013.2 553 207 134 24 71 48 4 47 2 44 58 70 2 1262 98
2013.3 555 215 139 24 72 47 4 48 2 46 61 73 2 1288 100
2013.4 553 213 138 24 72 47 5 49 2 47 61 72 2 1283 100
2014.1 576 221 143 25 74 49 5 51 2 49 63 75 2 1334 104
2014.2 567 216 140 24 73 48 5 51 2 49 62 73 2 1311 102
2014.3 567 215 139 24 72 48 5 51 2 48 62 72 2 1307 102
2014.4 576 216 141 25 73 49 5 51 2 49 62 73 2 1323 103
2015.1 585 218 142 25 73 49 5 52 2 49 63 73 2 1339 104
2015.2 593 220 144 25 74 50 5 52 2 50 64 74 2 1353 105
2015.3 599 221 145 25 74 50 5 53 2 50 64 74 2 1364 106
2015.4 604 222 145 25 75 51 5 53 2 51 65 74 2 1374 107
2016.1 608 222 146 26 75 51 5 53 2 51 65 74 2 1379 107
2016.2 612 223 146 26 75 51 5 54 2 51 65 75 2 1387 108
Fiscal year
2010 2739 1148 729 116 370 220 20 224 7 209 301 382 9 6472
2011 2818 954 604 112 345 271 24 228 9 180 254 315 8 6122
2012 3038 899 574 116 351 314 28 247 12 175 244 298 8 6304
2013 2297 808 520 95 286 209 19 191 7 166 225 271 7 5100
2014 2252 866 560 97 291 190 18 198 6 191 246 292 8 5216
2015 2321 869 566 99 293 196 19 205 6 197 251 292 8 5322
2016 2423 887 582 102 299 203 20 213 7 202 259 297 9 5504

Queensland and Queensland region construction activity: Quarterly projection update – December quarter 2014 41
Table A.3 Private dwelling: total value of work done – 2012-13 $ million
Brisbane Gold
coast Sunshine
Coast West
Moreton Wide Bay/
Burnett Darling Downs
South West Fitzroy
Central West Mackay Northern
Far North
North West Queensland
Queensland December
2013 = 100
2009.3 1754 731 412 83 241 137 9 138 4 163 207 206 7 4093 116
2009.4 1881 769 432 90 258 159 10 143 4 181 220 219 8 4375 124
2010.1 1848 714 421 89 253 171 10 136 3 182 215 214 8 4265 121
2010.2 2017 742 457 99 273 201 10 147 4 199 232 228 9 4617 131
2010.3 1855 640 416 91 243 188 9 137 3 178 205 204 8 4179 118
2010.4 1846 590 409 87 232 183 9 141 4 170 193 192 8 4062 115
2011.1 1861 477 346 80 209 192 11 145 5 144 162 154 7 3791 107
2011.2 1891 436 322 74 198 189 12 150 6 133 152 145 6 3714 105
2011.3 2042 449 330 76 204 197 13 168 6 138 164 160 7 3953 112
2011.4 1868 430 313 69 186 172 12 165 5 136 164 165 6 3693 104
2012.1 1916 463 337 75 193 172 12 189 5 158 187 189 7 3904 110
2012.2 1852 448 329 80 187 172 14 205 5 176 194 196 6 3863 109
2012.3 1608 382 286 75 164 159 14 196 5 175 172 169 6 3410 96
2012.4 1641 397 299 81 171 168 16 228 5 209 183 171 6 3576 101
2013.1 1505 377 277 74 159 158 16 237 5 218 171 154 6 3357 95
2013.2 1526 392 284 72 161 161 18 269 4 239 176 151 7 3461 98
2013.3 1519 409 287 60 151 151 16 260 3 234 164 141 7 3401 96
2013.4 1663 433 315 61 153 153 13 220 3 209 163 143 8 3536 100
2014.1 1819 446 333 65 165 163 11 189 3 186 172 147 8 3706 105
2014.2 1900 483 348 68 165 162 11 167 3 154 174 139 8 3781 107
2014.3 1946 475 361 62 164 159 11 144 3 128 166 139 6 3763 106
2014.4 2056 492 387 65 165 148 10 132 3 121 170 150 6 3905 110
2015.1 2069 527 398 71 177 157 11 150 4 133 183 166 7 4054 115
2015.2 2096 561 410 76 188 165 13 166 5 145 195 181 8 4208 119
2015.3 2005 562 401 77 189 163 13 170 5 147 195 184 9 4118 116
2015.4 2025 586 411 81 197 169 14 181 6 155 204 194 10 4231 120
2016.1 2035 604 418 85 202 173 14 190 6 161 210 202 11 4311 122
2016.2 2053 622 426 88 207 177 15 199 7 166 216 209 12 4397 124
Fiscal year
2010 7500 2956 1722 362 1025 669 40 564 14 725 874 866 32 17350
2011 7453 2143 1492 331 882 751 40 573 18 626 712 695 29 15746
2012 7678 1790 1308 300 769 713 51 727 23 608 709 710 26 15413
2013 6280 1548 1146 302 656 647 64 930 19 840 702 644 25 13804
2014 6900 1772 1284 254 634 628 50 836 11 783 673 570 30 14424
2015 8167 2055 1556 274 694 628 45 591 15 526 715 637 27 15931
2016 8117 2374 1655 331 795 682 56 740 25 628 825 789 42 17058

Queensland and Queensland region construction activity: Quarterly projection update – December quarter 2014 42
Table A.4 Private non-residential building value of work done – 2012-13 $ million
Brisbane Gold
coast Sunshine
Coast West
Moreton Wide Bay/
Burnett Darling Downs
South West Fitzroy
Central West Mackay Northern
Far North
North West Queensland
Queensland December
2013 = 100
2009.3 586 130 42 8 34 44 2 33 1 48 48 36 2 1016 79
2009.4 587 123 47 9 62 46 2 31 1 42 53 33 2 1037 81
2010.1 585 143 46 8 65 39 3 27 2 40 49 32 4 1043 81
2010.2 600 127 39 6 47 31 4 39 1 48 45 29 5 1022 80
2010.3 555 93 43 6 33 39 3 55 1 142 49 31 5 1055 82
2010.4 527 80 47 8 30 49 2 47 1 155 45 31 8 1028 80
2011.1 522 73 38 9 31 50 1 32 1 92 63 47 8 968 75
2011.2 724 87 30 9 32 53 7 31 1 56 85 60 8 1183 92
2011.3 741 79 47 7 26 49 9 35 1 38 62 40 6 1140 89
2011.4 687 87 63 8 23 43 6 44 1 47 89 39 3 1140 89
2012.1 617 96 94 8 21 41 4 85 1 61 90 38 5 1161 91
2012.2 555 75 83 7 15 34 7 112 1 69 55 29 5 1045 81
2012.3 610 59 56 5 12 34 10 131 1 77 34 23 4 1056 82
2012.4 614 85 45 5 15 39 11 133 1 82 32 19 3 1082 84
2013.1 608 112 40 6 16 60 7 167 0 83 50 20 10 1179 92
2013.2 595 107 32 7 31 80 5 190 3 71 61 20 17 1218 95
2013.3 501 92 282 6 43 74 5 160 5 51 53 16 15 1305 102
2013.4 498 91 349 5 37 59 5 104 4 44 42 19 24 1282 100
2014.1 575 144 254 5 37 54 4 65 2 60 44 31 28 1304 102
2014.2 614 361 130 4 35 52 5 38 1 65 41 33 17 1396 109
2014.3 681 411 62 4 31 55 7 26 0 59 34 27 6 1404 110
2014.4 716 302 59 6 35 68 9 30 0 50 42 27 6 1349 105
2015.1 741 186 62 8 43 67 6 46 0 36 64 27 7 1294 101
2015.2 698 148 108 7 44 59 4 63 1 37 66 26 9 1270 99
2015.3 630 153 138 7 40 57 5 72 2 46 57 31 11 1248 97
2015.4 619 173 182 8 40 60 6 88 2 61 52 40 15 1346 105
2016.1 609 169 171 9 39 58 6 84 2 60 52 40 14 1314 103
2016.2 626 173 168 9 40 59 6 84 2 61 54 43 14 1340 105
Fiscal year
2010 2358 522 173 31 208 160 11 131 5 179 196 130 13 4117
2011 2327 332 158 31 127 192 13 165 3 445 242 169 29 4234
2012 2600 338 286 30 84 167 26 276 3 216 297 145 19 4486
2013 2427 363 173 22 74 212 33 621 4 312 177 81 33 4535
2014 2189 688 1016 20 152 239 18 366 12 221 180 99 84 5285
2015 2836 1047 291 24 154 248 26 165 2 182 206 107 29 5316
2016 2484 669 659 34 159 234 22 328 9 228 215 154 54 5248

Queensland and Queensland region construction activity: Quarterly projection update – December quarter 2014 43
Table A.5 Public non-residential building value of work done – 2012-13 $ million
Brisbane Gold
coast Sunshine
Coast West
Moreton Wide Bay/
Burnett Darling Downs
South West Fitzroy
Central West Mackay Northern
Far North
North West Queensland
Queensland December
2013 = 100
2009.3 386 92 50 51 23 9 3 18 1 11 74 67 1 787 163
2009.4 377 115 45 22 46 24 5 27 0 21 118 43 4 847 176
2010.1 281 343 30 14 41 27 5 19 1 73 90 40 4 968 201
2010.2 253 457 22 12 32 27 6 20 3 94 65 38 8 1037 215
2010.3 381 448 26 14 29 29 9 29 5 90 47 40 13 1159 240
2010.4 561 216 32 11 31 23 8 29 6 52 33 36 10 1050 218
2011.1 595 32 28 9 37 20 4 42 11 25 33 34 5 876 182
2011.2 669 27 18 5 19 10 1 26 8 12 14 104 2 916 190
2011.3 560 44 15 4 9 6 0 13 3 5 6 108 2 776 161
2011.4 512 59 23 5 9 12 0 19 2 7 17 99 7 771 160
2012.1 383 64 26 6 15 16 1 28 1 9 93 66 9 718 149
2012.2 239 120 19 7 18 14 3 35 4 18 172 41 11 701 145
2012.3 127 134 9 4 10 6 4 27 5 26 115 33 17 518 107
2012.4 103 90 18 9 7 2 5 80 4 52 179 32 15 596 124
2013.1 158 36 21 8 7 2 5 102 2 48 162 23 8 582 121
2013.2 245 14 18 5 11 4 5 92 1 33 94 15 4 542 112
2013.3 340 13 18 9 17 7 5 80 0 24 38 12 3 567 118
2013.4 266 36 18 15 19 14 5 50 0 19 22 16 3 482 100
2014.1 192 39 19 12 19 13 3 31 1 13 24 16 2 384 80
2014.2 199 45 25 5 24 24 1 22 1 7 16 15 1 386 80
2014.3 156 30 14 2 20 26 0 14 1 3 9 12 1 287 60
2014.4 271 30 14 3 25 55 1 17 2 2 12 16 1 450 93
2015.1 265 15 20 4 15 67 2 17 2 2 11 12 0 431 89
2015.2 242 13 41 5 10 63 2 21 2 5 15 14 1 432 90
2015.3 238 22 31 7 14 39 3 29 1 8 16 14 1 423 88
2015.4 234 31 21 10 19 15 3 36 0 12 18 15 1 415 86
2016.1 213 29 20 9 17 14 3 31 0 11 17 14 1 381 79
2016.2 216 31 22 10 17 15 3 29 0 11 17 15 1 388 81
Fiscal year
2010 1296 1007 148 99 142 87 19 84 6 199 347 188 16 3639
2011 2207 724 104 39 116 82 22 127 30 179 127 213 31 4001
2012 1694 288 84 22 51 48 6 95 10 38 289 314 28 2966
2013 633 273 66 26 36 14 19 301 12 160 549 104 44 2237
2014 998 133 80 40 79 57 15 184 2 62 100 60 9 1819
2015 934 87 90 13 70 211 5 69 7 12 46 53 2 1600
2016 900 113 94 36 68 83 11 124 3 42 68 58 5 1606

Queensland and Queensland region construction activity: Quarterly projection update – December quarter 2014 44
Table A.6 Total non-residential building value of work done – 2012-13 $ million
Brisbane Gold
coast Sunshine
Coast West
Moreton Wide Bay/
Burnett Darling Downs
South West Fitzroy
Central West Mackay Northern
Far North
North West Queensland
Queensland December
2013 = 100
2009.3 972 222 93 60 57 53 5 52 1 60 122 104 3 1803 102
2009.4 964 238 92 31 108 70 7 58 1 63 171 75 6 1884 107
2010.1 866 486 75 22 106 66 8 46 3 113 139 72 8 2011 114
2010.2 853 584 61 18 80 58 10 59 4 142 110 67 13 2059 117
2010.3 936 540 69 19 63 68 11 84 6 232 96 71 18 2214 126
2010.4 1088 296 79 19 61 71 10 77 7 207 78 67 18 2078 118
2011.1 1117 105 66 18 68 71 6 74 12 118 96 81 14 1844 105
2011.2 1393 115 48 14 51 64 8 57 8 68 99 164 10 2099 119
2011.3 1301 123 62 11 35 55 10 48 4 43 69 148 8 1916 109
2011.4 1199 146 86 12 32 56 6 63 2 54 106 139 10 1911 108
2012.1 1000 161 120 14 35 57 6 113 2 70 184 104 14 1880 107
2012.2 794 196 102 14 33 47 10 147 5 87 227 69 16 1745 99
2012.3 737 193 66 9 23 40 14 158 6 103 149 56 21 1574 89
2012.4 717 175 63 13 22 41 15 213 5 134 210 51 18 1678 95
2013.1 766 147 61 15 24 61 13 269 2 131 212 43 18 1761 100
2013.2 840 121 50 12 42 84 10 282 3 104 155 35 21 1760 100
2013.3 841 106 300 15 60 81 10 240 5 75 91 28 18 1872 106
2013.4 765 126 367 20 56 73 10 154 4 63 65 35 27 1764 100
2014.1 767 183 274 17 56 67 7 95 3 73 68 47 30 1687 96
2014.2 814 406 155 10 59 76 6 60 2 72 56 48 18 1781 101
2014.3 837 442 76 5 52 81 8 40 1 62 42 39 7 1691 96
2014.4 987 332 73 9 61 123 10 47 2 53 54 43 6 1799 102
2015.1 1007 200 83 11 58 134 8 63 2 38 75 39 8 1725 98
2015.2 940 161 149 12 54 122 6 84 3 42 81 39 10 1702 96
2015.3 867 175 168 15 54 95 7 100 3 55 73 45 13 1671 95
2015.4 853 204 203 18 59 75 9 124 3 73 70 54 16 1761 100
2016.1 823 199 192 18 56 73 8 115 3 70 69 55 15 1695 96
2016.2 842 204 190 19 58 74 9 113 3 72 71 58 15 1728 98
Fiscal year
2010 3654 1530 321 130 350 248 30 214 10 378 543 319 29 7757
2011 4534 1056 262 69 243 274 35 292 33 625 369 383 60 8235
2012 4294 626 370 51 135 215 31 371 13 254 586 459 47 7452
2013 3060 636 239 49 110 227 52 922 16 472 726 185 78 6772
2014 3187 821 1095 61 231 296 33 550 14 283 280 158 93 7104
2015 3770 1134 381 37 224 459 31 235 9 194 252 161 31 6917
2016 3385 782 753 70 227 317 33 452 11 270 283 212 59 6854
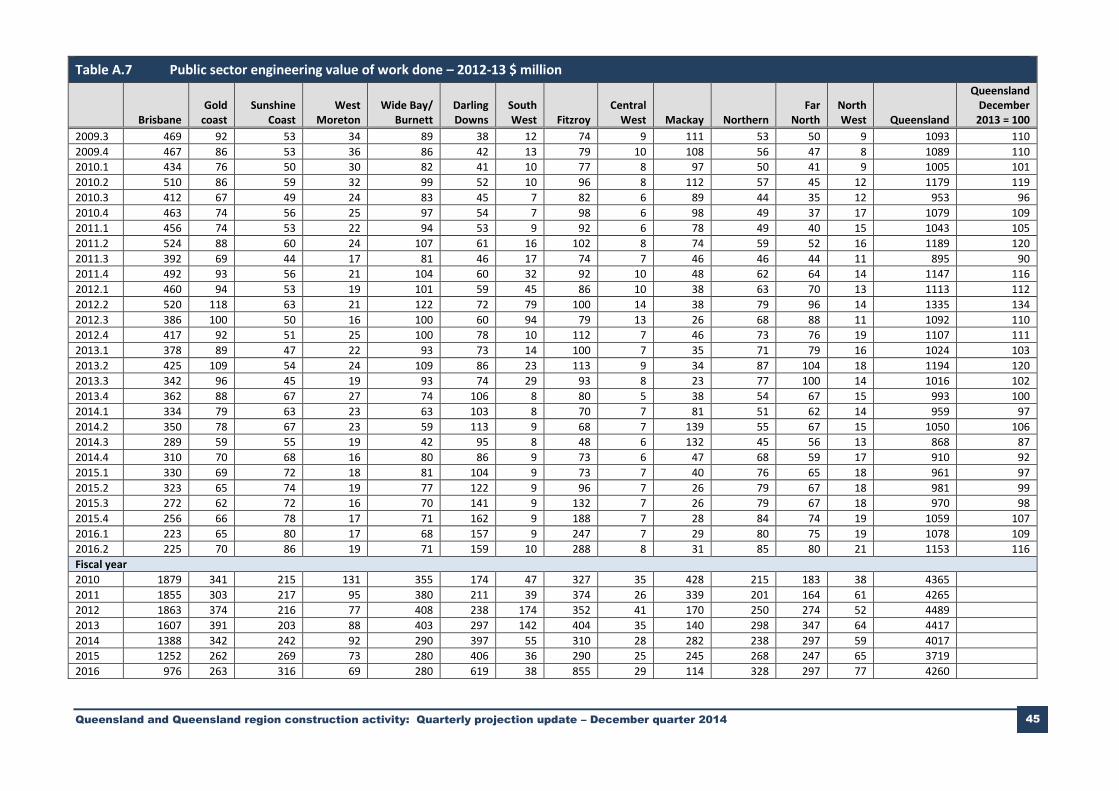
Queensland and Queensland region construction activity: Quarterly projection update – December quarter 2014 45
Table A.7 Public sector engineering value of work done – 2012-13 $ million
Brisbane Gold
coast Sunshine
Coast West
Moreton Wide Bay/
Burnett Darling Downs
South West Fitzroy
Central West Mackay Northern
Far North
North West Queensland
Queensland December
2013 = 100
2009.3 469 92 53 34 89 38 12 74 9 111 53 50 9 1093 110
2009.4 467 86 53 36 86 42 13 79 10 108 56 47 8 1089 110
2010.1 434 76 50 30 82 41 10 77 8 97 50 41 9 1005 101
2010.2 510 86 59 32 99 52 10 96 8 112 57 45 12 1179 119
2010.3 412 67 49 24 83 45 7 82 6 89 44 35 12 953 96
2010.4 463 74 56 25 97 54 7 98 6 98 49 37 17 1079 109
2011.1 456 74 53 22 94 53 9 92 6 78 49 40 15 1043 105
2011.2 524 88 60 24 107 61 16 102 8 74 59 52 16 1189 120
2011.3 392 69 44 17 81 46 17 74 7 46 46 44 11 895 90
2011.4 492 93 56 21 104 60 32 92 10 48 62 64 14 1147 116
2012.1 460 94 53 19 101 59 45 86 10 38 63 70 13 1113 112
2012.2 520 118 63 21 122 72 79 100 14 38 79 96 14 1335 134
2012.3 386 100 50 16 100 60 94 79 13 26 68 88 11 1092 110
2012.4 417 92 51 25 100 78 10 112 7 46 73 76 19 1107 111
2013.1 378 89 47 22 93 73 14 100 7 35 71 79 16 1024 103
2013.2 425 109 54 24 109 86 23 113 9 34 87 104 18 1194 120
2013.3 342 96 45 19 93 74 29 93 8 23 77 100 14 1016 102
2013.4 362 88 67 27 74 106 8 80 5 38 54 67 15 993 100
2014.1 334 79 63 23 63 103 8 70 7 81 51 62 14 959 97
2014.2 350 78 67 23 59 113 9 68 7 139 55 67 15 1050 106
2014.3 289 59 55 19 42 95 8 48 6 132 45 56 13 868 87
2014.4 310 70 68 16 80 86 9 73 6 47 68 59 17 910 92
2015.1 330 69 72 18 81 104 9 73 7 40 76 65 18 961 97
2015.2 323 65 74 19 77 122 9 96 7 26 79 67 18 981 99
2015.3 272 62 72 16 70 141 9 132 7 26 79 67 18 970 98
2015.4 256 66 78 17 71 162 9 188 7 28 84 74 19 1059 107
2016.1 223 65 80 17 68 157 9 247 7 29 80 75 19 1078 109
2016.2 225 70 86 19 71 159 10 288 8 31 85 80 21 1153 116
Fiscal year
2010 1879 341 215 131 355 174 47 327 35 428 215 183 38 4365
2011 1855 303 217 95 380 211 39 374 26 339 201 164 61 4265
2012 1863 374 216 77 408 238 174 352 41 170 250 274 52 4489
2013 1607 391 203 88 403 297 142 404 35 140 298 347 64 4417
2014 1388 342 242 92 290 397 55 310 28 282 238 297 59 4017
2015 1252 262 269 73 280 406 36 290 25 245 268 247 65 3719
2016 976 263 316 69 280 619 38 855 29 114 328 297 77 4260

Queensland and Queensland region construction activity: Quarterly projection update – December quarter 2014 46
Table A.8 Private sector engineering value of work done – 2012-13 $ million
Brisbane Gold
coast Sunshine
Coast West
Moreton Wide Bay/
Burnett Darling Downs
South West Fitzroy
Central West Mackay Northern
Far North
North West Queensland
Queensland December
2013 = 100
2009.3 1863 358 158 38 20 326 164 658 15 310 195 92 110 4307 43
2009.4 1689 337 149 36 21 302 123 603 14 307 213 86 98 3977 39
2010.1 1678 353 170 40 24 324 24 692 16 355 252 99 97 4123 41
2010.2 1266 219 286 34 18 240 20 717 13 525 194 83 125 3738 37
2010.3 1345 242 369 37 15 375 22 853 15 622 198 91 151 4335 43
2010.4 1365 253 386 39 16 392 23 904 15 650 175 95 145 4458 44
2011.1 1565 291 441 45 18 582 315 1028 31 687 200 109 120 5432 54
2011.2 1764 337 511 52 21 679 663 1370 36 503 241 127 224 6527 65
2011.3 1549 277 420 42 30 569 644 2301 30 410 200 114 205 6792 67
2011.4 1576 279 360 43 34 618 626 3454 30 446 201 118 206 7988 79
2012.1 1692 295 192 45 36 706 790 2736 48 1056 212 125 218 8150 81
2012.2 1466 253 176 38 45 681 860 3441 64 1149 181 107 270 8732 86
2012.3 1579 241 172 37 48 682 752 3575 71 1301 173 102 282 9013 89
2012.4 1295 229 163 35 71 682 798 3748 78 1364 164 118 308 9055 90
2013.1 1368 255 182 39 111 803 914 3496 90 1568 182 108 297 9414 93
2013.2 1256 231 165 35 75 742 777 3240 83 1426 164 98 268 8560 85
2013.3 1449 285 204 43 60 915 716 4060 103 1787 203 121 401 10348 102
2013.4 1378 272 194 41 71 895 773 3938 99 1754 192 112 393 10112 100
2014.1 1219 246 176 37 68 906 620 3718 89 1573 174 206 297 9328 92
2014.2 1131 236 165 35 58 856 453 3427 68 1617 164 251 236 8698 86
2014.3 1108 250 164 37 36 551 435 3110 66 1659 167 305 126 8015 79
2014.4 1153 265 174 39 63 513 362 3506 58 1606 176 276 161 8352 83
2015.1 926 212 140 31 59 475 290 3398 46 1610 141 126 149 7603 75
2015.2 791 173 114 25 47 473 235 3509 38 1586 114 103 122 7330 72
2015.3 643 143 96 21 35 609 193 3981 31 1143 94 85 253 7326 72
2015.4 568 134 91 20 21 628 180 3928 29 868 326 102 284 7178 71
2016.1 498 129 88 17 7 574 160 3691 26 761 375 98 253 6677 66
2016.2 516 138 84 18 7 577 128 3357 194 747 394 96 286 6543 65
Fiscal year
2010 6495 1268 762 148 83 1192 330 2669 59 1496 854 359 431 16144
2011 6039 1123 1706 173 70 2028 1022 4156 98 2463 813 422 639 20752
2012 6283 1104 1148 168 144 2575 2920 11932 171 3061 794 463 898 31663
2013 5497 956 682 145 305 2909 3241 14059 322 5660 683 426 1156 36041
2014 5176 1038 739 156 257 3572 2562 15144 360 6732 733 690 1327 38486
2015 3979 900 592 133 205 2012 1321 13522 208 6461 597 810 558 31300
2016 2226 544 360 76 70 2388 661 14957 279 3519 1188 381 1077 27725

Queensland and Queensland region construction activity: Quarterly projection update – December quarter 2014 47
Table A.9 Total engineering value of work done – 2012-13 $ million
Brisbane Gold
coast Sunshine
Coast West
Moreton Wide Bay/
Burnett Darling Downs
South West Fitzroy
Central West Mackay Northern
Far North
North West Queensland
Queensland December
2013 = 100
2009.3 2331 450 211 71 109 364 176 733 24 421 248 141 119 5400 49
2009.4 2156 423 202 71 107 344 136 682 24 414 269 133 106 5066 46
2010.1 2111 430 219 70 106 365 34 769 24 452 302 139 106 5128 46
2010.2 1776 305 345 66 117 292 30 813 22 636 250 128 138 4917 44
2010.3 1757 309 417 61 98 420 29 935 21 711 242 126 163 5288 48
2010.4 1829 327 442 64 112 446 29 1002 21 749 223 132 161 5537 50
2011.1 2021 365 494 67 112 634 325 1120 38 766 249 150 135 6475 58
2011.2 2288 425 570 76 128 740 678 1472 44 577 299 179 241 7716 69
2011.3 1941 347 464 59 111 616 661 2375 36 456 246 158 217 7687 69
2011.4 2068 372 415 63 138 678 658 3545 39 494 263 182 220 9135 82
2012.1 2152 389 245 64 137 765 835 2823 58 1095 275 195 230 9263 83
2012.2 1986 370 239 60 167 753 939 3541 78 1186 261 202 284 10067 91
2012.3 1965 341 222 53 148 741 846 3655 83 1327 240 190 293 10104 91
2012.4 1713 321 215 60 172 760 808 3860 85 1410 237 194 327 10161 92
2013.1 1746 344 229 61 204 876 928 3596 97 1603 253 187 314 10438 94
2013.2 1681 339 219 59 184 829 800 3353 92 1460 251 202 286 9754 88
2013.3 1791 382 249 62 153 989 745 4153 112 1811 280 221 415 11364 102
2013.4 1740 360 261 68 146 1002 781 4018 104 1793 247 179 408 11104 100
2014.1 1553 324 239 60 131 1009 628 3788 96 1654 225 268 311 10286 93
2014.2 1481 314 232 58 117 969 463 3495 75 1756 219 319 251 9748 88
2014.3 1397 309 220 57 78 646 442 3158 72 1791 212 362 139 8883 80
2014.4 1463 334 242 56 144 598 371 3579 64 1653 244 335 177 9261 83
2015.1 1256 281 212 50 140 579 299 3471 53 1650 217 191 167 8564 77
2015.2 1114 238 188 44 124 595 245 3604 44 1612 193 171 140 8311 75
2015.3 915 204 168 37 105 751 201 4112 37 1169 173 152 270 8296 75
2015.4 824 200 169 37 92 789 190 4116 36 896 410 177 303 8238 74
2016.1 722 195 168 34 75 730 169 3939 33 789 455 173 273 7755 70
2016.2 741 208 170 37 78 736 138 3645 202 778 478 176 307 7696 69
Fiscal year
2010 8374 1609 977 279 438 1365 377 2996 94 1924 1068 542 468 20510
2011 7894 1426 1923 267 450 2240 1061 4529 124 2802 1014 586 700 25017
2012 8147 1478 1364 246 553 2812 3093 12284 212 3231 1045 738 951 36152
2013 7104 1347 885 232 708 3206 3383 14463 357 5799 981 773 1220 40458
2014 6564 1380 981 248 547 3969 2617 15454 387 7014 970 987 1386 42503
2015 5231 1162 861 206 485 2418 1357 13812 233 6706 866 1058 623 35019
2016 3202 807 675 144 350 3007 699 15812 309 3632 1516 677 1154 31984
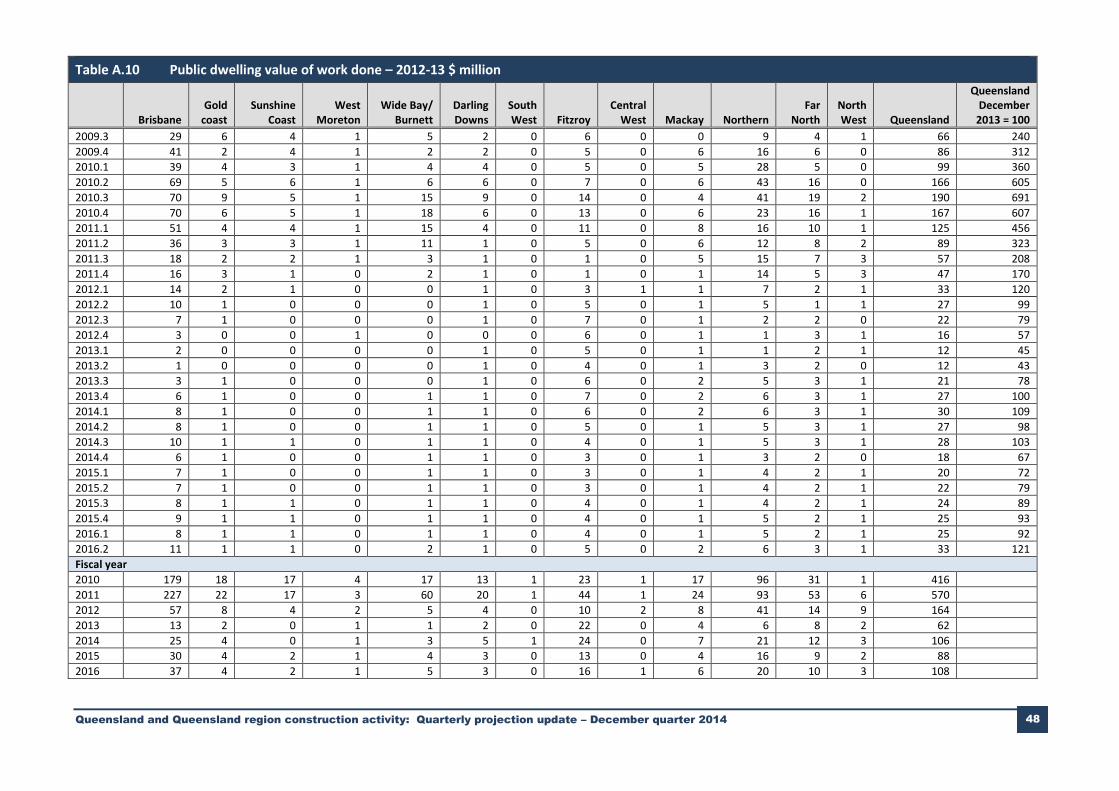
Queensland and Queensland region construction activity: Quarterly projection update – December quarter 2014 48
Table A.10 Public dwelling value of work done – 2012-13 $ million
Brisbane Gold
coast Sunshine
Coast West
Moreton Wide Bay/
Burnett Darling Downs
South West Fitzroy
Central West Mackay Northern
Far North
North West Queensland
Queensland December
2013 = 100
2009.3 29 6 4 1 5 2 0 6 0 0 9 4 1 66 240
2009.4 41 2 4 1 2 2 0 5 0 6 16 6 0 86 312
2010.1 39 4 3 1 4 4 0 5 0 5 28 5 0 99 360
2010.2 69 5 6 1 6 6 0 7 0 6 43 16 0 166 605
2010.3 70 9 5 1 15 9 0 14 0 4 41 19 2 190 691
2010.4 70 6 5 1 18 6 0 13 0 6 23 16 1 167 607
2011.1 51 4 4 1 15 4 0 11 0 8 16 10 1 125 456
2011.2 36 3 3 1 11 1 0 5 0 6 12 8 2 89 323
2011.3 18 2 2 1 3 1 0 1 0 5 15 7 3 57 208
2011.4 16 3 1 0 2 1 0 1 0 1 14 5 3 47 170
2012.1 14 2 1 0 0 1 0 3 1 1 7 2 1 33 120
2012.2 10 1 0 0 0 1 0 5 0 1 5 1 1 27 99
2012.3 7 1 0 0 0 1 0 7 0 1 2 2 0 22 79
2012.4 3 0 0 1 0 0 0 6 0 1 1 3 1 16 57
2013.1 2 0 0 0 0 1 0 5 0 1 1 2 1 12 45
2013.2 1 0 0 0 0 1 0 4 0 1 3 2 0 12 43
2013.3 3 1 0 0 0 1 0 6 0 2 5 3 1 21 78
2013.4 6 1 0 0 1 1 0 7 0 2 6 3 1 27 100
2014.1 8 1 0 0 1 1 0 6 0 2 6 3 1 30 109
2014.2 8 1 0 0 1 1 0 5 0 1 5 3 1 27 98
2014.3 10 1 1 0 1 1 0 4 0 1 5 3 1 28 103
2014.4 6 1 0 0 1 1 0 3 0 1 3 2 0 18 67
2015.1 7 1 0 0 1 1 0 3 0 1 4 2 1 20 72
2015.2 7 1 0 0 1 1 0 3 0 1 4 2 1 22 79
2015.3 8 1 1 0 1 1 0 4 0 1 4 2 1 24 89
2015.4 9 1 1 0 1 1 0 4 0 1 5 2 1 25 93
2016.1 8 1 1 0 1 1 0 4 0 1 5 2 1 25 92
2016.2 11 1 1 0 2 1 0 5 0 2 6 3 1 33 121
Fiscal year
2010 179 18 17 4 17 13 1 23 1 17 96 31 1 416
2011 227 22 17 3 60 20 1 44 1 24 93 53 6 570
2012 57 8 4 2 5 4 0 10 2 8 41 14 9 164
2013 13 2 0 1 1 2 0 22 0 4 6 8 2 62
2014 25 4 0 1 3 5 1 24 0 7 21 12 3 106
2015 30 4 2 1 4 3 0 13 0 4 16 9 2 88
2016 37 4 2 1 5 3 0 16 1 6 20 10 3 108
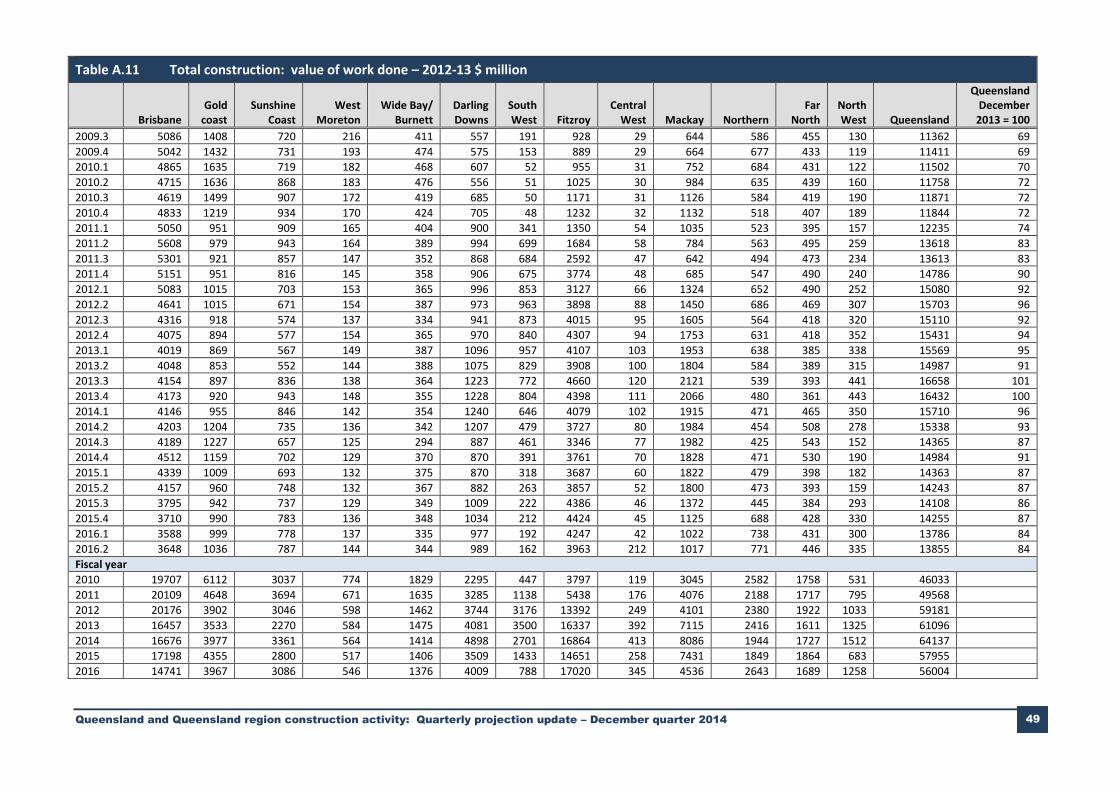
Queensland and Queensland region construction activity: Quarterly projection update – December quarter 2014 49
Table A.11 Total construction: value of work done – 2012-13 $ million
Brisbane Gold
coast Sunshine
Coast West
Moreton Wide Bay/
Burnett Darling Downs
South West Fitzroy
Central West Mackay Northern
Far North
North West Queensland
Queensland December
2013 = 100
2009.3 5086 1408 720 216 411 557 191 928 29 644 586 455 130 11362 69
2009.4 5042 1432 731 193 474 575 153 889 29 664 677 433 119 11411 69
2010.1 4865 1635 719 182 468 607 52 955 31 752 684 431 122 11502 70
2010.2 4715 1636 868 183 476 556 51 1025 30 984 635 439 160 11758 72
2010.3 4619 1499 907 172 419 685 50 1171 31 1126 584 419 190 11871 72
2010.4 4833 1219 934 170 424 705 48 1232 32 1132 518 407 189 11844 72
2011.1 5050 951 909 165 404 900 341 1350 54 1035 523 395 157 12235 74
2011.2 5608 979 943 164 389 994 699 1684 58 784 563 495 259 13618 83
2011.3 5301 921 857 147 352 868 684 2592 47 642 494 473 234 13613 83
2011.4 5151 951 816 145 358 906 675 3774 48 685 547 490 240 14786 90
2012.1 5083 1015 703 153 365 996 853 3127 66 1324 652 490 252 15080 92
2012.2 4641 1015 671 154 387 973 963 3898 88 1450 686 469 307 15703 96
2012.3 4316 918 574 137 334 941 873 4015 95 1605 564 418 320 15110 92
2012.4 4075 894 577 154 365 970 840 4307 94 1753 631 418 352 15431 94
2013.1 4019 869 567 149 387 1096 957 4107 103 1953 638 385 338 15569 95
2013.2 4048 853 552 144 388 1075 829 3908 100 1804 584 389 315 14987 91
2013.3 4154 897 836 138 364 1223 772 4660 120 2121 539 393 441 16658 101
2013.4 4173 920 943 148 355 1228 804 4398 111 2066 480 361 443 16432 100
2014.1 4146 955 846 142 354 1240 646 4079 102 1915 471 465 350 15710 96
2014.2 4203 1204 735 136 342 1207 479 3727 80 1984 454 508 278 15338 93
2014.3 4189 1227 657 125 294 887 461 3346 77 1982 425 543 152 14365 87
2014.4 4512 1159 702 129 370 870 391 3761 70 1828 471 530 190 14984 91
2015.1 4339 1009 693 132 375 870 318 3687 60 1822 479 398 182 14363 87
2015.2 4157 960 748 132 367 882 263 3857 52 1800 473 393 159 14243 87
2015.3 3795 942 737 129 349 1009 222 4386 46 1372 445 384 293 14108 86
2015.4 3710 990 783 136 348 1034 212 4424 45 1125 688 428 330 14255 87
2016.1 3588 999 778 137 335 977 192 4247 42 1022 738 431 300 13786 84
2016.2 3648 1036 787 144 344 989 162 3963 212 1017 771 446 335 13855 84
Fiscal year
2010 19707 6112 3037 774 1829 2295 447 3797 119 3045 2582 1758 531 46033
2011 20109 4648 3694 671 1635 3285 1138 5438 176 4076 2188 1717 795 49568
2012 20176 3902 3046 598 1462 3744 3176 13392 249 4101 2380 1922 1033 59181
2013 16457 3533 2270 584 1475 4081 3500 16337 392 7115 2416 1611 1325 61096
2014 16676 3977 3361 564 1414 4898 2701 16864 413 8086 1944 1727 1512 64137
2015 17198 4355 2800 517 1406 3509 1433 14651 258 7431 1849 1864 683 57955
2016 14741 3967 3086 546 1376 4009 788 17020 345 4536 2643 1689 1258 56004