nicky shree shrestha
TRANSCRIPT
Extreme Weather Events in Nepal: Trends and Projections
Nicky Shree Shrestha The Small Earth Nepal, Kathmandu University
Piyush Dahal The Small Earth Nepal
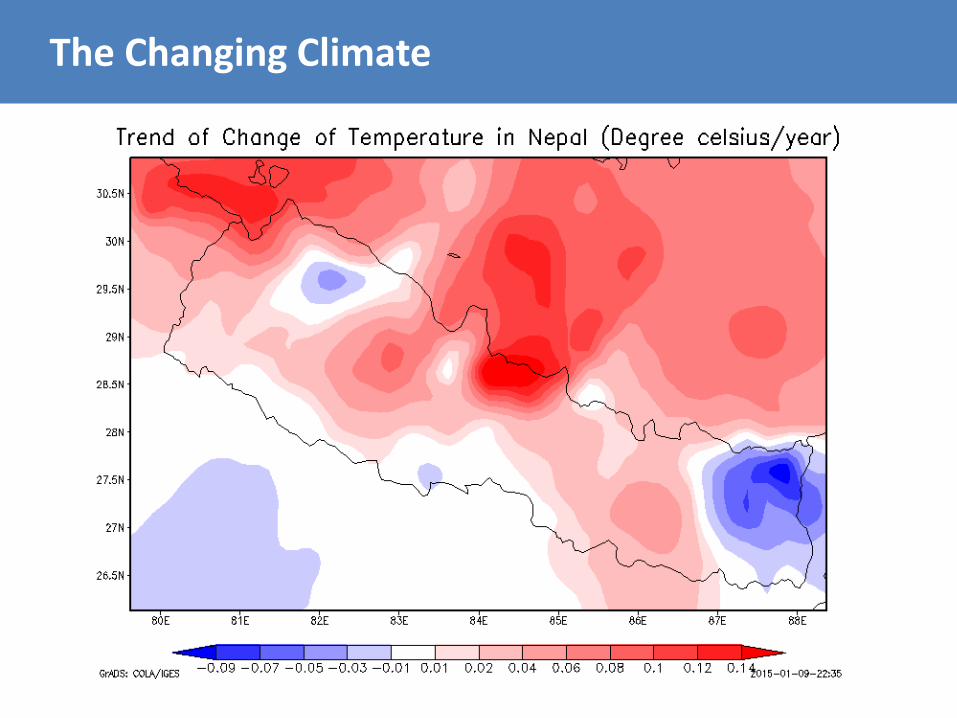
The Changing Climate
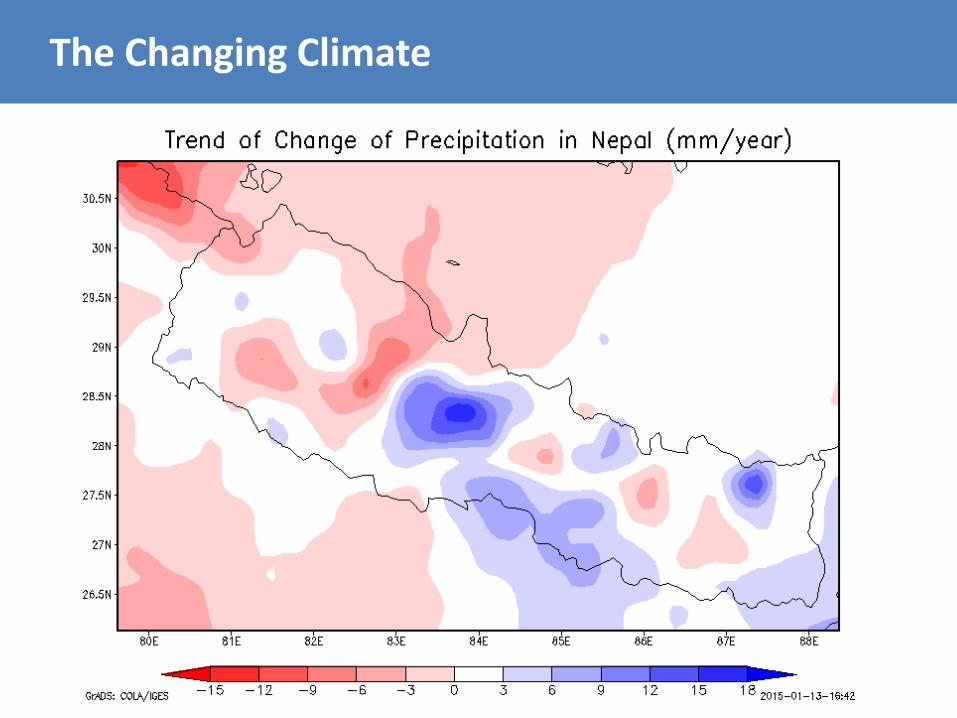
The Changing Climate
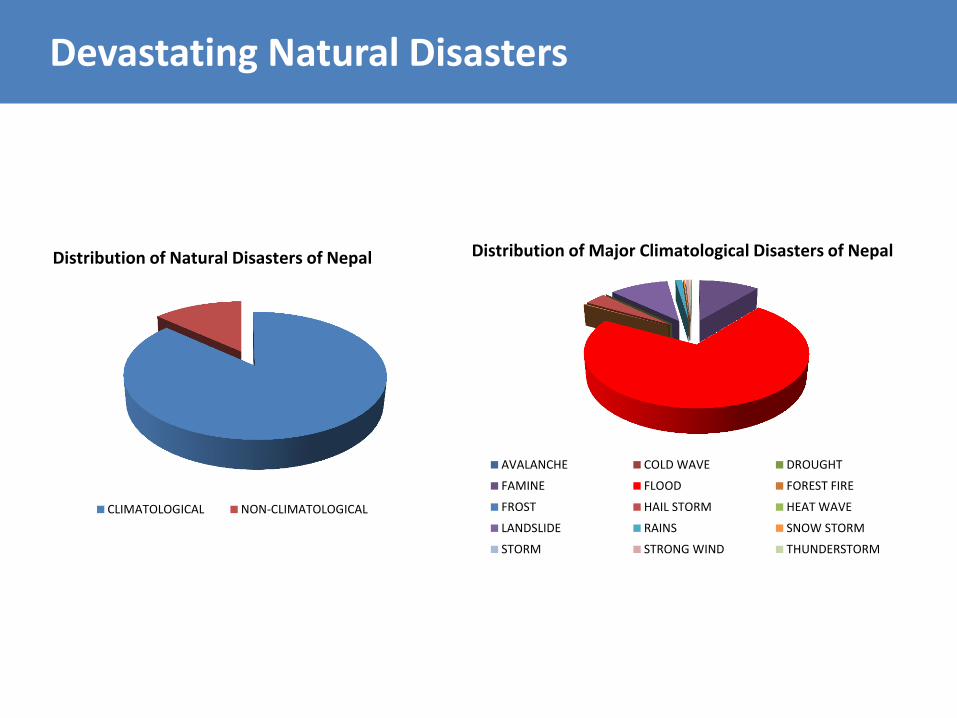
Devastating Natural Disasters
CLIMATOLOGICAL NON-CLIMATOLOGICAL
Distribution of Natural Disasters of Nepal
AVALANCHE COLD WAVE DROUGHT
FAMINE FLOOD FOREST FIRE
FROST HAIL STORM HEAT WAVE
LANDSLIDE RAINS SNOW STORM
STORM STRONG WIND THUNDERSTORM
Distribution of Major Climatological Disasters of Nepal
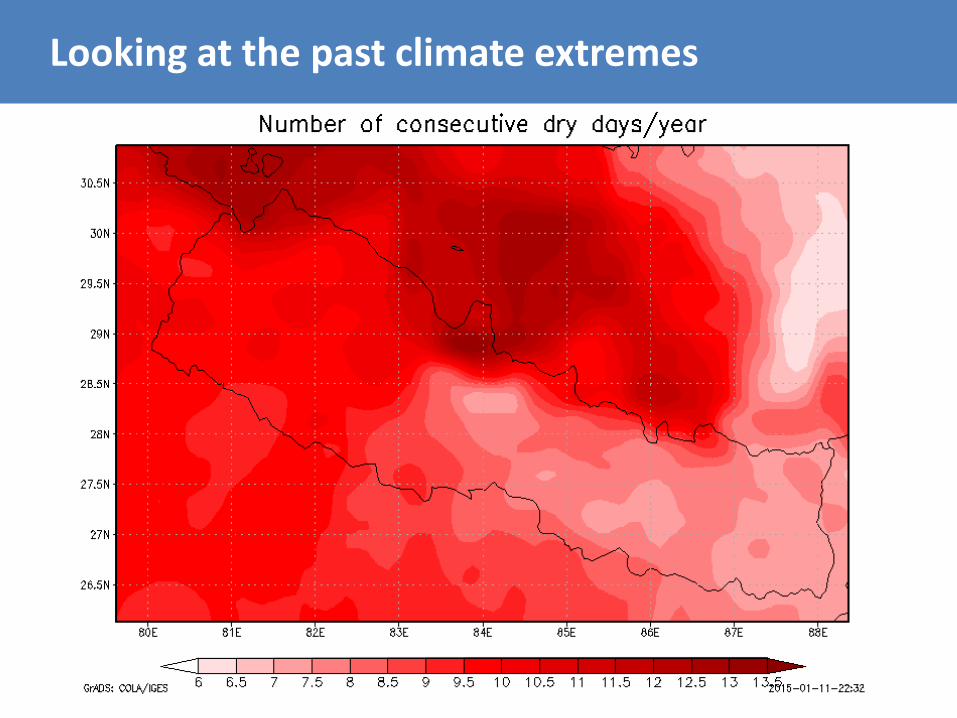
Looking at the past climate extremes
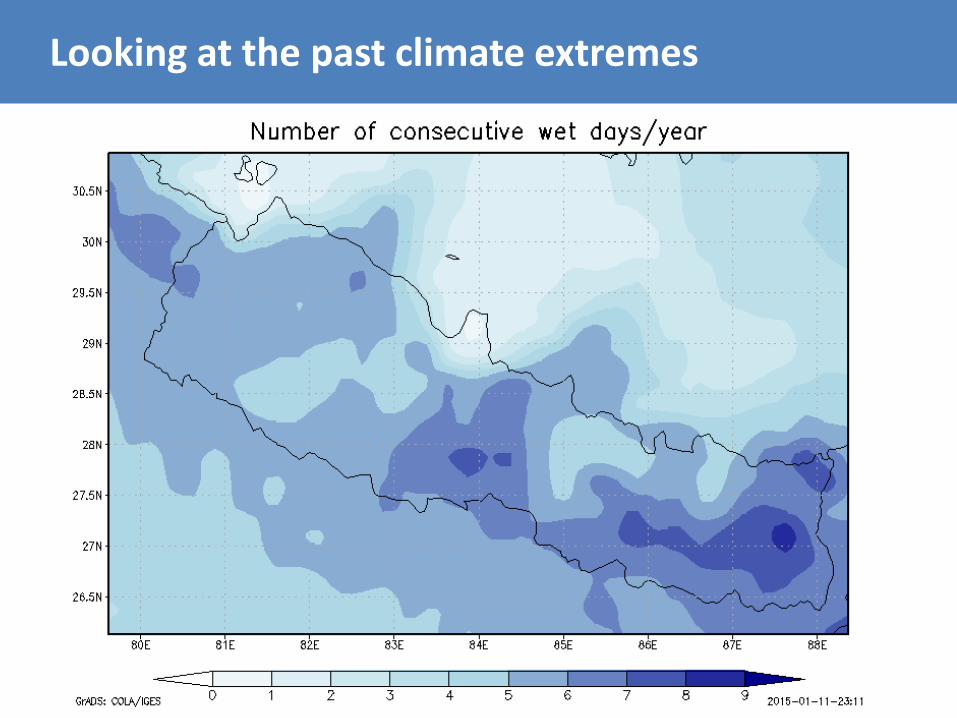
Looking at the past climate extremes
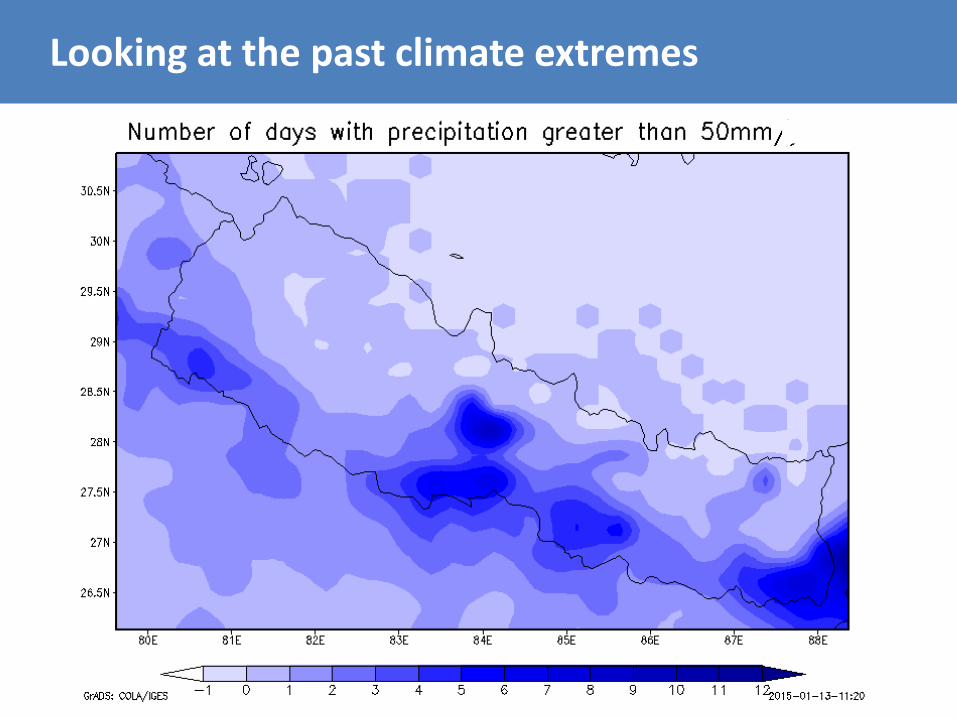
Looking at the past climate extremes
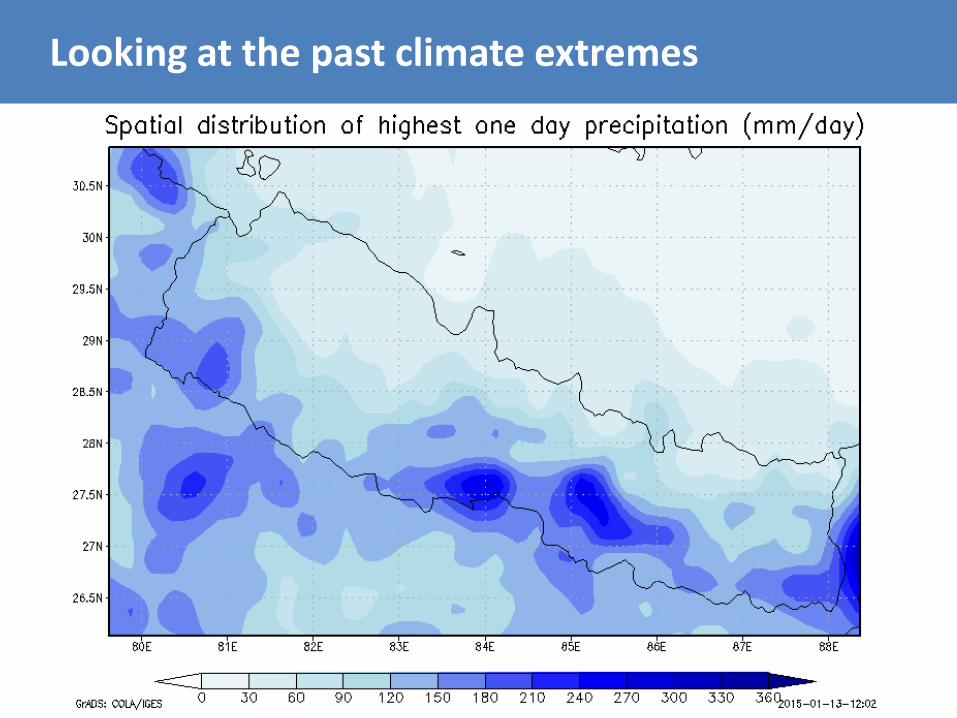
Looking at the past climate extremes
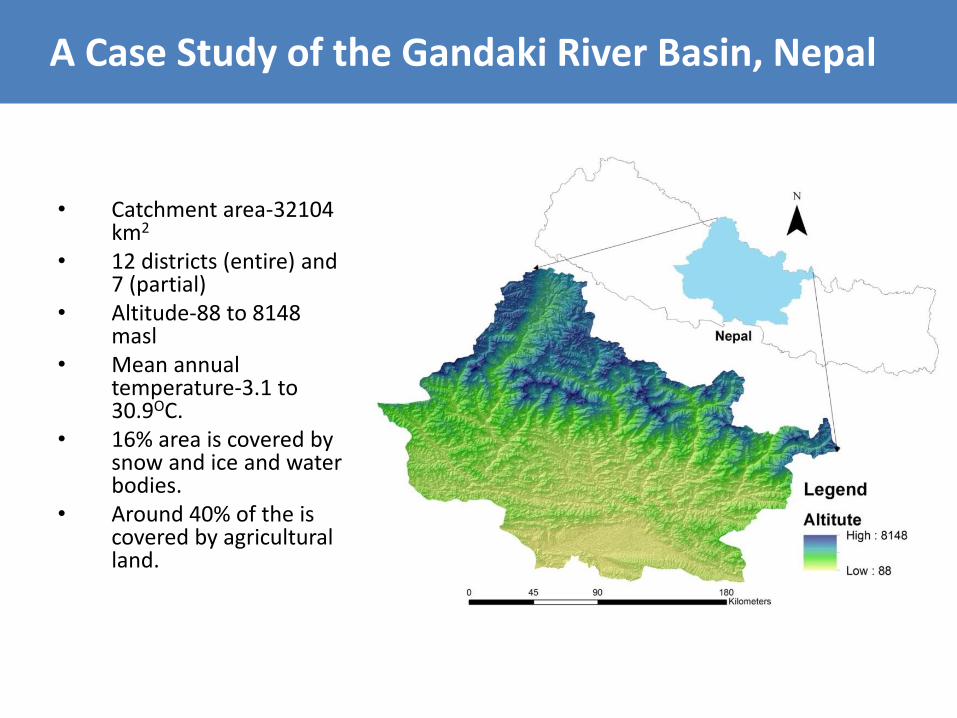
• Catchment area-32104 km2
• 12 districts (entire) and 7 (partial)
• Altitude-88 to 8148 masl
• Mean annual temperature-3.1 to 30.9OC.
• 16% area is covered by snow and ice and water bodies.
• Around 40% of the is covered by agricultural land.
A Case Study of the Gandaki River Basin, Nepal
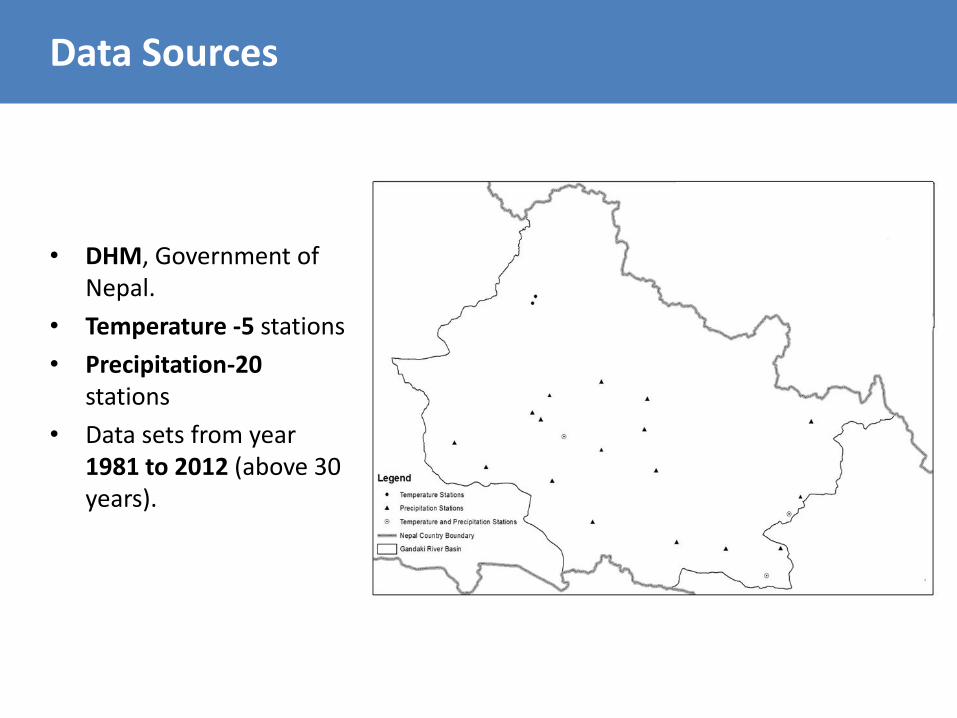
• DHM, Government of Nepal.
• Temperature -5 stations
• Precipitation-20 stations
• Data sets from year 1981 to 2012 (above 30 years).
Data Sources
Station
No.
Altitude
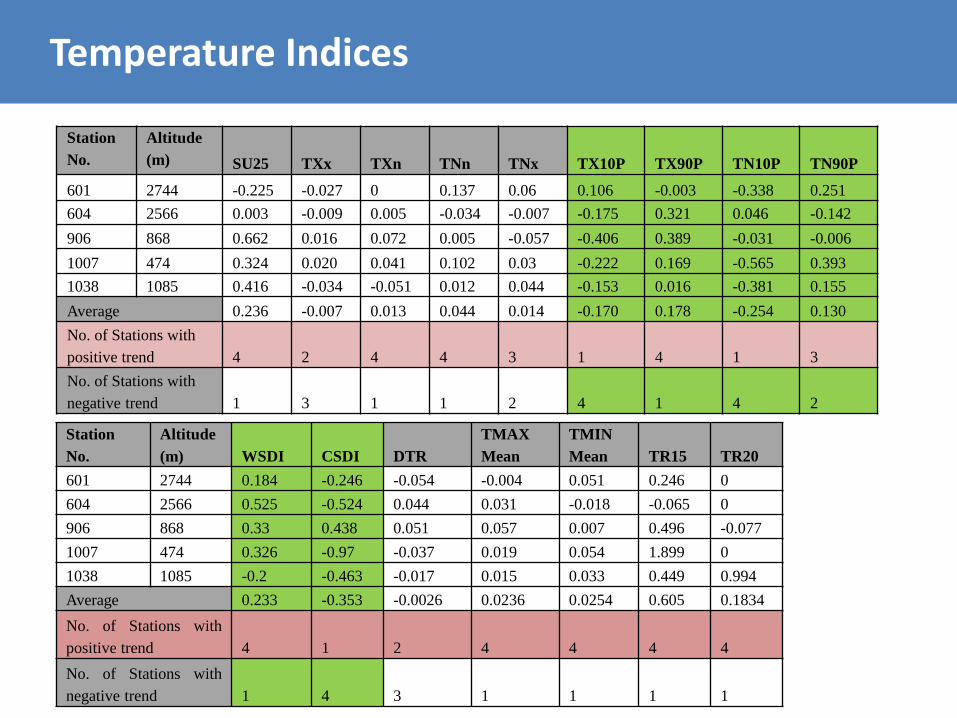
(m) SU25 TXx TXn TNn TNx TX10P TX90P TN10P TN90P
601 2744 -0.225 -0.027 0 0.137 0.06 0.106 -0.003 -0.338 0.251
604 2566 0.003 -0.009 0.005 -0.034 -0.007 -0.175 0.321 0.046 -0.142
906 868 0.662 0.016 0.072 0.005 -0.057 -0.406 0.389 -0.031 -0.006
1007 474 0.324 0.020 0.041 0.102 0.03 -0.222 0.169 -0.565 0.393
1038 1085 0.416 -0.034 -0.051 0.012 0.044 -0.153 0.016 -0.381 0.155
Average 0.236 -0.007 0.013 0.044 0.014 -0.170 0.178 -0.254 0.130
No. of Stations with
positive trend 4 2 4 4 3 1 4 1 3
No. of Stations with
negative trend 1 3 1 1 2 4 1 4 2
Station
No.
Altitude
(m) WSDI CSDI DTR
TMAX
Mean
TMIN
Mean TR15 TR20
601 2744 0.184 -0.246 -0.054 -0.004 0.051 0.246 0
604 2566 0.525 -0.524 0.044 0.031 -0.018 -0.065 0
906 868 0.33 0.438 0.051 0.057 0.007 0.496 -0.077
1007 474 0.326 -0.97 -0.037 0.019 0.054 1.899 0
1038 1085 -0.2 -0.463 -0.017 0.015 0.033 0.449 0.994
Average 0.233 -0.353 -0.0026 0.0236 0.0254 0.605 0.1834
No. of Stations with
positive trend 4 1 2 4 4 4 4
No. of Stations with
negative trend 1 4 3 1 1 1 1
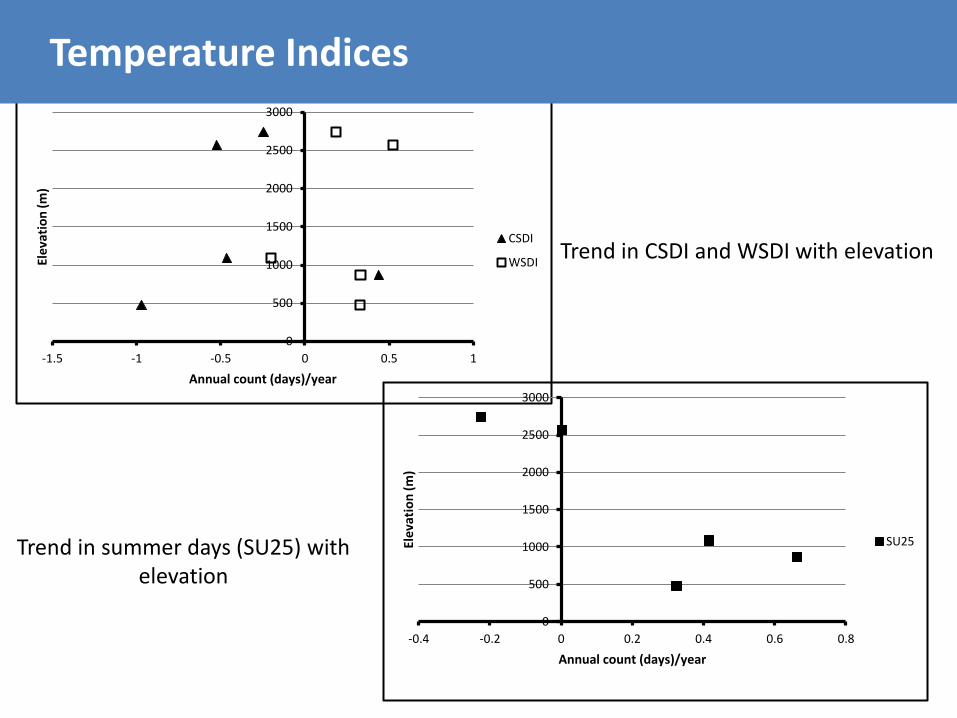
Temperature Indices
0
500
1000
1500
2000
2500
3000
-0.8 -0.6 -0.4 -0.2 0 0.2 0.4 0.6
Elev
atio
n (m
)
Percentage of days/year
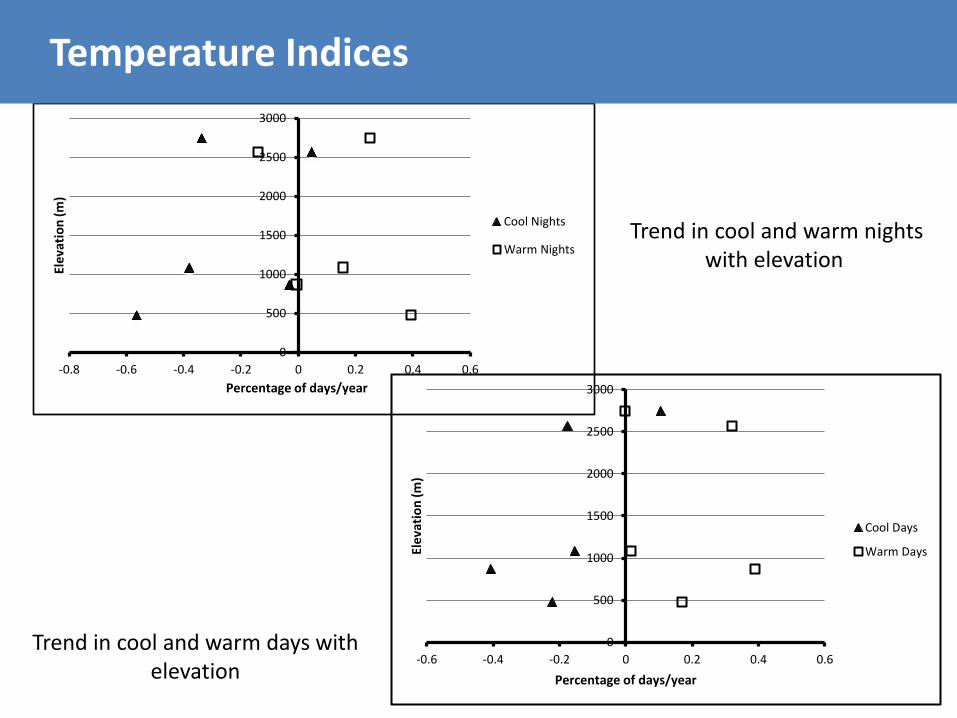
Cool Nights
Warm Nights
0
500
1000
1500
2000
2500
3000
-0.6 -0.4 -0.2 0 0.2 0.4 0.6
Ele
vati
on
(m)
Percentage of days/year
Cool Days
Warm Days
Trend in cool and warm nights with elevation
Trend in cool and warm days with elevation
Temperature Indices
0
500
1000
1500
2000
2500
3000
-1.5 -1 -0.5 0 0.5 1
Elev
atio
n (m
)
Annual count (days)/year
CSDI
WSDI
0
500
1000
1500
2000
2500
3000
-0.4 -0.2 0 0.2 0.4 0.6 0.8
Ele
vati
on
(m
)
Annual count (days)/year
SU25
Trend in CSDI and WSDI with elevation
Trend in summer days (SU25) with elevation
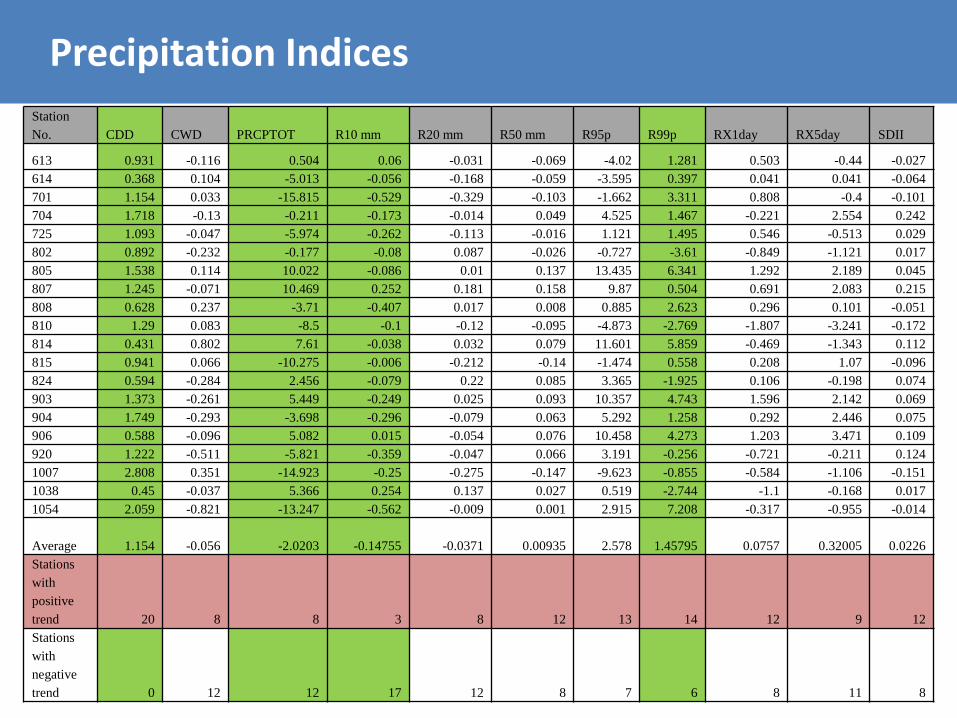
Temperature Indices
Station
No. CDD CWD PRCPTOT R10 mm R20 mm R50 mm R95p R99p RX1day RX5day SDII
613 0.931 -0.116 0.504 0.06 -0.031 -0.069 -4.02 1.281 0.503 -0.44 -0.027
614 0.368 0.104 -5.013 -0.056 -0.168 -0.059 -3.595 0.397 0.041 0.041 -0.064
701 1.154 0.033 -15.815 -0.529 -0.329 -0.103 -1.662 3.311 0.808 -0.4 -0.101
704 1.718 -0.13 -0.211 -0.173 -0.014 0.049 4.525 1.467 -0.221 2.554 0.242
725 1.093 -0.047 -5.974 -0.262 -0.113 -0.016 1.121 1.495 0.546 -0.513 0.029
802 0.892 -0.232 -0.177 -0.08 0.087 -0.026 -0.727 -3.61 -0.849 -1.121 0.017
805 1.538 0.114 10.022 -0.086 0.01 0.137 13.435 6.341 1.292 2.189 0.045
807 1.245 -0.071 10.469 0.252 0.181 0.158 9.87 0.504 0.691 2.083 0.215
808 0.628 0.237 -3.71 -0.407 0.017 0.008 0.885 2.623 0.296 0.101 -0.051
810 1.29 0.083 -8.5 -0.1 -0.12 -0.095 -4.873 -2.769 -1.807 -3.241 -0.172
814 0.431 0.802 7.61 -0.038 0.032 0.079 11.601 5.859 -0.469 -1.343 0.112
815 0.941 0.066 -10.275 -0.006 -0.212 -0.14 -1.474 0.558 0.208 1.07 -0.096
824 0.594 -0.284 2.456 -0.079 0.22 0.085 3.365 -1.925 0.106 -0.198 0.074
903 1.373 -0.261 5.449 -0.249 0.025 0.093 10.357 4.743 1.596 2.142 0.069
904 1.749 -0.293 -3.698 -0.296 -0.079 0.063 5.292 1.258 0.292 2.446 0.075
906 0.588 -0.096 5.082 0.015 -0.054 0.076 10.458 4.273 1.203 3.471 0.109
920 1.222 -0.511 -5.821 -0.359 -0.047 0.066 3.191 -0.256 -0.721 -0.211 0.124
1007 2.808 0.351 -14.923 -0.25 -0.275 -0.147 -9.623 -0.855 -0.584 -1.106 -0.151
1038 0.45 -0.037 5.366 0.254 0.137 0.027 0.519 -2.744 -1.1 -0.168 0.017
1054 2.059 -0.821 -13.247 -0.562 -0.009 0.001 2.915 7.208 -0.317 -0.955 -0.014
Average 1.154 -0.056 -2.0203 -0.14755 -0.0371 0.00935 2.578 1.45795 0.0757 0.32005 0.0226
Stations
with
positive
trend 20 8 8 3 8 12 13 14 12 9 12
Stations
with
negative
trend 0 12 12 17 12 8 7 6 8 11 8
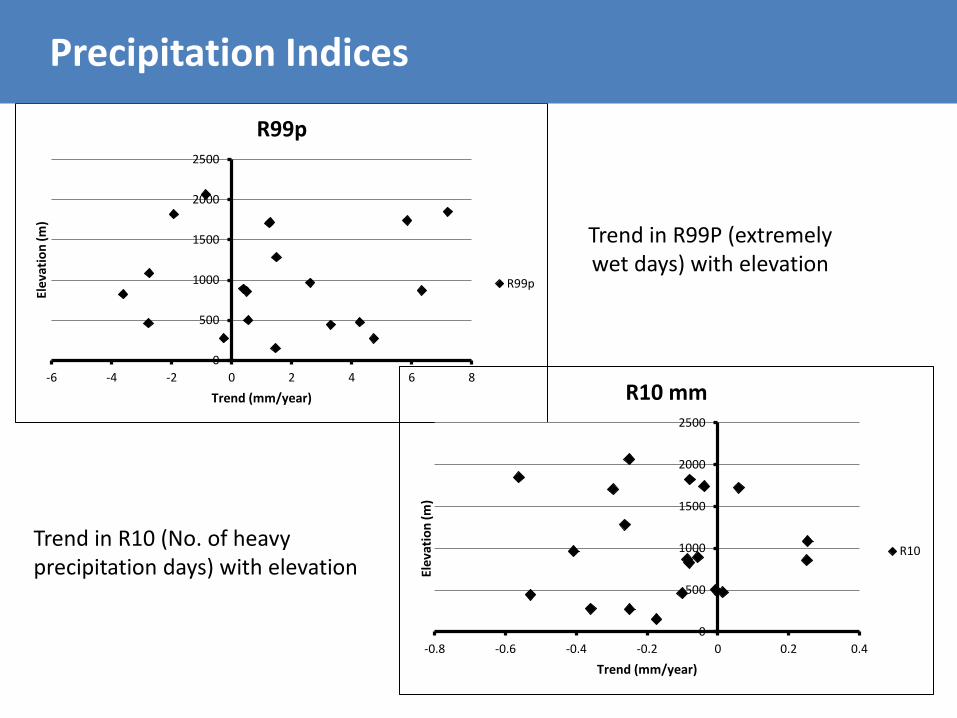
Precipitation Indices
Precipitation Indices
0
500
1000
1500
2000
2500
-6 -4 -2 0 2 4 6 8
Elev
atio
n (m
)
Trend (mm/year)
R99p
R99p
0
500
1000
1500
2000
2500
-0.8 -0.6 -0.4 -0.2 0 0.2 0.4
Elev
atio
n (m
)
Trend (mm/year)
R10 mm
R10
Trend in R99P (extremely wet days) with elevation
Trend in R10 (No. of heavy precipitation days) with elevation
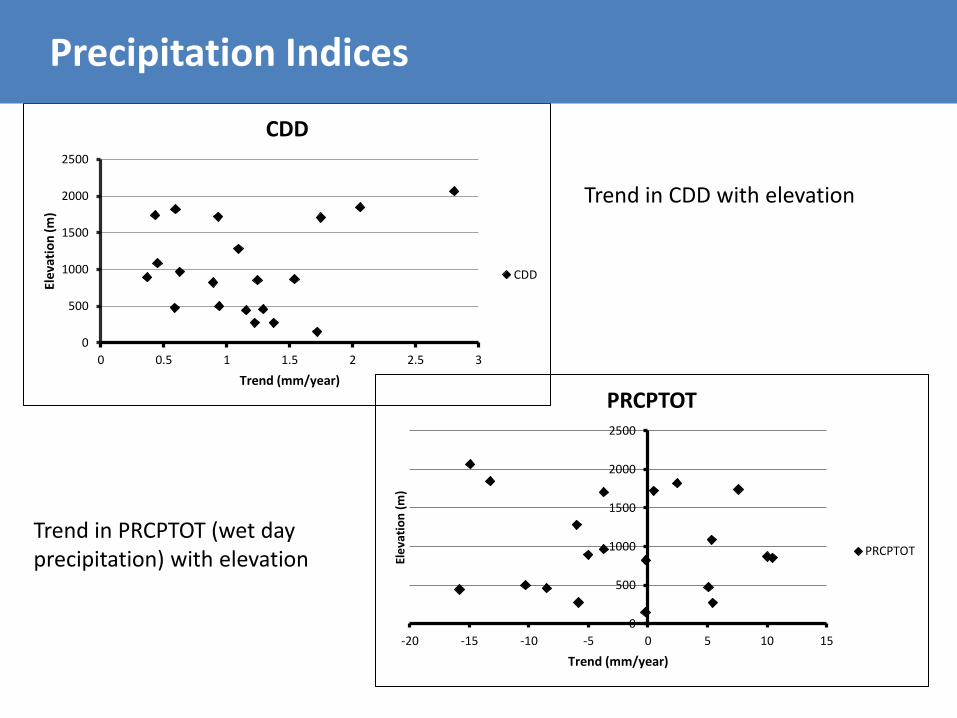
Precipitation Indices
0
500
1000
1500
2000
2500
-20 -15 -10 -5 0 5 10 15
Ele
vati
on
(m
)
Trend (mm/year)
PRCPTOT
PRCPTOT
0
500
1000
1500
2000
2500
0 0.5 1 1.5 2 2.5 3
Elev
atio
n (m
)
Trend (mm/year)
CDD
CDD
Trend in CDD with elevation
Trend in PRCPTOT (wet day precipitation) with elevation
Precipitation Indices
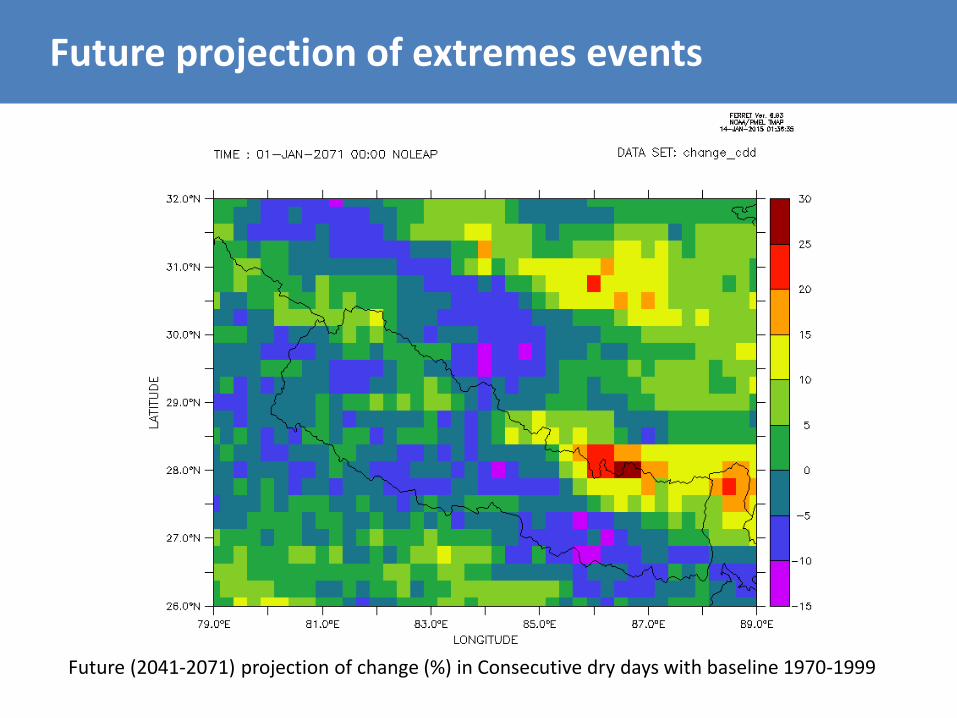
Future projection of extremes events
Future (2041-2071) projection of change (%) in Consecutive dry days with baseline 1970-1999
Trend in CDD with elevation
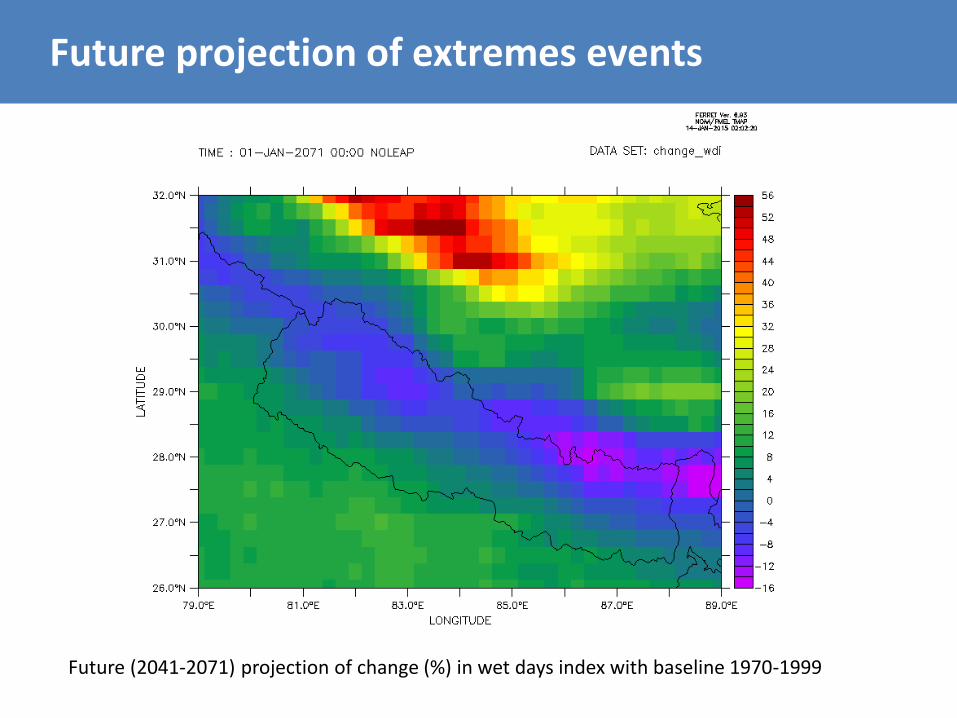
Future projection of extremes events
Future (2041-2071) projection of change (%) in wet days index with baseline 1970-1999
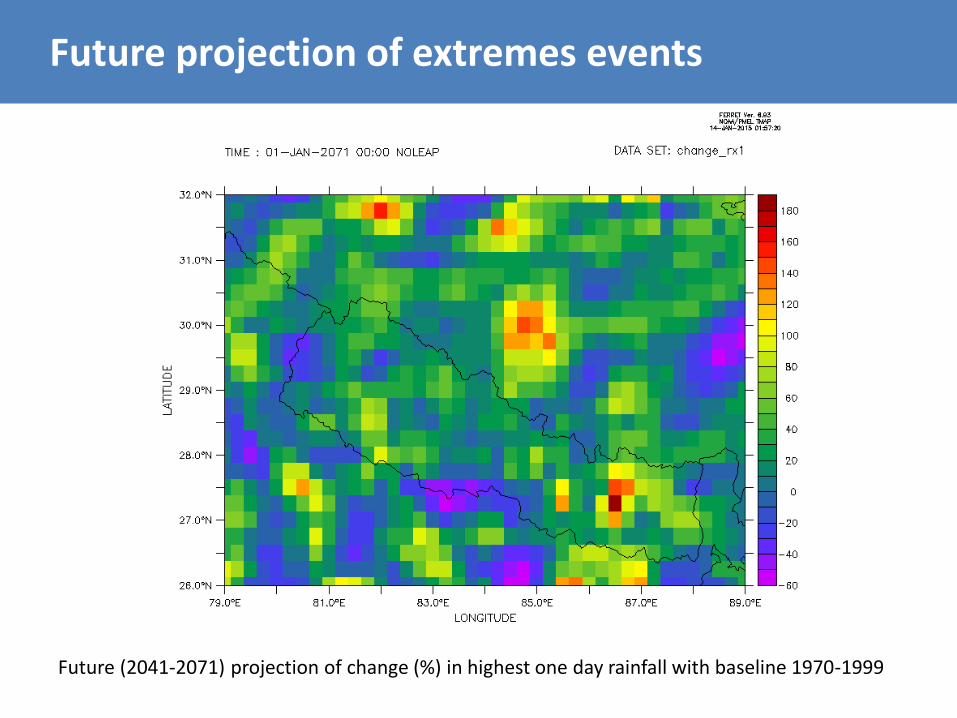
Future projection of extremes events
Future (2041-2071) projection of change (%) in highest one day rainfall with baseline 1970-1999

Trend in CDD with elevation
Future projection of extremes events
Future (2041-2071) projection of change (%) in consecutive wet days with baseline 1970-1999
Conclusion
Warming trend of temperature. No distinct trends of precipitation but the extreme precipitation events are increasing. Consecutive dry days are increasing and are more pronounced in the higher altitude. In future, the wet days index is projected to increase in the lowland Terai but decrease in the higher altitude.
Acknowledgement
This study is a part of research project “Climate Change Adaptation for Livestock Smallholders in Gandaki River Basin Nepal” and is
supported by USAID Feed the Future Innovation Lab for Collaborative Research on Adapting Livestock Systems to
Climate Change.

THANK YOU