nhs finance “building blocks” bob dredge director of finance birmingham children’s hospital...
TRANSCRIPT
NHS FINANCE “BUILDING BLOCKS”
Bob DredgeDirector of Finance
Birmingham Children’s Hospital NHS Trust
FUNDING THE NHS
FUTURE PROSPECTS
CURRENT ISSUES
FUNDING PRINCIPALS Since 1976 – equity Access based on need Need measured in £ Allocate £ based on need
SINCE 1976 Slow progress Different measurement Different definition of need FHS excluded until 1998 GMS excluded until 2002
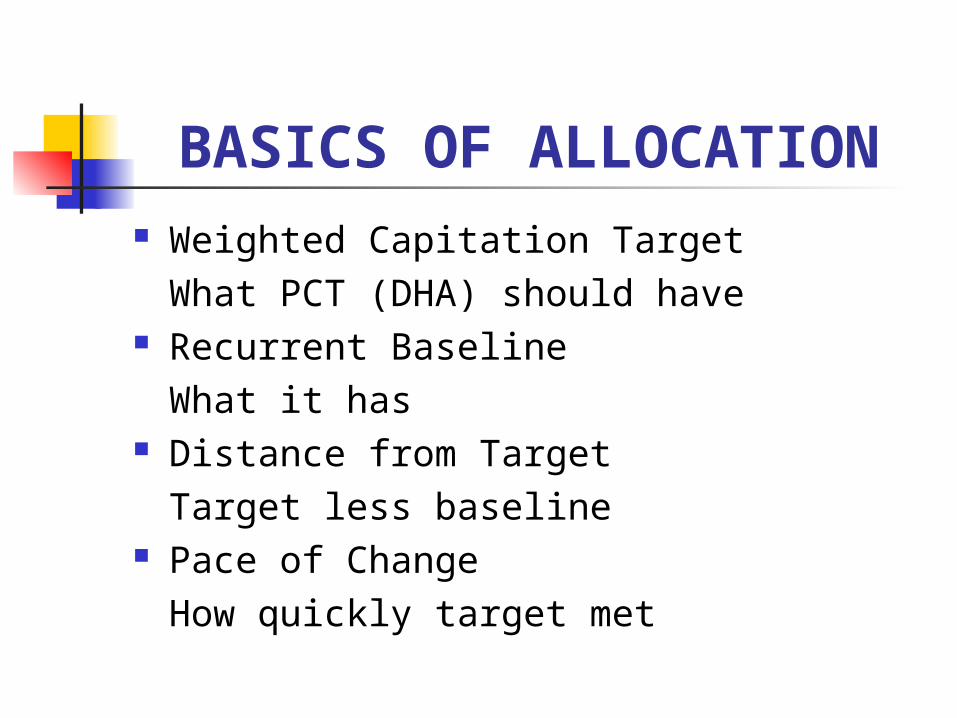
BASICS OF ALLOCATION Weighted Capitation Target
What PCT (DHA) should have Recurrent Baseline
What it has Distance from Target
Target less baseline Pace of Change
How quickly target met

WEIGHTING FACTORS Age structure (cost weights)

AGE/COST/CURVE
0
500
1000
1500
2000
2500
AllBirths
Age 5-15
Age45-64
Age75-84
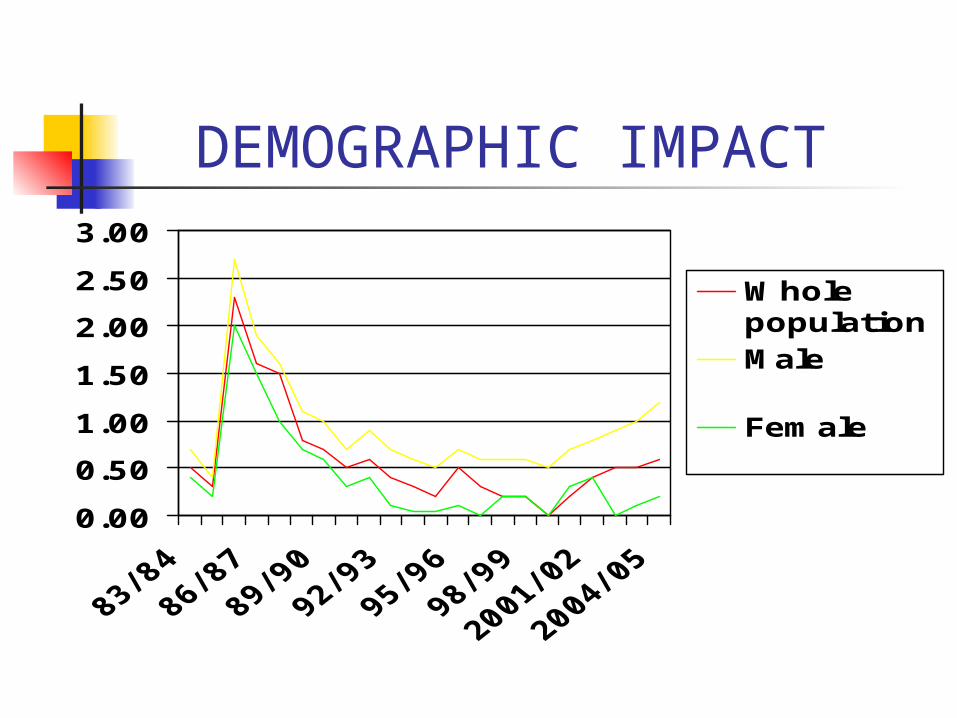
DEMOGRAPHIC IMPACT
0.00
0.50
1.00
1.50
2.00
2.50
3.00
Wholepopulation Male
Female
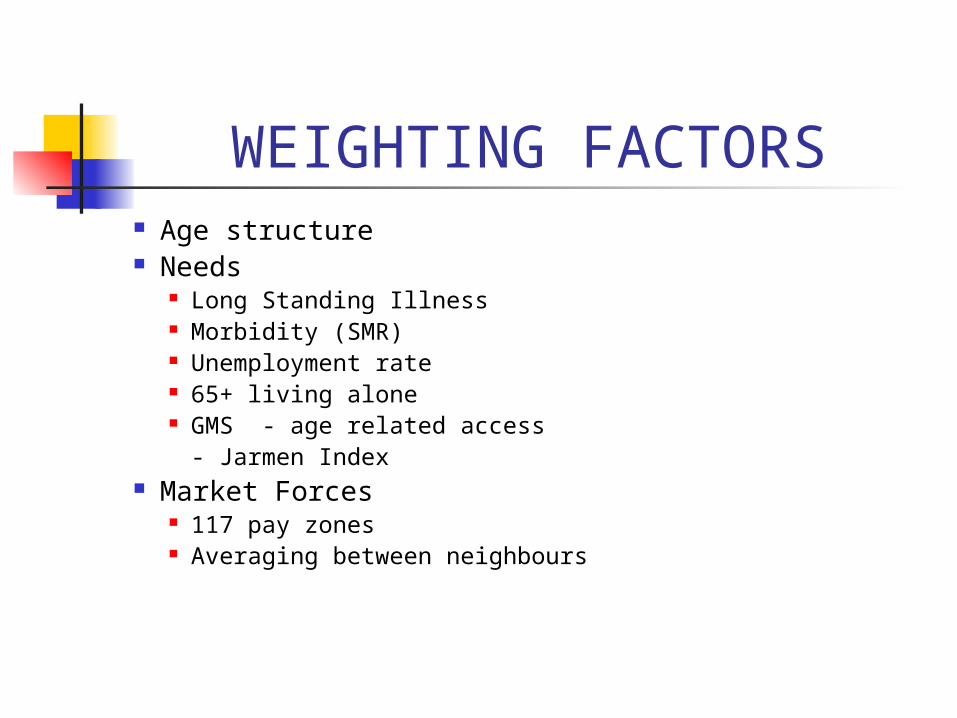
WEIGHTING FACTORS Age structure Needs
Long Standing Illness Morbidity (SMR) Unemployment rate 65+ living alone GMS - age related access
- Jarmen Index Market Forces
117 pay zones Averaging between neighbours
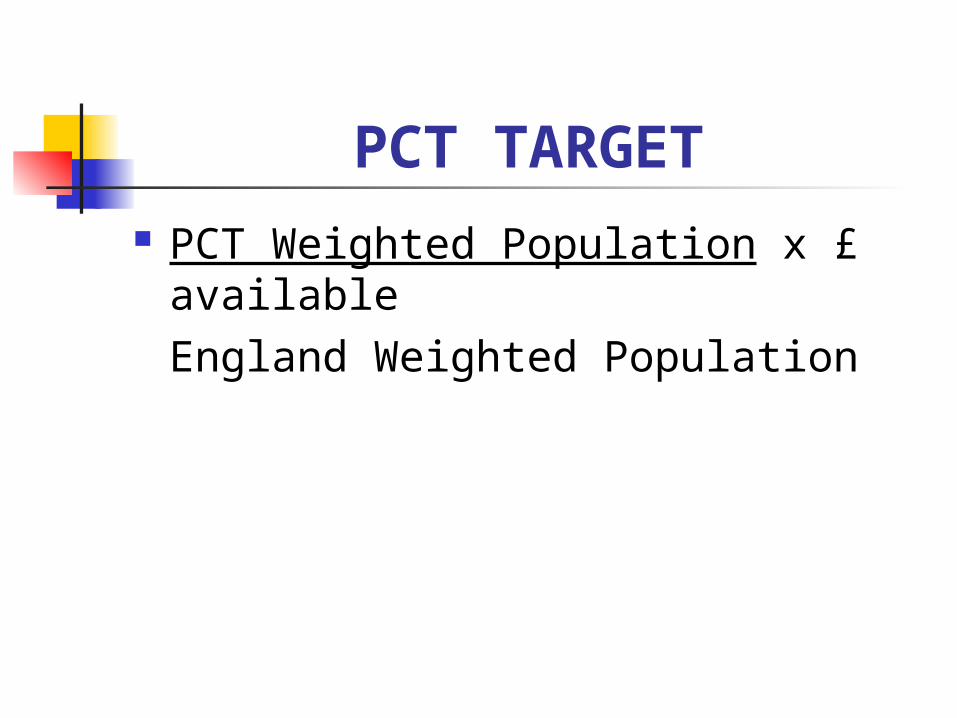
PCT TARGET PCT Weighted Population x £
availableEngland Weighted Population
FUNDED BY 98% Public Funds 2% changes
Constant % for 10 years
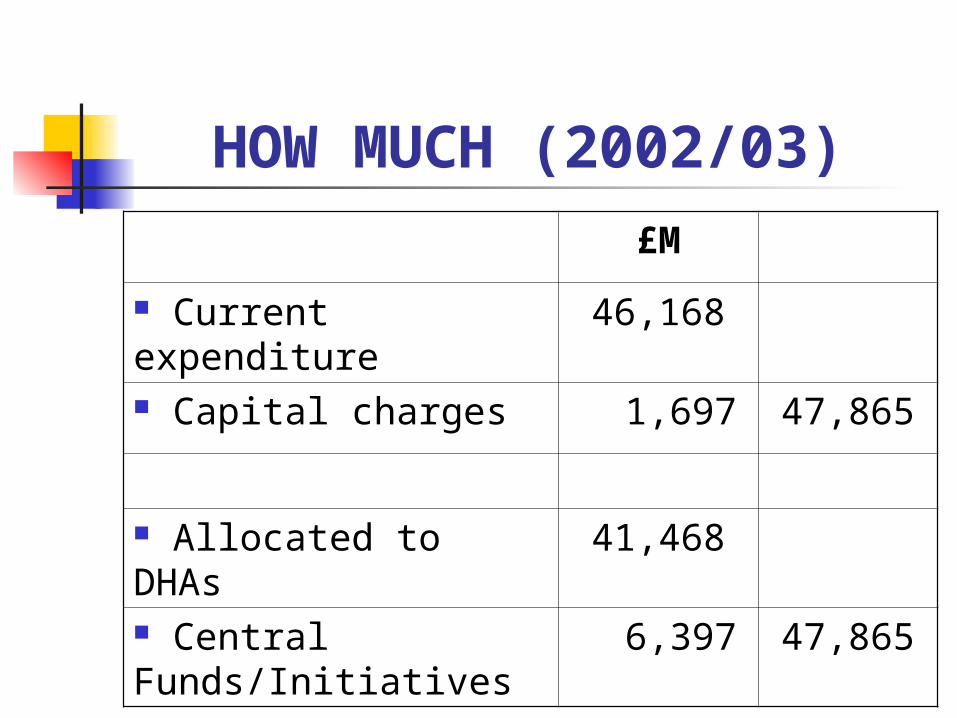
HOW MUCH (2002/03)
£M
Current expenditure 46,168
Capital charges 1,697 47,865
Allocated to DHAs 41,468
Central Funds/Initiatives
6,397 47,865
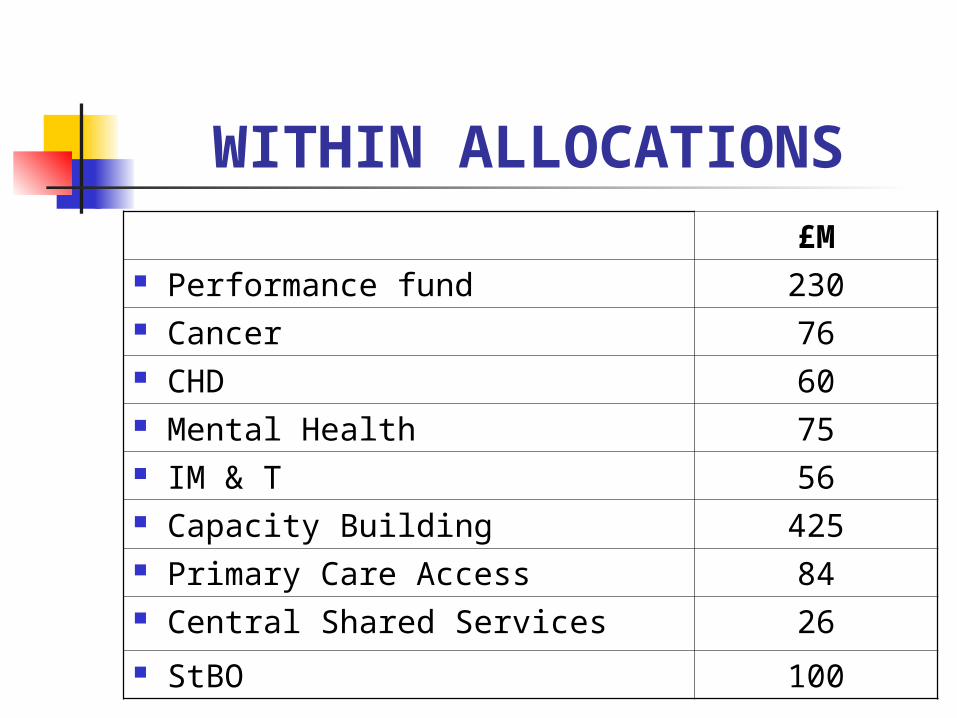
WITHIN ALLOCATIONS£M
Performance fund 230 Cancer 76 CHD 60 Mental Health 75 IM & T 56 Capacity Building 425 Primary Care Access 84 Central Shared Services 26 StBO 100
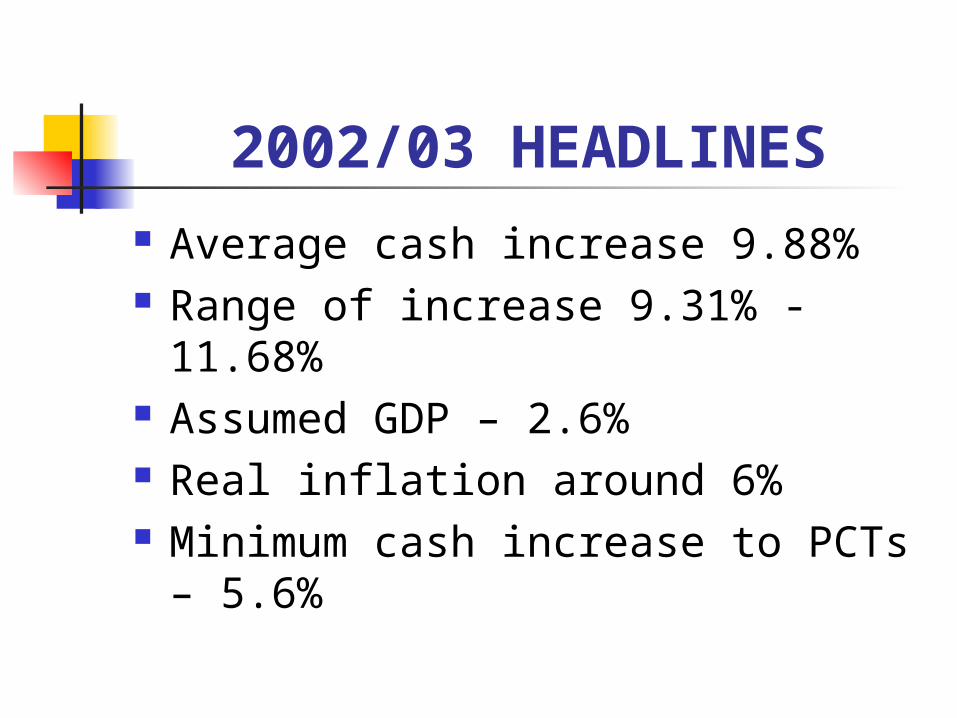
2002/03 HEADLINES Average cash increase 9.88% Range of increase 9.31% - 11.68% Assumed GDP – 2.6% Real inflation around 6% Minimum cash increase to PCTs –
5.6%
2002/03 HEADLINES Some earmarked developments Real CIP risks – 0.2% - 6.3% in BBC
£40m needed Duty to break even Health economy issue
FUTURE PROSPECTS Wanless
Government response
Is NHS failing?
WANLESS
It should be noted that in all other countries examined, there are relatively high levels of dissatisfaction with health service… whatever the (spend).
TORs
Estimate resources needed in 20 years time
Not how financed …but publicly funded, comprehensive and high quality

FUNDING MECHANISMS
Taxation – direct and indirect Social Insurance - earnings related
- employer tax Out-of-Pocket - public and private Private Insurance
PRINCIPLES Efficiency - lowest cost
- minimum disruption to economy
Equity - access based on clinical need (NICE)- contributions related to ability to pay
Choice - meeting expectation
PUBLIC OR PRIVATE
OECD suggest greater share of public spending associated with better health outcomes
OUT OF POCKET
UK - limited to primary care - progressive – many
exceptions France/Sweden – all pay same USA – 55% private
TAXATION Efficient to finance/collect Cost containment Forces prioritisation (nationally) Vulnerable to economic cycle ? Ensures universal access not based on
ability to pay (risk too large) Progressive in economic terms Limited personal choice
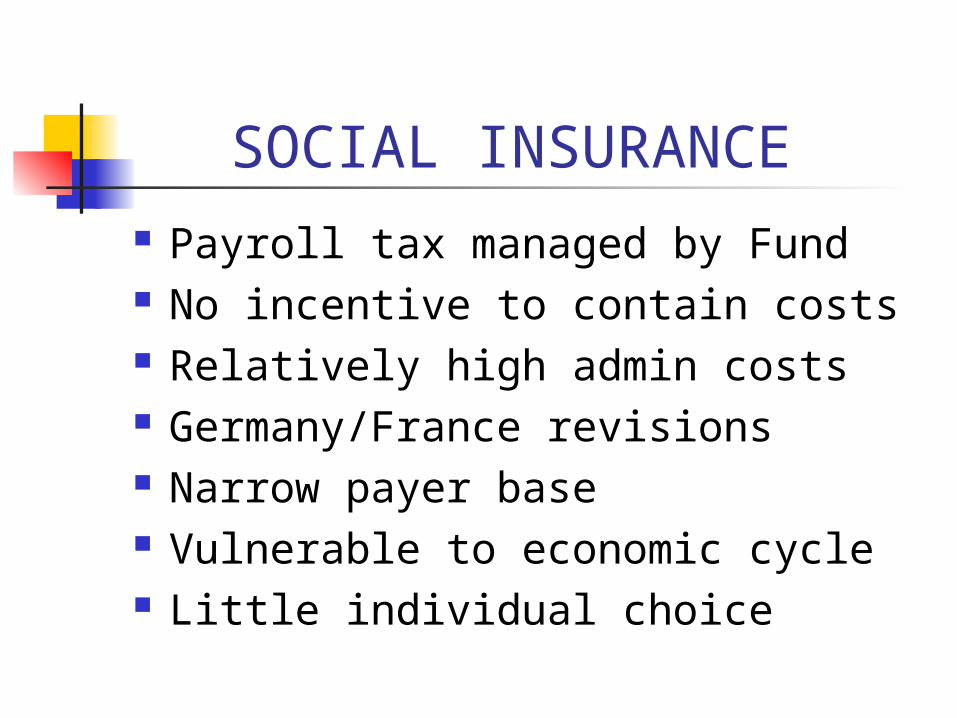
SOCIAL INSURANCE Payroll tax managed by Fund No incentive to contain costs Relatively high admin costs Germany/France revisions Narrow payer base Vulnerable to economic cycle Little individual choice
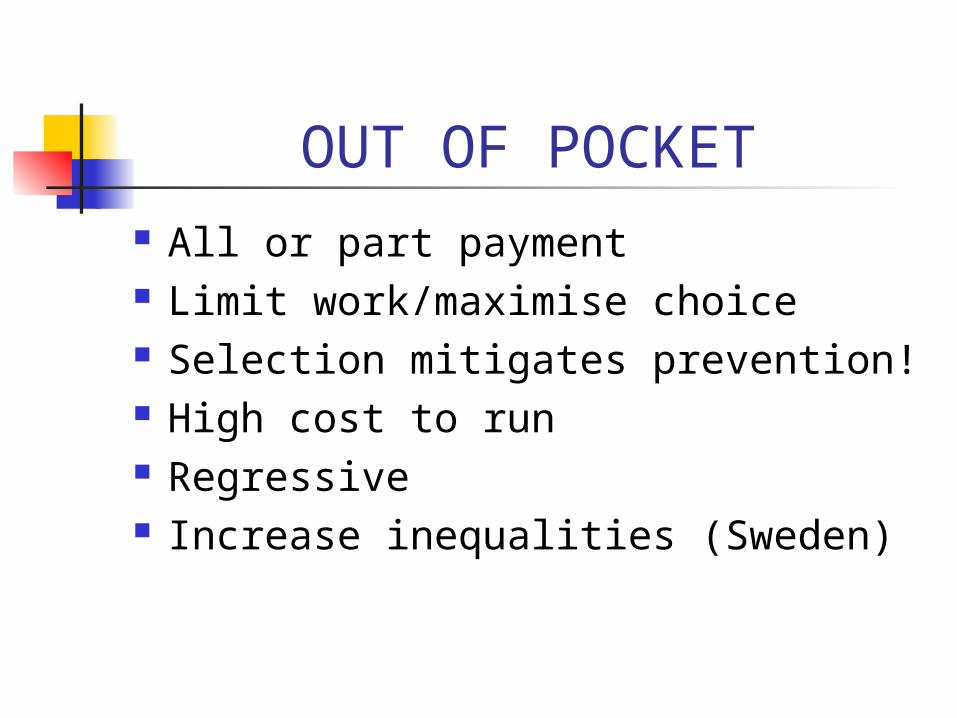
OUT OF POCKET All or part payment Limit work/maximise choice Selection mitigates prevention! High cost to run Regressive Increase inequalities (Sweden)
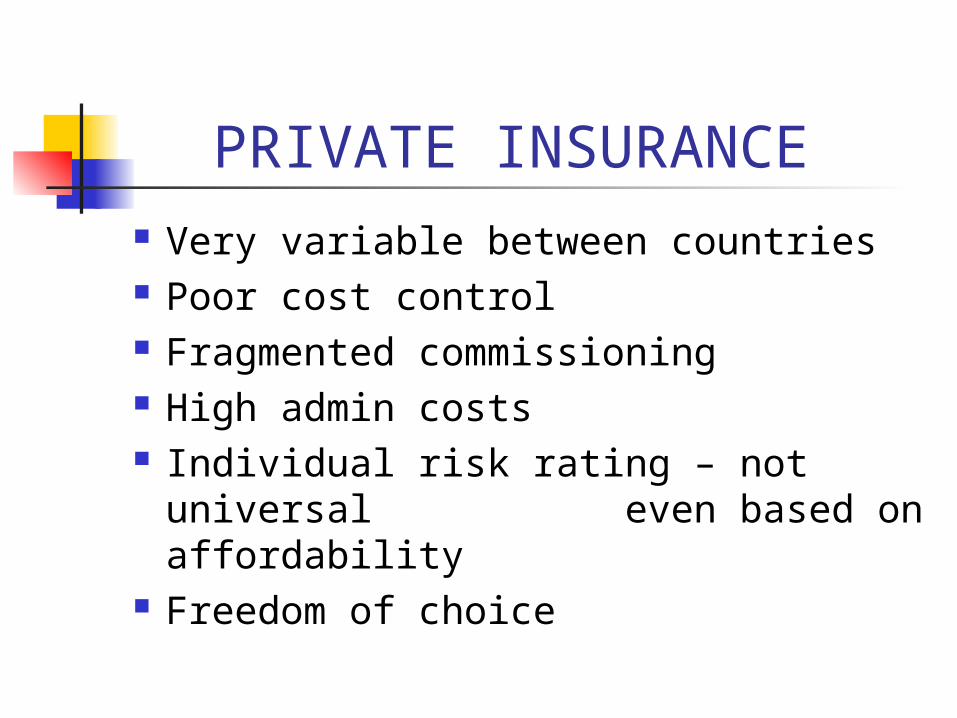
PRIVATE INSURANCE Very variable between countries Poor cost control Fragmented commissioning High admin costs Individual risk rating – not universal
even based on affordability Freedom of choice
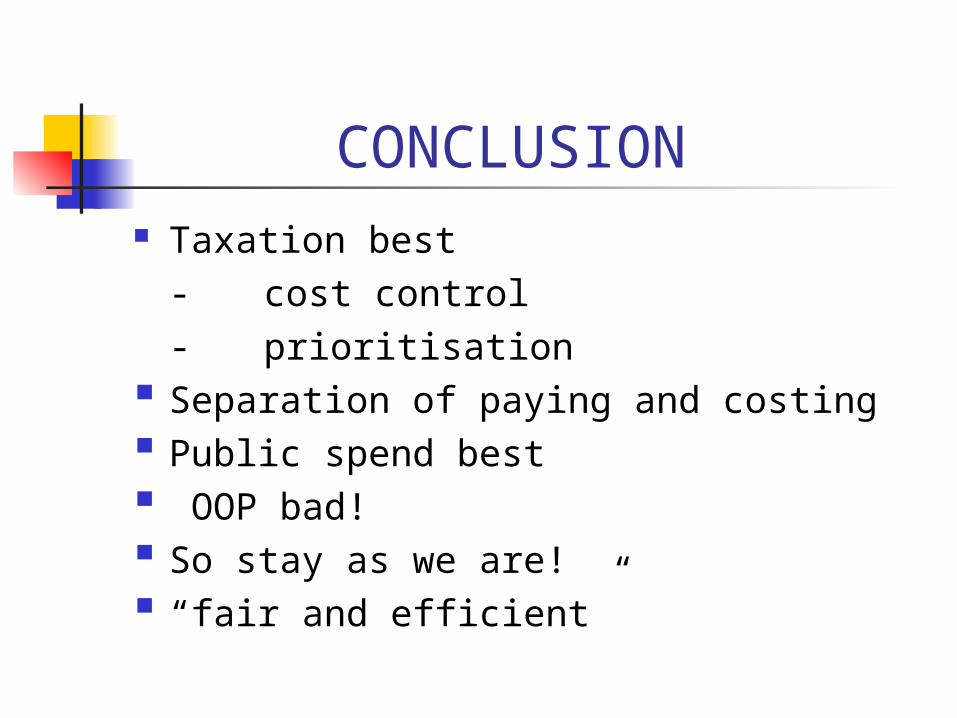
CONCLUSION Taxation best
- cost control - prioritisation
Separation of paying and costing Public spend best OOP bad! So stay as we are! “fair and efficient”
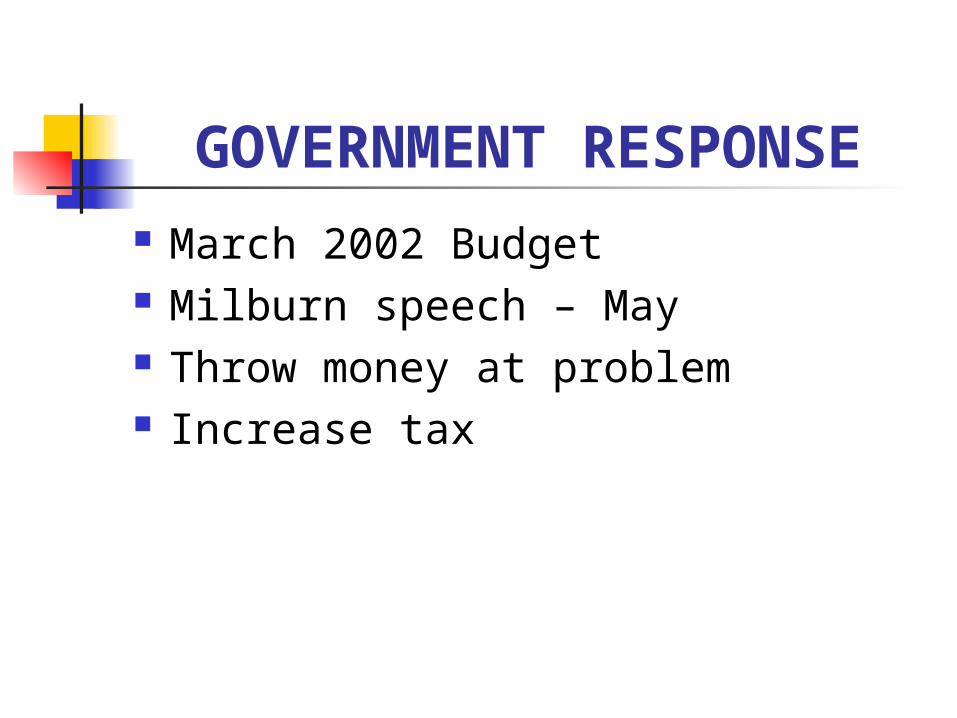
GOVERNMENT RESPONSE
March 2002 Budget Milburn speech – May Throw money at problem Increase tax
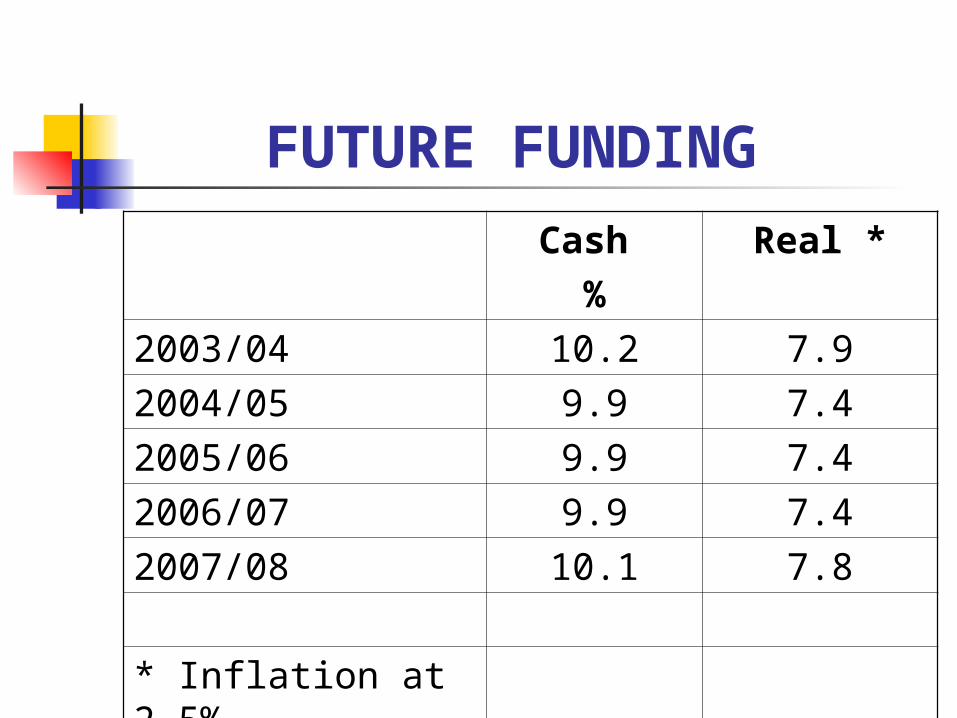
FUTURE FUNDING
Cash %
Real *
2003/04 10.2 7.9
2004/05 9.9 7.4
2005/06 9.9 7.4
2006/07 9.9 7.4
2007/08 10.1 7.8
* Inflation at 2.5%
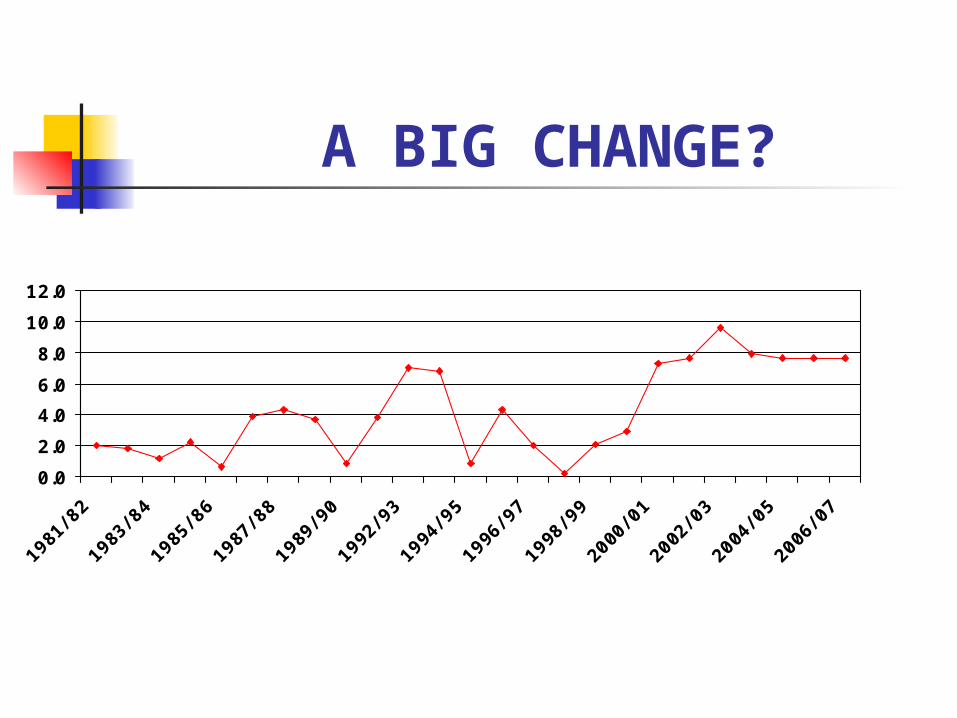
A BIG CHANGE?
0.0
2.0
4.0
6.0
8.0
10.0
12.0
1981
/ 82
1983
/ 84
1985
/ 86
1987
/ 88
1989
/ 90
1992
/ 93
1994
/ 95
1996
/ 97
1998
/ 99
2000
/ 01
2002
/ 03
2004
/ 05
2006
/ 07
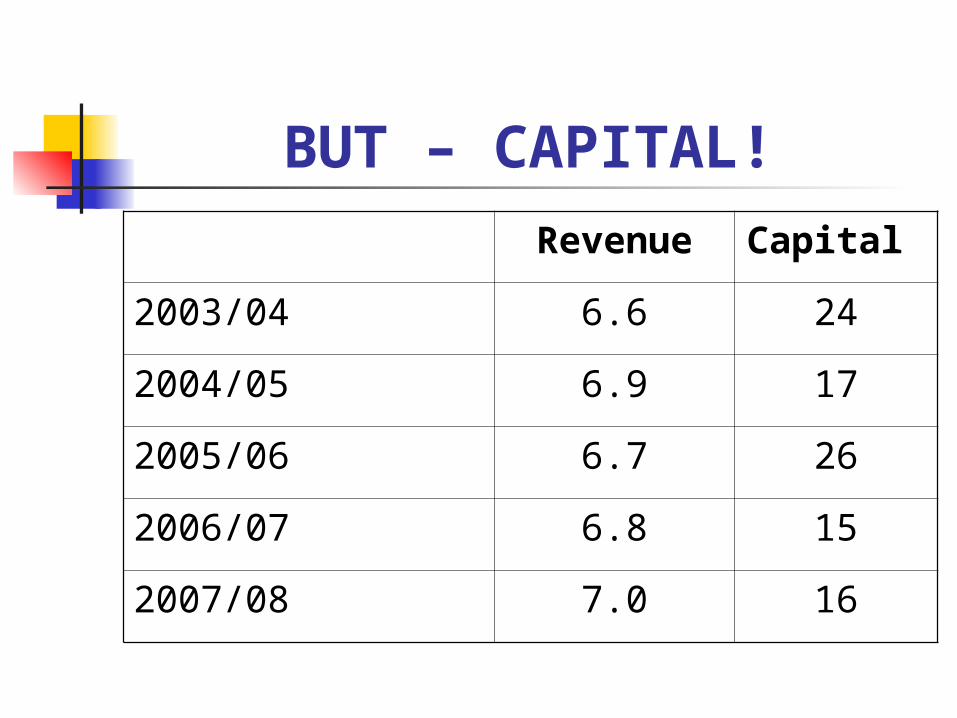
BUT – CAPITAL!
Revenue Capital
2003/04 6.6 24
2004/05 6.9 17
2005/06 6.7 26
2006/07 6.8 15
2007/08 7.0 16
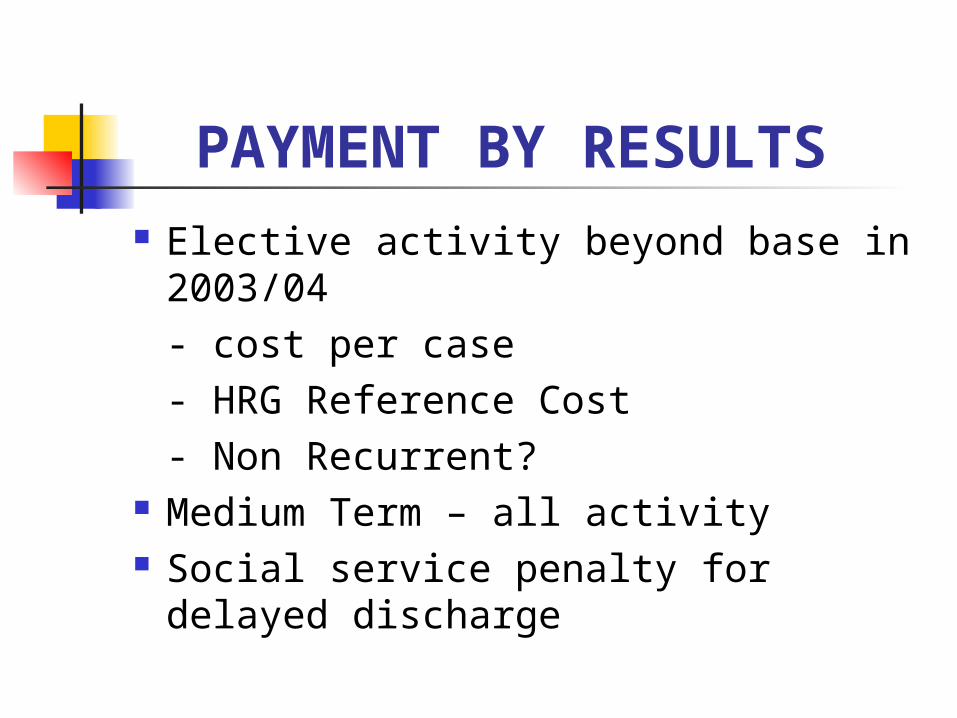
PAYMENT BY RESULTS Elective activity beyond base in
2003/04- cost per case- HRG Reference Cost- Non Recurrent?
Medium Term – all activity Social service penalty for delayed
discharge
USE OF PRIVATE SECTOR
Surgical Teams Expect Work Whole Service (Kaiser) Model? LIFT
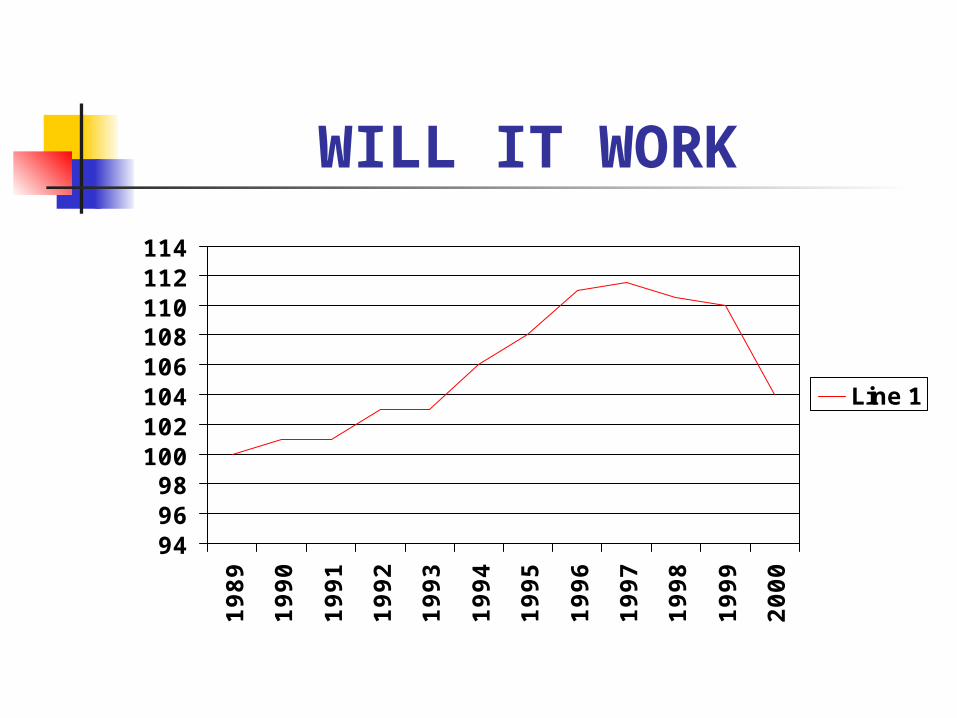
WILL IT WORK
949698
100102104106108110112114
1989
1990
1991
1992
1993
1994
1995
1996
1997
1998
1999
2000
Line 1
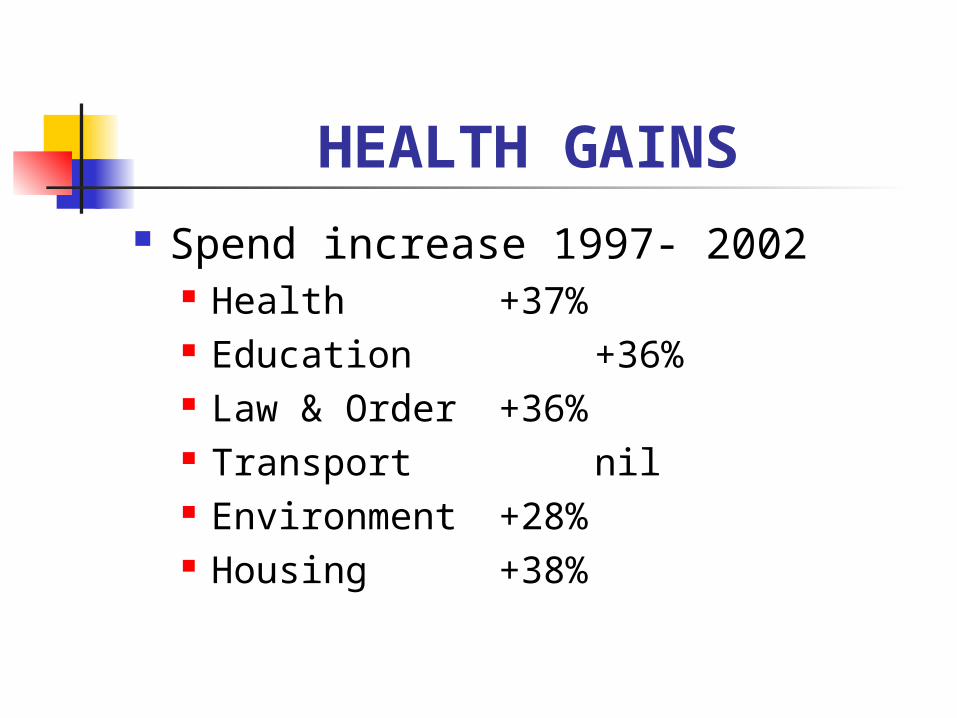
HEALTH GAINS Spend increase 1997- 2002
Health +37% Education +36% Law & Order +36% Transport nil Environment +28% Housing +38%
FINANCIAL DUTIES Break-Even each year Capital Cash (6%) absorption Manage EFL Meet Resource Limit Public Sector Payment