new york state trauma registry - new york state department ... · new york city northern new york...
TRANSCRIPT
New York State Trauma RegistryStatistical Summary Report 2010-2013
New York State Department of HealthOffice of Primary Care and Health System ManagementSeptember, 2015
Table of Contents - 2
Table of Contents
Table of ContentsExecutive SummaryFacility Information
Geographic DistributionRegional Summaries
Patient CharacteristicsYearly IncidentsIncidents and IncidenceCase FatalitiesVital StatisticsTemporal DistributionsPayer Types
Injury CharacteristicsMechanism of InjuryPlace of InjuryFallsMotor Vehicle TrafficFirearmInjury Severity Characteristics
Emergency Medical ServicesResponse TimesTransport TimesInitial Destination
Outcome StatisticsDischarge Disposition
Length of StayComplicationsHospital Wait TimesEmergency DepartmentIntensive Care UnitVentilatorPediatric Final DestinationCost of Trauma
Risk Adjusted ComparisonsTrauma Center DesignationPediatric Treatment by DesignationReferral StatusYear of DischargeRegionRegion and Injury
Comparison to National Trauma Data BankCase Fatality Rates By Injury Severity ScoreCase Fatality Rates By Age
AppendixIncidence By Trauma Mechanism and CountyMortality By Trauma Mechanism and CountyInjury StatisticsMaterials and MethodsRisk Adjustment MethodologyInclusion CriteriaReferences
Executive Summary - 3
Executive Summary
Introduction
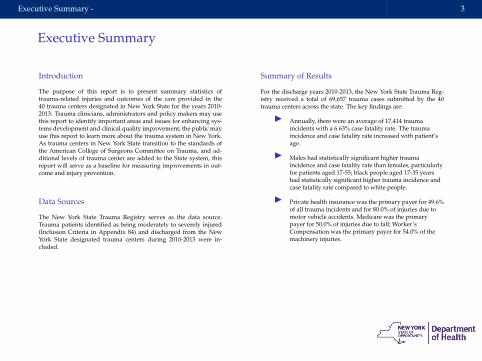
The purpose of this report is to present summary statistics oftrauma-related injuries and outcomes of the care provided in the40 trauma centers designated in New York State for the years 2010-2013. Trauma clinicians, administrators and policy makers may usethis report to identify important areas and issues for enhancing sys-tems development and clinical quality improvement; the public mayuse this report to learn more about the trauma system in New York.As trauma centers in New York State transition to the standards ofthe American College of Surgeons Committee on Trauma, and ad-ditional levels of trauma center are added to the State system, thisreport will serve as a baseline for measuring improvements in out-come and injury prevention.
Data Sources
The New York State Trauma Registry serves as the data source.Trauma patients identified as being moderately to severely injured(Inclusion Criteria in Appendix 84) and discharged from the NewYork State designated trauma centers during 2010-2013 were in-cluded.
Summary of Results
For the discharge years 2010-2013, the New York State Trauma Reg-istry received a total of 69,657 trauma cases submitted by the 40trauma centers across the state. The key findings are:
I Annually, there were an average of 17,414 traumaincidents with a 6.63% case fatality rate. The traumaincidence and case fatality rate increased with patient’sage.
I Males had statistically significant higher traumaincidence and case fatality rate than females, particularlyfor patients aged 17-55; black people aged 17-35 yearshad statistically significant higher trauma incidence andcase fatality rate compared to white people.
I Private health insurance was the primary payer for 49.6%of all trauma incidents and for 80.0% of injuries due tomotor vehicle accidents. Medicare was the primarypayer for 50.0% of injuries due to fall; Worker’sCompensation was the primary payer for 54.0% of themachinery injuries.
Executive Summary - 4
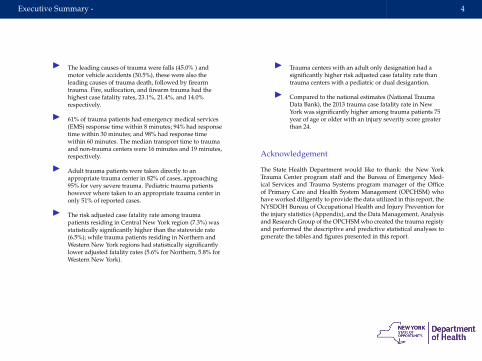
I The leading causes of trauma were falls (45.0% ) andmotor vehicle accidents (30.5%), these were also theleading causes of trauma death, followed by firearmtrauma. Fire, suffocation, and firearm trauma had thehighest case fatality rates, 23.1%, 21.4%, and 14.0%respectively.
I 61% of trauma patients had emergency medical services(EMS) response time within 8 minutes; 94% had responsetime within 30 minutes; and 98% had response timewithin 60 minutes. The median transport time to traumaand non-trauma centers were 16 minutes and 19 minutes,respectively.
I Adult trauma patients were taken directly to anappropriate trauma center in 82% of cases, approaching95% for very severe trauma. Pediatric trauma patientshowever where taken to an appropriate trauma center inonly 51% of reported cases.
I The risk adjusted case fatality rate among traumapatients residing in Central New York region (7.3%) wasstatistically significantly higher than the statewide rate(6.5%); while trauma patients residing in Northern andWestern New York regions had statistically significantlylower adjusted fatality rates (5.6% for Northern, 5.8% forWestern New York).
I Trauma centers with an adult only designation had asignificantly higher risk adjusted case fatality rate thantrauma centers with a pediatric or dual desigantion.
I Compared to the national estimates (National TraumaData Bank), the 2013 trauma case fatality rate in NewYork was significantly higher among trauma patients 75year of age or older with an injury severity score greaterthan 24.
Acknowledgement
The State Health Department would like to thank: the New YorkTrauma Center program staff and the Bureau of Emergency Med-ical Services and Trauma Systems program manager of the Officeof Primary Care and Health System Management (OPCHSM) whohave worked diligently to provide the data utilized in this report, theNYSDOH Bureau of Occupational Health and Injury Prevention forthe injury statistics (Appendix), and the Data Management, Analysisand Research Group of the OPCHSM who created the trauma registyand performed the descriptive and predictive statistical analyses togenerate the tables and figures presented in this report.

Facility Information
Facility Information - Geographic Distribution 6
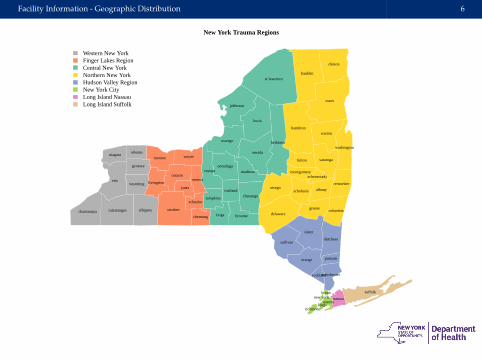
Western New YorkFinger Lakes RegionCentral New YorkNorthern New YorkHudson Valley RegionNew York CityLong Island NassauLong Island Suffolk
albany
allegany
bronx
broome
cattaraugus
cayuga
chautauquachemung
chenango
clinton
columbia
cortland
delaware
dutchess
erie
essex
franklin
fulton
genesee
greene
hamilton
herkimer
jefferson
kings
lewis
livingston
madison
monroe
montgomery
nassaunew york
niagara oneida
onondaga
ontario
orange
orleans
oswego
otsego
putnam
queens
rensselaer
richmond
rockland
st lawrence
saratoga
schenectady
schoharie
schuyler
seneca
steuben
suffolk
sullivan
tioga
tompkins
ulster
warren
washington
wayne
westchester
wyomingyates
New York Trauma Regions
Facility Information - Geographic Distribution 7
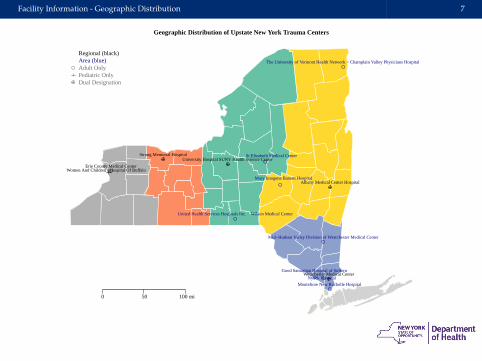
Geographic Distribution of Upstate New York Trauma Centers
University Hospital SUNY Health Science CenterSt Elizabeth Medical Center
United Health Services Hospitals Inc. − Wilson Medical Center
Strong Memorial Hospital
Westchester Medical Center
Mid−Hudson Valley Division of Westchester Medical Center
Nyack Hospital
Montefiore New Rochelle Hospital
Good Samaritan Hospital of Suffern
Albany Medical Center Hospital
The University of Vermont Health Network − Champlain Valley Physicians Hospital
Mary Imogene Bassett Hospital
Erie County Medical CenterWomen And Children's Hospital Of Buffalo
Regional (black)Area (blue)Adult OnlyPediatric OnlyDual Designation
0 50 100 mi
Facility Information - Geographic Distribution 8
bronx
kings
new york
queens
richmond
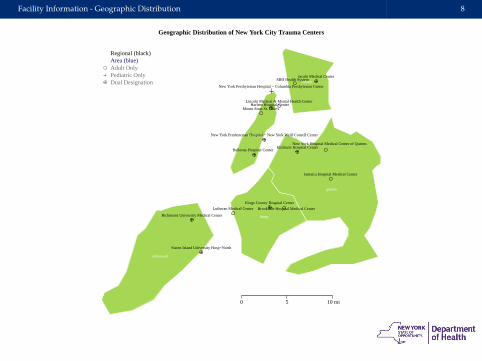
Geographic Distribution of New York City Trauma Centers
Kings County Hospital Center
Lutheran Medical Center
Elmhurst Hospital Center
New York Presbyterian Hospital − New York Weill Cornell Center
Jamaica Hospital Medical Center
Staten Island University Hosp−North
Lincoln Medical & Mental Health Center
Jacobi Medical Center
Richmond University Medical Center
Bellevue Hospital Center
Harlem Hospital Center
Brookdale Hospital Medical Center
SBH Health System
Mount Sinai St. Luke's
New York Hospital Medical Center of Queens
New York Presbyterian Hospital − Columbia Presbyterian Center
Regional (black)Area (blue)Adult OnlyPediatric OnlyDual Designation
0 5 10 mi
Facility Information - Geographic Distribution 9
nassau
suffolk
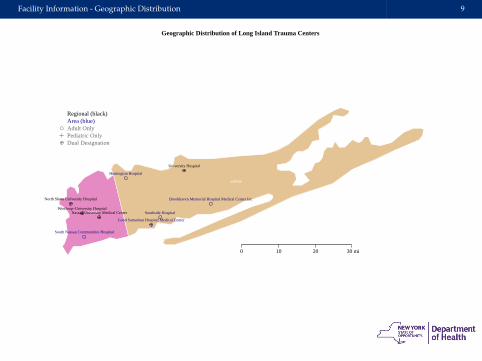
Geographic Distribution of Long Island Trauma Centers
South Nassau Communities Hospital
North Shore University Hospital
Winthrop−University HospitalNassau University Medical Center
Huntington Hospital
Good Samaritan Hospital Medical Center
Brookhaven Memorial Hospital Medical Center Inc
Southside Hospital
University Hospital
Regional (black)Area (blue)Adult OnlyPediatric OnlyDual Designation
0 10 20 30 mi
Facility Information - Regional Summaries 10
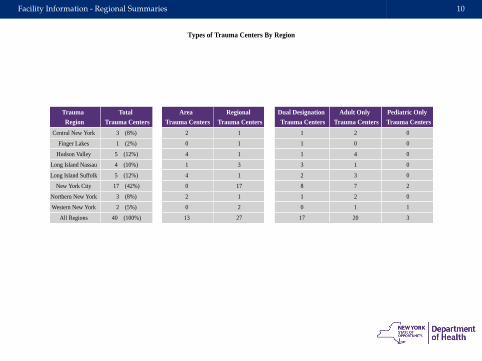
Trauma Region
Central New York
Finger Lakes
Hudson Valley
Long Island Nassau
Long Island Suffolk
New York City
Northern New York
Western New York
All Regions
Total Trauma Centers
3 (8%)
1 (2%)
5 (12%)
4 (10%)
5 (12%)
17 (42%)
3 (8%)
2 (5%)
40 (100%)
Area Trauma Centers
2
0
4
1
4
0
2
0
13
Regional Trauma Centers
1
1
1
3
1
17
1
2
27
Dual Designation Trauma Centers
1
1
1
3
2
8
1
0
17
Adult Only Trauma Centers
2
0
4
1
3
7
2
1
20
Pediatric Only Trauma Centers
0
0
0
0
0
2
0
1
3
Types of Trauma Centers By Region
Facility Information - Regional Summaries 11
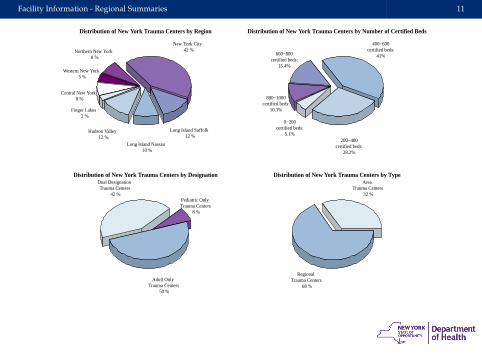
Distribution of New York Trauma Centers by Region
Central New York 8 %
Finger Lakes 2 %
Hudson Valley 12 %
Long Island Nassau 10 %
Long Island Suffolk 12 %
New York City 42 %Northern New York
8 %
Western New York 5 %
Distribution of New York Trauma Centers by Number of Certified Beds
0−200 certified beds:
5.1%200−400
certified beds: 28.2%
400−600 certified beds:
41%600−800 certified beds:
15.4%
800−1000 certified beds:
10.3%
Distribution of New York Trauma Centers by DesignationDual Designation Trauma Centers
42 %
Adult Only Trauma Centers
50 %
Pediatric Only Trauma Centers
8 %
Distribution of New York Trauma Centers by TypeArea
Trauma Centers 32 %
Regional Trauma Centers
68 %
Facility Information - Regional Summaries 12
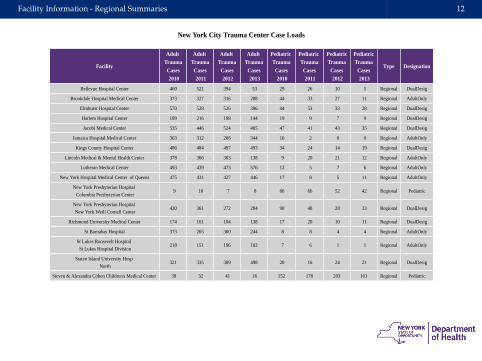
Facility
Bellevue Hospital Center
Brookdale Hospital Medical Center
Elmhurst Hospital Center
Harlem Hospital Center
Jacobi Medical Center
Jamaica Hospital Medical Center
Kings County Hospital Center
Lincoln Medical & Mental Health Center
Lutheran Medical Center
New York Hospital Medical Center of Queens
New York Presbyterian Hospital
Columbia Presbyterian Center
New York Presbyterian Hospital
New York Weill Cornell Center
Richmond University Medical Center
St Barnabas Hospital
St Lukes Roosevelt Hospital
St Lukes Hospital Division
Staten Island University Hosp
North
Steven & Alexandra Cohen Children's Medical Center
Adult Trauma Cases 2010
460
373
570
199
535
363
486
378
493
475
9
420
174
373
218
321
39
Adult Trauma Cases 2011
521
327
529
216
446
312
484
366
439
431
10
361
161
265
151
335
32
Adult Trauma Cases 2012
394
316
526
198
524
206
497
303
473
427
7
272
104
300
196
389
41
Adult Trauma Cases 2013
53
208
396
144
405
344
493
138
576
446
8
284
138
244
182
498
16
Pediatric Trauma Cases 2010
29
44
44
19
47
16
34
9
12
17
66
90
17
8
7
20
152
Pediatric Trauma Cases 2011
26
33
53
9
41
2
24
20
5
8
66
48
20
8
6
16
178
Pediatric Trauma Cases 2012
10
27
33
7
43
0
14
21
7
5
52
28
10
4
1
24
203
Pediatric Trauma Cases 2013
5
11
28
9
35
0
19
12
6
11
42
33
11
4
1
21
163
Type
Regional
Regional
Regional
Regional
Regional
Regional
Regional
Regional
Regional
Regional
Regional
Regional
Regional
Regional
Regional
Regional
Regional
Designation
DualDesig
AdultOnly
DualDesig
DualDesig
DualDesig
AdultOnly
DualDesig
AdultOnly
AdultOnly
AdultOnly
Pediatric
DualDesig
DualDesig
AdultOnly
AdultOnly
DualDesig
Pediatric
New York City Trauma Center Case Loads
Facility Information - Regional Summaries 13
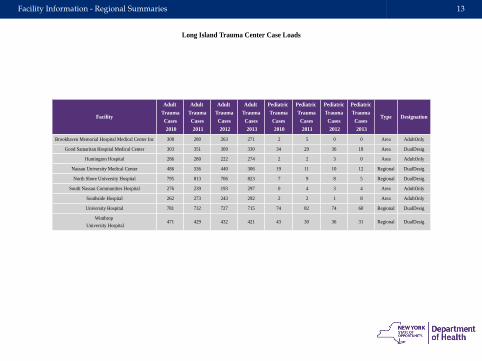
Facility
Brookhaven Memorial Hospital Medical Center Inc
Good Samaritan Hospital Medical Center
Huntington Hospital
Nassau University Medical Center
North Shore University Hospital
South Nassau Communities Hospital
Southside Hospital
University Hospital
Winthrop
University Hospital
Adult Trauma Cases 2010
308
303
286
486
795
276
262
781
471
Adult Trauma Cases 2011
280
351
280
336
813
239
273
732
429
Adult Trauma Cases 2012
263
309
222
440
706
193
243
727
432
Adult Trauma Cases 2013
271
330
274
306
823
297
292
715
421
Pediatric Trauma Cases 2010
2
34
2
19
7
0
2
74
43
Pediatric Trauma Cases 2011
5
29
2
11
9
4
2
82
30
Pediatric Trauma Cases 2012
0
36
3
10
8
3
1
74
36
Pediatric Trauma Cases 2013
0
18
0
12
5
4
8
60
31
Type
Area
Area
Area
Regional
Regional
Area
Area
Regional
Regional
Designation
AdultOnly
DualDesig
AdultOnly
DualDesig
DualDesig
AdultOnly
AdultOnly
DualDesig
DualDesig
Long Island Trauma Center Case Loads
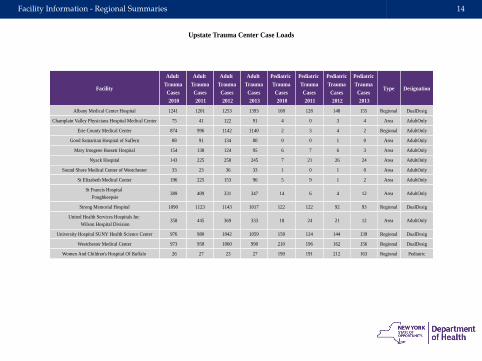
Facility Information - Regional Summaries 14
Facility
Albany Medical Center Hospital
Champlain Valley Physicians Hospital Medical Center
Erie County Medical Center
Good Samaritan Hospital of Suffern
Mary Imogene Bassett Hospital
Nyack Hospital
Sound Shore Medical Center of Westchester
St Elizabeth Medical Center
St Francis Hospital
Poughkeepsie
Strong Memorial Hospital
United Health Services Hospitals Inc
Wilson Hospital Division
University Hospital SUNY Health Science Center
Westchester Medical Center
Women And Children's Hospital Of Buffalo
Adult Trauma Cases 2010
1241
75
874
88
154
143
33
196
389
1090
358
976
973
26
Adult Trauma Cases 2011
1201
41
996
91
138
225
23
225
409
1123
445
980
958
27
Adult Trauma Cases 2012
1253
122
1142
134
124
258
36
153
331
1143
369
1042
1060
23
Adult Trauma Cases 2013
1393
91
1140
80
95
245
33
96
347
1017
333
1059
990
27
Pediatric Trauma Cases 2010
108
4
2
0
6
7
1
5
14
122
18
158
210
190
Pediatric Trauma Cases 2011
128
0
3
0
7
21
0
9
6
122
24
124
196
191
Pediatric Trauma Cases 2012
148
3
4
1
6
26
1
1
4
92
21
144
162
212
Pediatric Trauma Cases 2013
155
4
2
0
3
24
0
2
12
93
12
139
156
163
Type
Regional
Area
Regional
Area
Area
Area
Area
Area
Area
Regional
Area
Regional
Regional
Regional
Designation
DualDesig
AdultOnly
AdultOnly
AdultOnly
AdultOnly
AdultOnly
AdultOnly
AdultOnly
AdultOnly
DualDesig
AdultOnly
DualDesig
DualDesig
Pediatric
Upstate Trauma Center Case Loads

Patient Characteristics
Patient Characteristics - Yearly Incidents 16
2010 2011 2012 2013
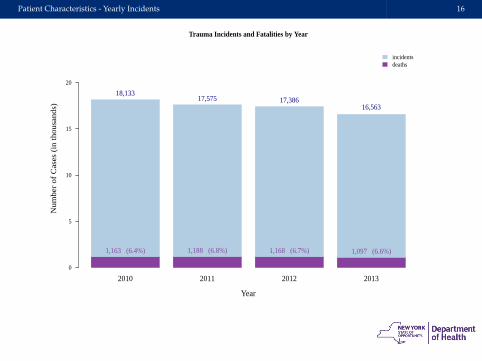
Trauma Incidents and Fatalities by Year
Year
Nu
mb
er
of
Ca
ses
(in
th
ou
san
ds)
0
5
10
15
20
1,163 (6.4%) 1,188 (6.8%) 1,168 (6.7%) 1,097 (6.6%)
18,13317,575 17,386
16,563
incidentsdeaths
Patient Characteristics - Yearly Incidents 17
Female Male
2010
Nu
mb
er
of C
ase
s (in
th
ou
san
ds)
0
2
4
6
8
10
12
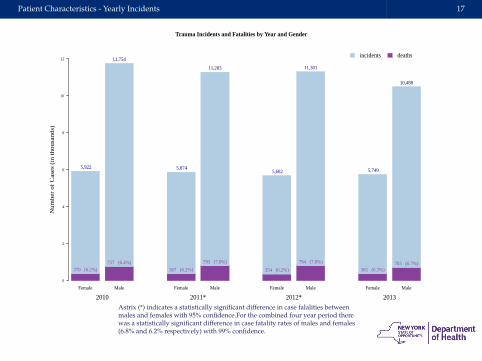
370 (6.2%)757 (6.4%)
5,922
11,754
Female Male
2011*
367 (6.2%)
793 (7.0%)
5,874
11,283
Female Male
2012*
354 (6.2%)
794 (7.0%)
5,682
11,301
Female Male
2013
365 (6.3%)703 (6.7%)
5,749
10,488
incidents deaths
Trauma Incidents and Fatalities by Year and Gender
Astrix (*) indicates a statistically significant difference in case falalities betweenmales and females with 95% confidence.For the combined four year period therewas a statistically significant difference in case fatality rates of males and females(6.8% and 6.2% respectively) with 99% confidence.
Patient Characteristics - Incidents and Incidence 18
1 4 7 11 15 19 23 27 31 35 39 43 47 51 55 59 63 67 71 75 79 83 87 91 95 99 104
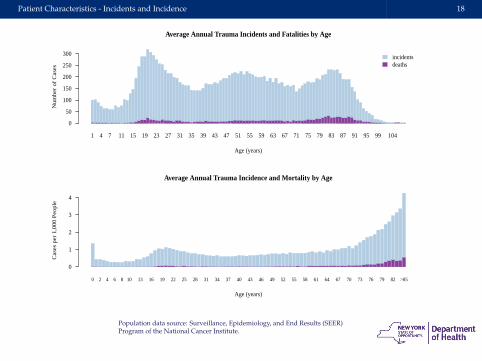
Average Annual Trauma Incidents and Fatalities by Age
Age (years)
Nu
mb
er
of C
ase
s
0
50
100
150
200
250
300 incidentsdeaths
0 2 4 6 8 10 13 16 19 22 25 28 31 34 37 40 43 46 49 52 55 58 61 64 67 70 73 76 79 82 >85
Average Annual Trauma Incidence and Mortality by Age
Age (years)
Ca
ses
pe
r 1
,00
0 P
eo
ple
0
1
2
3
4
Population data source: Surveillance, Epidemiology, and End Results (SEER)Program of the National Cancer Institute.
Patient Characteristics - Incidents and Incidence 19
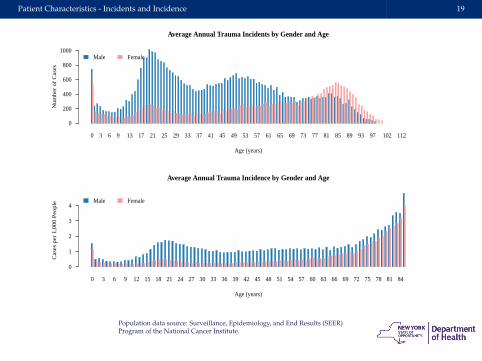
0 3 6 9 13 17 21 25 29 33 37 41 45 49 53 57 61 65 69 73 77 81 85 89 93 97 102 112
Average Annual Trauma Incidents by Gender and Age
Age (years)
Nu
mb
er
of C
ase
s
0
200
400
600
800
1000Male Female
0 3 6 9 12 15 18 21 24 27 30 33 36 39 42 45 48 51 54 57 60 63 66 69 72 75 78 81 84
Average Annual Trauma Incidence by Gender and Age
Age (years)
Ca
ses
pe
r 1
,00
0 P
eo
ple
0
1
2
3
4Male Female
Population data source: Surveillance, Epidemiology, and End Results (SEER)Program of the National Cancer Institute.
Patient Characteristics - Incidents and Incidence 20
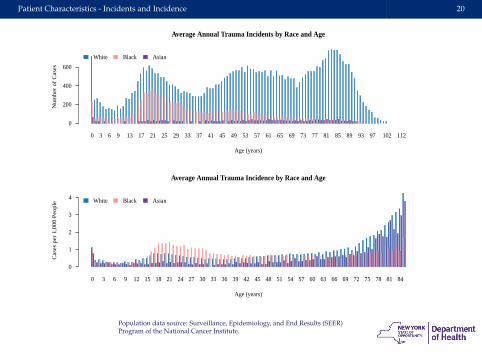
0 3 6 9 13 17 21 25 29 33 37 41 45 49 53 57 61 65 69 73 77 81 85 89 93 97 102 112
Average Annual Trauma Incidents by Race and Age
Age (years)
Nu
mb
er
of C
ase
s
0
200
400
600
White Black Asian
0 3 6 9 12 15 18 21 24 27 30 33 36 39 42 45 48 51 54 57 60 63 66 69 72 75 78 81 84
Average Annual Trauma Incidence by Race and Age
Age (years)
Ca
ses
pe
r 1
,00
0 P
eo
ple
0
1
2
3
4 White Black Asian
Population data source: Surveillance, Epidemiology, and End Results (SEER)Program of the National Cancer Institute.
Patient Characteristics - Case Fatalities 21
0 20 40 60 80
0
2
4
6
8
10
12
14
16
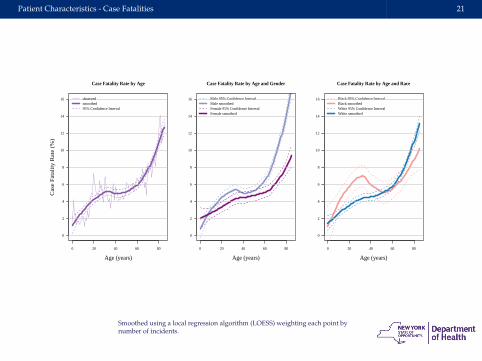
Case Fatality Rate by Age
Age (years)
Ca
se F
ata
lity
Ra
te (
%)
observedsmoothed95% Confidence Interval
0 20 40 60 80
0
2
4
6
8
10
12
14
16
Case Fatality Rate by Age and Gender
Age (years)
Male 95% Confidence IntervalMale smoothedFemale 95% Confidence IntervalFemale smoothed
0 20 40 60 80
0
2
4
6
8
10
12
14
16
Case Fatality Rate by Age and Race
Age (years)
Black 95% Confidence IntervalBlack smoothedWhite 95% Confidence IntervalWhite smoothed
Smoothed using a local regression algorithm (LOESS) weighting each point bynumber of incidents.
Patient Characteristics - Vital Statistics 22
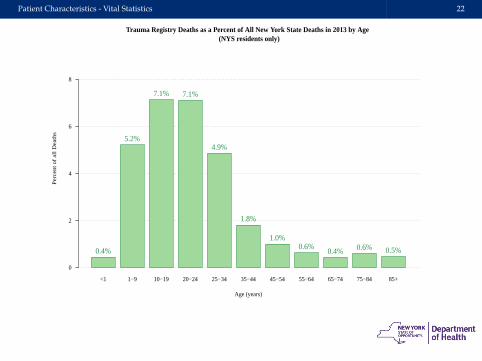
<1 1−9 10−19 20−24 25−34 35−44 45−54 55−64 65−74 75−84 85+
Trauma Registry Deaths as a Percent of All New York State Deaths in 2013 by Age (NYS residents only)
Age (years)
Pe
rce
nt o
f a
ll D
ea
ths
0
2
4
6
8
0.4%
5.2%
7.1% 7.1%
4.9%
1.8%
1.0%0.6%
0.4% 0.6% 0.5%
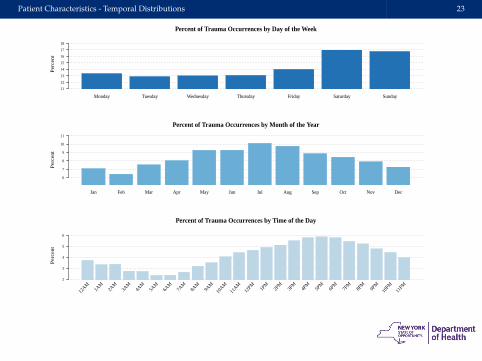
Patient Characteristics - Temporal Distributions 23
Monday Tuesday Wednesday Thursday Friday Saturday Sunday
Percent of Trauma Occurrences by Day of the Week
Pe
rce
nt
11
12
13
14
15
16
17
18
Jan Feb Mar Apr May Jun Jul Aug Sep Oct Nov Dec
Percent of Trauma Occurrences by Month of the Year
Pe
rce
nt
6
7
8
9
10
11
Percent of Trauma Occurrences by Time of the Day
Pe
rce
nt
2
3
4
5
6
12AM
1AM
2AM
3AM
4AM
5AM
6AM
7AM
8AM
9AM
10AM
11AM
12PM
1PM
2PM
3PM
4PM
5PM
6PM
7PM
8PM
9PM
10PM
11PM
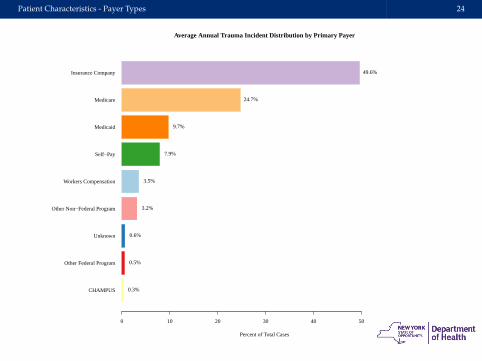
Patient Characteristics - Payer Types 24
CHAMPUS
Other Federal Program
Unknown
Other Non−Federal Program
Workers Compensation
Self−Pay
Medicaid
Medicare
Insurance Company
Average Annual Trauma Incident Distribution by Primary Payer
Percent of Total Cases
0 10 20 30 40 50
0.3%
0.5%
0.6%
3.2%
3.5%
7.9%
9.7%
24.7%
49.6%
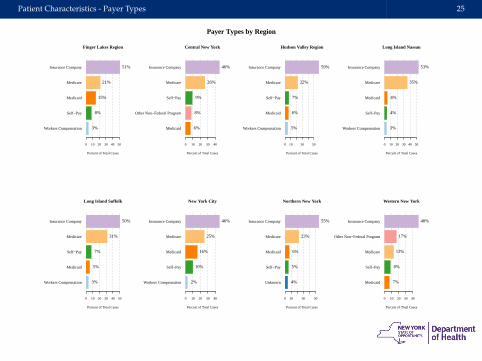
Patient Characteristics - Payer Types 25
Workers Compensation
Self−Pay
Medicaid
Medicare
Insurance Company
Finger Lakes Region
Percent of Total Cases
0 10 20 30 40 50
3%
8%
15%
21%
51%
Medicaid
Other Non−Federal Program
Self−Pay
Medicare
Insurance Company
Central New York
Percent of Total Cases
0 10 20 30 40
6%
8%
9%
26%
46%
Workers Compensation
Medicaid
Self−Pay
Medicare
Insurance Company
Hudson Valley Region
Percent of Total Cases
0 10 30 50
5%
6%
7%
22%
59%
Workers Compensation
Self−Pay
Medicaid
Medicare
Insurance Company
Long Island Nassau
Percent of Total Cases
0 10 20 30 40 50
3%
4%
4%
35%
53%
Workers Compensation
Medicaid
Self−Pay
Medicare
Insurance Company
Long Island Suffolk
Percent of Total Cases
0 10 20 30 40 50
3%
5%
7%
31%
50%
Workers Compensation
Self−Pay
Medicaid
Medicare
Insurance Company
New York City
Percent of Total Cases
0 10 20 30 40
2%
10%
16%
25%
46%
Unknown
Self−Pay
Medicaid
Medicare
Insurance Company
Northern New York
Percent of Total Cases
0 10 30 50
4%
5%
6%
23%
55%
Medicaid
Self−Pay
Medicare
Other Non−Federal Program
Insurance Company
Western New York
Percent of Total Cases
0 10 20 30 40
7%
8%
13%
17%
48%
Payer Types by Region
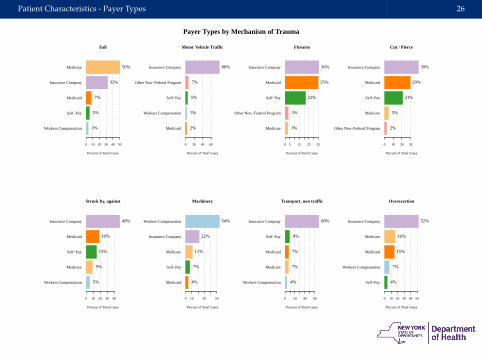
Patient Characteristics - Payer Types 26
Workers Compensation
Self−Pay
Medicaid
Insurance Company
Medicare
Fall
Percent of Total Cases
0 10 20 30 40 50
3%
5%
7%
32%
50%
Medicaid
Workers Compensation
Self−Pay
Other Non−Federal Program
Insurance Company
Motor Vehicle Traffic
Percent of Total Cases
0 20 40 60
2%
3%
5%
7%
80%
Medicare
Other Non−Federal Program
Self−Pay
Medicaid
Insurance Company
Firearm
Percent of Total Cases
0 5 15 25 35
3%
3%
22%
35%
36%
Other Non−Federal Program
Medicare
Self−Pay
Medicaid
Insurance Company
Cut / Pierce
Percent of Total Cases
0 10 20 30
2%
5%
21%
29%
39%
Workers Compensation
Medicare
Self−Pay
Medicaid
Insurance Company
Struck by, against
Percent of Total Cases
0 10 20 30 40
5%
9%
15%
18%
48%
Medicaid
Self−Pay
Medicare
Insurance Company
Workers Compensation
Machinery
Percent of Total Cases
0 10 30 50
4%
7%
11%
22%
54%
Workers Compensation
Medicare
Medicaid
Self−Pay
Insurance Company
Transport, non traffic
Percent of Total Cases
0 20 40 60
4%
7%
7%
9%
68%
Self−Pay
Workers Compensation
Medicaid
Medicare
Insurance Company
Overexertion
Percent of Total Cases
0 10 20 30 40 50
4%
7%
15%
16%
52%
Payer Types by Mechanism of Trauma

Injury Characteristics
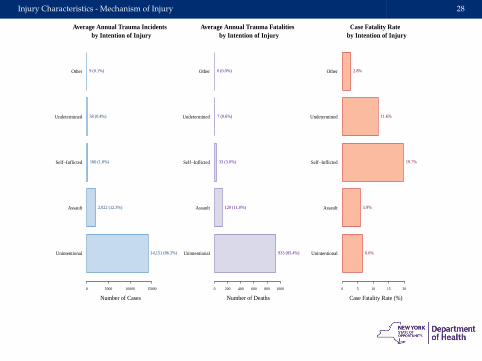
Injury Characteristics - Mechanism of Injury 28
Unintentional
Assault
Self−Inflicted
Undetermined
Other
Average Annual Trauma Incidents by Intention of Injury
Number of Cases
0 5000 10000 15000
14,151 (86.3%)
2,022 (12.3%)
166 (1.0%)
58 (0.4%)
9 (0.1%)
Unintentional
Assault
Self−Inflicted
Undetermined
Other
Average Annual Trauma Fatalities by Intention of Injury
Number of Deaths
0 200 400 600 800 1000
933 (85.4%)
120 (11.0%)
33 (3.0%)
7 (0.6%)
0 (0.0%)
Unintentional
Assault
Self−Inflicted
Undetermined
Other
Case Fatality Rate by Intention of Injury
Case Fatality Rate (%)
0 5 10 15 20
6.6%
5.9%
19.7%
11.6%
2.8%
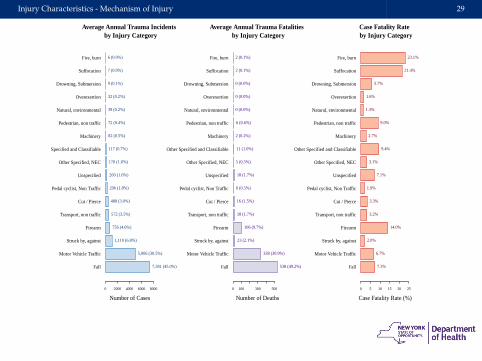
Injury Characteristics - Mechanism of Injury 29
Fall
Motor Vehicle Traffic
Struck by, against
Firearm
Transport, non traffic
Cut / Pierce
Pedal cyclist, Non Traffic
Unspecified
Other Specified, NEC
Other Specified and Classifiable
Machinery
Pedestrian, non traffic
Natural, environmental
Overexertion
Drowning, Submersion
Suffocation
Fire, burn
Average Annual Trauma Incidents by Injury Category
Number of Cases
0 2000 4000 6000 8000
7,381 (45.0%)
5,006 (30.5%)
1,110 (6.8%)
756 (4.6%)
572 (3.5%)
488 (3.0%)
296 (1.8%)
260 (1.6%)
170 (1.0%)
117 (0.7%)
82 (0.5%)
72 (0.4%)
39 (0.2%)
32 (0.2%)
9 (0.1%)
7 (0.0%)
6 (0.0%)
Fall
Motor Vehicle Traffic
Struck by, against
Firearm
Transport, non traffic
Cut / Pierce
Pedal cyclist, Non Traffic
Unspecified
Other Specified, NEC
Other Specified and Classifiable
Machinery
Pedestrian, non traffic
Natural, environmental
Overexertion
Drowning, Submersion
Suffocation
Fire, burn
Average Annual Trauma Fatalities by Injury Category
Number of Deaths
0 100 300 500
538 (49.2%)
338 (30.9%)
23 (2.1%)
106 (9.7%)
18 (1.7%)
16 (1.5%)
6 (0.5%)
18 (1.7%)
5 (0.5%)
11 (1.0%)
2 (0.2%)
6 (0.6%)
0 (0.0%)
0 (0.0%)
0 (0.0%)
2 (0.1%)
2 (0.1%)
Fall
Motor Vehicle Traffic
Struck by, against
Firearm
Transport, non traffic
Cut / Pierce
Pedal cyclist, Non Traffic
Unspecified
Other Specified, NEC
Other Specified and Classifiable
Machinery
Pedestrian, non traffic
Natural, environmental
Overexertion
Drowning, Submersion
Suffocation
Fire, burn
Case Fatality Rate by Injury Category
Case Fatality Rate (%)
0 5 10 15 20 25
7.3%
6.7%
2.0%
14.0%
3.2%
3.3%
1.9%
7.1%
3.1%
9.4%
2.7%
9.0%
1.3%
1.6%
5.7%
21.4%
23.1%
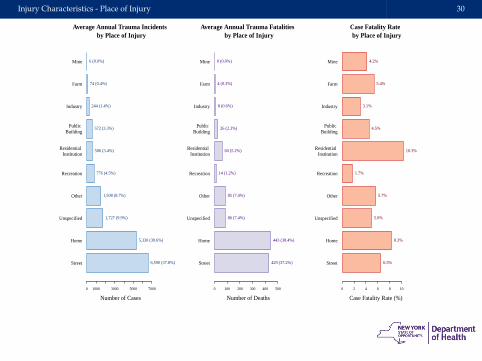
Injury Characteristics - Place of Injury 30
Street
Home
Unspecified
Other
Recreation
Residential Institution
Public Building
Industry
Farm
Mine
Average Annual Trauma Incidents by Place of Injury
Number of Cases
0 1000 3000 5000 7000
6,590 (37.8%)
5,330 (30.6%)
1,727 (9.9%)
1,508 (8.7%)
776 (4.5%)
586 (3.4%)
572 (3.3%)
244 (1.4%)
74 (0.4%)
6 (0.0%)
Street
Home
Unspecified
Other
Recreation
Residential Institution
Public Building
Industry
Farm
Mine
Average Annual Trauma Fatalities by Place of Injury
Number of Deaths
0 100 200 300 400 500
429 (37.2%)
443 (38.4%)
86 (7.4%)
85 (7.4%)
14 (1.2%)
60 (5.2%)
26 (2.3%)
8 (0.6%)
4 (0.3%)
0 (0.0%)
Street
Home
Unspecified
Other
Recreation
Residential Institution
Public Building
Industry
Farm
Mine
Case Fatality Rate by Place of Injury
Case Fatality Rate (%)
0 2 4 6 8 10
6.5%
8.3%
5.0%
5.7%
1.7%
10.3%
4.5%
3.1%
5.4%
4.2%
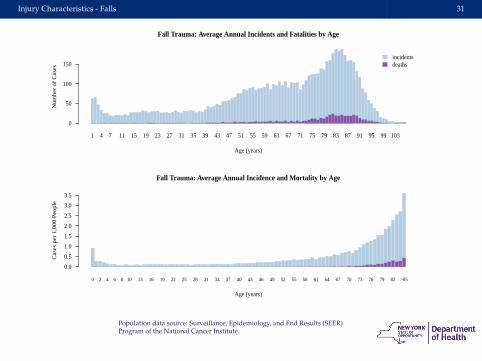
Injury Characteristics - Falls 31
1 4 7 11 15 19 23 27 31 35 39 43 47 51 55 59 63 67 71 75 79 83 87 91 95 99 103
Fall Trauma: Average Annual Incidents and Fatalities by Age
Age (years)
Nu
mb
er
of C
ase
s
0
50
100
150incidentsdeaths
0 2 4 6 8 10 13 16 19 22 25 28 31 34 37 40 43 46 49 52 55 58 61 64 67 70 73 76 79 82 >85
Fall Trauma: Average Annual Incidence and Mortality by Age
Age (years)
Ca
ses
pe
r 1
,00
0 P
eo
ple
0.0
0.5
1.0
1.5
2.0
2.5
3.0
3.5
Population data source: Surveillance, Epidemiology, and End Results (SEER)Program of the National Cancer Institute.
Injury Characteristics - Motor Vehicle Traffic 32
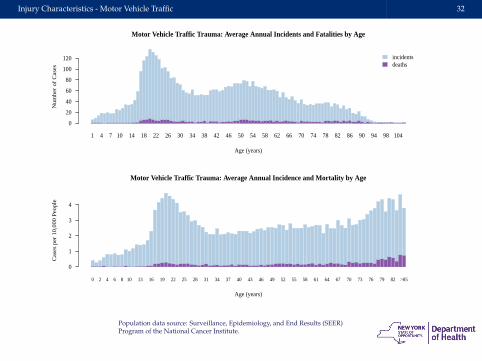
1 4 7 10 14 18 22 26 30 34 38 42 46 50 54 58 62 66 70 74 78 82 86 90 94 98 104
Motor Vehicle Traffic Trauma: Average Annual Incidents and Fatalities by Age
Age (years)
Nu
mb
er
of C
ase
s
0
20
40
60
80
100
120 incidentsdeaths
0 2 4 6 8 10 13 16 19 22 25 28 31 34 37 40 43 46 49 52 55 58 61 64 67 70 73 76 79 82 >85
Motor Vehicle Traffic Trauma: Average Annual Incidence and Mortality by Age
Age (years)
Ca
ses
pe
r 1
0,0
00
Pe
op
le
0
1
2
3
4
Population data source: Surveillance, Epidemiology, and End Results (SEER)Program of the National Cancer Institute.
Injury Characteristics - Firearm 33
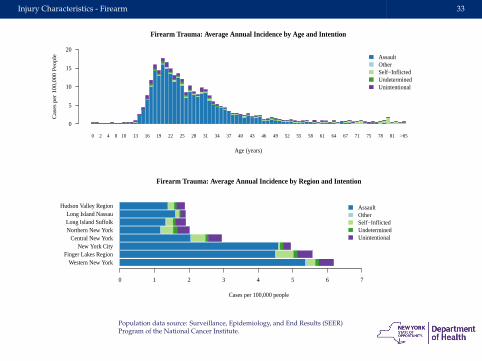
0 2 4 8 10 13 16 19 22 25 28 31 34 37 40 43 46 49 52 55 58 61 64 67 71 75 78 81 >85
Firearm Trauma: Average Annual Incidence by Age and Intention
Age (years)
Ca
ses
pe
r 1
00
,00
0 P
eo
ple
0
5
10
15
20AssaultOtherSelf−InflictedUndeterminedUnintentional
Western New YorkFinger Lakes Region
New York CityCentral New York
Northern New YorkLong Island SuffolkLong Island Nassau
Hudson Valley Region
Firearm Trauma: Average Annual Incidence by Region and Intention
Cases per 100,000 people
0 1 2 3 4 5 6 7
AssaultOtherSelf−InflictedUndeterminedUnintentional
Population data source: Surveillance, Epidemiology, and End Results (SEER)Program of the National Cancer Institute.
Injury Characteristics - Injury Severity Characteristics 34
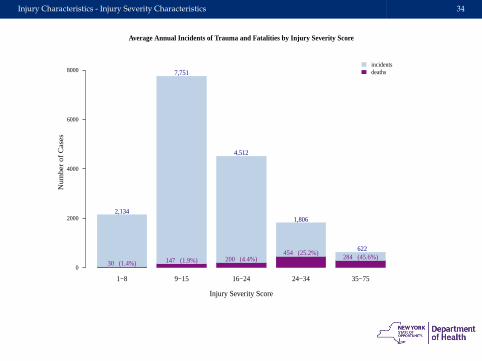
1−8 9−15 16−24 24−34 35−75
Average Annual Incidents of Trauma and Fatalities by Injury Severity Score
Injury Severity Score
Nu
mb
er
of C
ase
s
0
2000
4000
6000
8000
30 (1.4%) 147 (1.9%) 200 (4.4%)454 (25.2%)
284 (45.6%)
2,134
7,751
4,512
1,806
622
incidentsdeaths
Injury Characteristics - Injury Severity Characteristics 35
0 20 40 60 80
0
20
40
60
80
100
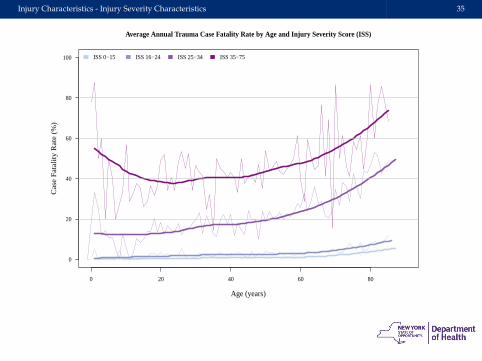
Average Annual Trauma Case Fatality Rate by Age and Injury Severity Score (ISS)
Age (years)
Ca
se F
ata
lity
Ra
te (
%)
ISS 0−15 ISS 16−24 ISS 25−34 ISS 35−75
Emergency Medical Services
Emergency Medical Services - Response Times 37
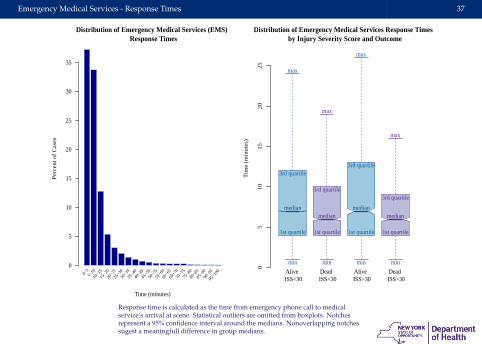
Distribution of Emergency Medical Services (EMS) Response Times
Time (minutes)
Pe
rce
nt o
f C
ase
s
0
5
10
15
20
25
30
35
0−55−
10
10−1
5
15−2
0
20−2
5
25−3
0
30−3
5
35−4
0
40−4
5
45−5
0
50−5
5
55−6
0
60−6
5
65−7
0
70−7
5
75−8
0
80−8
5
85−9
0
90−9
5
95−1
00
05
10
15
20
25
Distribution of Emergency Medical Services Response Times by Injury Severity Score and Outcome
Tim
e (
min
ute
s)
Alive ISS<30
Dead ISS<30
Alive ISS>30
Dead ISS>30
min min min min
1st quartile 1st quartile 1st quartile 1st quartile
medianmedian
medianmedian
3rd quartile
3rd quartile
3rd quartile
3rd quartile
max
max
max
max
Response time is calculated as the time from emergency phone call to medicalservice’s arrival at scene. Statistical outliers are omitted from boxplots. Notchesrepresent a 95% confidence interval around the medians. Nonoverlapping notchessugest a meaningfull difference in group medians.
Emergency Medical Services - Response Times 38
albany
allegany
bronx
broomecattaraugus
cayuga
chautauquachemung
chenango
clinton
columbia
cortland
delaware
dutchess
erie
essex
franklin
fultongenesee
greene
hamilton
herkimer
jefferson
kings
lewis
livingston
madison
monroe
montgomery
nassaunew york
niagara oneida
onondaga
ontario
orange
orleans
oswego
otsego
putnam
queens
rensselaer
richmond
rockland
st lawrence
saratoga
schenectady
schoharie
schuyler
seneca
steuben
suffolk
sullivan
tioga
tompkins
ulster
warren
washington
wayne
westchester
wyomingyates
bronxkings
new yorkfultonnassauqueens
richmondalbany
broomecolumbiacortland
eriemonroe
onondagarocklandsaratoga
schenectadyclinton
dutchessoneidaorleans
rensselaersuffolkwarren
westchestergreene
madisonniagaraoswegocayuga
chautauquagenesee
montgomeryontario
tompkinstioga
washingtonwayne
cattaraugusherkimer
livingstonotsegoseneca
schoharieessex
orangeulster
chenangosullivan
wyomingalleganydelawarejeffersonputnam
lewisyates
chemungfranklinsteuben
hamiltonschuyler
st lawrence
EMS Response Time (minutes)
0 10 20 30 40
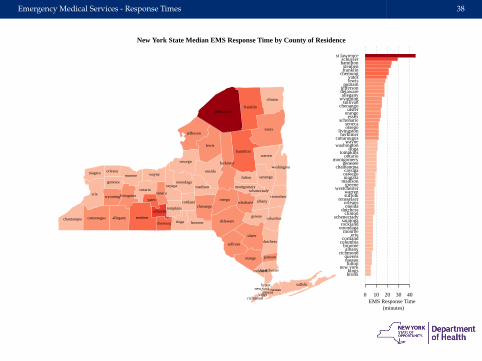
New York State Median EMS Response Time by County of Residence
Emergency Medical Services - Transport Times 39
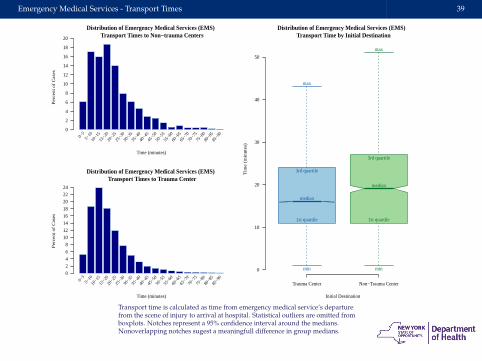
Distribution of Emergency Medical Services (EMS) Transport Times to Non−trauma Centers
Time (minutes)
Pe
rce
nt
of
Ca
ses
0
2
4
6
8
10
12
14
16
18
20
0−5
5−10
10−1
5
15−2
0
20−2
5
25−3
0
30−3
5
35−4
0
40−4
5
45−5
0
50−5
5
55−6
0
60−6
5
65−7
0
70−7
5
75−8
0
80−8
5
85−9
0
Distribution of Emergency Medical Services (EMS) Transport Times to Trauma Center
Time (minutes)
Pe
rce
nt
of
Ca
ses
0
2
4
6
8
10
12
14
16
18
20
22
24
0−5
5−10
10−1
5
15−2
0
20−2
5
25−3
0
30−3
5
35−4
0
40−4
5
45−5
0
50−5
5
55−6
0
60−6
5
65−7
0
70−7
5
75−8
0
80−8
5
85−9
0
Trauma Center Non−Trauma Center
0
10
20
30
40
50
Distribution of Emergency Medical Services (EMS) Transport Time by Initial Destination
Initial Destination
Tim
e (
min
ute
s)
min min
1st quartile 1st quartile
median
median
3rd quartile
3rd quartile
max
max
Transport time is calculated as time from emergency medical service’s departurefrom the scene of injury to arrival at hospital. Statistical outliers are omitted fromboxplots. Notches represent a 95% confidence interval around the medians.Nonoverlapping notches sugest a meaningfull difference in group medians.
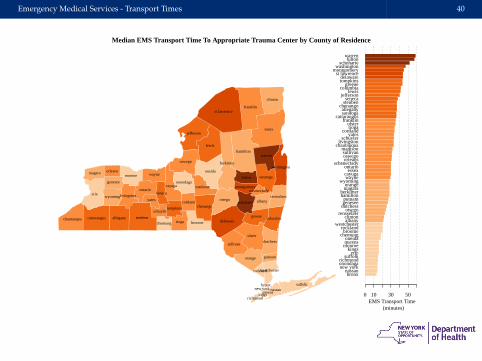
Emergency Medical Services - Transport Times 40
albany
allegany
bronx
broomecattaraugus
cayuga
chautauquachemung
chenango
clinton
columbia
cortland
delaware
dutchess
erie
essex
franklin
fultongenesee
greene
hamilton
herkimer
jefferson
kings
lewis
livingston
madison
monroe
montgomery
nassaunew york
niagara oneida
onondaga
ontario
orange
orleans
oswego
otsego
putnam
queens
rensselaer
richmond
rockland
st lawrence
saratoga
schenectady
schoharie
schuyler
seneca
steuben
suffolk
sullivan
tioga
tompkins
ulster
warren
washington
wayne
westchester
wyomingyates
bronxnassau
new yorkonondagarichmond
suffolkerie
kingsmonroequeensoneida
chemungbroome
rocklandwestchester
albanyclinton
rensselaerotsego
dutchessgeneseeputnam
hamiltonherkimer
niagaraorange
wyomingwaynecayuga
essexontario
schenectadyorleansoswegosullivanmadison
chautauqualivingston
schuyleryates
cortlandtiogaulster
franklincattaraugus
saratogaallegany
chenangosteubenseneca
jeffersonlewis
columbiagreene
tompkinsdelaware
st lawrencemontgomerywashington
schohariefulton
warren
EMS Transport Time (minutes)
0 10 30 50
Median EMS Transport Time To Appropriate Trauma Center by County of Residence
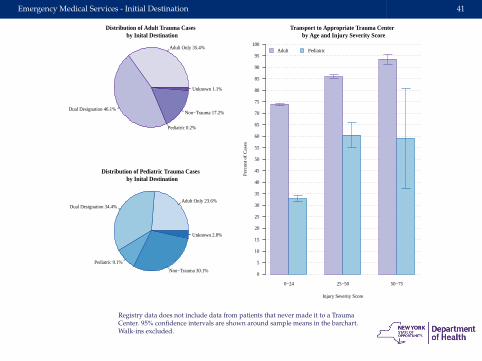
Emergency Medical Services - Initial Destination 41
Adult Only 35.4%
Dual Designation 46.1%
Pediatric 0.2%
Non−Trauma 17.2%
Unknown 1.1%
Distribution of Adult Trauma Cases by Inital Destination
Adult Only 23.6%Dual Designation 34.4%
Pediatric 9.1%
Non−Trauma 30.1%
Unknown 2.8%
Distribution of Pediatric Trauma Cases by Inital Destination
0−24 25−50 50−75
Transport to Appropriate Trauma Center by Age and Injury Severity Score
Injury Severity Score
Pe
rce
nt
of
Ca
ses
0
5
10
15
20
25
30
35
40
45
50
55
60
65
70
75
80
85
90
95
100Adult Pediatric
Registry data does not include data from patients that never made it to a TraumaCenter. 95% confidence intervals are shown around sample means in the barchart.Walk-ins excluded.
Outcome Statistics
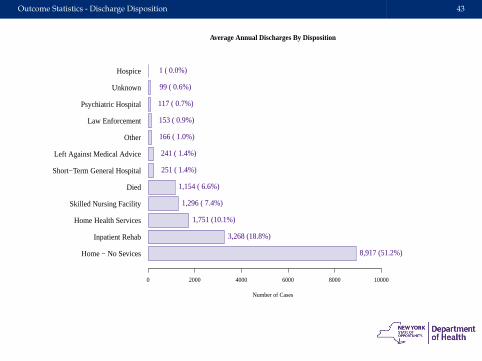
Outcome Statistics - Discharge Disposition 43
Home − No Sevices
Inpatient Rehab
Home Health Services
Skilled Nursing Facility
Died
Short−Term General Hospital
Left Against Medical Advice
Other
Law Enforcement
Psychiatric Hospital
Unknown
Hospice
Average Annual Discharges By Disposition
Number of Cases
0 2000 4000 6000 8000 10000
8,917 (51.2%)
3,268 (18.8%)
1,751 (10.1%)
1,296 ( 7.4%)
1,154 ( 6.6%)
251 ( 1.4%)
241 ( 1.4%)
166 ( 1.0%)
153 ( 0.9%)
117 ( 0.7%)
99 ( 0.6%)
1 ( 0.0%)
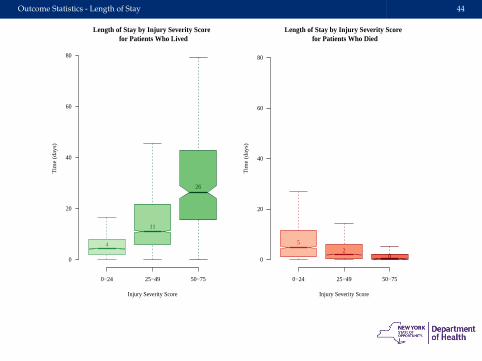
Outcome Statistics - Length of Stay 44
0−24 25−49 50−75
0
20
40
60
80
Length of Stay by Injury Severity Score for Patients Who Lived
Injury Severity Score
Tim
e (
da
ys)
4
11
26
0−24 25−49 50−75
0
20
40
60
80
Length of Stay by Injury Severity Score for Patients Who Died
Injury Severity Score
Tim
e (
da
ys)
52
0
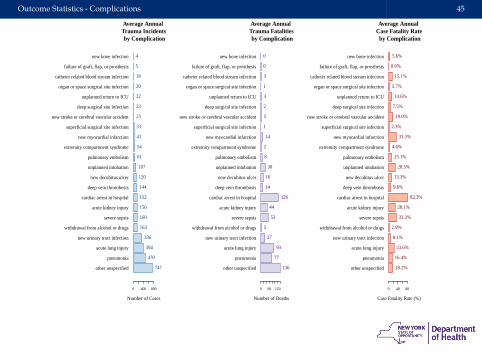
Outcome Statistics - Complications 45
other unspecified
pneumonia
acute lung injury
new urinary tract infection
withdrawal from alcohol or drugs
severe sepsis
acute kidney injury
cardiac arrest in hospital
deep vein thrombosis
new decubitus ulcer
unplanned intubation
pulmonary embolism
extremity compartment syndrome
new myocardial infarction
superficial surgical site infection
new stroke or cerebral vascular accident
deep surgical site infection
unplanned return to ICU
organ or space surgical site infection
catheter related blood stream infection
failure of graft, flap, or prosthesis
new bone infection
Average Annual Trauma Incidents by Complication
Number of Cases
0 400 800
747
470
394
336
163
160
156
152
144
120
107
61
54
41
33
25
23
22
20
18
5
4
other unspecified
pneumonia
acute lung injury
new urinary tract infection
withdrawal from alcohol or drugs
severe sepsis
acute kidney injury
cardiac arrest in hospital
deep vein thrombosis
new decubitus ulcer
unplanned intubation
pulmonary embolism
extremity compartment syndrome
new myocardial infarction
superficial surgical site infection
new stroke or cerebral vascular accident
deep surgical site infection
unplanned return to ICU
organ or space surgical site infection
catheter related blood stream infection
failure of graft, flap, or prosthesis
new bone infection
Average Annual Trauma Fatalities by Complication
Number of Deaths
0 60 120
136
77
93
27
5
53
44
126
14
16
30
8
2
14
1
5
2
3
1
3
0
0
other unspecified
pneumonia
acute lung injury
new urinary tract infection
withdrawal from alcohol or drugs
severe sepsis
acute kidney injury
cardiac arrest in hospital
deep vein thrombosis
new decubitus ulcer
unplanned intubation
pulmonary embolism
extremity compartment syndrome
new myocardial infarction
superficial surgical site infection
new stroke or cerebral vascular accident
deep surgical site infection
unplanned return to ICU
organ or space surgical site infection
catheter related blood stream infection
failure of graft, flap, or prosthesis
new bone infection
Average Annual Case Fatality Rate by Complication
Case Fatality Rate (%)
0 40 80
18.2%
16.4%
23.6%
8.1%
2.9%
33.3%
28.1%
82.3%
9.6%
13.3%
28.5%
13.1%
4.6%
33.3%
2.3%
19.0%
7.5%
14.6%
3.7%
15.1%
0.0%
5.6%
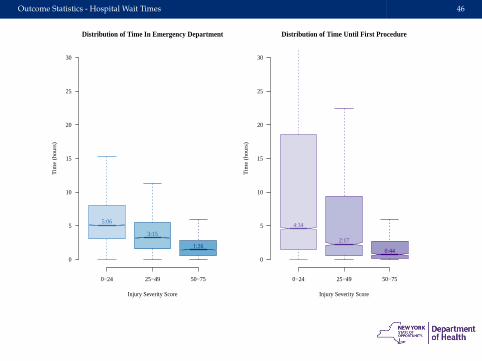
Outcome Statistics - Hospital Wait Times 46
0−24 25−49 50−75
0
5
10
15
20
25
30
Distribution of Time In Emergency Department
Injury Severity Score
Tim
e (
ho
urs
)
5:06
3:15
1:26
0−24 25−49 50−75
0
5
10
15
20
25
30
Distribution of Time Until First Procedure
Injury Severity Score
Tim
e (
ho
urs
)
4:34
2:17
0:44
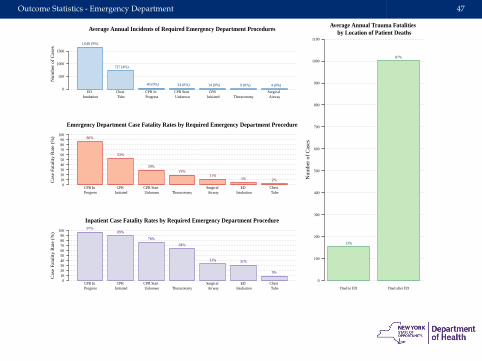
Outcome Statistics - Emergency Department 47
ED Intubation
Chest Tube
CPR In Progress
CPR Start Unknown
CPR Initiated Thoracotomy
Surgical Airway
Average Annual Incidents of Required Emergency Department Procedures
Nu
mb
er
of
Ca
ses
0
500
1000
1500
1,648 (9%)
727 (4%)
40 (0%) 24 (0%) 14 (0%) 9 (0%) 4 (0%)
CPR In Progress
CPR Initiated
CPR Start Unknown Thoracotomy
Surgical Airway
ED Intubation
Chest Tube
Emergency Department Case Fatality Rates by Required Emergency Department Procedure
Ca
se F
ata
lity
Ra
te (
%)
0102030405060708090
10086%
53%
29%19%
11%5% 2%
CPR In Progress
CPR Initiated
CPR Start Unknown Thoracotomy
Surgical Airway
ED Intubation
Chest Tube
Inpatient Case Fatality Rates by Required Emergency Department Procedure
Ca
se F
ata
lity
Ra
te (
%)
0102030405060708090
10097%
89%
76%
64%
33% 31%
9%
Died in ED Died after ED
Average Annual Trauma Fatalities by Location of Patient Deaths
Nu
mb
er
of
Ca
ses
0
100
200
300
400
500
600
700
800
900
1000
1100
13%
87%
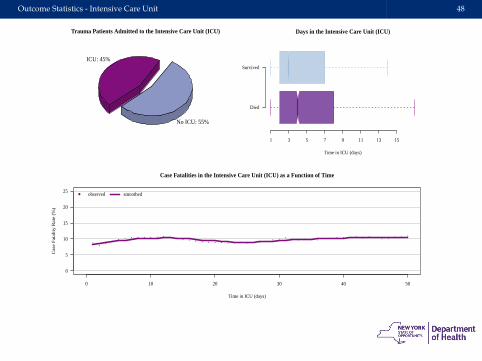
Outcome Statistics - Intensive Care Unit 48
Trauma Patients Admitted to the Intensive Care Unit (ICU)
ICU: 45%
No ICU: 55%
Died
Survived
Days in the Intensive Care Unit (ICU)
Time in ICU (days)
1 3 5 7 9 11 13 15
0 10 20 30 40 50
0
5
10
15
20
25
Case Fatalities in the Intensive Care Unit (ICU) as a Function of Time
Time in ICU (days)
Ca
se F
ata
lity
Ra
te (
%)
observed smoothed
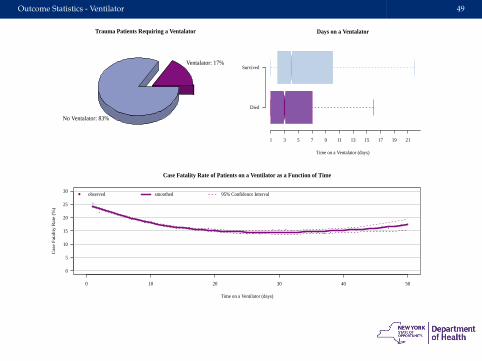
Outcome Statistics - Ventilator 49
Trauma Patients Requiring a Ventalator
No Ventalator: 83%
Ventalator: 17%
Died
Survived
Days on a Ventalator
Time on a Ventalator (days)
1 3 5 7 9 11 13 15 17 19 21
0 10 20 30 40 50
0
5
10
15
20
25
30
Case Fatality Rate of Patients on a Ventilator as a Function of Time
Time on a Ventilator (days)
Ca
se F
ata
lity
Ra
te (
%)
observed smoothed 95% Confidence Interval
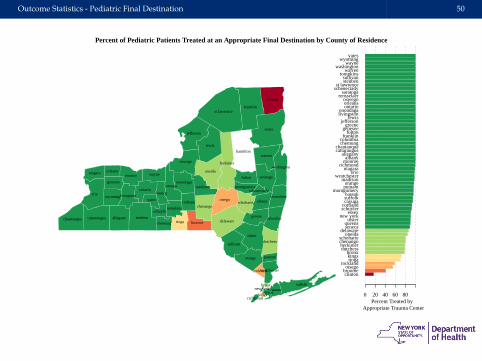
Outcome Statistics - Pediatric Final Destination 50
albany
allegany
bronx
broomecattaraugus
cayuga
chautauquachemung
chenango
clinton
columbia
cortland
delaware
dutchess
erie
essex
franklin
fultongenesee
greene
hamilton
herkimer
jefferson
kings
lewis
livingston
madison
monroe
montgomery
nassaunew york
niagara oneida
onondaga
ontario
orange
orleans
oswego
otsego
putnam
queens
rensselaer
richmond
rockland
st lawrence
saratoga
schenectady
schoharie
schuyler
seneca
steuben
suffolk
sullivan
tioga
tompkins
ulster
warren
washington
wayne
westchester
wyomingyates
clintonbroomeotsego
rocklandtiogakingsbronx
dutchessherkimerchenangoschoharie
oneidadelaware
senecaqueensulster
new yorkessex
schuylercortlandcayugasuffolknassau
montgomeryputnamorange
madisonwestchester
erieniagara
richmondmonroealbany
alleganycattarauguschautauqua
chemungcolumbia
franklinfulton
geneseegreene
jeffersonlewis
livingstononondaga
ontarioorleansoswego
rensselaersaratoga
schenectadyst lawrence
steubensullivan
tompkinswarren
washingtonwayne
wyomingyates
Percent Treated by Appropriate Trauma Center
0 20 40 60 80
Percent of Pediatric Patients Treated at an Appropriate Final Destination by County of Residence
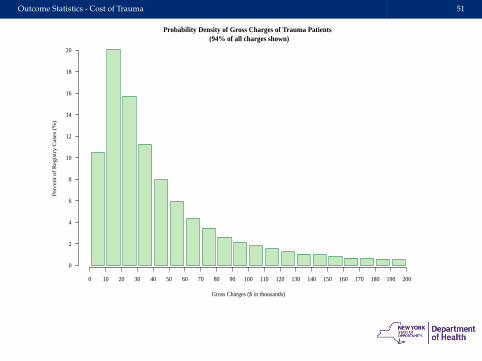
Outcome Statistics - Cost of Trauma 51
Probability Density of Gross Charges of Trauma Patients (94% of all charges shown)
Gross Charges ($ in thousands)
Pe
rce
nt o
f R
eg
istr
y C
ase
s (%
)
0
2
4
6
8
10
12
14
16
18
20
0 10 20 30 40 50 60 70 80 90 100 110 120 130 140 150 160 170 180 190 200
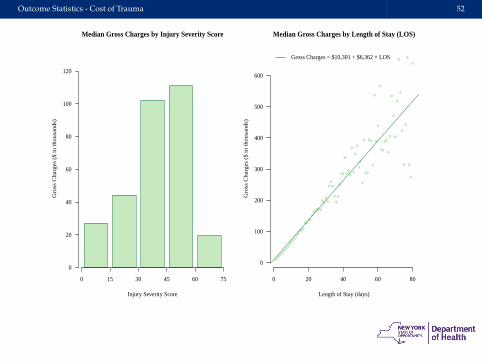
Outcome Statistics - Cost of Trauma 52
Median Gross Charges by Injury Severity Score
Injury Severity Score
Gro
ss C
ha
rge
s ($
in th
ou
san
ds)
0
20
40
60
80
100
120
0 15 30 45 60 75 0 20 40 60 80
0
100
200
300
400
500
600
Median Gross Charges by Length of Stay (LOS)
Length of Stay (days)
Gro
ss C
ha
rge
s ($
in th
ou
san
ds)
Gross Charges = $10,301 + $6,362 × LOS

Risk Adjusted Comparisons
Risk Adjusted Comparisons - Trauma Center Designation 54
2
4
6
8
10
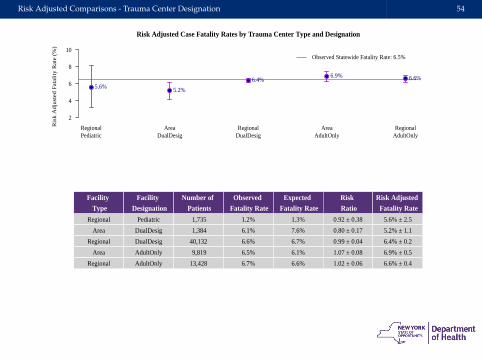
Risk Adjusted Case Fatality Rates by Trauma Center Type and Designation
Ris
k A
dju
ste
d F
ata
lity
Ra
te (
%)
RegionalPediatric
AreaDualDesig
RegionalDualDesig
AreaAdultOnly
RegionalAdultOnly
5.6% 5.2%
6.4%6.9% 6.6%
Observed Statewide Fatality Rate: 6.5%
Facility Type
Regional
Area
Regional
Area
Regional
Facility Designation
Pediatric
DualDesig
DualDesig
AdultOnly
AdultOnly
Number of Patients
1,735
1,384
40,132
9,819
13,428
Observed Fatality Rate
1.2%
6.1%
6.6%
6.5%
6.7%
Expected Fatality Rate
1.3%
7.6%
6.7%
6.1%
6.6%
Risk Ratio
0.92 ± 0.38
0.80 ± 0.17
0.99 ± 0.04
1.07 ± 0.08
1.02 ± 0.06
Risk Adjusted Fatality Rate
5.6% ± 2.5
5.2% ± 1.1
6.4% ± 0.2
6.9% ± 0.5
6.6% ± 0.4
Risk Adjusted Comparisons - Pediatric Treatment by Designation 55
0
2
4
6
8
10
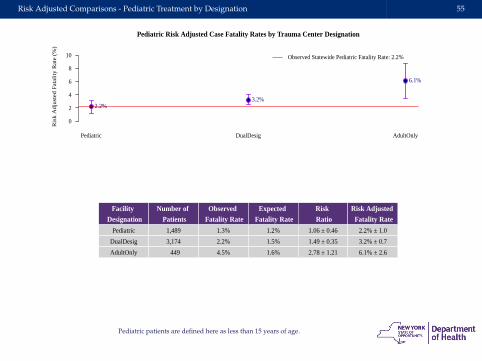
Pediatric Risk Adjusted Case Fatality Rates by Trauma Center Designation
Ris
k A
dju
ste
d F
ata
lity
Ra
te (
%)
Pediatric DualDesig AdultOnly
2.2%3.2%
6.1%
Observed Statewide Pediatric Fatality Rate: 2.2%
Facility Designation
Pediatric
DualDesig
AdultOnly
Number of Patients
1,489
3,174
449
Observed Fatality Rate
1.3%
2.2%
4.5%
Expected Fatality Rate
1.2%
1.5%
1.6%
Risk Ratio
1.06 ± 0.46
1.49 ± 0.35
2.78 ± 1.21
Risk Adjusted Fatality Rate
2.2% ± 1.0
3.2% ± 0.7
6.1% ± 2.6
Pediatric patients are defined here as less than 15 years of age.
Risk Adjusted Comparisons - Referral Status 56
3
4
5
6
7
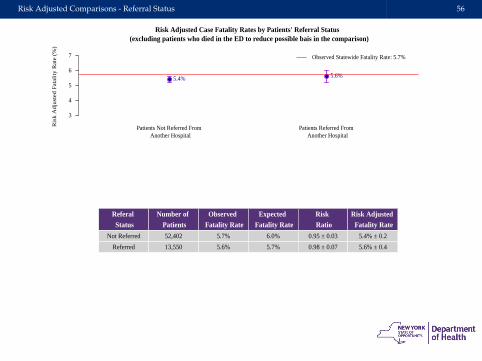
Risk Adjusted Case Fatality Rates by Patients' Referral Status (excluding patients who died in the ED to reduce possible bais in the comparison)
Ris
k A
dju
ste
d F
ata
lity
Ra
te (
%)
Patients Not Referred From Another Hospital
Patients Referred From Another Hospital
5.4% 5.6%
Observed Statewide Fatality Rate: 5.7%
Referal Status
Not Referred
Referred
Number of Patients
52,402
13,550
Observed Fatality Rate
5.7%
5.6%
Expected Fatality Rate
6.0%
5.7%
Risk Ratio
0.95 ± 0.03
0.98 ± 0.07
Risk Adjusted Fatality Rate
5.4% ± 0.2
5.6% ± 0.4
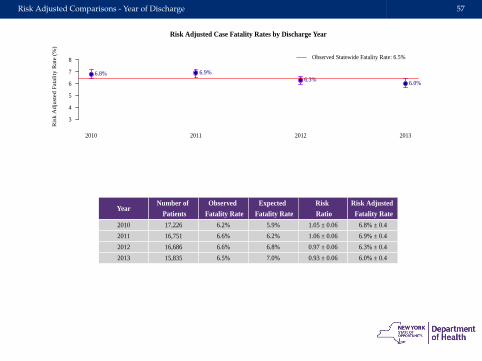
Risk Adjusted Comparisons - Year of Discharge 57
3
4
5
6
7
8
Risk Adjusted Case Fatality Rates by Discharge Year
Ris
k A
dju
ste
d F
ata
lity
Ra
te (
%)
2010 2011 2012 2013
6.8% 6.9%6.3%
6.0%
Observed Statewide Fatality Rate: 6.5%
Year
2010
2011
2012
2013
Number of Patients
17,226
16,751
16,686
15,835
Observed Fatality Rate
6.2%
6.6%
6.6%
6.5%
Expected Fatality Rate
5.9%
6.2%
6.8%
7.0%
Risk Ratio
1.05 ± 0.06
1.06 ± 0.06
0.97 ± 0.06
0.93 ± 0.06
Risk Adjusted Fatality Rate
6.8% ± 0.4
6.9% ± 0.4
6.3% ± 0.4
6.0% ± 0.4
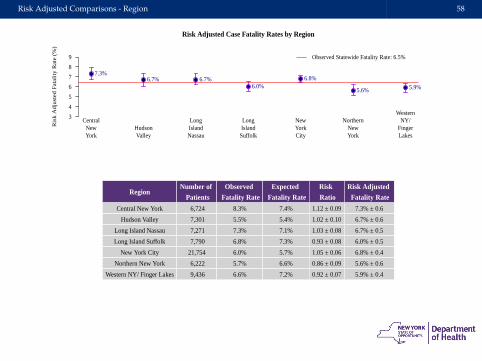
Risk Adjusted Comparisons - Region 58
3
4
5
6
7
8
9
Risk Adjusted Case Fatality Rates by Region
Ris
k A
dju
ste
d F
ata
lity
Ra
te (
%)
CentralNewYork
HudsonValley
LongIslandNassau
LongIslandSuffolk
NewYorkCity
NorthernNewYork
WesternNY/
FingerLakes
7.3%6.7% 6.7%
6.0%6.8%
5.6% 5.9%
Observed Statewide Fatality Rate: 6.5%
Region
Central New York
Hudson Valley
Long Island Nassau
Long Island Suffolk
New York City
Northern New York
Western NY/ Finger Lakes
Number of Patients
6,724
7,301
7,271
7,790
21,754
6,222
9,436
Observed Fatality Rate
8.3%
5.5%
7.3%
6.8%
6.0%
5.7%
6.6%
Expected Fatality Rate
7.4%
5.4%
7.1%
7.3%
5.7%
6.6%
7.2%
Risk Ratio
1.12 ± 0.09
1.02 ± 0.10
1.03 ± 0.08
0.93 ± 0.08
1.05 ± 0.06
0.86 ± 0.09
0.92 ± 0.07
Risk Adjusted Fatality Rate
7.3% ± 0.6
6.7% ± 0.6
6.7% ± 0.5
6.0% ± 0.5
6.8% ± 0.4
5.6% ± 0.6
5.9% ± 0.4
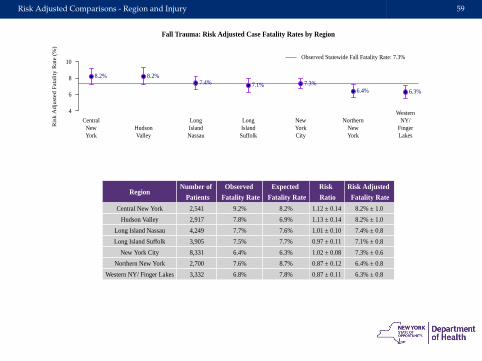
Risk Adjusted Comparisons - Region and Injury 59
4
6
8
10
Fall Trauma: Risk Adjusted Case Fatality Rates by Region
Ris
k A
dju
ste
d F
ata
lity
Ra
te (
%)
CentralNewYork
HudsonValley
LongIslandNassau
LongIslandSuffolk
NewYorkCity
NorthernNewYork
WesternNY/
FingerLakes
8.2% 8.2%7.4% 7.1% 7.3%
6.4% 6.3%
Observed Statewide Fall Fatality Rate: 7.3%
Region
Central New York
Hudson Valley
Long Island Nassau
Long Island Suffolk
New York City
Northern New York
Western NY/ Finger Lakes
Number of Patients
2,541
2,917
4,249
3,905
8,331
2,700
3,332
Observed Fatality Rate
9.2%
7.8%
7.7%
7.5%
6.4%
7.6%
6.8%
Expected Fatality Rate
8.2%
6.9%
7.6%
7.7%
6.3%
8.7%
7.8%
Risk Ratio
1.12 ± 0.14
1.13 ± 0.14
1.01 ± 0.10
0.97 ± 0.11
1.02 ± 0.08
0.87 ± 0.12
0.87 ± 0.11
Risk Adjusted Fatality Rate
8.2% ± 1.0
8.2% ± 1.0
7.4% ± 0.8
7.1% ± 0.8
7.3% ± 0.6
6.4% ± 0.8
6.3% ± 0.8
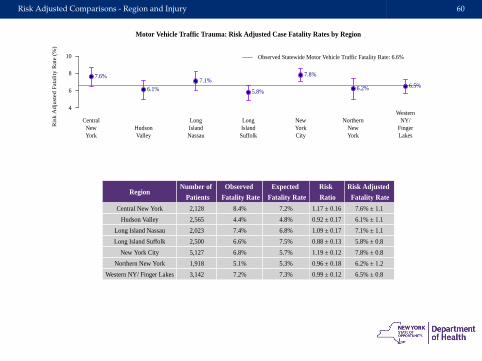
Risk Adjusted Comparisons - Region and Injury 60
4
6
8
10
Motor Vehicle Traffic Trauma: Risk Adjusted Case Fatality Rates by Region
Ris
k A
dju
ste
d F
ata
lity
Ra
te (
%)
CentralNewYork
HudsonValley
LongIslandNassau
LongIslandSuffolk
NewYorkCity
NorthernNewYork
WesternNY/
FingerLakes
7.6%
6.1%7.1%
5.8%
7.8%
6.2% 6.5%
Observed Statewide Motor Vehicle Traffic Fatality Rate: 6.6%
Region
Central New York
Hudson Valley
Long Island Nassau
Long Island Suffolk
New York City
Northern New York
Western NY/ Finger Lakes
Number of Patients
2,128
2,565
2,023
2,500
5,127
1,918
3,142
Observed Fatality Rate
8.4%
4.4%
7.4%
6.6%
6.8%
5.1%
7.2%
Expected Fatality Rate
7.2%
4.8%
6.8%
7.5%
5.7%
5.3%
7.3%
Risk Ratio
1.17 ± 0.16
0.92 ± 0.17
1.09 ± 0.17
0.88 ± 0.13
1.19 ± 0.12
0.96 ± 0.18
0.99 ± 0.12
Risk Adjusted Fatality Rate
7.6% ± 1.1
6.1% ± 1.1
7.1% ± 1.1
5.8% ± 0.8
7.8% ± 0.8
6.2% ± 1.2
6.5% ± 0.8
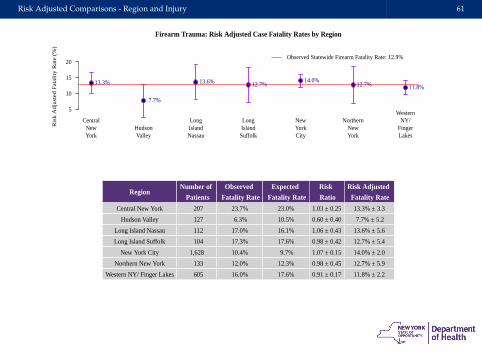
Risk Adjusted Comparisons - Region and Injury 61
5
10
15
20
Firearm Trauma: Risk Adjusted Case Fatality Rates by Region
Ris
k A
dju
ste
d F
ata
lity
Ra
te (
%)
CentralNewYork
HudsonValley
LongIslandNassau
LongIslandSuffolk
NewYorkCity
NorthernNewYork
WesternNY/
FingerLakes
13.3%
7.7%
13.6% 12.7%14.0%
12.7% 11.8%
Observed Statewide Firearm Fatality Rate: 12.9%
Region
Central New York
Hudson Valley
Long Island Nassau
Long Island Suffolk
New York City
Northern New York
Western NY/ Finger Lakes
Number of Patients
207
127
112
104
1,628
133
605
Observed Fatality Rate
23.7%
6.3%
17.0%
17.3%
10.4%
12.0%
16.0%
Expected Fatality Rate
23.0%
10.5%
16.1%
17.6%
9.7%
12.3%
17.6%
Risk Ratio
1.03 ± 0.25
0.60 ± 0.40
1.06 ± 0.43
0.98 ± 0.42
1.07 ± 0.15
0.98 ± 0.45
0.91 ± 0.17
Risk Adjusted Fatality Rate
13.3% ± 3.3
7.7% ± 5.2
13.6% ± 5.6
12.7% ± 5.4
14.0% ± 2.0
12.7% ± 5.9
11.8% ± 2.2
Comparison to National Trauma Data Bank
Comparison to National Trauma Data Bank - Case Fatality Rates By Injury Severity Score 63
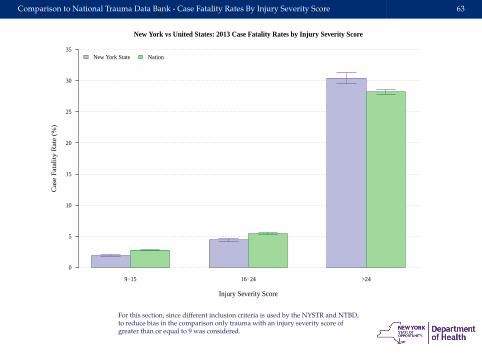
9−15 16−24 >24
New York vs United States: 2013 Case Fatality Rates by Injury Severity Score
Injury Severity Score
Ca
se F
ata
lity
Ra
te (
%)
0
5
10
15
20
25
30
35New York State Nation
For this section, since different inclusion criteria is used by the NYSTR and NTBD,to reduce bias in the comparison only trauma with an injury severity score ofgreater than or equal to 9 was considered.
Comparison to National Trauma Data Bank - Case Fatality Rates By Age 64
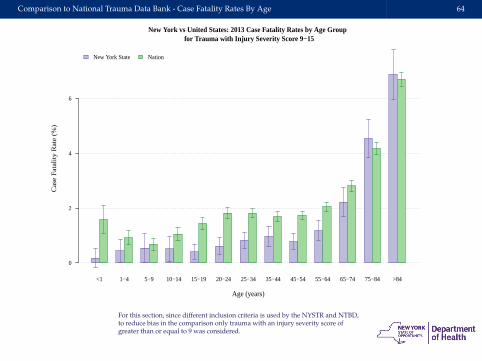
<1 1−4 5−9 10−14 15−19 20−24 25−34 35−44 45−54 55−64 65−74 75−84 >84
New York vs United States: 2013 Case Fatality Rates by Age Group for Trauma with Injury Severity Score 9−15
Age (years)
Ca
se F
ata
lity
Ra
te (
%)
0
2
4
6
New York State Nation
For this section, since different inclusion criteria is used by the NYSTR and NTBD,to reduce bias in the comparison only trauma with an injury severity score ofgreater than or equal to 9 was considered.
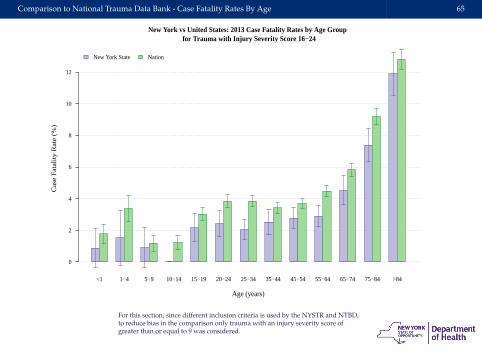
Comparison to National Trauma Data Bank - Case Fatality Rates By Age 65
<1 1−4 5−9 10−14 15−19 20−24 25−34 35−44 45−54 55−64 65−74 75−84 >84
New York vs United States: 2013 Case Fatality Rates by Age Group for Trauma with Injury Severity Score 16−24
Age (years)
Ca
se F
ata
lity
Ra
te (
%)
0
2
4
6
8
10
12
New York State Nation
For this section, since different inclusion criteria is used by the NYSTR and NTBD,to reduce bias in the comparison only trauma with an injury severity score ofgreater than or equal to 9 was considered.
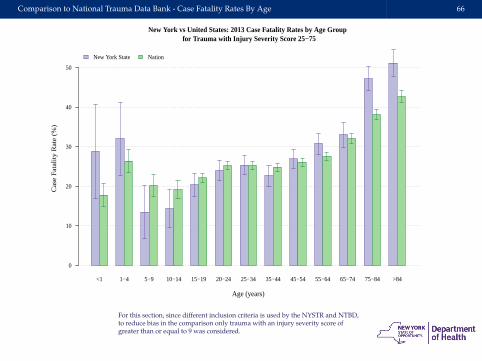
Comparison to National Trauma Data Bank - Case Fatality Rates By Age 66
<1 1−4 5−9 10−14 15−19 20−24 25−34 35−44 45−54 55−64 65−74 75−84 >84
New York vs United States: 2013 Case Fatality Rates by Age Group for Trauma with Injury Severity Score 25−75
Age (years)
Ca
se F
ata
lity
Ra
te (
%)
0
10
20
30
40
50
New York State Nation
For this section, since different inclusion criteria is used by the NYSTR and NTBD,to reduce bias in the comparison only trauma with an injury severity score ofgreater than or equal to 9 was considered.

Appendix
Appendix - Incidence By Trauma Mechanism and County 68
albany
allegany
bronx
broomecattaraugus
cayuga
chautauquachemung
chenango
clinton
columbia
cortland
delaware
dutchess
erie
essex
franklin
fultongenesee
greene
hamilton
herkimer
jefferson
kings
lewis
livingston
madison
monroe
montgomery
nassaunew york
niagara oneida
onondaga
ontario
orange
orleans
oswego
otsego
putnam
queens
rensselaer
richmond
rockland
st lawrence
saratoga
schenectady
schoharie
schuyler
seneca
steuben
suffolk
sullivan
tioga
tompkins
ulster
warren
washington
wayne
westchester
wyomingyates
franklinchemungschuyler
tompkinsst lawrence
essexsteuben
chautauquaschenectady
kingsorangebronx
new yorkwayne
tiogaputnamwarren
westchestermonroesullivan
washingtonwyoming
niagaraerie
lewisrichmond
senecaonondaga
oneidaalleganysaratogamadison
cayugaulster
schohariedutchessjeffersongenesee
rensselaerlivingston
albanyorleansoswegocortlandclintonqueens
cattaraugusontario
hamiltonherkimercolumbia
yatesfulton
chenangorockland
greenemontgomery
otsegobroomenassau
delawaresuffolk
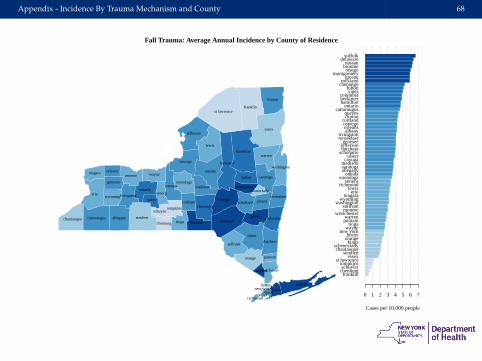
Cases per 10,000 people
0 1 2 3 4 5 6 7
Fall Trauma: Average Annual Incidence by County of Residence
Appendix - Incidence By Trauma Mechanism and County 69
albany
allegany
bronx
broomecattaraugus
cayuga
chautauquachemung
chenango
clinton
columbia
cortland
delaware
dutchess
erie
essex
franklin
fultongenesee
greene
hamilton
herkimer
jefferson
kings
lewis
livingston
madison
monroe
montgomery
nassaunew york
niagara oneida
onondaga
ontario
orange
orleans
oswego
otsego
putnam
queens
rensselaer
richmond
rockland
st lawrence
saratoga
schenectady
schoharie
schuyler
seneca
steuben
suffolk
sullivan
tioga
tompkins
ulster
warren
washington
wayne
westchester
wyomingyates
franklinchemungnew york
st lawrencechautauqua
tompkinskings
clintonrichmond
essexbronx
queensrockland
westchestersteubenwarrenputnamotsego
eriehamilton
tiogaalbany
schenectadyjeffersonschuyler
orangemonroe
onondagasenecaoneida
rensselaerfulton
saratogalewis
broomeherkimer
nassaucortlandniagara
columbiawashington
alleganymadison
schoharieontario
wyomingcattaraugus
geneseedutchess
cayugadelawaresullivan
livingstonyatesulster
oswegomontgomery
suffolkwayne
orleanschenango
greene
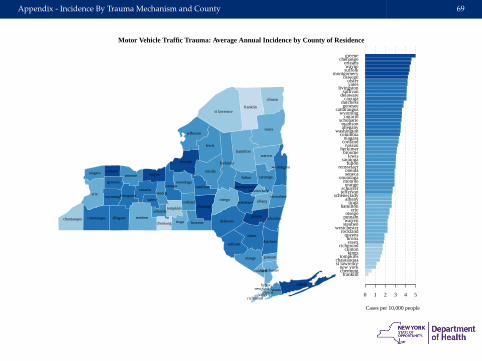
Cases per 10,000 people
0 1 2 3 4 5
Motor Vehicle Traffic Trauma: Average Annual Incidence by County of Residence
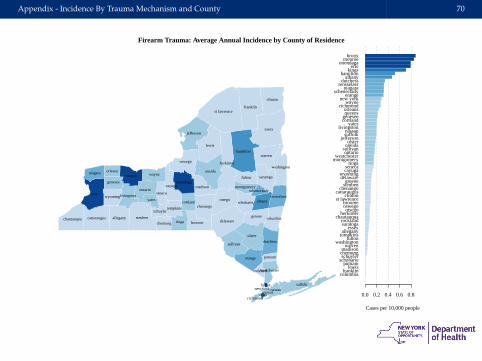
Appendix - Incidence By Trauma Mechanism and County 70
albany
allegany
bronx
broomecattaraugus
cayuga
chautauquachemung
chenango
clinton
columbia
cortland
delaware
dutchess
erie
essex
franklin
fultongenesee
greene
hamilton
herkimer
jefferson
kings
lewis
livingston
madison
monroe
montgomery
nassaunew york
niagara oneida
onondaga
ontario
orange
orleans
oswego
otsego
putnam
queens
rensselaer
richmond
rockland
st lawrence
saratoga
schenectady
schoharie
schuyler
seneca
steuben
suffolk
sullivan
tioga
tompkins
ulster
warren
washington
wayne
westchester
wyomingyates
columbiafranklin
lewisputnam
schoharieschuyler
chemungmadison
warrenwashington
fultontompkinsallegany
essexsaratogarockland
chautauquaherkimer
otsegooswegobroome
st lawrenceclinton
cattarauguschenango
steubengreene
delawarewyoming
cayugaseneca
tiogamontgomerywestchester
ontariosullivanoneidaulster
jeffersonsuffolknassau
livingstonyates
cortlandgeneseequeensorleans
richmondwayne
new yorkorange
schenectadyniagara
rensselaerdutchess
albanyhamilton
kingserie
onondagamonroe
bronx
Cases per 10,000 people
0.0 0.2 0.4 0.6 0.8
Firearm Trauma: Average Annual Incidence by County of Residence
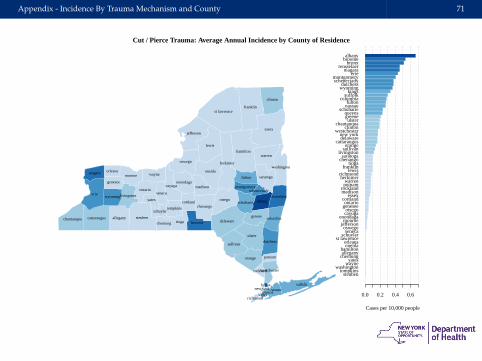
Appendix - Incidence By Trauma Mechanism and County 71
albany
allegany
bronx
broomecattaraugus
cayuga
chautauquachemung
chenango
clinton
columbia
cortland
delaware
dutchess
erie
essex
franklin
fultongenesee
greene
hamilton
herkimer
jefferson
kings
lewis
livingston
madison
monroe
montgomery
nassaunew york
niagara oneida
onondaga
ontario
orange
orleans
oswego
otsego
putnam
queens
rensselaer
richmond
rockland
st lawrence
saratoga
schenectady
schoharie
schuyler
seneca
steuben
suffolk
sullivan
tioga
tompkins
ulster
warren
washington
wayne
westchester
wyomingyates
steubentompkins
washingtonwayneyates
chemungalleganyhamilton
oneidaorleans
st lawrenceschuyler
senecaoswego
jeffersonmonroe
onondagacayugaotsego
geneseeontario
cortlandessex
madisonrocklandputnamwarren
herkimerrichmond
lewisfranklin
tiogachenangosaratoga
livingstonsullivanorange
cattaraugusdelawarenew york
westchesterclinton
chautauquaulster
greenequeens
schoharienassaufulton
columbiasuffolk
kingswyomingdutchess
schenectadymontgomery
erieniagara
rensselaerbronx
broomealbany
Cases per 10,000 people
0.0 0.2 0.4 0.6
Cut / Pierce Trauma: Average Annual Incidence by County of Residence

Appendix - Incidence By Trauma Mechanism and County 72
albany
allegany
bronx
broomecattaraugus
cayuga
chautauquachemung
chenango
clinton
columbia
cortland
delaware
dutchess
erie
essex
franklin
fultongenesee
greene
hamilton
herkimer
jefferson
kings
lewis
livingston
madison
monroe
montgomery
nassaunew york
niagara oneida
onondaga
ontario
orange
orleans
oswego
otsego
putnam
queens
rensselaer
richmond
rockland
st lawrence
saratoga
schenectady
schoharie
schuyler
seneca
steuben
suffolk
sullivan
tioga
tompkins
ulster
warren
washington
wayne
westchester
wyomingyates
chemungfranklin
fultonhamiltonschuyler
new yorkwestchester
bronxkingsulster
queensrichmond
nassaumonroeputnamsullivanorange
chautauquarocklandjefferson
eriest lawrence
tompkinstioga
saratogasuffolkbroome
essexschenectady
dutchesssenecaalbany
onondagasteuben
washingtononeida
chenangocortland
greeneniagara
rensselaerwarren
livingstonherkimer
otsegoclintonoswego
madisonontario
columbiawayne
geneseewyoming
lewismontgomery
cattaraugusschoharie
orleansyates
alleganycayuga
delaware
Cases per 10,000 people
0.0 0.1 0.2 0.3 0.4
Machinery Trauma: Average Annual Incidence by County of Residence
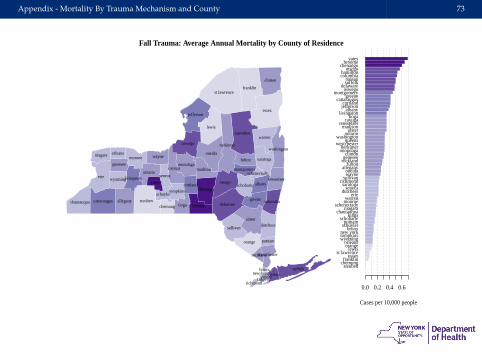
Appendix - Mortality By Trauma Mechanism and County 73
albany
allegany
bronx
broomecattaraugus
cayuga
chautauquachemung
chenango
clinton
columbia
cortland
delaware
dutchess
erie
essex
franklin
fultongenesee
greene
hamilton
herkimer
jefferson
kings
lewis
livingston
madison
monroe
montgomery
nassaunew york
niagara oneida
onondaga
ontario
orange
orleans
oswego
otsego
putnam
queens
rensselaer
richmond
rockland
st lawrence
saratoga
schenectady
schoharie
schuyler
seneca
steuben
suffolk
sullivan
tioga
tompkins
ulster
warren
washington
wayne
westchester
wyomingyates
steubenchemungfranklin
essexst lawrence
lewisorangeorleans
wyomingtompkinsnew york
bronxschuylerputnam
schohariekings
chautauquaniagara
schenectadymonroewarren
eriedutchess
senecasaratoga
richmondsullivanwayneoneida
alleganyfulton
rocklandgeneseeclinton
onondagaherkimer
westchesterqueens
washingtonontario
ulstermadison
rensselaercayuga
tiogalivingston
albanyjeffersoncortland
cattaraugusgreene
montgomeryoswego
delawaresuffolknassau
columbiahamilton
otsegochenango
broomeyates
Cases per 10,000 people
0.0 0.2 0.4 0.6
Fall Trauma: Average Annual Mortality by County of Residence
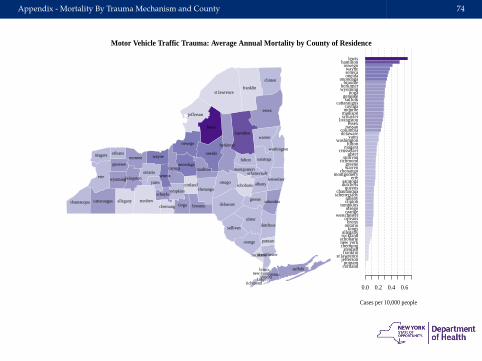
Appendix - Mortality By Trauma Mechanism and County 74
albany
allegany
bronx
broomecattaraugus
cayuga
chautauquachemung
chenango
clinton
columbia
cortland
delaware
dutchess
erie
essex
franklin
fultongenesee
greene
hamilton
herkimer
jefferson
kings
lewis
livingston
madison
monroe
montgomery
nassaunew york
niagara oneida
onondaga
ontario
orange
orleans
oswego
otsego
putnam
queens
rensselaer
richmond
rockland
st lawrence
saratoga
schenectady
schoharie
schuyler
seneca
steuben
suffolk
sullivan
tioga
tompkins
ulster
warren
washington
wayne
westchester
wyomingyates
cortlandputnam
jeffersonst lawrence
franklinsteuben
chemungnew yorkschoharierocklandallegany
kingsontariobronx
orleanswestchester
orangeotsego
tompkinsclintonalbany
schenectadychautauqua
queensdutchesssaratoga
eriemontgomery
chenangowarrengreene
richmondsullivan
ulsterrensselaer
niagarafulton
washingtonyates
delawarecolumbia
nassauessex
livingstonschuylermadisonmonroecayuga
cattaraugussuffolk
geneseetioga
wyomingherkimerbroome
onondagaoneidasenecawayne
oswegohamilton
lewis
Cases per 10,000 people
0.0 0.2 0.4 0.6
Motor Vehicle Traffic Trauma: Average Annual Mortality by County of Residence
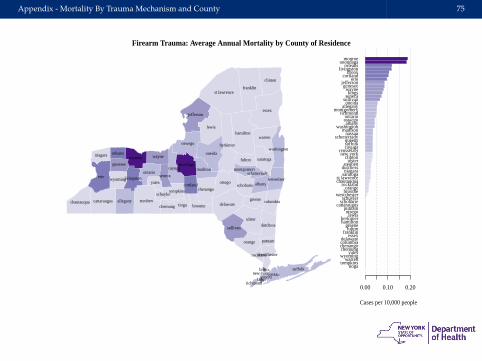
Appendix - Mortality By Trauma Mechanism and County 75
albany
allegany
bronx
broomecattaraugus
cayuga
chautauquachemung
chenango
clinton
columbia
cortland
delaware
dutchess
erie
essex
franklin
fultongenesee
greene
hamilton
herkimer
jefferson
kings
lewis
livingston
madison
monroe
montgomery
nassaunew york
niagara oneida
onondaga
ontario
orange
orleans
oswego
otsego
putnam
queens
rensselaer
richmond
rockland
st lawrence
saratoga
schenectady
schoharie
schuyler
seneca
steuben
suffolk
sullivan
tioga
tompkins
ulster
warren
washington
wayne
westchester
wyomingyates
tiogatompkins
warrenwyoming
yateschemungchenangocolumbiadelaware
essexfranklin
fultongreene
hamiltonherkimer
lewisotsego
putnamcattaraugus
schoharieschuyler
westchesterbroomeorange
rocklandchautauquast lawrence
saratoganiagara
dutchesssteuben
ulsterclinton
new yorkrensselaer
cayugasuffolkqueens
schenectadynassau
madisonwashington
albanyoswegoontario
richmondmontgomery
alleganyoneida
sullivansenecakings
waynegenesee
jeffersonerie
cortlandbronx
livingstonorleans
onondagamonroe
Cases per 10,000 people
0.00 0.10 0.20
Firearm Trauma: Average Annual Mortality by County of Residence
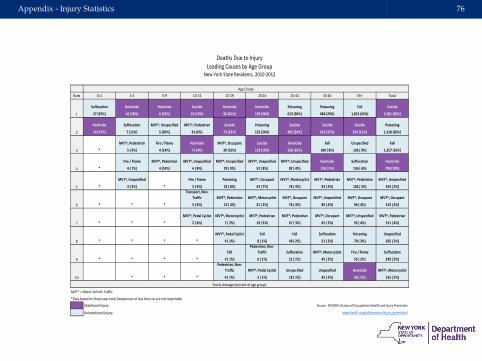
Appendix - Injury Statistics 76
Rank 0<1 1-4 5-9 10-14 15-19 20-24 25-44 45-64 65+ Total
Suffocation Homicide Homicide Suicide Homicide Homicide Poisoning Poisoning Fall Suicide
27 (32%) 16 (28%) 6 (23%) 10 (19%) 96 (31%) 159 (26%) 613 (30%) 684 (29%) 1,013 (45%) 1,581 (20%)
Homicide Suffocation MVT^, Unspecified MVT^, Pedestrian Suicide Poisoning Suicide Suicide Suicide Poisoning
14 (17%) 7 (12%) 5 (20%) 8 (16%) 73 (23%) 123 (20%) 492 (24%) 633 (27%) 254 (11%) 1,518 (20%)
MVT^, Pedestrian Fire / Flame Homicide MVT^, Occupant Suicide Homicide Fall Unspecified Fall
* 5 ( 9%) 4 (14%) 7 (14%) 30 (10%) 118 (19%) 326 (16%) 180 ( 8%) 196 ( 9%) 1,257 (16%)
Fire / Flame MVT^, Pedestrian MVT^, Unspecified MVT^, Unspecified MVT^, Unspecified MVT^, Unspecified Homicide Suffocation Homicide
* 4 ( 7%) 4 (14%) 4 ( 8%) 29 ( 9%) 52 ( 8%) 82 ( 4%) 126 ( 5%) 136 ( 6%) 790 (10%)
MVT^, Unspecified Fire / Flame Poisoning MVT^, Occupant MVT^, Motorcyclist MVT^, Pedestrian MVT^, Pedestrian MVT^, Unspecified
* 3 ( 5%) * 3 ( 6%) 23 ( 8%) 43 ( 7%) 76 ( 4%) 93 ( 4%) 102 ( 5%) 354 ( 5%)
Transport, Non-
Traffic MVT^, Pedestrian MVT^, Motorcyclist MVT^, Occupant MVT^, Unspecified MVT^, Occupant MVT^, Occupant
* * * 3 ( 6%) 13 ( 4%) 21 ( 3%) 76 ( 4%) 85 ( 4%) 94 ( 4%) 313 ( 4%)
MVT^, Pedal Cyclist MVT^, Motorcyclist MVT^, Pedestrian MVT^, Pedestrian MVT^, Occupant MVT^, Unspecified MVT^, Pedestrian
* * * 2 ( 4%) 7 ( 2%) 19 ( 3%) 67 ( 3%) 65 ( 3%) 92 ( 4%) 311 ( 4%)
MVT^, Pedal Cyclist Fall Fall Suffocation Poisoning Unspecified
* * * * 4 ( 1%) 8 ( 1%) 49 ( 2%) 51 ( 2%) 70 ( 3%) 265 ( 3%)
Fall
Pedestrian, Non-
Traffic Suffocation MVT^, Motorcyclist Fire / Flame Suffocation
* * * * 4 ( 1%) 6 ( 1%) 21 ( 1%) 45 ( 2%) 55 ( 2%) 249 ( 3%)
Pedestrian, Non-
Traffic MVT^, Pedal Cyclist Unspecified Unspecified Homicide MVT^, Motorcyclist
* * * 4 ( 1%) 5 ( 1%) 18 ( 1%) 42 ( 2%) 36 ( 2%) 155 ( 2%)
MVT^ = Motor Vehicle Traffic
*Data based on three year total frequencies of less than six are not reportable
Intentional Injury Source: NYSDOH, Bureau of Occupational Health and Injury Prevention
Unintentional Injury www.health.ny.gov/prevention/injury_prevention/
Deaths Due to Injury
Leading Causes by Age GroupNew York State Residents, 2010-2012
7
8
9
10
Age Group
Yearly Average (percent of age group)
1
2
3
4
5
6
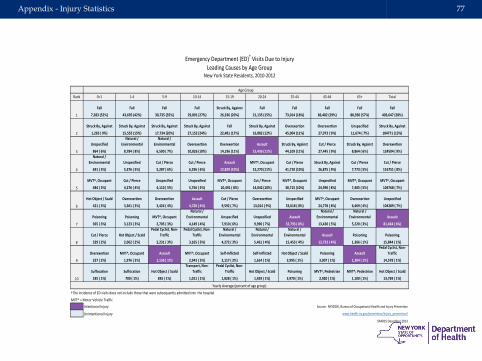
Appendix - Injury Statistics 77
Rank 0<1 1-4 5-9 10-14 15-19 20-24 25-44 45-64 65+ Total
Fall Fall Fall Fall Struck By, Against Fall Fall Fall Fall Fall
7,283 (52%) 43,695 (42%) 30,735 (35%) 29,891 (27%) 26,336 (20%) 21,135 (15%) 73,014 (18%) 86,482 (29%) 88,930 (57%) 403,647 (28%)
Struck By, Against Struck By, Against Struck By, Against Struck By, Against Fall Struck By, Against Overexertion Overexertion Unspecified Struck By, Against
1,265 ( 9%) 15,555 (15%) 17,734 (20%) 27,152 (24%) 22,481 (17%) 16,882 (12%) 45,004 (11%) 27,973 ( 9%) 11,674 ( 7%) 184771 (13%)
Unspecified
Natural /
Environmental
Natural /
Environmental Overexertion Overexertion Assault Struck By, Against Cut / Pierce Struck By, Against Overexertion
864 ( 6%) 8,784 ( 8%) 6,500 ( 7%) 10,826 (10%) 14,196 (11%) 15,436 (11%) 44,109 (11%) 27,445 ( 9%) 8,864 ( 6%) 124504 ( 9%)
Natural /
Environmental Unspecified Cut / Pierce Cut / Pierce Assault MVT^, Occupant Cut / Pierce Struck By, Against Cut / Pierce Cut / Pierce
691 ( 5%) 5,376 ( 5%) 5,287 ( 6%) 6,296 ( 6%) 12,829 (10%) 15,270 (11%) 41,710 (10%) 26,875 ( 9%) 7,773 ( 5%) 116751 ( 8%)
MVT^, Occupant Cut / Pierce Unspecified Unspecified MVT^, Occupant Cut / Pierce MVT^, Occupant Unspecified MVT^, Occupant MVT^, Occupant
484 ( 3%) 4,276 ( 4%) 4,110 ( 5%) 5,756 ( 5%) 10,491 ( 8%) 14,042 (10%) 38,715 (10%) 24,990 ( 8%) 7,405 ( 5%) 104768 ( 7%)
Hot Object / Scald Overexertion Overexertion Assault Cut / Pierce Overexertion Unspecified MVT^, Occupant Overexertion Unspecified
421 ( 3%) 3,361 ( 3%) 3,424 ( 4%) 4,720 ( 4%) 9,592 ( 7%) 13,014 ( 9%) 33,618 ( 8%) 24,778 ( 8%) 6,469 ( 4%) 104289 ( 7%)
Poisoning Poisoning MVT^, Occupant
Natural /
Environmental Unspecified Unspecified Assault
Natural /
Environmental
Natural /
Environmental Assault
365 ( 3%) 3,123 ( 3%) 2,705 ( 3%) 4,149 ( 4%) 7,910 ( 6%) 9,990 ( 7%) 32,793 ( 8%) 13,420 ( 5%) 5,220 ( 3%) 81,464 ( 6%)
Cut / Pierce Hot Object / Scald
Pedal Cyclist, Non-
Traffic
Pedal Cyclist, Non-
Traffic
Natural /
Environmental
Natural /
Environmental
Natural /
Environmental Assault Poisoning Poisoning
329 ( 2%) 2,062 ( 2%) 2,231 ( 3%) 3,165 ( 3%) 4,272 ( 3%) 5,461 ( 4%) 15,453 ( 4%) 12,733 ( 4%) 1,366 ( 1%) 15,844 ( 1%)
Overexertion MVT^, Occupant Assault MVT^, Occupant Self-Inflicted Self-Inflicted Hot Object / Scald Poisoning Assault
Pedal Cyclist, Non-
Traffic
237 ( 2%) 1,976 ( 2%) 1,136 ( 1%) 2,943 ( 3%) 2,117 ( 2%) 1,614 ( 1%) 3,995 ( 1%) 3,007 ( 1%) 1,204 ( 1%) 14,578 ( 1%)
Suffocation Suffocation Hot Object / Scald
Transport, Non-
Traffic
Pedal Cyclist, Non-
Traffic Hot Object / Scald Poisoning MVT^, Pedestrian MVT^, Pedestrian Hot Object / Scald
185 ( 1%) 700 ( 1%) 835 ( 1%) 1,011 ( 1%) 1,828 ( 1%) 1,459 ( 1%) 3,970 ( 1%) 2,920 ( 1%) 1,100 ( 1%) 13,769 ( 1%)
†The incidence of ED visits does not include those that were subsequently admitted into the hospital
MVT^ = Motor Vehicle Traffic
Intentional Injury Source: NYSDOH, Bureau of Occupational Health and Injury Prevention
Unintentional Injury www.health.ny.gov/prevention/injury_prevention/
SPARCS December 2013
Emergency Department (ED)† Visits Due to Injury
Leading Causes by Age GroupNew York State Residents, 2010-2012
7
8
9
10
Age Group
Yearly Average (percent of age group)
1
2
3
4
5
6
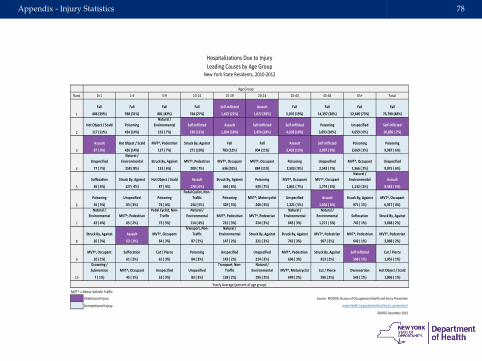
Appendix - Injury Statistics 78
Rank 0<1 1-4 5-9 10-14 15-19 20-24 25-44 45-64 65+ Total
Fall Fall Fall Fall Self-Inflicted Assault Fall Fall Fall Fall
406 (39%) 938 (31%) 881 (42%) 764 (27%) 1,422 (22%) 1,627 (20%) 5,076 (19%) 14,397 (38%) 52,640 (73%) 76,790 (48%)
Hot Object / Scald Poisoning
Natural /
Environmental Self-Inflicted Assault Self-Inflicted Self-Inflicted Poisoning Unspecified Self-Inflicted
117 (11%) 434 (14%) 153 ( 7%) 296 (11%) 1,204 (18%) 1,454 (18%) 4,208 (16%) 3,893 (10%) 4,659 ( 6%) 10,896 ( 7%)
Assault Hot Object / Scald MVT^, Pedestrian Struck By, Against Fall Fall Assault Self-Inflicted Poisoning Poisoning
87 ( 8%) 426 (14%) 137 ( 7%) 271 (10%) 783 (12%) 904 (11%) 3,403 (13%) 2,907 ( 8%) 2,069 ( 3%) 9,987 ( 6%)
Unspecified
Natural /
Environmental Struck By, Against MVT^, Pedestrian MVT^, Occupant MVT^, Occupant Poisoning Unspecified MVT^, Occupant Unspecified
77 ( 7%) 258 ( 8%) 133 ( 6%) 200 ( 7%) 636 (10%) 884 (11%) 2,503 ( 9%) 2,543 ( 7%) 1,566 ( 2%) 9,075 ( 6%)
Suffocation Struck By, Against Hot Object / Scald Assault Struck By, Against Poisoning MVT^, Occupant MVT^, Occupant
Natural /
Environmental Assault
56 ( 5%) 127 ( 4%) 87 ( 4%) 178 ( 6%) 364 ( 6%) 545 ( 7%) 1,861 ( 7%) 1,774 ( 5%) 1,132 ( 2%) 8,482 ( 5%)
Poisoning Unspecified Poisoning
Pedal Cyclist, Non-
Traffic Poisoning MVT^, Motorcyclist Unspecified Assault Struck By, Against MVT^, Occupant
56 ( 5%) 83 ( 3%) 74 ( 4%) 134 ( 5%) 329 ( 5%) 246 ( 3%) 1,221 ( 5%) 1,604 ( 4%) 971 ( 1%) 6,917 ( 4%)
Natural /
Environmental MVT^, Pedestrian
Pedal Cyclist, Non-
Traffic
Natural /
Environmental MVT^, Pedestrian MVT^, Pedestrian
Natural /
Environmental
Natural /
Environmental Suffocation Struck By, Against
42 ( 4%) 65 ( 2%) 73 ( 3%) 114 ( 4%) 215 ( 3%) 224 ( 3%) 843 ( 3%) 1,271 ( 3%) 742 ( 1%) 3,668 ( 2%)
Struck By, Against Assault MVT^, Occupant
Transport, Non-
Traffic
Natural /
Environmental Struck By, Against Struck By, Against MVT^, Pedestrian MVT^, Pedestrian MVT^, Pedestrian
26 ( 3%) 63 ( 2%) 64 ( 3%) 87 ( 3%) 147 ( 2%) 221 ( 3%) 742 ( 3%) 907 ( 2%) 642 ( 1%) 3,088 ( 2%)
MVT^, Occupant Suffocation Cut / Pierce Poisoning Unspecified Unspecified MVT^, Pedestrian Struck By, Against Self-Inflicted Cut / Pierce
10 ( 1%) 61 ( 2%) 61 ( 3%) 84 ( 3%) 143 ( 2%) 214 ( 3%) 696 ( 3%) 813 ( 2%) 598 ( 1%) 1,955 ( 1%)
Drowning /
Submersion MVT^, Occupant Unspecified Unspecified
Transport, Non-
Traffic
Natural /
Environmental MVT^, Motorcyclist Cut / Pierce Overexertion Hot Object / Scald
7 ( 1%) 45 ( 1%) 53 ( 3%) 83 ( 3%) 138 ( 2%) 195 ( 2%) 649 ( 2%) 596 ( 2%) 543 ( 1%) 1,806 ( 1%)
MVT^ = Motor Vehicle Traffic
Intentional Injury Source: NYSDOH, Bureau of Occupational Health and Injury Prevention
Unintentional Injury www.health.ny.gov/prevention/injury_prevention/
SPARCS December 2013
10
Age Group
Yearly Average (percent of age group)
1
2
3
4
5
6
Hospitalizations Due to Injury
Leading Causes by Age GroupNew York State Residents, 2010-2012
7
8
9
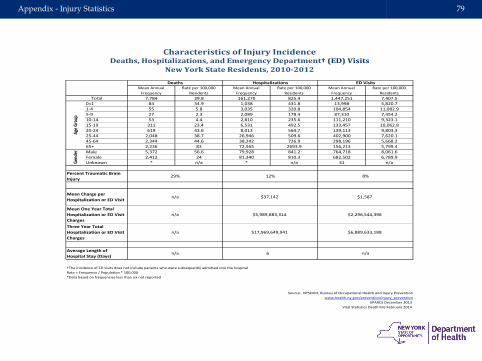
Appendix - Injury Statistics 79
Mean Annual
Frequency
Rate per 100,000
Residents
Mean Annual
Frequency
Rate per 100,000
Residents
Mean Annual
Frequency
Rate per 100,000
Residents
7,784 39.8 161,270 825.4 1,447,251 7,407.50<1 84 34.9 1,038 431.8 13,998 5,820.71-4 55 5.8 3,035 320.8 104,854 11,082.95-9 27 2.3 2,089 178.4 87,310 7,454.210-14 53 4.4 2,810 235.6 111,210 9,323.115-19 311 23.4 6,531 492.5 133,457 10,062.820-24 619 43.6 8,013 564.7 139,113 9,803.325-44 2,048 38.7 26,946 509.6 402,900 7,620.145-64 2,344 44.6 38,242 726.9 298,196 5,668.265+ 2,236 83 72,565 2693.9 156,213 5,799.4Male 5,372 56.6 79,928 841.2 764,718 8,061.6Female 2,412 24 81,340 810.3 682,502 6,789.9Unknown * n/a * n/a 31 n/a
6
Source: NYSDOH, Bureau of Occupational Health and Injury Prevention www.health.ny.gov/prevention/injury_prevention
SPARCS December 2013
Vital Statistics Death File February 2014
†The incidence of ED visits does not include patients who were subsequently admitted into the hospital
Rate = Frequency / Population * 100,000
n/a
Mean One Year Total
Hospitalization or ED Visit
Charges
*Data based on frequencies less than six not reported
$6,889,633,188$17,969,649,941
n/a
n/a
Three Year Total
Hospitalization or ED Visit
Charges
Average Length of
Hospital Stay (Days)
Characteristics of Injury IncidenceDeaths, Hospitalizations, and Emergency Department† (ED) Visits
New York State Residents, 2010-2012
Percent Traumatic Brain
Injury
Mean Charge per
Hospitalization or ED Visit
Age
Gro
upG
ende
r
Total
$37,142
Deaths
29%
$2,296,544,396
$1,587
Hospitalizations ED Visits
12% 8%
n/a
$5,989,883,314n/a
Appendix - Materials and Methods 80
Materials and Methods
1. Data Sources
Trauma Registry - Established in 1993, the New York State Trauma Registry(NYSTR) receives reports from designated trauma centers on patients iden-tified and treated as being moderately to severely traumatically injured (In-clusion Criteria in Appendix Inclusion Criteria in Appendix). The reportscontains variables specified by the New York State Trauma Registry includ-ing patients’ demographic information, diagnoses and treatments. A verysmall portion of the trauma reports in the NYSTR were submitted fromseveral non-trauma centers/hospitals.
Statewide Planning and Research Cooperative System (SPARCS) - Imple-mented by the New York State Department of Health (NYSDOH) in 1979,SPARCS is a comprehensive, integrated information system available to as-sist hospitals and organizations in the health care industry with healthcareresource planning, financial analysis, decision making, and surveillance ofNew York State. SPARCS receives, processes, stores, and analyzes the inpa-tient and emergency department from data from all hospitals in New York.Each health care provider submits its SPARCS data, as mandated, in theuniform, computer-readable format described in the Universal Data Set.
Surveillance, Epidemiology, and End Results Program (SEER) - The pop-ulation estimates used to calculate trauma incidence and mortality werefrom Surveillance, Epidemiology, and End Results Program (SEER) of theNational Cancer Institute. These data were produced by the US CensusBureau’s Population Estimates Program, in collaboration with the NationalCenter for Health Statistics and with support from the National CancerInstitute.[3]
National Trauma Data Bank (NTDB) - NTDB collects trauma registry datafrom participating trauma centers across the U.S. on an annual basis. Thecase fatality rates calculated using NYSTR 2013 data were compared withthat published on NTDB 2014 Annual Report.[4]
2. The Cohort
A cohort used for generating the NYSTR Summary Report was constructedwith NYSTR data from 2010 through 2013 submitted from the certifiedtrauma centers. Trauma records submitted by non-trauma centers wereexcluded in the data analyses.
3. Data Matching
A dataset containing all patients diagnosed with traumatic injuries andwere treated in New York State trauma centers for discharge years 2010 -2013 was created from SPARCS hospital inpatients and emergency depart-ment (ED) discharge files. This data file was matched to Trauma Registryrecords for the same discharge year period by using identifying variablessuch as hospital’s Permanent Facility Identifier, admission dates, dischargedates, hospital’s medical record numbers, Patients’ date of birth, etc. Thematches were conducted without using patient’s name and address, be-cause SPARCS does not contain patient name and SAPRCS ED data do nothave patient’s address information. The records found in the SPARCS hos-pital data files or ED data files but not in the Trauma Registry databasewere defined as unmatched/missed reports and were sent to hospitals foraudits. After checking their own unmatched/missed reports, hospitals re-submit the missing trauma cases and corrected trauma cases to TraumaRegistry.

Appendix - Materials and Methods 81
4. Statistical Analysis
Descriptive Analysis. Standard linear and weighted loess regression tech-niques were used. All confidence intervals shown represent a 95% confi-dence interval of the sample population. Box plots omits outliers, defenedas 1.5 times the interquartile range.
Predictive Analysis. Predictive analysis of risk of mortality was per-formed to develop a risk adjusted model that provides unbiased estimatesof trauma case fatality rates. The detailed description of the risk adjustmentmethodology was provided in the Risk Adjustment Methodology section inAppendix.
5. Specific Notes
EMS Time Variables. Many omissions were present in the EMS time vari-ables, approximately 47% of the cohort. Therefore, when time variableswere quoted, a subset excluding the records with missing values was used.
E-codes. In the cohort, about 3.5% of patients have more than one E Codefor cause. In this analysis, only the primary E code cause was used, in theMechanism of Injury section, page 28
Payer and total charges. Primary payer and total charges used for the PayerTypes section, page 24 and the Cost of Trauma section, page 51 were ob-tained from SPARCS data.
Pediatric patents. In this report, the pediatric patients were defined asthose aged 14 years or younger.
Comparison to the Nation. Since different inclusion criteria is used by theNYSTR and NTBD, only trauma with an injury severity score of greaterthan or equal to 9 was considered.
6. Software
All figures, tables, maps, and calculations were created with R statisticalsoftware[5]. This document was typeset with LATEX. The two scripts werecombined into a single program with Sweave[7].
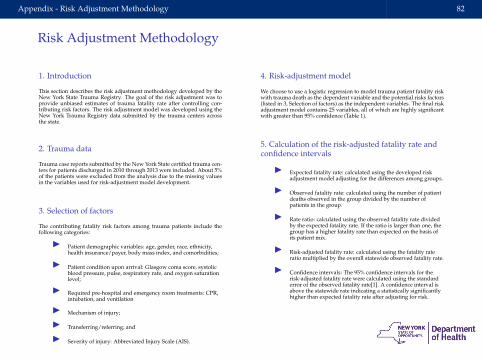
Appendix - Risk Adjustment Methodology 82
Risk Adjustment Methodology
1. Introduction
This section describes the risk adjustment methodology developed by theNew York State Trauma Registry. The goal of the risk adjustment was toprovide unbiased estimates of trauma fatality rate after controlling con-tributing risk factors. The risk adjustment model was developed using theNew York Trauma Registry data submitted by the trauma centers acrossthe state.
2. Trauma data
Trauma case reports submitted by the New York State certified trauma cen-ters for patients discharged in 2010 through 2013 were included. About 5%of the patients were excluded from the analysis due to the missing valuesin the variables used for risk-adjustment model development.
3. Selection of factors
The contributing fatality risk factors among trauma patients include thefollowing categories:
I Patient demographic variables: age, gender, race, ethnicity,health insurance/payer, body mass index, and comorbidities;
I Patient condition upon arrival: Glasgow coma score, systolicblood pressure, pulse, respiratory rate, and oxygen saturationlevel;
I Required pre-hospital and emergency room treatments: CPR,intubation, and ventilation
I Mechanism of injury;
I Transferring/referring; and
I Severity of injury: Abbreviated Injury Scale (AIS).
4. Risk-adjustment model
We choose to use a logistic regression to model trauma patient fatality riskwith trauma death as the dependent variable and the potential risks factors(listed in 3, Selection of factors) as the independent variables. The final riskadjustment model contains 25 variables, all of which are highly significantwith greater than 95% confidence (Table 1).
5. Calculation of the risk-adjusted fatality rate andconfidence intervals
I Expected fatality rate: calculated using the developed riskadjustment model adjusting for the differences among groups.
I Observed fatality rate: calculated using the number of patientdeaths observed in the group divided by the number ofpatients in the group.
I Rate ratio: calculated using the observed fatality rate dividedby the expected fatality rate. If the ratio is larger than one, thegroup has a higher fatality rate than expected on the basis ofits patient mix.
I Risk-adjusted fatality rate: calculated using the fatality rateratio multiplied by the overall statewide observed fatality rate.
I Confidence intervals: The 95% confidence intervals for therisk-adjusted fatality rate were calculated using the standarderror of the observed fatality rate[1]. A confidence interval isabove the statewide rate indicating a statistically significantlyhigher than expected fatality rate after adjusting for risk.
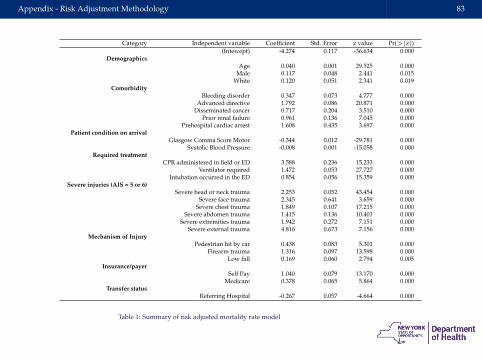
Appendix - Risk Adjustment Methodology 83
Category Independent variable Coefficient Std. Error z value Pr(>|z|)(Intercept) -4.274 0.117 -36.634 0.000
DemographicsAge 0.040 0.001 29.525 0.000
Male 0.117 0.048 2.441 0.015White 0.120 0.051 2.341 0.019
ComorbidityBleeding disorder 0.347 0.073 4.777 0.000
Advanced directive 1.792 0.086 20.871 0.000Disseminated cancer 0.717 0.204 3.510 0.000
Prior renal failure 0.961 0.136 7.045 0.000Prehospital cardiac arrest 1.608 0.435 3.697 0.000
Patient condition on arrivalGlasgow Comma Score Motor -0.344 0.012 -29.781 0.000
Systolic Blood Pressure -0.008 0.001 -15.058 0.000Required treatment
CPR administered in field or ED 3.588 0.236 15.233 0.000Ventilator required 1.472 0.053 27.727 0.000
Intubation occurred in the ED 0.854 0.056 15.359 0.000Severe injuries (AIS = 5 or 6)
Severe head or neck trauma 2.253 0.052 43.454 0.000Severe face trauma 2.345 0.641 3.659 0.000
Severe chest trauma 1.849 0.107 17.215 0.000Severe abdomen trauma 1.415 0.136 10.401 0.000
Severe extremities trauma 1.942 0.272 7.151 0.000Severe external trauma 4.816 0.673 7.156 0.000
Mechanism of InjuryPedestrian hit by car 0.438 0.083 5.301 0.000
Firearm trauma 1.316 0.097 13.598 0.000Low fall 0.169 0.060 2.794 0.005
Insurance/payerSelf Pay 1.040 0.079 13.170 0.000
Medicare 0.378 0.065 5.864 0.000Transfer status
Referring Hospital -0.267 0.057 -4.664 0.000
Table 1: Summary of risk adjusted mortality rate model
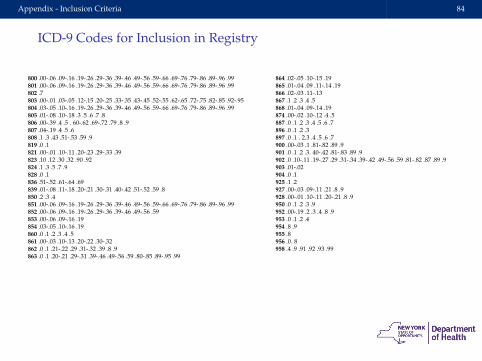
Appendix - Inclusion Criteria 84
ICD-9 Codes for Inclusion in Registry
800 .00-.06 .09-.16 .19-.26 .29-.36 .39-.46 .49-.56 .59-.66 .69-.76 .79-.86 .89-.96 .99801 .00-.06 .09-.16 .19-.26 .29-.36 .39-.46 .49-.56 .59-.66 .69-.76 .79-.86 .89-.96 .99802 .7803 .00-.01 .03-.05 .12-.15 .20-.25 .33-.35 .43-.45 .52-.55 .62-.65 .72-.75 .82-.85 .92-.95804 .03-.05 .10-.16 .19-.26 .29-.36 .39-.46 .49-.56 .59-.66 .69-.76 .79-.86 .89-.96 .99805 .01-.08 .10-.18 .3 .5 .6 .7 .8806 .00-.39 .4 .5 . 60-.62 .69-.72 .79 .8 .9807 .04-.19 .4 .5 .6808 .1 .3 .43 .51-.53 .59 .9819 .0 .1821 .00-.01 .10-.11 .20-.23 .29-.33 .39823 .10 .12 .30 .32 .90 .92824 .1 .3 .5 .7 .9828 .0 .1836 .51-.52 .61-.64 .69839 .01-.08 .11-.18 .20-.21 .30-.31 .40-.42 .51-.52 .59 .8850 .2 .3 .4851 .00-.06 .09-.16 .19-.26 .29-.36 .39-.46 .49-.56 .59-.66 .69-.76 .79-.86 .89-.96 .99852 .00-.06 .09-.16 .19-.26 .29-.36 .39-.46 .49-.56 .59853 .00-.06 .09-.16 .19854 .03-.05 .10-.16 .19860 .0 .1 .2 .3 .4 .5861 .00-.03 .10-.13 .20-.22 .30-.32862 .0 .1 .21-.22 .29 .31-.32 .39 .8 .9863 .0 .1 .20-.21 .29-.31 .39-.46 .49-.56 .59 .80-.85 .89-.95 .99
864 .02-.05 .10-.15 .19865 .01-.04 .09 .11-.14 .19866 .02-.03 .11-.13867 .1 .2 .3 .4 .5868 .01-.04 .09-.14 .19874 .00-.02 .10-.12 .4 .5887 .0 .1 .2 .3 .4 .5 .6 .7896 .0 .1 .2 .3897 .0 .1 . 2.3 .4 .5 .6 .7900 .00-.03 .1 .81-.82 .89 .9901 .0 .1 .2 .3. 40-.42 .81-.83 .89 .9902 .0 .10-.11 .19-.27 .29 .31-.34 .39-.42 .49-.56 .59 .81-.82 .87 .89 .9903 .01-.02904 .0 .1925 .1 .2927 .00-.03 .09-.11 .21 .8 .9928 .00-.01 .10-.11 .20-.21 .8 .9950 .0 .1 .2 .3 .9952 .00-.19 .2 .3 .4 .8 .9953 .0 .1 .2 .4954 .8 .9955 .8956 .0. 8958 .4 .9 .91 .92 .93 .99
Appendix - References 85
References
[1] Hosmer D. and Lemeshow S. Confidence Interval Estimates of an Index of Quality Performance Based onLogistic Regression Models. Statistics in Medicine, Volume 14, 2161-2172 (1995).
[2] Baker, O’Neill, Haddon, and Long. The Injury Severity Score: A Method for Describing Patients withMultiple Injuries and Evaluating Emergency Care. Journal of Trauma, Volume 14 No. 3, March 1974.
[3] Surveillance, Epidemiology, and End Results (SEER) Program Populations (1969-2013)(www.seer.cancer.gov/popdata), National Cancer Institute, DCCPS, Surveillance Research Program,Surveillance Systems Branch, released January 2015.
[4] Tables 21 and 22, Committee on Trauma, American College of Surgeons. NTDB Annual Report 2014.Chicago, IL. https://www.facs.org/quality%20programs/trauma/ntdb/docpub
[5] R Core Team (2014). R: A language and environment for statistical computing. R Foundation for StatisticalComputing, Vienna, Austria. URL http://www.R-project.org/.
[6] Original S code by Richard A. Becker and Allan R. Wilks. R version by Ray Brownrigg. Enhancements byThomas P Minka <[email protected]> (2014). maps: Draw Geographical Maps. R package version2.3-9. http://CRAN.R-project.org
[7] Friedrich Leisch. Sweave: Dynamic generation of statistical reports using literate data analysis. In WolfgangHärdle and Bernd Rönz, editors, Compstat 2002 - Proceedings in Computational Statistics, pages 575-580.Physica Verlag, Heidelberg, 2002. ISBN 3-7908-1517-9.