new transfer students - casper college · table of contents new transfer students 2010-11 list of...
TRANSCRIPT
New Transfer Students
2010–11
Casper College
Office of Institutional Analysis
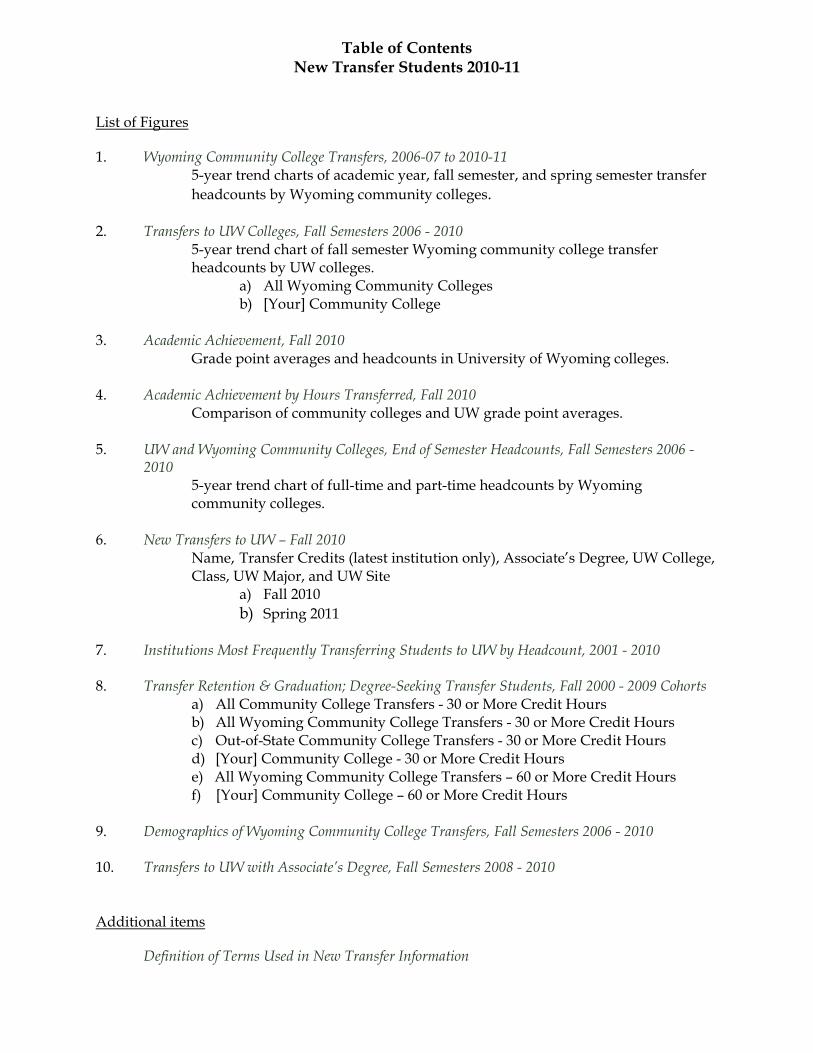
Table of Contents New Transfer Students 2010-11
List of Figures 1. Wyoming Community College Transfers, 2006-07 to 2010-11
5-year trend charts of academic year, fall semester, and spring semester transfer headcounts by Wyoming community colleges.
2. Transfers to UW Colleges, Fall Semesters 2006 - 2010
5-year trend chart of fall semester Wyoming community college transfer headcounts by UW colleges.
a) All Wyoming Community Colleges b) [Your] Community College
3. Academic Achievement, Fall 2010
Grade point averages and headcounts in University of Wyoming colleges. 4. Academic Achievement by Hours Transferred, Fall 2010
Comparison of community colleges and UW grade point averages. 5. UW and Wyoming Community Colleges, End of Semester Headcounts, Fall Semesters 2006 -
2010 5-year trend chart of full-time and part-time headcounts by Wyoming community colleges.
6. New Transfers to UW – Fall 2010
Name, Transfer Credits (latest institution only), Associate’s Degree, UW College, Class, UW Major, and UW Site
a) Fall 2010 b) Spring 2011
7. Institutions Most Frequently Transferring Students to UW by Headcount, 2001 - 2010 8. Transfer Retention & Graduation; Degree-Seeking Transfer Students, Fall 2000 - 2009 Cohorts
a) All Community College Transfers - 30 or More Credit Hours b) All Wyoming Community College Transfers - 30 or More Credit Hours c) Out-of-State Community College Transfers - 30 or More Credit Hours d) [Your] Community College - 30 or More Credit Hours e) All Wyoming Community College Transfers – 60 or More Credit Hours f) [Your] Community College – 60 or More Credit Hours
9. Demographics of Wyoming Community College Transfers, Fall Semesters 2006 - 2010 10. Transfers to UW with Associate’s Degree, Fall Semesters 2008 - 2010 Additional items Definition of Terms Used in New Transfer Information
300
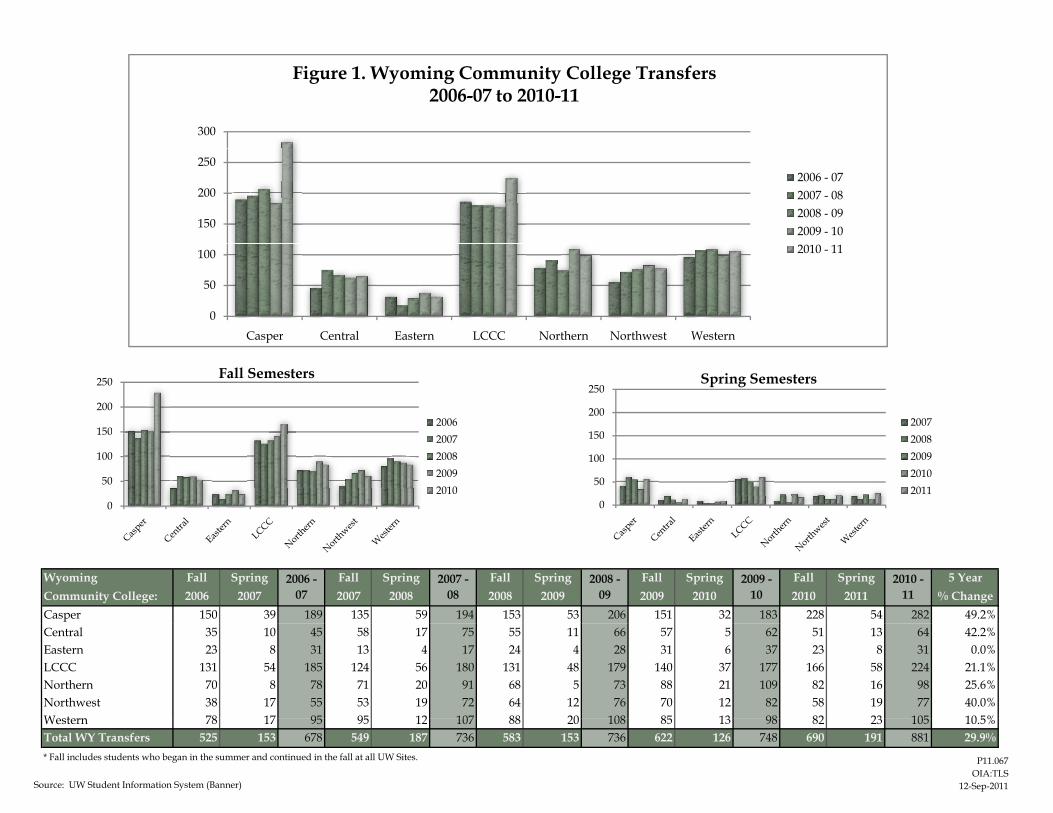
Figure 1. Wyoming Community College Transfers2006-07 to 2010-11
150
200
2502006 - 072007 - 082008 - 092009 - 10
0
50
100
Casper Central Eastern LCCC Northern Northwest Western
2010 - 11
150
200
250Fall Semesters
2006
Casper Central Eastern LCCC Northern Northwest Western
150
200
250Spring Semesters
2007
0
50
100
1502007200820092010
0
50
100
150 2008200920102011
Wyoming Fall Spring Fall Spring Fall Spring Fall Spring Fall Spring 5 YearCommunity College: 2006 2007 2007 2008 2008 2009 2009 2010 2010 2011 % ChangeCasper 150 39 189 135 59 194 153 53 206 151 32 183 228 54 282 49.2%
2006 - 07
2007 - 08
2008 - 09
2009 - 10
2010 - 11
Central 35 10 45 58 17 75 55 11 66 57 5 62 51 13 64 42.2%Eastern 23 8 31 13 4 17 24 4 28 31 6 37 23 8 31 0.0%LCCC 131 54 185 124 56 180 131 48 179 140 37 177 166 58 224 21.1%Northern 70 8 78 71 20 91 68 5 73 88 21 109 82 16 98 25.6%Northwest 38 17 55 53 19 72 64 12 76 70 12 82 58 19 77 40.0%Western 78 17 95 95 12 107 88 20 108 85 13 98 82 23 105 10 5%Western 78 17 95 95 12 107 88 20 108 85 13 98 82 23 105 10.5%Total WY Transfers 525 153 678 549 187 736 583 153 736 622 126 748 690 191 881 29.9%* Fall includes students who began in the summer and continued in the fall at all UW Sites.
Source: UW Student Information System (Banner)
P11.067OIA:TLS
12-Sep-2011

Figure 2a. Transfers to UW Colleges - Fall Semesters 2006 - 2010
All Wyoming Community Colleges
250
300
y g y g
F ll 2006
150
200Fall 2006
Fall 2007
Fall 2008
Fall 2009
0
50
100 Fall 2010
UW Fall Fall Fall Fall Fall 5 Year
0Agriculture & Nat. Res.
Arts & Sciences
Business Education Engineering & App. Sci.
Health Sciences
Undeclared & Other**
College 2006 2007 2008 2009 2010 % ChangeAgriculture & Nat. Res. 34 35 35 43 65 91.2%Arts & Sciences 191 196 186 212 247 29.3%Business 52 57 65 59 55 5.8%Education 92 93 87 105 105 14.1%Engineering & App. Sci. 39 39 45 42 50 28.2%Health Sciences 99 110 136 132 131 32.3%Undeclared & Other** 18 19 29 29 37 105.6%
Total Transfers 525 549 583 622 690 31.4%* Fall includes students who began in the summer and continued in the fall at all UW Sites.**Other includes Energy Resource Science majors beginning in 2009**Other includes Energy Resource Science majors beginning in 2009.
Source: UW Student Information System (Banner)
P11.067OIA:TLS
12-Sep-2011
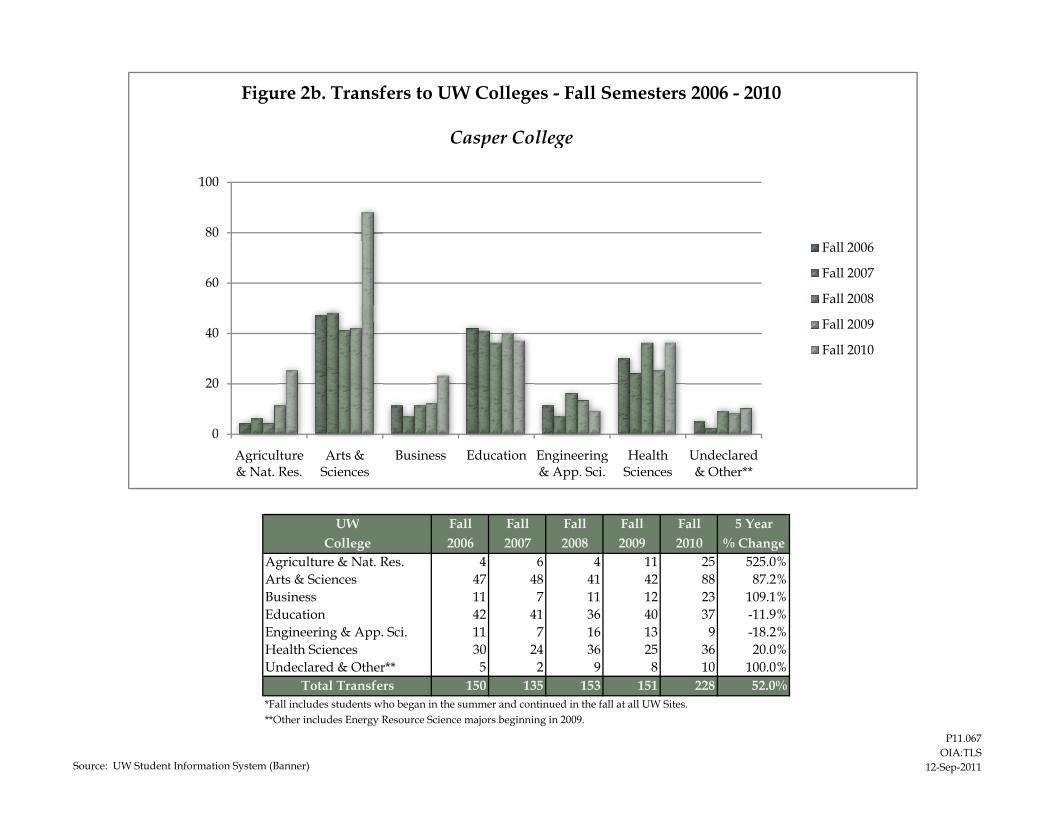
Figure 2b. Transfers to UW Colleges - Fall Semesters 2006 - 2010
Casper College
80
100
p g
40
60
Fall 2006
Fall 2007
Fall 2008
Fall 2009
0
20
40Fall 2010
UW Fall Fall Fall Fall Fall 5 Year
0Agriculture & Nat. Res.
Arts & Sciences
Business Education Engineering & App. Sci.
Health Sciences
Undeclared & Other**
UW Fall Fall Fall Fall Fall 5 YearCollege 2006 2007 2008 2009 2010 % Change
Agriculture & Nat. Res. 4 6 4 11 25 525.0%Arts & Sciences 47 48 41 42 88 87.2%Business 11 7 11 12 23 109.1%Education 42 41 36 40 37 -11.9%Engineering & App. Sci. 11 7 16 13 9 -18.2%Health Sciences 30 24 36 25 36 20.0%Undeclared & Other** 5 2 9 8 10 100.0%
Total Transfers 150 135 153 151 228 52.0%*Fall includes students who began in the summer and continued in the fall at all UW Sites.**O h i l d E R S i j b i i i 2009**Other includes Energy Resource Science majors beginning in 2009.
Source: UW Student Information System (Banner)
P11.067OIA:TLS
12-Sep-2011
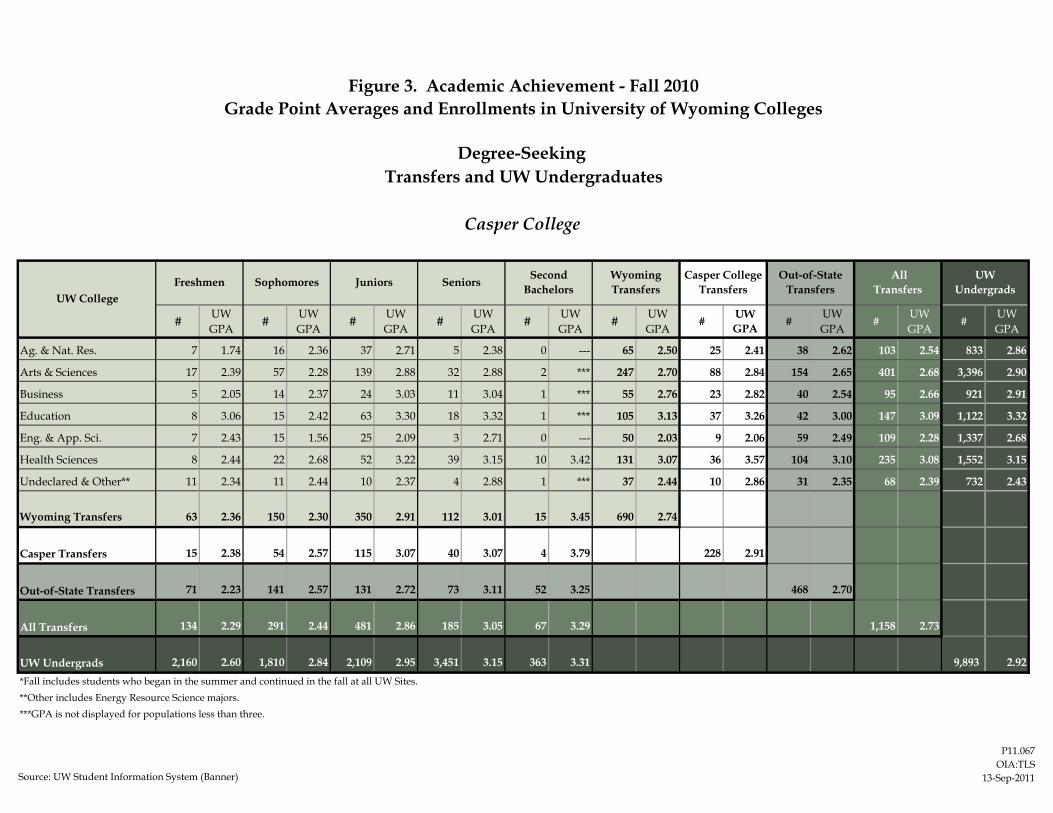
Figure 3. Academic Achievement - Fall 2010Grade Point Averages and Enrollments in University of Wyoming Colleges
Degree-Seeking Transfers and UW Undergraduates
Casper College
# UW GPA # UW
GPA # UW GPA # UW
GPA # UW GPA # UW
GPA# UW
GPA #UW GPA
#UW GPA
#UW GPA
Ag. & Nat. Res. 7 1.74 16 2.36 37 2.71 5 2.38 0 --- 65 2.50 25 2.41 38 2.62 103 2.54 833 2.86
Arts & Sciences 17 2.39 57 2.28 139 2.88 32 2.88 2 *** 247 2.70 88 2.84 154 2.65 401 2.68 3,396 2.90
Business 5 2.05 14 2.37 24 3.03 11 3.04 1 *** 55 2.76 23 2.82 40 2.54 95 2.66 921 2.91
Education 8 3.06 15 2.42 63 3.30 18 3.32 1 *** 105 3.13 37 3.26 42 3.00 147 3.09 1,122 3.32
Eng. & App. Sci. 7 2.43 15 1.56 25 2.09 3 2.71 0 --- 50 2.03 9 2.06 59 2.49 109 2.28 1,337 2.68
Health Sciences 8 2.44 22 2.68 52 3.22 39 3.15 10 3.42 131 3.07 36 3.57 104 3.10 235 3.08 1,552 3.15
Undeclared & Other** 11 2.34 11 2.44 10 2.37 4 2.88 1 *** 37 2.44 10 2.86 31 2.35 68 2.39 732 2.43
Wyoming Transfers 63 2.36 150 2.30 350 2.91 112 3.01 15 3.45 690 2.74
15 2.38 54 2.57 115 3.07 40 3.07 4 3.79 228 2.91
Out-of-State Transfers 71 2.23 141 2.57 131 2.72 73 3.11 52 3.25 468 2.70
All Transfers 134 2.29 291 2.44 481 2.86 185 3.05 67 3.29 1,158 2.73
2,160 2.60 1,810 2.84 2,109 2.95 3,451 3.15 363 3.31 9,893 2.92*Fall includes students who began in the summer and continued in the fall at all UW Sites.**Other includes Energy Resource Science majors. ***GPA is not displayed for populations less than three.
UWUndergrads
Casper Transfers
Wyoming Transfers
Out-of-State Transfers
Casper College Transfers
AllTransfers
UW CollegeFreshmen Sophomores Juniors Seniors Second
Bachelors
UW Undergrads
Source: UW Student Information System (Banner)
P11.067OIA:TLS
13-Sep-2011

Figure 4. Academic Achievement by Hours Transferred - Fall 2010Comparison of Community College and UW Grade Point Averages
Degree-SeekingTransfers and UW Undergraduates
Casper College
0 <= Hours < 30 18 3.04 2.54 75 3.02 2.50 129 2.94 2.59 204 2.97 2.55 3,480 2.69
30 <= Hours < 60 56 3.15 2.58 165 3.12 2.33 143 3.01 2.62 308 3.07 2.47 2,637 2.92
60 <= Hours < 90 115 3.29 3.09 348 3.31 2.91 126 3.10 2.75 474 3.25 2.87 1,755 3.06
90 <= Hours 39 3.30 3.04 102 3.32 3.04 70 3.19 3.07 172 3.26 3.05 2,021 3.14
Totals 228 3.26 2.91 690 3.27 2.74 468 3.10 2.70 1,158 3.21 2.73 9,893 2.92*Transferred credit hours and community college GPA are totaled from all transfer work, not only transfer work from individual community colleges. Only hours for grade are included.
Casper College Transfers
UW Fall Semester
GPA
Transferred Credit Hours* Transfer
GPA*#UW 1st Fall
Semester GPA
UW 1st Fall Semester
GPA# Transfer
GPA*
UW 1st Fall Semester
GPA## Transfer
GPA*
UW 1st Fall Semester
GPA# Transfer
GPA*
UndergraduatesAll UW
All TransfersWyoming Transfers Out-of-State Transfers
Source: UW Student Information System (Banner)
P11.067OIA:TLS
13-Sep-2011
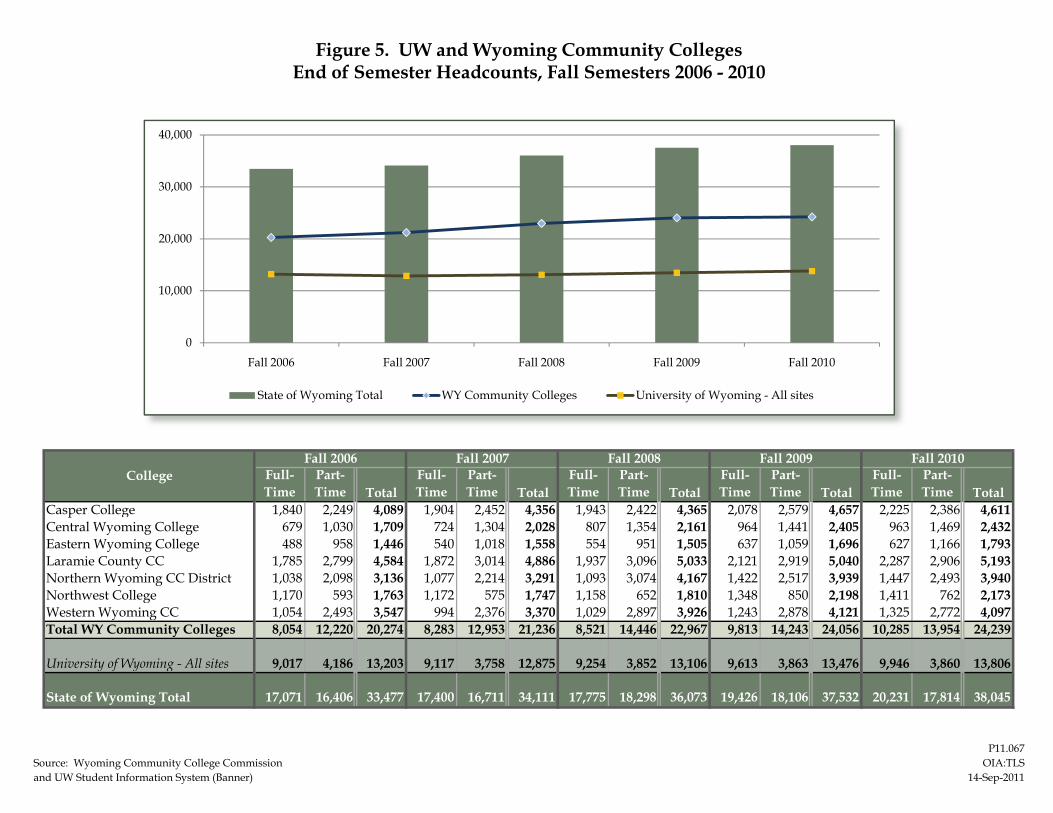
Figure 5. UW and Wyoming Community CollegesEnd of Semester Headcounts, Fall Semesters 2006 - 2010
0
10,000
20,000
30,000
40,000
Fall 2006 Fall 2007 Fall 2008 Fall 2009 Fall 2010
State of Wyoming Total WY Community Colleges University of Wyoming - All sites
Full-Time
Part-Time Total
Full-Time
Part-Time Total
Full-Time
Part-Time Total
Full-Time
Part-Time Total
Full-Time
Part-Time Total
Casper College 1,840 2,249 4,089 1,904 2,452 4,356 1,943 2,422 4,365 2,078 2,579 4,657 2,225 2,386 4,611Central Wyoming College 679 1,030 1,709 724 1,304 2,028 807 1,354 2,161 964 1,441 2,405 963 1,469 2,432Eastern Wyoming College 488 958 1,446 540 1,018 1,558 554 951 1,505 637 1,059 1,696 627 1,166 1,793Laramie County CC 1,785 2,799 4,584 1,872 3,014 4,886 1,937 3,096 5,033 2,121 2,919 5,040 2,287 2,906 5,193Northern Wyoming CC District 1,038 2,098 3,136 1,077 2,214 3,291 1,093 3,074 4,167 1,422 2,517 3,939 1,447 2,493 3,940Northwest College 1,170 593 1,763 1,172 575 1,747 1,158 652 1,810 1,348 850 2,198 1,411 762 2,173Western Wyoming CC 1,054 2,493 3,547 994 2,376 3,370 1,029 2,897 3,926 1,243 2,878 4,121 1,325 2,772 4,097Total WY Community Colleges 8,054 12,220 20,274 8,283 12,953 21,236 8,521 14,446 22,967 9,813 14,243 24,056 10,285 13,954 24,239
University of Wyoming - All sites 9,017 4,186 13,203 9,117 3,758 12,875 9,254 3,852 13,106 9,613 3,863 13,476 9,946 3,860 13,806
State of Wyoming Total 17,071 16,406 33,477 17,400 16,711 34,111 17,775 18,298 36,073 19,426 18,106 37,532 20,231 17,814 38,045
Fall 2008 Fall 2009 Fall 2010College
Fall 2006 Fall 2007
Source: Wyoming Community College Commission and UW Student Information System (Banner)
P11.067OIA:TLS
14-Sep-2011
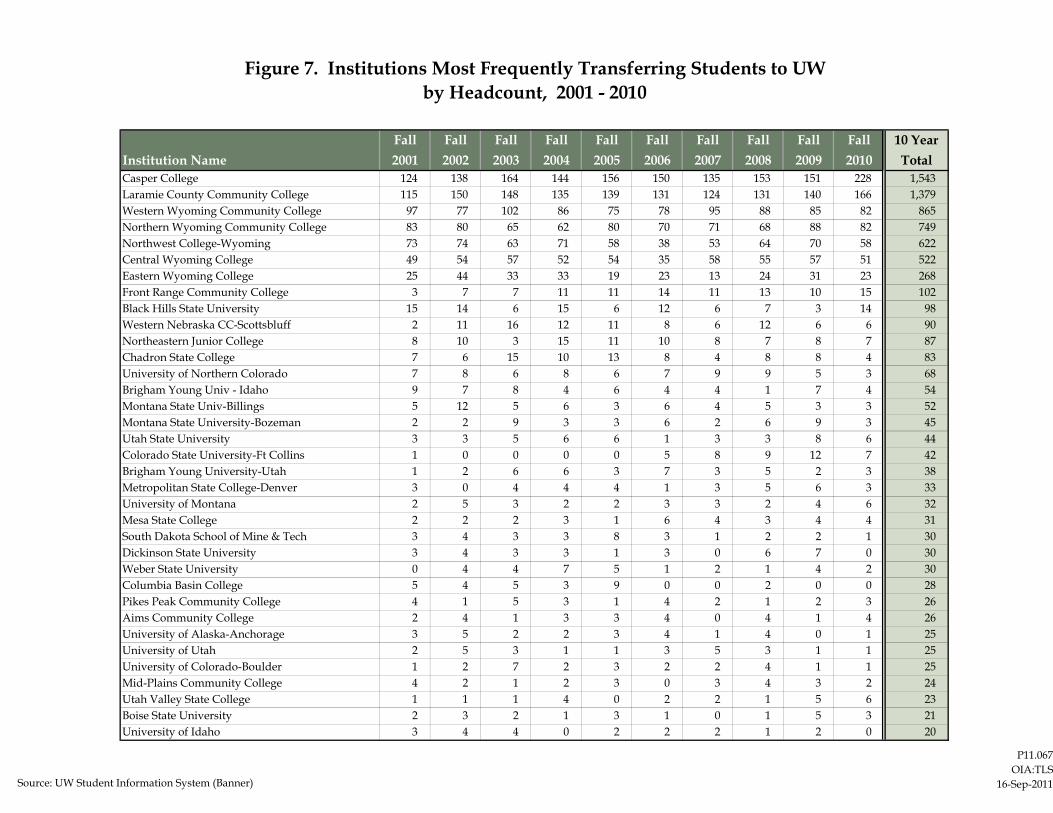
Figure 7. Institutions Most Frequently Transferring Students to UWby Headcount, 2001 - 2010
Fall Fall Fall Fall Fall Fall Fall Fall Fall Fall 10 YearInstitution Name 2001 2002 2003 2004 2005 2006 2007 2008 2009 2010 TotalCasper College 124 138 164 144 156 150 135 153 151 228 1,543Laramie County Community College 115 150 148 135 139 131 124 131 140 166 1,379Western Wyoming Community College 97 77 102 86 75 78 95 88 85 82 865Northern Wyoming Community College 83 80 65 62 80 70 71 68 88 82 749Northwest College-Wyoming 73 74 63 71 58 38 53 64 70 58 622Central Wyoming College 49 54 57 52 54 35 58 55 57 51 522Eastern Wyoming College 25 44 33 33 19 23 13 24 31 23 268Front Range Community College 3 7 7 11 11 14 11 13 10 15 102Black Hills State University 15 14 6 15 6 12 6 7 3 14 98Western Nebraska CC-Scottsbluff 2 11 16 12 11 8 6 12 6 6 90Northeastern Junior College 8 10 3 15 11 10 8 7 8 7 87Chadron State College 7 6 15 10 13 8 4 8 8 4 83University of Northern Colorado 7 8 6 8 6 7 9 9 5 3 68Brigham Young Univ - Idaho 9 7 8 4 6 4 4 1 7 4 54Montana State Univ-Billings 5 12 5 6 3 6 4 5 3 3 52Montana State University-Bozeman 2 2 9 3 3 6 2 6 9 3 45Utah State University 3 3 5 6 6 1 3 3 8 6 44Colorado State University-Ft Collins 1 0 0 0 0 5 8 9 12 7 42Brigham Young University-Utah 1 2 6 6 3 7 3 5 2 3 38Metropolitan State College-Denver 3 0 4 4 4 1 3 5 6 3 33University of Montana 2 5 3 2 2 3 3 2 4 6 32Mesa State College 2 2 2 3 1 6 4 3 4 4 31South Dakota School of Mine & Tech 3 4 3 3 8 3 1 2 2 1 30Dickinson State University 3 4 3 3 1 3 0 6 7 0 30Weber State University 0 4 4 7 5 1 2 1 4 2 30Columbia Basin College 5 4 5 3 9 0 0 2 0 0 28Pikes Peak Community College 4 1 5 3 1 4 2 1 2 3 26Aims Community College 2 4 1 3 3 4 0 4 1 4 26University of Alaska-Anchorage 3 5 2 2 3 4 1 4 0 1 25University of Utah 2 5 3 1 1 3 5 3 1 1 25University of Colorado-Boulder 1 2 7 2 3 2 2 4 1 1 25Mid-Plains Community College 4 2 1 2 3 0 3 4 3 2 24Utah Valley State College 1 1 1 4 0 2 2 1 5 6 23Boise State University 2 3 2 1 3 1 0 1 5 3 21University of Idaho 3 4 4 0 2 2 2 1 2 0 20
Source: UW Student Information System (Banner)
P11.067OIA:TLS
16-Sep-2011
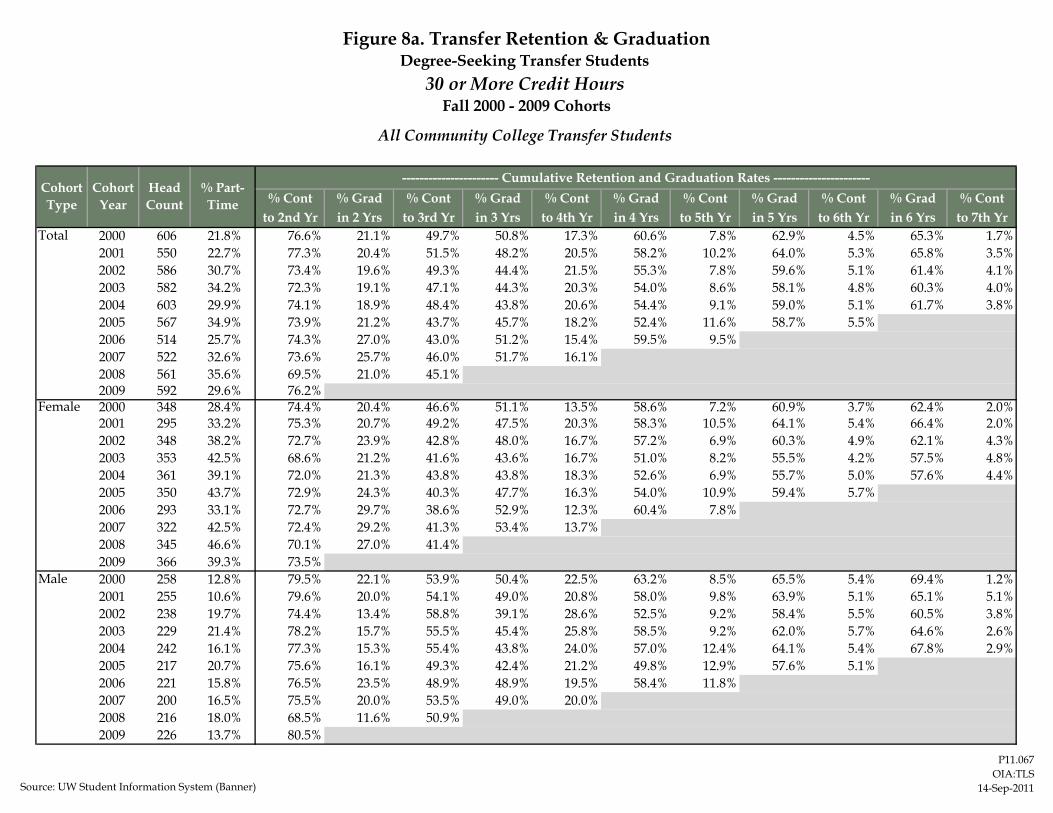
Figure 8a. Transfer Retention & GraduationDegree-Seeking Transfer Students
30 or More Credit HoursFall 2000 - 2009 Cohorts
All Community College Transfer Students
---------------------- Cumulative Retention and Graduation Rates ----------------------% Cont % Grad % Cont % Grad % Cont % Grad % Cont % Grad % Cont % Grad % Cont
to 2nd Yr in 2 Yrs to 3rd Yr in 3 Yrs to 4th Yr in 4 Yrs to 5th Yr in 5 Yrs to 6th Yr in 6 Yrs to 7th YrTotal 2000 606 21.8% 76.6% 21.1% 49.7% 50.8% 17.3% 60.6% 7.8% 62.9% 4.5% 65.3% 1.7%
2001 550 22.7% 77.3% 20.4% 51.5% 48.2% 20.5% 58.2% 10.2% 64.0% 5.3% 65.8% 3.5%2002 586 30.7% 73.4% 19.6% 49.3% 44.4% 21.5% 55.3% 7.8% 59.6% 5.1% 61.4% 4.1%2003 582 34.2% 72.3% 19.1% 47.1% 44.3% 20.3% 54.0% 8.6% 58.1% 4.8% 60.3% 4.0%2004 603 29.9% 74.1% 18.9% 48.4% 43.8% 20.6% 54.4% 9.1% 59.0% 5.1% 61.7% 3.8%2005 567 34.9% 73.9% 21.2% 43.7% 45.7% 18.2% 52.4% 11.6% 58.7% 5.5%2006 514 25.7% 74.3% 27.0% 43.0% 51.2% 15.4% 59.5% 9.5%2007 522 32.6% 73.6% 25.7% 46.0% 51.7% 16.1%2008 561 35.6% 69.5% 21.0% 45.1%2009 592 29.6% 76.2%
Female 2000 348 28.4% 74.4% 20.4% 46.6% 51.1% 13.5% 58.6% 7.2% 60.9% 3.7% 62.4% 2.0%2001 295 33.2% 75.3% 20.7% 49.2% 47.5% 20.3% 58.3% 10.5% 64.1% 5.4% 66.4% 2.0%2002 348 38.2% 72.7% 23.9% 42.8% 48.0% 16.7% 57.2% 6.9% 60.3% 4.9% 62.1% 4.3%2003 353 42.5% 68.6% 21.2% 41.6% 43.6% 16.7% 51.0% 8.2% 55.5% 4.2% 57.5% 4.8%2004 361 39.1% 72.0% 21.3% 43.8% 43.8% 18.3% 52.6% 6.9% 55.7% 5.0% 57.6% 4.4%2005 350 43.7% 72.9% 24.3% 40.3% 47.7% 16.3% 54.0% 10.9% 59.4% 5.7%2006 293 33.1% 72.7% 29.7% 38.6% 52.9% 12.3% 60.4% 7.8%2007 322 42.5% 72.4% 29.2% 41.3% 53.4% 13.7%2008 345 46.6% 70.1% 27.0% 41.4%2009 366 39.3% 73.5%
Male 2000 258 12.8% 79.5% 22.1% 53.9% 50.4% 22.5% 63.2% 8.5% 65.5% 5.4% 69.4% 1.2%2001 255 10.6% 79.6% 20.0% 54.1% 49.0% 20.8% 58.0% 9.8% 63.9% 5.1% 65.1% 5.1%2002 238 19.7% 74.4% 13.4% 58.8% 39.1% 28.6% 52.5% 9.2% 58.4% 5.5% 60.5% 3.8%2003 229 21.4% 78.2% 15.7% 55.5% 45.4% 25.8% 58.5% 9.2% 62.0% 5.7% 64.6% 2.6%2004 242 16.1% 77.3% 15.3% 55.4% 43.8% 24.0% 57.0% 12.4% 64.1% 5.4% 67.8% 2.9%2005 217 20.7% 75.6% 16.1% 49.3% 42.4% 21.2% 49.8% 12.9% 57.6% 5.1%2006 221 15.8% 76.5% 23.5% 48.9% 48.9% 19.5% 58.4% 11.8%2007 200 16.5% 75.5% 20.0% 53.5% 49.0% 20.0%2008 216 18.0% 68.5% 11.6% 50.9%2009 226 13.7% 80.5%
% Part-Time
Head Count
Cohort Year
Cohort Type
Source: UW Student Information System (Banner)
P11.067OIA:TLS
14-Sep-2011
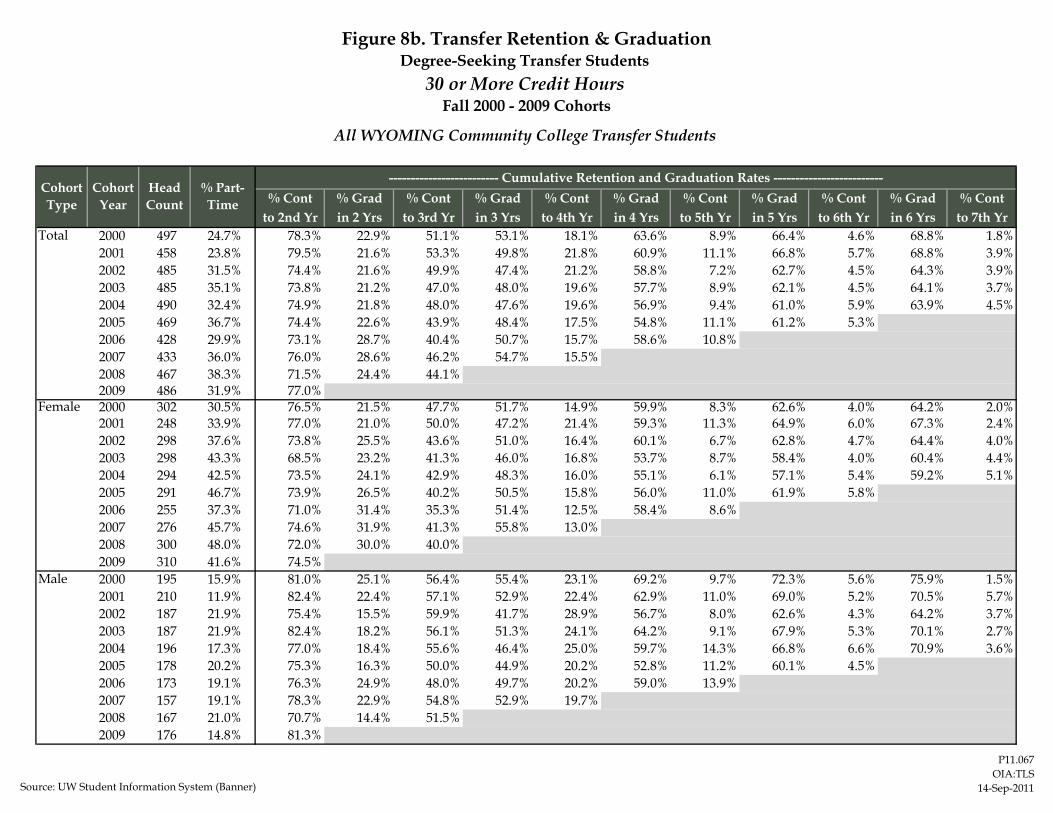
Figure 8b. Transfer Retention & GraduationDegree-Seeking Transfer Students
30 or More Credit HoursFall 2000 - 2009 Cohorts
All WYOMING Community College Transfer Students
------------------------- Cumulative Retention and Graduation Rates -------------------------% Cont % Grad % Cont % Grad % Cont % Grad % Cont % Grad % Cont % Grad % Cont
to 2nd Yr in 2 Yrs to 3rd Yr in 3 Yrs to 4th Yr in 4 Yrs to 5th Yr in 5 Yrs to 6th Yr in 6 Yrs to 7th YrTotal 2000 497 24.7% 78.3% 22.9% 51.1% 53.1% 18.1% 63.6% 8.9% 66.4% 4.6% 68.8% 1.8%
2001 458 23.8% 79.5% 21.6% 53.3% 49.8% 21.8% 60.9% 11.1% 66.8% 5.7% 68.8% 3.9%2002 485 31.5% 74.4% 21.6% 49.9% 47.4% 21.2% 58.8% 7.2% 62.7% 4.5% 64.3% 3.9%2003 485 35.1% 73.8% 21.2% 47.0% 48.0% 19.6% 57.7% 8.9% 62.1% 4.5% 64.1% 3.7%2004 490 32.4% 74.9% 21.8% 48.0% 47.6% 19.6% 56.9% 9.4% 61.0% 5.9% 63.9% 4.5%2005 469 36.7% 74.4% 22.6% 43.9% 48.4% 17.5% 54.8% 11.1% 61.2% 5.3%2006 428 29.9% 73.1% 28.7% 40.4% 50.7% 15.7% 58.6% 10.8%2007 433 36.0% 76.0% 28.6% 46.2% 54.7% 15.5%2008 467 38.3% 71.5% 24.4% 44.1%2009 486 31.9% 77.0%
Female 2000 302 30.5% 76.5% 21.5% 47.7% 51.7% 14.9% 59.9% 8.3% 62.6% 4.0% 64.2% 2.0%2001 248 33.9% 77.0% 21.0% 50.0% 47.2% 21.4% 59.3% 11.3% 64.9% 6.0% 67.3% 2.4%2002 298 37.6% 73.8% 25.5% 43.6% 51.0% 16.4% 60.1% 6.7% 62.8% 4.7% 64.4% 4.0%2003 298 43.3% 68.5% 23.2% 41.3% 46.0% 16.8% 53.7% 8.7% 58.4% 4.0% 60.4% 4.4%2004 294 42.5% 73.5% 24.1% 42.9% 48.3% 16.0% 55.1% 6.1% 57.1% 5.4% 59.2% 5.1%2005 291 46.7% 73.9% 26.5% 40.2% 50.5% 15.8% 56.0% 11.0% 61.9% 5.8%2006 255 37.3% 71.0% 31.4% 35.3% 51.4% 12.5% 58.4% 8.6%2007 276 45.7% 74.6% 31.9% 41.3% 55.8% 13.0%2008 300 48.0% 72.0% 30.0% 40.0%2009 310 41.6% 74.5%
Male 2000 195 15.9% 81.0% 25.1% 56.4% 55.4% 23.1% 69.2% 9.7% 72.3% 5.6% 75.9% 1.5%2001 210 11.9% 82.4% 22.4% 57.1% 52.9% 22.4% 62.9% 11.0% 69.0% 5.2% 70.5% 5.7%2002 187 21.9% 75.4% 15.5% 59.9% 41.7% 28.9% 56.7% 8.0% 62.6% 4.3% 64.2% 3.7%2003 187 21.9% 82.4% 18.2% 56.1% 51.3% 24.1% 64.2% 9.1% 67.9% 5.3% 70.1% 2.7%2004 196 17.3% 77.0% 18.4% 55.6% 46.4% 25.0% 59.7% 14.3% 66.8% 6.6% 70.9% 3.6%2005 178 20.2% 75.3% 16.3% 50.0% 44.9% 20.2% 52.8% 11.2% 60.1% 4.5%2006 173 19.1% 76.3% 24.9% 48.0% 49.7% 20.2% 59.0% 13.9%2007 157 19.1% 78.3% 22.9% 54.8% 52.9% 19.7%2008 167 21.0% 70.7% 14.4% 51.5%2009 176 14.8% 81.3%
% Part-Time
Head Count
Cohort Year
Cohort Type
Source: UW Student Information System (Banner)
P11.067OIA:TLS
14-Sep-2011
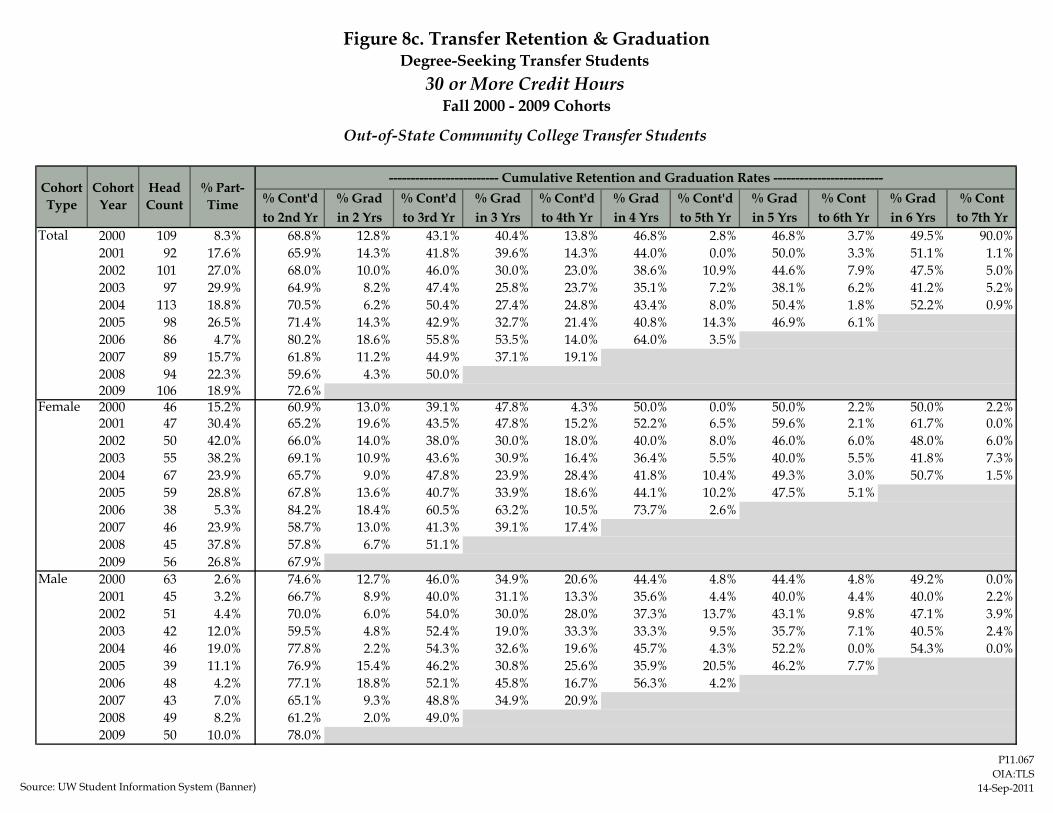
Figure 8c. Transfer Retention & GraduationDegree-Seeking Transfer Students
30 or More Credit HoursFall 2000 - 2009 Cohorts
Out-of-State Community College Transfer Students
------------------------- Cumulative Retention and Graduation Rates -------------------------% Cont'd % Grad % Cont'd % Grad % Cont'd % Grad % Cont'd % Grad % Cont % Grad % Contto 2nd Yr in 2 Yrs to 3rd Yr in 3 Yrs to 4th Yr in 4 Yrs to 5th Yr in 5 Yrs to 6th Yr in 6 Yrs to 7th Yr
Total 2000 109 8.3% 68.8% 12.8% 43.1% 40.4% 13.8% 46.8% 2.8% 46.8% 3.7% 49.5% 90.0%2001 92 17.6% 65.9% 14.3% 41.8% 39.6% 14.3% 44.0% 0.0% 50.0% 3.3% 51.1% 1.1%2002 101 27.0% 68.0% 10.0% 46.0% 30.0% 23.0% 38.6% 10.9% 44.6% 7.9% 47.5% 5.0%2003 97 29.9% 64.9% 8.2% 47.4% 25.8% 23.7% 35.1% 7.2% 38.1% 6.2% 41.2% 5.2%2004 113 18.8% 70.5% 6.2% 50.4% 27.4% 24.8% 43.4% 8.0% 50.4% 1.8% 52.2% 0.9%2005 98 26.5% 71.4% 14.3% 42.9% 32.7% 21.4% 40.8% 14.3% 46.9% 6.1%2006 86 4.7% 80.2% 18.6% 55.8% 53.5% 14.0% 64.0% 3.5%2007 89 15.7% 61.8% 11.2% 44.9% 37.1% 19.1%2008 94 22.3% 59.6% 4.3% 50.0%2009 106 18.9% 72.6%
Female 2000 46 15.2% 60.9% 13.0% 39.1% 47.8% 4.3% 50.0% 0.0% 50.0% 2.2% 50.0% 2.2%2001 47 30.4% 65.2% 19.6% 43.5% 47.8% 15.2% 52.2% 6.5% 59.6% 2.1% 61.7% 0.0%2002 50 42.0% 66.0% 14.0% 38.0% 30.0% 18.0% 40.0% 8.0% 46.0% 6.0% 48.0% 6.0%2003 55 38.2% 69.1% 10.9% 43.6% 30.9% 16.4% 36.4% 5.5% 40.0% 5.5% 41.8% 7.3%2004 67 23.9% 65.7% 9.0% 47.8% 23.9% 28.4% 41.8% 10.4% 49.3% 3.0% 50.7% 1.5%2005 59 28.8% 67.8% 13.6% 40.7% 33.9% 18.6% 44.1% 10.2% 47.5% 5.1%2006 38 5.3% 84.2% 18.4% 60.5% 63.2% 10.5% 73.7% 2.6%2007 46 23.9% 58.7% 13.0% 41.3% 39.1% 17.4%2008 45 37.8% 57.8% 6.7% 51.1%2009 56 26.8% 67.9%
Male 2000 63 2.6% 74.6% 12.7% 46.0% 34.9% 20.6% 44.4% 4.8% 44.4% 4.8% 49.2% 0.0%2001 45 3.2% 66.7% 8.9% 40.0% 31.1% 13.3% 35.6% 4.4% 40.0% 4.4% 40.0% 2.2%2002 51 4.4% 70.0% 6.0% 54.0% 30.0% 28.0% 37.3% 13.7% 43.1% 9.8% 47.1% 3.9%2003 42 12.0% 59.5% 4.8% 52.4% 19.0% 33.3% 33.3% 9.5% 35.7% 7.1% 40.5% 2.4%2004 46 19.0% 77.8% 2.2% 54.3% 32.6% 19.6% 45.7% 4.3% 52.2% 0.0% 54.3% 0.0%2005 39 11.1% 76.9% 15.4% 46.2% 30.8% 25.6% 35.9% 20.5% 46.2% 7.7%2006 48 4.2% 77.1% 18.8% 52.1% 45.8% 16.7% 56.3% 4.2%2007 43 7.0% 65.1% 9.3% 48.8% 34.9% 20.9%2008 49 8.2% 61.2% 2.0% 49.0%2009 50 10.0% 78.0%
% Part-Time
Head Count
Cohort Year
Cohort Type
Source: UW Student Information System (Banner)
P11.067OIA:TLS
14-Sep-2011
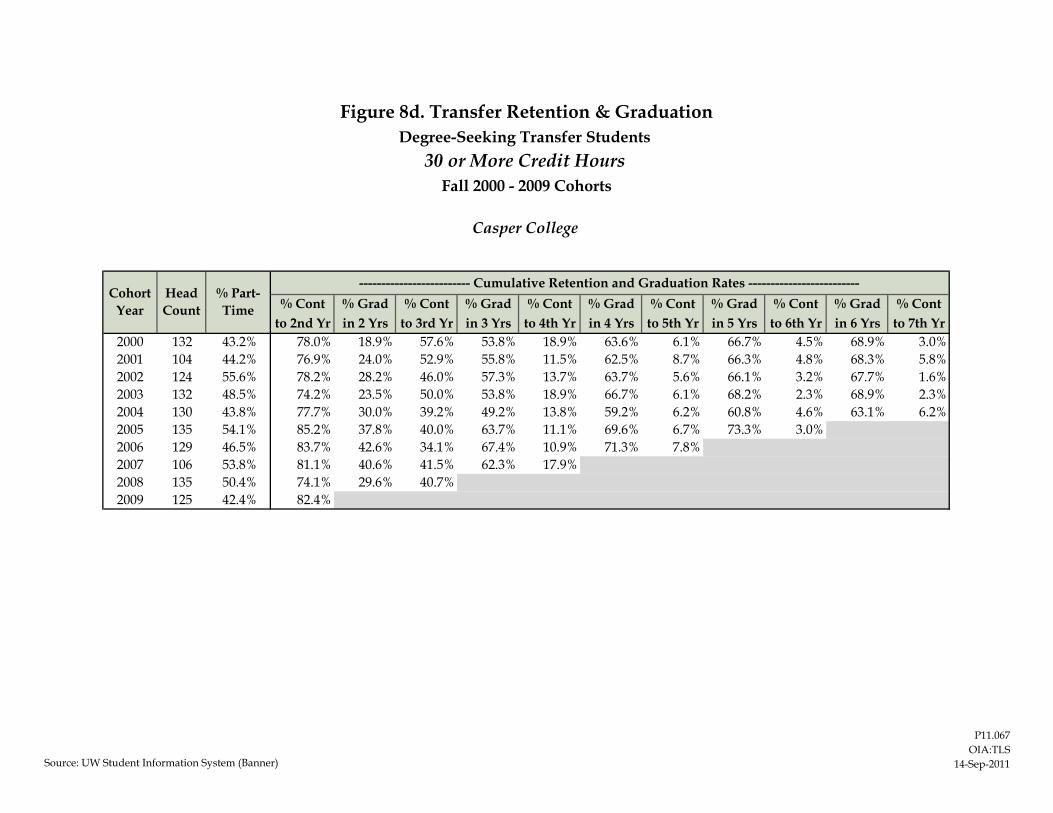
------------------------- Cumulative Retention and Graduation Rates -------------------------% Cont % Grad % Cont % Grad % Cont % Grad % Cont % Grad % Cont % Grad % Cont
to 2nd Yr in 2 Yrs to 3rd Yr in 3 Yrs to 4th Yr in 4 Yrs to 5th Yr in 5 Yrs to 6th Yr in 6 Yrs to 7th Yr2000 132 43.2% 78.0% 18.9% 57.6% 53.8% 18.9% 63.6% 6.1% 66.7% 4.5% 68.9% 3.0%2001 104 44.2% 76.9% 24.0% 52.9% 55.8% 11.5% 62.5% 8.7% 66.3% 4.8% 68.3% 5.8%2002 124 55.6% 78.2% 28.2% 46.0% 57.3% 13.7% 63.7% 5.6% 66.1% 3.2% 67.7% 1.6%2003 132 48.5% 74.2% 23.5% 50.0% 53.8% 18.9% 66.7% 6.1% 68.2% 2.3% 68.9% 2.3%2004 130 43.8% 77.7% 30.0% 39.2% 49.2% 13.8% 59.2% 6.2% 60.8% 4.6% 63.1% 6.2%2005 135 54.1% 85.2% 37.8% 40.0% 63.7% 11.1% 69.6% 6.7% 73.3% 3.0%2006 129 46.5% 83.7% 42.6% 34.1% 67.4% 10.9% 71.3% 7.8%2007 106 53.8% 81.1% 40.6% 41.5% 62.3% 17.9%2008 135 50.4% 74.1% 29.6% 40.7%2009 125 42.4% 82.4%
Cohort Year
Head Count
% Part-Time
Figure 8d. Transfer Retention & GraduationDegree-Seeking Transfer Students
30 or More Credit HoursFall 2000 - 2009 Cohorts
Casper College
Source: UW Student Information System (Banner)
P11.067OIA:TLS
14-Sep-2011
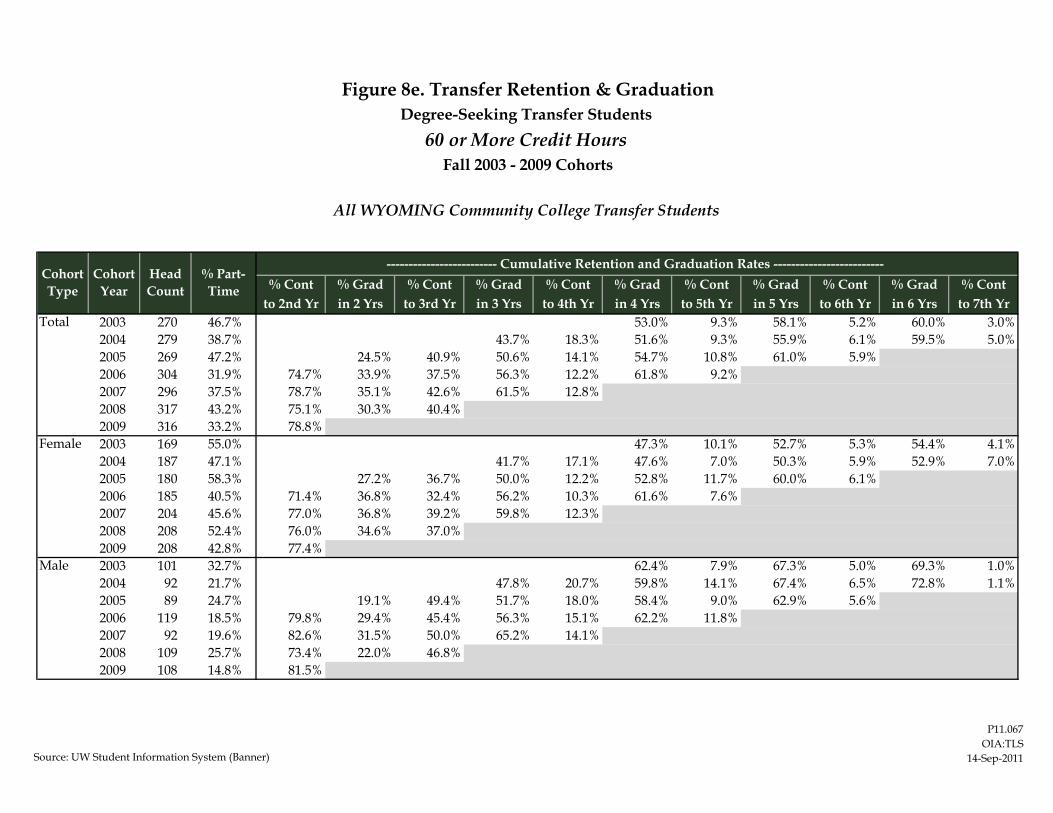
Figure 8e. Transfer Retention & GraduationDegree-Seeking Transfer Students
60 or More Credit HoursFall 2003 - 2009 Cohorts
All WYOMING Community College Transfer Students
------------------------- Cumulative Retention and Graduation Rates -------------------------% Cont % Grad % Cont % Grad % Cont % Grad % Cont % Grad % Cont % Grad % Cont
to 2nd Yr in 2 Yrs to 3rd Yr in 3 Yrs to 4th Yr in 4 Yrs to 5th Yr in 5 Yrs to 6th Yr in 6 Yrs to 7th YrTotal 2003 270 46.7% 53.0% 9.3% 58.1% 5.2% 60.0% 3.0%
2004 279 38.7% 43.7% 18.3% 51.6% 9.3% 55.9% 6.1% 59.5% 5.0%2005 269 47.2% 24.5% 40.9% 50.6% 14.1% 54.7% 10.8% 61.0% 5.9%2006 304 31.9% 74.7% 33.9% 37.5% 56.3% 12.2% 61.8% 9.2%2007 296 37.5% 78.7% 35.1% 42.6% 61.5% 12.8%2008 317 43.2% 75.1% 30.3% 40.4%2009 316 33.2% 78.8%
Female 2003 169 55.0% 47.3% 10.1% 52.7% 5.3% 54.4% 4.1%2004 187 47.1% 41.7% 17.1% 47.6% 7.0% 50.3% 5.9% 52.9% 7.0%2005 180 58.3% 27.2% 36.7% 50.0% 12.2% 52.8% 11.7% 60.0% 6.1%2006 185 40.5% 71.4% 36.8% 32.4% 56.2% 10.3% 61.6% 7.6%2007 204 45.6% 77.0% 36.8% 39.2% 59.8% 12.3%2008 208 52.4% 76.0% 34.6% 37.0%2009 208 42.8% 77.4%
Male 2003 101 32.7% 62.4% 7.9% 67.3% 5.0% 69.3% 1.0%2004 92 21.7% 47.8% 20.7% 59.8% 14.1% 67.4% 6.5% 72.8% 1.1%2005 89 24.7% 19.1% 49.4% 51.7% 18.0% 58.4% 9.0% 62.9% 5.6%2006 119 18.5% 79.8% 29.4% 45.4% 56.3% 15.1% 62.2% 11.8%2007 92 19.6% 82.6% 31.5% 50.0% 65.2% 14.1%2008 109 25.7% 73.4% 22.0% 46.8%2009 108 14.8% 81.5%
Cohort Type
Cohort Year
Head Count
% Part-Time
Source: UW Student Information System (Banner)
P11.067OIA:TLS
14-Sep-2011
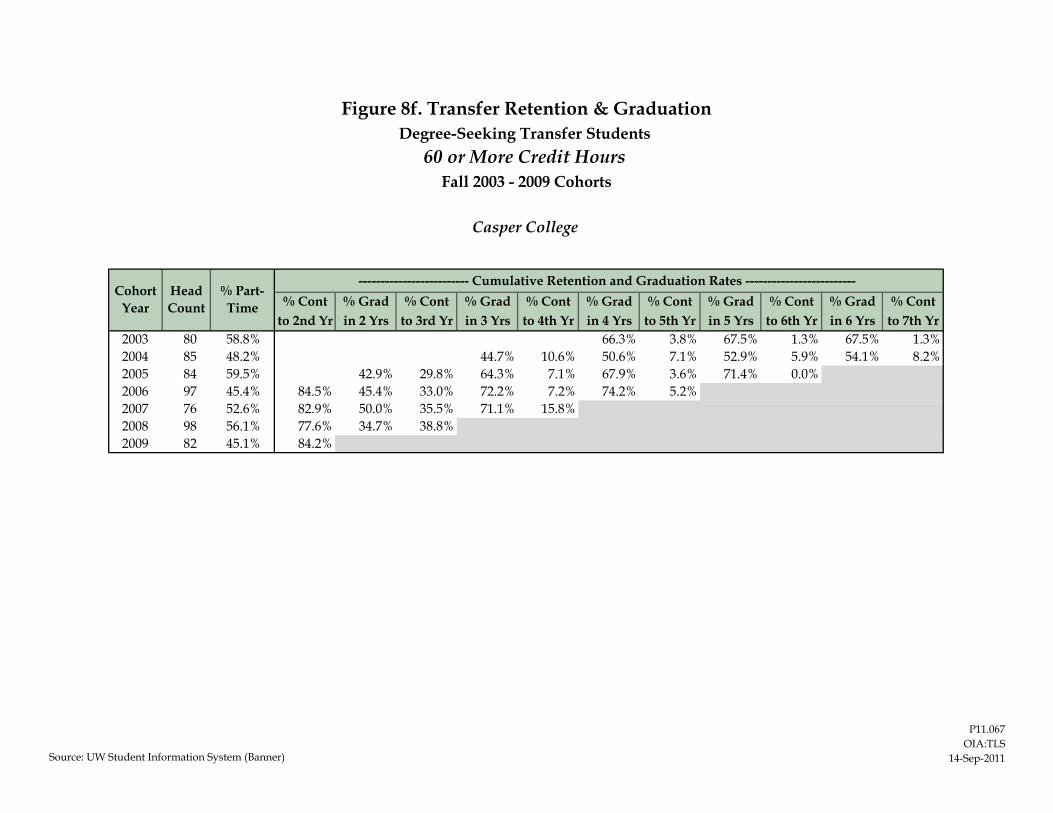
------------------------- Cumulative Retention and Graduation Rates -------------------------% Cont % Grad % Cont % Grad % Cont % Grad % Cont % Grad % Cont % Grad % Cont
to 2nd Yr in 2 Yrs to 3rd Yr in 3 Yrs to 4th Yr in 4 Yrs to 5th Yr in 5 Yrs to 6th Yr in 6 Yrs to 7th Yr2003 80 58.8% 66.3% 3.8% 67.5% 1.3% 67.5% 1.3%2004 85 48.2% 44.7% 10.6% 50.6% 7.1% 52.9% 5.9% 54.1% 8.2%2005 84 59.5% 42.9% 29.8% 64.3% 7.1% 67.9% 3.6% 71.4% 0.0%2006 97 45.4% 84.5% 45.4% 33.0% 72.2% 7.2% 74.2% 5.2%2007 76 52.6% 82.9% 50.0% 35.5% 71.1% 15.8%2008 98 56.1% 77.6% 34.7% 38.8%2009 82 45.1% 84.2%
Cohort Year
Head Count
% Part-Time
Figure 8f. Transfer Retention & GraduationDegree-Seeking Transfer Students
60 or More Credit HoursFall 2003 - 2009 Cohorts
Casper College
Source: UW Student Information System (Banner)
P11.067OIA:TLS
14-Sep-2011
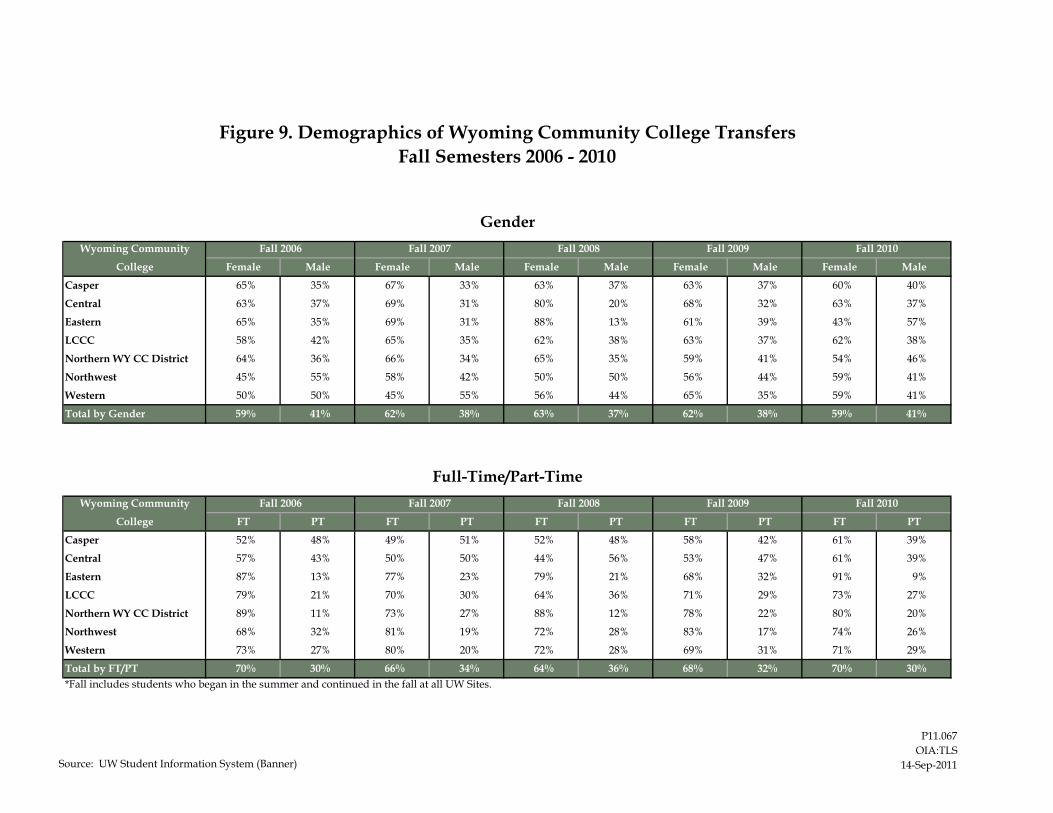
Figure 9. Demographics of Wyoming Community College TransfersFall Semesters 2006 - 2010
GenderWyoming Community Fall 2006 Fall 2007 Fall 2008 Fall 2009 Fall 2010
College Female Male Female Male Female Male Female Male Female Male
Casper 65% 35% 67% 33% 63% 37% 63% 37% 60% 40%
Central 63% 37% 69% 31% 80% 20% 68% 32% 63% 37%
Eastern 65% 35% 69% 31% 88% 13% 61% 39% 43% 57%
LCCC 58% 42% 65% 35% 62% 38% 63% 37% 62% 38%
Northern WY CC District 64% 36% 66% 34% 65% 35% 59% 41% 54% 46%
Northwest 45% 55% 58% 42% 50% 50% 56% 44% 59% 41%
Western 50% 50% 45% 55% 56% 44% 65% 35% 59% 41%
Total by Gender 59% 41% 62% 38% 63% 37% 62% 38% 59% 41%
Full-Time/Part-TimeWyoming Community Fall 2006 Fall 2007 Fall 2008 Fall 2009 Fall 2010
College FT PT FT PT FT PT FT PT FT PT
Casper 52% 48% 49% 51% 52% 48% 58% 42% 61% 39%
Central 57% 43% 50% 50% 44% 56% 53% 47% 61% 39%
Eastern 87% 13% 77% 23% 79% 21% 68% 32% 91% 9%
LCCC 79% 21% 70% 30% 64% 36% 71% 29% 73% 27%
Northern WY CC District 89% 11% 73% 27% 88% 12% 78% 22% 80% 20%
Northwest 68% 32% 81% 19% 72% 28% 83% 17% 74% 26%
Western 73% 27% 80% 20% 72% 28% 69% 31% 71% 29%
Total by FT/PT 70% 30% 66% 34% 64% 36% 68% 32% 70% 30%*Fall includes students who began in the summer and continued in the fall at all UW Sites.
Source: UW Student Information System (Banner)
P11.067OIA:TLS
14-Sep-2011
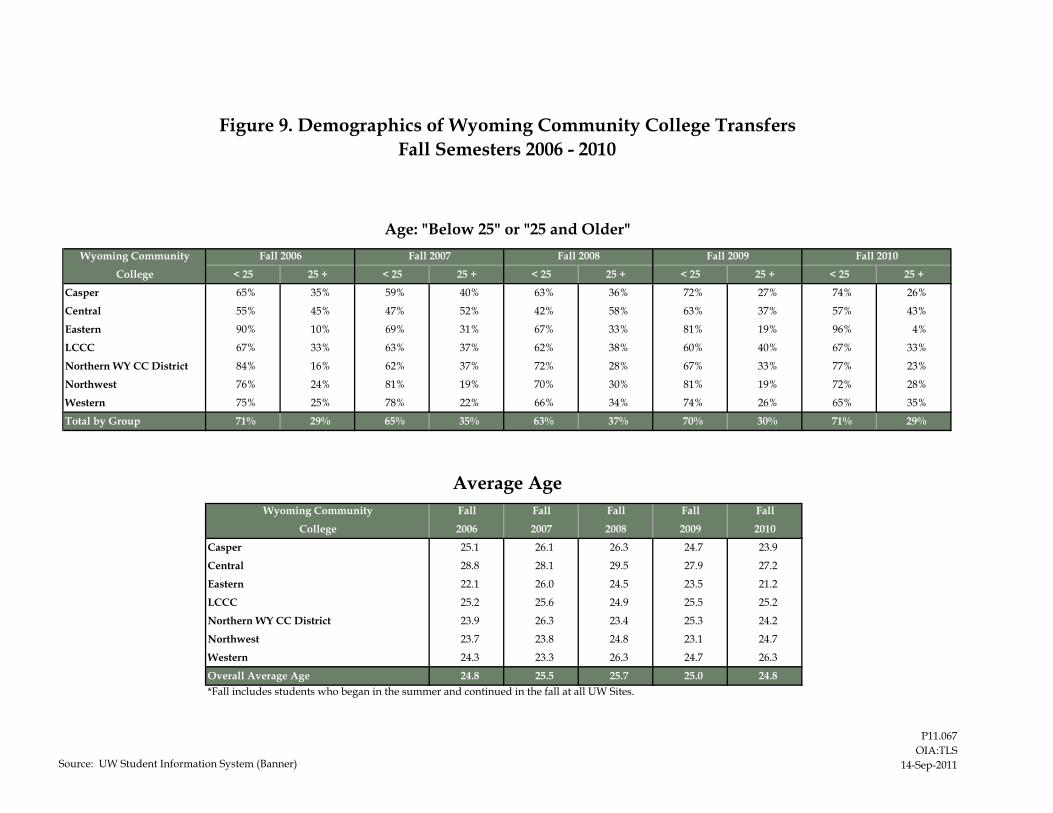
Figure 9. Demographics of Wyoming Community College TransfersFall Semesters 2006 - 2010
Wyoming Community Fall 2006 Fall 2007 Fall 2008 Fall 2009 Fall 2010
College < 25 25 + < 25 25 + < 25 25 + < 25 25 + < 25 25 +
Casper 65% 35% 59% 40% 63% 36% 72% 27% 74% 26%
Central 55% 45% 47% 52% 42% 58% 63% 37% 57% 43%
Eastern 90% 10% 69% 31% 67% 33% 81% 19% 96% 4%
LCCC 67% 33% 63% 37% 62% 38% 60% 40% 67% 33%
Northern WY CC District 84% 16% 62% 37% 72% 28% 67% 33% 77% 23%
Northwest 76% 24% 81% 19% 70% 30% 81% 19% 72% 28%
Western 75% 25% 78% 22% 66% 34% 74% 26% 65% 35%
Total by Group 71% 29% 65% 35% 63% 37% 70% 30% 71% 29%
Fall Fall Fall Fall Fall
2006 2007 2008 2009 2010
Casper 25.1 26.1 26.3 24.7 23.9
Central 28.8 28.1 29.5 27.9 27.2
Eastern 22.1 26.0 24.5 23.5 21.2
LCCC 25.2 25.6 24.9 25.5 25.2
Northern WY CC District 23.9 26.3 23.4 25.3 24.2
Northwest 23.7 23.8 24.8 23.1 24.7
Western 24.3 23.3 26.3 24.7 26.3
24.8 25.5 25.7 25.0 24.8*Fall includes students who began in the summer and continued in the fall at all UW Sites.
Wyoming Community
College
Overall Average Age
Age: "Below 25" or "25 and Older"
Average Age
Source: UW Student Information System (Banner)
P11.067OIA:TLS
14-Sep-2011
Fall 2010Fall 2009Fall 2008
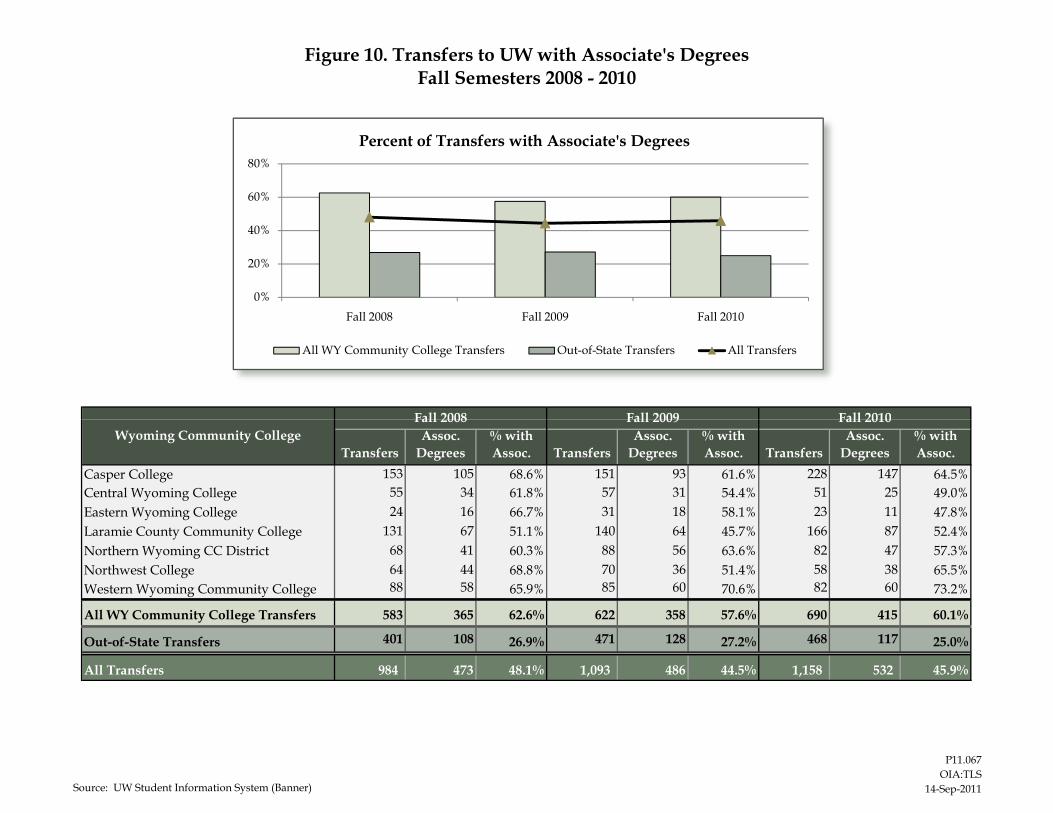
Figure 10. Transfers to UW with Associate's DegreesFall Semesters 2008 - 2010
0%
20%
40%
60%
80%
Fall 2008 Fall 2009 Fall 2010
Percent of Transfers with Associate's Degrees
All WY Community College Transfers Out-of-State Transfers All Transfers
TransfersAssoc.
Degrees% with Assoc. Transfers
Assoc. Degrees
% with Assoc. Transfers
Assoc. Degrees
% with Assoc.
Casper College 153 105 68.6% 151 93 61.6% 228 147 64.5%Central Wyoming College 55 34 61.8% 57 31 54.4% 51 25 49.0%Eastern Wyoming College 24 16 66.7% 31 18 58.1% 23 11 47.8%Laramie County Community College 131 67 51.1% 140 64 45.7% 166 87 52.4%Northern Wyoming CC District 68 41 60.3% 88 56 63.6% 82 47 57.3%Northwest College 64 44 68.8% 70 36 51.4% 58 38 65.5%Western Wyoming Community College 88 58 65.9% 85 60 70.6% 82 60 73.2%
All WY Community College Transfers 583 365 62.6% 622 358 57.6% 690 415 60.1%
Out-of-State Transfers 401 108 26.9% 471 128 27.2% 468 117 25.0%
All Transfers 984 473 48.1% 1,093 486 44.5% 1,158 532 45.9%
Fall 2010Fall 2009Wyoming Community College
Fall 2008
Source: UW Student Information System (Banner)
P11.067OIA:TLS
14-Sep-2011
Definition of Terms Used in New Transfer Information
New Transfer Students: Undergraduate students, who previously attended a higher education institution, have been officially admitted to the University of Wyoming (UW), and are attending UW as a degree-seeking student for the first time. This includes students at UW for the first time seeking a second bachelor’s degree.
Fall 2010 new transfers include those as defined above, who began taking classes during Summer or Fall 2010. These students are identified only with the most recent college they attended prior to attending UW. Re-enrollees at UW are not counted as new transfers.
UW GPA: Calculated by dividing the student’s earned points by earned hours.
UW GPAs are for Fall Semester 2010 only. Community College GPA: Cumulative GPA prior to UW. This GPA may include work from more than one institution. Transferred Hours: Total hours taken for grade prior to UW. This total may include hours from more than one institution. Undergraduate Students: This group includes freshmen, sophomores, juniors, seniors,
second bachelors, and non-degree undergraduates.