new regulatory approaches towards investments: a revision of
TRANSCRIPT
WIK Diskussionsbeitrag
Nr. 353
New regulatory approaches towards investments:
a revision of international experiences
IRIN working paper for working package: Advancing incentive regulation with respect to smart grids
Author:
Christine Müller
Bad Honnef, April 2011
Innovative Regulierung für intelligente NetzeInnovative Regulierung für intelligente NetzeInnovative Regulierung für intelligente NetzeInnovative Regulierung für intelligente Netze

WIK Wissenschaftliches Institut für
Infrastruktur und Kommunikationsdienste GmbH
Rhöndorfer Str. 68, 53604 Bad Honnef
Postfach 20 00, 53588 Bad Honnef
Tel 02224-9225-0
Fax 02224-9225-63
Internet: http://www.wik.org
eMail [email protected]
In den vom WIK herausgegebenen Diskussionsbeiträgen erscheinen in loser Folge Auf-sätze und Vorträge von Mitarbeitern des Instituts sowie ausgewählte Zwischen- und Ab-schlussberichte von durchgeführten Forschungsprojekten. Mit der Herausgabe dieser Reihe bezweckt das WIK, über seine Tätigkeit zu informieren, Diskussionsanstöße zu geben, aber auch Anregungen von außen zu empfangen. Kritik und Kommentare sind deshalb jederzeit willkommen. Die in den verschiedenen Beiträgen zum Ausdruck kom-menden Ansichten geben ausschließlich die Meinung der jeweiligen Autoren wieder. WIK behält sich alle Rechte vor. Ohne ausdrückliche schriftliche Genehmigung des WIK ist es auch nicht gestattet, das Werk oder Teile daraus in irgendeiner Form (Fotokopie, Mikrofilm oder einem anderen Verfahren) zu vervielfältigen oder unter Verwendung elektronischer Systeme zu verarbeiten oder zu verbreiten. ISSN 1865-8997
New regulatory approaches towards investments I
Contents
Zusammenfassung III
Summary VI
1 Introduction 1
2 Country specific facts and figures 2
2.1 Regulatory and quality statistics 2
2.2 Rate of return statistics 4
2.3 Investment statistics 7
3 New regulatory approaches towards investments (international experiences) 10
3.1 United Kingdom 11
3.2 Italy 19
3.3 Norway 22
3.4 The Netherlands 25
3.5 Interim conclusions 31
4 Conclusions 33
References 35
II Diskussionsbeitrag Nr. 353
List of figures
Figure 1: The development of the quality level (SAIDI) in the reference countries 3
Figure 2: The development of Energy Not Supplied (ENS) in Norway 4
Figure 3: DNO investments (in Mio USD per capita; normalised) for the Netherlands,
Italy, the United Kingdom and Germany 7
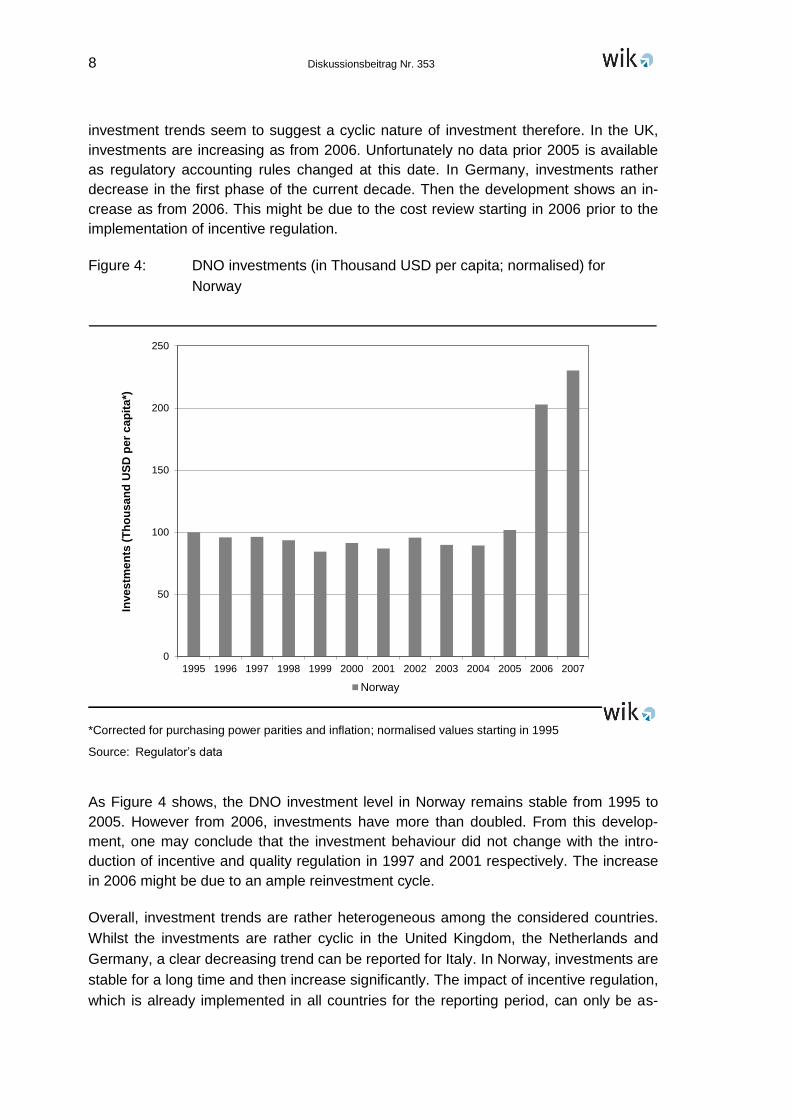
Figure 4: DNO investments (in Thousand USD per capita; normalised) for Norway 8
List of tables
Table 1: Statistics on incentive regulation and quality regulation 2
Table 2: WACC statistics (real, pre-tax values) 5
Table 3: Differentiation between different innovation categories 30
New regulatory approaches towards investments III
About „Innovative Regulation for Intelligent Networks“ (IRIN)
Ambitious climate policy in the triangle of the energy political goals sustainability, securi-
ty of supply, and competitiveness increase the importance of decentralized energy gen-
eration and the development of network infrastructure to smart grids. Since 2009 Ger-
man energy networks are subject to incentive regulation with the objective to incentivize
efficient operation of gas and electricity networks. It is an open debate how to advance
the regulatory framework such that it supports the necessary developments and the
associated investments and innovations as well as coordination in future smart grids.
The research project IRIN - Innovative Regulation for Intelligent Networks - deals with
the design of an adequate institutional framework that supports efficient and effective
network development towards smart grids. The project is funded by the Federal Ministry
of Economics (BMWi).
The project is a cooperation of the following institutes:
Bremer Energie Institut at Jacobs University (project leader)
Öko-Institut Freiburg
WIK (Wissenschaftliches Institut für Infrastruktur und Kommunikationsdienste)
Ruhr-Universität Bochum: Institut für Berg- und Energierecht
The research project aims to develop the institutional framework that guides efficient
and effective network development towards smart grids. Central research questions
are:
How to design an incentive regulation that guarantees necessary investments
while at the same time preventing inefficient investment?
Which network pricing system sends effective signals for efficient coordination of
network, generation and load installations?
Which advancements should be made to incentive regulation to adequately ac-
count for network innovation and transformation?
Are changes to the current legal framework required?
Each project partner is responsible for one of the following research foci:
Work Package 1: Advancing incentive regulation with respect to smart grids
(WIK)
Work Package 2: Intelligent network pricing (Bremer Energie Institut)
Work Package 3: Advancement of incentive regulation: network innovation
and transformation (Öko-Institut Freiburg)
Work Package 4: Adaptation of the legal framework
(Ruhr-Universität Bochum)
The results from WIK‟s work package are published as WIK discussion paper. More
background information regarding the IRIN project is available at http://www.bremer-
energie-institut.de/irin/de/background.

New regulatory approaches towards investments V
Zusammenfassung
Dieses Arbeitspapier präsentiert und evaluiert internationale Ländererfahrungen von
Regulierungsregimen, die eine Vorreiterrolle im Hinblick auf eine intensivere regulatori-
sche Auseinandersetzung mit dem Thema (dynamisch effiziente) Investitionen einneh-
men. Hierzu werden Beispiele von Ländern betrachtet, die bereits auf eine längere His-
torie im Bereich der Anreizregulierung zurückblicken und ihren Regulierungsrahmen im
Hinblick auf eine explizitere Incentivierung von Investitionen und Innovationen (im Kon-
text Smart Grids) kürzlich reformiert haben oder entsprechende Maßnahmen planen.
Als einschlägige Beispiele werden das Vereinigte Königreich, Italien, Norwegen und die
Niederlande herangezogen.
In diesen Ländern werden unterschiedlich intensive Maßnahmen zur regulatorischen
Berücksichtigung von Investitionen und zur Stimulation dynamischer Effizienz ergriffen.
Das Vereinigte Königreich kann hierbei als Pionierland betrachtet werden. Dort wurde
der Regulierungsrahmen im Zuge der RPI-X@20-Initiative komplett revidiert und es
wird eine Umstellung von einem auf Kosteneffizienz fokussierten Ansatz auf eine ganz-
heitliche, innovations- und outputorientierte Regulierungssystematik angestrebt. Im Fo-
kus steht nunmehr eine in die Zukunft gerichtete, langfristige Preis-
Leistungsbetrachtung, die allerdings noch in der Praxis erprobt werden muss. Weniger
ganzheitlich, dafür eher pragmatisch ausgerichtet sind die Instrumente in Italien. Dort
kann die Regulierungsbehörde bestimmte Investitionen mit einer zusätzlichen Rendite
versehen. In den Niederlanden werden zusätzliche Anreizmaßnahmen für Investitionen
und Innovationen aktuell intensiv diskutiert. In Norwegen hat man das Problem des
Zeitverzuges bei der regulatorischen Anerkennung der Kapitalkosten korrigiert.
Insgesamt lässt sich aus den Ansätzen im Vereinigten Königreich, Italien und Norwe-
gen sowie aus der aktuellen Debatte in den Niederlanden schlussfolgern, dass es sich
hier um vielversprechende Ansätze im Hinblick auf eine zunehmende regulatorische
Sensibilität in Bezug auf Investitionen im Kontext Smart Grids handelt. Damit die über-
geordneten klimapolitischen Ziele in regulatorische Funktionalitäten überführt werden
und der Systemumbau hin zu Smart Grids eingeleitet wird, ist es notwendig, dass auch
andere Regulierungsregime diesbezüglich eine regulatorische Debatte anstoßen und
den vorgestellten Beispielländern folgen. Eine gründliche Auseinandersetzung, inwie-
fern die regulatorischen Instrumente in den vorgestellten Beispielländern auch in
Deutschland Anwendung finden können, sollte die Diskussion begleiten.

VI Diskussionsbeitrag Nr. 353
Summary
This paper presents and evaluates international case studies of countries pioneering
increased regulatory measures towards (dynamic efficient) investment. Therefore it
analyses international experiences from regulatory regimes that already have a long
history of incentive regulation and recently revised or plan to revise their regulatory
framework to further stimulate investments and innovation in a smart grids context. The
pertinent examples in this context are the United Kingdom (UK), Italy, Norway and the
Netherlands.
The case studies show that the analysed countries adopt more or less intense
measures to increase the regulatory provision for investments and dynamic efficiency.
The UK can be considered as pioneer in pursuing this path by changing the priorities
from a regulatory focus on cost-efficiency to a holistic innovation and output-oriented
approach with a forward looking, long-term value for money perspective, albeit still lack-
ing regulatory practice. A less holistic but rather more straightforward solution has been
implemented in Italy where the regulator may increase the rate of return for specific
investments. In the Netherlands, revised approaches towards investments and innova-
tion are still under discussion. The intensity of the debate however suggests the im-
portance of this issue. Norway has corrected the time-lag problem with capital expendi-
ture.
The approaches taken in the UK, Italy and Norway as well as the current discussions in
the Netherlands are encouraging steps towards a more investment friendly regulatory
approach in a smart grids context. In order to make sure that the overarching climate
targets are transformed into regulatory functionalities in order to facilitate the paradigm
shift towards smart grids it is crucial that other countries become alert, initiate the regu-
latory debate and follow their examples. A thorough assessment as to what extent the
instruments implemented in the countries of reference would be appropriate in the
German regulatory context should help in pursuing this path.
New regulatory approaches towards investments 1
1 Introduction
Within Müller et al. (2010), we survey from a theoretical point of view to what extent
cost-based and incentive-based regulatory regimes stimulate different categories of
investments (replacement investment, expansion investments and asset innovation, i.e.
smart grid investments). For the purpose of the former analysis, we furthermore differ-
entiate by different efficiency measures, i.e. allocative efficiency, productive efficiency
and dynamic efficiency and analyse to what extent each efficiency measure1 is stimu-
lated by the regulatory regime.2
Overall, we find that conventional cost-based regulation only stimulates allocative effi-
ciency and strongly encourages over-capitalization (Averch-Johnson-Effect). Moreover,
we argue that current forms of incentive regulation only lead to productive efficiency,
predominantly incentivizing short-term efficiency in terms of operational expenditures
(OPEX). Also, additional instruments such as quality regulation and/or additional allow-
ances, e.g. investment budgets as applied in Germany, may incentivize replacement
and expansions investments respectively. However, from a theoretical point of view,
incentive regulation does not stimulate dynamic efficiency in the sense of explicit regu-
latory stimuli for asset innovation leading to a dynamically efficient CAPEX allocation.
Thus, we conclude that complex trade-offs result from the guiding idea of an efficiency
oriented network operation (productive efficiency) and the incentivisation of dynamic
efficiency. A scrutiny of the state-of the art of related academic work shows that this
problematic is merely characterized. Therefore we identify this issue as academic void
that should be filled within the IRIN project.
In pursuing this path, the objective of this paper is to present international case studies
of countries pioneering increased regulatory measures towards (dynamic efficient) in-
vestments in a smart grids context. Therefore this paper presents and analyses interna-
tional experience from regulatory regimes that already have a long history of incentive
regulation and recently revised or plan to revise their regulatory framework to further
stimulate investments and innovation. The pertinent examples in this context are the
United Kingdom (UK), Italy, Norway, and the Netherlands.
The paper is structured as follows: section two presents country specific facts and fig-
ures whilst section three deals with the case studies. Section four concludes.
1 Allocative efficiency describes a Pareto optimum where marginal revenue equals marginal cost. Pro-
ductive efficiency exists when a fixed output is reached with minimum cost or - vice versa - a maxi-mum output is reached with a fixed input. This implies that production is cost-efficient. However, both efficiency measures imply a static interpretation of efficiency not taking into account a long-term per-spective. A dynamic development is determined by process innovation and investment in new tech-nologies. This can be defined as dynamic efficiency. This efficiency measure does not only imply the creation of additional demand but also long-term cost reduction and the realisation of technological progress. Dynamic efficiency implies that welfare reaches a maximum over time. This allows for tem-porary static inefficiencies assuming that dynamic efficient investments and innovation are not always cost efficient from a short-term perspective.
2 Müller et al. (2010).
2 Diskussionsbeitrag Nr. 353
2 Country specific facts and figures
The objective of this section is to highlight regulatory and sector specific facts and fig-
ures of the countries of interest. The reporting period starts in 1995 and ends in 2010
albeit depending on data availability.
The statistics are based on different sources. Regarding the regulatory parameters, the
paper relies on information contained in the national reports regulators annually submit
to the Council of European Energy Regulators (CEER) and the European Regulators‟
Group for Electricity and Gas (ERGEG). Regarding the investment data, the analysis is
based on data provided by courtesy of regulatory authorities. Some information has
been received by expert interviews with regulatory authorities.
2.1 Regulatory and quality statistics
Table 1: Statistics on incentive regulation and quality regulation
Incentive Regulation (since)
Quality Regulation - Bonus/Malus -
(since)
Quality Regulation - Standards -
(since)
Italy 2000 2000 2000
The Netherlands 2001 2005 2000
Norway 1997 2001 2007
UK 1990 1995 1995
Source: ERGEG national reports, 4th
CEER Benchmarking report (2008) and regulator‟s data (Norway)
Table 1 provides an overview of the regulatory history of the countries of interest. The
UK can be considered as one of the European pioneers in incentive and quality regula-
tion looking back on two decades of regulatory experience. Norway certainly gives an-
other state-of-the art approach in incentive and especially quality regulation. Likewise,
the Netherlands and Italy can be considered as mature regulatory regimes, albeit each
pursuing different approaches. Detailed insights are featured in section 3.
New regulatory approaches towards investments 3
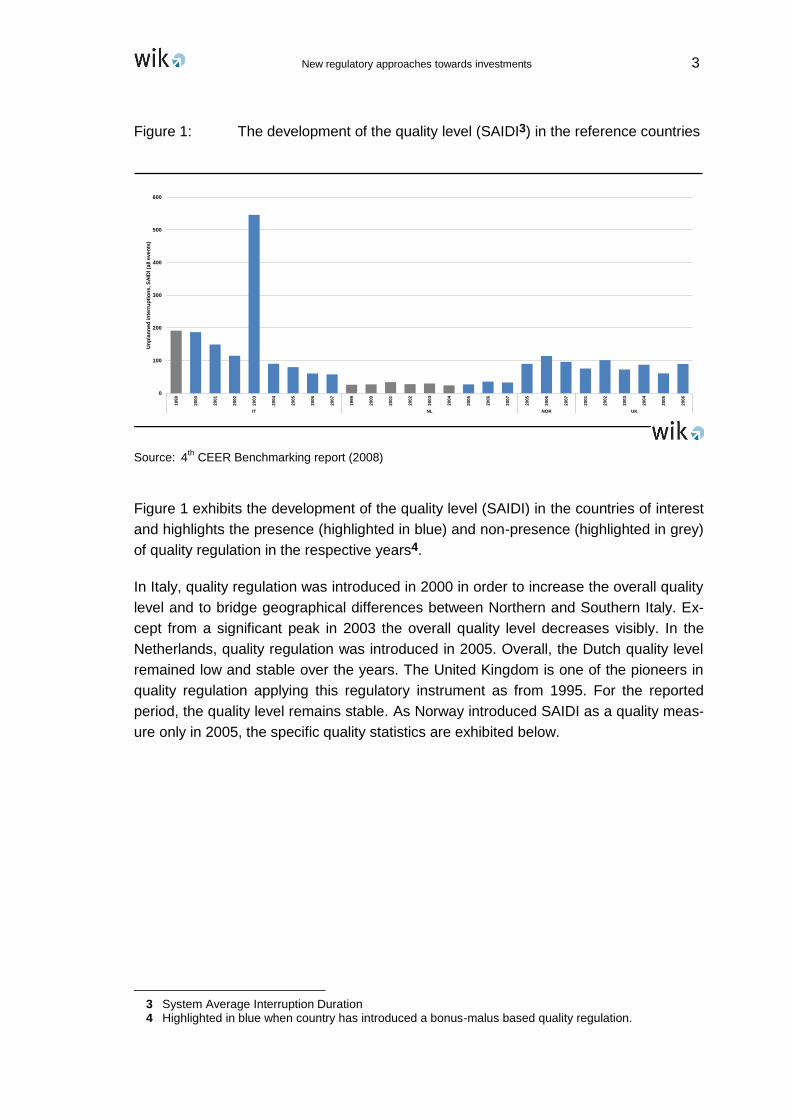
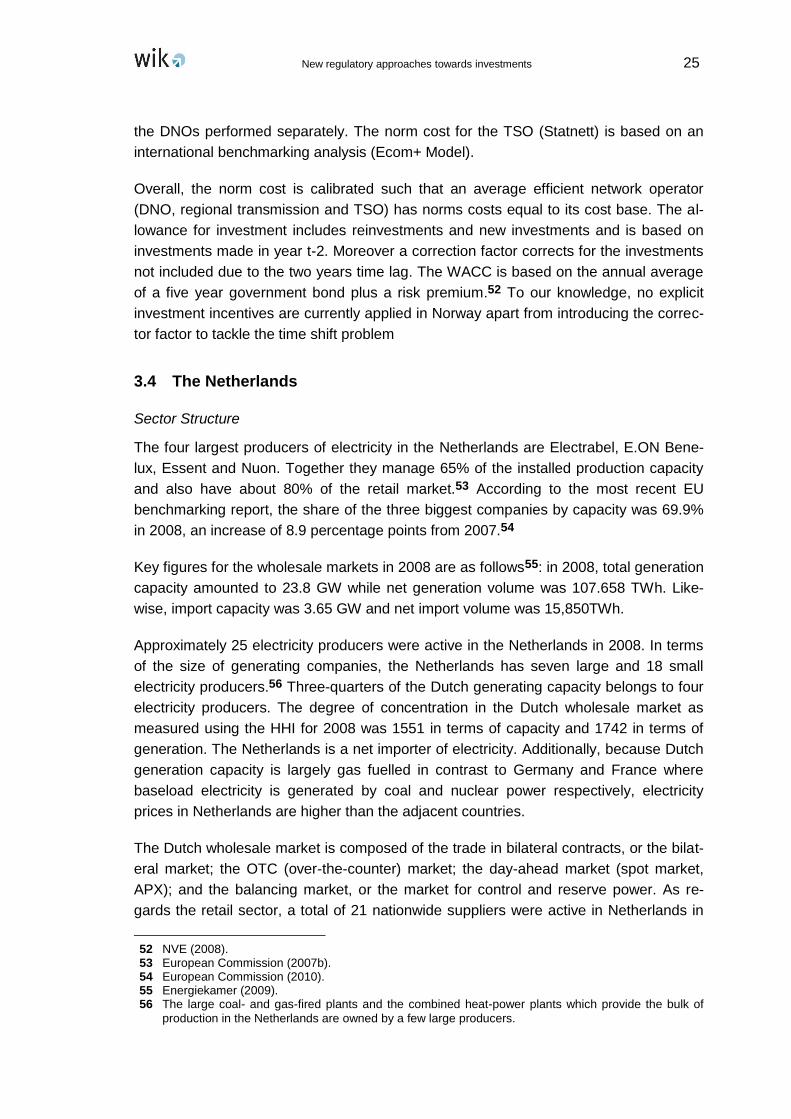
Figure 1: The development of the quality level (SAIDI3) in the reference countries
Source: 4th
CEER Benchmarking report (2008)
Figure 1 exhibits the development of the quality level (SAIDI) in the countries of interest
and highlights the presence (highlighted in blue) and non-presence (highlighted in grey)
of quality regulation in the respective years4.
In Italy, quality regulation was introduced in 2000 in order to increase the overall quality
level and to bridge geographical differences between Northern and Southern Italy. Ex-
cept from a significant peak in 2003 the overall quality level decreases visibly. In the
Netherlands, quality regulation was introduced in 2005. Overall, the Dutch quality level
remained low and stable over the years. The United Kingdom is one of the pioneers in
quality regulation applying this regulatory instrument as from 1995. For the reported
period, the quality level remains stable. As Norway introduced SAIDI as a quality meas-
ure only in 2005, the specific quality statistics are exhibited below.
3 System Average Interruption Duration 4 Highlighted in blue when country has introduced a bonus-malus based quality regulation.
0
100
200
300
400
500
600
19
99
20
00
20
01
20
02
20
03
20
04
20
05
20
06
20
07
19
99
20
00
20
01
20
02
20
03
20
04
20
05
20
06
20
07
20
05
20
06
20
07
20
01
20
02
20
03
20
04
20
05
20
06
IT NL NOR UK
Un
pla
nn
ed
in
terr
up
tio
ns
, S
AID
I (a
ll e
ve
nts
)
4 Diskussionsbeitrag Nr. 353
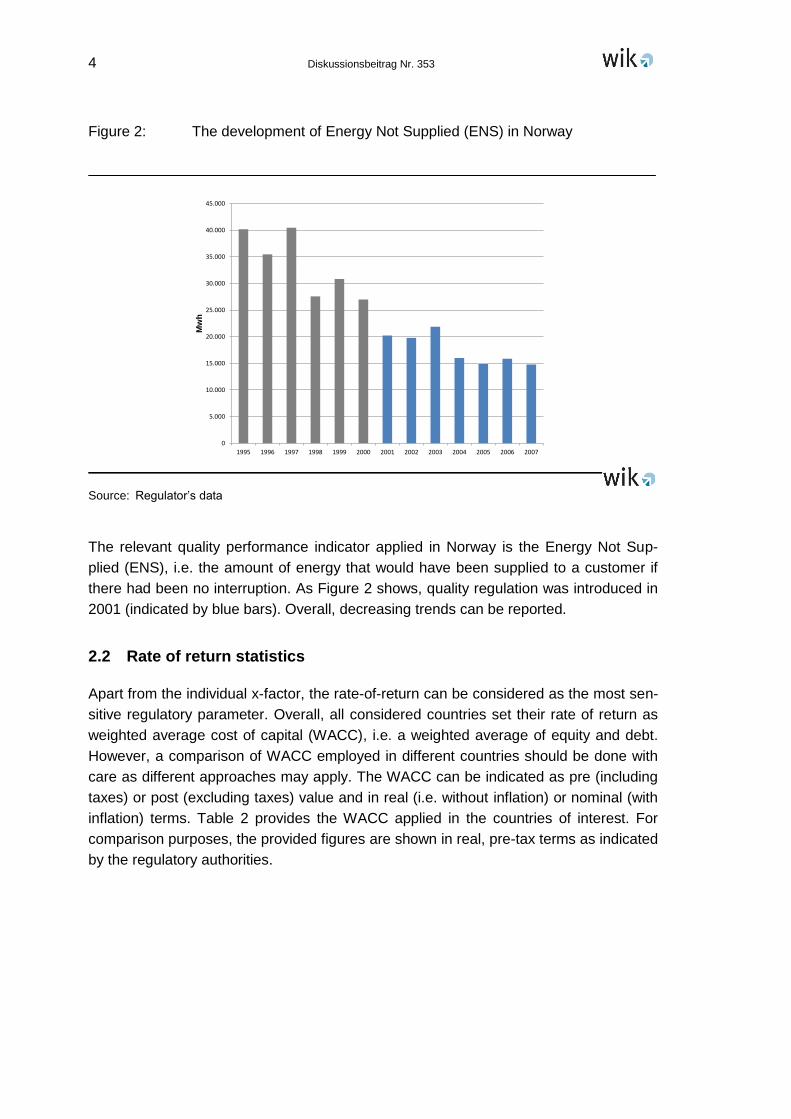
Figure 2: The development of Energy Not Supplied (ENS) in Norway
Source: Regulator‟s data
The relevant quality performance indicator applied in Norway is the Energy Not Sup-
plied (ENS), i.e. the amount of energy that would have been supplied to a customer if
there had been no interruption. As Figure 2 shows, quality regulation was introduced in
2001 (indicated by blue bars). Overall, decreasing trends can be reported.
2.2 Rate of return statistics
Apart from the individual x-factor, the rate-of-return can be considered as the most sen-
sitive regulatory parameter. Overall, all considered countries set their rate of return as
weighted average cost of capital (WACC), i.e. a weighted average of equity and debt.
However, a comparison of WACC employed in different countries should be done with
care as different approaches may apply. The WACC can be indicated as pre (including
taxes) or post (excluding taxes) value and in real (i.e. without inflation) or nominal (with
inflation) terms. Table 2 provides the WACC applied in the countries of interest. For
comparison purposes, the provided figures are shown in real, pre-tax terms as indicated
by the regulatory authorities.
0
5.000
10.000
15.000
20.000
25.000
30.000
35.000
40.000
45.000
1995 1996 1997 1998 1999 2000 2001 2002 2003 2004 2005 2006 2007
Mw
h
New regulatory approaches towards investments 5
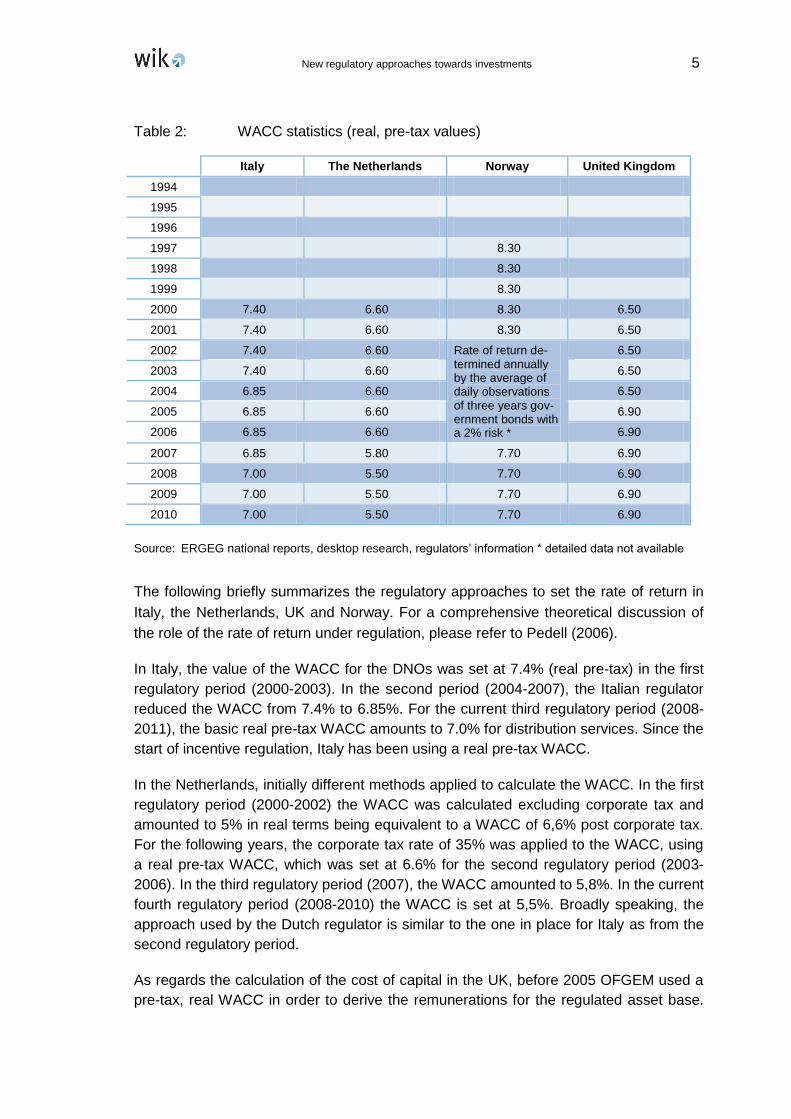
Table 2: WACC statistics (real, pre-tax values)
Italy The Netherlands Norway United Kingdom
1994
1995
1996
1997 8.30
1998 8.30
1999 8.30
2000 7.40 6.60 8.30 6.50
2001 7.40 6.60 8.30 6.50
2002 7.40 6.60 Rate of return de-termined annually by the average of daily observations of three years gov-ernment bonds with a 2% risk *
6.50
2003 7.40 6.60 6.50
2004 6.85 6.60 6.50
2005 6.85 6.60 6.90
2006 6.85 6.60 6.90
2007 6.85 5.80 7.70 6.90
2008 7.00 5.50 7.70 6.90
2009 7.00 5.50 7.70 6.90
2010 7.00 5.50 7.70 6.90
Source: ERGEG national reports, desktop research, regulators‟ information * detailed data not available
The following briefly summarizes the regulatory approaches to set the rate of return in
Italy, the Netherlands, UK and Norway. For a comprehensive theoretical discussion of
the role of the rate of return under regulation, please refer to Pedell (2006).
In Italy, the value of the WACC for the DNOs was set at 7.4% (real pre-tax) in the first
regulatory period (2000-2003). In the second period (2004-2007), the Italian regulator
reduced the WACC from 7.4% to 6.85%. For the current third regulatory period (2008-
2011), the basic real pre-tax WACC amounts to 7.0% for distribution services. Since the
start of incentive regulation, Italy has been using a real pre-tax WACC.
In the Netherlands, initially different methods applied to calculate the WACC. In the first
regulatory period (2000-2002) the WACC was calculated excluding corporate tax and
amounted to 5% in real terms being equivalent to a WACC of 6,6% post corporate tax.
For the following years, the corporate tax rate of 35% was applied to the WACC, using
a real pre-tax WACC, which was set at 6.6% for the second regulatory period (2003-
2006). In the third regulatory period (2007), the WACC amounted to 5,8%. In the current
fourth regulatory period (2008-2010) the WACC is set at 5,5%. Broadly speaking, the
approach used by the Dutch regulator is similar to the one in place for Italy as from the
second regulatory period.
As regards the calculation of the cost of capital in the UK, before 2005 OFGEM used a
pre-tax, real WACC in order to derive the remunerations for the regulated asset base.
6 Diskussionsbeitrag Nr. 353
During the third distribution price control review (2000-2005), OFGEM settled for a real
pre-tax WACC of 6.5%. For the following years, Ofgem has decided to use a post-tax
approach to the cost of capital as a means to capture the tax benefit associated with
gearing up. OFGEM‟s rationale for this switch was i) to reduce the incentives to in-
crease gearing and discourage excessive use of debt, ii) to reflect the change to the
Inland Revenue‟s treatment of network capital expenditure, which is expected to in-
crease effective tax rates for most companies; and iii) improve consistency with other
aspects of the regulatory framework, in which changes in the level of costs are passed
on to consumers at the subsequent price control review.5 The post-tax WACC amounts
to 4,8% in Ofgem‟s final proposal for the fourth price control period. Table 2 indicates
the equivalent real, pre-tax value amounting to 6,9% for comparison purposes.
The WACC in Norway is calculated as nominal pre-tax. From 1997 to 2001 the average
WACC amounted to 8,3%. From 2002 to 2006 the rate of return was determined annu-
ally by the average of daily observations of three years government bonds with a 2%
risk premium added, allowing a range between 2% and 20%. As yearly values are not
available, an average value of 11% is assumed6. For the regulatory period from 2007 to
2010 it is set at 7,7%.
5 Ofgem (2004). 6 For the 1997-2001 period, the rate of return was delimited between 2% and 15%, which would give an
average value of 8.5%. This is pretty close to the actual value of 8.3%. Therefore an average assump-tion is made for the 2002 to 2006 values within the ceilings of 2% and 20%. This gives a rate of return of 11%.
New regulatory approaches towards investments 7
2.3 Investment statistics
This sub-section describes the investment development in the reference countries. In-
formation on DSO investments in Germany is included for comparison purposes.
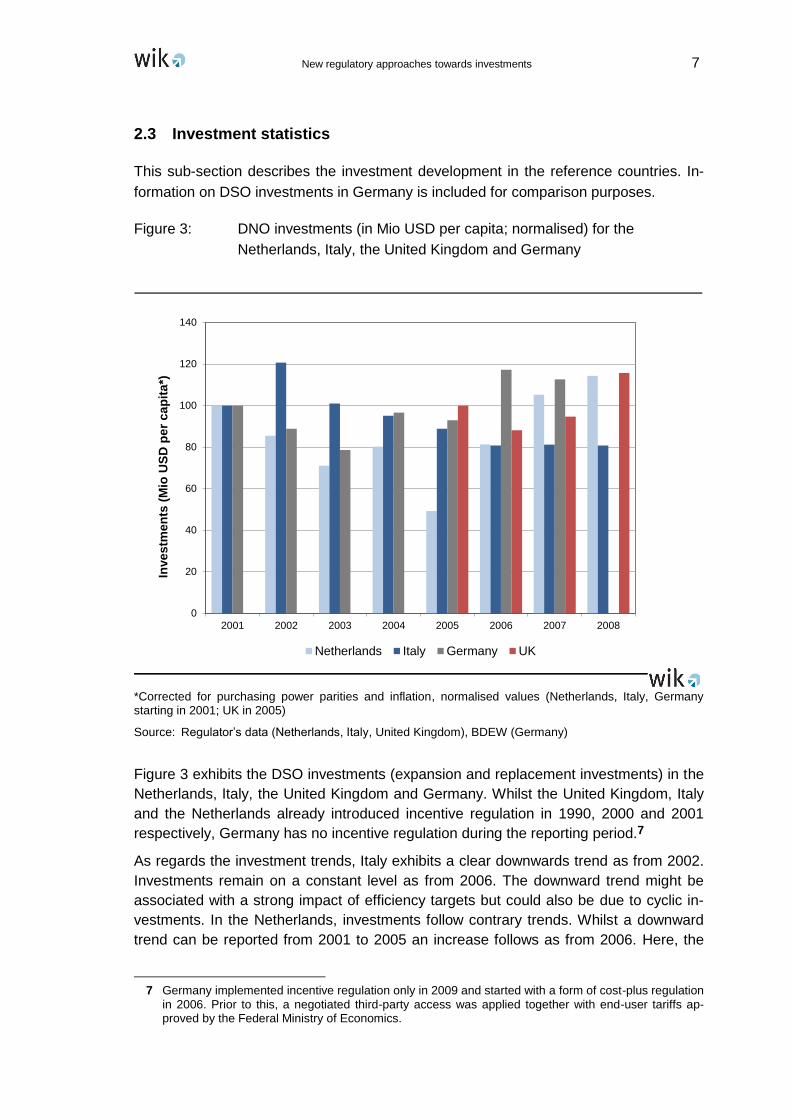
Figure 3: DNO investments (in Mio USD per capita; normalised) for the
Netherlands, Italy, the United Kingdom and Germany
*Corrected for purchasing power parities and inflation, normalised values (Netherlands, Italy, Germany starting in 2001; UK in 2005)
Source: Regulator‟s data (Netherlands, Italy, United Kingdom), BDEW (Germany)
Figure 3 exhibits the DSO investments (expansion and replacement investments) in the
Netherlands, Italy, the United Kingdom and Germany. Whilst the United Kingdom, Italy
and the Netherlands already introduced incentive regulation in 1990, 2000 and 2001
respectively, Germany has no incentive regulation during the reporting period.7
As regards the investment trends, Italy exhibits a clear downwards trend as from 2002.
Investments remain on a constant level as from 2006. The downward trend might be
associated with a strong impact of efficiency targets but could also be due to cyclic in-
vestments. In the Netherlands, investments follow contrary trends. Whilst a downward
trend can be reported from 2001 to 2005 an increase follows as from 2006. Here, the
7 Germany implemented incentive regulation only in 2009 and started with a form of cost-plus regulation
in 2006. Prior to this, a negotiated third-party access was applied together with end-user tariffs ap-proved by the Federal Ministry of Economics.
0
20
40
60
80
100
120
140
2001 2002 2003 2004 2005 2006 2007 2008
Inve
stm
en
ts (
Mio
US
D p
er
ca
pit
a*)
Netherlands Italy Germany UK
8 Diskussionsbeitrag Nr. 353
investment trends seem to suggest a cyclic nature of investment therefore. In the UK,
investments are increasing as from 2006. Unfortunately no data prior 2005 is available
as regulatory accounting rules changed at this date. In Germany, investments rather
decrease in the first phase of the current decade. Then the development shows an in-
crease as from 2006. This might be due to the cost review starting in 2006 prior to the
implementation of incentive regulation.
Figure 4: DNO investments (in Thousand USD per capita; normalised) for
Norway
*Corrected for purchasing power parities and inflation; normalised values starting in 1995
Source: Regulator‟s data
As Figure 4 shows, the DNO investment level in Norway remains stable from 1995 to
2005. However from 2006, investments have more than doubled. From this develop-
ment, one may conclude that the investment behaviour did not change with the intro-
duction of incentive and quality regulation in 1997 and 2001 respectively. The increase
in 2006 might be due to an ample reinvestment cycle.
Overall, investment trends are rather heterogeneous among the considered countries.
Whilst the investments are rather cyclic in the United Kingdom, the Netherlands and
Germany, a clear decreasing trend can be reported for Italy. In Norway, investments are
stable for a long time and then increase significantly. The impact of incentive regulation,
which is already implemented in all countries for the reporting period, can only be as-
0
50
100
150
200
250
1995 1996 1997 1998 1999 2000 2001 2002 2003 2004 2005 2006 2007
Inve
stm
en
ts (
Th
ou
sa
nd
US
D p
er
cap
ita
*)
Norway
New regulatory approaches towards investments 9
sumed. The most probable coherence is supposed for Italy. Norway, however, being
the only country for which longer time series are available, does not at all give an indi-
cation that investment behaviour changed with the implementation of incentive regula-
tion.
Comparing the investments trends to the quality level, opposite trends can be recorded
for Italy where the quality level increases (except for the peak in 2003) and investments
decrease. Intuitively one would rather assume simultaneous trends. In contrast, Norway
exhibits slight simultaneous developments: The quality level visibly increases over time
whilst investments also increase by the end of the observation period. However, any
rationales should be treated with care, as all countries exhibit different network histo-
ries, voltage levels defined as “distribution” and geographical and environmental situa-
tions. Moreover, strong interdependencies might exist between the presence of incen-
tive and/or quality regulation, the level of the WACC and investments.
Overall, no clear influences or causalities can be identified. Therefore the impact of the
regulatory indicators and other relevant parameters on investments will be estimated in
a separate paper relying on a more extensive data set. This will include information on
countries without incentives regulation over time in order to enable a counterfactual
argumentation. The estimations are however still dependent on data availability.
In the following the paper presents international approaches with increased regulatory
measures towards investments. It features four case studies, namely the UK, Italy,
Norway, and the Netherlands.
10 Diskussionsbeitrag Nr. 353
3 New regulatory approaches towards investments (international
experiences)
Sustainability and decarbonisation targets play a central role in worldwide, European
and national energy policy. The long-term target to become carbon neutral by 2050 and
the medium-term targets of the European Union imposed by the 20-20-20 agenda (Lis-
bon Treaty) stipulate: i) a reduction of CO2-emissions by 20%, ii) an increase of energy
efficiency by 20%, and iii) 20% of energy needs met from renewable energy sources
(RES) by 2020.
These binding long-term requirements will considerably affect the energy sector and
change its structure substantially. As a matter of fact, the electricity distribution sector
plays a key role in integrating intermittent, decentralized low carbon technologies, ena-
bling new forms of demand-side-management and managing electric vehicles. This
requires networks to respond to intermittent generation schedules, enable bi-directional
energy flows and new forms of communication and network control. The key technology
will be an ICT-based infrastructure, namely smart grids. Their development, however,
will require an ample amount of investments and innovation in distribution networks.
Being a natural monopolist, network operators invest in a regulatory environment. This
may, however, not provide the right incentives anymore to enable the paradigm shift
towards smart grids. Thus, the discussion of a realignment of the regulatory framework
including reconfigured incentives that take into account the overarching sustainable
policy objectives is one of the key debates at stake.8
In order to enrich the debate, the paper reviews international experiences to see what
kind of approaches are taken to customize the regulatory framework to better stimulate
investments and asset innovation. It refers to four pertinent examples, namely the Unit-
ed Kingdom, Norway, Italy, and the Netherlands. These countries currently revise or
plan to revise their regulatory approach towards investments and innovation in different
shapes.
For a better outline of the country studies, the paper firstly presents some key facts and
figures regarding the sector structure of the respective country. Secondly the attention
is drawn to the regulatory regime and current or planned amendments with a particular
impact on smart grid implications, investments and innovation. For the country review,
the following central questions are formulated:
What are the international approaches to better stimulate investments and asset-
innovation (dynamic efficiency)?
Is regulation considered as the right place to stimulate investments and asset inno-
vation?
How do regulators see the role of the network operator?
These questions are condensed in the interim conclusions in sub-section 3.5.
8 Müller et al. (2010).
New regulatory approaches towards investments 11
3.1 United Kingdom
Sector Structure
The UK electricity industry consists of three markets – England and Wales, Scotland
and Northern Ireland. The first two are fully open to competition, while in Northern Ire-
land the market has been opened to non-household customers only. The following par-
agraphs provide an overview of the electricity supply sector in Great Britain (England
and Wales and Scotland).9
The total installed capacity in the UK system amounted to 83.6 GW by the start of
2009/10. As regards the competition profile of the electricity generation market in 2008,
eight companies had market shares exceeding five per cent and, of these, the largest
three companies held 43% of transmission entry capacity. Furthermore, six out of the
eight are part of vertically integrated corporate groups which are active in both genera-
tion and supply. According to capacity owned by different companies in the UK in 2008,
EDF has the largest Herfindahl-Hirschman Index (HHI)10 amounting to 339. EDF ac-
quired British Energy in late 2008 and now owns and operates a number of nuclear
plants in GB. Overall, Great Britain has the lowest generation sector concentration in
the EU.11
In March 2001, the means of trading electricity changed with the introduction of the New
Electricity Trading Arrangements (NETA) in England and Wales, which replaced the
Electricity Pool of England and Wales. The former arrangements were based on bi-
lateral trading between generators, suppliers, traders and customers in the Over The
Counter (OTC) market. The NETA were introduced to deliver more competitive, market-
based trading.
Since 2005, National Grid Plc has taken responsibility for the system operation of the
two Scottish transmission networks in addition to the transmission networks in England
and Wales. The ownership of the network however remains with the vertically integrated
Scottish entities. While the British TSO is ownership unbundled, the distribution network
operators (DNOs) in UK are all legally unbundled as of 2009. These DNOs were estab-
lished as part of the privatisation process in 1990 and were the incumbent providers of
distribution network services in each geographic area for several years. However, the
Utilities Act 2000 changed the legislative and regulatory framework to enable each DNO
to own and operate network assets in any area of Great Britain. These changes have
also facilitated the entry of new DNOs that build, own and operate networks connected
within existing distribution systems. As a result, there exist an additional four much
9 In the following, please refer to Ofgem (2009). 10 Per definition, a HHI under 1,000 index points indicates no market concentration, a HHI between
1,200 and 1,800 indicates that a market is „moderately concentrated‟ and a HHI above 1,800 suggests a high concentration.
11 European Commission (2007a).
12 Diskussionsbeitrag Nr. 353
smaller independent distribution network operators (IDNOs). Thus, there are 18 li-
censed electricity distributors in total.
On the retail side, there are six main suppliers active in the household market with addi-
tional companies active in the large user sector.12 The six large suppliers evolved from
the fifteen former incumbent electricity and gas suppliers over the 1998-2003 period.
These are: E.ON UK (formerly Powergen), RWE npower (owned by RWE AG), EDF
Energy (owned by Electricité de France), Scottish and Southern Energy (SSE), Scottish
Power (owned by Iberdrola) and British Gas (owned by Centrica). At the end of 2008,
there were also five active domestic and eleven non-domestic electricity suppliers that
are not former incumbents. The six large supplier groups in the domestic market are
vertically integrated, i.e. they are part of a corporate group that is active in both the
wholesale and retail markets. Between them, the six supplier groups account for 54% of
generation capacity (excluding contractual arrangements between generators and sup-
pliers). In addition to the six large supplier groups, other non-domestic suppliers are
also vertically integrated (such as British Energy). About 70% of generation output is
accounted for by vertically-integrated suppliers in the non-domestic markets.13
Regulatory Approach: the current regime
The UK can be characterized as a pioneer in the regulation of energy markets. The pro-
cess of liberalisation and privatisation of the British utilities started in 1983. The famous
RPI-X regulation was implemented in 1990 and shows a transparent history in the con-
tinuous enhancement of the regulatory approach. Therefore, the British approach
serves as a pertinent example due to the long experience and pioneering features in
their regulatory approach and provides useful lessons for the revision of regulatory re-
gimes.
An independent regulator, the Office of Energy Regulation (Offer) was established in
1990. In 1999, Offer merged with the Office of Gas Regulation (Ofgas) to form the Of-
fice of Gas and Electricity Markets (Ofgem). The first regulatory period (price control
review) started in 1990/1991 with the objective to promote efficiency and hence lower
tariffs of distribution companies. Albeit lacking effectiveness at the beginning, the se-
cond and third price control reviews (1995-2000 and 2000-2005 respectively) signifi-
cantly reduced distribution charges. Studies show empirical evidence that distribution
companies succeeded in achieving significant efficiency improvements and delivering
gains to customers.14
The incentive regulation model of distribution networks in Britain features a hybrid ap-
proach since 1990. Under the current arrangements, the operating expenditures
(OPEX), capital expenditures (CAPEX), and quality of service (including network energy
losses) are incentivised separately within the so called „building blocks„ approach. In
12 Ofgem (2009). 13 Ibid. 14 Jamasb and Pollitt (2007).
New regulatory approaches towards investments 13
this, these different cost components receive diverse regulatory treatment. This will be
explained in the following.
As regards the first building block, the controllable OPEX are incentivised by bench-
marking these against an efficient frontier made up of the best practice DNOs in the
sector. Subsequently the allowed OPEX of individual DNOs are set such that network
operators are required to close a specific proportion of their performance gap relative to
the frontier during the price control period (x-factor). In addition, all DNOs are subject to
a general technical efficiency improvement target that is common to all DNOs (general
x-factor).
Secondly, CAPEX are fixed in the so called regulatory asset base (RAB) individually for
each company. Companies earn an allowed rate of return on their assets based on a
weighted average cost of capital (WACC). In order to provide for a reasonable level of
CAPEX (old assets fall out of the RAB due to depreciation as new investments are add-
ed due to reinvestment cycles) Ofgem introduced the so-called „menu of sliding scales‟
to individually assess the required level of CAPEX as from the fourth price control re-
view (2005-2010). According to their investment strategy, network operators may
choose between a regulatory menu of a rather cost-based driven regulation of their
CAPEX or a rather incentive based approach.15
The derived allowed OPEX and CAPEX together form the basis of the utilities‟ allowed
revenues. DNOs are allowed to recover their capital (i.e. the WACC multiplied with the
regulatory asset base and depreciation) and operating expenditures. The utilities‟ actual
revenue should reach the efficient level of allowed revenue by the end of the price con-
trol period. The x-factor constitutes the path to improve efficiency.
Quality of service is incentivised separately pertaining to different quality dimensions.
Broadly speaking, these include i) interruptions (continuity of supply), ii) guaranteed
standards of performance, and iii) quality of telephone service. The first dimension is
linked to individual performance targets. Deviation from these targets results in compa-
ny specific penalties and rewards, which affect the total allowed revenue. The last two
dimensions involve compensation payments in case companies deviate from pre-
defined standards.
Eventually, the regulatory framework provides incentives to reduce network losses
based on a yardstick loss figure. The company receives a penalty or reward when it
exceeds or decreases below the yardstick respectively.16
Due to the elaborated but also very complex incentive structure in the British regulatory
regime, the network operator is likely to face trade-offs between the different incentives
for the different cost-components. Ambiguous incentives may for example occur be-
15 Please refer to Müller et al. (2010) chapter 2.4.1 for a detailed description and evaluation of the
menue-of-sliding-scales approach. 16 Jamasb and Pollitt (2007).
14 Diskussionsbeitrag Nr. 353
tween the network operator‟s preference not to invest in a low loss transformer in favour
of limiting capital expenditures by investing in a conventional transformer. Moreover
companies may be tempted to capitalize operational expenditures to promote efficiency
gains in the OPEX benchmarking.17
Dipping more thoroughly into Ofgem‟s approach towards investments it becomes visible
that the option for the fragmented regulatory approach allows for a flexible regulatory
treatment of capital expenditures. This is first of all due to the fact that Ofgem opted for
a pure OPEX benchmarking. This approach eliminates the economic pressure to also
keep CAPEX low that regulatees face when a total cost-based (TOTEX) benchmarking
approach applies. In other words, the TOTEX approach implies that efficiency targets
will be derived from both operational and capital expenditures. This may hamper the
network operator in undertaking the necessary investments in favour of reducing its cost
of capital to realise higher efficiency gains. A pure OPEX benchmarking however stimu-
lates short term-efficiency only with regard to operational expenditures and leaves regu-
latory flexibility to deal with investments. Thus, Ofgem implemented a more flexible reg-
ulatory approach with the separated investment appraisal and the introduction of the
„menu-of-sliding-scales‟-regulation. Although different shortcomings should be noted
with regard to the menu approach, one essential positive feature consists i) in the provi-
sion for the network operator‟s individual investment cycle (high vs low investment
needs), ii) regulatory room for corporate optimisation between OPEX and CAPEX and
iii) the possibility to receive a bonus when outperforming regulatory targets.
In addition to this, Ofgem‟s approach allowed an ample increase in the allowance for
investments for network modernisation within the fourth regulatory period. This allow-
ance boost has resulted in a positive x-factor for the sector as a whole and can be in-
terpreted as a strong incentive to stimulate investments.18
Over and above a specific treatment of investment, Ofgem also implemented regulatory
provision for innovation. Basically this includes the introduction of an innovation funding
initiative (IFI) to recover research and development (R&D expenditures) via regulated
tariffs. Moreover, the instrument of so-called registered power zones (RPZ) involves the
option to create tariff space for demonstration projects aiming at the connection of dis-
tributed generation.19
Empirical evidence20 and Ofgem‟s21 overall appraisal suggest that RPI-X regulation
significantly reduced distribution charges and improved the network operators‟ efficien-
cy. However, critical reflection about the British regulatory approach with all its multifac-
eted features initiated a review of its „fit for purpose‟ given the upcoming challenges for
17 Ibid. 18 Jamasb and Pollitt (2007). 19 For an in-depth overview of the British regulatory approach towards these two instruments and the
current and upcoming regulatory treatment of R&D expenditures, please refer to Bauknecht (2010). 20 Jamasb and Pollitt (2007). 21 Ofgem (2010a).
New regulatory approaches towards investments 15
networks triggered by ambitious decarbonisation and sustainability targets22 and the
required paradigm shift of all energy related activities. Therefore Ofgem decided to re-
vise the regulatory framework accordingly.
Hence, the following sub-section deals with Ofgem‟s RPI-X@20 initiative, an in-depth
review of energy network regulation aimed at finding an optimal framework enabling
energy network companies to operate networks required for a sustainable low carbon
energy sector. The most pertinent features of the RPI-X@20 initiative will be highlighted
in the following sub-section. Special attention will be paid to the implications for invest-
ments.
Regulatory Approach: RPI-X@20 – the way forward
Followed by comprehensive debates and consultations on the merits and drawbacks of
past and future regulatory design features, Ofgem published its final decision document
for their revised regulatory approach in upcoming price controls for electricity and gas
transmission and distribution companies.23
The new regulatory framework is known as the RIIO model, abbreviated for Revenue
set to deliver strong Incentives, Innovation and Outputs. The underlying regulatory for-
mula can be synthesised as the following equation: Revenues = Incentives + Innovation
+ Outputs.
Overall, the RIIO model is based on the RPI-X framework. Whilst some existing fea-
tures were enhanced, others were retained or new dimensions were added. Two perti-
nent elements characterise the new framework: it is output driven and takes a long term
perspective to deliver “long term value for money” in order to promote smarter networks
for a low carbon future keeping in mind the 2030 and 2050 targets. Moreover this ap-
proach proactively provides for the long life-cycle of network assets, which may involve
30 to 40 years.24 The long term vision also includes the option for network operators to
decide themselves on an optimal allocation of OPEX and CAPEX and to minimise cost
in the long run depending on the nature of the investment.
The following highlights the key features of the RIIO model25:
Revenues and outputs
Revenues are set upfront during the price control review process based on a revised
“building blocks approach”. These are the revenues a network operator is allowed to
recover to efficiently deliver pre-defined outputs. These outputs will form the central
regulatory reference value. The outputs to be delivered are defined during the review
process. They are based on the following six categories:
22 The targets set by the British Government stipulate a 80% reduction in greenhouse gas emissions by
2050 and a decarbonised electricity generation by 2030. 23 Ofgem (2010a). 24 Ofgem (2010a). 25 In the following, please refer to Ofgem (2010b).
16 Diskussionsbeitrag Nr. 353
o Customer satisfaction
o Reliability and availability
o Safety
o Conditions for connection
o Environmental impact
o Social obligations
In each category, a set of so-called primary outputs is defined reflecting customer ex-
pectations with respect to the operational business of the network operator. An example
should illustrate the approach: Taking the output category „reliability and availability‟
„customer interruptions‟ and „customer minutes lost‟ could constitute primary outputs.
For the category „environmental impact‟ the „role in consumer energy efficiency‟ or the
„carbon footprint of networks including losses‟ would be further examples for primary
outputs. Output delivery is encouraged by incentives directly linked to primary outputs
and the allowed revenue in the price control. This is, at each price control review the
regulator determines a specific level of performance at which the network operator is
expected to operate. In return, the network operators specify in their business plans
what primary outputs they plan to deliver and what they expect to be the associated
cost. The regulator sets the allowed revenues accordingly to fund the outputs efficiently
assuming a long term value-for money perspective.
Holistic and time-limited innovation stimulus
As a matter of fact, long-term thinking takes a central role in setting the output catego-
ries. Therefore, the new regulatory framework includes a flexible instrument to proac-
tively provide for dynamic efficiency. This instrument was implemented to protect
against the risk that pure delivery of primary outputs might be inefficient for certain ac-
tivities and hence the required performance level in a certain category could not be
reached within the eight years horizon of the regulatory period. With the instrument of
„secondary deliverables‟ the framework provides the opportunity for network operators
to include expenses in their business plans aiming at innovative projects of which costs
would occur immediately but benefits would only occur within a longer time horizon.
These „secondary deliverables‟ could form milestones in project delivery. With regard to
the price control, this implies that network operators will merely be allowed to raise rev-
enues from consumers given the milestone is reached. On the one hand, this approach
has been chosen to provide certainty to network operators to engage in long-term in-
vestments and on the other that customers do not overpay and their money is only
raised when there is certainty that network operators will deliver benefits in the long run.
However, this instrument requires a deep level of involvement and scrutiny for both
network operators and Ofgem. Therefore, it will only be applied to ample investments
associated with a high level of uncertainty.
New regulatory approaches towards investments 17
In addition to this holistic approach the RIIO model includes a time-limited „Innovation
Stimulus Package‟ based on the Low Carbon Network (LCN) fund that is already ap-
plied in the current regulatory period. Broadly speaking this instrument provides the
opportunity that network companies or third parties may apply for a fund aimed at
demonstration projects. Moreover it explicitly encourages third parties to apply if they
can carry out a specific task more innovatively and efficiently than network operators.26
With these two instruments, the new regulatory framework comprises two ways to en-
courage innovative output delivery. First of all, as already suggested above, the price
control review process will facilitate the inclusion of technical and commercial innovation
related to capital expenditures with the option to define „secondary deliverables‟ as
milestones for innovation projects that span price control periods. Secondly, the explicit
and time-limited innovation stimulus will especially provide for the transitional period
adapting the energy sector to the decarbonisation and sustainability targets.
In order to provide consistency with the regulatory features described above further
enhancements have been made.
Extension of the regulatory period (price control review) to eight years
The extension of the regulatory period to eight years has been realized to provide net-
work operators with more flexibility to efficiently optimise their delivery of outputs in a
longer perspective and to reduce regulatory risks. This vision also involves drawing on
longer-term business plans. If necessary, the regulatory scheme includes the option of
a tightly-scoped mid-term review. This review will however not involve any new review
of capital cost or existing output incentives. This approach goes hand in hand with a
long-term regulatory commitment to the WACC and the network operators individual
risk situation.27
Business plan review as core instrument of the price control review process
In their business plans network operators demonstrate how they plan to deliver the de-
termined outputs. Within this appraisal, the onus is on the network operator to justify
that its plan to deliver output constitutes the best option to meet the RIIO targets. De-
pending on the quality of justification the regulator employs an assessment tool-kit to
evaluate the business plans. This tool-kit is associated with an increased level of regu-
latory scrutiny. If the companies provide a reasonable, well-argued justification in its
business plan the company will be fast-tracked through the price control review pro-
cess. If however the regulator has certain doubts he may choose to apply additional
regulatory instruments (comparison with performance in former regulatory periods,
26 For a detailed overview of the „innovation stimulus package‟ planned within the RIIO model, please
refer to Bauknecht (2010). 27 Ofgem (2010b).
18 Diskussionsbeitrag Nr. 353
TOTEX benchmarking techniques) evidencing the network operators efficiency situa-
tion.28
Keeping these new features in mind the paper now addresses the role of investments in
the RIIO model more thoroughly.
The British Government‟s sustainability targets to reduce carbon emissions by 80% by
2050 requires ample investments to adapt the network infrastructure both technological-
ly and capacity-wise to a newly structured energy sector.
This long term perspective is the reason why Ofgem‟s approach towards investments is
strongly based on a long term value for money perspective and a holistic treatment of
capital expenditures. This is reflected in a number of aspects involving flexibility from
both the regulator and the network operator.
First of all, the network operator is supposed to set out its investment strategy to meet
the long-term targets. This involves a well-justified strategy linking anticipated expendi-
tures to the delivery of primary outputs and if necessary to secondary deliverables de-
fined as milestones for a longer investment cycle. Moreover the network operator is
required to consider alternative options to deliver outputs making an optimal compro-
mise between OPEX and CAPEX deployment. This includes a thorough consideration
of all implications an investment might have over and above the eight years regulatory
period. As a matter of fact, with this approach the regulator requires a cultural change in
the company‟s operational business and rewards long-term, innovative thinking. The
network operator‟s response to this framework will be assessed by the regulatory toolkit
controlling efficient expenditures. If considered necessary, the regulator may scrutinize
specific expenditures by using benchmarking techniques to reveal efficient cost or if
feeling concerned about a particular investment project require a detailed bottom-up
justification of the project. The benchmarking approach will be based on a TOTEX
benchmarking to avoid an OPEX CAPEX bias. However benchmarking results will no
longer form the logical basis to determine the allowed revenues but will rather be con-
sidered as “one piece of evidence” as regards the network operator‟s cost structure.
Secondly, different refinements were made in regulatory financing arrangements. The
RIIO model transparently sets out the different principles of financeability in order to
provide a clear ex-ante framework for investors, companies and other involved parties.
Overall the RIIO model assumes a long-term view of financeability. Amongst others, this
implies that the companies‟ capitalisation policy is supported by a fixed percentage de-
termining the OPEX/CAPEX split of the respective company. This is, the company may
capitalize a certain amount during the price control period. The percentage is deter-
mined based on the submitted CAPEX presented in the business plan.
28 Ofgem (2010b).
New regulatory approaches towards investments 19
As regards the depreciation rate, the RIIO model will henceforth refer to the average
expected economic lifetime of the assets. Previously, the regulator reduced the lifetime
of the assets to an assumed regulatory lifetime that was significantly lower than the
physical one. This policy has been pursued in order to drive companies‟ perceived fi-
nanceability due to higher cash flows. Hence the regulator is aware that the new ap-
proach may slow down the expected return on investment and will consider if appropri-
ate a transition period with some flexibility as regards regulated revenues.
Within the future regulatory framework the rate of return is still based on a real weighted
average cost of capital (WACC) approach. 29
The sub-section above presented the main features of the current and future regulatory
framework in the United Kingdom and the special role of investments in this context. It
shows that the future regulatory framework puts investment in a long term context, de-
signs regulatory functionalities for overarching sustainability and decarbonisation tar-
gets and adjusts related regulatory instruments accordingly to facilitate a long-term val-
ue for money consideration. Moreover, the Achilles heel of regulation, namely the cru-
cial regulatory factors „regulatory commitment‟ and „regulatory uncertainty‟ respectively,
is proactively taken into account30. However the enhancements of RIIO mentioned
above simultaneously risk a rather “heavy handed” regulatory approach. The yet due
practical regulatory implementation of RIIO has to prove if the new functionalities actual-
ly deliver a dynamic efficient outcome. Notwithstanding these caveats Ofgem can be
considered as the pioneer in pursuing new regulatory design options.
3.2 Italy
Sector structure
The Italian Electricity sector is dominated by one major player, Enel, which is active in
the generation, distribution and retail market. To begin with, the key generation fig-
ures.31 In 2008, maximum net installed generation capacity amounted to 98,625 MW,
and the net available capacity (for at least 50% of the time) was equal to 83,813 MW.
Enel assumes a market share of 40.9% whilst only four other companies achieve a
market share of over 5%. The market concentration is rather high with a HHI of 1,921 in
terms of maximum net installed capacity and 2,242 regarding net available capacity. In
2004, a process of strong generation capacity expansion started and is still on-going.
Net capacity increased by 6.2% in 2008, which is reported as by far the strongest in-
crease in the last five years.32 As in previous years, capacity growth came mostly from
thermoelectric plants (more than 75%) followed by wind plants (17%) and, thirdly, pho-
tovoltaic plants (4.4%) whose overall power capacity is expected to overtake that of
geothermal plants in the course of 2009. As regards the perspective for net installed
29 Ofgem (2010b). 30 Müller et al (2010). 31 In the following, please refer to AEEG (2009). 32 AEEG (2009).
20 Diskussionsbeitrag Nr. 353
capacity, AEEG (2009) underlines that significant differences exist between Southern
and Northern Italy. Whilst the distribution of new thermoelectric capacity is almost equal
with 47% in the south and 43% in the north, wind power and photovoltaic capacity will
amount to 97% in the south and only to less than 1% in the north.
Electricity trading takes place on the regulated spot market managed by a market oper-
ator. The spot market is further divided into two submarkets, the day-ahead market, and
the adjustment market. In the dispatching services market the Italian TSO Terna pro-
cures the resources required for providing transmission and dispatching services and
for power system security.
Since 2005, power transmission and nationwide dispatch are operated by Terna. The
model adopted for the Italian electricity system corresponds to ownership unbundling.
As of 31 December 2008 29,99% of Terna‟s shares were owned by a public sharehold-
er, whilst Enel and an asset management company held 5.1% each of the capital. The
remaining 60% belong to public retail suppliers. Electricity distribution is undertaken by
Enel Distribuzione in over 95% of Italy‟s municipalities. More than 100 medium sized
and small companies undertake distribution in the remaining municipalities. In 2008,
there was a total of 131 distribution companies, managing more than 1,200,000 km
networks. Two thirds are low voltage lines and almost one third medium to high voltage
lines.
The Italian electricity market has been 100% open for end-users since 2007. In the re-
tail market, Terna also assumes a major role with a market share of 47.2%. Only two
other retail companies attain a market share over 5%.
Regulatory Approach
Italy reflects upon one decade of quality and incentive regulation both starting in 2000.
Tariff regulation is implemented through a price cap mechanism with efficiency goals for
transmission, distribution and metering services set by the Italian regulator Autorità per
l'energia elettrica e il gas (AEEG) over a four-year regulatory period. The electricity sec-
tor currently undergoes the third regulatory period (2008-11). The planned productivity
gains for this period amount to 2,3% for transmission, 1,9% for distribution and 5,0% for
metering.33 Nota bene that the before mentioned x-factor only applies to operating cost
as from the current regulatory period. In the previous ones, the x-factor was also ap-
plied to amortisation and depreciation (regulatory period 2004-2007) and additionally to
the return on investment (regulatory period 2000-2003).34
The AEEG updates tariffs on an annual basis. This update provides for two cost catego-
ries. Firstly taking into account the reduction in real terms regarding operating costs and
secondly a review of depreciation and return on invested capital, to adapt for new infra-
structure investments to improve security of supply, competition, and quality of ser-
33 AEEG (2009). 34 AEEG (2008).
New regulatory approaches towards investments 21
vice.35 As regards the investment update, companies annually report their investments
made in the year t-1, which will be allowed in the tariffs for the year t+1.36
Over and above this regulatory change to solely focus on OPEX efficiency as from this
regulatory period, the Italian regulator also revised the approach towards investments.
From now on, the regulator discriminates between different investment categories for
transmission and distribution investment respectively, which are associated - provided
they fall in a certain category - with an extra return on investment. On the TSO-Level
this new incentive system allows an extra return for i) investments dedicated at the de-
velopment of transmission capacity in order to reduce congestion between market
zones and intrazones and ii) investments in Net Transfer Capacity (NTC) on electricity
borders. The extra allowance amounts to 3 percentage points extra return on invested
capital for 12 years over the 6.9% base rate of return. On the DNO-level, this new regu-
latory instrument grants an extra return of 2 percentage points over the 7% base return
for crucial investments for the distribution system such as new HV/MV transformation
stations, replacement of existing transformers with low loss transformers as well as MV
active grid automation, protection and control systems.
In addition to these additional allowances for specific investments the AEEG also set off
the introduction of efficiency indicators for investments in order to measure the extra
benefit that individual investment bring to the system as from 2011. The objective of
these indicators (relevant for both TSO and DNO investment) is to define an order of
priority for infrastructure investments and objective criteria to grant an adequate rate of
return for expansion investment.37
Originally, quality regulation has been implemented in Italy in order to improve the con-
tinuity of supply level compared to other European countries and to bridge national dif-
ferences between North (higher quality level) and South (lower quality level). Overall,
quality levels steadily decreased in Italy as confirmed by the statistics (see Figure 1).
However exceptional events were responsible for increases in SAIDI values in 2003
and 2008.38 For the regulatory period 2008-11, the Italian regulator introduced a new
scheme of penalties and incentives providing for both the duration of power outages
(similar to the previous years) and, to the number of both long and short outages, so
that all outages lasting more than one second are now covered. Moreover, service qual-
ity regulation is applied.39
Smart meter roll-out is quite advanced in Italy having the largest smart meter base in
the world.40 This is mainly due to Enel‟s initiative that equipped 30 Million households
with smart meters between 2001 and 2005. A nationwide rollout should be realised by
35 Ibid. 36 Ibid. 37 Ibid. 38 AEEG (2009). 39 CEER (2008) and AEEG (2009). 40 Meeus et al. (2010).
22 Diskussionsbeitrag Nr. 353
the end of 2011. Smart meters are used to give feedback to consumers and to intro-
duce new business models and services based on the metering data. A recent Gov-
ernment decree enjoins distribution companies to install visual displays for its consum-
ers.
All smart metering activities fall under the network operators‟ responsibility. Related
tariffs are determined by the regulatory authority and include OPEX and CAPEX with a
smart metering specific WACC amounting to 7,2%. The Italian regulator adjusts meter-
ing tariffs on an annual basis and adjustments refer to OPEX only. They also have a
specific x-factor, which is 5% higher than the x-factors for distribution (1,9%) and trans-
mission (2,3%). Moreover, smart metering activities have a link to quality regulation.
The network operator receives a bonus of 15 € per customer when using smart meters
to record unplanned interruptions longer than three minutes. Getting this reward how-
ever requires that the network operator fulfils certain smart metering roll-out provisions.
More specifically, 85% instead of 65% low voltage withdrawal points have to be com-
missioned with smart meters by 30 June 2010.41
In parallel to its pioneering smart metering activities, the Italian regime includes instru-
ments to promote innovation. A first instrument has existed since 1999 consisting of a
general R&D component in the network tariff, which is paid by all consumers. The Ital-
ian regulator is responsible for determining this levy, which currently amounts to 0.03
c€/kWh. The objective of this levy is to fund R&D activities that have an impact on the
electricity system. 42 Over and above, the regulatory authority incentivises demonstra-
tion projects within a competitive procedure. Selected projects will be awarded with an
increased WACC of 2 percentage points for 12 years.43
Overall, the Italian approach can be considered as pragmatic. It provides clear incen-
tives and a clear mandate regarding the smart grid/smart metering activities. However,
the increased rate-of-return may involve demarcation problems specifying the appropri-
ate investment category.
3.3 Norway
Sector structure
The Norwegian electricity market has one of the longest experiences with market liber-
alization and introduction of competition in Europe (in principal, full market opening
started from 1st January 1991). The other Nordic markets followed soon and today,
Norway is part of an open and integrated electricity market in the Nordic region with a
common Nordic power exchange.
41 Wissner (2009). 42 More information here: http://www.ricercadisistema.it/ 43 Meeus et al. (2010).

New regulatory approaches towards investments 23
As regards the organization and ownership, a total of 409 companies held a licence to
operate in the Norwegian power sector as of 31st December 2009.44 Of these, a total of
162 companies were involved in grid operations, while 64 companies are integrated
companies engaged in generation, grid operation and supply to end-users. 42 compa-
nies were only involved in grid operations. In terms of ownership type, roughly 75% of
the licensees were organised as limited companies, five per cent as cooperatives, while
around 17% were organised as municipal, county or inter-municipal companies.
Both the Norwegian TSO Statnett SF – which owns about 90% of the national grid - as
well as Norway‟s largest electricity producer Statkraft SF are fully state owned, with
ownership interest held by two different ministerial portfolios.45 As regards the structure
of the power generation market, in 2007 there were six companies that had five per cent
or more of installed available capacity in the Norwegian market.46 The largest three
companies owned roughly 40% of installed available capacity. When adjusting for direct
and indirect financial ownership the figure increased to about 60%. Additionally, around
90% of the generation capacity was publicly owned in 2009, while private ownership
accounted for the remaining 10%.
The most pertinent key indicators for the size and mix of electricity generation are as
follows47: The Norwegian net generation was 142,4 TWh in 2008 and this figure de-
clined to 132.8 TWh in 2009, driven by dry weather conditions. In 2009, hydropower
accounted for 127.1 TWh (95.75), thermal power 4.7 TWh (3.55) and wind power 1
TWh (0.75). The annual hydroelectricity production for years with average inflow is es-
timated at 130.7 TWh and the installed capacity was 30,901 MW at the end of 2009.
Somewhat more than 80% of the installed capacity is available in the winter season.
The year 2009 saw 126 MW of capacity additions for hydro power and 2.3 MW of new
wind power generation capacity while no capacity expansion took place for thermal
generation.
The Norwegian wholesale market is integrated in the Nordic wholesale market through
price coupling on a common power exchange, Nord Pool Spot. Nord Pool Spot organis-
es the Nordic marketplace for trading electricity for physical delivery, and offers both
day-ahead and intra-day markets to participants from 20 countries.
Although Norway does not fall under EU requirements, the Norwegian TSO Statnett
was organized as a separate, ownership unbundled entity since the introduction of
competition in the Norwegian electricity market. The Norwegian Ministry of Petroleum
and Energy has full ownership of Statnett while the ownership interest of Statkraft SF
(generation) lies with the Ministry of Trade and Industry. As the ownership interest is
held by two different ministerial portfolios, organization of public ownership interest in
44 NVE (2009). 45 Herbert Smith (2010). 46 In the following, please refer to NVE (2009). 47 Ibid.
24 Diskussionsbeitrag Nr. 353
Statnett and Statkraft at the outset complies with EU ownership unbundling require-
ments.
At the distribution level, most of the grid is owned by county and municipal authorities.
By June 2009, there were 162 DNOs in Norway. Of these, there are only seven large
DNOs, i.e. with more than 100.000 customers. The rest of the country is covered by
smaller DNOs.48
As regards the provisions for customer switching, the fees for changing supplier were
totally removed in 1997 while a weekly change of supplier has been possible since
1998. Since 2005, provision was made for hourly metering of all customers with annual
consumption above 100,000kWh/year. Meanwhile, only five suppliers for the retail mar-
ket have a market share of 5% or more calculated by volume. Again three out of those
five companies supply 32% of the total volume delivered to households. On average
most end users are still customers of the incumbent supplier.49
Regulatory approach
The Norwegian regulatory regime consists of price-cap regulation with benchmarking
since 1997 and quality regulation since 2001. Norway‟s regulatory approach is often
considered as state-of-the-art when referring to international regulatory experience.
Moreover, Norway is the only country in the European context with a long history in rev-
enue-cap regulation. In general terms, this is the same approach according to which the
German regulatory design has been conceived. Therefore a closer look at their regula-
tory framework shall be taken.
Since 1997, the total revenue for each distribution firm was capped using a RPI-X for-
mula where the x-factor reflected both a common requirement for productivity improve-
ment for the sector as a whole and an individual x-factor reflecting the network opera-
tor‟s efficiency improvement target. Currently, Norway is in the fourth regulatory period
(from 2007 to 2011) and over the years investment incentives and quality regulation
have been gradually enhanced from period to period. With the new regulatory period,
the Norwegian regulator NVE introduced a number of changes in the revenue structure.
From 1 January 2007 NVE network operators are regulated with one annual revenue
cap based on a yardstick formula50 and an annual return on historical capital. The cost
base for the revenue cap for year t consists of the following components from the year t-
2: OPEX, depreciation, the cost of physical losses and the cost of energy not supplied
(CENS)51. According to this formula 40% of the companies‟ actual costs are recovered
whilst the remaining 60% follow from a cost norm derived from benchmarking. The un-
derlying method is a Data Envelopment Analysis (DEA) for regional transmission and
48 Ibid. 49 Ibid. 50 Please refer to Müller et al. (2010) for a detailed description of the yardstick approach. 51 For a detailed overview on the Norwegian approach towards quality regulation integrating the custom-
er‟s willingness-to-pay via the CENS approach, please refer to Growitsch et al. (2010).
New regulatory approaches towards investments 25
the DNOs performed separately. The norm cost for the TSO (Statnett) is based on an
international benchmarking analysis (Ecom+ Model).
Overall, the norm cost is calibrated such that an average efficient network operator
(DNO, regional transmission and TSO) has norms costs equal to its cost base. The al-
lowance for investment includes reinvestments and new investments and is based on
investments made in year t-2. Moreover a correction factor corrects for the investments
not included due to the two years time lag. The WACC is based on the annual average
of a five year government bond plus a risk premium.52 To our knowledge, no explicit
investment incentives are currently applied in Norway apart from introducing the correc-
tor factor to tackle the time shift problem
3.4 The Netherlands
Sector Structure
The four largest producers of electricity in the Netherlands are Electrabel, E.ON Bene-
lux, Essent and Nuon. Together they manage 65% of the installed production capacity
and also have about 80% of the retail market.53 According to the most recent EU
benchmarking report, the share of the three biggest companies by capacity was 69.9%
in 2008, an increase of 8.9 percentage points from 2007.54
Key figures for the wholesale markets in 2008 are as follows55: in 2008, total generation
capacity amounted to 23.8 GW while net generation volume was 107.658 TWh. Like-
wise, import capacity was 3.65 GW and net import volume was 15,850TWh.
Approximately 25 electricity producers were active in the Netherlands in 2008. In terms
of the size of generating companies, the Netherlands has seven large and 18 small
electricity producers.56 Three-quarters of the Dutch generating capacity belongs to four
electricity producers. The degree of concentration in the Dutch wholesale market as
measured using the HHI for 2008 was 1551 in terms of capacity and 1742 in terms of
generation. The Netherlands is a net importer of electricity. Additionally, because Dutch
generation capacity is largely gas fuelled in contrast to Germany and France where
baseload electricity is generated by coal and nuclear power respectively, electricity
prices in Netherlands are higher than the adjacent countries.
The Dutch wholesale market is composed of the trade in bilateral contracts, or the bilat-
eral market; the OTC (over-the-counter) market; the day-ahead market (spot market,
APX); and the balancing market, or the market for control and reserve power. As re-
gards the retail sector, a total of 21 nationwide suppliers were active in Netherlands in
52 NVE (2008). 53 European Commission (2007b). 54 European Commission (2010). 55 Energiekamer (2009). 56 The large coal- and gas-fired plants and the combined heat-power plants which provide the bulk of
production in the Netherlands are owned by a few large producers.
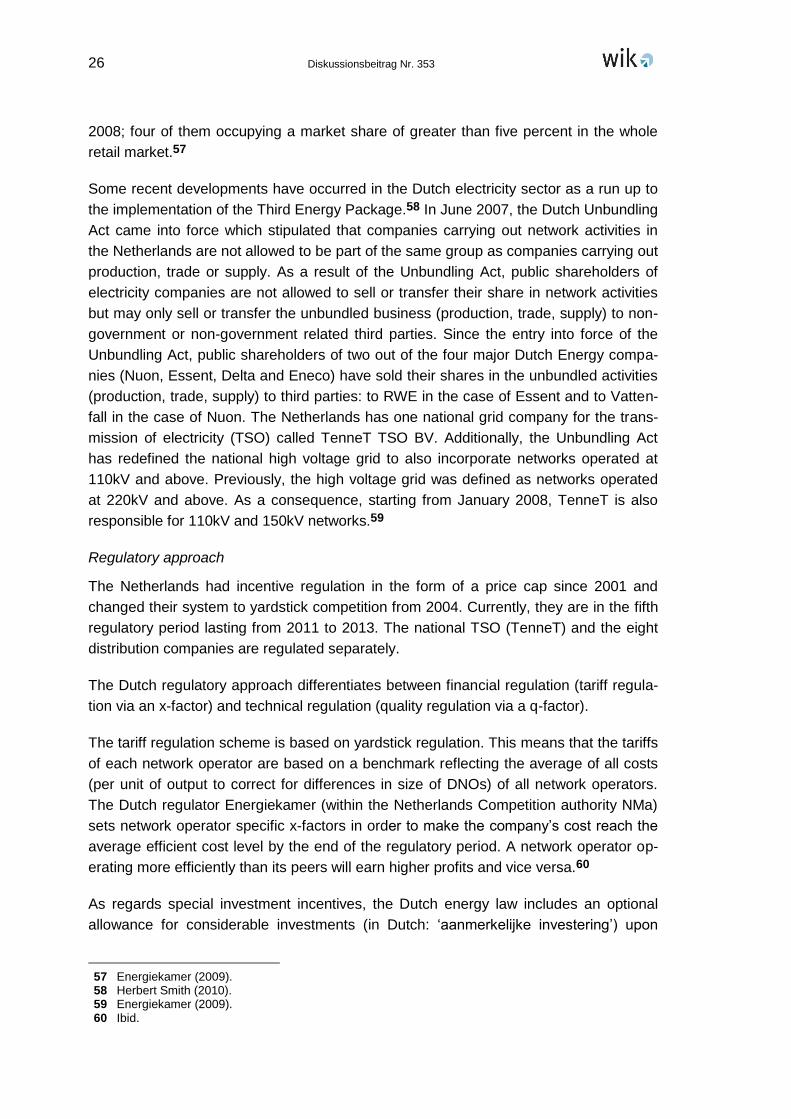
26 Diskussionsbeitrag Nr. 353
2008; four of them occupying a market share of greater than five percent in the whole
retail market.57
Some recent developments have occurred in the Dutch electricity sector as a run up to
the implementation of the Third Energy Package.58 In June 2007, the Dutch Unbundling
Act came into force which stipulated that companies carrying out network activities in
the Netherlands are not allowed to be part of the same group as companies carrying out
production, trade or supply. As a result of the Unbundling Act, public shareholders of
electricity companies are not allowed to sell or transfer their share in network activities
but may only sell or transfer the unbundled business (production, trade, supply) to non-
government or non-government related third parties. Since the entry into force of the
Unbundling Act, public shareholders of two out of the four major Dutch Energy compa-
nies (Nuon, Essent, Delta and Eneco) have sold their shares in the unbundled activities
(production, trade, supply) to third parties: to RWE in the case of Essent and to Vatten-
fall in the case of Nuon. The Netherlands has one national grid company for the trans-
mission of electricity (TSO) called TenneT TSO BV. Additionally, the Unbundling Act
has redefined the national high voltage grid to also incorporate networks operated at
110kV and above. Previously, the high voltage grid was defined as networks operated
at 220kV and above. As a consequence, starting from January 2008, TenneT is also
responsible for 110kV and 150kV networks.59
Regulatory approach
The Netherlands had incentive regulation in the form of a price cap since 2001 and
changed their system to yardstick competition from 2004. Currently, they are in the fifth
regulatory period lasting from 2011 to 2013. The national TSO (TenneT) and the eight
distribution companies are regulated separately.
The Dutch regulatory approach differentiates between financial regulation (tariff regula-
tion via an x-factor) and technical regulation (quality regulation via a q-factor).
The tariff regulation scheme is based on yardstick regulation. This means that the tariffs
of each network operator are based on a benchmark reflecting the average of all costs
(per unit of output to correct for differences in size of DNOs) of all network operators.
The Dutch regulator Energiekamer (within the Netherlands Competition authority NMa)
sets network operator specific x-factors in order to make the company‟s cost reach the
average efficient cost level by the end of the regulatory period. A network operator op-
erating more efficiently than its peers will earn higher profits and vice versa.60
As regards special investment incentives, the Dutch energy law includes an optional
allowance for considerable investments (in Dutch: „aanmerkelijke investering‟) upon
57 Energiekamer (2009). 58 Herbert Smith (2010). 59 Energiekamer (2009). 60 Ibid.
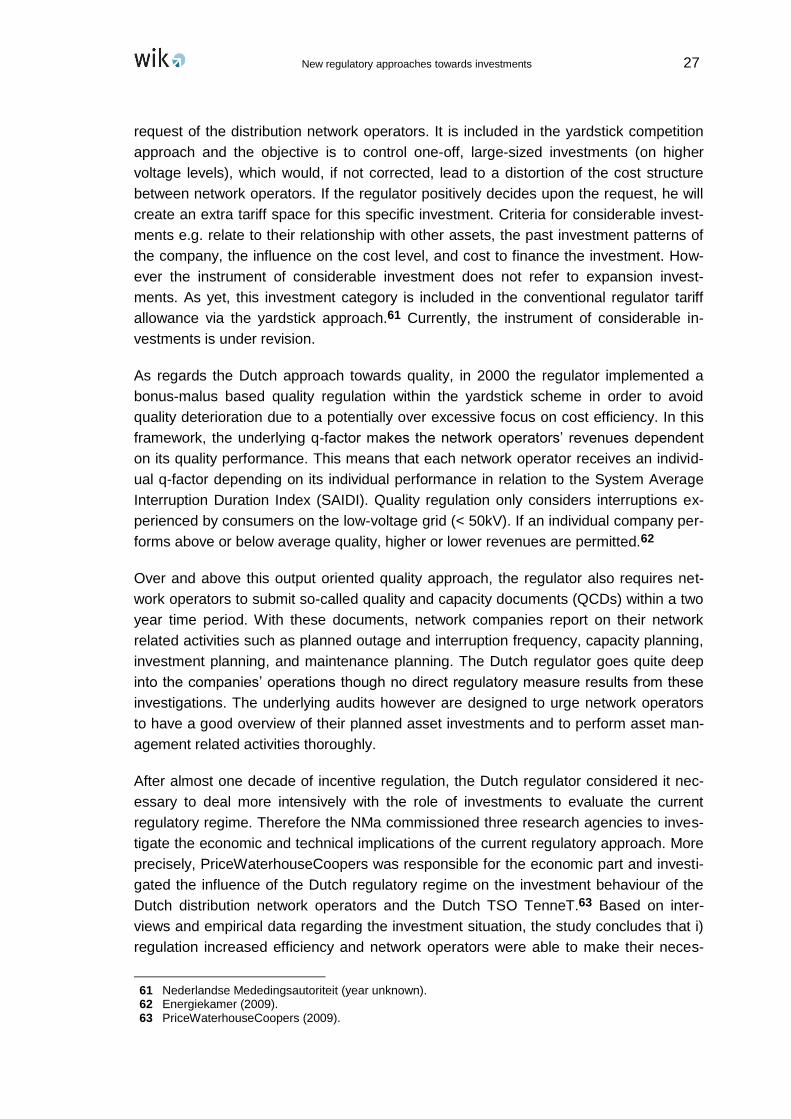
New regulatory approaches towards investments 27
request of the distribution network operators. It is included in the yardstick competition
approach and the objective is to control one-off, large-sized investments (on higher
voltage levels), which would, if not corrected, lead to a distortion of the cost structure
between network operators. If the regulator positively decides upon the request, he will
create an extra tariff space for this specific investment. Criteria for considerable invest-
ments e.g. relate to their relationship with other assets, the past investment patterns of
the company, the influence on the cost level, and cost to finance the investment. How-
ever the instrument of considerable investment does not refer to expansion invest-
ments. As yet, this investment category is included in the conventional regulator tariff
allowance via the yardstick approach.61 Currently, the instrument of considerable in-
vestments is under revision.
As regards the Dutch approach towards quality, in 2000 the regulator implemented a
bonus-malus based quality regulation within the yardstick scheme in order to avoid
quality deterioration due to a potentially over excessive focus on cost efficiency. In this
framework, the underlying q-factor makes the network operators‟ revenues dependent
on its quality performance. This means that each network operator receives an individ-
ual q-factor depending on its individual performance in relation to the System Average
Interruption Duration Index (SAIDI). Quality regulation only considers interruptions ex-
perienced by consumers on the low-voltage grid (< 50kV). If an individual company per-
forms above or below average quality, higher or lower revenues are permitted.62
Over and above this output oriented quality approach, the regulator also requires net-
work operators to submit so-called quality and capacity documents (QCDs) within a two
year time period. With these documents, network companies report on their network
related activities such as planned outage and interruption frequency, capacity planning,
investment planning, and maintenance planning. The Dutch regulator goes quite deep
into the companies‟ operations though no direct regulatory measure results from these
investigations. The underlying audits however are designed to urge network operators
to have a good overview of their planned asset investments and to perform asset man-
agement related activities thoroughly.
After almost one decade of incentive regulation, the Dutch regulator considered it nec-
essary to deal more intensively with the role of investments to evaluate the current
regulatory regime. Therefore the NMa commissioned three research agencies to inves-
tigate the economic and technical implications of the current regulatory approach. More
precisely, PriceWaterhouseCoopers was responsible for the economic part and investi-
gated the influence of the Dutch regulatory regime on the investment behaviour of the
Dutch distribution network operators and the Dutch TSO TenneT.63 Based on inter-
views and empirical data regarding the investment situation, the study concludes that i)
regulation increased efficiency and network operators were able to make their neces-
61 Nederlandse Mededingsautoriteit (year unknown). 62 Energiekamer (2009). 63 PriceWaterhouseCoopers (2009).
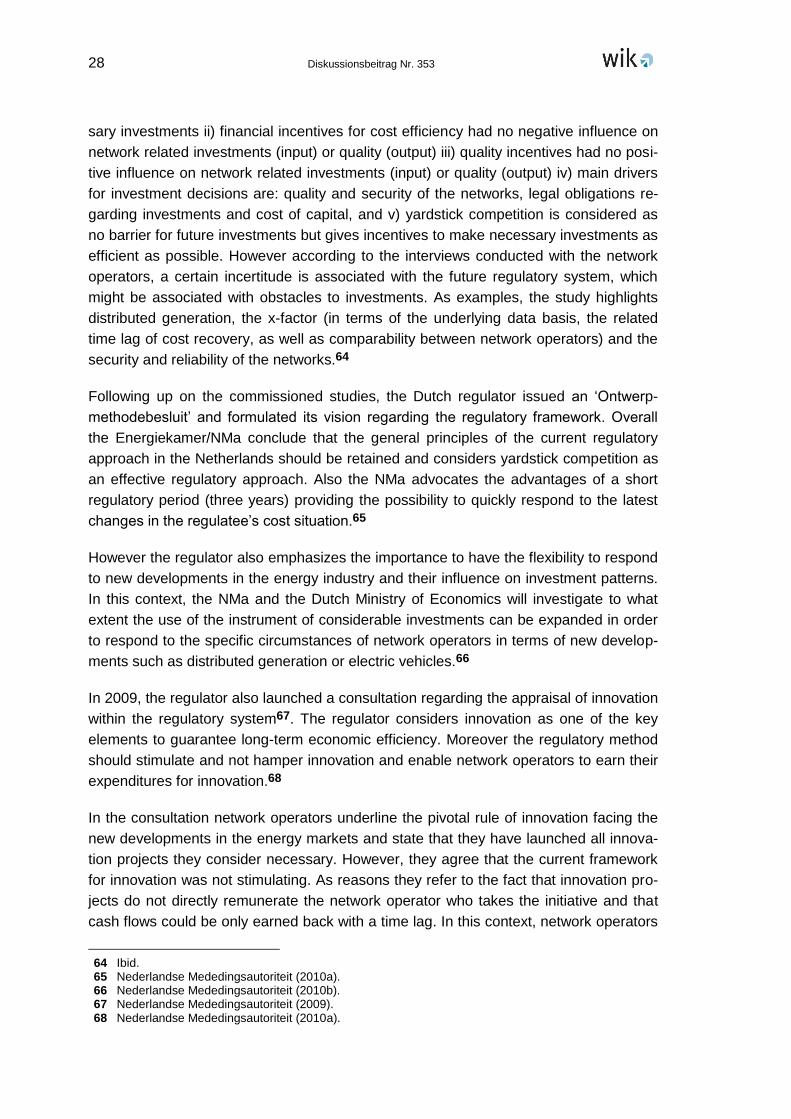
28 Diskussionsbeitrag Nr. 353
sary investments ii) financial incentives for cost efficiency had no negative influence on
network related investments (input) or quality (output) iii) quality incentives had no posi-
tive influence on network related investments (input) or quality (output) iv) main drivers
for investment decisions are: quality and security of the networks, legal obligations re-
garding investments and cost of capital, and v) yardstick competition is considered as
no barrier for future investments but gives incentives to make necessary investments as
efficient as possible. However according to the interviews conducted with the network
operators, a certain incertitude is associated with the future regulatory system, which
might be associated with obstacles to investments. As examples, the study highlights
distributed generation, the x-factor (in terms of the underlying data basis, the related
time lag of cost recovery, as well as comparability between network operators) and the
security and reliability of the networks.64
Following up on the commissioned studies, the Dutch regulator issued an „Ontwerp-
methodebesluit‟ and formulated its vision regarding the regulatory framework. Overall
the Energiekamer/NMa conclude that the general principles of the current regulatory
approach in the Netherlands should be retained and considers yardstick competition as
an effective regulatory approach. Also the NMa advocates the advantages of a short
regulatory period (three years) providing the possibility to quickly respond to the latest
changes in the regulatee‟s cost situation.65
However the regulator also emphasizes the importance to have the flexibility to respond
to new developments in the energy industry and their influence on investment patterns.
In this context, the NMa and the Dutch Ministry of Economics will investigate to what
extent the use of the instrument of considerable investments can be expanded in order
to respond to the specific circumstances of network operators in terms of new develop-
ments such as distributed generation or electric vehicles.66
In 2009, the regulator also launched a consultation regarding the appraisal of innovation
within the regulatory system67. The regulator considers innovation as one of the key
elements to guarantee long-term economic efficiency. Moreover the regulatory method
should stimulate and not hamper innovation and enable network operators to earn their
expenditures for innovation.68
In the consultation network operators underline the pivotal rule of innovation facing the
new developments in the energy markets and state that they have launched all innova-
tion projects they consider necessary. However, they agree that the current framework
for innovation was not stimulating. As reasons they refer to the fact that innovation pro-
jects do not directly remunerate the network operator who takes the initiative and that
cash flows could be only earned back with a time lag. In this context, network operators
64 Ibid. 65 Nederlandse Mededingsautoriteit (2010a). 66 Nederlandse Mededingsautoriteit (2010b). 67 Nederlandse Mededingsautoriteit (2009). 68 Nederlandse Mededingsautoriteit (2010a).
New regulatory approaches towards investments 29
argue for direct innovation incentives in the form of higher allowances directly related to
innovation. They also consider it helpful to correct for the time-lag with cost recovery.
Other parties (consumer organisations) state that no explicit innovation incentives were
necessary as the current regulatory framework would comprehensively control for effi-
ciency being due to innovative operations. Moreover representatives argue that neces-
sary innovation might also be facilitated by other parties than network operators and
that direct incentives for these parties would disadvantage other market participants.69
The NMa concludes from the consultation that the current regulatory framework in-
cludes sufficient incentives to stimulate network operators to innovate and does not
foresee regulatory changes to create extra tariff space for innovation. Moreover extra
tariff space would not guarantee that network operators would use this extra grant for
innovation. Moreover the regulator currently investigates to what extent the instrument
of „considerable investments‟ might be customized to the upcoming challenge of decen-
tralised generation and changes in legislation. The NMa will also investigate the role of
innovation in this context and to what extent amendments to this instrument might cor-
rect for the critical time lag.70
In parallel to the regulator‟s activities, the Dutch Ministry of Economics installed a task-
force for smart grids (in Dutch: „Taskforce Intelligente Netten‟). The objective of this
task-force is to discuss potential amendments of the regulatory framework due to the
upcoming challenge of smart grids.
Whilst the regulator does not see any crucial shortcomings in the regulatory incentive
structure to stimulate investments, the taskforce smart grids emphasizes different re-
straints as regards the development of smart grids.71 In this context, the taskforce es-
pecially highlights the issue that the current regulatory tariff structure does not provide
for intelligent network expenses and therefore does not include adequate incentives for
innovation. Moreover, the taskforce states the importance of encouraging R&D activities
and practical demonstration projects. The network operator is considered as a central
actor in the field of smart grids, though strongly regulated. Therefore innovation should
play an adequate role in the regulatory framework.
In more detail, the related discussion document sets out the taskforce‟s vision of how to
stimulate innovation in a regulated environment. First of all, network operators should
get more room to invest in smart grids supporting infrastructure on a local and regional
level. They should decide themselves upon their role as an enabler or platform opera-
tor72. Secondly network operators should receive the mandate to invest in the support-
ing infrastructure. A politically determined national infrastructure plan should serve as a
basis for investment.
69 Ibid. 70 Ibid. 71 Ministerie van Economische Zaken (2010). 72 A more detailed public presentation of the Dutch approach is expected soon.

30 Diskussionsbeitrag Nr. 353
Related cost should be socialised. For these two central arguments, the task force dif-
ferentiates by three different types of innovation as highlighted in the table below:
Table 3: Differentiation between different innovation categories
N° Type Example Potential regulatory approach
1 Innovations that are related to the central task of a network operator such as renewal and upgrade of the operating material
Investment in ICT to avoid disturbances or for the pur-pose of congestion manage-
ment
This type of innovation belongs to the regular running costs and shall be recovered by the regulated tariffs
2 Innovations for which the network operator incurs cost whilst the benefit occurs elsewhere. This refers to a shared responsibility between network operators, the public and other stakeholders
Support of projects (micro-CHP and other distributed generation, sustainable neighbourhoods)
The connection of genera-tion units (windparks, bio-gascollection, international gas transport connections, Supergrid), which are trig-gered due to sustainable and decarbonsiation tar-gets.
The Ministry carries out a political-ly driven cost-benefit analysis for the required type of investments. Followed by a chamber debate over the vision and the cost-benefit-analysis the political con-sequences are clear and hence a corporate mandate can be given to the network operators.
The network operators prepare their QCDs in accordance with this mandate. These documents form the national infrastructure plan.
Based on the cost-benefit-analysis the minister decides upon the sub-mitted infrastructure plan. If eco-nomically desired developments are insufficiently supported the minister may issue a directive for it. In this the underlying cost will be incorporated in the network operators‟ tariffs. Afterwards, the NMA controls whether the invest-ments have been made efficiently.
3 Innovation that might give a fundamental change to to-day‟s role allocation and insti-tutional design in the market. These changes cannot be integrated in the current sys-tem but need to be estab-lished in parallel to the exist-ing system. In this the system does not only experience technological changes but also changes of the roles of the different market parties, their interactions and market rules.
Large-sized bi-directional energy distribution sys-tems
New forms of balancing, metering and billing
Energy flows from the net-work operator to a market maker
New forms of participation of users and prosumers
New roles, responsibilities, duties and rights
Provide room for experiments. Network operators must be able to participate in demonstration pro-jects, which are free of and re-pressive legal, fiscal or ad-ministrative rules. However the taskforce emphasizes in this con-text that the construction of a network that is able to facilitate heat pumps, electrical cars, micro-chip or photovoltaic has to happen in the normal operational man-agement.
Source: Ministerie van Economische Zaken (2010), own depiction
Overall this country example shows that the Dutch regulator as well as the Dutch Minis-
try of Economics developed an increased awareness of investment treatment after one
decade of incentive regulation. However the studies, consultations and discussions also
indicate that the opinion about the regulatory role of investments and innovation is quite
New regulatory approaches towards investments 31
heterogeneous and still requires substantial discussions before specific regulatory in-
vestment incentives will be implemented.
3.5 Interim conclusions
This section has provided a comprehensive insight into the international approaches
that the countries of reference take to customize their regulatory framework regarding
increased regulatory measures towards investments and dynamic efficiency within a
smart grids context.
The following central questions have been formulated at the outset.
What are the international approaches to better stimulate investments and as-
set-innovation (dynamic efficiency)?
Is regulation considered as the right place to stimulate investments and asset
innovation?
How do regulators see the role of the network operator?
Taking these into account, the following conclusions from the case studies can be
drawn:
The most intense adaption of the regulatory regime takes place in the United Kingdom.
Here, the regulatory framework undergoes a deep revision, proactively adapting the
regulatory parameters to an output oriented, forward looking, long-term value for money
perspective in order to stimulate dynamic efficient investments and hence innovation.
All this happens in order to facilitate an adaption of the networks to the overarching de-
carbonisation and sustainability targets. Hence the RIIO model in the UK suggests that,
theoretically, a regulatory stimulation of dynamic efficient investments and a transfor-
mation of climate targets into regulatory functionalities is possible. The practical imple-
mentation however is yet to be proven. One essential learning nevertheless is already
the new regulatory awareness to undertake a long-term perspective with respect to reg-
ulatory incentives instead of focussing solely on short-term efficiency targets. More pre-
cisely, the output based approach in the UK including criteria such as environmental
impact or social obligations indicate a new regulatory vision of the network operator‟s
role. This is, over and above cost efficiency (OPEX and CAPEX) new regulatory criteria
are at stake. These criteria mirror the policy targets in terms of sustainability and decar-
bonisation. The future will show to what extent the RIIO model proves to be the right
approach to encourage a paradigm shift from short term efficiency incentives to a holis-
tic, long-term value for money strategy.
Moreover, Ofgem‟s role in the UK electricity markets goes beyond a pure network focus
but its influence also pertains to the entire industry to encourage environmental im-
provement. This leaves room to inspire third parties to efficiently take over parts of the
network operators‟ duties and hence constitutes a competitive element to stimulate in-
32 Diskussionsbeitrag Nr. 353
novation. Thus, one can conclude that in the UK the regulatory framework is considered
as the right place to stimulate investments and asset innovation but also has the flexibil-
ity to yield this task to third parties. This implies that the network operator is not as-
signed the central role in facilitating smart grids but other market participants are also
encouraged to take the initiative, which creates a competitive environment.
Another essential feature of the UK case is the low number of regulated entities. The
fact that there are less than 20 distribution network operators keeps a lot of room for
regulatory flexibility and makes it possible in the first place to allow for very individual
regulatory instruments such as the „secondary deliverables‟. The in-depth scrutiny of
business plans, however, turns the regulatory approach out to be heavy-handed. Espe-
cially a larger number of regulated entities might not be fit for purpose for such con-
cepts.
The other analysed countries do not undergo a substantial regulatory paradigm shift but
also increase their regulatory measures towards investments. Italy took a pragmatic
approach and increased the rate of return for special investments, e.g. related to smart
grids activities. However, this might involve demarcation problems. To illustrate this, let
us suppose an investment is to be made in intelligent substations. For such an invest-
ment the regulatory demarcation between conventional replacement investments and
e.g. investments in intelligent network control, which do not fall in the first category,
might blur. Identifying clear regulatory boundaries is a crucial task, therefore. Moreover,
the AEEG plans to implement regulatory incentives for efficient expansion investments
as from 2011, and demonstration projects are encouraged in a competitive way. In con-
trast to the UK, however, the network operator is assigned the central role in the devel-
opment of smart grids and smart metering. In the Netherlands, the discussion as to
what extent the regulatory framework will be adapted regarding investments and asset
innovation is still under extensive discussion. Here one can also state an increasing
regulatory awareness towards the adaption of the networks to enable smart grids solu-
tions. This also implies an on-going discussion as to which role the network operator
plays in this context. Eventually, Norway does not seem to take explicit measures to
incentivise smart grids investment/innovation but provides for an extra allowance in the
regulatory framework to correct for the two year time lag in the regulatory consideration
of investments. In this, investment related shortcomings are corrected in the regulatory
design. The time-lag is also considered as an issue in the Netherlands.
New regulatory approaches towards investments 33
4 Conclusions
The objective of this paper was to present international experiences of countries pio-
neering increased regulatory measures towards (dynamic efficient) investments.
To begin with, country specific facts and figures were presented in order to empirically
underline the most relevant regulatory parameters and the investment situation. As a
matter of fact, however, no causalities can be identified. Therefore potential relation-
ships will be elicited in an empirical paper once the required data is available.
Subsequently, the paper discussed four case studies where regulators revise their regu-
latory framework towards a more sensitive approach to stimulate investments and dy-
namic efficiency. The case studies show that the analysed countries take more or less
intense measures to increase the regulatory provision for investments and dynamic
efficiency. The UK can be considered as pioneer in pursuing this path by changing the
priorities from a regulatory focus on cost-efficiency to a holistic innovation and output-
oriented approach with a forward looking, long-term value for money perspective trans-
forming climate targets into regulatory functionalities. A less holistic but rather straight-
forward solution has been implemented in Italy where the regulator may increase the
rate of return for specific investments. In the Netherlands, revised approaches towards
investments and innovation are still under discussion. The intensity of the debate how-
ever suggests the importance of this issue. Norway corrected the time-lag problem.
To conclude, the following should be taken into account when considering a “smart”
regulatory framework.
Dynamic efficient investments are not a target in themselves. They are the essential
catalyst to facilitate smart grids in order to tackle the overarching sustainability and de-
carbonisation targets. Therefore policymakers when deciding upon these targets should
provide a clear mandate and clear incentives to stimulate investments in the necessary
infrastructure. This goes together with the need to consider new market design options,
role definitions and a critical reflection on the regulatory framework within a long-term,
forward-looking perspective. This may imply rather multi-faceted output oriented ap-
proaches. “Living” dynamic efficiency, avoiding micro-management and ensuring con-
sistency will however be crucial challenges in this context. Depending on the “maturity”
of the regulatory framework and the number of regulated entities, pragmatic solutions
should therefore get priority in the regulatory debate albeit being aware of potential de-
marcation problems. Moreover, essential shortcomings in the regulatory design such as
the time-lag problem should be corrected.
Policy makers and regulators should also be aware that the paradigm shift towards
smart grids will enable new players and new organizational design options. This implies
that benefits of smart grids investments will accrue to different participants to the value
chain in different dimensions. This requires new regulatory flexibility to integrate third

34 Diskussionsbeitrag Nr. 353
parties and to internalise cost and benefits appropriately. The “fit for purpose” of the
overarching market framework should be critically reflected in this context.
The approaches taken in the UK, Italy and Norway as well as the current discussions in
the Netherlands are encouraging steps in this direction. In order to tackle the overarch-
ing climate targets and facilitate the paradigm shift towards smart grids it is crucial that
other countries become alert, initiate the regulatory debate and follow their examples. A
thorough assessment as to what extent the instruments implemented in the countries of
reference would be appropriate in the German regulatory context should help in pursu-
ing this path.
New regulatory approaches towards investments 35
References
AEEG [The Italian Regulatory Authority for Electricity and Gas] (2009): Annual report to the Eu-
ropean Commission on regulatory activities and the state of services in the electricity
and gas sectors, 31 July 2009.
AEEG [The Italian Regulatory Authority for Electricity and Gas] (2008): Annual report to the Eu-
ropean Commission on regulatory activities and the state of services in the electricity
and gas sectors, 31 July 2008.
Bauknecht, D. (2010): Incentive regulation and network investments, study for the Federal Min-
istry of Economics and Technology, IRIN working paper, May 2010.
CEER (2008): 4th benchmarking report on quality of electricity supply 2008, Council of European
Energy Regulators, Ref: C08-EQS-24-04, December 2008, Brussels.
Energiekamer (2009): 2009 National Report Office of Energy Regulation (The Energiekamer) to
the European Commission. Download via http://www.energy-regula
tors.eu/portal/page/portal/EER_HOME/EER_PUBLICATIONS/NATIONAL_REPORTS/N
ational%20Reporting%202009/NR_En/E09_NR_Netherlands-EN.pdf (as at 1. October
2010.
European Commission (2010): Commission Staff Working Document, Technical Annex to the
Communication from the Commission to the Council and the European Parliament, Re-
port on progress in creating the internal gas and electricity market, COM(2010)84 final,
11 March 2010. Download via http://eur-lex.europa.eu/LexUriServ
/LexUriServ.do?uri=SEC:2010:0251:FIN:EN.PDF (as at 14 October 2010).
European Commission (2007a): United Kingdom – Internal Market Factsheet, January 2007.
Download via http://ec.europa.eu/energy/energy_policy/doc/factsheets/market/market_
uk_en.pdf (as at 8 November 2010).
European Commission (2007b): Netherlands – Internal Market Factsheet, January 2007. Down-
load via http://ec.europa.eu/energy/energy_policy/doc/factsheets/market/market
_nl_en.pdf (as at 8 November 2010).
Growitsch, C., Jamasb, T., Müller, C., and Wissner, M. (2010): Social cost-efficient Service Qual-
ity - Integrating Customer Valuation in Incentive Regulation‟, in: Energy Policy, Volume
38, Issue 5, May 2010, Pages 2536-2544.
Herbert Smith (2010): European Energy Review 2010, Special Edition on the EU Third Energy
and Climate Change Packages, January 2010. Download via:
http://www.herbertsmith.com/NR/rdonlyres/ECB0CBCD-49C5-439A-8A3B-
40586EEB3DA4/0/7847EER2010d1Norway.pdf (as at 2nd November 2010).
Jamasb, T. and Pollitt, M. (2007): Incentive Regulation of Electricity Distribution Networks: Les-
sons of Experience from Britain, in: Energy Policy Volume 35, Issue 12, December
2007, Pages 6163-6187.
Meeus, L., Saguan, M., Glachant, J.-M. and Belmans, R. (2010): Smart regulation for smart
grids, EUI Working Papers RSCAC 2010/45, Robert Schuman Centre for Advanced
Studies, Florence School of Regulation, May 2010.
Müller, C., Growitsch, C., and Wissner, M. (2010): Regulierung und Investitionsanreize in der
ökonomischen Theorie. IRIN Working Paper im Rahmen des Arbeitspakets: Smart Grid-
36 Diskussionsbeitrag Nr. 353
gerechte Weiterentwicklung der Anreizregulierung, WIK Diskussionsbeitrag Nr. 349, Bad
Honnef, December 2010.
Ministerie van Economische Zaken (2010): Op weg naar intelligente netten in Nederland,
Discussiedocument van de Taskforce Intelligente Netten, July 2010. Download via
http://www.rijksoverheid.nl/documenten-en-
publicaties/rapporten/2010/09/02/samenvatting-op-weg-naar-intelligente-netten-in-
nederland.html (as at 18 October 2010).
Nederlandse Mededingingsautoriteit (2010a): Ontwerpmethodebesluit Nummer 103222_1/101,
Betreft zaak: Ontwerp-besluit van de Raad van Bestuur van de Nederlandse
Mededingingsautoriteit als bedoeld in artikel 81, eerste lid, van de Gaswet.
Nederlandse Mededingingsautoriteit (2010b): Taking care of optimal energy-distribution net-
works, The regulator‟s vision of the regulatory framework, The Hague, February 2010.
Download via:
http://www.energiekamer.nl/images/100220%20Manage-ment%20samenvatting%
20reguleringskader%20-%20vertaling_tcm7-135724.pdf (as at 15 October 2010).
Nederlandse Mededingingsautoriteit (2009): Consultatiedocument van de Nederlandse
Mededingingsautoriteit, Nummer 103345 / 2, Betreft zaaknr. 103345 / Consultatie over
innovatie, 16 October 2009. Download via
http://www.energiekamer.nl/images/Energiekamer%20-%20Consultatiedocument%20
over%20Innovatie_tcm7-132765.pdf (as at 16 October 2010).
Nederlandse Mededingsautoriteit (year unknown): Besluit, Nummer: 102000-14, Beleidsregel
met betrekking tot de beoordeling van voorstellen voor een aanmerkelijke investering ter
uitbreiding van het door een netbeheerder beheerde net.
NVE (2009): Report on regulation and the electricity market, Norwegian Water Resources and
Energy Directorate (NVE), 30th of June 2009. Download via http://www.energy-
regula-
tors.eu/portal/page/portal/EER_HOME/EER_PUBLICATIONS/NATIONAL_REPORTS/N
ational%20Reporting%202009/NR_En/E09_NR_Norway-EN.pdf (as at 20 October
2010).
NVE (2005): Report on regulation and the electricity market, Norwegian Water Resources and
Energy Directorate (NVE), 15th of July 2005. Download via http://www.energy-
regulators.eu/portal/page/portal/EER_HOME/EER_PUBLICATIONS/NATIONAL_
REPORTS/NR_2005.
Ofgem (2010a): RIIO: A new way to regulate energy networks, Final decision, October 2010.
Download via: http://www.ofgem.gov.uk/Networks/rpix20/ConsultDocs/Documents1
/Decision%20doc.pdf (as at 28 October 2010).
Ofgem (2010b): Handbook for implementing the RIIO model, October 2010. Download via
http://www.ofgem.gov.uk/Networks/rpix20/ConsultDocs/Documents1/RIIO%20handbook
.pdf (as at 28 October 2010).
Ofgem (2009): Ofgem 2009 National Report to the European Commission, 31 July 2009. Down-
load via: http://www.energy-regulators.eu/portal/page/portal/EER_HOME/EER_
PUBLICATIONS/NATIONAL_REPORTS/National%20Reporting%202009/NR_En/E09_
NR_UK-EN.pdf (as at 7 October 2010).

New regulatory approaches towards investments 37
Ofgem (2004): Electricity Distribution Price Control Review, Background information on the cost
of capital, March 2004. Download via: http://www.ofgem.gov.uk/NETWORKS
/ELECDIST/PRICECNTRLS/DPCR4/Documents1/6592-
COST%20OF%20CAPITAL%20Final.pdf (as at 7 October 2010).
Pedell, B. (2006): Regulatory risk and the cost of capital. Determinants and implications for rate
regulation. Berlin. Springer.
PriceWaterhouseCoopers (2009): Investeringen in energienetwerken onder druk? Een
beoordeling van het reguleringskader, Studie für die Nederlandse Mededingsautoriteit,
Energiekamer, Oktober 2009.
Wissner, M. (2009): Smart Metering, WIK Diskussionsbeitrag Nr. 321, Bad Honnef, July 2009.

Sonstige Diskussionsbeiträge 39
Als "Diskussionsbeiträge" des Wissenschaftlichen Instituts für Infrastruktur und Kom-
munikationsdienste sind zuletzt erschienen:
Nr. 277: Marcus Stronzik, Oliver Franz:
Berechnungen zum generellen X-Faktor für deutsche Strom- und Gas-netze: Produktivitäts- und Inputpreis-differential, Juli 2006
Nr. 278: Alexander Kohlstedt:
Neuere Theoriebeiträge zur Netzöko-nomie: Zweiseitige Märkte und On-net/ Off-net-Tariffdifferenzierung, August 2006
Nr. 279: Gernot Müller:
Zur Ökonomie von Trassenpreis-systemen, August 2006
Nr. 280: Franz Büllingen, Peter Stamm in Ko-operation mit Prof. Dr.-Ing. Peter Vary, Helge E. Lüders und Marc Werner (RWTH Aachen):
Potenziale alternativer Techniken zur bedarfsgerechten Versorgung mit Breit-bandzugängen, September 2006
Nr. 281: Michael Brinkmann, Dragan Ilic:
Technische und ökonomische Aspekte des VDSL-Ausbaus, Glasfaser als Al-ternative auf der (vor-) letzten Meile, Oktober 2006
Nr. 282: Franz Büllingen:
Mobile Enterprise-Solutions –- Stand und Perspektiven mobiler Kommuni-kationslösungen in kleinen und mittle-ren Unternehmen, November 2006
Nr. 283: Franz Büllingen, Peter Stamm:
Triple Play im Mobilfunk: Mobiles Fern-sehen über konvergente Hybridnetze, Dezember 2006
Nr. 284: Mark Oelmann, Sonja Schölermann:
Die Anwendbarkeit von Vergleichs-marktanalysen bei Regulierungsent-scheidungen im Postsektor, Dezember 2006
Nr. 285: Iris Böschen:
VoIP im Privatkundenmarkt – Markt-strukturen und Geschäftsmodelle, Dezember 2006
Nr. 286: Franz Büllingen, Christin-Isabel Gries, Peter Stamm:
Stand und Perspektiven der Telekom-munikationsnutzung in den Breitband-kabelnetzen, Januar 2007
Nr. 287: Konrad Zoz:
Modellgestützte Evaluierung von Ge-schäftsmodellen alternativer Teilneh-mernetzbetreiber in Deutschland, Ja-nuar 2007
Nr. 288: Wolfgang Kiesewetter:
Marktanalyse und Abhilfemaßnahmen nach dem EU-Regulierungsrahmen im Ländervergleich, Februar 2007
Nr. 289: Dieter Elixmann, Ralf G. Schäfer, Andrej Schöbel:
Internationaler Vergleich der Sektorper-formance in der Telekommunikation und ihrer Bestimmungsgründe, Februar 2007
Nr. 290: Ulrich Stumpf:
Regulatory Approach to Fixed-Mobile Substitution, Bundling and Integration, März 2007
Nr. 291: Mark Oelmann:
Regulatorische Marktzutrittsbedingun-gen und ihre Auswirkungen auf den Wettbewerb: Erfahrungen aus aus-gewählten Briefmärkten Europas, März 2007
Nr. 292: Patrick Anell, Dieter Elixmann:
"Triple Play"-Angebote von Festnetz-betreibern: Implikationen für Unter-nehmensstrategien, Wettbewerb(s)po-litik und Regulierung, März 2007
Nr. 293: Daniel Schäffner:
Bestimmung des Ausgangsniveaus der Kosten und des kalkulatorischen Ei-genkapitalzinssatzes für eine Anreizre-gulierung des Energiesektors, April 2007
Nr. 294: Alex Kalevi Dieke, Sonja Schölermann:
Ex-ante-Preisregulierung nach voll-ständiger Marktöffnung der Briefmärk-te, April 2007

40 Sonstige Diskussionsbeiträge
Nr. 295: Alex Kalevi Dieke, Martin Zauner:
Arbeitsbedingungen im Briefmarkt, Mai 2007
Nr. 296: Antonia Niederprüm:
Geschäftsstrategien von Postunter-nehmen in Europa, Juli 2007
Nr. 297: Nicole Angenendt, Gernot Müller, Mar-cus Stronzik, Matthias Wissner:
Stromerzeugung und Stromvertrieb – eine wettbewerbsökonomische Analy-se, August 2007
Nr. 298: Christian Growitsch, Matthias Wissner:
Die Liberalisierung des Zähl- und Messwesens, September 2007
Nr. 299: Stephan Jay:
Bedeutung von Bitstrom in euro-päischen Breitbandvorleistungsmärk-ten, September 2007
Nr. 300: Christian Growitsch, Gernot Müller, Margarethe Rammerstorfer, Prof. Dr. Christoph Weber (Lehrstuhl für Ener-giewirtschaft, Universität Duisburg-Essen):
Determinanten der Preisentwicklung auf dem deutschen Minutenreserve-markt, Oktober 2007
Nr. 301: Gernot Müller:
Zur kostenbasierten Regulierung von Eisenbahninfrastrukturentgelten – Eine ökonomische Analyse von Kostenkon-zepten und Kostentreibern, Dezember 2007
Nr. 302: Patrick Anell, Stephan Jay, Thomas Plückebaum:
Nachfrage nach Internetdiensten – Dienstearten, Verkehrseigenschaften und Quality of Service, Dezember 2007
Nr. 303: Christian Growitsch, Margarethe Ram-merstorfer:
Zur wettbewerblichen Wirkung des Zweivertragsmodells im deutschen Gasmarkt, Februar 2008
Nr. 304: Patrick Anell, Konrad Zoz:
Die Auswirkungen der Festnetzmobil-funksubstitution auf die Kosten des lei-tungsvermittelten Festnetzes, Februar 2008
Nr. 305: Marcus Stronzik, Margarethe Rammer-storfer, Anne Neumann:
Wettbewerb im Markt für Erdgasspei-cher, März 2008
Nr. 306: Martin Zauner:
Wettbewerbspolitische Beurteilung von Rabattsystemen im Postmarkt, März 2008
Nr. 307: Franz Büllingen, Christin-Isabel Gries, Peter Stamm:
Geschäftsmodelle und aktuelle Ent-wicklungen im Markt für Broadband Wireless Access-Dienste, März 2008
Nr. 308: Christian Growitsch, Gernot Müller, Marcus Stronzik:
Ownership Unbundling in der Gaswirt-schaft – Theoretische Grundlagen und empirische Evidenz, Mai 2008
Nr. 309: Matthias Wissner:
Messung und Bewertung von Versor-gungsqualität, Mai 2008
Nr. 310: Patrick Anell, Stephan Jay, Thomas Plückebaum:
Netzzugang im NGN-Core, August 2008
Nr. 311: Martin Zauner, Alex Kalevi Dieke, Torsten Marner, Antonia Niederprüm:
Ausschreibung von Post-Universal-diensten. Ausschreibungsgegenstände, Ausschreibungsverfahren und beglei-tender Regulierungsbedarf, September 2008
Nr. 312: Patrick Anell, Dieter Elixmann:
Die Zukunft der Festnetzbetreiber, Dezember 2008
Nr. 313: Patrick Anell, Dieter Elixmann, Ralf Schäfer:
Marktstruktur und Wettbewerb im deut-schen Festnetz-Markt: Stand und Ent-wicklungstendenzen, Dezember 2008
Nr. 314: Kenneth R. Carter, J. Scott Marcus, Christian Wernick:
Network Neutrality: Implications for Eu-rope, Dezember 2008
Sonstige Diskussionsbeiträge 41
Nr. 315: Stephan Jay, Thomas Plückebaum:
Strategien zur Realisierung von Quality of Service in IP-Netzen, Dezember 2008
Nr. 316: Juan Rendon, Thomas Plückebaum, Iris Böschen, Gabriele Kulenkampff:
Relevant cost elements of VoIP net-works, Dezember 2008
Nr. 317: Nicole Angenendt, Christian Growitsch, Rabindra Nepal, Christine Müller:
Effizienz und Stabilität des Stromgroß-handelsmarktes in Deutschland – Ana-lyse und wirtschaftspolitische Implika-tionen, Dezember 2008
Nr. 318: Gernot Müller:
Produktivitäts- und Effizienzmessung im Eisenbahninfrastruktursektor – Me-thodische Grundlagen und Schätzung des Produktivitätsfortschritts für den deutschen Markt, Januar 2009
Nr. 319: Sonja Schölermann:
Kundenschutz und Betreiberauflagen im liberalisierten Briefmarkt, März 2009
Nr. 320: Matthias Wissner:
IKT, Wachstum und Produktivität in der Energiewirtschaft - Auf dem Weg zum Smart Grid, Mai 2009
Nr. 321: Matthias Wissner:
Smart Metering, Juli 2009
Nr. 322: Christian Wernick unter Mitarbeit von Dieter Elixmann:
Unternehmensperformance führender TK-Anbieter in Europa, August 2009
Nr. 323: Werner Neu, Gabriele Kulenkampff:
Long-Run Incremental Cost und Preis-setzung im TK-Bereich - unter beson-derer Berücksichtigung des techni-schen Wandels, August 2009
Nr. 324: Gabriele Kulenkampff:
IP-Interconnection – Vorleistungsdefini-tion im Spannungsfeld zwischen PSTN, Internet und NGN, November 2009
Nr. 325 Juan Rendon, Thomas Plückebaum, Stephan Jay:
LRIC cost approaches for differentiated QoS in broadband networks, November 2009
Nr. 326: Kenneth R. Carter with contributions of Christian Wernick, Ralf Schäfer, J. Scott Marcus:
Next Generation Spectrum Regulation for Europe: Price-Guided Radio Policy, November 2009
Nr. 327: Gernot Müller:
Ableitung eines Inputpreisindex für den deutschen Eisenbahninfrastruktursek-tor, November 2009
Nr. 328: Anne Stetter, Sonia Strube Martins:
Der Markt für IPTV: Dienstverfüg-barkeit, Marktstruktur, Zugangsfragen, Dezember 2009
Nr. 329: J. Scott Marcus, Lorenz Nett, Ulrich Stumpf, Christian Wernick:
Wettbewerbliche Implikationen der On-net/Off-net Preisdifferenzierung, De-zember 2009
Nr. 330: Anna Maria Doose, Dieter Elixmann, Stephan Jay:
"Breitband/Bandbreite für alle": Kosten und Finanzierung einer nationalen Inf-rastruktur, Dezember 2009
Nr. 331: Alex Kalevi Dieke, Petra Junk, Antonia Niederprüm, Martin Zauner:
Preisstrategien von Incumbents und Wettbewerbern im Briefmarkt, Dezem-ber 2009
Nr. 332: Stephan Jay, Dragan Ilic, Thomas Plückebaum:
Optionen des Netzzugangs bei Next Generation Access, Dezember 2009
Nr. 333: Christian Growitsch, Marcus Stronzik, Rabindra Nepal:
Integration des deutschen Gasgroß-handelsmarktes, Februar 2010
Nr. 334: Ulrich Stumpf:
Die Abgrenzung subnationaler Märkte als regulatorischer Ansatz, März 2010
Nr. 335: Stephan Jay, Thomas Plückebaum, Dragan Ilic:
Der Einfluss von Next Generation Ac-cess auf die Kosten der Sprachtermi-nierung, März 2010
42 Sonstige Diskussionsbeiträge
Nr. 336: Alex Kalevi Dieke, Petra Junk, Martin Zauner:
Netzzugang und Zustellwettbewerb im Briefmarkt, März 2010
Nr. 337: Christian Growitsch, Felix Höffler, Matthias Wissner:
Marktmachtanalyse für den deutschen Regelenergiemarkt, April 2010
Nr. 338: Ralf G. Schäfer unter Mitarbeit von Volker Köllmann:
Regulierung von Auskunfts- und Mehr-wertdiensten im internationalen Ver-gleich, April 2010
Nr. 339: Christian Growitsch, Christine Müller, Marcus Stronzik
Anreizregulierung und Netzinvesti-tionen, April 2010
Nr. 340: Anna Maria Doose, Dieter Elixmann, Rolf Schwab:
Das VNB-Geschäftsmodell in einer sich wandelnden Marktumgebung: Heraus-forderungen und Chancen, April 2010
Nr. 341: Alex Kalevi Dieke, Petra Junk, Sonja Schölermann:
Die Entwicklung von Hybridpost: Markt-entwicklungen, Geschäftsmodelle und regulatorische Fragestellungen, August 2010
Nr. 342: Karl-Heinz Neumann:
Structural models for NBN deployment, September 2010
Nr. 343: Christine Müller:
Versorgungsqualität in der leitungsge-bundenen Gasversorgung, September 2010
Nr. 344: Roman Inderst, Jürgen Kühling, Karl-Heinz Neumann, Martin Peitz:
Investitionen, Wettbewerb und Netzzu-gang bei NGA, September 2010
Nr. 345: Christian Growitsch, J. Scott Marcus, Christian Wernick:
Auswirkungen niedrigerer Mobiltermi-nierungsentgelte auf Endkundenpreise und Nachfrage, September 2010
Nr. 346: Antonia Niederprüm, Veronika Sönt-gerath, Sonja Thiele, Martin Zauner:
Post-Filialnetze im Branchenvergleich, September 2010
Nr. 347: Peter Stamm:
Aktuelle Entwicklungen und Strategien der Kabelbranche, September 2010
Nr. 348: Gernot Müller:
Abgrenzung von Eisenbahnverkehrs-märkten – Ökonomische Grundlagen und Umsetzung in die Regulierungs-praxis, November 2010
Nr. 349: Christine Müller, Christian Growitsch, Matthias Wissner:
Regulierung und Investitionsanreize in der ökonomischen Theorie, IRIN Work-ing Paper im Rahmen des Arbeits-pakets: Smart Grid-gerechte Weiter-entwicklung der Anreizregulierung, De-zember 2010
Nr. 350: Lorenz Nett, Ulrich Stumpf:
Symmetrische Regulierung: Möglich-keiten und Grenzen im neuen EU-Rechtsrahmen, Februar 2011
Nr. 350: Lorenz Nett, Ulrich Stumpf:
Symmetrische Regulierung: Möglich-keiten und Grenzen im neuen EU-Rechtsrahmen, Februar 2011
Nr. 351: Peter Stamm, Anne Stetter unter Mitarbeit von Mario Erwig:
Bedeutung und Beitrag alternativer Funklösungen für die Versorgung länd-licher Regionen mit Breitbandanschlüs-sen, Februar 2011
Nr. 352: Anna Maria Doose, Dieter Elixmann:
Nationale Breitbandstrategien und Im-plikationen für Wettbewerbspolitik und Regulierung, März 2011
Nr. 353: Christine Müller:
New regulatory approaches towards in-vestments: a revision of international experiences, IRIN working paper for working package: Advancing incentive regulation with respect to smart grids, April 2011


ISSN 1865-8997