new observation strategies for the solar uv spectral irradiance
TRANSCRIPT
New observation strategies for the solar UV spectral irradiance
Gael Cessateur1,*, Jean Lilensten2, Thierry Dudok de Wit3, Ali BenMoussa4, and Matthieu Kretzschmar3,4
1 Physical-Meteorological Observatory / World Radiation Center, Davos, Switzerland*corresponding author: e-mail: [email protected]
2 UJF-Grenoble 1 / CNRS-INSU, Institut de Planetologie et d’Astrophysique de Grenoble (IPAG), UMR 5274, 38041 Grenoble,France
3 LPC2E/CNRS, (UMR 7328) and University of Orleans, 3A avenue de la Recherche Scientifique, 45071 Orleans Cedex 2, France4 Solar Terrestrial Center of Excellence, Royal Observatory of Belgium (STCE/ROB), Circular 3, 1180 Brussels, Belgium
Received 6 March 2012 / Accepted 10 September 2012
ABSTRACT
Many applications in space weather and in space situational awareness require continuous solar spectral irradiance measurementsin the UV, and to a lesser degree in the visible band. Most space-borne solar radiometers are made out of two different parts:(i) a front filter that selects the passband and (ii) a detector that is usually based on silicon technology. Both are prone to degra-dation, which may be caused either by the degradation of the filter coating due to local deposition or to structural changes, or by thedegradation of the silicon detector by solar radiative and energetic particle fluxes. In this study, we provide a theoretical analysis ofthe filter degradation that is caused by structural changes such as pinholes; contamination-induced degradation will not be consid-ered. We then propose a new instrumental concept, which is expected to overcome, at least partially, these problems. We show howmost of the solar UV spectrum can be reconstructed from the measurement of only five spectral bands. This instrumental conceptoutperforms present spectrometers in terms of degradation. This new concept in addition overcomes the need for silicon-baseddetectors, which are replaced by wide band gap material detectors. Front filters, which can contribute to in-flight degradation, there-fore are not required, except for the extreme-UV (EUV) range. With a small weight and a low telemetry, this concept may also haveapplications in solar physics, in astrophysics and in planetology.
Key words. Space Weather – Solar Spectrum (UV) – Modelling – Instrumentation
1. Introduction and motivations
The solar activity manifests itself through several mechanisms.The upcoming cycle may reveal many differences compared toformer ones (Podladchikova & Van der Linden 2011) withmany impacts on space weather applications such as GNSS(Sreeja et al. 2011), scintillations (Beniguel & Hamel 2011)or forecasting (Sigernes et al. 2011; Tsagouri 2011). Amongthese mechanisms, the solar spectral irradiance in the ultraviolet(UV) is a key quantity for aeronomy throughout the solar sys-tem (Lilensten et al. 2008; Mikhailov et al. 2012), especially forevaluating changes in the dayside ionosphere and for forecast-ing extreme events (Tsurutani et al. 2012). The UV irradiance isalso important for the remote sensing of the planets, for climatestudies (Fox et al. 2011). In solar physics, the most energeticpart of the solar UV spectrum is conventionally divided intomiddle UV (MUV, 200–300 nm), far UV (FUV, 122–200 nm), extreme UV (EUV, 10–121 nm) and soft X-rays(XUV, 0.1–10 nm) (Tobiska & Nusinov 2006). The solar spec-tral variability in the UV is highly complex and dynamic, anddirectly affects the thermosphere/ionosphere system on varioustime scales. Unfortunately, the long-term monitoring of the UVis a major and expensive challenge: measurements must be car-ried out in space, where instruments suffer from ageing, degra-dation and signal contamination. Direct observations are at bestsparse, in particular in the EUV range before the launch of theTIMED satellite in 2002. Moreover, the reliability of recent datafrom SORCE/SIM and SORCE/SOLSTICE is being ques-tioned (e.g., Haigh et al. 2010; Lean et al. 2011).
As of today, all solar UVobservations are made either withbroadband radiometers or with spectrometers. All these instru-ments suffer from degradation and are facing the problem of in-flight calibration. As a consequence, most applications thatrequire continuous and long-term observations rely instead ona variety of solar proxies that partly mimic some of the spectralbands. The search for more robust instrument concepts there-fore is an issue of considerable importance.
The first source of instrument degradation is the contamina-tion of the front filters. All solar missions indeed report animportant decrease of the measured irradiance that is mostlikely caused by the UV polymerisation of hydrocarbon con-taminants onto optical surfaces. The EURECA mission, forinstance, reported a decrease of about 70% after 200 days ofobservation for a filter centred around 330 nm (Wehrli et al.1996). The SUSIM spectrometer on board UARS used anMgF2 entrance filter for the 115–263 nm range. More than75% of its signal was lost after 200 days of observation. Theinstrument scientists eventually completely removed the filterin front of the spectrometer (Floyd, 1999). Recently, similareffects were noticed with the LYRA radiometer on boardPROBA2; a major fraction of the signal (of about 90%) waslost for the Lyman-a channel after 1 year (Dominique et al.2012). This degradation is directly related to the cleanlinessof the instruments and of the spacecraft itself. Interference fil-ters using quartz or MgF2 material are more prone to such con-tamination (Floyd 1999). Metallic filters dedicated to EUVrange, like zirconium or aluminium, are less affected by it,
J. Space Weather Space Clim. 2 (2012) A16DOI: 10.1051/swsc/2012016� Owned by the authors, Published by EDP Sciences 2012
This is an Open Access article distributed under the terms of Creative Commons Attribution 3.0 Unported License
probably because the EUV spectral window is less sensitive tothe filter contamination. Degradation studies are notoriouslyrare in the literature on UV measurements; for that reason,we shall not further address this issue here.
The second main source of instrument degradation is thechange in the spectral response of the interference filters, whichoccurs when their structure changes under the effect of UV radi-ation or of contamination. As a consequence of this, the spectralinformation may change in time. Osantowski et al. (1991)characterised the spectral response of several UV filters in the120–200 nm range, after few months of operation in space.These filters were mode out of using MgF2. In the absence ofcontamination, they showed that the spectral responsedecreased by about 30% around 160 nm, while other wave-lengths remained unchanged. Here again, we are suffering froma strong lack of systematic studies.
A third effect is the appearance of pinholes on the surface ofmetallic filters. Their typical size is in the range of a fewmicrom-eters. Such pinholes alter the optical surface, which leads to anincrease of the porosity and, by extension, to a modification ofthe measured signal. Finally, the degradation of silicon detectorsis alsoa functionof the absorbeddoseof solar energetic radiationsand particles, which further reduce instrument life.
To bypass all these problems, several empirical approacheshave been developed to reconstruct the solar spectral UV irra-diance without direct observations. The most widespreadapproach is based on the use of solar proxies as substitutes,such as the radio flux at 10.7 cm (F10.7) (Tapping & Detracey1990) or the MgII core-to-wing index (Heath & Schlesinger1986), which benefit from long historical records that are rela-tively well calibrated and are often measured from the ground.Linear combinations of these proxies are used in many empir-ical models (Hinteregger 1981; Tobiska et al. 2000; Lean et al.2003; Richards et al. 1994, 2006). Dudok de Wit et al. (2009),however, have shown that no single index, and more impor-tantly, no combination of existing indexes, can properly recon-struct the solar EUV/FUV/MUV irradiance on all time scales,which is quite prejudicial to the characterisation of upper atmo-spheric parameters (Lilensten et al. 2007). This problem is par-ticularly acute for planetary missions, for which a localmeasurement of the UV flux (rather than an extrapolation fromEarth-based observations) is required to properly characteriselocal effects.
A second strategy consists in considering the solar spec-trums a linear superposition of reference spectra that originatein different regions on the solar disc. Such regions are charac-terised in terms of structures (such as the quiet Sun, coronalholes or active regions), or, more generally, are based on surfacemagnetism. They are determined through the analysis of solarimages (Warren et al. 1998; Worden et al. 1998; Kretzschmaret al. 2004) or solar magnetograms (Krivova & Solanki2008). An operational model (Vieira et al. 2012)1, for example,has been developed along that line. As it turns out, only a fewtypes of regions, typically three to four, are sufficient to prop-erly describe the solar spectral variability from the UV to thevisible. A statistical analysis has confirmed this unique property(Amblard et al. 2008). On time scales that exceed the dynamictime of transient events such as flares, Floyd et al. (2005) haveshown that emissions coming from the upper photosphere, thechromosphere, the transition region and the lower corona arestrongly correlated. This coherency stems from the strong
structuring of the solar atmosphere by the solar magnetic field(Domingo et al. 2009).
A direct consequence of this coherency of the solar spectralvariability is the possibility for reconstructing the irradiance at aspecific wavelength from nearby wavelengths. The most appro-priate set of lines could either be determined using a semi-empir-ical approach (Kretzschmar et al. 2006) or by a statisticalapproach (Dudok de Wit et al. 2005). These latter two studiesshow that a relative error on the reconstructed spectrum as lowas 10% can be achieved with 6–10 lines only. No single instru-ment, however, measures lines in a strict sense; all have a finitespectral resolution of the order of a few nm to a few tens ofnm. Kretzschmar et al. (2008) first investigated the possibilityof using spectral bands (rather than spectral lines) to reconstructthe solar spectral irradiance. Following these studies, Cessateuret al. (2011) extended the concept by testing it with three existingradiometers. It turns out thatwith four passbands that are properlydistributed over theUV spectrum, a relative error below 20% canbe achieved using 6 years of daily-averaged UV spectra fromTIMED/SEE (Woods et al. 2005) and SORCE/SOLTICE(Rottman 2005). These studies show that broadband radiometersare excellent candidates for obtaining the solar spectral irradiancein cases where no high spectral resolution is required.
The main issue we shall now focus on is the robustness ofbroadband detectors regarding degradation. Here, we shall onlyaddress the degradation due to solar UV radiation, ignoring thecontamination from carbon deposits or other pollutants. Thereare some technological solutions for overcoming the latter suchas cold traps, protecting shields, etc. Our study is organised asfollows:
d We first examine the state-of-the-art in the observation ofthe solar spectrum using radiometers. Two aspects needto be distinguished: detectors and filters. Indeed, bothparts are independent and do not suffer a priori fromthe same kind of degradation.
d We then propose a way to quantify the degradation of themetallic filters by considering their porosity due to theapparition of pinholes. We estimate the degradation con-sidering different technologies.
d We then propose a strategy to overcome these degrada-tions by using detectors without filters.
d We finally propose an instrumental concept for recon-structing the whole UV spectrum.
2. Technological aspects
2.1. Photodetectors
Space-borne instruments that are dedicated to the observation ofthe soft X-ray (XUV) to the near-infrared (NIR) spectral bandscommonly use Silicon (Si) photodetectors, which are techno-logically mature. However, present Si photodetectors for theEUV exhibit serious limitations in terms of performance andlifetime.
The recent launch of the ESA technological missionPROBA2 has offered the possibility to test for the first timeand in real conditions, photodetectors that are based on wideband gap material (WBGM) technologies (Hochedez et al.2006). Using WBGM as the active layer makes the photodetec-tors radiation-hard against both UV radiation and energetic par-ticles (e.g., solar energetic protons, energetic protons andelectrons in the radiation belts). These detectors are also partly
1 Available at the following website: http://lpc2e.cnrs-orleans.fr/~soteria/
J. Space Weather Space Clim. 2 (2012) A16
A16-p2
blind to visible light, which alleviates the need for high-rejec-tion filters in the visible range. These are important assets formaking observations in the XUV-EUV range.
Photodetectors built out from various WBGM have beenreported for a variety of potential applications in the fields ofautomotive, military defence as well as in environmental andbiological research. Among them, SiC (Wright & Horsfall2007), GaN (Monroy et al. 1999) and II–VI compound-baseddetectors (Sou et al. 2001) show a photodetector cut-off wave-length longer than 300 nm, whereas cBN (Soltani et al. 2008),AlN (Butun et al. 2006; Li et al. 2006; Dahal et al. 2007;BenMoussa et al. 2008) and diamond-based (Adam et al.2004; Balducci et al. 2005; Nesladek 2005; Sio et al. 2005;BenMoussa et al. 2006; Saito et al. 2006; Liao et al. 2007;Keister & Smedley 2009) devices present a significantly shorterphotoresponse cut-off at around 193 (Soltani et al. 2008), 210(BenMoussa et al. 2008) and 225 nm (BenMoussa et al.2006) wavelengths, respectively.
By their nature, cBN, AlN and diamond semiconductors arethe primary choice as the photosensitive materials for solarEUV and VUV photon detection (spectral range of interest10 � k � 200 nm) and meet the requirements for UV radiom-eters planned to study the Sun since they provide high radiationhardness, near-ultraviolet (NUV) and visible-blindness (wave-length cut-off value � 225 nm), mechanical, chemical andthermal stability and no need of cooling system (i.e., room-temperature operation).
Recently, and for upcoming EUV-UV solar radiometers,high-quality cBN, AlN and diamond Metal-Semiconductor-Metal (MSM) photodetectors have been built up by the researchgroup of the Royal Observatory of Belgium (BenMoussa et al.2009a). The aim of this group is to develop innovative photo-detectors using the widest band gap materials2 that are suitedfor high temperatures and harsh environments.
There are several important criteria for the design of UVphotodetectors for space applications, including the opticalwavelength of interest (here 1–280 nm), semiconductor mate-rial composition and thickness, detector geometrical structure(device architecture) and electrode metal composition. For thepurpose of UV radiation detection, it should be noted that thepenetration depth (1/a(k)) of almost all semiconductor materialsdrops drastically to extremely small values, which are of theorder of few nanometers. Most photons therefore are absorbedin the first atomic layers, which leads to carrier recombinationin the upper surface layer and consequently to a reduction ofthe sensitivity. Hence, it is crucial to optimise the photo-electroncollection close to the surface with a planar configuration of theelectrodes. Among different design structures, the MSM repre-sents a simple, cost-effective photodetector design that is notonly related to performance but also to the production process.MSM photodetectors are built with coplanar structures, makingtheir production simpler than p-i-n or Schottky diodes that con-sist of different layers with various doping constituents andconcentrations.
2.2. UV filters
There are different kinds of filters depending on the spectralranges. Metallic filters are often used in the EUV range likethose based on aluminium and zirconium from the LYRAinstrument on board PROBA2. Different architectures can also
be considered: a thin layer could directly be applied over thedetectors, or a mesh grid can be worked out such as porous fil-ters (Dominique et al. 2009) or by using different layers(Auchere et al. 2011). For the FUV and MUV ranges, interfer-ence optical filters like those based on quartz or magnesiumfluoride (MgF2) are often used. Very little information aboutthe nature of these filters, however, is available since it is oftenpatent-dependent (see, for e.g., http://www.princetoninstruments.com/).
2.3. Quantification of the porosity of the filters
Here, we shall address a simple approach to quantify the impactof the formation of pinholes on filters, which can contribute toin-flight degradation. What does matter here is to compare theperformance from silicon-based and wide band gap materials-based photodetectors for monitoring the solar UV irradiance.Following the work by Dominique et al. (2009), the transmit-tance of porous filters can be written as
T porous filter ¼ P 1� J 20
2pr2
kL
� �� J 2
1
2pr2
kL
� �� �ð1Þ
with P the porosity of the filter which is the ratio between the
area of the holes and the total surface P ¼ SholeAtotal
� �where by
definition 0 � P � 1. J0 and J0 are the Bessel functions ofthe first and second order, r and L are respectively the radiusand the average depth of holes. As a first approximation, dif-fraction effects can be neglected if the hole diameter is largerthan the considered wavelengths (2pr2 � kL). Mathemati-cally, this implies that these two Bessel functions tend to zero,so that the transmittance for the porous part of the filter can besummarised in one term of porosity P. The rest of the filter,non-porous, retains the inherent transmittance of the originalmaterial, that is, Tmaterial. The transfer function, F, the systemfilter and detector, D, can be written as
F ¼ ½P þ ð1� P ÞT material� � D: ð2Þ
We then use a radiometric model (BenMoussa et al. 2009b)based on the solar spectral irradiance measured by TIMED/SEE, SORCE/SOLSTICE and SIM/SOLSTICE to assess thespectral transmittance of such porous filters associated eitherwith diamond or silicon detectors. Figure 1 displays the totalresponse (filter + detector) for different porosity levels of analuminium filter. The solar spectrum is also displayed inFigure 1 in order to show the ratio of about 4–5 orders of mag-nitude between the irradiance as seen in the visible compared tothe one observed in the EUV. For relatively high levels (e.g.,P = 0.01), the contribution of the visible is nearly of the sameorder of magnitude for both cases than the nominal spectralband (between 17 and 80 nm).
From this, we can also define the purity of a signal as theratio between the one obtained with the non-porous filter to thatobtained with a porous one. As summarised in Table 1, the pur-ity decreases drastically for silicon detectors according to theporosity levels. For porosity levels of about P = 10�4, the sig-nal variability is similar to that of visible radiation in the case ofsilicon, while nearly 89% of the signal can always be attributedto the UV spectral range in the case of diamond detectors.However, for higher porosity, the contribution of the UV signalis drowned in that of the visible regardless of the nature of the2 See, for example, http://bold.oma.be
G. Cessateur et al.: New observation strategies for the solar UV spectral irradiance
A16-p3
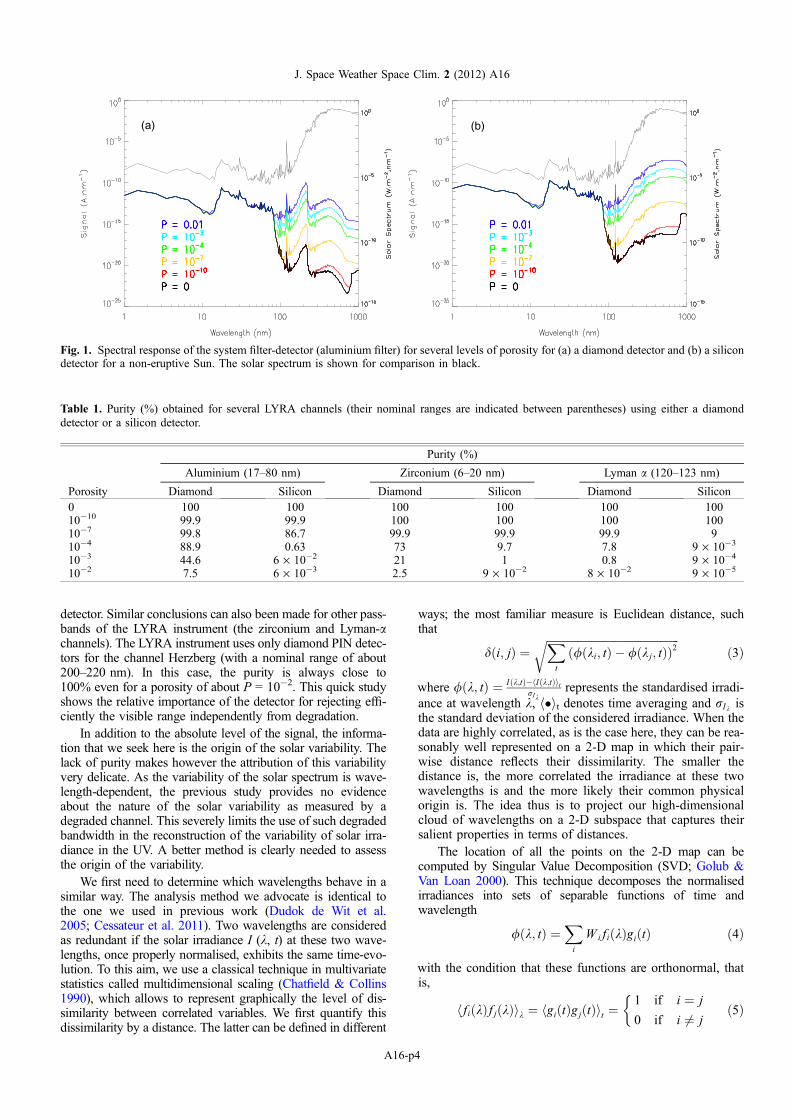
detector. Similar conclusions can also been made for other pass-bands of the LYRA instrument (the zirconium and Lyman-achannels). The LYRA instrument uses only diamond PIN detec-tors for the channel Herzberg (with a nominal range of about200–220 nm). In this case, the purity is always close to100% even for a porosity of about P = 10�2. This quick studyshows the relative importance of the detector for rejecting effi-ciently the visible range independently from degradation.
In addition to the absolute level of the signal, the informa-tion that we seek here is the origin of the solar variability. Thelack of purity makes however the attribution of this variabilityvery delicate. As the variability of the solar spectrum is wave-length-dependent, the previous study provides no evidenceabout the nature of the solar variability as measured by adegraded channel. This severely limits the use of such degradedbandwidth in the reconstruction of the variability of solar irra-diance in the UV. A better method is clearly needed to assessthe origin of the variability.
We first need to determine which wavelengths behave in asimilar way. The analysis method we advocate is identical tothe one we used in previous work (Dudok de Wit et al.2005; Cessateur et al. 2011). Two wavelengths are consideredas redundant if the solar irradiance I (k, t) at these two wave-lengths, once properly normalised, exhibits the same time-evo-lution. To this aim, we use a classical technique in multivariatestatistics called multidimensional scaling (Chatfield & Collins1990), which allows to represent graphically the level of dis-similarity between correlated variables. We first quantify thisdissimilarity by a distance. The latter can be defined in different
ways; the most familiar measure is Euclidean distance, suchthat
dði; jÞ ¼ffiffiffiffiffiffiffiffiffiffiffiffiffiffiffiffiffiffiffiffiffiffiffiffiffiffiffiffiffiffiffiffiffiffiffiffiffiffiffiffiffiffiffiffiffiffiffiffiX
t
ð/ðki; tÞ � /ðkj; tÞÞ2r
ð3Þ
where /ðk; tÞ ¼ Iðk;tÞ�hIðk;tÞitrIk
represents the standardised irradi-ance at wavelength k, h�it denotes time averaging and rIk isthe standard deviation of the considered irradiance. When thedata are highly correlated, as is the case here, they can be rea-sonably well represented on a 2-D map in which their pair-wise distance reflects their dissimilarity. The smaller thedistance is, the more correlated the irradiance at these twowavelengths is and the more likely their common physicalorigin is. The idea thus is to project our high-dimensionalcloud of wavelengths on a 2-D subspace that captures theirsalient properties in terms of distances.
The location of all the points on the 2-D map can becomputed by Singular Value Decomposition (SVD; Golub &Van Loan 2000). This technique decomposes the normalisedirradiances into sets of separable functions of time andwavelength
/ðk; tÞ ¼X
i
W ifiðkÞgiðtÞ ð4Þ
with the condition that these functions are orthonormal, thatis,
hfiðkÞfjðkÞik ¼ hgiðtÞgjðtÞit ¼1 if i ¼ j
0 if i 6¼ j
ð5Þ
(a) (b)
Fig. 1. Spectral response of the system filter-detector (aluminium filter) for several levels of porosity for (a) a diamond detector and (b) a silicondetector for a non-eruptive Sun. The solar spectrum is shown for comparison in black.
Table 1. Purity (%) obtained for several LYRA channels (their nominal ranges are indicated between parentheses) using either a diamonddetector or a silicon detector.
Purity (%)
Aluminium (17–80 nm) Zirconium (6–20 nm) Lyman a (120–123 nm)
Porosity Diamond Silicon Diamond Silicon Diamond Silicon
0 100 100 100 100 100 10010�10 99.9 99.9 100 100 100 10010�7 99.8 86.7 99.9 99.9 99.9 910�4 88.9 0.63 73 9.7 7.8 9 · 10�3
10�3 44.6 6 · 10�2 21 1 0.8 9 · 10�4
10�2 7.5 6 · 10�3 2.5 9 · 10�2 8 · 10�2 9 · 10�5
J. Space Weather Space Clim. 2 (2012) A16
A16-p4
Each squaredweightW 2i represents the amount of variance that is
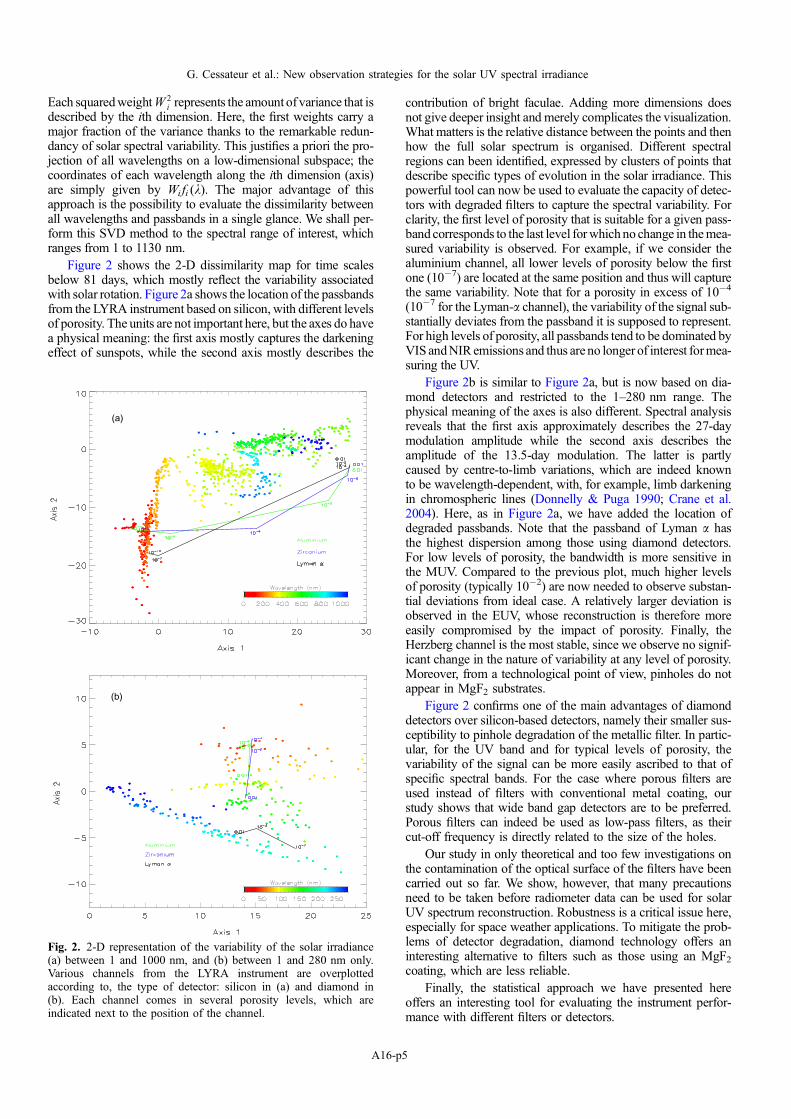
described by the ith dimension. Here, the first weights carry amajor fraction of the variance thanks to the remarkable redun-dancy of solar spectral variability. This justifies a priori the pro-jection of all wavelengths on a low-dimensional subspace; thecoordinates of each wavelength along the ith dimension (axis)are simply given by Wifi (k). The major advantage of thisapproach is the possibility to evaluate the dissimilarity betweenall wavelengths and passbands in a single glance. We shall per-form this SVD method to the spectral range of interest, whichranges from 1 to 1130 nm.
Figure 2 shows the 2-D dissimilarity map for time scalesbelow 81 days, which mostly reflect the variability associatedwith solar rotation. Figure 2a shows the location of the passbandsfrom the LYRA instrument based on silicon, with different levelsof porosity. The units are not important here, but the axes do havea physical meaning: the first axis mostly captures the darkeningeffect of sunspots, while the second axis mostly describes the
contribution of bright faculae. Adding more dimensions doesnot give deeper insight and merely complicates the visualization.What matters is the relative distance between the points and thenhow the full solar spectrum is organised. Different spectralregions can been identified, expressed by clusters of points thatdescribe specific types of evolution in the solar irradiance. Thispowerful tool can now be used to evaluate the capacity of detec-tors with degraded filters to capture the spectral variability. Forclarity, the first level of porosity that is suitable for a given pass-band corresponds to the last level forwhichno change in themea-sured variability is observed. For example, if we consider thealuminium channel, all lower levels of porosity below the firstone (10�7) are located at the same position and thus will capturethe same variability. Note that for a porosity in excess of 10�4
(10�7 for the Lyman-a channel), the variability of the signal sub-stantially deviates from the passband it is supposed to represent.For high levels of porosity, all passbands tend to be dominated byVIS andNIRemissions and thus are no longer of interest formea-suring the UV.
Figure 2b is similar to Figure 2a, but is now based on dia-mond detectors and restricted to the 1–280 nm range. Thephysical meaning of the axes is also different. Spectral analysisreveals that the first axis approximately describes the 27-daymodulation amplitude while the second axis describes theamplitude of the 13.5-day modulation. The latter is partlycaused by centre-to-limb variations, which are indeed knownto be wavelength-dependent, with, for example, limb darkeningin chromospheric lines (Donnelly & Puga 1990; Crane et al.2004). Here, as in Figure 2a, we have added the location ofdegraded passbands. Note that the passband of Lyman a hasthe highest dispersion among those using diamond detectors.For low levels of porosity, the bandwidth is more sensitive inthe MUV. Compared to the previous plot, much higher levelsof porosity (typically 10�2) are now needed to observe substan-tial deviations from ideal case. A relatively larger deviation isobserved in the EUV, whose reconstruction is therefore moreeasily compromised by the impact of porosity. Finally, theHerzberg channel is the most stable, since we observe no signif-icant change in the nature of variability at any level of porosity.Moreover, from a technological point of view, pinholes do notappear in MgF2 substrates.
Figure 2 confirms one of the main advantages of diamonddetectors over silicon-based detectors, namely their smaller sus-ceptibility to pinhole degradation of the metallic filter. In partic-ular, for the UV band and for typical levels of porosity, thevariability of the signal can be more easily ascribed to that ofspecific spectral bands. For the case where porous filters areused instead of filters with conventional metal coating, ourstudy shows that wide band gap detectors are to be preferred.Porous filters can indeed be used as low-pass filters, as theircut-off frequency is directly related to the size of the holes.
Our study in only theoretical and too few investigations onthe contamination of the optical surface of the filters have beencarried out so far. We show, however, that many precautionsneed to be taken before radiometer data can be used for solarUV spectrum reconstruction. Robustness is a critical issue here,especially for space weather applications. To mitigate the prob-lems of detector degradation, diamond technology offers aninteresting alternative to filters such as those using an MgF2coating, which are less reliable.
Finally, the statistical approach we have presented hereoffers an interesting tool for evaluating the instrument perfor-mance with different filters or detectors.
(b)
(a)
Fig. 2. 2-D representation of the variability of the solar irradiance(a) between 1 and 1000 nm, and (b) between 1 and 280 nm only.Various channels from the LYRA instrument are overplottedaccording to, the type of detector: silicon in (a) and diamond in(b). Each channel comes in several porosity levels, which areindicated next to the position of the channel.
G. Cessateur et al.: New observation strategies for the solar UV spectral irradiance
A16-p5
3. Which instrument for the future?
The motivation of our study was to investigate new ideas forfuture radiometers for solar UV monitoring. Future studies willhelp narrow down their technical constraints. Meanwhile, theremarkable properties of wide band gap materials lead us topropose a new instrumental concept that relies on filterlessdetectors. Using different detector architectures and differentmaterials, we are able to select theoretically spectral ranges thatare adequate for reconstructing the salient features of the solarspectral irradiance in the UV. Table 2 summarises the detectorsand their respective spectral ranges we consider in the follow-ing. It is important to note that the definition of such spectralranges is based on the intrinsic properties of the wide bandgap materials only. We consider four detectors without front fil-ter for the FUV and MUV ranges; two detectors using cBN(with a cut-off wavelength around 193 nm) are indeed dedi-cated to the FUV range. Two different architectures are avail-able, MSM or PIN, which select the different spectral bands,as explained by BenMoussa et al. (2006).
For the MUV range, we consider a new detector architecturethat selects the required passbands by using different materials:aluminium nitride (AlN) and gallium nitride (GaN) with a differ-ent stoichiometry (Saito et al. 2009). Because of the particulararchitecture, no additional windows on the detectors need tobe considered for limiting the short wavelength contribution.For the 210–230 nm range, we could also use a diamond detec-tor with a PIN architecture. Wide band gap materials technolo-gies, such as boron nitride (BN), are not mature yet and severalissues such as the doping process are still being investigated. Toinfer the variability of the EUV range, however, front filters areneeded because no semiconductors have their gap energy in theEUV range. We consider here aluminium filters, which havealready been used for the LYRA instrument (150 nm thick).The use of wide-band gap materials instead of Si allows us toreduce the thickness of such metallic filters.
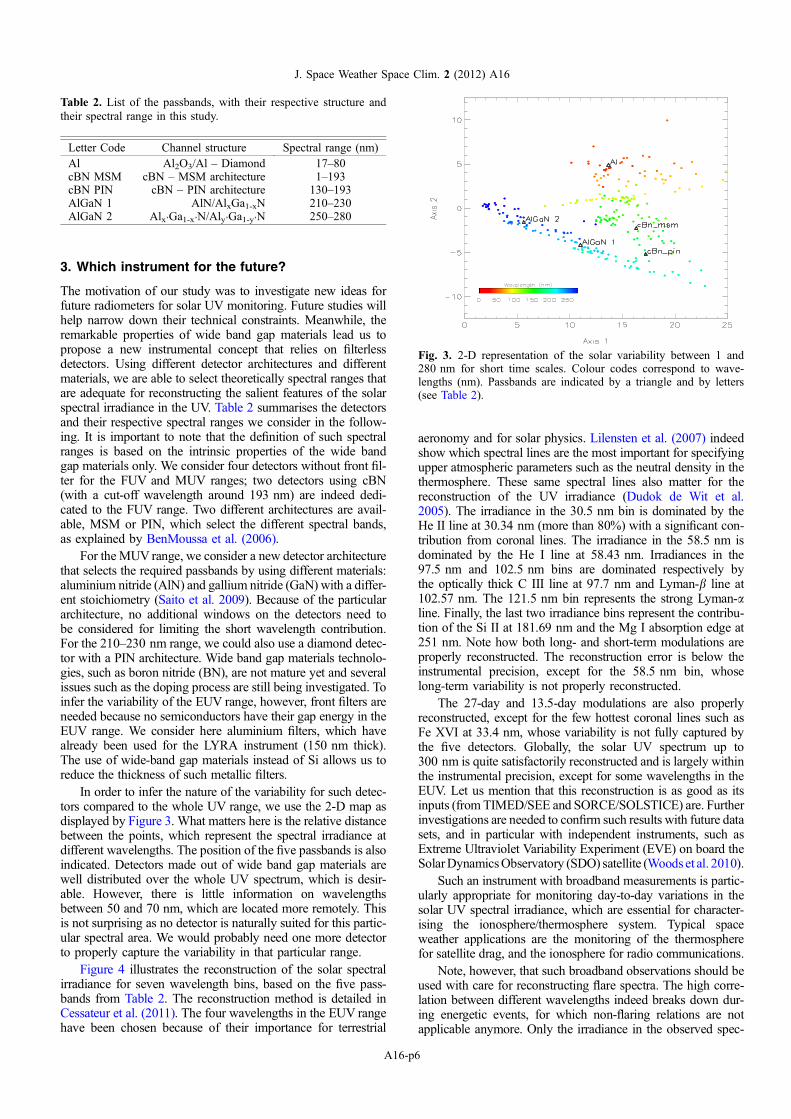
In order to infer the nature of the variability for such detec-tors compared to the whole UV range, we use the 2-D map asdisplayed by Figure 3. What matters here is the relative distancebetween the points, which represent the spectral irradiance atdifferent wavelengths. The position of the five passbands is alsoindicated. Detectors made out of wide band gap materials arewell distributed over the whole UV spectrum, which is desir-able. However, there is little information on wavelengthsbetween 50 and 70 nm, which are located more remotely. Thisis not surprising as no detector is naturally suited for this partic-ular spectral area. We would probably need one more detectorto properly capture the variability in that particular range.
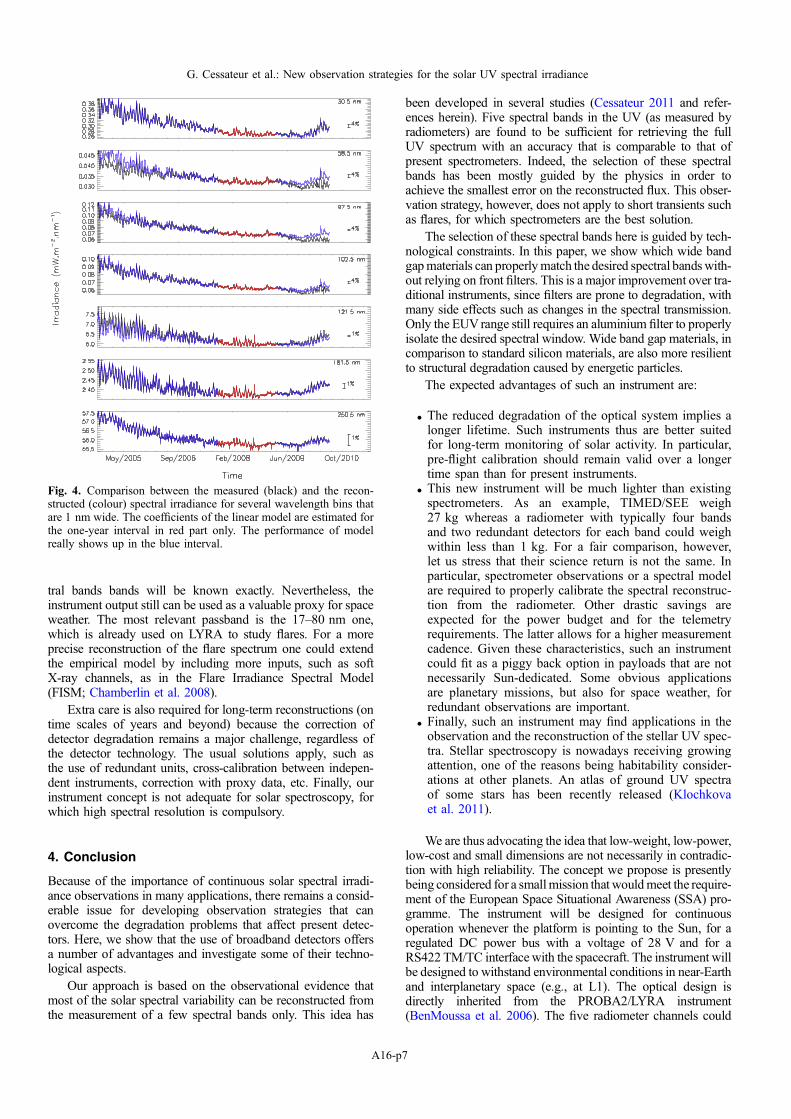
Figure 4 illustrates the reconstruction of the solar spectralirradiance for seven wavelength bins, based on the five pass-bands from Table 2. The reconstruction method is detailed inCessateur et al. (2011). The four wavelengths in the EUV rangehave been chosen because of their importance for terrestrial
aeronomy and for solar physics. Lilensten et al. (2007) indeedshow which spectral lines are the most important for specifyingupper atmospheric parameters such as the neutral density in thethermosphere. These same spectral lines also matter for thereconstruction of the UV irradiance (Dudok de Wit et al.2005). The irradiance in the 30.5 nm bin is dominated by theHe II line at 30.34 nm (more than 80%) with a significant con-tribution from coronal lines. The irradiance in the 58.5 nm isdominated by the He I line at 58.43 nm. Irradiances in the97.5 nm and 102.5 nm bins are dominated respectively bythe optically thick C III line at 97.7 nm and Lyman-b line at102.57 nm. The 121.5 nm bin represents the strong Lyman-aline. Finally, the last two irradiance bins represent the contribu-tion of the Si II at 181.69 nm and the Mg I absorption edge at251 nm. Note how both long- and short-term modulations areproperly reconstructed. The reconstruction error is below theinstrumental precision, except for the 58.5 nm bin, whoselong-term variability is not properly reconstructed.
The 27-day and 13.5-day modulations are also properlyreconstructed, except for the few hottest coronal lines such asFe XVI at 33.4 nm, whose variability is not fully captured bythe five detectors. Globally, the solar UV spectrum up to300 nm is quite satisfactorily reconstructed and is largely withinthe instrumental precision, except for some wavelengths in theEUV. Let us mention that this reconstruction is as good as itsinputs (from TIMED/SEE and SORCE/SOLSTICE) are. Furtherinvestigations are needed to confirm such results with future datasets, and in particular with independent instruments, such asExtreme Ultraviolet Variability Experiment (EVE) on board theSolarDynamicsObservatory (SDO) satellite (Woods et al. 2010).
Such an instrument with broadband measurements is partic-ularly appropriate for monitoring day-to-day variations in thesolar UV spectral irradiance, which are essential for character-ising the ionosphere/thermosphere system. Typical spaceweather applications are the monitoring of the thermospherefor satellite drag, and the ionosphere for radio communications.
Note, however, that such broadband observations should beused with care for reconstructing flare spectra. The high corre-lation between different wavelengths indeed breaks down dur-ing energetic events, for which non-flaring relations are notapplicable anymore. Only the irradiance in the observed spec-
Table 2. List of the passbands, with their respective structure andtheir spectral range in this study.
Letter Code Channel structure Spectral range (nm)
Al Al2O3/Al – Diamond 17–80cBN MSM cBN – MSM architecture 1–193cBN PIN cBN – PIN architecture 130–193AlGaN 1 AlN/AlxGa1-xN 210–230AlGaN 2 Alx’Ga1-x’N/Aly’Ga1-y’N 250–280
Fig. 3. 2-D representation of the solar variability between 1 and280 nm for short time scales. Colour codes correspond to wave-lengths (nm). Passbands are indicated by a triangle and by letters(see Table 2).
J. Space Weather Space Clim. 2 (2012) A16
A16-p6
tral bands bands will be known exactly. Nevertheless, theinstrument output still can be used as a valuable proxy for spaceweather. The most relevant passband is the 17–80 nm one,which is already used on LYRA to study flares. For a moreprecise reconstruction of the flare spectrum one could extendthe empirical model by including more inputs, such as softX-ray channels, as in the Flare Irradiance Spectral Model(FISM; Chamberlin et al. 2008).
Extra care is also required for long-term reconstructions (ontime scales of years and beyond) because the correction ofdetector degradation remains a major challenge, regardless ofthe detector technology. The usual solutions apply, such asthe use of redundant units, cross-calibration between indepen-dent instruments, correction with proxy data, etc. Finally, ourinstrument concept is not adequate for solar spectroscopy, forwhich high spectral resolution is compulsory.
4. Conclusion
Because of the importance of continuous solar spectral irradi-ance observations in many applications, there remains a consid-erable issue for developing observation strategies that canovercome the degradation problems that affect present detec-tors. Here, we show that the use of broadband detectors offersa number of advantages and investigate some of their techno-logical aspects.
Our approach is based on the observational evidence thatmost of the solar spectral variability can be reconstructed fromthe measurement of a few spectral bands only. This idea has
been developed in several studies (Cessateur 2011 and refer-ences herein). Five spectral bands in the UV (as measured byradiometers) are found to be sufficient for retrieving the fullUV spectrum with an accuracy that is comparable to that ofpresent spectrometers. Indeed, the selection of these spectralbands has been mostly guided by the physics in order toachieve the smallest error on the reconstructed flux. This obser-vation strategy, however, does not apply to short transients suchas flares, for which spectrometers are the best solution.
The selection of these spectral bands here is guided by tech-nological constraints. In this paper, we show which wide bandgapmaterials can properlymatch the desired spectral bandswith-out relying on front filters. This is a major improvement over tra-ditional instruments, since filters are prone to degradation, withmany side effects such as changes in the spectral transmission.Only the EUVrange still requires an aluminium filter to properlyisolate the desired spectral window. Wide band gap materials, incomparison to standard silicon materials, are also more resilientto structural degradation caused by energetic particles.
The expected advantages of such an instrument are:
d The reduced degradation of the optical system implies alonger lifetime. Such instruments thus are better suitedfor long-term monitoring of solar activity. In particular,pre-flight calibration should remain valid over a longertime span than for present instruments.
d This new instrument will be much lighter than existingspectrometers. As an example, TIMED/SEE weigh27 kg whereas a radiometer with typically four bandsand two redundant detectors for each band could weighwithin less than 1 kg. For a fair comparison, however,let us stress that their science return is not the same. Inparticular, spectrometer observations or a spectral modelare required to properly calibrate the spectral reconstruc-tion from the radiometer. Other drastic savings areexpected for the power budget and for the telemetryrequirements. The latter allows for a higher measurementcadence. Given these characteristics, such an instrumentcould fit as a piggy back option in payloads that are notnecessarily Sun-dedicated. Some obvious applicationsare planetary missions, but also for space weather, forredundant observations are important.
d Finally, such an instrument may find applications in theobservation and the reconstruction of the stellar UV spec-tra. Stellar spectroscopy is nowadays receiving growingattention, one of the reasons being habitability consider-ations at other planets. An atlas of ground UV spectraof some stars has been recently released (Klochkovaet al. 2011).
We are thus advocating the idea that low-weight, low-power,low-cost and small dimensions are not necessarily in contradic-tion with high reliability. The concept we propose is presentlybeing considered for a smallmission that wouldmeet the require-ment of the European Space Situational Awareness (SSA) pro-gramme. The instrument will be designed for continuousoperation whenever the platform is pointing to the Sun, for aregulated DC power bus with a voltage of 28 V and for aRS422 TM/TC interface with the spacecraft. The instrument willbe designed to withstand environmental conditions in near-Earthand interplanetary space (e.g., at L1). The optical design isdirectly inherited from the PROBA2/LYRA instrument(BenMoussa et al. 2006). The five radiometer channels could
Fig. 4. Comparison between the measured (black) and the recon-structed (colour) spectral irradiance for several wavelength bins thatare 1 nm wide. The coefficients of the linear model are estimated forthe one-year interval in red part only. The performance of modelreally shows up in the blue interval.
G. Cessateur et al.: New observation strategies for the solar UV spectral irradiance
A16-p7
be mounted in a common structure allowing co-alignment. Ineach of these channels, the solar flux will be collected throughan entrance aperture and a pinhole onto a photodiode detectorwhose current is converted into a voltage and digitised by anA/D converter. For each channel, the resulting signal is propor-tional to the exposure time and to the solar flux correspondingto the viewing angle in the given passband. All the mechanicalparts should be made of Al alloy as homothetic dilation can beconsidered in case of thermo-elastic deformations. The field-of-view should be large enough to allow all solar prominences tobe covered. Internal calibration sources (LEDs) are used to assessthe sensor (visible rejection, UV sensitivity) over time. To ensurestability of the photodiode response and electronics (amplifiers),a controlled heater will be used to stabilise the temperature a fewdegrees above that of the environment.
This layout could be further detailed but the instrument willbe designed to be as flexible and autonomous as possible. Itwill accommodate (as a piggy back configuration) availableresources and environment driven by the primary payload mis-sion and the spacecraft. The total mass, with five channels,should not exceed 1.5 kg, with an objective of 1.0 kg. The pre-liminary power budget should be less than 1.5 W. These valuesare estimated from our heritage with similar instruments (in par-ticular LYRA). LYRAweighs 3.53 kg (total weight per channelis 295 g) and measures 315 mm · 92.5 mm · 222 mm.LYRA contains all electronics necessary to control all twelvechannels and all three protective covers including the lockingmechanism. The average power consumption of LYRA is3.2 W (0.27 W per channel). Concerning board processing,several concepts developed for LYRA will be probably reusedif they make sense, such as storage management, data prioriti-sation and data compression algorithms.
Our instrumental concept also has several limitations. First ofall, it is not suitable for solar spectroscopy. A second limitation isthe lack of technological testing, even though the experiencegathered from the PROBA2/LYRA and PICARD/PREMOSinstruments confirms that the concept works. It is likely, though,that newproblemswill showup during the research and develop-ment phase, and during operation. Let us mention, for example,the problem of the cBN doping, which needs further investiga-tion. The spectral window of such new detectors, as presentedby Saito et al. (2009), is also extremely temperature-dependent.Finally, we are still lacking a complete end-to-end test of theirdegradation. And, not least, let us mention the ubiquitous prob-lem of hydrocarbon contamination, which has not beenaddressed here, and presently can be handled only by a drasticcontrol of spacecraft cleanliness. Indeed, the polluted environ-ment of the spacecraft, which alter the filters, may certainly alterthe detectors, now unprotected by front filters. Further investiga-tions on this particular issue are a high priority. Redundant obser-vations measurements may partly help overcome some of theseproblems. We are nevertheless convinced that the present studyis an important and necessary step towards the definition of futureinstruments for SSA programmes.
Acknowledgements. This study received funding from the EuropeanCommunity’s Seventh Framework Programme (FP7/2007-2013) un-der the Grant Agreement No. 218816 (SOTERIA project, www.so-teria-space.eu) and grant agreement eHeroes (Project No. 284461,www.eheroes.eu). This study received was also supported by theSwiss National Science Foundation under grant 200020_130102.The authors would like to thank two anonymous referees for com-ments and suggestions which helped improve this paper.
References
Adam, W., E. Berdermann, P. Bergonzo, W. de Boer, F. Bogani,et al., New developments in CVD diamond for detector applica-tions, Eur. Phys. J. C – Part. Fields, 33, s1014–s1016,DOI: 10.1140/epjcd/s2004-03-1798-6, 2004.
Amblard, P.-O., S. Moussaoui, T. Dudok de Wit, J. Aboudarham, M.Kretzschmar, J. Lilensten, and F. Auchere, The EUV Sun as thesuperposition of elementary Suns, A&A, 487, L13–L16, 2008.
Auchere, F., J. Rizzi, A. Philippon, and P. Rochus, Minimization ofthe shadow patterns produced by periodic mesh grids in extremeultraviolet telescopes, J. Opt. Soc. Am. A, 28, 40–45, 2011.
Balducci, A., M. Marinelli, E. Milani, M.E. Morgada,A. Tucciarone, G. Verona-Rinati, M. Angelone, and M. Pillon,Extreme ultraviolet single-crystal diamond detectors by chemicalvapor deposition, Appl. Phys. Lett., 86 (19), 193509, 2005.
Beniguel, Y., and P. Hamel, A global ionosphere scintillationpropagation model for equatorial regions, J. Space Weather SpaceClim., 1, A04, 2006.
BenMoussa, A., J.F. Hochedez, U. Schuhle, W. Schmutz, K.Haenen, et al., Diamond detectors for LYRA, the solar VUVradiometer on board PROBA2, Diamond Rel. Mater., 15 (48),802–806, 2006.
BenMoussa, A., J.F. Hochedez, R. Dahal, J. Li, J.Y. Lin, H.X. Jiang,A. Soltani, J.-C. De Jaeger, U. Kroth, and M. Richter, Charac-terization of AlN metal-semiconductor-metal diodes in thespectral range of 44–360 nm: photoemission assessments, Appl.Phys. Lett., 92 (2), 022108, 2008.
BenMoussa, A., A. Soltani, U. Schuhle, K. Haenen, Y.M. Chong,et al., Recent developments of wide-bandgap semiconductorbased UV sensors, Diamond Rel. Mater., 18 (5–8), 864,Proceedings of Diamond 2008, the 19th European Conferenceon Diamond, Diamond-Like Materials, Carbon Nanotubes,Nitrides and Silicon Carbide, 2009a.
BenMoussa, A., I.E. Dammasch, J.-F. Hochedez, U. Schuhle, S.Koller, et al., Pre-flight calibration of LYRA, the solar VUVradiometer on board PROBA2, A&A, 508, 1085–1094, 2009b.
Butun, S., T. Tut, B. Butun, M. Gokkavas, H. Yu, and E. Ozbay,Deep-ultraviolet Al0.75Ga0.25N photodiodes with low cutoffwavelength, Appl. Phys. Lett., 88 (12), 123503, 2006.
Cessateur, G., Reconstruction du spectre UV solaire en vue de lacaracterisation des environnements planetaires, Ph.D. thesis,Universite d’Orleans, 2011, October [in French].
Cessateur, G., T. Dudok de Wit, M. Kretzschmar, J. Lilensten, J.-F.Hochedez, and M. Snow, Monitoring the solar UV irradiancespectrum from the observation of a few passbands, A&A, 528,A68+, 2011.
Chamberlin, P.C., T.N. Woods, and F.G. Eparvier, Flare irradiancespectral model (FISM): Flare component algorithms and results,Space Weather, 6, 5001+, 2008.
Chatfield, C., and A.J. Collins, Introduction to Multivariate Analysis,Chapman and Hall, London, 1990.
Crane, P.C., L.E. Floyd, J.W. Cook, L.C. Herring, E.H. Avrett, andD.K. Prinz, The center-to-limb behavior of solar active regions atultraviolet wavelengths, A&A, 419, 735–746, 2004.
Dahal, R., T.M. Tahtamouni Al, Z.Y. Fan, J.Y. Lin, and H.X. Jiang,Hybrid AlN-SiC deep ultraviolet Schottky barrier photodetectors,Appl. Phy. Lett., 90 (26), 263505, 2007.
Domingo, V., I. Ermolli, P. Fox, C. Frohlich, M. Haberreiter, et al.,Solar surface magnetism and irradiance on time scales fromdays to the 11-year cycle, Space Sci. Rev., 145, 337–380,2009.
Dominique, M., A.V. Mitrofanov, J.-F. Hochedez, P. Yu. Apel, U.Schuhle, et al., Track membranes with open pores used asdiffractive filters for space-based x-ray and EUV solar observa-tions, Appl. Opt., 48 (5), 834–841, 2009.
Dominique, M., J.-F. Hochedez, W. Schmutz, I.E. Dammasch, A.I.Shapiro, M.A. Kretzschmar, D. Benmoussa Gillotay, and Y.Stockman, The LYRA instrument on-board PROBA2: descriptionand in-flight performances, Sol. Phys., Submitted, 2012.
J. Space Weather Space Clim. 2 (2012) A16
A16-p8
Donnelly, R.F., and L.C. Puga, Thirteen-day periodicity and thecenter-to-limb dependence of UV, EUV, and X-ray emission ofsolar activity, 130, 369–390, 1990.
Dudok de Wit, T., J. Lilensten, J. Aboudarham, P.-O. Amblard, andM. Kretzschmar, Retrieving the solar EUV spectrum from areduced set of spectral lines, Ann. Geophys., 23, 3055–3069,2005.
Dudok de Wit, T., M. Kretzschmar, J. Lilensten, and T. Woods,Finding the best proxies for the solar UV irradiance, Geophys.Res. Lett., 36, 10107+, 2009.
Floyd, L., Filter responsivity degradation caused by solar UVexposure, Adv. Space Res., 23, 1459–1462, 1999.
Floyd, L., J. Newmark, J. Cook, L. Herring, and D. McMullin, SolarEUVand UV spectral irradiances and solar indices, J. Atmos. Sol.-Terr. Phys., 67, 3–15, 2005.
Fox, N., A. Kaiser-Weiss, W. Schmutz, K. Thome, D. Young, B.Wielicki, R. Winkler, and E. Woolliams, Accurate radiometryfrom space: an essential tool for climate studies, Phil. Trans. R.Soc. A: Math. Phys. Eng. Sci., 369 (1953), 4028–4063, 2011.
Golub, G.H., and C.F. Van Loan, Matrix Computations, JohnsHopkins Press, Baltimore, 2000.
Haigh, J.D., A.R. Winning, R. Toumi, and J.W. Harder, An influenceof solar spectral variations on radiative forcing of climate, Nature,467, 696–699, 2010.
Heath, D.F., and B.M. Schlesinger, The Mg 280-nm doublet as amonitor of changes in solar ultraviolet irradiance, J. Geophys.Res., 91, 8672–8682, 1986.
Hinteregger, H.E., Representations of solar EUV fluxes for aero-nomical applications, Adv. Space Res., 1, 39–52, 1981.
Hochedez, J.-F., W. Schmutz, Y. Stockman, U. Schuhle, A.Benmoussa, et al., LYRA, a solar UV radiometer on Proba2,Adv. Space Res., 37, 303–312, 2006.
Keister, J.W., and J. Smedley, Single crystal diamond photodiode forsoft X-ray radiometry, Nucl. Instrum. Methods Phys. Res., A:Accel. Spectrom. Detect. Assoc. Equip., 606 (3), 774–779,2009.
Klochkova, V.G., E.L. Chentsov, T. Kipper, V.E. Panchuk, N.S.Tavolganskaya, and M.V. Yushkin, An atlas of ground UV spectraof selected stars, Astrophys. Space Sci., 335, 83–89, 2011.
Kretzschmar, M., J. Lilensten, and J. Aboudarham, Variability of theEUV quiet Sun emission and reference spectrum using SUMER,A&A, 419, 345–356, 2004.
Kretzschmar, M., J. Lilensten, and J. Aboudarham, Retrieving thesolar EUV spectral irradiance from the observation of 6 lines, Adv.Space Res., 37, 341–346, 2006.
Kretzschmar, M., T. Dudok de Wit, J. Lilensten, J.-F. Hochedez, J.Aboudarham, P.-O. Amblard, F. Auchere, and S. Moussaoui,Solar EUV/FUV irradiance variations: analysis and observationalstrategy, Acta Geophys., 57, 42–51, 2008.
Krivova, N.A., and S.K. Solanki, Models of solar irradiancevariations: current status, J. Astrophys. Astron., 29, 151–158, 2008.
Lean, J.L., H.P. Warren, J.T. Mariska, and J. Bishop, A new model ofsolar EUV irradiance variability 2. Comparisons with empiricalmodels and observations and implications for space weather,J. Geophys. Res. (Space Phys.), 108, 1059+, 2003.
Lean, J.L., T.N. Woods, F.G. Eparvier, R.R. Meier, D.J. Strickland,J.T. Correira, and J.S. Evans, Solar extreme ultraviolet irradiance:present, past, and future, J. Geophys. Res. (Space Phys.), 116,A01102, 2011.
Li, J., Z.Y. Fan, R. Dahal, M.L Nakarmi, J.Y. Lin, and H.X. Jiang,200 nm deep ultraviolet photodetectors based on AlN, Appl.Phys. Lett., 89 (21), 213510, 2006.
Liao, M., Y. Koide, and J. Alvarez, Single Schottky-barrierphotodiode with interdigitated-finger geometry: Application todiamond, Appl. Phys. Lett., 90 (12), 123507, 2007.
Lilensten, J., T. Dudok de Wit, P.-O. Amblard, J. Aboudarham, F.Auchere, and M. Kretzschmar, Recommendation for a set of solarEUV lines to be monitored for aeronomy applications, Ann.Geophys., 25 (6), 1299–1310, 2007.
Lilensten, J., T. Dudok de Wit, M. Kretzschmar, P.-O. Amblard, S.Moussaoui, J. Aboudarham, and F. Auchere, Review on the solarspectral variability in the EUV for space weather purposes, Ann.Geophys., 26, 269–279, 2008.
Mikhailov, A.V, A. Belehaki, L. Perrone, B. Zolesi, and I. Tsagouri,Retrieval of thermospheric parameters from routine ionosphericobservations: assessment of method’s performance at mid-latitudes daytime hours, J. Space Weather Space Clim., 2, A03,2012.
Monroy, E., F. Calle, E. Muoz, F. Omns, B. Beaumont, and P. Gibart,Visible-blindness in photoconductive and photovoltaic AlGaNultraviolet detectors, J. Electron. Mater., 28, 240–245,DOI: 10.1007/s11664-999-0021-2, 1999.
Nesladek, M., Conventional n-type doping in diamond: state of theart and recent progress, Semicond. Sci. Technol., 20 (2), R19,2005.
Osantowski, J.F., R.A.M. Keski-Kuha, H. Herzig, A.R. Toft, J.S.Gum, and C.M. Fleetwood, Optical coating technology for theEUV, Adv. Space Res., 11, 185–201, 1991.
Podladchikova, T., and R. Van der Linden, An upper limit predictionof the peak sunspot number for solar cycle 24, J. Space WeatherSpace Clim., 1, A01, 2011.
Richards, P.G., J.A. Fennelly, and D.G. Torr, EUVAC: a solar EUVflux model for aeronomic calculations, J. Geophys. Res., 99,8981–8992, 1994.
Richards, P.G., T.N. Woods, and W.K. Peterson, HEUVAC: A newhigh resolution solar EUV proxy model, Adv. Space Res., 37,315–322, 2006.
Rottman, G., The SORCE mission, Sol. Phys., 230, 7–25, 2005.Saito, T., K. Hayashi, H. Ishihara, and I. Saito, Characterization of
photoconductive diamond detectors as a candidate of FUV/VUVtransfer standard detectors, Metrologia, 43 (2), S51, 2006.
Saito, T., T. Hitora, H. Hitora, H. Kawai, I. Saito, and E. Yamaguchi,UV/VUV photodetectors using group III-nitride semiconductors,Phys. Stat. Sol. C, 6 (S2), S658–S661, 2009.
Sigernes, F., M. Dyrland, P. Brekke, S. Chernouss, D.A. Lorent-zen, K. Oksavik, and C. Sterling Deehr, Two methods toforecast auroral displays, J. Space Weather Space Clim., 1, A03,2011.
Sio, A, J. De Achard, J. De Achard, A. Tallaire, R.S. Sussmann, A.T.Collins, F. Silva, and E. Pace, Electro-optical response of a single-crystal diamond ultraviolet photoconductor in transverse config-uration, Appl. Phys. Lett., 86 (21), 213504, 2005.
Soltani, A., H.A. Barkad, M. Mattalah, B. Benbakhti, J.-C. DeJaeger, 193 nm deep-ultraviolet solar-blind cubic boron nitridebased photodetectors, Appl. Phys. Lett., 92 (5), 053501,2008.
Sou, I.K., C.W. Wu Marcus, T. Sun, K.S. Wong, and G.K.L. Wong,Molecular-beam-epitaxy-grown ZnMgS ultraviolet photodetec-tors, Appl. Phys. Lett., 78 (13), 1811–1813, 2001.
Sreeja, V., M. Aquino, B. Forte, Z. Elmas, C. Hancock, et al.,Tackling ionospheric scintillation threat to GNSS in LatinAmerica, J. Space Weather Space Clim., 1, A05, 2011.
Tapping, K.F., and B. Detracey, The origin of the 10.7 CM flux, Sol.Phys., 127, 321–332, 1990.
Tobiska, W., and A. Nusinov, ISO 21348 – process for determiningsolar irradiances, Pages 2621–+ of: 36th COSPAR ScientificAssembly, 36, COSPAR, Plenary Meeting, 2006.
Tobiska, W.K., T. Woods, F. Eparvier, R. Viereck, L. Floyd, D.Bouwer, G. Rottman, and O.R. White, The SOLAR2000empirical solar irradiance model and forecast tool, J. Atmos.Sol.-Terr. Phys., 62, 1233–1250, 2000.
Tsagouri, I., Evaluation of the performance of DIAS ionosphericforecasting models, J. Space Weather Space Clim., 1, A02,2011.
Tsurutani, B.T., O.P. Verkhoglyadova, A.J. Mannucci, G.S. Lakhina,and J.D. Huba, Extreme changes in the dayside ionosphere duringa Carrington-type magnetic storm, J. Space Weather Space Clim.,2, A05, 2012.
G. Cessateur et al.: New observation strategies for the solar UV spectral irradiance
A16-p9
Vieira, L.E., T. Dudok de Wit, and M. Kretzschmar, Short-termforecast of the total and spectral solar irradiance, J. Space WeatherSpace Clim., Submitted, 2012.
Warren, H.P., J.T. Mariska, and J. Lean, A new reference spectrumfor the EUV irradiance of the quiet Sun 1. Emission measureformulation, J. Geophys. Res., 103, 12077–12090, 1998.
Wehrli, C., C. Frohlich, and J. Romero, Space degradation of SOVAsunphotometers on EURECA, Metrologia, 32, 653–656, 1996.
Woods, T.N., F.G. Eparvier, S.M. Bailey, P.C. Chamberlin, J. Lean,G.J. Rottman, S.C. Solomon, W.K. Tobiska, and D.L. Woodraska,Solar EUV Experiment (SEE): Mission overview and first results,J. Geophys. Res. (Space Phys.), 110, 1312+, 2005.
Woods, T.N., F.G. Eparvier, R. Hock, A.R. Jones, D. Woodraska,et al., Extreme ultraviolet variability experiment (EVE) on thesolar dynamics observatory (SDO): overview of science objec-tives, instrument design, data products, and model developments,Sol. Phys., 275 (1–2), 115–143, 2010.
Worden, J.R., O.R. White, and T.N. Woods, Evolution of chromo-spheric structures derived from Ca II K spectroheliograms:implications for solar ultraviolet irradiance variability, Astrophys.J., 496, 998+, 1998.
Wright, N.G., and A.B. Horsfall, SiC sensors: a review, J. Phys. D:Appl. Phys., 40 (20), 6345, 2007.
J. Space Weather Space Clim. 2 (2012) A16
A16-p10