new measurement techniques of surface electromyographic signals in
TRANSCRIPT

26
New Measurement Techniques of Surface Electromyographic Signals in Rest Position
for Application in the Ophthalmological Field
Edoardo Fiorucci, Fabrizio Ciancetta and Annalisa Monaco Università dell’Aquila,
Italy
1. Introduction
The Stomatognatic apparatus is a component of the craniomandibular system, and it represents an entryway to external stimuli: relationship among occlusion, masticatory muscle system (Murch, 1974; Oddsson, 1989) and head posture (Barber & Sharpe, 1988) have been recently confirmed. Proprioception messages from the neck muscles are integrated in the central nervous system and contribute to control balance and body orientation. Centripetal impulses from neck proprioceptors cooperate with the labyrinth impulses to promote oculomotor muscular activity through the cervical–vestibular–ocular reflex (Ito, 1995). Some important encephalic nuclei (trigeminal nuclei, oculomotor nuclei, vestibular nuclei, accessorial nerve nuclei) are integrated in the medial longitudinal fasciculus. Ocular proprioceptive receptors send afferent signals to trigeminal and cuneate nuclei. The anatomic and physiologic links of these anatomical structures imply a co-ordinated integration of proprioceptive ocular and stomatognathic afferences. The ocular system and the stomatognathic one are anatomically and physiologically connected. Vision plays an important role in the multi-sensorial process of postural stabilisation: among visual inputs, the postural one allows to draw a moving object ocular nuclei control the eye position in the orbit; the ocular nuclei send fibers to nuclei which control neck and head movements and receive afferences from vestibular nuclei. It has been observed that a modification of ocular proprioception modifies head and body posture (Donaldson & Knox, 1991; Buisseret-Delmas & Buisseret, 1990; Schmid et al., 1981). Ocular proprioception is linked with stomatognathic muscular system: neuromuscular spindles and myotendinous receptors (Rose et al., 1991; Lukas et al., 1994; Rose & Abrahams, 1975) of extraocular muscles send afferences to trigeminal and cuneate nuclei (Porter, 1986). Moreover oculomotor, vestibular, trigeminal and accessorial nerve nuclei are connected through the medial longitudinal fasciculus. The role of trigeminal afferences on tonic-postural regulation has been underlined too (Meyer & Baron, 1976) Several studies supported anatomical linkage between stomatognathic and ocular systems. Patients with Temporomandibular disorders (TMD) and this prevalence increase in those patients with head, neck, and shoulder pain. A similar association has been found in children with a mandibular functional lateral-deviation respect to healthy subjects in
www.intechopen.com

EMG Methods for Evaluating Muscle and Nerve Function
508
pediatric age. It is also stated that in TMD subjects, head rotation (as a compensatory adjustment for the eye dominance) is significantly associated to a mandibular shifting
toward the contralateral side. These relationships, recorded by measuring transverse head postural change by means of temporary eye dominance change, have been confirmed (Lin
SY & White, 1996). Passive soft-tissue viscoelasticity and stretch reflexes in the jaw-closing muscles are involved in mandibular postural stability during locomotion as a consequence
of the influence of head support and body posture on the mandibular rest position. Relationship between oculomotors and neck cephalogyric muscles have been reported by
Meyer & Baron, 1976. These authors showed that desmodontal receptors and temporo-mandibular joint, like sternocleidomatoid, trapezius and cervical muscles are connected
with oculomotor muscles. A study confirmed that the alteration of dental occlusion can induce some fluctuations in visual focusing (Sharifi et al., 1998)
Electromyography has been widely applied to estimate oro-facial muscle function or dysfunction.
Association between EMG activity of jaw and neck muscles with TMD signs/symptoms as
well as malocclusion, parafunctions and posture has been investigated
Some works shows the effects of body position on the EMG activity of sternocleidomastoid
and masseter muscles in healthy subjects. Many sEMG studies are concerned with
functional activity, such as clenching, and few of them have studied the rest position and the
difference between the anterior temporalis sEMG in open and closed eye conditions.
Patients with myogenous facial pain show that the open eyes condition, compared with the
closed eyes one, is associated with a change in the head and neck sEMG activity in the
mandibular rest position (Monaco et al., 2010). This behaviour is not present in the healthy
control subjects. A recent study (Spadaro et al., 2010) involving young healthy subjects with
normal occlusion and without visual defects, compared the EMG values of the the anterior
temporalis area at mandible rest position, in the closed eyes and open eyes conditions: the
results showed no significant difference in the EMG values, suggesting that subjects with
class I without myogenous facial pain signs or symptoms and with clinically verified correct
vision, accept the exteroceptive visual input without an adaptive mechanism on the sEMG
pattern of the stomatognathic system.
These observations suggest that the visual input effect could be a good provocation test for
assessing a neuromuscular reply that will be more significant in neurogenic facilitation areas
(Schmid & Mongini , 1985) .
The alteration of dental occlusion can induce some fluctuations in visual focusing, and the
visual input effect on the EMG activity of Sternocleidomastoid and Masseter muscles at rest
has been proved too. The different pattern of EMG activity of anterior temporalis with
respect to masseter, sternocleidomastoid, and anterior digastric observed at rest, upon
variation in the visual input, suggests a differential innervation of stomatognathic muscles.
In fact the innervations of the sternocleidomastoid and anterior digastric muscles is
provided by spinal and hypoglossal (XI and XII) nerves, while that of masseter and anterior
temporalis muscles is provided by the trigeminal (V) nerve.
Interactions between neck and the extraocular muscles in the myopic eye have been
reported (Valentino & Fabozzo, 1993). Monaco et al., 2006 confirmed that myopic defects can
induce some alterations on EMG activity of masticatory muscles.
Nevertheless, there is a low interest about the influence of visual inputs on EMG values, as
well about the relationship between visual defects and EMG values.
www.intechopen.com

New Measurement Techniques of Surface Electromyographic Signals in Rest Position for Application in the Ophthalmological Field
509
Among the neuromuscular factors that are able to affect the EMG values of the jaw elevators, the activity of the extraocular muscles, that is explicated by the activity of anterior temporalis, could be of interest.
2. Electrical characteristics of SEMG signals in rest position
In the intramuscular EMG, the contribution of each different motor units (UM) is distinguished according to the morphology of the electrical potentials. On the contrary, in the surface EMG (SEMG), the filtering effect of human tissues drastically reduces the morphological difference between the voltages that cannot be used as a classification element. The human body is a good electrical conductor, but unfortunately the conductivity varies with tissue thickness. Because the of amplitude EMG signals is inversely proportional to the square of the distance from the source, the Ums, whose activity is possible to detect, are those located at a maximum distance of 15 mm from the electrodes. The interposed tissues can attenuate the high-frequency of component signals, and generally this mitigation is proportionally to the UM depth. Moreover, in case of size-recuded muscles, neighbouring muscles may produce a significant amount of EMG noise (crosstalk); this issue is omnipresent when dealing with SEMG signals. However, all possible efforts must be made to eliminate or reduce the presence of the crosstalk. Despite this disadvantage, the use of surface electrodes simplifies the signal pick-up, making possible to record the signals in static and dynamic conditions, such as during the execution of functional movements or exercises. The isometric activities generate electrical voltages whose root mean square (rms) values range from less than 50 μV to 20-30 mV, depending on the investigated muscle. The typical
amplitude of noise amount at 5 V rms, so the S/N is enough for the correct evaluation of the muscle activity with an acceptable accuracy (Fig. 1). The signal is generally amplified by a factor from 500 to 2000. The frequency range of a SEMG amplifier is from 10 Hz to 500 Hz. The typical repetition rate of UM firing is about 7 to 20 Hz, depending on the size of the muscle. The high frequency cut-off corresponds to the maximum frequency of the SEMG signals. Moreover, because of the movement of electrodes and cables, the low frequency components of the collected signal should be removed. The SEMG signal is filtered, to eliminate the disturbances and highlight the relevant components (e.g. a low-pass filtering to analyze low-frequency components, or a high-pass filtering to analyze high frequency components, or a notch-filtering to eliminate components at a specific band). Therefore, the signal is processed to extract the desired quantity concerning the muscular fibres. The Study of the activities of superficial muscles in rest position has been considered with scant regard, for two main reasons: i) the activity of signals is not measured with needle electrodes during rest time, with a consequently worsening in the transmission of the signal; ii) the amplitudes of the acquired electromyographic signals in rest conditions are in the
same range of the noise (1 to 5V rms), and are difficult to evaluate. Nevertheless, some interesting phenomena were observed during the application of surface electromyography in rest position (Ferrario et al., 1993; Rilo et al., 1997). For example, the records of electrical signal from the anterior temporal muscle showed different results in rest condition of the mandible, according to the open or closed eyes condition. Those signals varied by subject, but were constant for the same person, during the same recording session
www.intechopen.com

EMG Methods for Evaluating Muscle and Nerve Function
510
and without changing the recording apparatus or the electrodes themselves; furthermore, this variation was independent from the state of the eyes. In the electromyographic measurement practice, keeping open or closed the eyes is usually required for about 15 s at a time (Miralles et al., 1998; Kawamura, 1967).
Fig. 1. The amplitude of electromyographic signal during the clenching and rest time.
From the preliminary measurements, the voltage amplitude of the investigated signals seems to be related to the sequence of the open-eyes and closed-eyes conditions. The signals
appeared to be in the range of 1 to 6 V rms, comparable with the noise level, and with a frequency lower than 20 Hz. This effect of movement could not be recorded because of the band pass (20 to 500 Hz filter), usually integrated in surface electromyographic equipment. Due to the limitation of these instruments, the clinical analysis of subjects could not unequivocally highlight the real cause of the obtained results (Bucci et al., 2009; Monaco et al., 2006; Shahani, 1977; Sharifi et al., 1998). Considering that several clinical report questionated this issue, we decided to investigate the phenomenon with an ad hoc measurement station, that is capable to fully capture and analyze these signals. Briefly, the main goal of our research was the implementation and characterization of suitable measurement techniques for the identification of the biological signals, by reducing the effect of the superimposed noise without removing the signals related to non isometric muscle activities.
3. First preliminary study: evaluation of the influence of ocular defects on of the activity of stomatognatic muscles
The aim of this first preliminary study was to determine how the activity of the stomatognatic muscles is influenced by ocular defects. We expect a significant modification of SEMG values by changing visual input and visual defects. A total of 20 children aged between 7 and 13 years (mean age 9±8 months), was evaluated. In the study group 10 children with myopic defects were enlisted, selected among the patients afferent to the Pediatric Dentistry Department of the University of L’Aquila.
www.intechopen.com

New Measurement Techniques of Surface Electromyographic Signals in Rest Position for Application in the Ophthalmological Field
511
Ten subjects with normal vision, the control group, were chosen through the Pair Matching procedures, so that each myopic child had a matching age case control. All subjects were investigated by SEMG. Each subject underwent to two recordings of SEMG at rest: during the first SEMG each child was asked to keep his/her eyes closed, while during the second SEMG recordings each child was asked to keep his/her eyes open while looking straight ahead and to keep the lips in normal soft contact. The group of myopic children performed the recordings without lenses.Time for each recording was 15 seconds. Each individual was seated in a wooden chair with headrest in a comfortable stance. SEMG activity was recorded by K7 (Myotronic Inc.; Seattle,Washington, USA), using bipolar surface electrodes at single differential with interelectrode distance of 1 cm. The surface electrodes were placed with adhesive tape to the skin over the superficial masseter (LMM, RMM), anterior temporal (LTA, RTA), anterior digastric (RDA, LDA) and sternocleidomastoid (LSC, RSC) bilaterally and parallel to the muscle fibres. Eight channel surface electromyographic equipment was used (Myotronic Inc.; Seattle,Washington, USA). The obtained signals were amplified, recorded and computed using a clinical aimed software (K7- Myotronic Inc.;
Seattle,Washington, USA); the Root Mean Square (RMS), expressed in volt, was used as amplitude indicator of the signal. SEMG of the subjects was examined by the same operator without knowledge of the recording purpose. A paired t-test for independent samples was performed to obtain a comparison between mean and variance values of electromyographic data. The p value < .05 was assumed as the level of significance. To facilitate the introduction of the data in the statistic software program, all the absolute values expressed
in volt RMS were multiplied by 10. Comparison according to the age of the individuals showed no significant differences
between the groups (p > .05). Tables 1 and 2 illustrate the mean values, in volt, and standard deviations (parenthesis) of SEMG activity at rest with closed and open eyes for the anterior temporal, masseter, sternocleidomastoid and anterior digastric muscles of the children with normal vision (control group).
LTA LMM RMM RTA LSC LDA RDA RSC
Observations 10 10 10 10 10 10 10 10
Mean 17.2 13.6 14.5 17.7 23.6 24.5 32.0 24.7
SD 7.4 3.6 4.6 6.2 6.8 11.2 19.5 10.3
Table 1. Mean Value and Standard Deviation of Electromyographic Activity at Rest with closed eyes in the Stomatognatic Muscles of Control subjects.
LTA LMM RMM RTA LSC LDA RDA RSC
Observations 10 10 10 10 10 10 10 10
Mean 18.7 13.0 12.8 17.8 23.1 24.4 26.8 22.9
SD 8.6 3.8 2.5 10.2 10.2 10.7 8.5 8.5
Table 2. Mean Value and Standard Deviation of Electromyographic Activity with opened eyes in the Stomatognatic Muscles of Control Patients.
Tables 3 and 4 show the mean values and standard deviation of EMG activity at rest with closed eyes and open eyes for the anterior temporal, masseter, sternocleidomastoid and anterior digastric muscles of the children with myopic vision (study group). In myopic patients (study group) a significant difference was observed in LTA muscles.
www.intechopen.com

EMG Methods for Evaluating Muscle and Nerve Function
512
LTA LMM RMM RTA LSC LDA RDA RSC
Observations 10 10 10 10 10 10 10 10
Mean 22.5 16.2 15.3 19.5 24.6 24.3 22.4 22.3
SD 11.5 8.1 10.4 7.2 8.3 11.2 8.05 10.9
Table 3. Mean Value and Standard Deviation of Electromyographic Activity with closed
eyes in the Stomatognatic Muscles of Control Patients.
LTA LMM RMM RTA LSC LDA RDA RSC
Observations 10 10 10 10 10 10 10 10
Mean 32.6 17.3 14.6 24.2 20.8 27 25.9 18.4
SD 13.3 7.9 9.7 9.8 6.5 10.7 10.2 6.3
Table 4. Mean Value and Standard Deviation of Electromyographic Activity with opened
eyes in the Stomatognatic Muscles of Control Patients.
In the closed eyes condition it is possible to observe an identical pattern of SEMG activity in
both control and study group. SEMG values of left and right anterior temporal muscles were
significantly different. These results underline that: i) a change in the visual input does not
induce a modification in the basic tone of the stomatognatic system in children with normal
vision; ii) the myopic children showed an increase of anterior temporal activity at rest. the
activity of masticatory muscles, controlled by the trigeminal nerve, is regulated by several
inputs coming from the proprioception of neuromuscular spindles. These inputs have an
important role in the maintenance and in the modifications of muscular basal tone.
Proprioception messages coming from the muscles of the neck are integrated in the central
nervous system and contribute to control the balance and the body orientation in the space-
time. Centripetal impulses from the muscles of the neck proprioceptors cooperate with the
labyrinth impulses to promote the oculomotor muscular activity through the cervical-
vestibular-ocular reflex.
Some important encephalic nuclei (trigeminal nuclei, oculomotor nuclei, vestibular nuclei,
accessorial nerve nuclei) are integrated in the medial longitudinal fasciculus. Moreover,
ocular proprioceptive receptors send afferences to the trigeminal and cuneate nuclei.
This study confirms the physiologic link of these anatomical structures: a modification of the
proprioceptive ocular afferences can be reflected on the stomatognatic one. The EMG
evaluations comported different RMS values as a consequence of the proprioceptive input
change.
The results suggest that the relation between stomatognatic and oculomotor system is
underestimated and the use of EMG could permit the integrate study of the two systems.
4. Second preliminary study: evaluation of the electromyographic activity of
stomatognathic muscles at rest with eyes closed and with eyes open
The aim of the second preliminary study was to evaluate the electromyographic activity of
stomatognathic muscles at rest with eyes closed and with eyes open and the effects of ocular
correction on electromyographic activity and muscular balance. This knowledge could be
clinically relevant in order to evaluate if, in subjects with functional lateral deviation, the
ocular correction could contribute to variations of muscular tone and its symmetry.
www.intechopen.com

New Measurement Techniques of Surface Electromyographic Signals in Rest Position for Application in the Ophthalmological Field
513
The study was performed at the Dental Clinic of the University of L’Aquila. This study included 32 subjects with functional lateral-deviated mandible selected among children with tooth midline deviation, listed to paediatric dentistry clinic for dental care. All the patients presented natural dentition, an observable deviation of mandibular and anterior tooth midlines on functional base diagnosed by clinical examination, frontal and basal tele-radiographs. The subjects were chosen according to the following parameters: deviated chin from mid-sagittal plane (recognized by perpendicular line to horizontal bipupillary and bicommisural lines); the lack of alignment of the upper and lower labial frena; asymmetry of interincisive lines and molars/canine classes; deviation of incisor midline in maximal intercuspidation both in centric relation and at rest position; mandibular deviation during opening; noise and tenderness referred to temporomandibular joint (TMJ). The frontal teleradiograph, taken at open mouth, confirmed the symmetry of maxillary and mandibular structures. In order to be considered for the study, the following characteristics had to be present: i) negative history of orthodontic treatment; ii) observable deviation of anterior tooth midlines >1,5 mm with alignment at mouth open; iii) absence of skeletal asymmetry; iv) absence of any anterior or posterior/lateral crossbite; v) muscular ocular-extrinsic tone alteration. In the first visit all subjects underwent complete ophthalmological and orthoptical evaluation by the same ophthalmologist. The oculo-extrinsic muscular tone disorders were classified as eso (convergence latent strabismus) and exophories (divergence latent strabismus) and measured by using cover test and Berens prisms. The values expressed as angle of deviation were measured in prismathic diottries (DP). Thirthy-two children with functional mandibular lateral deviation and muscular extrinsic ocular tone disorders, 19 girls and 13 boys, ranging from 8 to 12 years of age, with mean age of 10.1 (sd 1.1) in study group and 9.6 (sd 1.6) in control group (Table 1), were selected. No statistical differences were observed in the mean age for the two groups. Therefore, all subjects received a prescription for their ocular alterations. The subjects were randomly divided into two groups: study and control. The study group received ocular correction that needed to be balanced upon EMG control at the next visit, while the control group received a conventional ocular correction through lenses. At second visit, all subjects were investigated by SEMG. Recordings were performed by placing bipolar surface electrodes (Instruments Co. Seattle) on the left and right anterior temporal, masseter, sternocleidomastoid and digastric muscles. During the recordings, EMG was monitored using a system K7 (Myotronic Inc., Seattle, Washington, USA). Each subject underwent three recordings of the integrated SEMG activity at rest, with eyes open and closed and after ocular correction. During the first SEMG recording each child was asked to keep his/her eyes closed. During the second SEMG recording, each child was asked to keep his/her eyes open while looking straight ahead and to keep the lips in normal soft contact. During the third SEMG recording children in the control group wore glasses for ocular correction through orthoptic examination only, while children in the the study group wore lenses centred and balanced through orthoptic evaluation integrated by means electromyography control. Recordings were performed with previous instruction to the children. SEMG recording time for each trial was 15 seconds. Two-samples paired comparison test (t-test) was performed on SEMG at rest, with and without visual input and with ocular correction, for each investigated muscle. The SEMG values are based on RMS measured in volt and using Symmetry Index (rightleft / right+left) (SI). SI values range from 0 to 1 (0 = perfect symmetry). Each patient was seated in a wood chair with headrest in a comfortable stance, and patients were asked to closed the eyes, to avoid enviromental input. SEMG activity was recorded by
www.intechopen.com

EMG Methods for Evaluating Muscle and Nerve Function
514
K7 software (K7 Myotronic Inc.-Seattle, Washington, USA) using bipolar surface electrodes at single differential with interelectrode distance of 1 cm. The surface electrodes were affixed with adhesive tape to the skin over the superficial masseter (LMM,RMM), anterior temporal (LTA,RTA), anterior digastric (RDA, LDA) and sternocleidomastoid (LSC, RSC), bilaterally and parallel to the muscle fibers. Eight channel surface electromyographic equipment was used (Myotronics). The signal obtained were amplified, recorded and computed using a clinical aimed software (K7-Myotronics); the Root Mean Square (RMS),
expresses in volt, was used as amplitude indicator of the signal. SEMG of the subjects were examined by the same operator without knowledge of recording purpose. The subjects of both groups were analysed with respect to the rate of lateral deviation from tooth midline and electromyographycally examined. Therefore the subjects of the study gruop wore lenses centred and balanced by means SEMG, the control group wore lenses fabricated according to conventional orthoptic evaluation. The SEMG values were compared and statistically analysed. A paired t-test for independent samples was performed to obtain a comparison between mean and variance values of electromyographic data. The level of significance was set at the p value of <.05. A correlation analysis was performed between the rate of lateral deviation and the DP rate. A correlation coefficient (r) equal or greater than 0.600 was considered significant. A linear regression statistics coefficient was performed between the rate of lateral deviation and the DP rate. To facilitate the introduction of the data in the statistic software, all absolute values
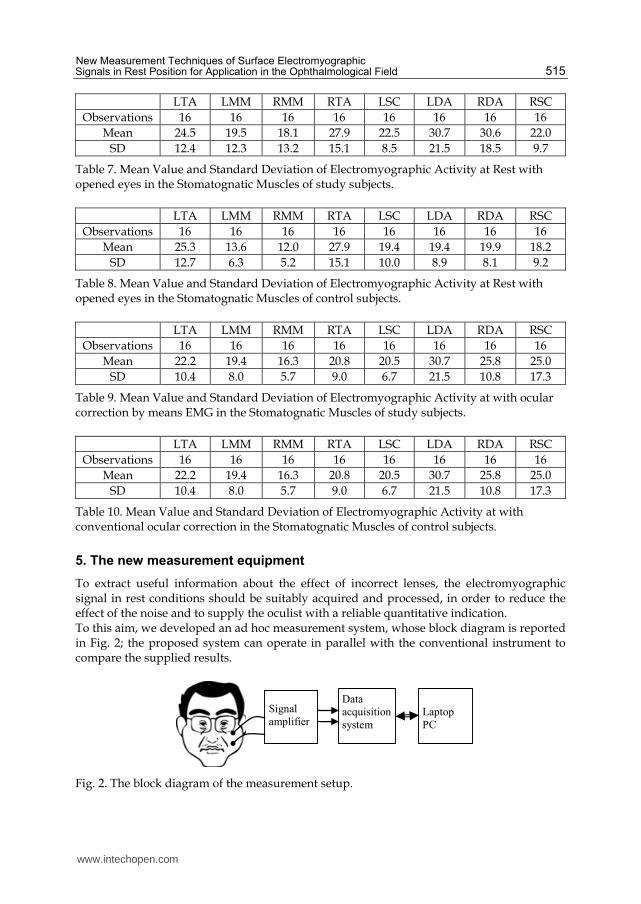
expressed in volt rms were multiplied by 10. Tables 5 and 6 illustrate the mean values, in
volt, of SEMG activity at rest with closed eyes for the anterior temporal, masseter, sternocleidomastoid and anterior digastric muscles respectively of the study and control group. Tables 7 and 8 show the mean values of SEMG activity at rest for the anterior temporal, masseter, sternocleidomastoid and anterior digastric muscles with eyes open in the study and the control groups, respectively. Tables 9 and 10 report the mean values of SEMG activity at rest for the anterior temporal, masseter, sternocleidomastoid and anterior digastric muscles with ocular correction in the study and the control group, respectively. The comparison between the results in Tables 5 and 7 shows that EMG activity of the anterior temporal increases significantly in children with conventional ocular correction (control group) (p<0.05). In the study group children the ocular correction obtained by means SEMG did not show an increase of muscular values of TA.
LTA LMM RMM RTA LSC LDA RDA RSC
Observations 16 16 16 16 16 16 16 16
Mean 20.3 19.5 19.9 17.5 22.9 29.0 36.5 22.4
SD 10.5 13.0 13.7 6.7 6.4 18.1 22.7 10.5
Table 5. Mean Value and Standard Deviation of Electromyographic Activity at Rest with closed eyes in the Stomatognatic Muscles of study subjects.
LTA LMM RMM RTA LSC LDA RDA RSC
Observations 16 16 16 16 16 16 16 16
Mean 20.5 13.6 11.6 18.9 18.0 17.9 19.4 18.0
SD 9.4 7.0 5.1 8.0 10.9 8.6 8.2 8.7
Table 6. Mean Value and Standard Deviation of Electromyographic Activity at Rest with closed eyes in the Stomatognatic Muscles of control subjects.
www.intechopen.com
New Measurement Techniques of Surface Electromyographic Signals in Rest Position for Application in the Ophthalmological Field
515
LTA LMM RMM RTA LSC LDA RDA RSC
Observations 16 16 16 16 16 16 16 16
Mean 24.5 19.5 18.1 27.9 22.5 30.7 30.6 22.0
SD 12.4 12.3 13.2 15.1 8.5 21.5 18.5 9.7
Table 7. Mean Value and Standard Deviation of Electromyographic Activity at Rest with opened eyes in the Stomatognatic Muscles of study subjects.
LTA LMM RMM RTA LSC LDA RDA RSC
Observations 16 16 16 16 16 16 16 16
Mean 25.3 13.6 12.0 27.9 19.4 19.4 19.9 18.2
SD 12.7 6.3 5.2 15.1 10.0 8.9 8.1 9.2
Table 8. Mean Value and Standard Deviation of Electromyographic Activity at Rest with opened eyes in the Stomatognatic Muscles of control subjects.
LTA LMM RMM RTA LSC LDA RDA RSC
Observations 16 16 16 16 16 16 16 16
Mean 22.2 19.4 16.3 20.8 20.5 30.7 25.8 25.0
SD 10.4 8.0 5.7 9.0 6.7 21.5 10.8 17.3
Table 9. Mean Value and Standard Deviation of Electromyographic Activity at with ocular correction by means EMG in the Stomatognatic Muscles of study subjects.
LTA LMM RMM RTA LSC LDA RDA RSC
Observations 16 16 16 16 16 16 16 16
Mean 22.2 19.4 16.3 20.8 20.5 30.7 25.8 25.0
SD 10.4 8.0 5.7 9.0 6.7 21.5 10.8 17.3
Table 10. Mean Value and Standard Deviation of Electromyographic Activity at with conventional ocular correction in the Stomatognatic Muscles of control subjects.
5. The new measurement equipment
To extract useful information about the effect of incorrect lenses, the electromyographic signal in rest conditions should be suitably acquired and processed, in order to reduce the effect of the noise and to supply the oculist with a reliable quantitative indication. To this aim, we developed an ad hoc measurement system, whose block diagram is reported in Fig. 2; the proposed system can operate in parallel with the conventional instrument to compare the supplied results.
Signal
amplifier
Data
acquisition
system
Laptop
PC
Fig. 2. The block diagram of the measurement setup.
www.intechopen.com
EMG Methods for Evaluating Muscle and Nerve Function
516
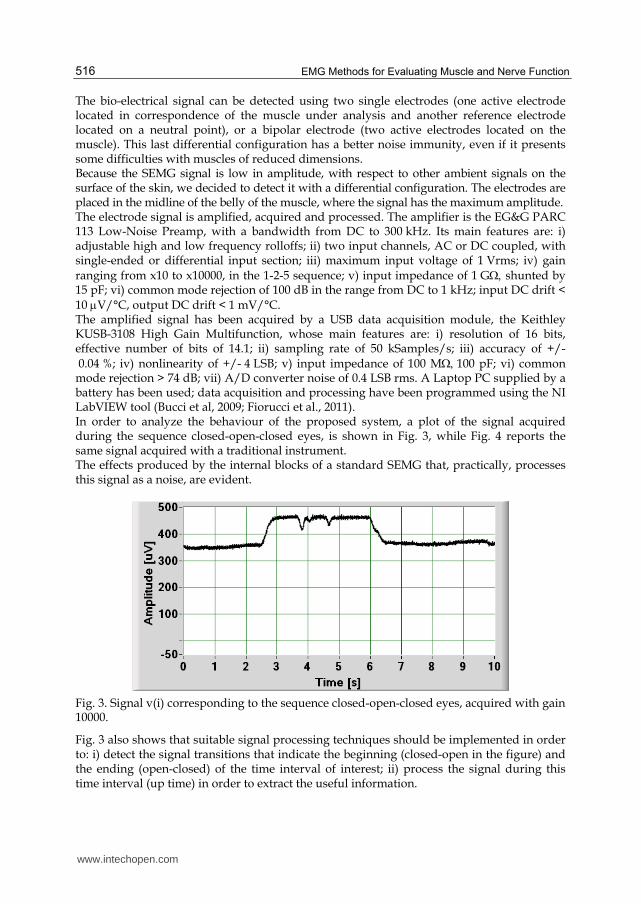
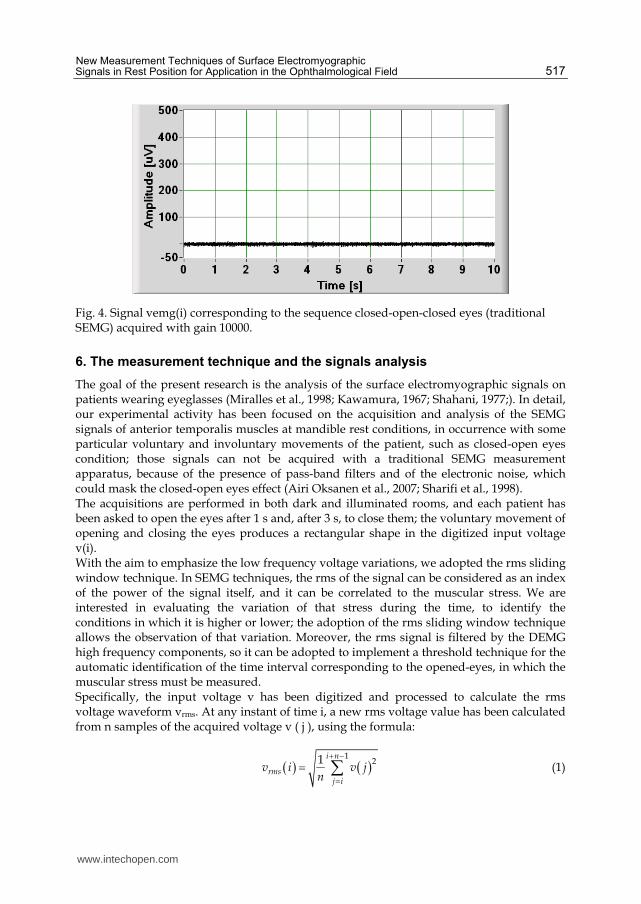
The bio-electrical signal can be detected using two single electrodes (one active electrode located in correspondence of the muscle under analysis and another reference electrode located on a neutral point), or a bipolar electrode (two active electrodes located on the muscle). This last differential configuration has a better noise immunity, even if it presents some difficulties with muscles of reduced dimensions. Because the SEMG signal is low in amplitude, with respect to other ambient signals on the surface of the skin, we decided to detect it with a differential configuration. The electrodes are placed in the midline of the belly of the muscle, where the signal has the maximum amplitude. The electrode signal is amplified, acquired and processed. The amplifier is the EG&G PARC 113 Low-Noise Preamp, with a bandwidth from DC to 300 kHz. Its main features are: i) adjustable high and low frequency rolloffs; ii) two input channels, AC or DC coupled, with single-ended or differential input section; iii) maximum input voltage of 1 Vrms; iv) gain ranging from x10 to x10000, in the 1-2-5 sequence; v) input impedance of 1 G shunted by 15 pF; vi) common mode rejection of 100 dB in the range from DC to 1 kHz; input DC drift < 10 V/°C, output DC drift < 1 mV/°C. The amplified signal has been acquired by a USB data acquisition module, the Keithley KUSB-3108 High Gain Multifunction, whose main features are: i) resolution of 16 bits, effective number of bits of 14.1; ii) sampling rate of 50 kSamples/s; iii) accuracy of +/- 0.04 %; iv) nonlinearity of +/- 4 LSB; v) input impedance of 100 M100 pF; vi) common mode rejection > 74 dB; vii) A/D converter noise of 0.4 LSB rms. A Laptop PC supplied by a battery has been used; data acquisition and processing have been programmed using the NI LabVIEW tool (Bucci et al, 2009; Fiorucci et al., 2011). In order to analyze the behaviour of the proposed system, a plot of the signal acquired during the sequence closed-open-closed eyes, is shown in Fig. 3, while Fig. 4 reports the same signal acquired with a traditional instrument. The effects produced by the internal blocks of a standard SEMG that, practically, processes this signal as a noise, are evident.
Fig. 3. Signal v(i) corresponding to the sequence closed-open-closed eyes, acquired with gain 10000.
Fig. 3 also shows that suitable signal processing techniques should be implemented in order to: i) detect the signal transitions that indicate the beginning (closed-open in the figure) and the ending (open-closed) of the time interval of interest; ii) process the signal during this time interval (up time) in order to extract the useful information.
www.intechopen.com
New Measurement Techniques of Surface Electromyographic Signals in Rest Position for Application in the Ophthalmological Field
517
Fig. 4. Signal vemg(i) corresponding to the sequence closed-open-closed eyes (traditional SEMG) acquired with gain 10000.
6. The measurement technique and the signals analysis
The goal of the present research is the analysis of the surface electromyographic signals on patients wearing eyeglasses (Miralles et al., 1998; Kawamura, 1967; Shahani, 1977;). In detail, our experimental activity has been focused on the acquisition and analysis of the SEMG signals of anterior temporalis muscles at mandible rest conditions, in occurrence with some particular voluntary and involuntary movements of the patient, such as closed-open eyes condition; those signals can not be acquired with a traditional SEMG measurement apparatus, because of the presence of pass-band filters and of the electronic noise, which could mask the closed-open eyes effect (Airi Oksanen et al., 2007; Sharifi et al., 1998). The acquisitions are performed in both dark and illuminated rooms, and each patient has been asked to open the eyes after 1 s and, after 3 s, to close them; the voluntary movement of opening and closing the eyes produces a rectangular shape in the digitized input voltage v(i). With the aim to emphasize the low frequency voltage variations, we adopted the rms sliding window technique. In SEMG techniques, the rms of the signal can be considered as an index of the power of the signal itself, and it can be correlated to the muscular stress. We are interested in evaluating the variation of that stress during the time, to identify the conditions in which it is higher or lower; the adoption of the rms sliding window technique allows the observation of that variation. Moreover, the rms signal is filtered by the DEMG high frequency components, so it can be adopted to implement a threshold technique for the automatic identification of the time interval corresponding to the opened-eyes, in which the muscular stress must be measured. Specifically, the input voltage v has been digitized and processed to calculate the rms voltage waveform vrms. At any instant of time i, a new rms voltage value has been calculated from n samples of the acquired voltage v ( j ), using the formula:
121 i n
rmsj i
v i v jn
(1)
www.intechopen.com

EMG Methods for Evaluating Muscle and Nerve Function
518
where n is the number of samples contained in each summation interval (variable from 20 ms to 100 ms). The new value vrms(i+1) has been calculated by sliding forward a sample of the input voltage. This technique improves the transitory response and guarantees a better temporal resolution: the vrms(i) is updated at each sampling point, so it is possible to directly compare v(i) and vrms(i). During the experimental activity, by analyzing the features of the acquired SEMG signals and comparing them with the movements of the patients, we identified two stress symptoms, that can be directly related with the incorrect prescription of eyeglasses; they can be described comparing Figs. 5 and 6. Fig 5 shows the SEMG signal acquired, in an illuminated room, on a patient without eyeglasses, that have been asked to open the eyes, to try to focalize and to close the eyes. In those conditions there is the maximum stress, whose main symptoms are: A) the partial closing and opening of the eyes due to the winking movement as a consequence of the difficulty in focusing the image; B) the amplitude increasing of the SEMG high frequency components, that is related to the increased activity of the masticatory muscles. The signal in Fig. 6 shows the minimum stress conditions, as it has been acquired in an illuminated room, on a patient wearing the correct eyeglasses: the A and B phenomena are absent. To quantify the patient stress, we introduced a new signal, v*(i), calculated as the point-by-point difference between v(i) and vrms(i):
* rmsv i v i v i (2)
It represents the dynamic component of the muscle activity, that takes into account the winking movement (high frequency components). We observed that two quantitative parameters of the v*(i) signal can be adopted as indexes of the stress of a patient wearing incorrect eyeglasses: the average power and the voltage range in open-eyes condition. We verified that these parameters are smallest when the muscle stress is minimum, that is when the prescription of eyeglasses is correct. The measurement of the average power and voltage range was performed only in the time interval in which the rms signal vrms(i) is higher than a suitable threshold.
Fig. 5. Results in case of no lenses (maximum stress).
www.intechopen.com

New Measurement Techniques of Surface Electromyographic Signals in Rest Position for Application in the Ophthalmological Field
519
Fig. 6. Results in case of correct lenses (minimum stress).
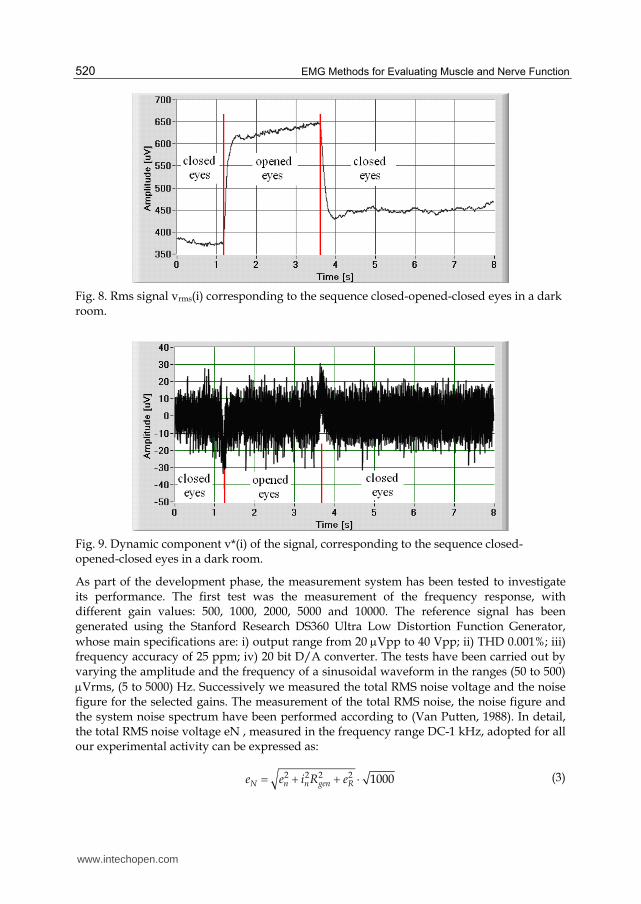
We also performed the amplitude spectrum measurement, in order to investigate about the possible presence of frequency components whose amplitude could be related to the muscular stress. In Fig.7 a flowchart of the signal processing algorithm implemented on the proposed measurement system is synthesized. Figs. 8 to 11 show vrms(i) and v*(i) signals obtained with the proposed technique starting, respectively, in dark and illuminated rooms. The acquisitions in an illuminated room have been performed asking the patient, without sight defects, to open the eyes, to try to focalize a sign and then to close the eyes. Fig. 10 shows the voltage level variations due to the voluntary movement of opening and closing the eyes, superimposed to the high-frequency signal due to the muscle stress; the voltage drop at 2.2 s is due to the focalizing movement involving a partial closing of the eyes.
Fig. 7. Data analysis procedure.
D/A conversion of signal v(i)
Processing of signal v*(i)
Processing of W and Range
Data visualization
Thresholding
Amplification and hardware filtering
Processing of signal vrms(i)
www.intechopen.com
EMG Methods for Evaluating Muscle and Nerve Function
520
Fig. 8. Rms signal vrms(i) corresponding to the sequence closed-opened-closed eyes in a dark room.
Fig. 9. Dynamic component v*(i) of the signal, corresponding to the sequence closed-opened-closed eyes in a dark room.
As part of the development phase, the measurement system has been tested to investigate its performance. The first test was the measurement of the frequency response, with different gain values: 500, 1000, 2000, 5000 and 10000. The reference signal has been generated using the Stanford Research DS360 Ultra Low Distortion Function Generator,
whose main specifications are: i) output range from 20 Vpp to 40 Vpp; ii) THD 0.001%; iii) frequency accuracy of 25 ppm; iv) 20 bit D/A converter. The tests have been carried out by varying the amplitude and the frequency of a sinusoidal waveform in the ranges (50 to 500)
Vrms, (5 to 5000) Hz. Successively we measured the total RMS noise voltage and the noise figure for the selected gains. The measurement of the total RMS noise, the noise figure and the system noise spectrum have been performed according to (Van Putten, 1988). In detail, the total RMS noise voltage eN , measured in the frequency range DC-1 kHz, adopted for all our experimental activity can be expressed as:
2 2 2 2 1000N n n gen Re e i R e (3)
www.intechopen.com

New Measurement Techniques of Surface Electromyographic Signals in Rest Position for Application in the Ophthalmological Field
521
where en is the equivalent short-circuit input RMS noise voltage, in is the equivalent open circuit RMS noise current, Rgen is the internal resistance of the voltage source, and eR is the thermal noise voltage developed across Rgen. As suggested in (Gerleman & Cook, 1992) a typical value of surface electrode impedance is
Rgen = 20 k, en has been measured by shunting a 20 k resistor across the input terminals of the EG&G PARC 113, at 290 K, measuring the preamp output rms voltage and dividing it by the amplifier gains reported in Tab III. The Noise Figure has been calculated as:
2
210log N
R
eNF
e
(4)
where:
2 4Re kT R B (5)
K is the Boltzmann’s constant, T the temperature, B the bandwidth and R the considered resistance. The obtained results, tabulated in Table 11, show a good response of the instrument, because the noise amplitude is quite irrelevant for the bio-electrical signal detection. We also calculated the system dynamic range, considering that the CMRR of the EG&G PARC 113 in the range from DC to 1 kHz is greater than 100 dB; and that the 16 bits data acquisition board presents a theoretical dynamic range of 96 dB; from the tests we carried out that the overall system dynamic range can be assumed as 86 dB.
Fig. 10. Rms signal vrms(i) corresponding to the sequence closed-opened-closed eyes in an illuminated room with no eyeglasses.
Gain Noise Figure [dB] Total RMS noise voltage [nV rms]
500 2.56 952
1000 2.04 897
2000 7.60 1702
5000 3.10 1014
10000 2.15 908
Table 11. Noise figures and total RMS noise voltages for different gain settings.
www.intechopen.com

EMG Methods for Evaluating Muscle and Nerve Function
522
Fig. 11. Dynamic component v*(i) of the signal, corresponding to the sequence closed-opened-closed eyes in an illuminated room, without eyeglasses.
7. Experimental results
We conducted some test to investigate about the effectiveness of the processed parameters to provide useful information concerning the eyeglass prescription. To evaluate the stress of wearing eyeglasses, an experimental activity has been carried out in the Dental Clinic of the University of L’Aquila on a group of 30 patients with different visual defects. As a first step, the correct eye glasses prescription is detected by the ophthalmologist of our team, by using a set of optical test lenses and a trial frame (Fig.12).
Fig. 12. A measurement session with optical test lenses and a trial frame.
www.intechopen.com

New Measurement Techniques of Surface Electromyographic Signals in Rest Position for Application in the Ophthalmological Field
523
After that, the closed-open-closed EMG signals are acquired while the patient is wearing correct and wrong (obtained by adding +/-0.25, +/-2 and +/5 cylindrical correction degrees) lenses. In all the tests, both the increasing and decreasing of the corrective lenses graduation have been characterized by an increase of the average power and by the presence of focalizing movements, involving an increase of the SEMG signal range. In other words, the minimum values of both the parameters are reached when the correct prescription is applied. To underline the relation between muscular stress and incorrect eyeglasses, the SEMG signals v(i) acquired on the same patient are presented in Figs. 13-17, with the previously described correction degrees; they have been obtained by adding respectively the following cylindrical correction degrees: +0.25, -0.25, + 2, -2, +5, -5. The measured values of voltage range and average power are reported in Table 12; it is possible, by using the proposed measurement and analysis approach, to determine the eyeglasses prescription minimizing the muscular stress. In Figs. 19-24 we propose the comparison between the amplitude spectrum of signal in Fig. 6, adopted as a reference for the minimum stress conditions, and the amplitude spectra of the signals in Figs. 13-18. It is possible to identify two frequency bands, in which the effect of the muscular stress seems to be more evident: 10-400 Hz, and 720-740 Hz. In all the figures, the correct eyeglasses reduce the amplitude of the frequency components.
Fig. 13. Signal acquired in case of +0.25 degrees.
Fig. 14. Signal acquired in case of -0.25 degrees.
www.intechopen.com

EMG Methods for Evaluating Muscle and Nerve Function
524
Fig. 15. Signal acquired in case of +2 degrees.
Fig. 16. Signal acquired in case of -2 degrees.
Fig. 17. Signal acquired in case of + 5 degrees.
www.intechopen.com

New Measurement Techniques of Surface Electromyographic Signals in Rest Position for Application in the Ophthalmological Field
525
Fig. 18. Signal acquired in case of - 5 degrees.
Deviation from correct prescription
[cylindrical correction degrees] Range [uV]
Average power [pW]
-5 6.8 0.61
-2 6.7 0.35
-0,25 5.0 0.28
0 1.5 0.04
0,25 4.3 0.31
2 6.3 0.40
5 8.5 0.72
Table 12. Measured voltage range and average power values.
Fig. 19. Spectra comparison of signals for correct lenses and +0,25 degree lenses.
www.intechopen.com

EMG Methods for Evaluating Muscle and Nerve Function
526
Fig. 20. Spectra comparison of signals for correct lenses and -0,25 degree lenses.
Fig. 21. Spectra comparison of signals for correct lenses and +2 degree lenses.
Fig. 22. Spectra comparison of signals for correct lenses and -2 degree lenses.
www.intechopen.com

New Measurement Techniques of Surface Electromyographic Signals in Rest Position for Application in the Ophthalmological Field
527
Fig. 23. Spectra comparison of signals for correct lenses and +5 degree lenses.
Fig. 24. Spectra comparison of signals for correct lenses and -5 degree lenses.
Fig. 25. Spectra comparison of signals for correct lenses and +0,25 degree lenses, in the range 720-740 Hz.
www.intechopen.com

EMG Methods for Evaluating Muscle and Nerve Function
528
Fig. 26. Spectra comparison of signals for correct lenses and -0,25 degree lenses, in the range 720-740 Hz.
Fig. 27. Spectra comparison of signals for correct lenses and +2 degree lenses, in the range 720-740 Hz.
Fig. 28. Spectra comparison of signals for correct lenses and -2 degree lenses, in the range 720-740 Hz.
www.intechopen.com

New Measurement Techniques of Surface Electromyographic Signals in Rest Position for Application in the Ophthalmological Field
529
Fig. 29. Spectra comparison of signals for correct lenses and +5 degree lenses, in the range 720-740 Hz.
Fig. 30. Spectra comparison of signals for correct lenses and -5 degree lenses, in the range 720-740 Hz.
8. Conclusion
The main aim of this chapter was the implementation of new measurement techniques of surface electromyographic signals, that are of great importance for the analysis of neuromuscular functions. Traditional SEMG apparatuses can not be adopted for this application, mainly because of the presence of built-in filtering sections that eliminate the related signal components (Ferdjallah et al., 2000), but also because it is required a special signal processing. By adopting the proposed technique, it is possible to acquire the raw signals, to identify the presence of voluntary movements during the acquisition period with the proposed rms sliding window technique, and to calculate some indexes of the signal v*(i), such as average power and the voltage range in open-eyes conditions. The proposed approach has been applied to evaluate the effects of the graduation of eyeglasses and contact lens on the muscle stress in rest conditions. By processing the SEMG, it is possible to define the right choice for the grade of glasses or contact lenses, with a direct and objective
www.intechopen.com

EMG Methods for Evaluating Muscle and Nerve Function
530
evaluation of the generated muscular stress. Currently, we are working to elaborate a protocol by analysing a greater number of patients. Further improvement of the present paper will investigate the relation between the eyeglasses and contact lens and the amplitude spectrum of the SEMG signal in the frequency range 720 – 740 Hz, in which the amplitudes of the frequency components can supply information about the stress of the patients as suggested by Figs. 23-28. Finally, the adoption of an image acquisition device will be possible to directly compare the EMG signals to the filmed movement of the patient’s face.
9. References
Barber HO. & Sharpe JA. (1988) Vestibular disorder. Year Book Medical Publisher Inc.
Chicago, ISBN 0815104197.
Buisseret-Delmas C & Buisseret P. (1990) Central projections of extraocular muscle afferents
in cat. C. Neuroscience Letters. Vol. 109, No. 1-2, pp.48-53, ISSN 0304-3940
Bucci G., Fiorucci E., Monaco A. & Cattaneo R. (2009), Development of an ad hoc
measurement station for the human surface electromyography in rest position”
Proceedings of IEEE MEMEA 2009, ISBN: 978-1-4244-3599-9, Cetraro Italy, May
2009
Donaldson IM & Knox PC. (1991) Afferent signals from pigeon extraocular muscles modify
the vestibular responses of units in the abducens nucleus. Proceedings Biological
Sciences. Vol. 244, No. 1311, pp.233-239, ISSN 09628452
Ferrario VF, Sforza c, Miani JR, D’Addona & Barbini E. (1993) Electromyographic activity of
human masticatory muscles in normal young people. Statistical evaluation of
reference values for clinical applications. Journal of Oral Rehabilitation. Vol. 20, No. 3,
pp. 271-280, ISSN 1365-2842
Ferdjallah M.; Myers K., Starsky A. & Harris G.F. (2000) Dynamic electromyography. Pediatric Gait, 2000. A new Millennium in Clinical Care and Motion Analysis Technology,
ISBN 0-7803-6469-4, Chicago USA , July 2000.
Fiorucci E., Bucci G., Ciancetta F. & Monaco A. (2011) Measurement and analysis of surface
electromyographic signals on patients wearing eyeglasses Proceedings of IEEE
MEMEA 2011, BARI Italy, May 2011
Gerleman D. G. & Cook T. M., (1992) Selected Topics in Surface Electromyography for Use in the
Occupational Setting: Expert Perspectives- Chapter 4: Instrumentation U.S. Department
of Health and Human Services.
Ito S., Taketomi M. &Hirano M. (1995) Effects on tonic neck reflex on optokinetic nystagmus
in rabbits. Acta Otolaryngologica , Vol. 115, No. 2, pp 134–136.
Kawamura Y. (1967), Neurophysiologic background of occlusion. Periodontics. 1967; Vol.5:,
pp. 175-183.
Lin SY. & White GE. (1996) Mandibular position and head posture as a function of eye
dominance. Journal of Clinical Pediatric Dentistry, Vol. 20, No. 2, pp. 133-140, ISSN
1053-4628
Lukas JR. & Aigner M, Heinzl H, & Mayr R. (1994) Number and distribution of
neuromuscular spindles in human extraocular muscles. Investigative Ophtalmology &
Visual Science, Vol. 35, No. 13 , pp. 4317-4327, ISSN 1552-5783
www.intechopen.com

New Measurement Techniques of Surface Electromyographic Signals in Rest Position for Application in the Ophthalmological Field
531
Meyer J. & Baron JB. (1976) Participation of trigeminal afferences in tonic postural
regulation. Static and dynamic aspects. Aggressiologie , Vol. 17, pp:33-40, ISSN
00021148
Miralles R., Gutierrez C., Zucchino G., Cavada G., Carvajal R., Valenzuela S. & Palazzi C.
(1998) Visual input effect on EMG activity of sternocleidomastoid and masseter
muscles in healthy subjects and in patients with myogenic cranio-cervical-
mandibular dysfunction. Cranio, Vol. 16, No. 3, pp. 168-184, ISSN 0886-9634
Monaco A., Cattaneo R., Spadaro A., Giannoni M., Di Martino S. & Gatto R. (2006) Visual
input effect on EMG activity of masticatory and postural muscles in healthy and
myopic children. European Journal of Paediatric Dentistry, Vol. 7, No.1, pp. 18-22,
ISSN 2035-648X .
Monaco A, Spadaro A, Cattaneo R. & Giannoni M. (2010) Effects of myogenous facial pain
on muscle activity of head and neck. International Journal of Oral & Maxillofacial
Surgery ; Vol. 39, No. 8, pp. 767-773, ISSN 0901-5027
Murch GM. (1973) Visual and Auditory Perception. New York: Bobbs-Merril Company Inc.;
Oddsson L. (1989) Motor patterns of a fast voluntary postural task in man: trunk
extension in standing. Acta physiologica Scandinavica, Vol. 136, No. 1, pp. 47-58,
ISSN 0302-2994
Oksanen A., Ylinen J., Pöyhönen T., Anttila P., Laimi K., Hiekkanen H. & Salminen J. (2007)
Repeatability of electromyography and force measurements of the neck muscles in
adolescents with and without headache. Journal of Electromyography and Kinesiology,
Vol.17, No. 4, pp.493-503, ISSN 1050-6411
Porter JD. (1986) Branstem terminations of extraocular muscle primary afferent neuron in
the monkey. Journal of Comparative Neurology, Vol. 247, No.2, pp. 133-143, ISSN
1096-9861
Rilo B., Santana U., Mora MJ. & Cadarso CM., (1997) Myoelectrical activity of clinical rest
position and jaw muscle activity in young adults. Journal of Oral Rehabilitation. Vol.
24, No. 10, pp. 735-740, ISSN 1365-2842.
Rose PK. & Abrahams VC. (1975) The effect of passive eye movement on unit discharge in
the superior colliculus of the cat. Brain Research, Vol 97, No. 1, pp 95-106, ISSN
00068993
Rose PK., Mac Donald J. & Abrahams VC, (1991) Projections of the tectospinal tract to the
upper cervical spinal cord of the cat: a study with the anterograde tracer PHA-L.
Journal of Comparative Neurololgy ; Vol. 314, No. 1, pp. 91-105, ISSN 0021-9967
Schmid W & Mongini F. (1985) Orthodontic treatment and mandibular modelling in growth.
Fortschr Kieferorthop , Vol. 46, No. 5, pp. 352-357, ISSN 0015-816X
Schmid R., Zambarbieri D. & Magenes G. (1981) Modifications of vestibular nystagmus
produced by fixation of visual and nonvisual targets. Annals of the New York
Academy of Sciences, Vol. 374, pp. 689-705, ISSN 1749-6632
Shahani M, (1977) Influence of visual input on monosynaptic reflex. Electromyography and
Clinical. Neurophysiology, Vol. 17, No. 1, pp. 3-11 ISSN
Sharifi Milani R, Deville de Periere D. & Micallef JP, (1988) Relationship between dental
occlusion and visual focusing. Cranio. Vol. 16, No. 2, pp. 109-118, ISSN 0886-9634
www.intechopen.com

EMG Methods for Evaluating Muscle and Nerve Function
532
Spadaro A, Monaco A, Cattaneo R., Masci C. & Gatto R. (2010) Effect on anterior temporalis
surface EMG of eyes open-closed condition. European Journal of Paediatric Dentistry
Vol. 11, No. 4, pp. 210-212, ISSN 2035-648X
Valentino B. & Fabozzo A. (1993) Interaction between the muscles of the neck and the extraocular muscles of the myopic eye. An electromyographic study. Surgical and Radiologic Anatomy , Vol. 15, No. 4, pp. 321-323, ISSN 0930-1038
Van Putten A. F. P. (1988) Electronic Measurement Systems, Prentice Hall, ISBN 9780132518857
www.intechopen.com

EMG Methods for Evaluating Muscle and Nerve FunctionEdited by Mr. Mark Schwartz
ISBN 978-953-307-793-2Hard cover, 532 pagesPublisher InTechPublished online 11, January, 2012Published in print edition January, 2012
InTech EuropeUniversity Campus STeP Ri Slavka Krautzeka 83/A 51000 Rijeka, Croatia Phone: +385 (51) 770 447 Fax: +385 (51) 686 166www.intechopen.com
InTech ChinaUnit 405, Office Block, Hotel Equatorial Shanghai No.65, Yan An Road (West), Shanghai, 200040, China
Phone: +86-21-62489820 Fax: +86-21-62489821
This first of two volumes on EMG (Electromyography) covers a wide range of subjects, from Principles andMethods, Signal Processing, Diagnostics, Evoked Potentials, to EMG in combination with other technologiesand New Frontiers in Research and Technology. The authors vary in their approach to their subjects, fromreviews of the field, to experimental studies with exciting new findings. The authors review the literature relatedto the use of surface electromyography (SEMG) parameters for measuring muscle function and fatigue to thelimitations of different analysis and processing techniques. The final section on new frontiers in research andtechnology describes new applications where electromyography is employed as a means for humans tocontrol electromechanical systems, water surface electromyography, scanning electromyography, EMGmeasures in orthodontic appliances, and in the ophthalmological field. These original approaches to the use ofEMG measurement provide a bridge to the second volume on clinical applications of EMG.
How to referenceIn order to correctly reference this scholarly work, feel free to copy and paste the following:
Edoardo Fiorucci, Fabrizio Ciancetta and Annalisa Monaco (2012). New Measurement Techniques of SurfaceElectromyographic Signals in Rest Position for Application in the Ophthalmological Field, EMG Methods forEvaluating Muscle and Nerve Function, Mr. Mark Schwartz (Ed.), ISBN: 978-953-307-793-2, InTech, Availablefrom: http://www.intechopen.com/books/emg-methods-for-evaluating-muscle-and-nerve-function/new-measurement-techniques-of-surface-electromyographic-signals-in-rest-position-for-application-in-

© 2012 The Author(s). Licensee IntechOpen. This is an open access articledistributed under the terms of the Creative Commons Attribution 3.0License, which permits unrestricted use, distribution, and reproduction inany medium, provided the original work is properly cited.