new jersey department of environmental protection division ... · new jersey department of...
TRANSCRIPT
New Jersey Department of Environmental Protection
Division of Air Quality
Technical Manual 1003
Guidance on Preparing a Risk Assessment for Air
Contaminant Emissions
2018

i
Table of Contents
1.0 INTRODUCTION ................................................................................................................... 1
1.1 PURPOSE OF DOCUMENT.................................................................................................................................. 1
1.2 PURPOSE OF RISK ASSESSMENT .................................................................................................................... 2
1.3 DESCRIPTION OF AIR TOXICS ......................................................................................................................... 2
1.4 RISK ASSESSMENT PROCEDURES .................................................................................................................. 2
2.0 RISK ASSESSMENTS ............................................................................................................. 3
2.1 RISK SCREENING ................................................................................................................................................. 3
2.1.1 The Risk Screening Worksheet for Stationary Sources ................................................ 3
2.1.2 The Risk Screening Worksheet for Nonroad Diesel Engines ....................................... 5
2.2 REFINED RISK ASSESSMENT........................................................................................................................... 6
2.2.1 Facility Opts to Have the Department Perform the Refined Risk Assessment .............. 6
2.2.2 Facility Opts to Perform its Own Refined Risk Assessment ......................................... 8
2.2.3 Determining Health Risks .............................................................................................. 8
2.2.4 New or Modified Source Operations Risk Management Guidelines .......................... 10
2.3 FACILITY WIDE RISK ASSESSMENT ........................................................................................................... 10
2.3.1. FACILITY WIDE RISK ASSESSMENT GUIDELINES ........................................................................ 12
3.0 RISK MANAGEMENT COMMITTEE REVIEW ................................................................ 13
APPENDIX A ACRONYMS & GLOSSARY ............................................................................ 14
APPENDIX B THE RISK ASSESSMENT PROCESS .............................................................. 16
APPENDIX C METHODOLOGY AND ASSUMPTIONS USED TO GENERATE THE AIR
IMPACT VALUES FOR THE NJDEP RISK SCREENING WORKSHEET ... 18
APPENDIX D REFERENCES .................................................................................................... 26
ii
List of Tables
2-1 Cancer Risk Guidelines for New or Modified Sources ----------------------------------------- 9
2-2 Long- and Short-Term Non-Cancer Risk Guidelines for New or Modified Sources ------- 9
2-3 Facility Wide Cancer Risk Guidelines ----------------------------------------------------------- 10
2-4 Facility Wide Long- and Short-Term Non-Cancer Risk Guidelines ------------------------- 10
C-1 Stack Parameters and Emission Rates ------------------------------------------------------------ 16
C-2 Stack Heights and Assumed Building Dimensions --------------------------------------------- 17
C-3 Worst-Case Impact Scenarios --------------------------------------------------------------------- 18
C-4 Annual Air Impact Values per ton/yr of Emissions for Stack Heights 15-250 ft ---------- 19
C-5 Hourly Air Impact Values per lb/hr of Emissions for Stack Heights 15-250 ft ------------ 21
List of Figures
C-1 Annual air impact value as a function of distance for all simulated stack heights --------- 20
C-2 Hourly air impact value as a function of distance for all simulated stack heights --------- 22
1
1.0 INTRODUCTION
1.1 Purpose of Document
The four types of risk assessments that a facility may have to conduct are: 1) Risk Screening
Worksheet Assessment; 2) Refined Risk Assessment; 3) Facility Wide Risk Assessment; and 4)
Comprehensive Exposure Risk Assessment (CERA). The first three assessments (Risk
Screening Worksheet, Refined Risk, and Facility Wide Risk) are the most commonly required
assessments and evaluate only the inhalation pathway for air toxics. One of these three types of
risk assessments will be required to obtain an air pollution control (APC) permit if any air toxics
are emitted above their applicable reporting thresholds.
The CERA evaluates the health impacts of air toxics from multiple pathways, including
inhalation, ingestion, and dermal. CERA is typically performed for facilities, such as hazardous
waste incinerators and Superfund sites, that are regulated by several Federal and state programs
and that require the development of a distinct, multidisciplinary health risk protocol. The
Department will work closely with the facility as well as other regulatory agencies to create a
comprehensive case-by-case risk evaluation. Because of the CERA’s complexity, it is beyond
the scope of this Technical Manual.
This document provides instructions on how to conduct the risk assessments required to obtain
an air pollution control (APC) permit from the New Jersey Department of Environmental
Protection (Department). Detailed descriptions about how to perform and interpret the results for
these three types of assessments are provided in Section 2.0 “Risk Assessments.” Appendix A
“Acronyms & Glossary” defines terms used throughout this manual. Appendix B “The Risk
Assessment Process” provides detailed information on the calculations, assumptions, and
procedures used in the risk assessments. Appendix C “Methodology and Assumptions Used to
Generate the Risk Screening Worksheet” provides information used to develop the Risk
Screening Worksheet for Stationary Sources (Section 2.1.1). Appendix D “References” provides
supporting documentation used to develop this manual.
Pursuant to N.J.A.C. 7:27-8.5(b), for preconstruction permit applications, and N.J.A.C. 7:27-
22.3(cc), for operating permit applications, health risk assessments are required for Air Toxic
emissions listed for new or modified equipment and at the time of Title V operating permit
renewals. For Title V permit renewals, a facility-wide health risk assessment is not required if
the facility has already completed one for a previous renewal, unless there have been changes to
emissions, stack parameters, risk factors, or dispersion models since the last time a facility-wide
health risk assessment was conducted. Applicability determinations are made at the time of
permit application. Additional information on applicability can be found at the Air Quality
Permitting Program, Division of Air Quality (DAQ) website http://www.state.nj.us/dep/aqpp.
2
1.2 Purpose of Risk Assessment
Risk assessment is a scientific process used to estimate the probability of adverse health effects
resulting from human exposure to hazardous substances. The Department utilizes risk
assessment to:
A. Evaluate potential air toxics risks remaining (residual health risk), either from
individual source operations or from entire facilities, after applicable pollution
controls; and
B. Make decisions regarding permitting, control, and/or regulation of air toxics.
1.3 Description of Air Toxics
Air toxics are natural or man-made pollutants that when emitted into the air may cause an
adverse health effect. Evidence of adverse health effects is based on human and animal exposure
studies. The Federal 1990 Clean Air Act (CAA) Amendments created a list of air toxics, called
“hazardous air pollutants” or “HAP,” as well as regulations to limit HAP emissions. Air toxics
that must be evaluated are listed on the NJDEP Division of Air Quality “Risk Screening
Worksheet for Long-Term Carcinogenic and Noncarcinogenic Effects and Short-Term Effects”
(Worksheet). The Worksheet evaluates HAPs, as well as other air contaminants, such as
hydrogen sulfide and ammonia.
The Worksheet’s air toxics list excludes "criteria pollutants" that have been established by
National or New Jersey Ambient Air Quality Standards. The exceptions to this are: lead, some
specific volatile organic compounds (VOCs), and specific heavy metals. Lead, which is a
criteria pollutant, is also considered to be an air toxic due to its ability to cause significant
adverse health effects at very low exposures. Specific VOCs, which are listed as HAPs, fall
under the VOC criteria pollutant category. And specific heavy metals, which are listed as
HAPs, are included in the particulate matter criteria pollutant category.
1.4 Risk Assessment Procedures
In most cases, potential residual health risk is initially determined using the Worksheet, which
can be found at the Department’s Risk Screening tools webpage,
www.state.nj.us/dep/aqpp/risk.html. The Worksheet is used by facilities prior to the submittal of
an application and by Department staff. If the health risk for the application is determined by the
Worksheet to be negligible, no further investigation of the health risk is necessary. If the
Worksheet indicates a health risk that is not negligible, the facility should evaluate changes that
can be made to the source operation(s) to lower the risk level. If changes cannot be made to
lower the Worksheet risk to a negligible level, then a refined risk assessment must be conducted.
Risk screening procedures are outlined in Section 2.1.1 “The Risk Screening Worksheet for
Stationary Sources” and Section 2.1.2 “The Risk Screening Worksheet for Nonroad Diesel
3
Engines.” Section 2.2 “Refined Risk Assessment” provides the information required to conduct
this type of assessment and outlines the procedures to follow by a facility requesting the
Department to conduct the assessment. Section 2.3 “Facility Wide Risk Assessment” discusses
the evaluation of the cumulative air health impact of all source operations at a facility. These
procedures evaluate the incremental inhalation risk from exposure to the permitted air toxic
emissions. They do not consider the existing risk of cancer and other maladies associated with
smoking, occupational or domestic exposures, dietary habits, inherited traits, or other factors that
impact health and wellbeing; nor do they consider health risks from other nearby air toxics
sources or existing levels of toxics in the ambient air.
2.0 RISK ASSESSMENTS
2.1 Risk Screening
The Department’s Risk Screening procedure uses generalized worst-case assumptions and
straight forward worksheet calculations to estimate cancer and non-cancer health risks from the
inhalation of air toxics listed in a permit application. In lieu of source specific dispersion
modeling, normalized air impact values are used to estimate dispersion of emitted air toxics and
the resulting ambient air concentrations. The screening process is designed to minimize the
likelihood of erroneously approving source operations that could potentially pose a significant
health risk by overestimating the risk. This ensures that any source operation that requires
further evaluation will be identified. Because the procedure is both quick and conservative, it
allows the Department to estimate risk from a greater number of sources than would be possible
if a refined risk assessment based on atmospheric dispersion modeling was required for every
application.
2.1.1 The Risk Screening Worksheet for Stationary Sources
The Worksheet is used for the risk screening assessment of stationary sources. For source
operations emitting air toxics, one Worksheet should be completed for each emission
point. However, based on the assumptions made when generating the model, the following
sources may not use this Worksheet: (1) sources without stacks, such as certain dry cleaners,
degreasers, storage tanks, and gasoline stations, (2) sources with stacks with a horizontal or
downward discharge direction, or (3) sources with stack heights less than 10 feet. See Appendix
C for a complete list of assumptions. For information on how to evaluate risk from other kinds
of sources, contact the Department at 609-292-6722.
The Worksheet is an Excel spreadsheet which can be found at the Department’s “Risk Screening
Tools” webpage at www.nj.gov/dep/aqpp/risk.html. The Excel spreadsheet is a protected file,
meaning that changes are allowed only to certain cells. Information can only be typed into the
yellow cells. It is also a "read only" file, which will not save any changes to the original file. To
input and save new data, the file must be saved under a different name, and this should be entered
into the “File name (.xls)” section on the Worksheet.
4
The Worksheet consists of two sheets, as indicated by the tabs at the bottom of the screen. The
first sheet contains the risk screening worksheet calculations (“Risk”). The second sheet (“CAS
Index”) contains a numerical listing of all the Chemical Abstract Service (CAS) numbers for the
air toxics listed in the Worksheet. If an air toxic cannot be found alphabetically in the risk sheet,
the "CAS Index" sheet of the Worksheet should be checked to see if it is listed under another
name. The “CAS Index” also contains synonyms for certain common air toxics. Note that
accurate identification of air toxics is critical to a risk assessment.
The Worksheet uses current unit risk factors (URF) and reference concentrations (RfC) based on
assumptions of continuous chronic exposure to carcinogenic and noncarcinogenic air toxics. For
noncarcinogenic air toxics with short term averaging periods, the exposure time is assumed to be
1, 8, or 24 hours, depending on the air toxic. To evaluate risk, the appropriate ambient air
concentration is estimated.
The facility must provide information by inputting data into the yellow cells. To the extent
possible, the background information on the source operation should be provided. This includes
Facility and Activity Identification Numbers, Facility Name and Location, File name, Emission
Unit ID, Equipment ID, Operating Scenario, and Emission Point ID.
The following information must be entered for the resulting air toxic concentrations and
risk estimates to be automatically calculated:
1. Stack height, in feet;
2. Distance to the nearest property line, in feet;
3. Chemical-specific maximum annual emission rate (Q) in tons/year; and
4. Chemical-specific maximum hourly emission rate (Qh) in pounds/hour.
The facility should ensure that the Worksheet is consistent with the data provided in the Air
Pollution Control (APC) permit application.
When stack height and distance to property line are typed into the Worksheet, the file will
automatically select the appropriate normalized annual air impact value (C’) and 1-hour air
impact value (C’st). Appendix C “Methodology and Assumptions Used to Generate the Air
Impact Values for the NJDEP Risk Screening Worksheet” outlines the procedures/background
information used to develop the Worksheet and describes the methodology used to develop air
impact values.
The incremental cancer risks (IR) and hazard quotients (HQ) will be calculated automatically
after the air toxics emission rates and all other necessary information are entered. A
“Negl.”(Negligible) or “FER” (Further Evaluation Required) will also appear for each unit risk
factor, and for each long-term and short term reference concentration that is evaluated.
The Worksheet will generate a “Negl.” result if: 1) the air toxic is a carcinogen and the
5
incremental risk is less than 1E-06; or 2) the air toxic is a noncarcinogen and any short or long-
term hazard quotients are less than 1. If all air toxics receive a “Negl.” result, the risk
assessment is considered complete, and no further evaluation is required. If the Worksheet
generates a “FER” result for any air toxic, the facility should evaluate if the risk level can be
reduced through mitigating actions. Mitigating actions that could lower risk levels include, but
are not limited to, the following:
1. Reducing air toxic emissions through:
i. Installation of an APC device or improving the efficiency of an
existing APC device.
ii. Replacing the air toxic substance with a non-toxic or less toxic
substance.
iii. Decreasing the annual operative hours.
iv. Decreasing the annual or hourly throughput.
2. Increasing the stack height.
3. Relocation of the source to a location further from the property line.
Please note that it is at the facility’s discretion whether to evaluate ways to lower the Worksheet
risk levels.
If the risk levels need further review after this evaluation, refined risk assessment must be
conducted. Only those air toxics with a “FER” result need to undergo a refined risk assessment
as outlined in Section 2.2.
2.1.2 The Risk Screening Worksheet for Nonroad Diesel Engines
To determine the health risk from the emission of diesel particulate matter emissions, the
“Cancer Risk Screening Worksheet for Nonroad Diesel Engines” (Diesel Worksheet) should be
used instead of the Worksheet if:
1. The stack discharge direction is up;
2. The capacity of the engine is 50 horsepower or greater; and
3. The stack height is at least 15 feet for an engine less than or equal to 600
horsepower; or the stack height is at least 25 feet for an engine greater than
600 horsepower
The Diesel Worksheet is not to be used for HAP other than diesel particulate matter. The Diesel
Worksheet can be found at: http://www.state.nj.us/dep/aqpp/risk.html. It is designed to calculate
diesel particulate emissions and assume an appropriate plume rise for diesel engines. The Diesel
Worksheet contains step-by-step instructions for completing this risk screening in the second tab
of the Excel file, along with details for interpreting the results in the third tab of the Excel file.
6
If the Diesel Worksheet shows an unacceptable risk, the risk from the engine must then
be determined using a refined risk assessment, as outlined in Section 2.2.
2.2 Refined Risk Assessment
The refined risk assessment consists of a refined atmospheric dispersion modeling analysis for
new or modified sources that estimates ambient air concentrations more accurately than the
Worksheet by using stack- and source-specific data as well as representative meteorological data.
The refined risk assessment often predicts air toxic concentrations that are lower than those
estimated with the Worksheet. The Department normally uses the USEPA refined model
AERMOD for these evaluations. However, models such as SCREEN3 and AERSCREEN can be
proposed on a case-by-case basis for use in a refined risk assessment protocol. The decision to
allow proposed air quality models to be used will be based on the unique characteristics of the
equipment and stack parameters being evaluated. It is recommended that the Department be
consulted during protocol development.
Ambient air monitoring can be proposed for use in a refined risk assessment protocol for an
individual source operation or for a facility-wide risk assessment protocol. The decision to allow
ambient air monitoring results to be used will be based on the unique characteristics of the
equipment and stack parameters being evaluated. The fence line ambient air monitoring program
must have been reviewed and approved by the Department for the data to be considered for a
modeling waiver.
The Department will conduct the refined risk assessment unless the facility specifies that they
will perform the analysis. The current fee schedules are available at N.J.A.C. 7:27-8.6 or
N.J.A.C. 7:27-22.31, which are posted on the Department’s website at
http://www.state.nj.us/dep/aqm/rules27.html..
A refined risk assessment evaluating carcinogenic risk as well as short- and long-term non-
carcinogenic risks is required for each individual air toxic with a “FER” result from the
Worksheet or Diesel Worksheet. The health risk for each air toxic must be determined: 1) at the
receptor with the highest predicted air concentration in the 5-year simulation (AERMOD); and 2)
at sensitive receptors (nearest residence, daycare centers, hospitals, nursing homes, playgrounds,
etc.) located within the defined modeling grid.
Section 2.2.1 describes in detail the information needed by the Department to conduct the refined
risk assessment for the facility. Section 2.2.2 is a guide for a facility that chooses to perform its
own refined risk assessment.
2.2.1 Facility Opts to Have the Department Perform the Refined Risk Assessment
A plot plan (also called land survey/site plan) of the facility property must be provided with the
modeling protocol. The preparation and submittal of a plot plan to a regulatory agency in New
Jersey is governed by the State Board of Professional Engineers and Land Surveyors and is
codified in the New Jersey Administrative Code at Title 13, Chapter 40. In accordance with
7
N.J.A.C. 13:40-5.1 (J) (n), all land surveys, construction plans, and maps prepared to show
topographic data or planimetric data and delineate property lines submitted to the Department
must bear the signature and impression seal of the licensed land surveyor or professional
engineer. Thus, a full-size paper copy is required. Any plot plan submitted in the modeling
protocol must show the facility's property line and the location of all sources and stacks that will
be included in the modeling analysis. The plot plan shall also identify fences and other barriers,
if any, which would deter public access.
The plot plan must be of sufficient detail (showing all building dimensions) to enable a
determination of Good Engineering Practice (GEP) formula stack height and the potential for
building downwash considerations for stack heights less than GEP formula heights. The grade
elevation and height above grade for each structure must be indicated as well as the stack base
elevation. In complex cases where there are a number of existing structures or tiers that must be
considered in the GEP analysis, photographs or three-dimensional sketches may also be required
as additional documentation.
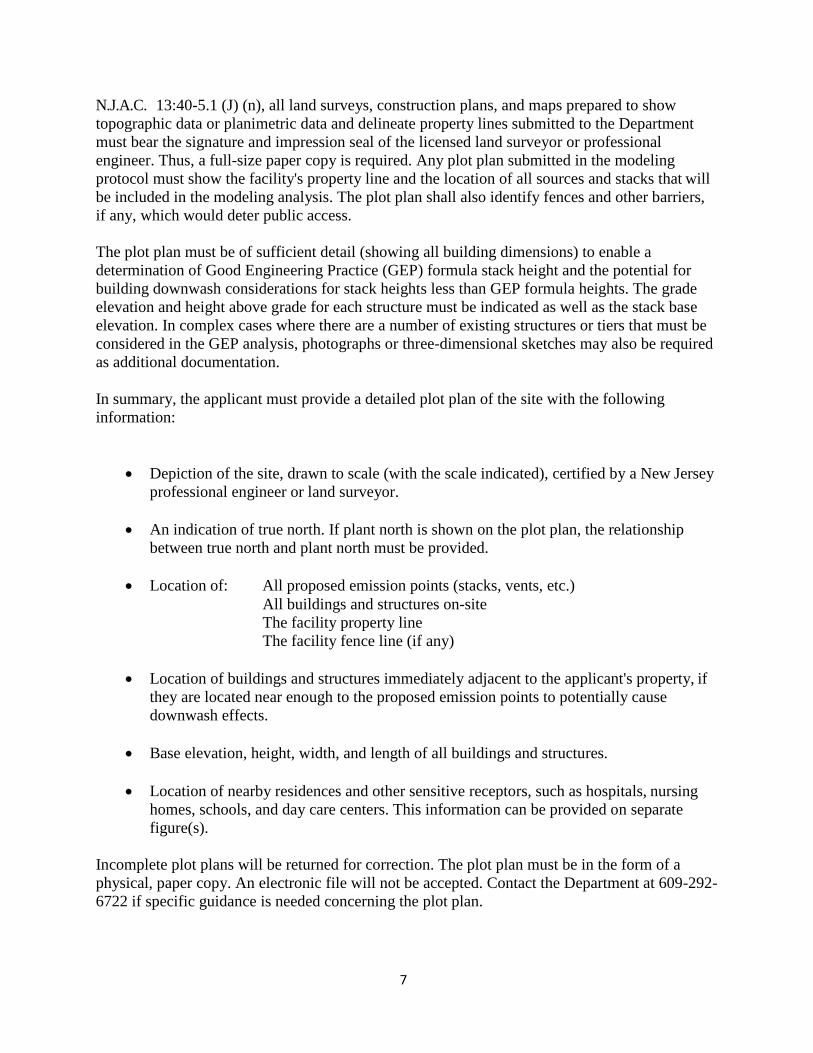
In summary, the applicant must provide a detailed plot plan of the site with the following
information:
• Depiction of the site, drawn to scale (with the scale indicated), certified by a New Jersey
professional engineer or land surveyor.
• An indication of true north. If plant north is shown on the plot plan, the relationship
between true north and plant north must be provided.
• Location of: All proposed emission points (stacks, vents, etc.)
All buildings and structures on-site
The facility property line
The facility fence line (if any)
• Location of buildings and structures immediately adjacent to the applicant's property, if
they are located near enough to the proposed emission points to potentially cause
downwash effects.
• Base elevation, height, width, and length of all buildings and structures.
• Location of nearby residences and other sensitive receptors, such as hospitals, nursing
homes, schools, and day care centers. This information can be provided on separate
figure(s).
Incomplete plot plans will be returned for correction. The plot plan must be in the form of a
physical, paper copy. An electronic file will not be accepted. Contact the Department at 609-292-
6722 if specific guidance is needed concerning the plot plan.

8
2.2.2 Facility Opts to Perform its Own Refined Risk Assessment
An applicant that opts to perform the refined risk assessment must submit an atmospheric
dispersion modeling protocol in accordance with procedures outlined in the Technical Manual
1002 “Guidance on Preparing an Air Quality Modeling Protocol.” This manual can be
downloaded at http://www.state.nj.us/dep/aqpp/techman.html. The protocol must be approved
by the Department before the refined modeling study is performed. The protocol information
must be consistent with the information in the permit application for the protocol to be deemed
complete.
2.2.3 Determining Health Risks
Dose Response Assessment
Dose-response assessment is the characterization of the relationship between a chemical
exposure, or dose, and the incidence and severity of an adverse health effect. It takes into
consideration factors that influence this relationship, including intensity and pattern of exposure,
and age and lifestyle variables that may affect susceptibility. It may also involve extrapolation
from high-dose to low-dose responses, and from animal to human responses. This information is
gathered from epidemiological or laboratory studies done by federal or state agencies, health
organizations, academic institutions, and others.
Dose-response assessment as utilized in the air permitting process involves the quantification (in
terms of severity or likelihood) of toxicological effects of individual chemicals on humans. The
dose-response relationship is evaluated differently for carcinogenic (cancer-causing) and non-
carcinogenic substances.
For carcinogens, it is assumed that there is a linear relationship between an increase in dose or exposure concentration and an increase in cancer risk, with no threshold. This is expressed as a potency slope or slope factor (SF), in units “per milligram (of chemical) per kilogram (of body weight) per day” or (mg/kg/day)-1. To evaluate risks from inhalation of carcinogenic substances, USEPA and other regulatory agencies use potency slopes to develop unit risk factors (URFs). A URF can be defined as the upper-bound excess probability of contracting cancer as the result of a
lifetime of exposure to a carcinogen at a concentration of 1 μg/m3 in air. URF units are “per
microgram (of chemical) per cubic meter (of air)” or (ug/m3)-1.
For inhalation effects from noncarcinogens, dose-response data are used to develop reference concentrations (RfCs), for both long-term (chronic) and short-term exposures. Unlike
carcinogens, noncarcinogens are assumed to have thresholds for adverse effects, meaning that injury does not occur until exposure has reached or exceeded some concentration (a threshold).
An RfC is derived from a no-observed adverse effect level (NOAEL) or lowest-observed adverse
effect level (LOAEL) determined through human or animal exposure studies. Since actual thresholds for the general population cannot be precisely determined, uncertainty or safety
factors are applied to the NOAEL or LOAEL. This assures that the RfC is set at a level that is expected to be protective of sensitive populations (the elderly, infirm, or very young). Short-term
RfCs are developed to prevent health effects from exposure periods of 24 hours or less. RfCs are
expressed in units of μg/m3. (Note: California’s air program refers to these values as “Reference
9
Exposure Levels (RELs),” while USEPA uses the term RfC.) Oral exposures are evaluated using
reference doses or RfDs, which have units of mg/kg/day.
To develop URFs, RfCs, SFs, and RfDs, toxicological studies are evaluated by groups assigned
for this purpose within USEPA and other agencies. These risk values are then usually peer-
reviewed, and gathered into databases. USEPA maintains the Integrated Risk Information
System (IRIS), which is available on-line at www.epa.gov/iris. Another primary source of risk
numbers is the California Office of Environmental Health Hazard Assessment (OEHHA). Their
data is available on-line at www.oehha.ca.gov. Within NJDEP, DAQ compiles the inhalation
information available from IRIS and other appropriate sources into lists of URFs and RfCs.
These are periodically updated and are available at www.nj.gov/dep/aqpp/risk.html.
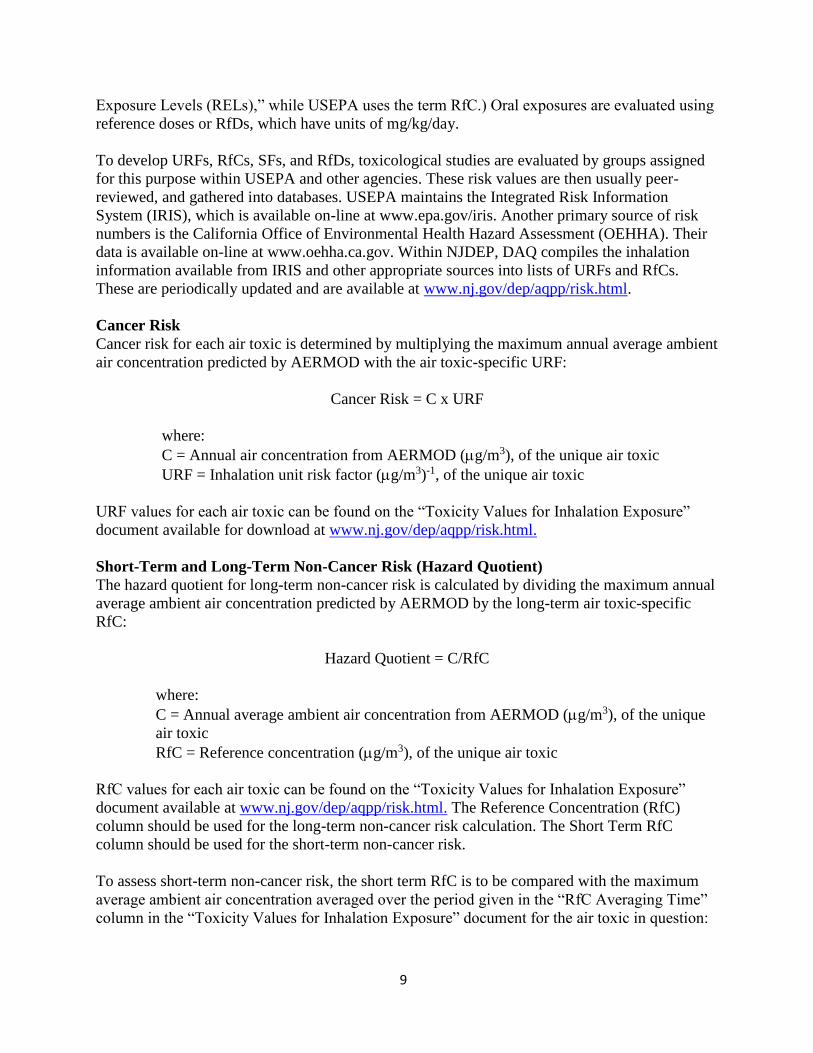
Cancer Risk
Cancer risk for each air toxic is determined by multiplying the maximum annual average ambient
air concentration predicted by AERMOD with the air toxic-specific URF:
Cancer Risk = C x URF
where:
C = Annual air concentration from AERMOD (g/m3), of the unique air toxic
URF = Inhalation unit risk factor (g/m3)-1, of the unique air toxic
URF values for each air toxic can be found on the “Toxicity Values for Inhalation Exposure”
document available for download at www.nj.gov/dep/aqpp/risk.html.
Short-Term and Long-Term Non-Cancer Risk (Hazard Quotient)
The hazard quotient for long-term non-cancer risk is calculated by dividing the maximum annual
average ambient air concentration predicted by AERMOD by the long-term air toxic-specific
RfC:
Hazard Quotient = C/RfC
where:
C = Annual average ambient air concentration from AERMOD (g/m3), of the unique
air toxic
RfC = Reference concentration (g/m3), of the unique air toxic
RfC values for each air toxic can be found on the “Toxicity Values for Inhalation Exposure”
document available at www.nj.gov/dep/aqpp/risk.html. The Reference Concentration (RfC)
column should be used for the long-term non-cancer risk calculation. The Short Term RfC
column should be used for the short-term non-cancer risk.
To assess short-term non-cancer risk, the short term RfC is to be compared with the maximum
average ambient air concentration averaged over the period given in the “RfC Averaging Time”
column in the “Toxicity Values for Inhalation Exposure” document for the air toxic in question:
10
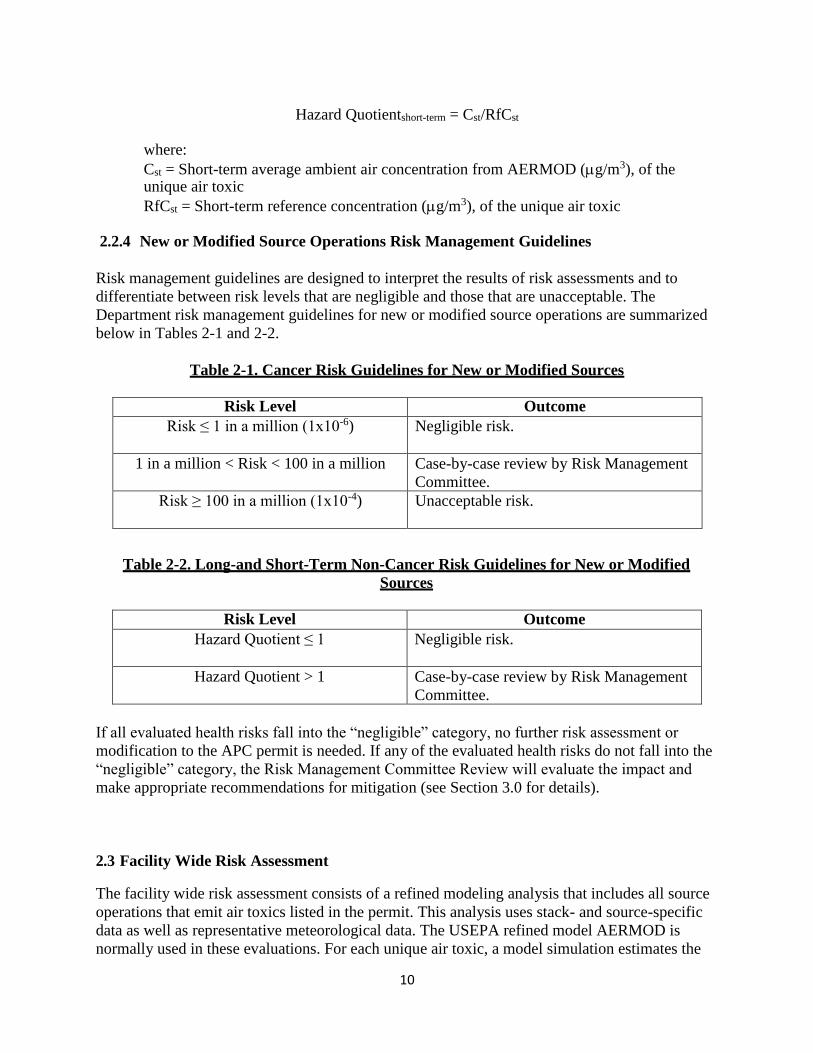
Hazard Quotientshort-term = Cst/RfCst
where:
Cst = Short-term average ambient air concentration from AERMOD (g/m3), of the unique air toxic
RfCst = Short-term reference concentration (g/m3), of the unique air toxic
2.2.4 New or Modified Source Operations Risk Management Guidelines
Risk management guidelines are designed to interpret the results of risk assessments and to
differentiate between risk levels that are negligible and those that are unacceptable. The
Department risk management guidelines for new or modified source operations are summarized
below in Tables 2-1 and 2-2.
Table 2-1. Cancer Risk Guidelines for New or Modified Sources
Risk Level Outcome
Risk ≤ 1 in a million (1x10⁻⁶) Negligible risk.
1 in a million < Risk < 100 in a million Case-by-case review by Risk Management
Committee.
Risk ≥ 100 in a million (1x10⁻⁴) Unacceptable risk.
Table 2-2. Long-and Short-Term Non-Cancer Risk Guidelines for New or Modified
Sources
Risk Level Outcome
Hazard Quotient ≤ 1 Negligible risk.
Hazard Quotient > 1 Case-by-case review by Risk Management
Committee.
If all evaluated health risks fall into the “negligible” category, no further risk assessment or
modification to the APC permit is needed. If any of the evaluated health risks do not fall into the
“negligible” category, the Risk Management Committee Review will evaluate the impact and
make appropriate recommendations for mitigation (see Section 3.0 for details).
2.3 Facility Wide Risk Assessment
The facility wide risk assessment consists of a refined modeling analysis that includes all source
operations that emit air toxics listed in the permit. This analysis uses stack- and source-specific
data as well as representative meteorological data. The USEPA refined model AERMOD is
normally used in these evaluations. For each unique air toxic, a model simulation estimates the
11
cumulative impact from multiple stacks or operations within the facility.
Applicants performing a facility wide risk assessment must submit an atmospheric dispersion
modeling protocol in accordance with procedures outlined in Technical Manual 1002 “Guidance
on Preparing an Air Quality Modeling Protocol.” This manual can be downloaded at
http://www.state.nj.us/dep/aqpp/techman.html. The information contained in the protocol must
be consistent with the information in the permit application for the protocol to be deemed
complete. The protocol must be approved by the Department before the facility wide modeling
study is performed. After the modeling study is complete, the Facility Wide Cancer, and Short-
and Long-Term Non-Cancer Risk Guidelines listed below in Table 2-3 and 2-4 should be used to
determine cancer and non-cancer risks (i.e. Hazard Quotient). Appendix B provides additional
information on the risk assessment process.
Models such as SCREEN3 and AERSCREEN can be proposed on a case-by-case basis for use in
a facility wide risk assessment protocol. The decision to allow proposed air quality models to be
used will be based on the unique characteristics of the equipment and stack parameters being
evaluated. It is recommended that the Department be consulted during protocol development.
The risk screening worksheet can be used as a preliminary alternative to conduct a facility wide
risk assessment for air toxic emissions. It should be noted that this methodology and its results
are subject to the review and approval of the Department. For example, if there are multiple
stacks releasing an air toxic, the screening worksheet can be used to assess the cancer and non-
cancer risks from the facility’s emissions of this air toxic by assuming all of the facility’s
emissions of the air toxic are emitted from each individual stack. Thus, separate risk screening
worksheets (one for each stack) must be submitted assuming that all the facility’s air toxic
emissions are released from each individual stack. The risk screening worksheet for the stack
with the greatest cancer and/or non-cancer risks is used to determine whether further evaluation
is required. The results will be compared to the guidelines in Tables 2-3 and 2-4 of the following
section.
12
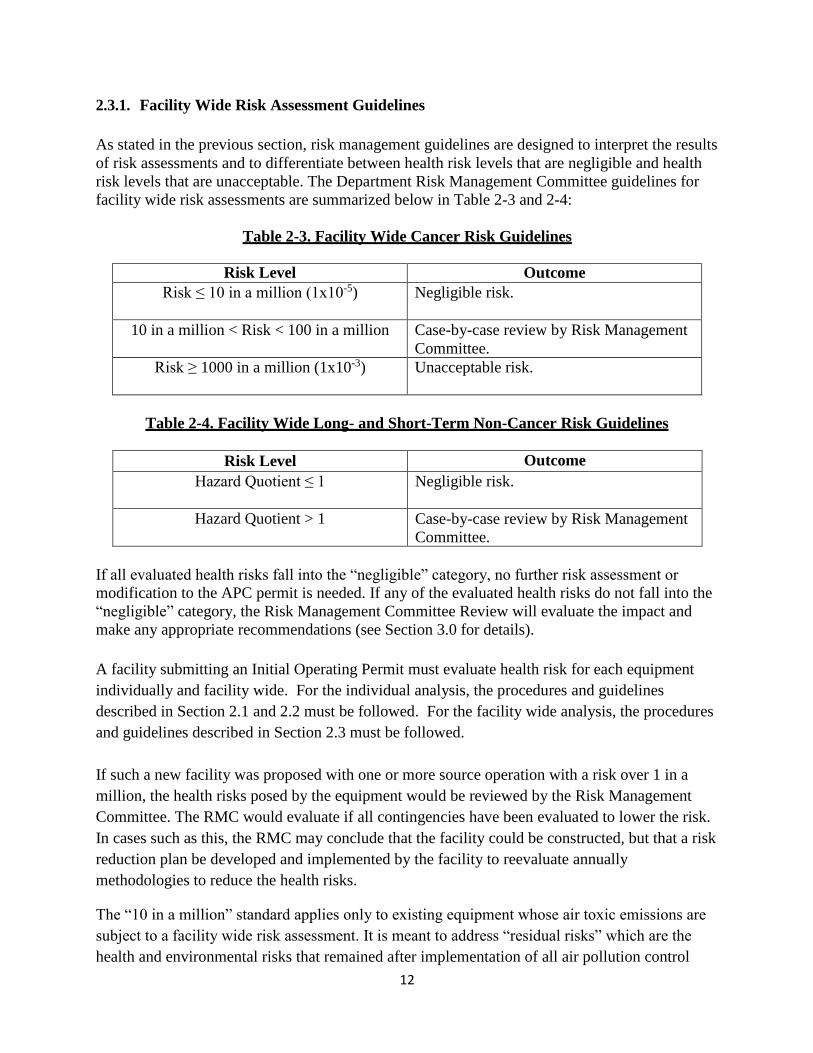
2.3.1. Facility Wide Risk Assessment Guidelines
As stated in the previous section, risk management guidelines are designed to interpret the results
of risk assessments and to differentiate between health risk levels that are negligible and health
risk levels that are unacceptable. The Department Risk Management Committee guidelines for
facility wide risk assessments are summarized below in Table 2-3 and 2-4:
Table 2-3. Facility Wide Cancer Risk Guidelines
Risk Level Outcome
Risk ≤ 10 in a million (1x10⁻⁵) Negligible risk.
10 in a million < Risk < 100 in a million Case-by-case review by Risk Management
Committee.
Risk ≥ 1000 in a million (1x10⁻³) Unacceptable risk.
Table 2-4. Facility Wide Long- and Short-Term Non-Cancer Risk Guidelines
Risk Level Outcome
Hazard Quotient ≤ 1 Negligible risk.
Hazard Quotient > 1 Case-by-case review by Risk Management
Committee.
If all evaluated health risks fall into the “negligible” category, no further risk assessment or
modification to the APC permit is needed. If any of the evaluated health risks do not fall into the
“negligible” category, the Risk Management Committee Review will evaluate the impact and
make any appropriate recommendations (see Section 3.0 for details).
A facility submitting an Initial Operating Permit must evaluate health risk for each equipment
individually and facility wide. For the individual analysis, the procedures and guidelines
described in Section 2.1 and 2.2 must be followed. For the facility wide analysis, the procedures
and guidelines described in Section 2.3 must be followed.
If such a new facility was proposed with one or more source operation with a risk over 1 in a
million, the health risks posed by the equipment would be reviewed by the Risk Management
Committee. The RMC would evaluate if all contingencies have been evaluated to lower the risk.
In cases such as this, the RMC may conclude that the facility could be constructed, but that a risk
reduction plan be developed and implemented by the facility to reevaluate annually
methodologies to reduce the health risks.
The “10 in a million” standard applies only to existing equipment whose air toxic emissions are
subject to a facility wide risk assessment. It is meant to address “residual risks” which are the
health and environmental risks that remained after implementation of all air pollution control
13
standards which were in effect when the equipment was first permitted. This process is
consistent with Section 112 of the Federal Clean Air Act which evaluates residual risk within
eight years of the implementation of a MACT standard.
14
3.0 RISK MANAGEMENT COMMITTEE REVIEW
If the outcome of a refined risk assessment or a facility wide risk assessment is not “negligible,”
the permit application and air quality dispersion modeling results will be forwarded to the
Department’s Risk Management Committee (RMC). The RMC includes supervisory staff from
each of the following: air quality evaluation section; the appropriate permitting section (Pre-
Construction Permits or Operating Permits); and the appropriate regional air enforcement office.
Additionally, supervisors may assign staff to provide technical expertise.
The RMC evaluates the application and related materials to identify risk reduction strategies that
may facilitate permit approval. The RMC may consider, but are not limited to the following
factors: overall impact on the sensitive receptor population; the uncertainties associated with the
health risk; compliance history; previous compliance efforts by the facility; new and pending
regulations; and cost analysis. Based upon the RMC’s analysis of the above-listed factors, the
RMC may recommend actions such as:
1. Applying better air pollution controls to lower emissions;
2. Modifying stack parameters to increase dispersion (for example, increase the stack
height); and/or
3. Implementing applicable risk minimization strategies to reduce risk in the
surrounding community.
The permitting section will discuss the RMC’s recommendations with the facility. The
permit application is reevaluated based on the facility’s response. If the facility agrees to
make modifications that lowers the health risk to a negligible level, no further input from the
RMC is necessary. However, if the facility’s proposed modifications do not lower the risk to
a negligible level, the RMC may reconvene to discuss the facility’s response and to
determine whether the facility should be required to implement additional strategies to
reduce the risk levels.
15
APPENDIX A
ACRONYMS & GLOSSARY
Air Toxics: Also known as toxic air pollutants or hazardous air pollutants, these are chemicals that cause or may cause serious effects in humans, and may be emitted into the air in quantities
that are large enough to cause adverse health effects. These effects cover a wide range of
conditions from lung irritation to birth defects to cancer. Health concerns may be associated
with both short and long-term exposures to these pollutants. Many are known to have
respiratory, neurological, immune or reproductive effects, particularly for more susceptible
sensitive populations such as children. There are 187 air toxics listed as “hazardous air
pollutants” in the 1990 Clean Air Act.
Carcinogen: A chemical for which there is some evidence (either in animals or humans) that it
may cause cancer.
Department: New Jersey Department of Environmental Protection
Exposure: Contact with a substance through inhalation, ingestion or some other means for a
specific period of time.
Hazardous Air Pollutants (HAP): In general, an "air toxic." Specifically, this also refers to
any of the 187 air toxic pollutants listed in the 1990 Clean Air Act amendments 42 U.S.C.
§7412(b). This list is incorporated into N.J.A.C. 7:27-17.
Hazard Quotient: An estimate of the potential for a detrimental non-cancer health effect from
exposure to a chemical.
Non-carcinogen: A pollutant that can cause adverse health effects other than cancer.
Reference Concentration (RfC): An estimate (with uncertainty spanning perhaps an order of
magnitude) of a continuous inhalation exposure to the human population (including sensitive
subgroups) that is likely to be without an appreciable risk of harmful effects during a lifetime. It
can be derived from various types of human or animal data, with uncertainty factors generally
applied to reflect limitations of the data used.
Slope Factor (SF): An upper-bound, approximating a 95% confidence limit, on the increased
cancer risk from a lifetime exposure to an agent. This estimate is usually expressed in units of
proportion (of a population) affected per mg/kg-day.
Unit Risk Factor (URF): The upper-bound excess lifetime cancer risk estimated to result from
continuous exposure to a chemical at a concentration of 1 µg/m3 in air. For example, if a
chemical’s URF is 2 x 10⁻⁶ (µg/m3), then a person exposed daily for a lifetime to 1 µg of the chemical in 1 cubic meter of air would have an increased risk of cancer equal to 2 in a million.
USEPA: United States Environmental Protection Agency.
16
Volatile Organic Compounds (VOCs): Any compound of carbon, excluding carbon monoxide,
carbon dioxide, carbonic acid, metallic carbides or carbonates, and ammonium carbonate, which
participates in atmospheric photochemical reactions as defined by the EPA at 40 CFR 51.100(s),
and incorporated into N.J.A.C. 7:27-8 and 22. VOCs include gasoline, and industrial chemicals
such as benzene, solvents such as toluene and xylene. Many VOCs are also HAPs.
17
APPENDIX B
THE RISK ASSESSMENT PROCESS
Risk Assessment Process
In 1986, the USEPA established risk assessment guidelines in order to provide consistency and
technical support between USEPA and other regulatory agencies. The guidelines were based on
recommendations from the National Research Council (NRC 1983). NRC divided the risk
assessment process into four steps, which are described below.
Step 1 - Hazard Identification
Hazard identification is the process used to determine the potential human health effects from
exposure to an air toxic. This is based on information provided by the scientific literature. For
air toxics sources, hazard identification involves identifying whether a hazard exists, and if so,
identifying the exact pollutants of concern. Hazard Identification takes into consideration
whether a pollutant is a potential human carcinogen or is associated with other types of adverse
health effects. For hazard identification in relation to an air permit, the following is considered:
A. Which contaminants will be emitted from the source;
B. Which of these contaminants have known health effects; and
C. The specific toxicological effects of these air toxics.
Step 2 - Dose-Response Assessment
Dose-response assessment is the characterization of the relationship between a chemical (air
toxic) exposure, or dose, and the incidence and severity of an adverse health effect. It takes into
consideration factors that influence this relationship, including intensity and pattern of exposure,
and age and lifestyle variables that may affect susceptibility. It may also involve extrapolation
from high-dose to low-dose responses, and from animal to human responses. This information is
gathered from epidemiological or laboratory studies done by federal or state agencies, health
organizations, academic institutions, and others.
Dose-response assessment as utilized in the air permitting process involves the quantification (in
terms of severity or likelihood) of toxicological effects of individual chemicals on humans. The
dose-response relationship is evaluated differently for carcinogenic (cancer-causing) and non-
carcinogenic substances.
For carcinogens, it is assumed that there is a linear relationship between an increase in dose or exposure concentration and an increase in cancer risk, with no threshold. This is expressed as a
potency slope or slope factor (SF), in units “per milligram (of chemical) per kilogram (of body
weight) per day” or (mg/kg/day)-1. To evaluate health risks from inhalation of carcinogenic
substances, USEPA and other regulatory agencies use potency slopes to develop unit risk
factors (URFs). A URF can be defined as the upper-bound excess probability of contracting
18
cancer as the result of a lifetime of exposure to a carcinogen at a concentration of 1 µg/m3 in air.
URF units are “per microgram (of chemical) per cubic meter (of air)” or (µg/m3)-1.
Step 3 - Exposure Assessment
The exposure assessment step determines the extent (intensity, frequency, and duration, or dose)
of human exposure to a chemical in the environment. There are three components to the
exposure assessment:
A. Estimation of the maximum quantity of each pollutant emitted from the source of
concern (based on data from previously existing sources or engineering estimates);
B. For each contaminant emitted from a source, estimation of the resulting maximum
annual average and (where applicable) maximum short-term average ambient air
concentrations, using dispersion models, or air impact values based on dispersion
models; and
C. Estimation of the amount of contaminant taken in by a human receptor.
Step 4 - Risk Characterization
Risk characterization is the final step in risk assessment. At this step, human health risk is
calculated and described based on the information gathered in the first three steps. The risk
characterization also includes some consideration of uncertainty, scientific judgment, and the
major assumptions that were made, especially regarding exposure. Human health risk estimates
for inhalation of carcinogens are based on the following calculation:
Cancer Risk = C x URF
where:
C = maximum annual average ambient air concentration of a pollutant, g/m3
URF = pollutant-specific inhalation unit risk factor, (g/m3)-1
Human health risk estimates for inhalation of non-carcinogens are based on the following
calculations:
Hazard Quotient = C/RfC
where:
C = maximum ambient air concentration, g/m3
RfC = pollutant-specific reference concentration, g/m3
The averaging time for non-carcinogen concentrations can be either annual, or a specific number
of hours, depending on the basis of the reference dose (see the list of averaging times for short-
term inhalation exposure in the “Toxicity Values for Inhalation Exposure” document available at
http://www.state.nj.us/dep/aqpp/risk.html).
19
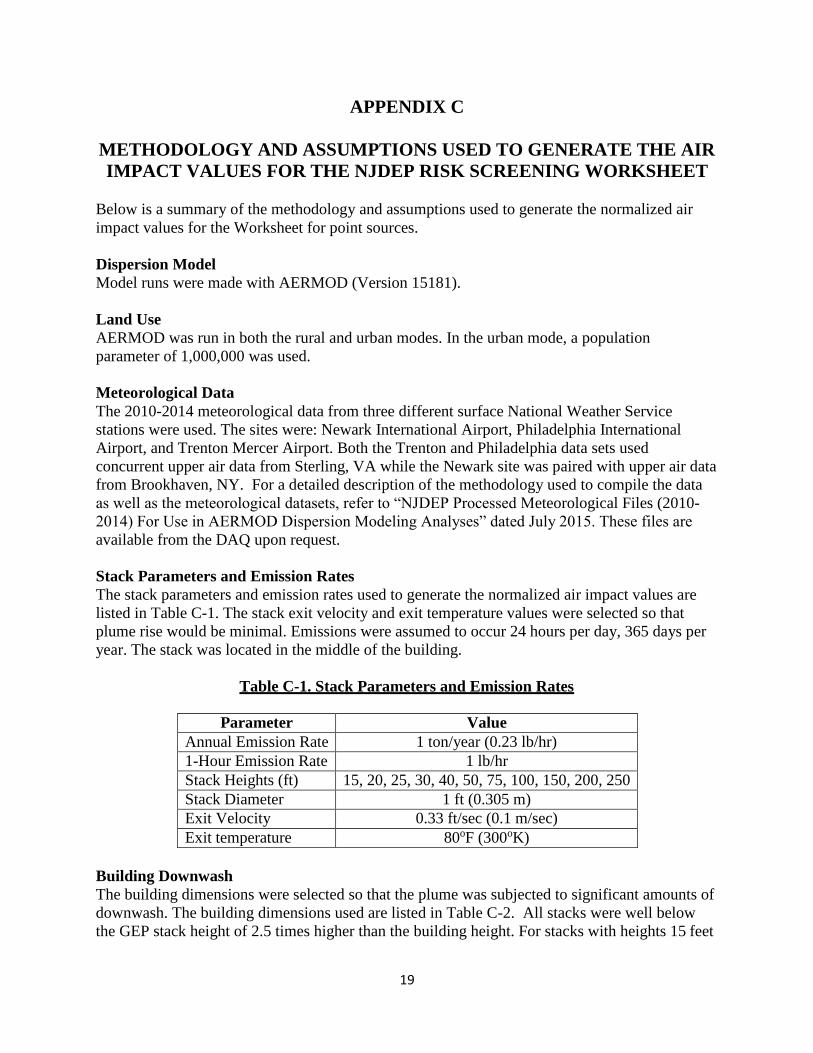
APPENDIX C
METHODOLOGY AND ASSUMPTIONS USED TO GENERATE THE AIR
IMPACT VALUES FOR THE NJDEP RISK SCREENING WORKSHEET
Below is a summary of the methodology and assumptions used to generate the normalized air
impact values for the Worksheet for point sources.
Dispersion Model
Model runs were made with AERMOD (Version 15181).
Land Use
AERMOD was run in both the rural and urban modes. In the urban mode, a population
parameter of 1,000,000 was used.
Meteorological Data
The 2010-2014 meteorological data from three different surface National Weather Service
stations were used. The sites were: Newark International Airport, Philadelphia International
Airport, and Trenton Mercer Airport. Both the Trenton and Philadelphia data sets used
concurrent upper air data from Sterling, VA while the Newark site was paired with upper air data
from Brookhaven, NY. For a detailed description of the methodology used to compile the data
as well as the meteorological datasets, refer to “NJDEP Processed Meteorological Files (2010-
2014) For Use in AERMOD Dispersion Modeling Analyses” dated July 2015. These files are
available from the DAQ upon request.
Stack Parameters and Emission Rates
The stack parameters and emission rates used to generate the normalized air impact values are
listed in Table C-1. The stack exit velocity and exit temperature values were selected so that
plume rise would be minimal. Emissions were assumed to occur 24 hours per day, 365 days per
year. The stack was located in the middle of the building.
Table C-1. Stack Parameters and Emission Rates
Parameter Value
Annual Emission Rate 1 ton/year (0.23 lb/hr)
1-Hour Emission Rate 1 lb/hr
Stack Heights (ft) 15, 20, 25, 30, 40, 50, 75, 100, 150, 200, 250
Stack Diameter 1 ft (0.305 m)
Exit Velocity 0.33 ft/sec (0.1 m/sec)
Exit temperature 80oF (300oK)
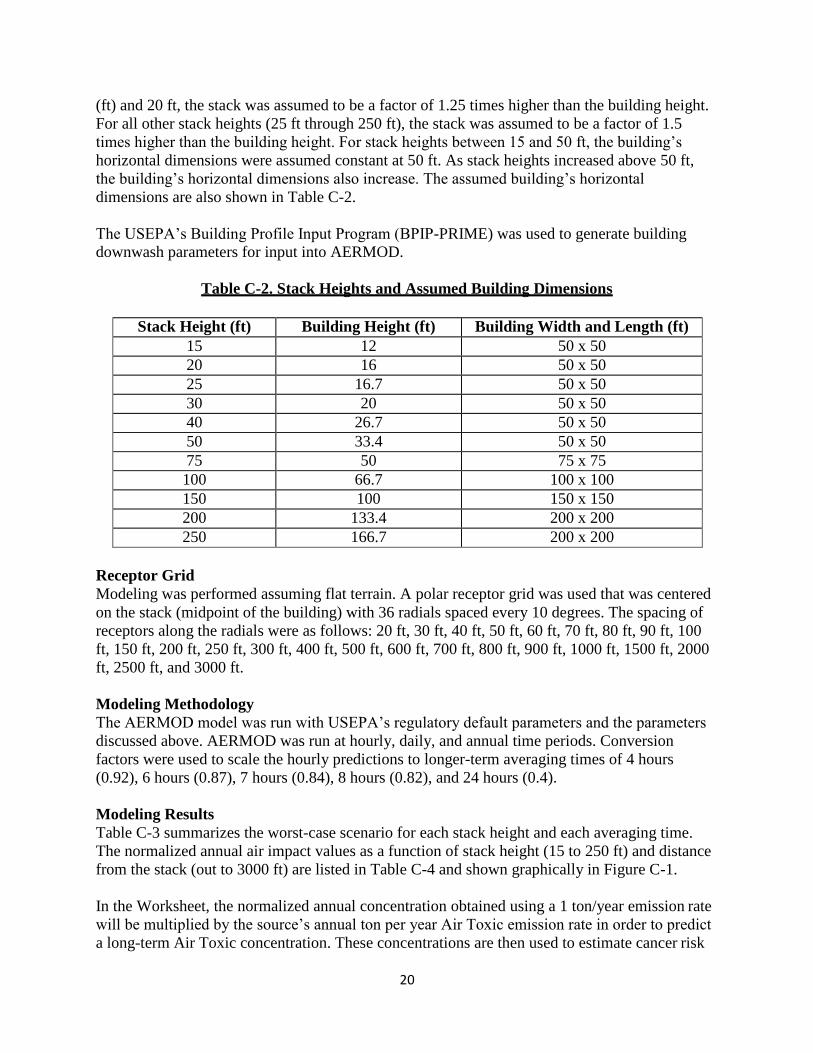
Building Downwash
The building dimensions were selected so that the plume was subjected to significant amounts of
downwash. The building dimensions used are listed in Table C-2. All stacks were well below
the GEP stack height of 2.5 times higher than the building height. For stacks with heights 15 feet
20
(ft) and 20 ft, the stack was assumed to be a factor of 1.25 times higher than the building height.
For all other stack heights (25 ft through 250 ft), the stack was assumed to be a factor of 1.5
times higher than the building height. For stack heights between 15 and 50 ft, the building’s
horizontal dimensions were assumed constant at 50 ft. As stack heights increased above 50 ft,
the building’s horizontal dimensions also increase. The assumed building’s horizontal
dimensions are also shown in Table C-2.
The USEPA’s Building Profile Input Program (BPIP-PRIME) was used to generate building
downwash parameters for input into AERMOD.
Table C-2. Stack Heights and Assumed Building Dimensions
Stack Height (ft) Building Height (ft) Building Width and Length (ft)
15 12 50 x 50
20 16 50 x 50
25 16.7 50 x 50
30 20 50 x 50
40 26.7 50 x 50
50 33.4 50 x 50
75 50 75 x 75
100 66.7 100 x 100
150 100 150 x 150
200 133.4 200 x 200
250 166.7 200 x 200
Receptor Grid
Modeling was performed assuming flat terrain. A polar receptor grid was used that was centered
on the stack (midpoint of the building) with 36 radials spaced every 10 degrees. The spacing of
receptors along the radials were as follows: 20 ft, 30 ft, 40 ft, 50 ft, 60 ft, 70 ft, 80 ft, 90 ft, 100
ft, 150 ft, 200 ft, 250 ft, 300 ft, 400 ft, 500 ft, 600 ft, 700 ft, 800 ft, 900 ft, 1000 ft, 1500 ft, 2000
ft, 2500 ft, and 3000 ft.
Modeling Methodology
The AERMOD model was run with USEPA’s regulatory default parameters and the parameters
discussed above. AERMOD was run at hourly, daily, and annual time periods. Conversion
factors were used to scale the hourly predictions to longer-term averaging times of 4 hours
(0.92), 6 hours (0.87), 7 hours (0.84), 8 hours (0.82), and 24 hours (0.4).
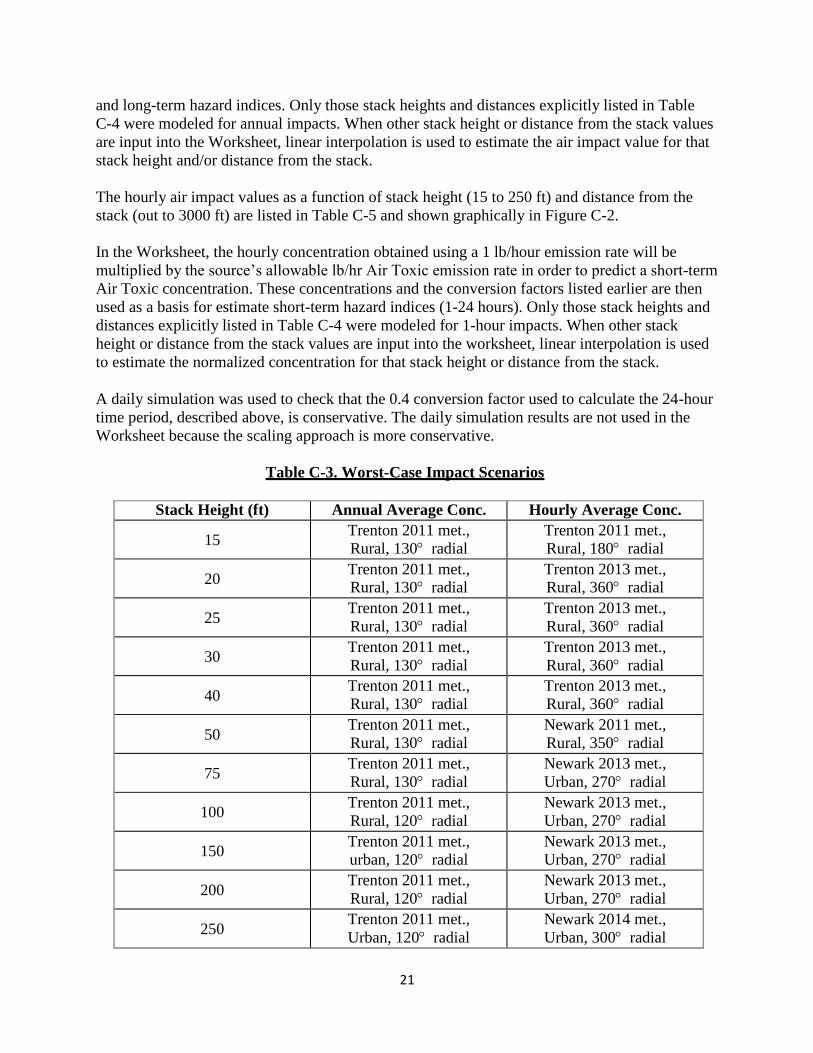
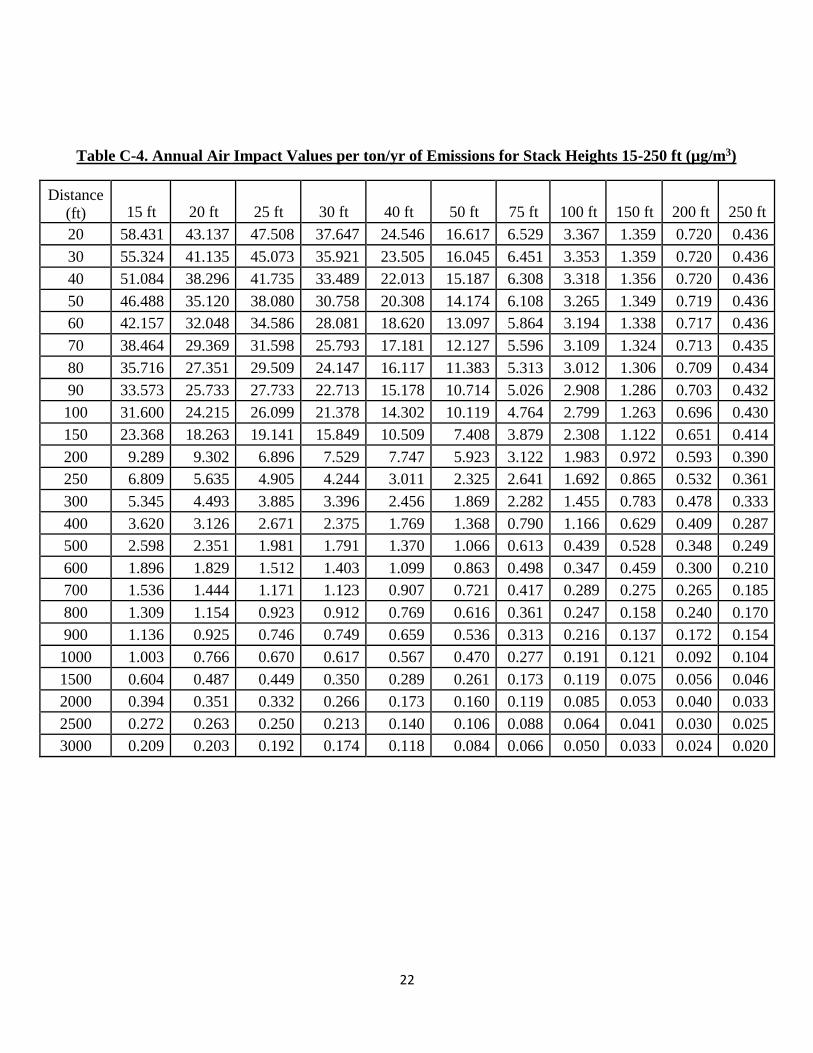
Modeling Results
Table C-3 summarizes the worst-case scenario for each stack height and each averaging time.
The normalized annual air impact values as a function of stack height (15 to 250 ft) and distance
from the stack (out to 3000 ft) are listed in Table C-4 and shown graphically in Figure C-1.
In the Worksheet, the normalized annual concentration obtained using a 1 ton/year emission rate
will be multiplied by the source’s annual ton per year Air Toxic emission rate in order to predict
a long-term Air Toxic concentration. These concentrations are then used to estimate cancer risk
21
and long-term hazard indices. Only those stack heights and distances explicitly listed in Table
C-4 were modeled for annual impacts. When other stack height or distance from the stack values
are input into the Worksheet, linear interpolation is used to estimate the air impact value for that
stack height and/or distance from the stack.
The hourly air impact values as a function of stack height (15 to 250 ft) and distance from the
stack (out to 3000 ft) are listed in Table C-5 and shown graphically in Figure C-2.
In the Worksheet, the hourly concentration obtained using a 1 lb/hour emission rate will be
multiplied by the source’s allowable lb/hr Air Toxic emission rate in order to predict a short-term
Air Toxic concentration. These concentrations and the conversion factors listed earlier are then
used as a basis for estimate short-term hazard indices (1-24 hours). Only those stack heights and
distances explicitly listed in Table C-4 were modeled for 1-hour impacts. When other stack
height or distance from the stack values are input into the worksheet, linear interpolation is used
to estimate the normalized concentration for that stack height or distance from the stack.
A daily simulation was used to check that the 0.4 conversion factor used to calculate the 24-hour
time period, described above, is conservative. The daily simulation results are not used in the
Worksheet because the scaling approach is more conservative.
Table C-3. Worst-Case Impact Scenarios
Stack Height (ft) Annual Average Conc. Hourly Average Conc.
15 Trenton 2011 met.,
Rural, 130 radial
Trenton 2011 met.,
Rural, 180 radial
20 Trenton 2011 met., Rural, 130 radial
Trenton 2013 met., Rural, 360 radial
25 Trenton 2011 met.,
Rural, 130 radial
Trenton 2013 met.,
Rural, 360 radial
30 Trenton 2011 met.,
Rural, 130 radial
Trenton 2013 met.,
Rural, 360 radial
40 Trenton 2011 met.,
Rural, 130 radial
Trenton 2013 met.,
Rural, 360 radial
50 Trenton 2011 met.,
Rural, 130 radial
Newark 2011 met.,
Rural, 350 radial
75 Trenton 2011 met.,
Rural, 130 radial
Newark 2013 met.,
Urban, 270 radial
100 Trenton 2011 met.,
Rural, 120 radial
Newark 2013 met.,
Urban, 270 radial
150 Trenton 2011 met.,
urban, 120 radial
Newark 2013 met.,
Urban, 270 radial
200 Trenton 2011 met.,
Rural, 120 radial
Newark 2013 met.,
Urban, 270 radial
250 Trenton 2011 met.,
Urban, 120 radial
Newark 2014 met.,
Urban, 300 radial
22
Table C-4. Annual Air Impact Values per ton/yr of Emissions for Stack Heights 15-250 ft (µg/m3)
Distance
(ft)
15 ft
20 ft
25 ft
30 ft
40 ft
50 ft
75 ft
100 ft
150 ft
200 ft
250 ft
20 58.431 43.137 47.508 37.647 24.546 16.617 6.529 3.367 1.359 0.720 0.436
30 55.324 41.135 45.073 35.921 23.505 16.045 6.451 3.353 1.359 0.720 0.436
40 51.084 38.296 41.735 33.489 22.013 15.187 6.308 3.318 1.356 0.720 0.436
50 46.488 35.120 38.080 30.758 20.308 14.174 6.108 3.265 1.349 0.719 0.436
60 42.157 32.048 34.586 28.081 18.620 13.097 5.864 3.194 1.338 0.717 0.436
70 38.464 29.369 31.598 25.793 17.181 12.127 5.596 3.109 1.324 0.713 0.435
80 35.716 27.351 29.509 24.147 16.117 11.383 5.313 3.012 1.306 0.709 0.434
90 33.573 25.733 27.733 22.713 15.178 10.714 5.026 2.908 1.286 0.703 0.432
100 31.600 24.215 26.099 21.378 14.302 10.119 4.764 2.799 1.263 0.696 0.430
150 23.368 18.263 19.141 15.849 10.509 7.408 3.879 2.308 1.122 0.651 0.414
200 9.289 9.302 6.896 7.529 7.747 5.923 3.122 1.983 0.972 0.593 0.390
250 6.809 5.635 4.905 4.244 3.011 2.325 2.641 1.692 0.865 0.532 0.361
300 5.345 4.493 3.885 3.396 2.456 1.869 2.282 1.455 0.783 0.478 0.333
400 3.620 3.126 2.671 2.375 1.769 1.368 0.790 1.166 0.629 0.409 0.287
500 2.598 2.351 1.981 1.791 1.370 1.066 0.613 0.439 0.528 0.348 0.249
600 1.896 1.829 1.512 1.403 1.099 0.863 0.498 0.347 0.459 0.300 0.210
700 1.536 1.444 1.171 1.123 0.907 0.721 0.417 0.289 0.275 0.265 0.185
800 1.309 1.154 0.923 0.912 0.769 0.616 0.361 0.247 0.158 0.240 0.170
900 1.136 0.925 0.746 0.749 0.659 0.536 0.313 0.216 0.137 0.172 0.154
1000 1.003 0.766 0.670 0.617 0.567 0.470 0.277 0.191 0.121 0.092 0.104
1500 0.604 0.487 0.449 0.350 0.289 0.261 0.173 0.119 0.075 0.056 0.046
2000 0.394 0.351 0.332 0.266 0.173 0.160 0.119 0.085 0.053 0.040 0.033
2500 0.272 0.263 0.250 0.213 0.140 0.106 0.088 0.064 0.041 0.030 0.025
3000 0.209 0.203 0.192 0.174 0.118 0.084 0.066 0.050 0.033 0.024 0.020
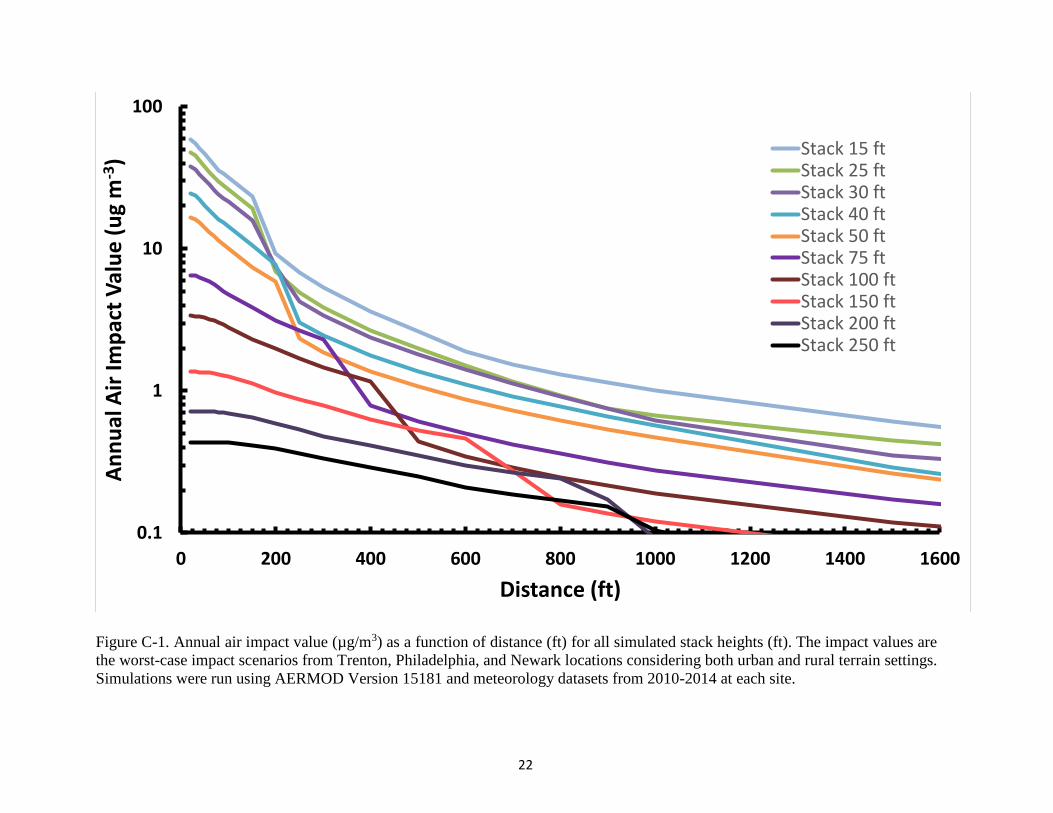
Figure C-1. Annual air impact value (µg/m3) as a function of distance (ft) for all simulated stack heights (ft). The impact values are
the worst-case impact scenarios from Trenton, Philadelphia, and Newark locations considering both urban and rural terrain settings.
Simulations were run using AERMOD Version 15181 and meteorology datasets from 2010-2014 at each site.
22
0.1
1
10
100
0 200 400 600 800 1000 1200 1400 1600
An
nu
al A
ir Im
pac
t V
alu
e (
ug
m-3
)
Distance (ft)
Stack 15 ftStack 25 ftStack 30 ftStack 40 ftStack 50 ftStack 75 ftStack 100 ftStack 150 ftStack 200 ftStack 250 ft
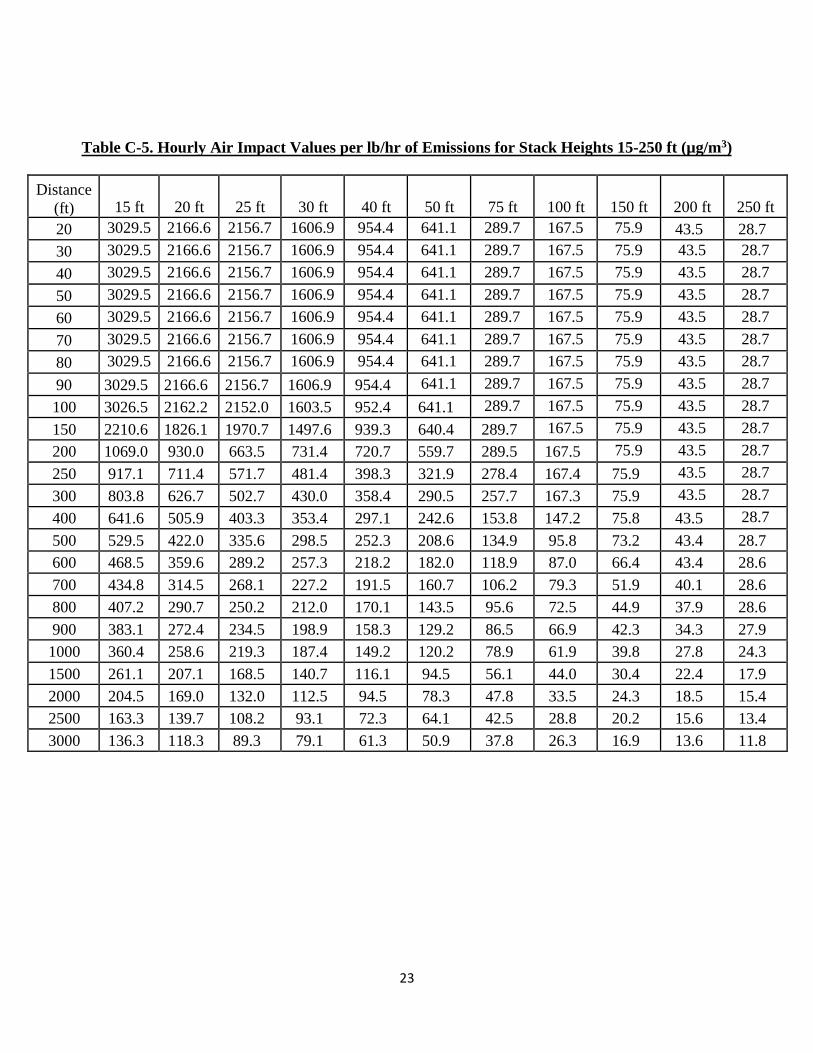
Table C-5. Hourly Air Impact Values per lb/hr of Emissions for Stack Heights 15-250 ft (µg/m3)
Distance
(ft)
15 ft
20 ft
25 ft
30 ft
40 ft
50 ft
75 ft
100 ft
150 ft
200 ft
250 ft
20 3029.5 2166.6 2156.7 1606.9 954.4 641.1 289.7 167.5 75.9 43.5 28.7
30 3029.5 2166.6 2156.7 1606.9 954.4 641.1 289.7 167.5 75.9 43.5 28.7
40 3029.5 2166.6 2156.7 1606.9 954.4 641.1 289.7 167.5 75.9 43.5 28.7
50 3029.5 2166.6 2156.7 1606.9 954.4 641.1 289.7 167.5 75.9 43.5 28.7
60 3029.5 2166.6 2156.7 1606.9 954.4 641.1 289.7 167.5 75.9 43.5 28.7
70 3029.5 2166.6 2156.7 1606.9 954.4 641.1 289.7 167.5 75.9 43.5 28.7
80 3029.5 2166.6 2156.7 1606.9 954.4 641.1 289.7 167.5 75.9 43.5 28.7
90 3029.5 2166.6 2156.7 1606.9 954.4 641.1 289.7 167.5 75.9 43.5 28.7
100 3026.5 2162.2 2152.0 1603.5 952.4 641.1 289.7 167.5 75.9 43.5 28.7
150 2210.6 1826.1 1970.7 1497.6 939.3 640.4 289.7 167.5 75.9 43.5 28.7
200 1069.0 930.0 663.5 731.4 720.7 559.7 289.5 167.5 75.9 43.5 28.7
250 917.1 711.4 571.7 481.4 398.3 321.9 278.4 167.4 75.9 43.5 28.7
300 803.8 626.7 502.7 430.0 358.4 290.5 257.7 167.3 75.9 43.5 28.7
400 641.6 505.9 403.3 353.4 297.1 242.6 153.8 147.2 75.8 43.5 28.7
500 529.5 422.0 335.6 298.5 252.3 208.6 134.9 95.8 73.2 43.4 28.7
600 468.5 359.6 289.2 257.3 218.2 182.0 118.9 87.0 66.4 43.4 28.6
700 434.8 314.5 268.1 227.2 191.5 160.7 106.2 79.3 51.9 40.1 28.6
800 407.2 290.7 250.2 212.0 170.1 143.5 95.6 72.5 44.9 37.9 28.6
900 383.1 272.4 234.5 198.9 158.3 129.2 86.5 66.9 42.3 34.3 27.9
1000 360.4 258.6 219.3 187.4 149.2 120.2 78.9 61.9 39.8 27.8 24.3
1500 261.1 207.1 168.5 140.7 116.1 94.5 56.1 44.0 30.4 22.4 17.9
2000 204.5 169.0 132.0 112.5 94.5 78.3 47.8 33.5 24.3 18.5 15.4
2500 163.3 139.7 108.2 93.1 72.3 64.1 42.5 28.8 20.2 15.6 13.4
3000 136.3 118.3 89.3 79.1 61.3 50.9 37.8 26.3 16.9 13.6 11.8
23
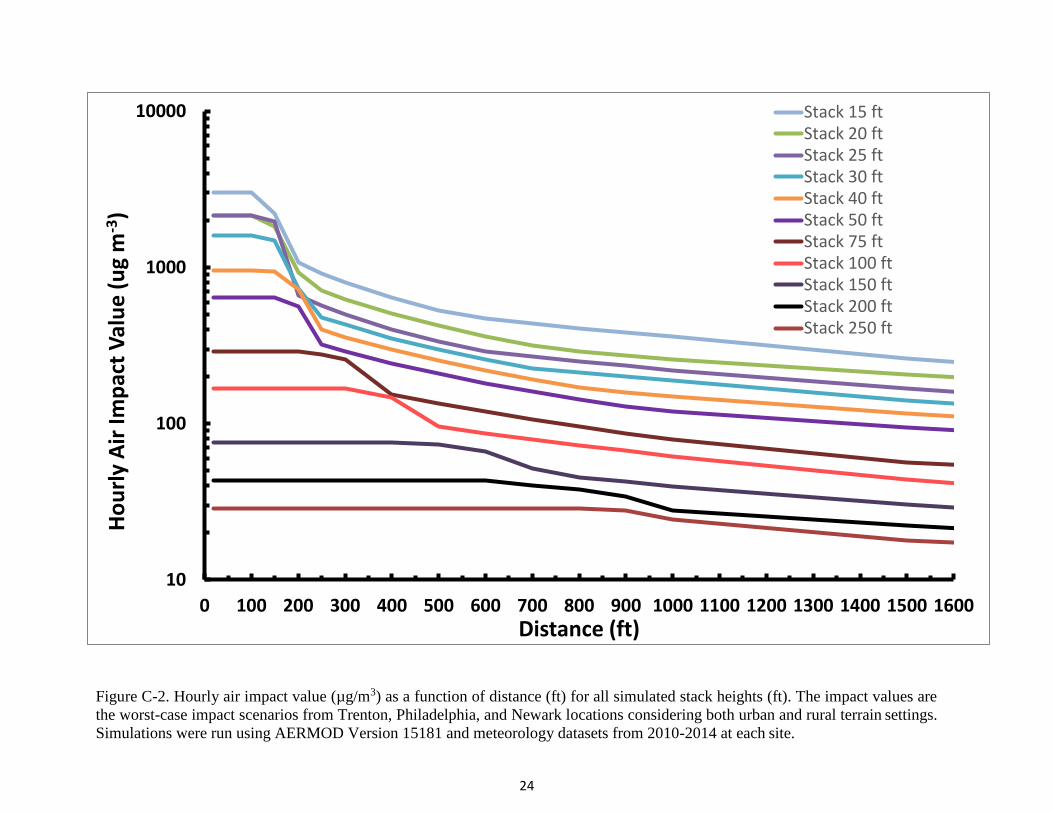
Figure C-2. Hourly air impact value (µg/m3) as a function of distance (ft) for all simulated stack heights (ft). The impact values are
the worst-case impact scenarios from Trenton, Philadelphia, and Newark locations considering both urban and rural terrain settings.
Simulations were run using AERMOD Version 15181 and meteorology datasets from 2010-2014 at each site.
24
10
100
1000
10000
0 100 200 300 400 500 600 700 800 900 1000 1100 1200 1300 1400 1500 1600
Ho
url
y A
ir Im
pac
t V
alu
e (
ug
m-3
)
Distance (ft)
Stack 15 ftStack 20 ftStack 25 ftStack 30 ftStack 40 ftStack 50 ftStack 75 ftStack 100 ftStack 150 ftStack 200 ftStack 250 ft
25
Conservatism in the Modeling of Air Impact Values and Risk Screening Worksheet
• The highest impact predicted from either the urban or rural mode was used for the risk
assessment.
• The highest impact predicted from any of the thirty model simulations for each stack height
was used.
• Of the 36 wind directions modeled, the direction for which the receptor radial had the highest
concentrations was selected.
• Minimal plume rise was assumed.
• All stack heights were well below their GEP stack heights and subject to large amounts of
building downwash.
• The stacks were located in the center of the building. When evaluating all wind directions,
this location will produce the maximum amount of downwash.
• Emissions were assumed to occur continuously 24-hours a day, 365 days a year.
26
APPENDIX D
REFERENCES
California Air Toxics Hot Spots Guidelines, www.oehha.ca.gov/air/hot_spots/index.html.
National Research Council (NRC) 1983. Risk Assessment in the Federal Government:
Managing the Process. National Academy Press, Washington, D.C.
New Jersey Administrative Code, Title 7, Chapter 27, Subchapter 8 (N.J.A.C. 7:27-8). Permits
and Certificates.
N.J.A.C. 7:27-17. Control and Prohibition of Air Pollution by Toxic Substances.
N.J.A.C. 7:27-18. Control and Prohibition of Air Pollution from New or Altered Sources
Affecting Ambient Air Quality.
NJDEP 2016. AQPP Technical Manual 1002: Guidance on Preparing an Air Quality Modeling
Protocol. Trenton, NJ.
NJDEP July 2015. Processed Meteorological Files (2010-2014) For Use in AERMOD
Dispersion Modeling Analyses.
NJDEP Risk Screening Tools, www.nj.gov/dep/aqpp/risk.html.
U.S. Environmental Protection Agency (USEPA) 1997. Exposure Factors Handbook – August
1997. National Center for Environmental Assessment,
http://cfpub.epa.gov/ncea/cfm/recordisplay.cfm?deid=12464.
USEPA 2005. Guidelines for Carcinogen Risk Assessment, March 2005. Risk Assessment
Forum, http://cfpub.epa.gov/ncea/cfm/recordisplay.cfm?deid=116283.
USEPA 2008. Child-Specific Exposure Factors Handbook, September 2008. National Center for
Environmental Assessment, http://cfpub.epa.gov/ncea/cfm/recordisplay.cfm?deid=56747.
USEPA. Integrated Risk Information System (IRIS), www.epa.gov/iris.