new insights into old methods for identifying causal rare variants
TRANSCRIPT
PROCEEDINGS Open Access
New insights into old methods for identifyingcausal rare variantsHaitian Wang1, Chien-Hsun Huang2, Shaw-Hwa Lo2, Tian Zheng2, Inchi Hu1*
From Genetic Analysis Workshop 17Boston, MA, USA. 13-16 October 2010
Abstract
The advance of high-throughput next-generation sequencing technology makes possible the analysis of rarevariants. However, the investigation of rare variants in unrelated-individuals data sets faces the challenge of lowpower, and most methods circumvent the difficulty by using various collapsing procedures based on genes,pathways, or gene clusters. We suggest a new way to identify causal rare variants using the F-statistic and slicedinverse regression. The procedure is tested on the data set provided by the Genetic Analysis Workshop 17(GAW17). After preliminary data reduction, we ranked markers according to their F-statistic values. Top-rankedmarkers were then subjected to sliced inverse regression, and those with higher absolute coefficients in the mostsignificant sliced inverse regression direction were selected. The procedure yields good false discovery rates for theGAW17 data and thus is a promising method for future study on rare variants.
BackgroundThere is a growing interest in the role of rare variants indisease etiology—rare in the sense that the minor allelefrequency (MAF) is less than 1%. Earlier genome-wideassociation studies identified risk loci that accounted foronly 5–10% of disease heritability [1]. There is now anincreasing body of evidence that suggests an associationbetween the rare variants and complex diseases [2].However, the small variance of rare variants makes theirassociation with phenotypes difficult to detect. Toincrease the detection power of such associations, mostexisting methods collapse the rare variants using biolo-gical information. Some of these collapsing methods arebased on genes or pathways, whereas others involvefunctionality, synonymous single-nucleotide polymorph-isms (SNPs), or nonsynonymous SNPs [3]. Although thecollapsing methods increase the allele frequency so thatthe risk effect is amplified, the noise in the collapsedvariables may also increase. This could render the col-lapsing method less effective in some cases.
In this paper, we propose a three-step method thatdoes not use collapsing. After removing the SNPs thatare identical in value across all subjects in the data, wecalculate the F-statistic for all the markers. We showthat the F-statistic does not down-weight a rare variantdespite its low allele frequency and thus is effective incapturing the effect of the rare variant. Next, we applysliced inverse regression (SIR) to top-ranked markersselected by the F-statistic. When the number of selectedtop markers is not too large, we find that SIR performswell in identifying the SNPs used to simulate theGenetic Analysis Workshop 17 (GAW17) phenotypesfrom the top markers (hereafter these SNPs are referredto as the answers).
MethodsData setThe data set [4] from GAW17 consists of 24,487 SNPsand 697 unrelated individuals. The genotypes are realsequencing data from the 1000 Genomes Project. Inparticular, rare variants (i.e., MAF < 1%) make up 74%of the total variants. Based on the same genotypes, 200replications are simulated. Four phenotypes are availablefor analysis: the quantitative traits Q1, Q2, Q4, and thedisease affected status. In this paper, we use Q1 to
* Correspondence: [email protected] of Information Systems, Business Statistics, and OperationsManagement, Hong Kong University of Science and Technology, Clear WaterBay, Kowloon, Hong KongFull list of author information is available at the end of the article
Wang et al. BMC Proceedings 2011, 5(Suppl 9):S50http://www.biomedcentral.com/1753-6561/5/S9/S50
© 2011 Wang et al; licensee BioMed Central Ltd. This is an open access article distributed under the terms of the Creative CommonsAttribution License (http://creativecommons.org/licenses/by/2.0), which permits unrestricted use, distribution, and reproduction inany medium, provided the original work is properly cited.
illustrate our method, which is influenced by 39 SNPs in9 genes. Although the method is applicable to Q2,which is influenced by 72 SNPs in 13 genes, the resultis not reported here. Q4 is too noisy to obtain meaning-ful conclusions. Our method does not require any infor-mation on the answers, although we use the informationto assess the performance of the method.
Preliminary data reductionBecause most of the SNPs are rare variants, many ofthem take identical values across all individuals in thedata set; that is, statistically they are indistinguishable.In the preliminary data reduction step, we remove theidentical-valued SNPs and keep track of them for laterreference. By doing so, we reduce the 24,487 SNPs to15,124 distinguishable markers. The benefit of this pro-cedure is twofold. First, the dimension is reduced forsubsequent statistical analysis, and, second, removingidentical-valued SNPs prevents the numerical problemscaused by degenerate matrices in regression and princi-pal component types of analyses.
Selection by F-statisticsThe F-statistic, as defined in the simple linear regressionmodel, takes the form:
Fn
Y Y
Y Y n
i
i
n
i i
i
n=−
=
−( )
−( ) −
=
=
∑
∑SSR
SSE/
/ ( )
/
/ ( )
,1
2
1
2
2
1
2
1
(1)
where:Yi=b0+ b1X1i+εIis the simple regression model for ith observation
i= 1,…,n using standard notations. In particular, εi areindependent normally distributed random variableswith mean 0 and variance s2. Let Y be the samplemean of Y’s. SSR and SSE are the regression sum ofsquares and the error sum of squares, respectively. Theestimated model is:
Y Xi i= +b b0 1 1 (2)
We calculate the F-statistic for each of the 15,124markers by fitting a simple linear regression model, onemarker at a time. The response variable Y is the averagevalue of Q1 over 10 replications. The markers are thenranked by F values. A number of top markers areselected for further analysis in the next step.
Selection by sliced inverse regressionSIR [5] is a nonparametric regression method that useslocal smoothing of the response variable. It retrieves
high-dimension data features from low-dimensionalprojection. After standardizing X, we estimate aninverse regression of X on sliced Y. The inverse regres-sion, that is, the computation of E(X|Y), converts ahigh-dimensional regression problem of Y on X tomany simple regressions of X on Y. In estimating E(X|Y), the range of Y is divided into small intervals(sliced) to increase computational efficiency. Next, weperform a principal components analysis on E(X|Y),and the principal components (PCs) are returned.These are the SIR effective dimension reduction direc-tions discussed by Li [5]. We simply call them the SIRdirections. In our analysis, SIR is performed using theR package dr.Top markers selected from the previous step are
subjected to SIR, and the response variable of SIR is thesame as the one used in the previous step of determin-ing the F-statistic. Because the first SIR direction (DIR1)contains the most important information of the data, itis the most significant, and we use only this SIRdirection in our method. Next, we perform a two-meanclustering analysis on the absolute DIR1 coefficients.The markers in the cluster with higher mean are ourfinal candidates for causal SNPs.
ResultsOur method is first applied to data from replicates 1 to10 (group 1). To assess the false discovery rate (FDR) ofour method, we divided the 200 replications of theGAW17 data set into 20 groups with 10 replicates pergroup (i.e., replicates 11 to 20 are group 2, replicates 21to 30 are group 3, etc.). We average the ratios of thenumber of identified answers to the number of finalcandidate SNPs over 20 groups to obtain the FDR.
Performance of the F-statisticFor the group 1 data, there are eight answers in the top100 markers ranked by the F-statistic (Table 1), andseven of them are in the top 32. The identified answerscome from four different genes, and their MAFs rangefrom 0.1% to 6.7%. We also identified rare variants withonly one minor allele (C4S1877 and C4S1889), and theb (influence level) of the answers were all relativelyhigh. This result shows that the answers found by the F-statistic have strong main risk effects.
How many top markers should be used?We need to select a number of top markers forfurther analysis. First, the p-value of DIR1 reportedby the SIR provides us with a clue regarding an upperbound for the number of markers to be selected. Inthe group 1 data, with 70 markers or less, the p-valueof DIR1 are all well below 0.1%, but with 80 markersthe p-value rises by more than 20 times, to 2%. This
Wang et al. BMC Proceedings 2011, 5(Suppl 9):S50http://www.biomedcentral.com/1753-6561/5/S9/S50
Page 2 of 5
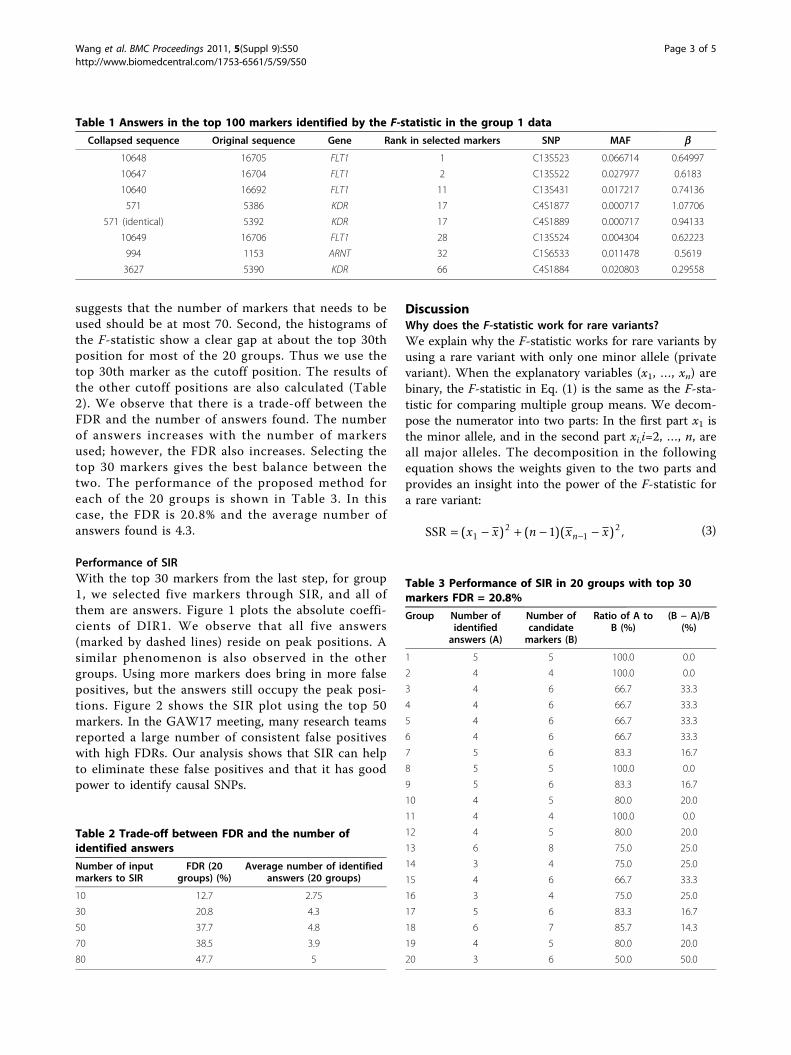
suggests that the number of markers that needs to beused should be at most 70. Second, the histograms ofthe F-statistic show a clear gap at about the top 30thposition for most of the 20 groups. Thus we use thetop 30th marker as the cutoff position. The results ofthe other cutoff positions are also calculated (Table2). We observe that there is a trade-off between theFDR and the number of answers found. The numberof answers increases with the number of markersused; however, the FDR also increases. Selecting thetop 30 markers gives the best balance between thetwo. The performance of the proposed method foreach of the 20 groups is shown in Table 3. In thiscase, the FDR is 20.8% and the average number ofanswers found is 4.3.
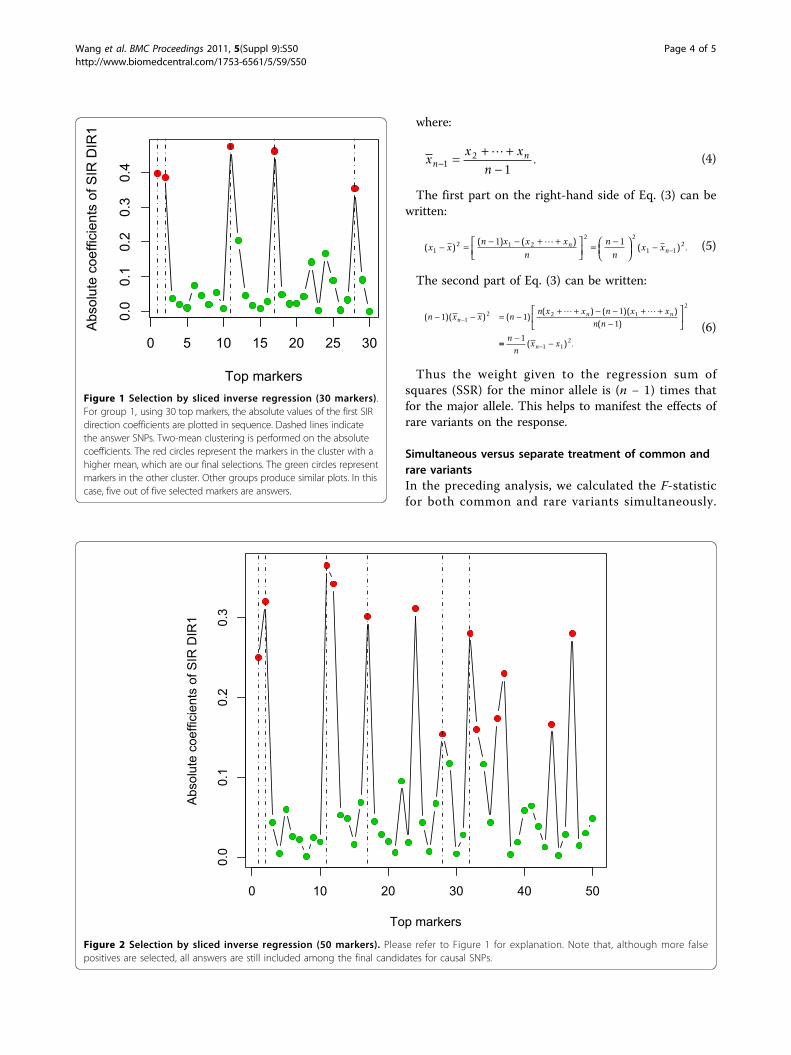
Performance of SIRWith the top 30 markers from the last step, for group1, we selected five markers through SIR, and all ofthem are answers. Figure 1 plots the absolute coeffi-cients of DIR1. We observe that all five answers(marked by dashed lines) reside on peak positions. Asimilar phenomenon is also observed in the othergroups. Using more markers does bring in more falsepositives, but the answers still occupy the peak posi-tions. Figure 2 shows the SIR plot using the top 50markers. In the GAW17 meeting, many research teamsreported a large number of consistent false positiveswith high FDRs. Our analysis shows that SIR can helpto eliminate these false positives and that it has goodpower to identify causal SNPs.
DiscussionWhy does the F-statistic work for rare variants?We explain why the F-statistic works for rare variants byusing a rare variant with only one minor allele (privatevariant). When the explanatory variables (x1, …, xn) arebinary, the F-statistic in Eq. (1) is the same as the F-sta-tistic for comparing multiple group means. We decom-pose the numerator into two parts: In the first part x1 isthe minor allele, and in the second part xi,i=2, …, n, areall major alleles. The decomposition in the followingequation shows the weights given to the two parts andprovides an insight into the power of the F-statistic fora rare variant:
SSR = − + − −−( ) ( )( ) ,x x n x xn12
121 (3)
Table 1 Answers in the top 100 markers identified by the F-statistic in the group 1 data
Collapsed sequence Original sequence Gene Rank in selected markers SNP MAF b
10648 16705 FLT1 1 C13S523 0.066714 0.64997
10647 16704 FLT1 2 C13S522 0.027977 0.6183
10640 16692 FLT1 11 C13S431 0.017217 0.74136
571 5386 KDR 17 C4S1877 0.000717 1.07706
571 (identical) 5392 KDR 17 C4S1889 0.000717 0.94133
10649 16706 FLT1 28 C13S524 0.004304 0.62223
994 1153 ARNT 32 C1S6533 0.011478 0.5619
3627 5390 KDR 66 C4S1884 0.020803 0.29558
Table 2 Trade-off between FDR and the number ofidentified answers
Number of inputmarkers to SIR
FDR (20groups) (%)
Average number of identifiedanswers (20 groups)
10 12.7 2.75
30 20.8 4.3
50 37.7 4.8
70 38.5 3.9
80 47.7 5
Table 3 Performance of SIR in 20 groups with top 30markers FDR = 20.8%
Group Number ofidentifiedanswers (A)
Number ofcandidatemarkers (B)
Ratio of A toB (%)
(B − A)/B(%)
1 5 5 100.0 0.0
2 4 4 100.0 0.0
3 4 6 66.7 33.3
4 4 6 66.7 33.3
5 4 6 66.7 33.3
6 4 6 66.7 33.3
7 5 6 83.3 16.7
8 5 5 100.0 0.0
9 5 6 83.3 16.7
10 4 5 80.0 20.0
11 4 4 100.0 0.0
12 4 5 80.0 20.0
13 6 8 75.0 25.0
14 3 4 75.0 25.0
15 4 6 66.7 33.3
16 3 4 75.0 25.0
17 5 6 83.3 16.7
18 6 7 85.7 14.3
19 4 5 80.0 20.0
20 3 6 50.0 50.0
Wang et al. BMC Proceedings 2011, 5(Suppl 9):S50http://www.biomedcentral.com/1753-6561/5/S9/S50
Page 3 of 5
where:
xx x
nnn
− = + +−1
2
1. (4)
The first part on the right-hand side of Eq. (3) can bewritten:
( )( ) ( )
( ) .x xn x x x
n
n
nx xn
n12 1 2
2 2
1 121 1− = − − + +⎡
⎣⎢⎤⎦⎥
= −⎛⎝⎜
⎞⎠⎟
− − (5)
The second part of Eq. (3) can be written:
( )( ) ( )( ) ( )( )
( )n x x n
n x x n x x
n nnn n− − = − + + − − + +
−⎡
⎣⎢
⎤
⎦⎥−1 1
111
2 2 12
== − −−n
nx xn
11 1
2( ) .
(6)
Thus the weight given to the regression sum ofsquares (SSR) for the minor allele is (n − 1) times thatfor the major allele. This helps to manifest the effects ofrare variants on the response.
Simultaneous versus separate treatment of common andrare variantsIn the preceding analysis, we calculated the F-statisticfor both common and rare variants simultaneously.
0 5 10 15 20 25 30
0.0
0.1
0.2
0.3
0.4
Top markers
Abs
olut
e co
effic
ient
s of
SIR
DIR
1
Figure 1 Selection by sliced inverse regression (30 markers).For group 1, using 30 top markers, the absolute values of the first SIRdirection coefficients are plotted in sequence. Dashed lines indicatethe answer SNPs. Two-mean clustering is performed on the absolutecoefficients. The red circles represent the markers in the cluster with ahigher mean, which are our final selections. The green circles representmarkers in the other cluster. Other groups produce similar plots. In thiscase, five out of five selected markers are answers.
0 10 20 30 40 50
0.0
0.1
0.2
0.3
Top markers
Abs
olut
e co
effic
ient
s of
SIR
DIR
1
Figure 2 Selection by sliced inverse regression (50 markers). Please refer to Figure 1 for explanation. Note that, although more falsepositives are selected, all answers are still included among the final candidates for causal SNPs.
Wang et al. BMC Proceedings 2011, 5(Suppl 9):S50http://www.biomedcentral.com/1753-6561/5/S9/S50
Page 4 of 5
Applying the F-statistic on private variants only leads tofurther interesting findings. After removing identicalSNPs, we reduce the 9,433 private variants to 685 distin-guishable markers. In the group 1 data, among the top20 markers ranked by F-statistic, five answers are found.Three of them are new (CAS4935, C4S1873, andC4S1887) to the previously identified SNPs when apply-ing the F-statistic to all markers. This suggests that aseparate treatment of common and rare variants is apromising strategy for further investigation.
ConclusionsWe use traditional statistical methods for new applica-tions in the context of rare variant research. A three-step method is introduced. First, we perform a simpledata reduction by removing identical-valued SNPs. Sec-ond, we calculate F-statistics on all markers and selectthose with the top F values. Finally, we perform SIR onthe top markers and perform two-mean clustering onthe absolute coefficients of the first SIR direction. Mar-kers in the cluster with a higher mean are the final can-didates for causal SNPs. Using the top 30 markers fromthe F-statistic, we find that the FDR is 20.8% and thatthe average number of answers is 4.3. We show that theproposed method is an effective and easy-to-use featureselection approach in the context of rare variants.
AcknowledgmentsThis research was supported by Hong Kong Research Grants Council grants642207, and DAG S08/09.BM15, and by National Institutes of Health (NIH)grants R01 GM070789 and 3R01 GM070789-05S1 and by National ScienceFoundation (NSF) grant DMS 0714669. HW would like to thank GAW17 forawarding the student travel support. We thank both reviewers for theirthoughtful comments. Genetic Analysis Workshop 17 is supported by NIHgrant R01 GM031575.This article has been published as part of BMC Proceedings Volume 5Supplement 9, 2011: Genetic Analysis Workshop 17. The full contents of thesupplement are available online at http://www.biomedcentral.com/1753-6561/5?issue=S9.
Author details1Department of Information Systems, Business Statistics, and OperationsManagement, Hong Kong University of Science and Technology, Clear WaterBay, Kowloon, Hong Kong. 2Department of Statistics, Columbia University,1255 Amsterdam Avenue, New York, NY 10027, USA.
Authors’ contributionsHW carried out the statistical analysis and drafted the manuscript. CHHprovided technical support for data management. SHL and TZ participatedin the design of statistical analysis and presentation of results. IH conceivedof the study, designed the statistical analysis, and helped to draft themanuscript.
Competing interestsThe authors declare that there are no competing interests.
Published: 29 November 2011
References1. Asimit J, Zeggini E: Rare variant association analysis methods for
complex traits. Annu Rev Genet 2010, 44:293-308.
2. Bansal V, Libiger O, Torkamani A, Schork NJ: Statistical analysis strategiesfor association studies involving rare variants. Nat Rev Genet 2010,11:773-785.
3. Dering C, Pugh E, Ziegler A: Statistical analysis of rare sequence variants:an overview of collapsing methods. Genet Epidemiol 2011, X(suppl X):X-X.
4. Almasy LA, Dyer TD, Peralta JM, Kent JW Jr, Charlesworth JC, Curran JE,Blangero J: Genetic Analysis Workshop 17 mini-exome simulation. BMCProc 2011, 5(suppl 9):S2.
5. Li KC: Sliced inverse regression for dimension reduction (withdiscussion). J Am Stat Assoc 1991, 86:316-342.
doi:10.1186/1753-6561-5-S9-S50Cite this article as: Wang et al.: New insights into old methods foridentifying causal rare variants. BMC Proceedings 2011 5(Suppl 9):S50.
Submit your next manuscript to BioMed Centraland take full advantage of:
• Convenient online submission
• Thorough peer review
• No space constraints or color figure charges
• Immediate publication on acceptance
• Inclusion in PubMed, CAS, Scopus and Google Scholar
• Research which is freely available for redistribution
Submit your manuscript at www.biomedcentral.com/submit
Wang et al. BMC Proceedings 2011, 5(Suppl 9):S50http://www.biomedcentral.com/1753-6561/5/S9/S50
Page 5 of 5