new captive finance – optimizing customer lifetime value · new captive finance – optimizing...
TRANSCRIPT

White paper
Munich, January 2016
New captive finance – Optimizing customer lifetime value

2 Roland Berger_White paper Automotive captive banking_FINAL.pptx
Major European car markets are forecast to experience only moderate growth after the European crisis and remain extremely competitive
Management summary
Offering finance products is a must to create additional sales momentum and defend current market shares. In Germany, car sales are mainly driven by corporate sales using leasing products
Providing finance products to customers also is a key means for OEMs to maximize customer lifetime value systematically – Most OEMs use their own captive units once they've reached a critical size in total sales
In the past, the offering of finance products by OEMs has evolved from a pure sales support function to the pursuit of profit contribution objectives while following a characteristic path related to sales volumes
Recently, mature captive units increasingly shifted focus away from pure sales support by broadening the product offering to mobility or retail banking services with ultimate aim of maximizing customer lifetime value for OEM
Roland Berger has identified three strategic moves to successfully develop captives and optimize the customer lifetime value
3 Roland Berger_White paper Automotive captive banking_FINAL.pptx
Contents Page
A. Current market overview 4
B. Business model of automotive captives 15
C. Captive maturity stages 22

4 Roland Berger_White paper Automotive captive banking_FINAL.pptx
A. Current market overview
5 Roland Berger_White paper Automotive captive banking_FINAL.pptx
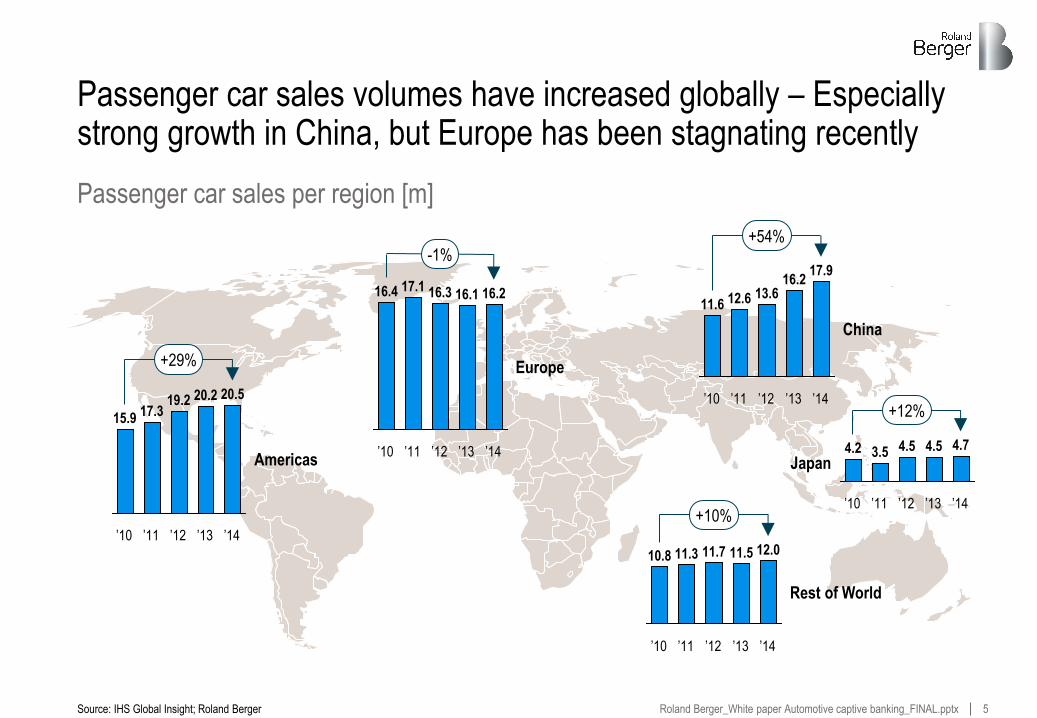
Passenger car sales volumes have increased globally – Especially strong growth in China, but Europe has been stagnating recently
Americas
’14
20.5
’13
20.2
’12
19.2
’11
17.3
’10
15.9
+29%
Passenger car sales per region [m]
Source: IHS Global Insight; Roland Berger
-1%
Europe
’14
16.2
’13
16.1
’12
16.3
’11
17.1
’10
16.4
’13
16.2
’12
13.6
’11
+54%
China
’14
17.9
12.6
’10
11.6
Japan
’14
4.7
’13
4.5 4.2
+12%
’12
4.5
’11
3.5
’10
’11
11.3
’10
10.8
’14
12.0
’13
11.5
’12
11.7
Rest of World
+10%

6 Roland Berger_White paper Automotive captive banking_FINAL.pptx
> Most important and stable car market: Germany
> Most positive development in UK with a rise of more than 20% from 2012 to 2014
> In contrast, Southern Euro-pean markets hit hard in aftermath of financial crisis
> Signs of recovery observable in Italian and French markets in 2014
> Spain's economic recovery also visible in car sales, which rose by almost 20% in 2014
Italy, France and Spain saw the strongest decline – But future overall growth expected and first signs already visible
Passenger car sales in Europe [m]
Source: IHS Global Insight; Roland Berger
A closer look at EU-5 automotive markets plus rest of Europe
20
15
10
5
0
Rest of
Europe
Spain
United
Kingdom
France
Germany
2020
Italy
19.1
8.4
1.2
1.9
2.4
2.0
3.2
2014
16.2
6.7
0.8 1.4
2.5
1.8
3.0
2013
16.1
7.0
0.7 1.3
2.3
1.8
3.0
2012
16.3
7.2
0.7 1.4
2.0
1.9
3.1
2011
17.1
7.2
0.8 1.8
1.9
2.2
3.2
2010
16.4
6.3
1.0
2.0
2.0
2.3
2.9
1.1%
-8.7%
CAGR (2010-2014)
-0.3%
-5.1%
5.1%
-3.5%
1.7%

7 Roland Berger_White paper Automotive captive banking_FINAL.pptx
More than 70% of cars are financed at point of sale – Market share of captives is typically slightly below 40%, except in Germany
Source: AutoValue; Roland Berger
Market structure of car financing in EU-5
> Captive banks have the strongest position in Germany – Possible driver: Strong German OEMs with broad FS offering
> Also, Germany has the highest share of cars not financed at the POS – Two possible drivers:
– High proportion of cash payers
– Strong position of local banks in Germany, i.e. banks providing salary accounts
> From OEM perspective, providing financing via a captive also provides a significant upside in terms of customer ownership
– Customer data available centrally
– Master data (e.g. address) can be maintained better
27%16% 15% 19%
28%52% 47% 49% 47%
45%37% 37% 36% 34%
11%
Germany United Kingdom Italy Spain France
Not financed Non-captive Captive
New car financing in selected European markets

8 Roland Berger_White paper Automotive captive banking_FINAL.pptx
German car market development relatively flat, but leasing products are becoming ever more important driven by corporate sales
Source: IHS Global Insight; DAT-Report 2014; Roland Berger
The largest European market in close-up
> Car sales tumbled by some 3 million cars p.a. since 2008 – Exception: 2009 with 3.8 m cars due to government subsidies
> Cash payments peaked in 2011 due to the euro crisis and now on a declining trend
> Leasing expected to become dominant form of car financing, mainly driven by corporate customers1)
> Share of financed or leased new cars is also rising with size of cars and engine capacity
> Besides new cars, share of financed used cars increased from 28% (2010) to 35% (2014)
1) In particular, whether leasing can be structured as operating lease
700
0
1,500
1,400
1,300
1,200
1,100
1,000
900
800
2014 2013 2011 2012 2010
Leased Cash (and other) Car credits
New car sales in Germany, 2010-2014 ['000]

9 Roland Berger_White paper Automotive captive banking_FINAL.pptx
> New car sales to private customers declining since 2011
> Cash payments jumped back to 31% after two years at relatively low level
> Partly financed cars in particular include so-called triple way finance
– Lump-sum payments at contract initiation and end
– (Rather low) monthly rates during contract lifetime
> However, likelihood of choosing finance products also differs between customer groups. (e.g. 2/3 of car replacements are financed, while only 1/3 of first time buyers choose finance products)
> While for used cars, the share of financed or leased cars is considerably lower (~30%), a trend toward non-cash payment can also be observed
~800k new private cars are at least partly financed annually – Financing focus is on classic products; leasing share below 20%
Source: IHS Global Insight; DAT-Report 2014; Roland Berger
New car sales in Germany – Non-corporates
600
1,400
1,200
1,000
800
400
200
0
2014
1,099
19%
4%
46%
31%
2013
15%
9%
54%
22%
2012
1,176
18%
7%
51%
24%
2011
1,274
16%
4%
46%
34%
2010
1,244
25%
5%
38%
32%
1,120
Leased Fully financed Partly financed Cash payment
1) In particular, whether leasing can be structured as operating lease
New car sales to private customers, 2010-2014 ['000]

10 Roland Berger_White paper Automotive captive banking_FINAL.pptx
Fleet customers use lease options more frequently – High share of non-captive options indicates untapped potential for captives
24%31%
46% 51%
26%
22%
26%
21%21%
23%
9%
8%9%
45%35% 31% 26%
42%2%
2%
Overall 1,000+ 100+ 10+ <10
Source: ARVAL; Roland Berger
New car sales in Germany – Corporates
Car loan (captive)
Other financing source (e.g. cash, non-captive financing)
Operating lease
Finance lease
> For corporate customers overall, leasing is the dominant form of car financing (49%), driven by accounting rules
> However, significant differences can be observed depending on company size:
– Share of operating leases increases with company size from 24% to 51%
– Self-purchases decrease at the same time from 45% to 26%
> Finance leasing and car loans account for 23%-34% and are relatively equal for all company sizes
> Disregarding crisis effects, the choice of financing has been relevantly stable since 2008
> Customer and data ownership typically lies with car dealers and leasing/finance providers
Fleet sales in Germany by company size [# employees]

11 Roland Berger_White paper Automotive captive banking_FINAL.pptx
Automotive finance players are characterized by two large groups: OEM-owned captive banks and traditional, non-captive banks
Source: Roland Berger
Captive banks/OEM-owned financial service providers (not exhaustive)
> Most OEMs are active in financial services, but not necessarily under a banking license – Decision dependent on target products and national regulation
> For smaller markets, OEMs are also using white label products from local banks, e.g. Volvo, Infiniti, Kia, Mazda, Suzuki in Germany
Non-captive banks in automotive finance (not exhaustive)
> Some non-captives are active as white-label providers for financial services activities of OEMs, e.g. Santander runs service centers for several OEMs
> Non-captive players can be further grouped into "Consu-mer finance banks" (e.g. Santander) and "Specialized banks" (e.g. Bank Deutsches Kraftfahrzeuggewerbe)
Market participants in automotive finance
12 Roland Berger_White paper Automotive captive banking_FINAL.pptx
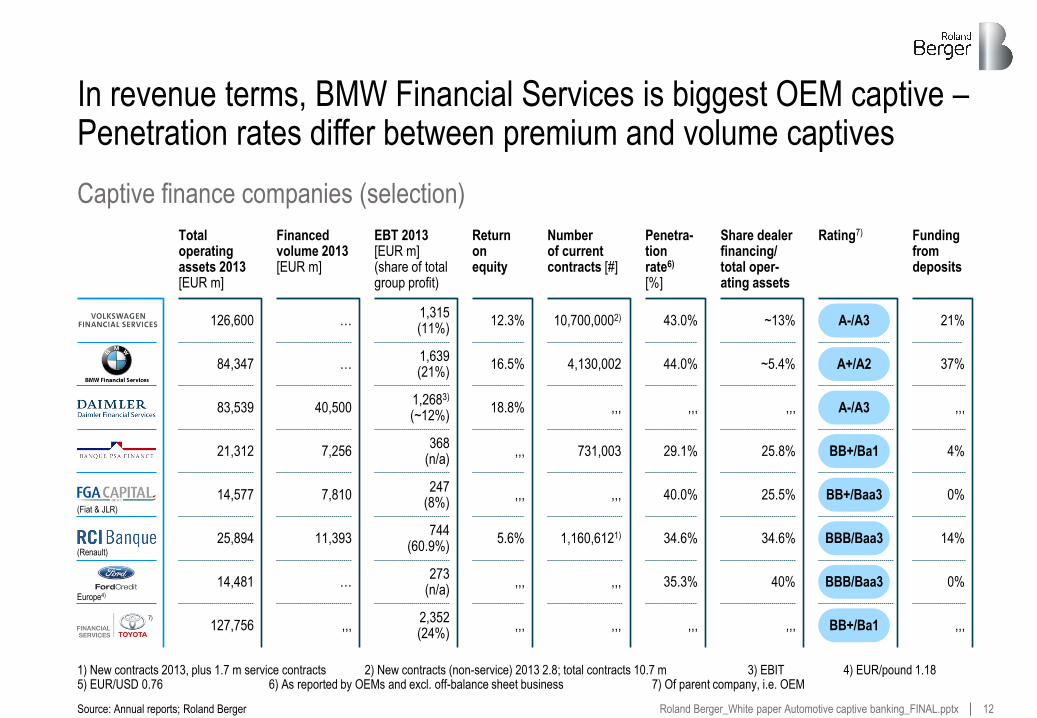
In revenue terms, BMW Financial Services is biggest OEM captive – Penetration rates differ between premium and volume captives
Source: Annual reports; Roland Berger
1) New contracts 2013, plus 1.7 m service contracts 2) New contracts (non-service) 2013 2.8; total contracts 10.7 m 3) EBIT 4) EUR/pound 1.18 5) EUR/USD 0.76 6) As reported by OEMs and excl. off-balance sheet business 7) Of parent company, i.e. OEM
Captive finance companies (selection)
Total operating assets 2013 [EUR m]
84,347
83,539
25,894
126,600
14,481
127,756
14,577
21,312
(Renault)
Europe4)
Financed volume 2013 [EUR m]
…
40,500
11,393
…
…
,,,
7,810
7,256
EBT 2013 [EUR m] (share of total group profit)
1,639 (21%)
1,2683) (~12%)
744 (60.9%)
1,315 (11%)
273 (n/a)
2,352 (24%)
247 (8%)
368 (n/a)
Return on equity
16.5%
18.8%
5.6%
12.3%
,,,
,,,
,,,
,,,
Number of current contracts [#]
4,130,002
,,,
1,160,6121)
10,700,0002)
,,,
,,,
,,,
731,003
Penetra-tion rate6) [%]
44.0%
,,,
34.6%
43.0%
35.3%
,,,
40.0%
29.1%
Share dealer financing/ total oper-ating assets
~5.4%
,,,
34.6%
~13%
40%
,,,
25.5%
25.8%
Rating7)
A+/A2
A-/A3
BBB/Baa3
A-/A3
BBB/Baa3
BB+/Ba1
BB+/Baa3
BB+/Ba1
Funding from deposits
37%
,,,
14%
21%
0%
,,,
0%
4%
(Fiat & JLR)
7)

13 Roland Berger_White paper Automotive captive banking_FINAL.pptx
Several non-captive players are also active in car finance, but actual business models and size of players vary widely
Competitive landscape in commercial finance in Germany
Source: Roland Berger
Share of car business
Bro
adn
ess
of
cust
om
er f
ocu
s
1) Bank Deutsches Kraftfahrzeuggewerbe
xx = Financed volume [m], only automotive, figures partly estimated
620
710
2,800
1,300
2,0007,800
FFS
Group
190
AKF Bank
Bank 11
BDK1)
Credit Plus
S-Kreditpartner Santander
> Several players (Santander, Credit Plus, FFS Group) are also acting as preferred finance provider esp. for Japanese OEMs
> Besides this, some players also have activities in financing other durable goods (caravans, furniture, electronic goods)
> All players rely heavily on cooperation networks with independent car dealers
> The majority of players are aiming at aggressive growth in the near future
> Three players (S-Kreditpartner, Credit Plus, BDK) are strongly integrated into bigger organizations with possible leverage effects
> Players are typically also active in the leasing and insurance business
Non-captive players' car business in Germany

14 Roland Berger_White paper Automotive captive banking_FINAL.pptx
Offering all car related products allows OEM to increase and better steer their total profit with the customer
Source: AutoMotorSport; Roland Berger
Initial view on steering profit generation
> Captives can offer low rates on car finance as a marketing tool, but OEMs have levers to compensate for this by generating profits in other steps of the value chain
– Realizing higher sales prices/giving less discount on financed cars – Increased profit in sales
– Realizing profits by directing financed cars into own garages – Increased profit in after-market
> From a customer perspective, it is rather difficult to analyze the total cost of ownership – But if a customer does so, using alternatives to a captive can be a reasonable proposition
Implications
0.0%
0.9%
1.9%
2.9%
3.9%
4.9%
5.9%
2.9%
1.5%
0.0%
0.0%
0.0%
4.3%
2.9%
1.4%
0.0%
0.0%
8.4%
7.1%
5.7%
4.3%
2.8%
1.4%
0.0%
5.9%
9.6%
8.4%
7.0%
5.6%
4.2%
2.8%
1.4%
6.9%
10.9%
9.6%
8.3%
6.9%
5.5%
4.1%
2.8%
7.9%
12.1%
10.9%
9.5%
8.1%
6.8%
5.4%
4.1%
8.9%
13.3%
12.1%
10.7%
9.4%
8.0%
6.7%
5.4%
9.9%
Offe
r fr
om c
aptiv
e fo
r 36
-mon
th lo
an
Offer from other bank for 36-month loan
From a total cost of ownership point of view, a 5.7% discount on car sales price is needed to make a 4.9% bank loan cheaper than a 0.9% loan from a captive on an undiscounted car
Break-even calculation: Credit rates vs. direct discount
3.9% 4.9%
4.4%
7.0%
5.7%
5.7%

15 Roland Berger_White paper Automotive captive banking_FINAL.pptx
B. Business model of automotive captives – Attractive, but also necessary at the same time

16 Roland Berger_White paper Automotive captive banking_FINAL.pptx
Focus of captives is extended by also taking into account customer lifetime value aside from the traditional elements of sales and profit
Source: Roland Berger
Objectives for captives
Lifetime value of car
and customer
Sales support
Profit generation
Advanced focus
Traditional focus
> Sales support for an OEM has two basic dimensions: – Increasing total number of cars
delivered to customers – Increasing average value per car
delivered to customers
> Most OEMs also offer finance products for their dealers (e.g. to finance inventory)
> Stabilization and management of residual values
> Provisioning of financial services offers an opportunity for profitable expansion of product offering close to core business
> Car financing is a rather low-risk business for OEMs compared to normal banking – Financed cars can be used as
collateral – Large scale of business makes it
well predictable
> FS products play an important role in creating customer loyalty
> FS products can also be used to generate revenues directly related to car, e.g. garages and spare parts
> Information gathered through financial products can generate important customer insights
> Collection and use of smart data to offer tailored innovative products for customers becomes a key success factor

17 Roland Berger_White paper Automotive captive banking_FINAL.pptx
> Vehicles of the customers of captives are on average 4.5 years old vs. 6.2 years in the case of cash buyers
> Financial services also generate a positive P&L effect in the traditional car business – By increasing the sale of new
instead of used cars – By selling more expensive
cars (larger cars or more add-ons)
> So far, OEMs are typically not able to assess marginal effect of financial services offering on total P&L – How sensitive are sales to
financial service offers? – What is the P&L effect beyond
FS of offering better rates?
Empirical data confirms benefit of financial services provisioning: More cars in total are sold as well as more expensive cars
Source: Arbeitskreis der Autobanken (AKA); Roland Berger
19%
28%
38%
39%
… a new car earlier
… a new car instead of a used car
… an extensive configuration
… a larger car model
Because of the financing offer, customers decided to purchase …
Average purchase price per vehicle
Cash buyer 25,762 EUR
Customer of an auto bank 27,635 EUR
23%
27%
30%
20%
46%
25%
10%
19%
> 6 years
4 to 6 years
3 to 4 years
< 3 years
Cash buyers: avg. 6.2 years
Autobank customers: avg. 4.5 years
Effects of providing financial services on car sales (1/2)
What was the purchase price of your current vehicle?
How long did you drive your previous car?

18 Roland Berger_White paper Automotive captive banking_FINAL.pptx
> Increasing customer loyalty is of great significance in developed markets – Overall sales figures growing
only marginally or not at all – Most car sales are
replacements
> From a dealer perspective, offering captive products also considerably more attractive than working together with non-captive partners – Higher return rate of existing
customers – Higher recommendation rate to
new customers
> More effective data collection as captive can store data, while ownership is typically with the dealer/lease provider
In addition, data shows that offering FS products via an own captive can also contribute to higher customer loyalty
Source: Arbeitskreis der Autobanken (AKA); Roland Berger
1) Only answers "likely/very likely" considered
Effects of providing financial services on car sales (2/2)
Did you decide on buying a car of the same brand as your previous car or did you change brand?
47%
62%38%
53%
Kept brand Changed brand
Non-captive
customers
Captive
customers
If you had to replace your current car, how likely would you be to …1)
75%
72%
61%
59%
… recommend
this dealer?
… opt for the
same dealer?
Non-captive customers
Captive customers

19 Roland Berger_White paper Automotive captive banking_FINAL.pptx
Automotive captives usually address the automotive value chain in three business areas: Dealers, end customers and remarketing
Dealer
> Investment financing > Stock financing (floorplan)
Customer
> Financing > Leasing > Insurance > Add-on services (e.g. fleet mgmt.,
fuel cards, tyre service)
Remarketing
> Certified pre-owned programs
> Marketing via captives > Cross-national optimization
Source: Roland Berger
Supplier Manu- facturing
Sales Customer Remarketing
1 2 3
Impact of financial services in value chain of car manufacturers
> Provisioning of financial services makes a high contribution to car manufacturers' sales and earnings due to
– High impact on purchase decision of customers itself
– Facilitation for customers to buy larger car and/or more services
– Support to maintain large sales network by providing financing to dealers
> Empirical data also shows higher loyalty among customers that are provided with financial services
Value chain of financial services for an OEM – Outline

20 Roland Berger_White paper Automotive captive banking_FINAL.pptx
Captive financing usually follows an evolutionary path that ultimately leads into banking and/or enhanced mobility services
Evolution of captive finance entities – Outline
Source: Roland Berger
Diversification
Supplier Manu- facturing
Sales Customer Remarketing
1 2 3
Non-brand offering
Financing
Leasing
Certified pre-owned
Commercial financing
Insurance1)
Cross-national residual value management
Fleet management, fuel cards, mainte-
nance contracts, etc.
Multi-make fleet management
Non-car related products (require banking license)
Savings accounts
Stock portfolio
Cap
tive
fo
cus
Pro
fit
Sal
es s
up
po
rt
1) Typically as white label offering from a cooperating insurance company
> Captives usually starts with the sole purpose of supporting new car sales and usually expand first to insurance products, followed by remarketing initiatives
> These "basic" offerings are often provided by or together with external partners. Further-developed captives tend to be OEM owned
> Brand strength and volume influence the tipping point of ownership structure
> After offering fleet management, captives have two options to further diversify from their core focus: Either banking services or brand independent offerings (multi-make)
Different product offerings per development stage

21 Roland Berger_White paper Automotive captive banking_FINAL.pptx
There are five different maturity stages that define unique captive archetypes of OEM financial services offerings
Source: Roland Berger
Overview of different models of financial services – Selection
No FS offering
1 Pure sales
support
2 Core
captive
3 All car related
4 Act as
a full bank
5
Entry state for small OEMs limiting their new car sales potential to self-purchases only
Basic offering of service products together with third party consumer finance specialist
Setup of own captive division usually the first step to shift focus from sales support to profit generation
Sophisticated product portfolio including all relevant car-related products, focus still very much on primary business
Significant product portfolio not related to car sales (e.g. retail banking services) leveraging custo-mer relationships
Example Example Example Example Example
True mobili-ty provider
6
Moving customer to center of business and becoming a true mobility provider (e.g. integrating car, train and flight offers)
Example

22 Roland Berger_White paper Automotive captive banking_FINAL.pptx
C. Captive maturity stages

23 Roland Berger_White paper Automotive captive banking_FINAL.pptx
New car sales ['000]
Archetype
5
100
200
700
1 2 3 4 5 6
…
The main driver of the automotive captive maturity stage is the volume of new car sales, but deviations show development potential
Maturity matrix (illustrative)
> Volume of new car sales is the main trigger for the development state of captives
> Archetype deviations to the left indicate development potential for captive units (e.g. Volvo Passenger Cars)
> Deviations to the right indicate readiness of captive units to support an increase in new car sales volume (e.g. Tesla Motors)
> Within large companies, a multi-brand strategy, e.g. for premium brands, can be pursued for captive business (e.g. VW with VW Financial Services and Porsche Bank)
> Depending on the strategic direction of the parent OEM, captives can prepare the ground for future success
Source: Roland Berger

24 Roland Berger_White paper Automotive captive banking_FINAL.pptx
Operating assets (captive)/revenue of parent OEM group
Archetype
20%
30%
40%
50%
1 2 3 4 5 6
…
Some captives have improvement potential compared to their peers, highlighting opportunities for further growth
Maturity matrix (illustrative)
Source: Roland Berger
> Amount of operating assets is mostly driven by:
– Car sales (new and used)
– Penetration rate on sales
– Average duration of finance provided
– Finance provided to dealerships
> Relation of captive assets to total turnover, ratio gives an indication of how well the captive is able to capture its full business potential
> BMW Financial Services is the clear benchmark, with a current ratio above 100%
> Ability to generate sufficient funding is a key prerequisite to increase the ratio
Follower

25 Roland Berger_White paper Automotive captive banking_FINAL.pptx
New car sales ['000]
Archetype
5
100
200
700
1 2 3 4 5 6
?
Depending on the maturity of captive units, we identified four winning strategies to secure future success
Maturity matrix (illustrative)
Source: Roland Berger
Winning strategies
Move out of niche markets, clear strategy to grow and reach significant size. Captive can be an enabler to realize future growth potential
Fight and grow market share 1.
Once captive is set up, reaching archetype 4 and 5 is the crucial task, turning the focus from sales support to profit generation
Expand the captive 2.
The strategic challenge is the full exploitation of the car-/OEM-related revenue and profit potential with synchronized and personalized offerings
Maximizing car lifetime value 3.
Even beyond archetype 5 there is potential to maximize profit by going beyond pure OEM sales support and becoming a true mobility provider – One lever could be to use the data available to the captive
Maximizing customer lifetime value 4.
1.
2.
3.
4.

26 Roland Berger_White paper Automotive captive banking_FINAL.pptx
Your Roland Berger experts
Partner
> Competence Center Financial Services
> 12 years of experience in the consulting industry
> Expert on captives, reorganization and business transformation
Dr. Dominik Löber
Project Manager
> Competence Center Financial Services
> 6 years of experience in the consulting industry
> Expert on automotive captives and banking IT/operations
Carsten Küst
Senior Partner
> Competence Center Automotive
> 20 years of experience in the automotive (Daimler, Aston Martin) and consulting industry
> Expert on sales, aftersales and downstream business
Philipp Grosse Kleimann
Source: Roland Berger
Principal
> Competence Center Automotive
> 14 years of experience in the consulting industry
> Expert on automotive captives, automotive aftersales and IT strategies
Alexander Brenner
