network monitoring with the perfsonar dashboard (pdf)
TRANSCRIPT
Network Monitoring with the perfSONAR Dashboard
Andy Lake
Brian Tierney
ESnet Advanced Network Technologies Group
TIP2013
Honolulu HI
January 15, 2013

Lawrence Berkeley National Laboratory U.S. Department of Energy | Office of Science
Overview
• perfSONAR overview
• Dashboard history and motivation
• Current ESnet dashboards
• Installation and integration with toolkit
• Future work and collaboration
• Info on new perfSONAR-PS release
1/15/13 2

Lawrence Berkeley National Laboratory U.S. Department of Energy | Office of Science
What is perfSONAR?
perfSONAR is a tool to:
• Set network performance expectations
• Find network problems (“soft failures”)
• Help fix these problems
All in multi-domain environments
• These problems are all harder when multiple networks are involved
perfSONAR is provides a standard way to publish active and passive monitoring data
• This data is interesting to network researchers as well as network operators
1/15/13 3

Lawrence Berkeley National Laboratory U.S. Department of Energy | Office of Science
Setting Expectations: Time to Copy 1 Terabyte
10 Mbps network : 300 hrs (12.5 days)
100 Mbps network : 30 hrs
1 Gbps network : 3 hrs (are your disks fast enough?)
10 Gbps network : 20 minutes (need really fast disks / filesystem)
These figures assume some headroom left for other users
Compare these speeds to: • USB 2.0 portable disk − 60 MB/sec (480 Mbps) peak − 5-15 MB/sec more typical − 15-40 hours to load 1 Terabyte
1/29/12 4

Lawrence Berkeley National Laboratory U.S. Department of Energy | Office of Science
Soft Network Failures
Soft failures are where basic connectivity functions, but high performance is not possible.
TCP was intentionally designed to hide all transmission errors from the user:
• “As long as the TCPs continue to function properly and the internet system does not become completely partitioned, no transmission errors will affect the users.” (From IEN 129, RFC 716)
Some soft failures only affect high bandwidth long RTT flows.
Hard failures are easy to detect & fix • soft failures can lie hidden for years!
One network problem can often mask others
1/29/12 5

Lawrence Berkeley National Laboratory U.S. Department of Energy | Office of Science
Sample Results: Finding/Fixing soft failures
Rebooted router with full route table
Gradual failure of optical line card
1/29/12 6

Lawrence Berkeley National Laboratory U.S. Department of Energy | Office of Science
perfSONAR Services PS-Toolkit includes these measurement tools:
• BWCTL: network throughput
• OWAMP: network loss, delay, and jitter
• traceroute
Test scheduler:
• runs bwctl, traceroute, and owamp tests on a regular interval
Measurement Archives (data publication)
• SNMP MA – router interface Data
• pSB MA -- results of bwctl, owamp, and traceroute tests
Lookup Service: used to find services
PS-Toolkit includes these web100-based Troubleshooting Tools
• NDT (TCP analysis, duplex mismatch, etc.)
• NPAD (TCP analysis, router queuing analysis, etc)
Lawrence Berkeley National Laboratory U.S. Department of Energy | Office of Science
perfSONAR-PS Software
perfSONAR-PS is an open source implementation of the perfSONAR measurement infrastructure and protocols
• Mostly written in perl, some Java and python too http://software.internet2.edu/pS-Performance_Toolkit/ Documentation and Issue tracker at: http://code.google.com/p/perfsonar-
ps/ All components are available as RPMs. The perfSONAR-PS consortium supports the CentOS. RPMs are compiled for both i386 and x86_64 architecture Functionality on other platforms and architectures is possible, but not
supported. • Should work: Red Hat Enterprise Linux and Scientific Linux ( v5) • Harder, but possible: − Fedora Linux, SuSE, Debian Variants
8 – 1/15/13, © 2011 Internet2
Lawrence Berkeley National Laboratory U.S. Department of Energy | Office of Science
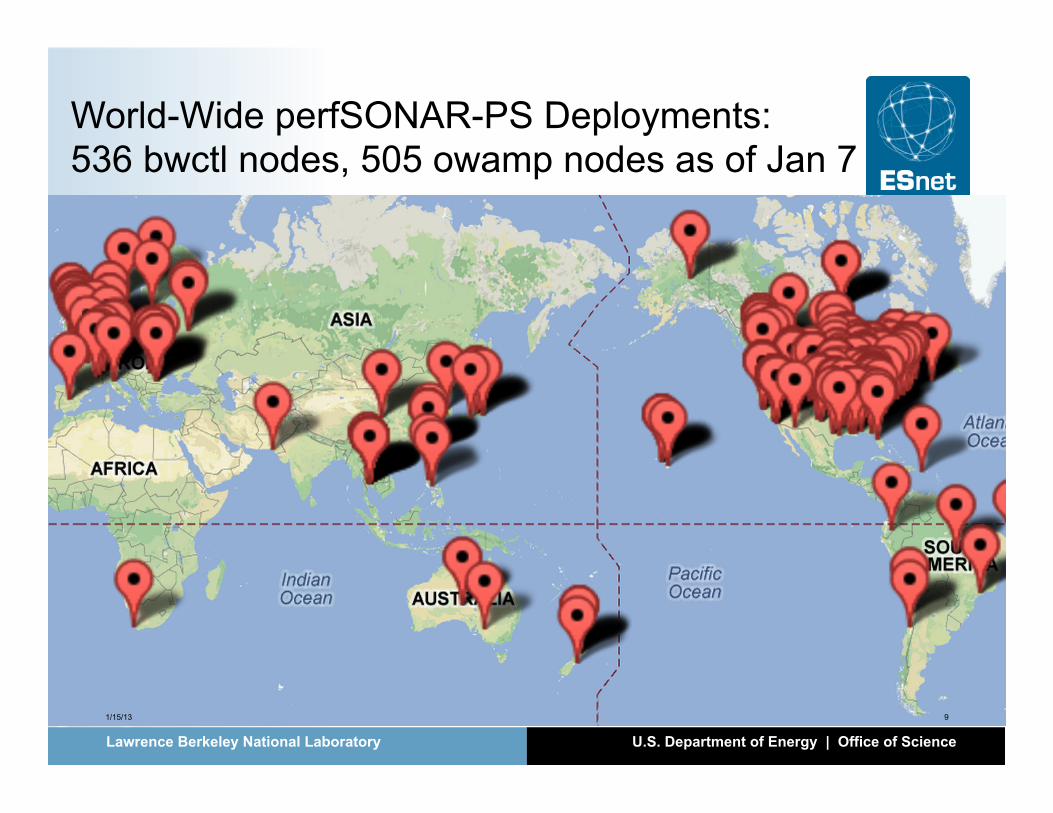
World-Wide perfSONAR-PS Deployments: 536 bwctl nodes, 505 owamp nodes as of Jan 7
1/15/13 9

Lawrence Berkeley National Laboratory U.S. Department of Energy | Office of Science
perfSONAR-PS Toolkit 3.3-RC1 now available • perfSONAR-PS Toolkit 3.3-rc1 announced. Still considered “beta”
but contains foundation for a wealth of new features and enhancements:
• CentOS 6 support • 32 bit and 64 bit support • LiveUSB Installation • New REST-based Lookup Service • Support for centralized mesh configuration of multiple hosts • MaDDash add-on package for displaying performance
measurement dashboard • Many more fixes/features and more to come in future RCs
• Dashboard is focus of this presentation, but part of a suite of new tools being added to perfSONAR-PS

Lawrence Berkeley National Laboratory U.S. Department of Energy | Office of Science
ESnet perfSONAR Infrastructure
• ESnet maintains perfSONAR deployment of 80 nodes on backbone and at site borders
• 36 throughput nodes running regular BWCTL tests • 34 latency nodes running regular OWAMP tests • 10 combined hosts running both BWCTL and OWAMP
• Over a 1000 point-to-point tests to monitor just within network. Manually walking through every graph trying to find problems not feasible…
1/15/13 11
Lawrence Berkeley National Laboratory U.S. Department of Energy | Office of Science
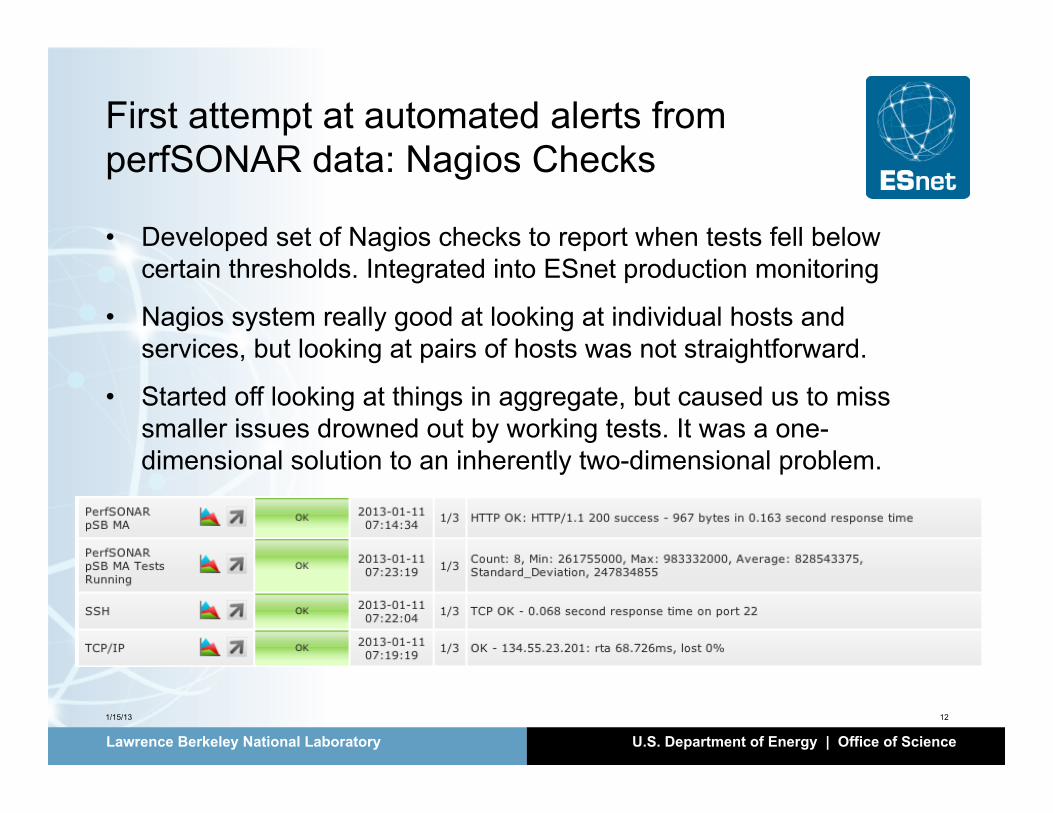
First attempt at automated alerts from perfSONAR data: Nagios Checks
• Developed set of Nagios checks to report when tests fell below certain thresholds. Integrated into ESnet production monitoring
• Nagios system really good at looking at individual hosts and services, but looking at pairs of hosts was not straightforward.
• Started off looking at things in aggregate, but caused us to miss smaller issues drowned out by working tests. It was a one-dimensional solution to an inherently two-dimensional problem.
1/15/13 12
Lawrence Berkeley National Laboratory U.S. Department of Energy | Office of Science
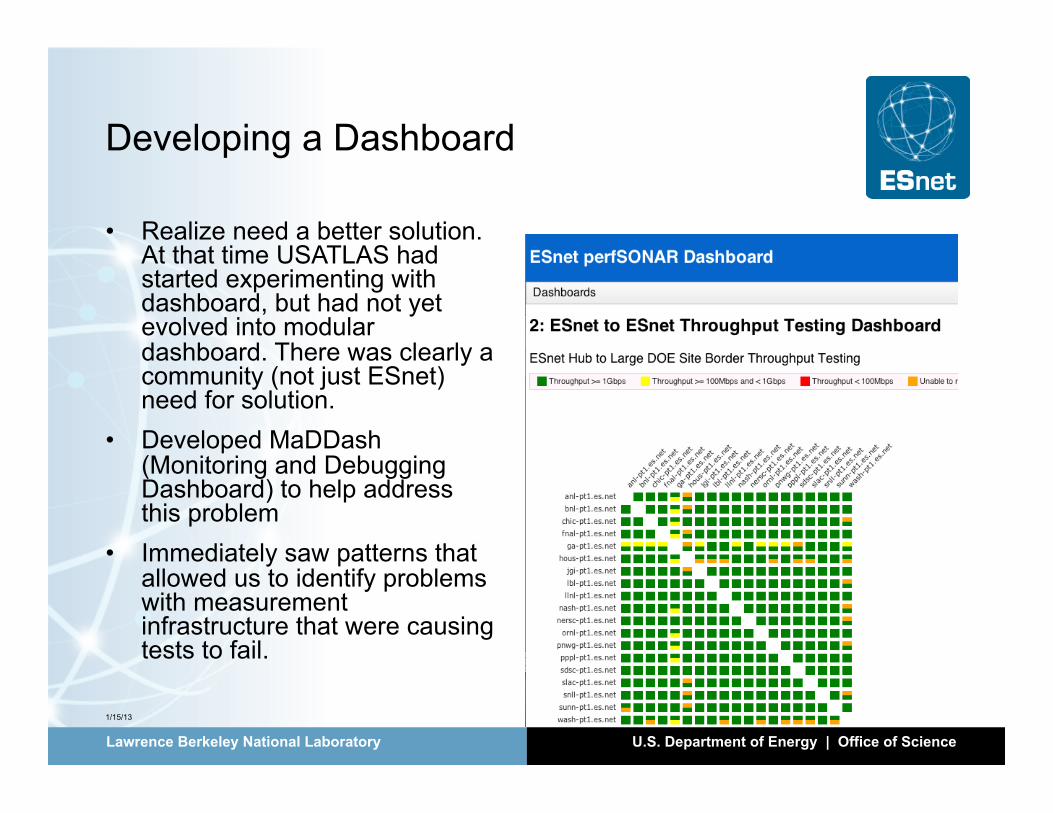
Developing a Dashboard
• Realize need a better solution. At that time USATLAS had started experimenting with dashboard, but had not yet evolved into modular dashboard. There was clearly a community (not just ESnet) need for solution.
• Developed MaDDash (Monitoring and Debugging Dashboard) to help address this problem
• Immediately saw patterns that allowed us to identify problems with measurement infrastructure that were causing tests to fail.
1/15/13 13

Lawrence Berkeley National Laboratory U.S. Department of Energy | Office of Science
Demo
1/15/13 14
Lawrence Berkeley National Laboratory U.S. Department of Energy | Office of Science
perfSONAR-PS Toolkit Integration
• Install with ‘yum install maddash’ on CentOS box, including those running perfSONAR-PS Toolkit NetInstall
• Install instructions at this link: − http://code.google.com/p/perfsonar-ps/wiki/MaDDashInstall
• New centralized mesh configuration tool can automatically generate configuration
• Integration with some of the administrative GUIs such as those that enable and disable services
1/15/13 15

Lawrence Berkeley National Laboratory U.S. Department of Energy | Office of Science
Dashboard Deployment
• Contains REST interface that allows easy access to data • Able to use interface to integrate with My ESnet portal
• https://my.es.net/network/performance/bwctl • https://my.es.net/network/performance/owamp
• Also able to extract into standalone GUI that others can install via RPM.
• NCAR/XSEDE: http://ps.ncar.xsede.org/maddash-webui/ • Internet2: http://lab234.internet2.edu/maddash-webui/ • PennREN:
http://bwctl.net.pennren.net/maddash-webui/index.cgi?dashboard=PennREN
• ESnet : http://ps-dashboard.es.net
1/15/13 16
Lawrence Berkeley National Laboratory U.S. Department of Energy | Office of Science
Future Work and Collaboration
• Working with USATLAS to share components and make sure tools can work with each other using common APIs and code.
• Job scheduling component of MaDDash ported to work with USATLAS modular dashboard
• Ongoing effort to improve performance, GUIs and simplify configuration
• Possible refinement of algorithm to determine when to change from green to yellow and back
• Identifying new dashboards and helping others get it running
1/15/13 17

Questions?
Thanks!
Andy Lake- [email protected]
Brian Tierney- [email protected]
http://www.es.net/
http://fasterdata.es.net/
http://code.google.com/p/perfsonar-ps/wiki/MaDDashInstall

Extra Slides

Lawrence Berkeley National Laboratory U.S. Department of Energy | Office of Science
Demo – Dashboard List
1/15/13 20
Lawrence Berkeley National Laboratory U.S. Department of Energy | Office of Science
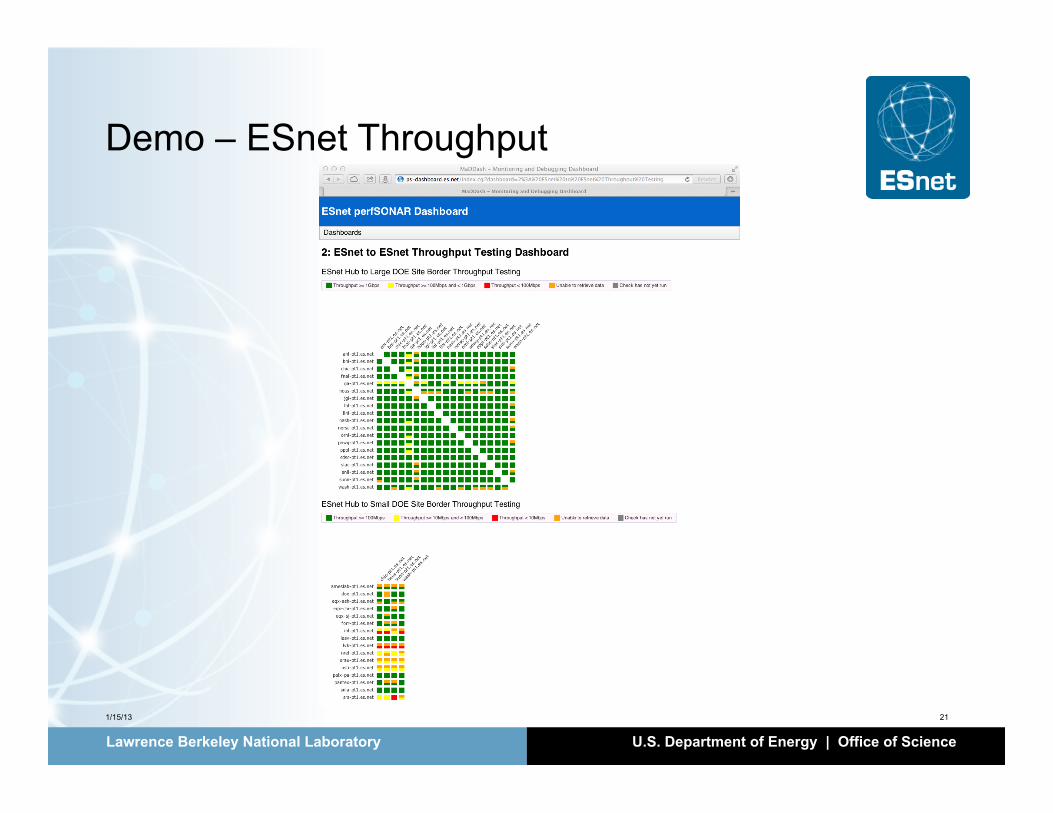
Demo – ESnet Throughput
1/15/13 21
Lawrence Berkeley National Laboratory U.S. Department of Energy | Office of Science
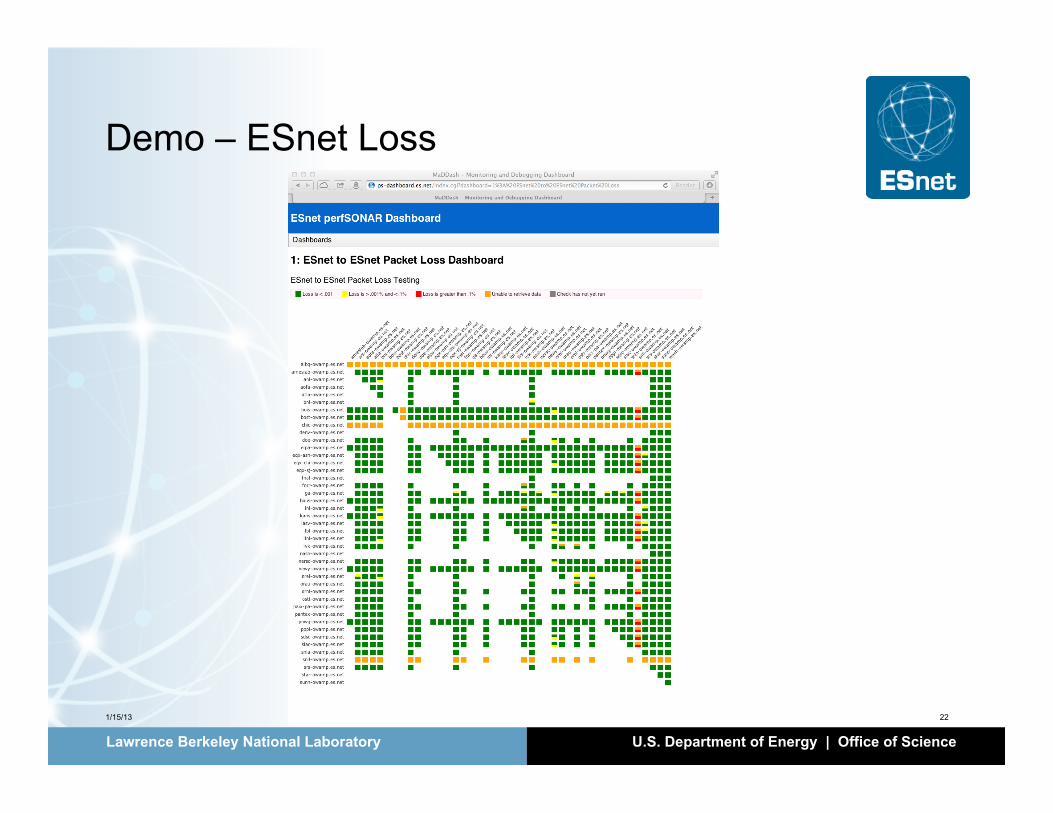
Demo – ESnet Loss
1/15/13 22

Lawrence Berkeley National Laboratory U.S. Department of Energy | Office of Science
Demo – Esnet to APAN
1/15/13 23

Lawrence Berkeley National Laboratory U.S. Department of Energy | Office of Science
Demo - Graphs
1/15/13 24

Lawrence Berkeley National Laboratory U.S. Department of Energy | Office of Science
perfSONAR-PS Toolkit 3.3-rc1
• perfSONAR-PS Toolkit 3.3-rc1 released on Monday. 3.3 is a major overhaul so we expect multiple RCs and need everyone’s help to test!
• New Features in RC1 • CentOS 6 (32-bit and 64 bit support) • LiveUSB distribution in addition to NetInstall and LiveCD • Completely rewritten and re-designed lookup service • Centralized mesh configuration management software • Integration with MaDDash performance monitoring dashboard • Numerous other bug fixes and enhancements
• Expect more in coming weeks from future RCs before final release • Traceroute visualization developed by University of Wisconsin • Iperf3 integration with BWCTL • Web10G integration
Since it’s a release candidate should be considered “beta” software and not used to upgrade existing production toolkit hosts
1/15/13 25