network localization of neurological symptoms from … · network localization of neurological...
TRANSCRIPT
Network localization of neurological symptomsfrom focal brain lesions
Aaron D. Boes,1,2 Sashank Prasad,3 Hesheng Liu,4 Qi Liu,4,5 Alvaro Pascual-Leone,1
Verne S. Caviness Jr2 and Michael D. Fox1,4,6
A traditional and widely used approach for linking neurological symptoms to specific brain regions involves identifying overlap in
lesion location across patients with similar symptoms, termed lesion mapping. This approach is powerful and broadly applicable,
but has limitations when symptoms do not localize to a single region or stem from dysfunction in regions connected to the lesion
site rather than the site itself. A newer approach sensitive to such network effects involves functional neuroimaging of patients, but
this requires specialized brain scans beyond routine clinical data, making it less versatile and difficult to apply when symptoms are
rare or transient. In this article we show that the traditional approach to lesion mapping can be expanded to incorporate network
effects into symptom localization without the need for specialized neuroimaging of patients. Our approach involves three steps:
(i) transferring the three-dimensional volume of a brain lesion onto a reference brain; (ii) assessing the intrinsic functional con-
nectivity of the lesion volume with the rest of the brain using normative connectome data; and (iii) overlapping lesion-associated
networks to identify regions common to a clinical syndrome. We first tested our approach in peduncular hallucinosis, a syndrome
of visual hallucinations following subcortical lesions long hypothesized to be due to network effects on extrastriate visual cortex.
While the lesions themselves were heterogeneously distributed with little overlap in lesion location, 22 of 23 lesions were negatively
correlated with extrastriate visual cortex. This network overlap was specific compared to other subcortical lesions (P5 10�5) and
relative to other cortical regions (P50.01). Next, we tested for generalizability of our technique by applying it to three additional
lesion syndromes: central post-stroke pain, auditory hallucinosis, and subcortical aphasia. In each syndrome, heterogeneous lesions
that themselves had little overlap showed significant network overlap in cortical areas previously implicated in symptom expression
(P510�4). These results suggest that (i) heterogeneous lesions producing similar symptoms share functional connectivity
to specific brain regions involved in symptom expression; and (ii) publically available human connectome data can be used to
incorporate these network effects into traditional lesion mapping approaches. Because the current technique requires no specialized
imaging of patients it may prove a versatile and broadly applicable approach for localizing neurological symptoms in the setting of
brain lesions.
1 Berenson-Allen Centre for Non-invasive Brain Stimulation, Division of Cognitive Neurology, Department of Neurology, HarvardMedical School and Beth Israel Deaconess Medical Centre, 330 Brookline Ave, Boston, MA, 02215, USA
2 Department of Paediatric Neurology, Massachusetts General Hospital, Harvard Medical School, Mailcode: WACC 8-835,Massachusetts General Hospital, 55 Fruit Street, Boston, MA 02114, USA
3 Department of Neurology, Division of Neuro-Ophthalmology, Brigham and Women’s Hospital, Harvard Medical School,75 Francis Street, Boston MA 02115, USA
4 Athinoula A. Martinos Centre for Biomedical Imaging, Massachusetts General Hospital, 149 13th Street, Charlestown, MA02129, USA
5 National Key Laboratory of Cognitive Neuroscience and Learning, Beijing Normal University, Beijing, 100875, P. R. China6 Department of Neurology, Massachusetts General Hospital, Harvard Medical School, Mailcode: WACC 8-835, Massachusetts
General Hospital, 55 Fruit Street, Boston, MA 02114, USA
Correspondence to: Aaron Boes, MD, PhD,
Berenson-Allen Centre for Non-invasive Brain Stimulation,
doi:10.1093/brain/awv228 BRAIN 2015: 138; 3061–3075 | 3061
Received March 16, 2015. Revised June 13, 2015. Accepted June 22, 2015. Advance Access publication August 11, 2015
� The Author (2015). Published by Oxford University Press on behalf of the Guarantors of Brain. All rights reserved.
For Permissions, please email: [email protected]
Division of Cognitive Neurology,
Department of Neurology,
Harvard Medical School and Beth Israel Deaconess Medical Centre,
330 Brookline Ave,
Boston, MA, 02215, USA
E-mail: [email protected]
Correspondence may also be addressed to:
Mike Fox, MD, PhD
E-mail: [email protected]
Keywords: lesion network mapping; lesion networks; hallucination; central post-stroke pain; subcortical aphasia
IntroductionThere is a long tradition of understanding regional brain
function by studying deficits that result from focal brain
injury. If patients with similar symptoms have lesions that
overlap in a specific brain region, one gains insight into the
functional role of that region. Because this lesion mapping
approach requires only a record of patient symptoms and
the location of the lesion, it has proven broadly applicable
across many neurological and psychiatric symptoms
(Damasio and Damasio, 1989; Robinson, 1997; Ferro
et al., 2010). Methodological improvements using statistics
to identify critical sites of lesion overlap have further
enhanced the utility of this approach (Frank et al., 1997;
Bates et al., 2003; Rorden et al., 2007; Mah et al., 2014).
However, traditional approaches to lesion mapping are lim-
ited by two important factors. First, similar symptoms may
result from lesions in different locations, making localiza-
tion to specific regions challenging (Chung et al., 2004;
Vuilleumier, 2013; Corbetta et al., 2015). Second, symp-
toms may result from lesion-induced functional alterations
in anatomically intact, connected brain regions (Feeney and
Baron, 1986; He et al., 2007a; Honey and Sporns, 2008;
Bartolomeo, 2011; Catani et al., 2012; Carrera and
Tononi, 2014). The fact that lesions have remote functional
effects has been appreciated for over a century (Brown-
Sequard, 1875; Von Monakow and Harris, 1914); how-
ever, it has remained unclear how one might incorporate
such effects into traditional lesion mapping.
One solution for localizing neurological symptoms that
incorporates such network effects is to perform functional
imaging on patient cohorts with brain lesions. This
approach has firmly established the importance of remote
network effects in symptom expression (Baron et al., 1986;
Vuilleumier et al., 2004; Corbetta et al., 2005; Sobesky
et al., 2005; He et al., 2007b; Kim et al., 2012) and recov-
ery of function (Saur et al., 2006; Carter et al., 2012;
Dijkhuizen et al., 2014). Unfortunately this requires specia-
lized functional neuroimaging scans, which are not rou-
tinely collected for clinical purposes. Obtaining such data
is especially difficult for rare symptoms, transient symp-
toms, or conditions that render brain scanning difficult.
As such, many studies of lesion-induced neurological
symptoms continue to rely solely on the site of the lesion
for symptom localization (Corbetta et al., 2015).
In this article we determine whether one can incorporate
the network effects of brain lesions into traditional lesion
mapping without the need for specialized brain imaging of
patients. Our method, termed lesion network mapping,
leverages normative human connectome data to identify
the distribution of regions likely to be functionally affected
by a given brain lesion. For each lesion, a lesion-derived
network is identified using resting state functional connect-
ivity MRI, which examines correlations in spontaneous,
low frequency fluctuations of the blood oxygen level-
dependent signal (Fox and Raichle, 2007). In contrast to
previous studies that collected resting state functional con-
nectivity MRI in patients with brain lesions (He et al.,
2007b; Carter et al., 2010; Wang et al., 2010; Park
et al., 2011), we use a large normative resting state func-
tional connectivity MRI database to identify regions likely
to be affected by a brain lesion, without the need for spe-
cialized imaging of the patients.
To demonstrate the utility of the approach we test two
main hypotheses: (i) lesions that cause similar symptoms
but occur in different locations will show overlap in net-
work connectivity; and (ii) sites of network overlap will
occur specifically in regions implicated in symptom expres-
sion. We start with peduncular hallucinosis, a neurological
syndrome in which lesion-induced network effects are
thought to play a pivotal role in generating symptoms.
Peduncular hallucinosis is characterized by vivid, dynamic,
well-formed visual hallucinations following a lesion to the
pons, midbrain, or thalamus (Lhermitte, 1922; De Morsier,
1935; McKee et al., 1990; Risser and Powell, 1993;
Manford and Andermann, 1998; Mocellin et al., 2006;
Benke, 2006). Why visual hallucinations result from these
lesions in non-visual structures remains unknown, but a
‘release’ of cortical activity in the extrastriate visual
cortex, a region active during visual hallucinations, is
thought to occur (Dunn et al., 1983; Asaad and Shapiro,
1986; Ffytche et al., 1998; Manford and Andermann,
1998; Adachi et al., 2000; Vetrugno et al., 2009).
Peduncular hallucinosis thus serves as an ideal test of
lesion network mapping. Specifically, lesion localization is
heterogeneous, symptoms are hypothesized to result from
3062 | BRAIN 2015: 138; 3061–3075 A. D. Boes et al.
distributed network effects, and there is a clear a priori
hypothesis regarding what remote site should be involved
in symptom generation.
A priori hypotheses regarding sites of remote network
effects in other stroke syndromes are not as clear.
However, utility outside peduncular hallucinosis is required
to show that our technique is broadly applicable. We there-
fore identified three additional syndromes in which reason-
able predictions regarding network effects could be made:
auditory hallucinosis, with network effects in the superior
temporal gyrus (Griffiths, 2000; Allen et al., 2008; Kumar
et al., 2014), central post-stroke pain, with network effects
in the posterior insula (Garcia-Larrea, 2012; Garcia-Larrea
and Peyron, 2013), and subcortical expressive aphasia,
with network effects in Broca’s area (Nadeau and
Crosson, 1997; Crosson, 2013).
Materials and methodsWe focus here on the methodological details for the analysis ofpeduncular hallucinosis and provide details for the otherstroke syndromes in the online Supplementary material.
Cases of peduncular hallucinosis were identified from eitherlocal cases seen by the authors or from the existing literature.Consent was obtained for the local cases according to theDeclaration of Helsinki and the study was approved by thePartners Human Subjects Institutional Review Board. Casesfrom the literature were identified through a systematicsearch of pubmed.org with search terms of ‘peduncular hallu-cinosis’ or ‘Lhermitte’s hallucinosis’, and citations from eachselected article were cross-referenced. The search was per-formed in August 2012 and limited to articles in English,although an exception was made for the historical French art-icles (Lhermitte, 1922; Van Bogaert, 1927). Inclusion criteriaincluded patients with predominantly visual hallucinations pre-sumed to have been caused by a focal intraparenchymal lesionrestricted to the brainstem or diencephalon, as demonstratedby imaging or anatomic examination. Exclusion criteriaincluded: (i) co-occurring cortical lesions; (ii) lesions of thedirect visual pathway; (iii) extrinsic compression injuries with-out a clearly delineated intra-parenchymal lesion; (iv) the pres-ence of obvious competing aetiologies for the hallucinations(e.g. a patient with comorbid psychosis or prior hallucinationsfrom psychiatric disease, alcoholism, drug abuse or a suspectedpharmacologic or metabolic cause); or (v) poor image reso-lution such that lesion boundaries could not be delineated.
We found 23 cases of peduncular hallucinosis with identifi-able causative brain lesions (mean age 61 � 19 years, range17–85). This included three original cases from our centre and20 cases from the existing literature. Details of these cases areprovided in Supplementary Table 1 and Supplementary Fig. 1.
Brain lesions were mapped by hand onto a standard tem-plate brain from FSL (MNI152 brain, 1 mm � 1 mm, http://fsl.fmrib.ox.ac.uk/fsldownloads/) using lesion mapping software(MRIcron http://www.mccauslandcenter.sc.edu/mricro/mricron/).Lesions from local cases were mapped in 3D using simultan-eous axial, coronal and sagittal views. Lesions from publishedfigures were traced in the 2D plane(s) in which they were dis-played, using neuroanatomical landmarks to accurately trans-fer the lesion location onto the template brain. To identify
areas of lesion overlap, 2D lesions from figures were extendedby 2 mm perpendicular to the plane in which they weredisplayed to more closely approximate natural 3D lesioncontours. A 2 mm extension was selected because it caneasily be replicated by others and it conservatively balancesthe risk of creating spurious sites of overlap versus missingsites of overlap relative to the actual 3D lesion shape. Amore liberal lesion extension of 4 mm was also included forcomparison. All lesions were mapped true to their lateralityand areas of overlap were displayed using MRIcron.
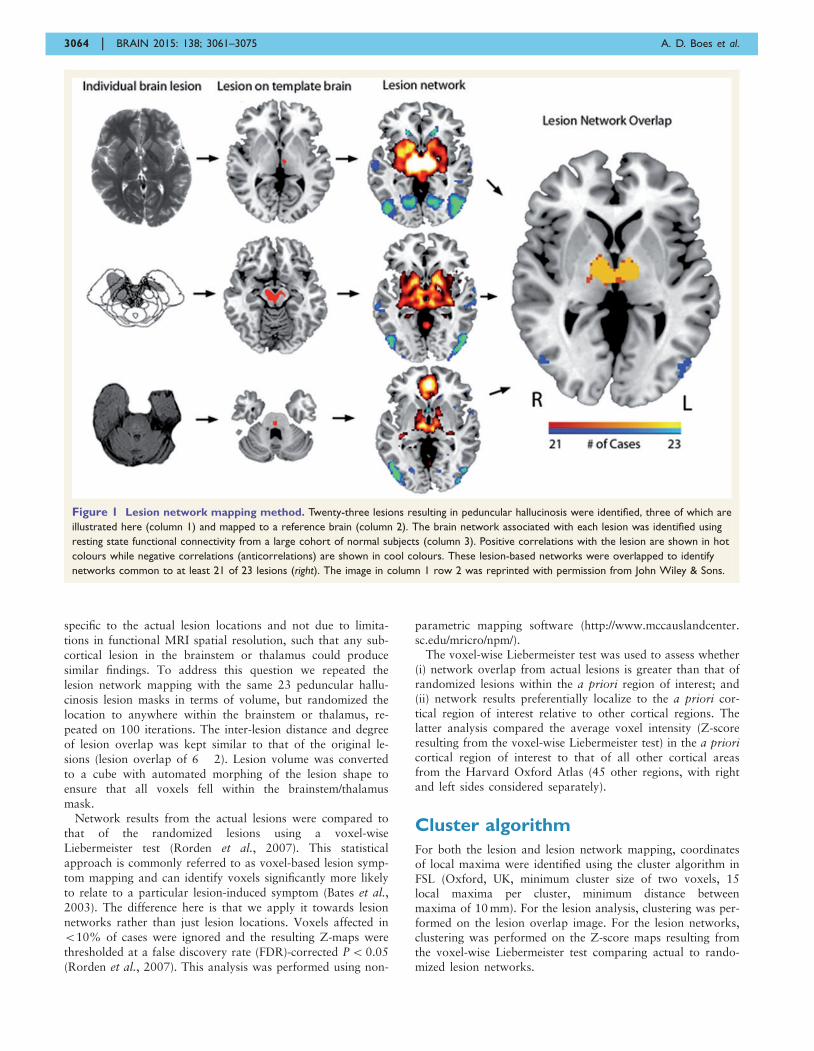
Investigation of the networks associated with peduncularhallucinosis lesions involved three steps: (i) the volume ofeach of the 23 lesions was transferred to a reference brain;(ii) the lesion volume was used as a seed region of interest ina resting state functional connectivity MRI analysis that usednormative data; and (iii) the resulting network associated witheach lesion volume was thresholded and overlaid across lesionsto identify common sites of network overlap (Fig. 1).
For Step 2 the full 3D lesion location was used as the seedregion of interest for local cases, while a 2D slice or slices(i.e. non-expanded) were used for the previously publishedpeduncular hallucinosis cases. The blood oxygen level-dependent signal for each lesion was an average of all voxelscontained in the lesion volume. The resting state functionalconnectivity MRI data set included 98 healthy right-handedsubjects (48 male subjects, age 22 � 3.2 years), part of alarger publically available data set (Buckner et al., 2014).Full methodological and processing details for the normativeresting state functional connectivity MRI data set are available(Fox et al., 2012). Briefly, subjects completed one or moreresting state functional connectivity MRI scans during whichthey were asked to rest in the scanner with their eyes open.Resting state functional connectivity MRI data were processedin accordance with the strategy of Fox et al. (2005) as imple-mented in Van Dijk et al. (2010), including global signalregression (Fox et al., 2009a).
Each of the 23 individual lesion-seeded resting state functionalconnectivity MRI network maps was thresholded at a t-value of�4.25 (P50.00005, uncorrected) (Fox et al., 2012). Afterapplying this statistical threshold, the resulting 23 binarizedresting state functional connectivity MRI network maps wereoverlapped to identify regions of shared positive and negativecorrelation, masked using a whole-brain template.
A priori region of interest
An a priori region of interest covering the predicted location ofnetwork overlap in peduncular hallucinosis was selectedfrom the Harvard Oxford Atlas distributed with FSL (lateraloccipital cortex, inferior division, threshold of 50) (Desikanet al., 2006). This region was selected because it providedthe best fit for the coordinates and Brodmann areas previouslyidentified in the generation of release hallucinations (Ffytcheet al., 1998; Adachi et al., 2000; Kazui et al., 2009; Vetrugnoet al., 2009).
Anatomical specificity and statisticalanalysis
In addition to identifying sites of network overlap we alsosought to determine if lesion-based network results were
Lesion network mapping BRAIN 2015: 138; 3061–3075 | 3063
specific to the actual lesion locations and not due to limita-tions in functional MRI spatial resolution, such that any sub-cortical lesion in the brainstem or thalamus could produce
similar findings. To address this question we repeated thelesion network mapping with the same 23 peduncular hallu-cinosis lesion masks in terms of volume, but randomized thelocation to anywhere within the brainstem or thalamus, re-peated on 100 iterations. The inter-lesion distance and degreeof lesion overlap was kept similar to that of the original le-sions (lesion overlap of 6 � 2). Lesion volume was convertedto a cube with automated morphing of the lesion shape toensure that all voxels fell within the brainstem/thalamusmask.
Network results from the actual lesions were compared tothat of the randomized lesions using a voxel-wiseLiebermeister test (Rorden et al., 2007). This statisticalapproach is commonly referred to as voxel-based lesion symp-tom mapping and can identify voxels significantly more likelyto relate to a particular lesion-induced symptom (Bates et al.,2003). The difference here is that we apply it towards lesionnetworks rather than just lesion locations. Voxels affected in510% of cases were ignored and the resulting Z-maps werethresholded at a false discovery rate (FDR)-corrected P50.05
(Rorden et al., 2007). This analysis was performed using non-
parametric mapping software (http://www.mccauslandcenter.sc.edu/mricro/npm/).
The voxel-wise Liebermeister test was used to assess whether(i) network overlap from actual lesions is greater than that ofrandomized lesions within the a priori region of interest; and(ii) network results preferentially localize to the a priori cor-tical region of interest relative to other cortical regions. Thelatter analysis compared the average voxel intensity (Z-scoreresulting from the voxel-wise Liebermeister test) in the a prioricortical region of interest to that of all other cortical areasfrom the Harvard Oxford Atlas (45 other regions, with rightand left sides considered separately).
Cluster algorithm
For both the lesion and lesion network mapping, coordinatesof local maxima were identified using the cluster algorithm inFSL (Oxford, UK, minimum cluster size of two voxels, 15local maxima per cluster, minimum distance betweenmaxima of 10 mm). For the lesion analysis, clustering was per-formed on the lesion overlap image. For the lesion networks,clustering was performed on the Z-score maps resulting fromthe voxel-wise Liebermeister test comparing actual to rando-mized lesion networks.
Figure 1 Lesion network mapping method. Twenty-three lesions resulting in peduncular hallucinosis were identified, three of which are
illustrated here (column 1) and mapped to a reference brain (column 2). The brain network associated with each lesion was identified using
resting state functional connectivity from a large cohort of normal subjects (column 3). Positive correlations with the lesion are shown in hot
colours while negative correlations (anticorrelations) are shown in cool colours. These lesion-based networks were overlapped to identify
networks common to at least 21 of 23 lesions (right). The image in column 1 row 2 was reprinted with permission from John Wiley & Sons.
3064 | BRAIN 2015: 138; 3061–3075 A. D. Boes et al.
Addressing possible confounds
Global signal regression
There is concern that global signal regression confounds theability to interpret anticorrelations (Fox et al., 2009a; Murphyet al., 2009). To ensure that our results were not dependenton a specific processing technique we repeated the ana-lysis using an alternative method, anatomical CompCor(Behzadi et al., 2007) implemented in the Conn toolbox(Whitfield-Gabrieli and Nieto-Castanon, 2012), which isdescribed in the Supplementary material.
Age
Age can impact the strength of functional connectivity(Ferreira and Busatto, 2013). Our analysis included patientswith brain lesions that were older than the control cohortfrom which the normative functional connectivity MRI datawere derived (61 � 18.7 versus 22 � 3.2). We thereforerepeated the analysis using functional connectivity data froma healthy older adult cohort (n = 56, age 70.3 � 4.4). Thesedata were derived from the Harvard Brain Aging Study anddetails regarding processing methods are published elsewhere(Schultz et al., 2014).
2D versus 3D lesions
We performed a quantitative comparison of the networkresults from the local cases in which 3D lesions were usedfor the functional connectivity analysis, relative to a single2D slice taken from the centre of the lesion. This analysiswas undertaken to assess the validity of using 2D slices torepresent 3D lesions, which was done for the literature-derivedlesions. Spatial correlation coefficient was used to quantify thesimilarity between network results.
Additional lesion syndromes
The same methods used in the primary analysis of peduncularhallucinosis were repeated for three additional syndromes(details provided in the online Supplementary material).Finally, using lesion and lesion network data from all four
conditions, a between-group analysis was performed using avoxel-wise Liebermeister test to assess whether thelesions and\or lesion networks could segregate betweenlesion syndromes (e.g. peduncular hallucinosis lesions andlesion networks compared to the other three conditions as‘controls’).
Results
Application in peduncular hallucinosis
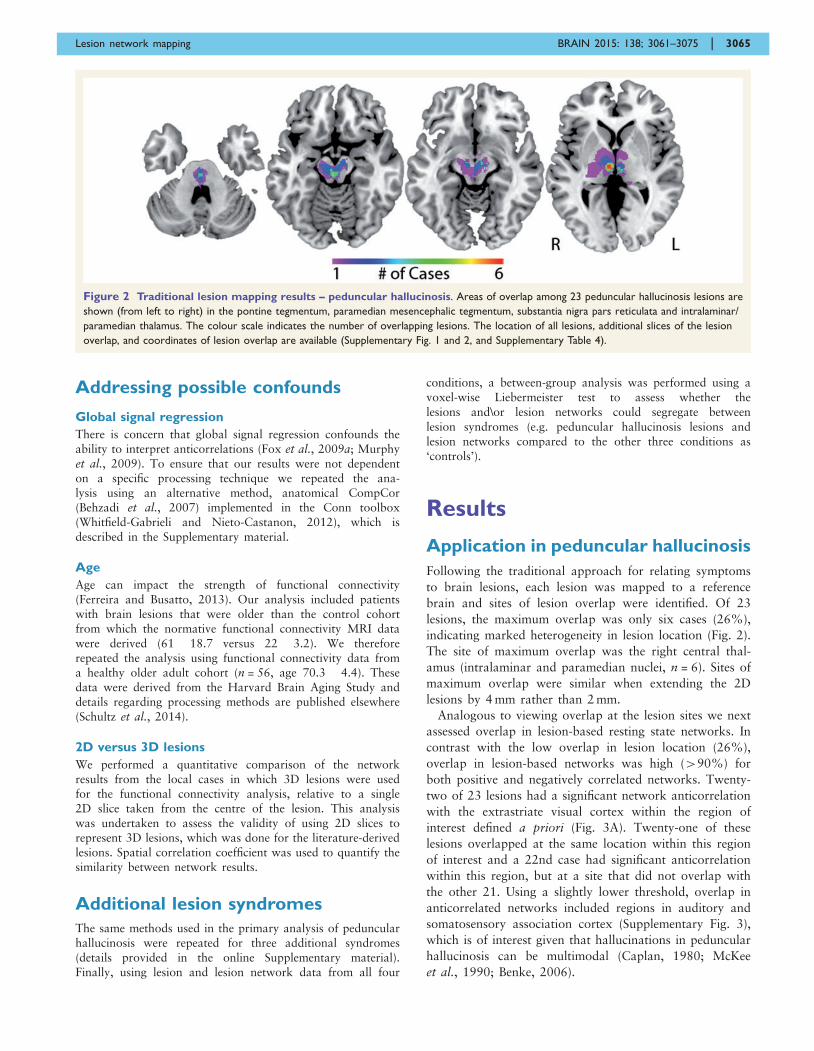
Following the traditional approach for relating symptoms
to brain lesions, each lesion was mapped to a reference
brain and sites of lesion overlap were identified. Of 23
lesions, the maximum overlap was only six cases (26%),
indicating marked heterogeneity in lesion location (Fig. 2).
The site of maximum overlap was the right central thal-
amus (intralaminar and paramedian nuclei, n = 6). Sites of
maximum overlap were similar when extending the 2D
lesions by 4 mm rather than 2 mm.
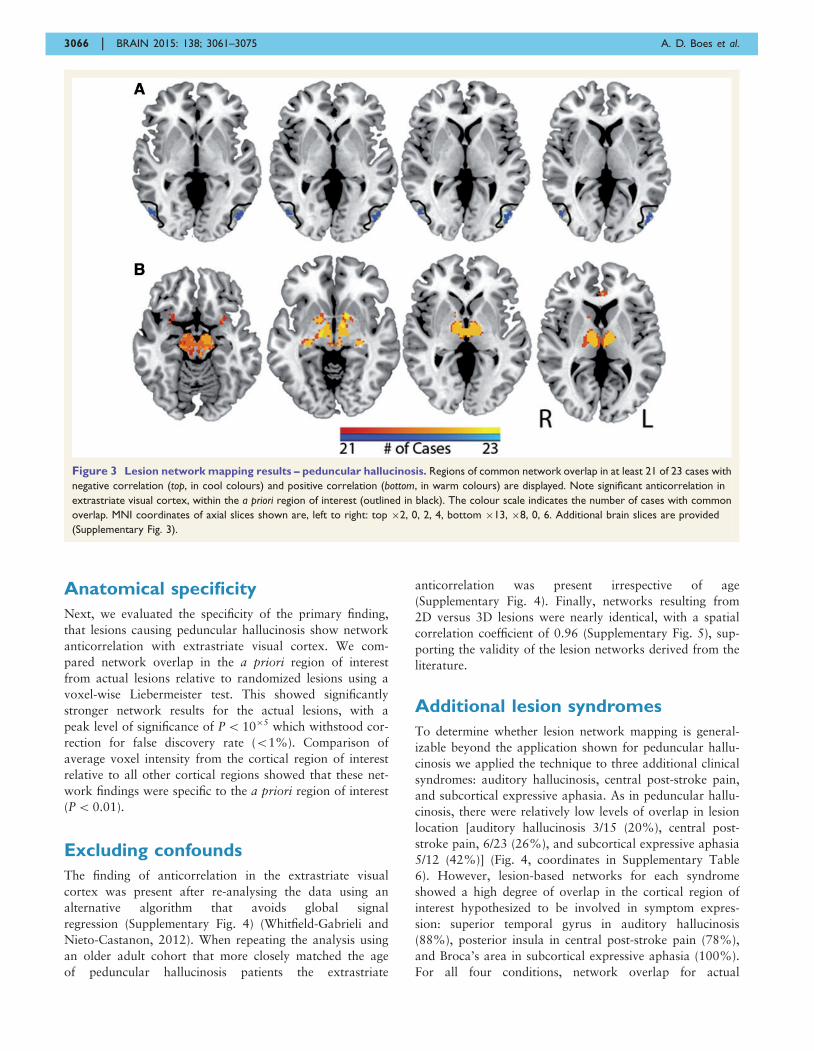
Analogous to viewing overlap at the lesion sites we next
assessed overlap in lesion-based resting state networks. In
contrast with the low overlap in lesion location (26%),
overlap in lesion-based networks was high (490%) for
both positive and negatively correlated networks. Twenty-
two of 23 lesions had a significant network anticorrelation
with the extrastriate visual cortex within the region of
interest defined a priori (Fig. 3A). Twenty-one of these
lesions overlapped at the same location within this region
of interest and a 22nd case had significant anticorrelation
within this region, but at a site that did not overlap with
the other 21. Using a slightly lower threshold, overlap in
anticorrelated networks included regions in auditory and
somatosensory association cortex (Supplementary Fig. 3),
which is of interest given that hallucinations in peduncular
hallucinosis can be multimodal (Caplan, 1980; McKee
et al., 1990; Benke, 2006).
Figure 2 Traditional lesion mapping results – peduncular hallucinosis. Areas of overlap among 23 peduncular hallucinosis lesions are
shown (from left to right) in the pontine tegmentum, paramedian mesencephalic tegmentum, substantia nigra pars reticulata and intralaminar/
paramedian thalamus. The colour scale indicates the number of overlapping lesions. The location of all lesions, additional slices of the lesion
overlap, and coordinates of lesion overlap are available (Supplementary Fig. 1 and 2, and Supplementary Table 4).
Lesion network mapping BRAIN 2015: 138; 3061–3075 | 3065
Anatomical specificity
Next, we evaluated the specificity of the primary finding,
that lesions causing peduncular hallucinosis show network
anticorrelation with extrastriate visual cortex. We com-
pared network overlap in the a priori region of interest
from actual lesions relative to randomized lesions using a
voxel-wise Liebermeister test. This showed significantly
stronger network results for the actual lesions, with a
peak level of significance of P510�5 which withstood cor-
rection for false discovery rate (51%). Comparison of
average voxel intensity from the cortical region of interest
relative to all other cortical regions showed that these net-
work findings were specific to the a priori region of interest
(P50.01).
Excluding confounds
The finding of anticorrelation in the extrastriate visual
cortex was present after re-analysing the data using an
alternative algorithm that avoids global signal
regression (Supplementary Fig. 4) (Whitfield-Gabrieli and
Nieto-Castanon, 2012). When repeating the analysis using
an older adult cohort that more closely matched the age
of peduncular hallucinosis patients the extrastriate
anticorrelation was present irrespective of age
(Supplementary Fig. 4). Finally, networks resulting from
2D versus 3D lesions were nearly identical, with a spatial
correlation coefficient of 0.96 (Supplementary Fig. 5), sup-
porting the validity of the lesion networks derived from the
literature.
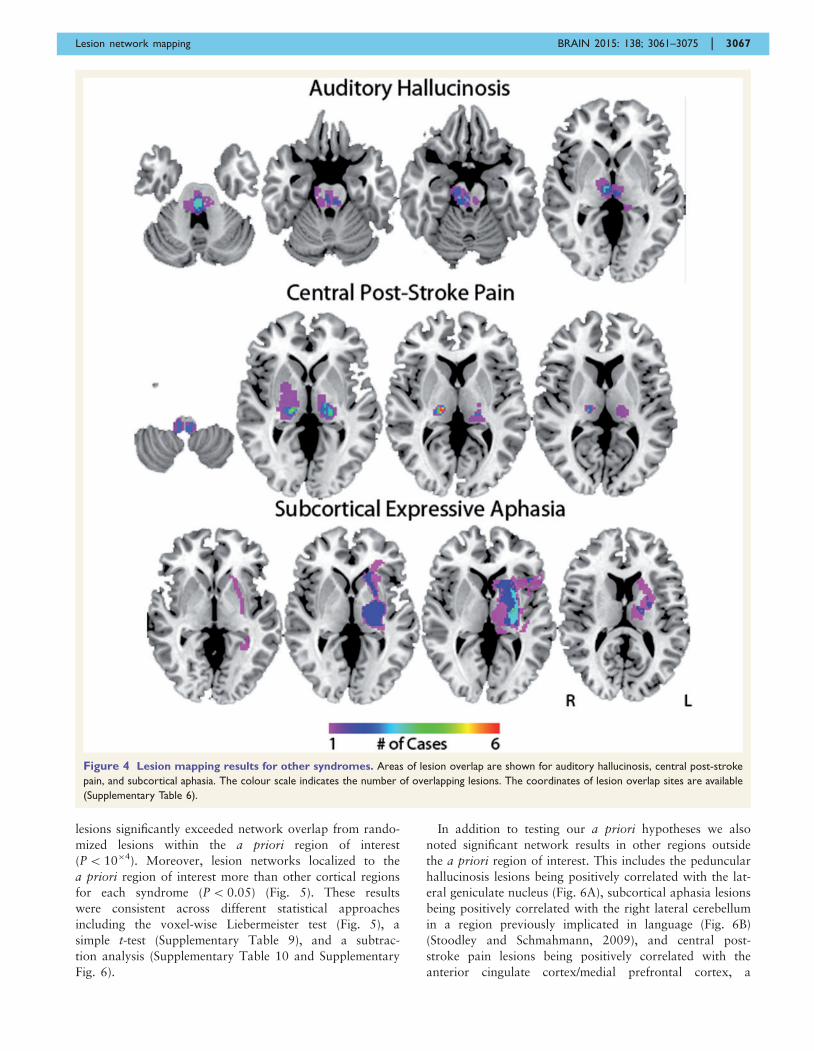
Additional lesion syndromes
To determine whether lesion network mapping is general-
izable beyond the application shown for peduncular hallu-
cinosis we applied the technique to three additional clinical
syndromes: auditory hallucinosis, central post-stroke pain,
and subcortical expressive aphasia. As in peduncular hallu-
cinosis, there were relatively low levels of overlap in lesion
location [auditory hallucinosis 3/15 (20%), central post-
stroke pain, 6/23 (26%), and subcortical expressive aphasia
5/12 (42%)] (Fig. 4, coordinates in Supplementary Table
6). However, lesion-based networks for each syndrome
showed a high degree of overlap in the cortical region of
interest hypothesized to be involved in symptom expres-
sion: superior temporal gyrus in auditory hallucinosis
(88%), posterior insula in central post-stroke pain (78%),
and Broca’s area in subcortical expressive aphasia (100%).
For all four conditions, network overlap for actual
Figure 3 Lesion network mapping results – peduncular hallucinosis. Regions of common network overlap in at least 21 of 23 cases with
negative correlation (top, in cool colours) and positive correlation (bottom, in warm colours) are displayed. Note significant anticorrelation in
extrastriate visual cortex, within the a priori region of interest (outlined in black). The colour scale indicates the number of cases with common
overlap. MNI coordinates of axial slices shown are, left to right: top �2, 0, 2, 4, bottom �13, �8, 0, 6. Additional brain slices are provided
(Supplementary Fig. 3).
3066 | BRAIN 2015: 138; 3061–3075 A. D. Boes et al.
lesions significantly exceeded network overlap from rando-
mized lesions within the a priori region of interest
(P510�4). Moreover, lesion networks localized to the
a priori region of interest more than other cortical regions
for each syndrome (P5 0.05) (Fig. 5). These results
were consistent across different statistical approaches
including the voxel-wise Liebermeister test (Fig. 5), a
simple t-test (Supplementary Table 9), and a subtrac-
tion analysis (Supplementary Table 10 and Supplementary
Fig. 6).
In addition to testing our a priori hypotheses we also
noted significant network results in other regions outside
the a priori region of interest. This includes the peduncular
hallucinosis lesions being positively correlated with the lat-
eral geniculate nucleus (Fig. 6A), subcortical aphasia lesions
being positively correlated with the right lateral cerebellum
in a region previously implicated in language (Fig. 6B)
(Stoodley and Schmahmann, 2009), and central post-
stroke pain lesions being positively correlated with the
anterior cingulate cortex/medial prefrontal cortex, a
Figure 4 Lesion mapping results for other syndromes. Areas of lesion overlap are shown for auditory hallucinosis, central post-stroke
pain, and subcortical aphasia. The colour scale indicates the number of overlapping lesions. The coordinates of lesion overlap sites are available
(Supplementary Table 6).
Lesion network mapping BRAIN 2015: 138; 3061–3075 | 3067
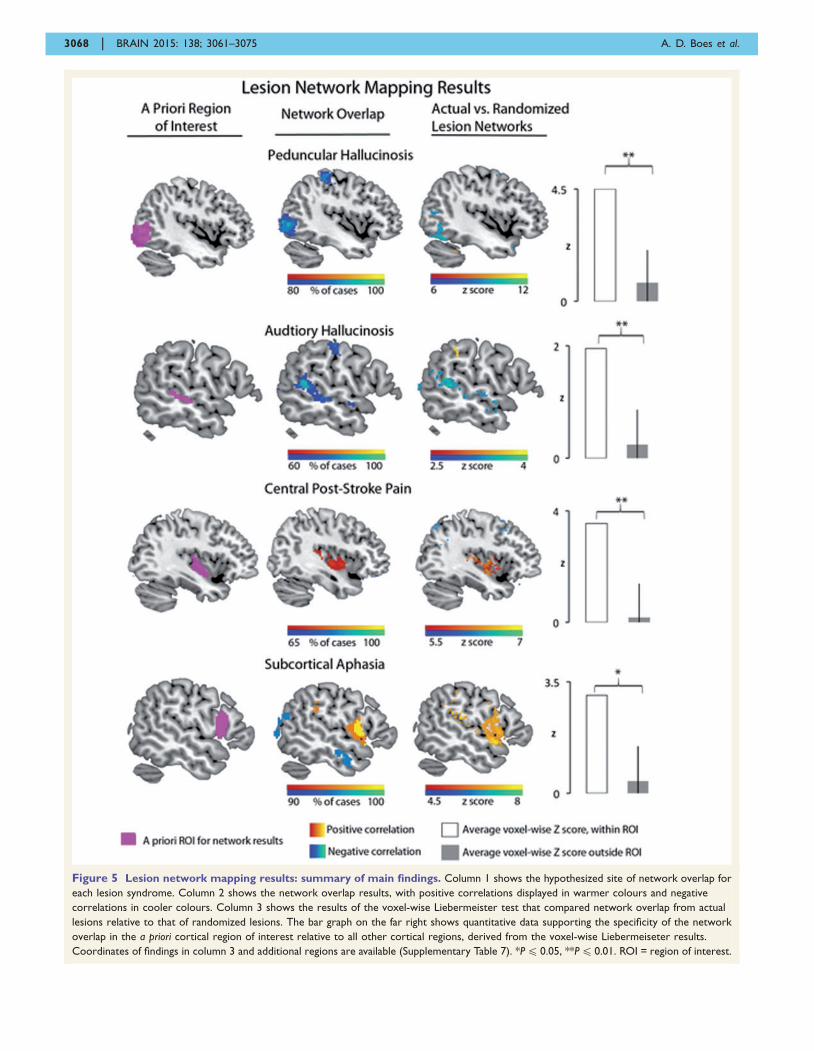
Figure 5 Lesion network mapping results: summary of main findings. Column 1 shows the hypothesized site of network overlap for
each lesion syndrome. Column 2 shows the network overlap results, with positive correlations displayed in warmer colours and negative
correlations in cooler colours. Column 3 shows the results of the voxel-wise Liebermeister test that compared network overlap from actual
lesions relative to that of randomized lesions. The bar graph on the far right shows quantitative data supporting the specificity of the network
overlap in the a priori cortical region of interest relative to all other cortical regions, derived from the voxel-wise Liebermeiseter results.
Coordinates of findings in column 3 and additional regions are available (Supplementary Table 7). *P4 0.05, **P4 0.01. ROI = region of interest.
3068 | BRAIN 2015: 138; 3061–3075 A. D. Boes et al.
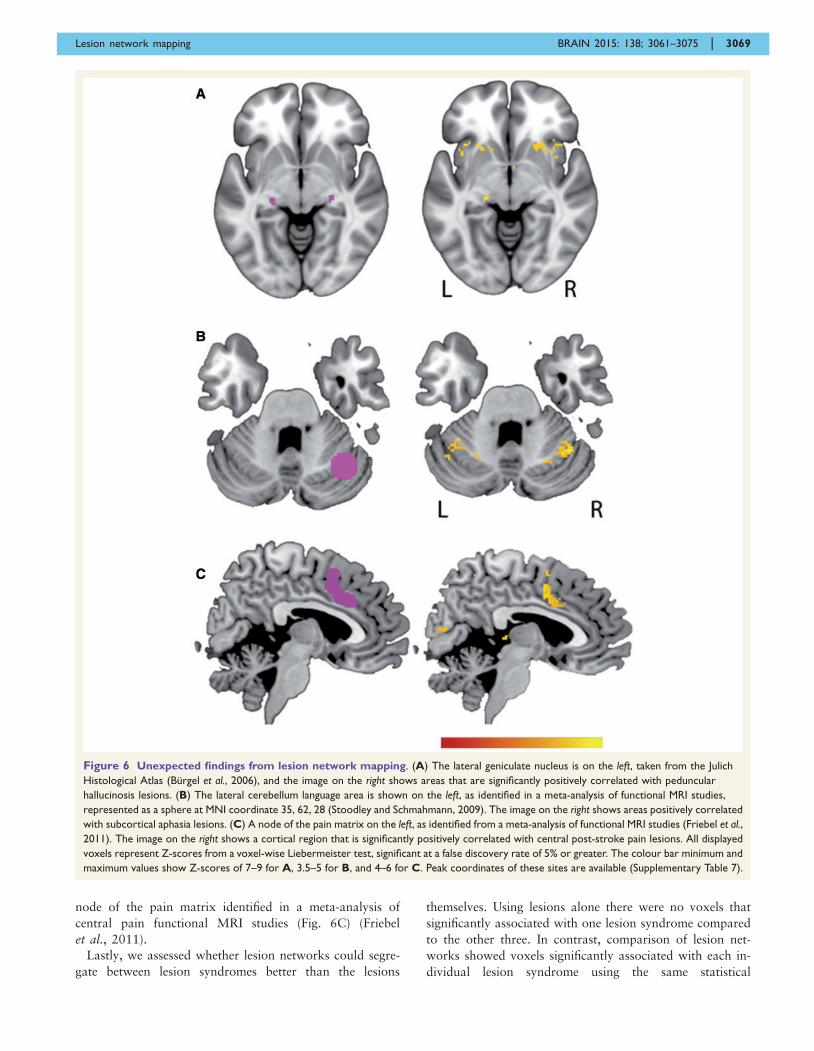
node of the pain matrix identified in a meta-analysis of
central pain functional MRI studies (Fig. 6C) (Friebel
et al., 2011).
Lastly, we assessed whether lesion networks could segre-
gate between lesion syndromes better than the lesions
themselves. Using lesions alone there were no voxels that
significantly associated with one lesion syndrome compared
to the other three. In contrast, comparison of lesion net-
works showed voxels significantly associated with each in-
dividual lesion syndrome using the same statistical
Figure 6 Unexpected findings from lesion network mapping. (A) The lateral geniculate nucleus is on the left, taken from the Julich
Histological Atlas (Burgel et al., 2006), and the image on the right shows areas that are significantly positively correlated with peduncular
hallucinosis lesions. (B) The lateral cerebellum language area is shown on the left, as identified in a meta-analysis of functional MRI studies,
represented as a sphere at MNI coordinate 35, 62, 28 (Stoodley and Schmahmann, 2009). The image on the right shows areas positively correlated
with subcortical aphasia lesions. (C) A node of the pain matrix on the left, as identified from a meta-analysis of functional MRI studies (Friebel et al.,
2011). The image on the right shows a cortical region that is significantly positively correlated with central post-stroke pain lesions. All displayed
voxels represent Z-scores from a voxel-wise Liebermeister test, significant at a false discovery rate of 5% or greater. The colour bar minimum and
maximum values show Z-scores of 7–9 for A, 3.5–5 for B, and 4–6 for C. Peak coordinates of these sites are available (Supplementary Table 7).
Lesion network mapping BRAIN 2015: 138; 3061–3075 | 3069
threshold (Fig. 7). Further, voxels significantly associated
with each syndrome were located within the a priori cor-
tical region of interest.
DiscussionHere we demonstrate that (i) lesion sites that produce simi-
lar neurological symptoms but occur in different locations
show overlap in their functional connectivity networks;
(ii) this overlap occurs in regions hypothesized a priori to
be involved in symptom expression; and (iii) these findings
hold true across lesion syndromes. Together, these findings
suggest that human connectome data can be used to in-
corporate network effects of brain lesions into symptom
localization. Because this technique does not require
advanced neuroimaging of patients, it may prove broadly
applicable towards understanding the neural correlates of
symptom expression across a variety of neurological and
psychiatric syndromes.
First we demonstrate utility in a syndrome long hypothe-
sized to be due to remote network effects, linking brainstem
and thalamus lesions in peduncular hallucinosis to cortical
areas implicated in visual release hallucinations. Next, we
show generalizability of the technique by applying it to
three additional disorders: auditory hallucinosis, central
post-stroke pain, and subcortical expressive aphasia.
Below we discuss how the current technique may help
address limitations of traditional lesion mapping, offers
complimentary information relative to functional imaging
in patients, and provides unique insights into the lesion
syndromes investigated here.
Augmenting the traditional approach
The lesion network mapping approach described in the
present paper addresses two limitations of traditional
lesion mapping: (i) it can allow for heterogeneously dis-
tributed lesions resulting in the same clinical syndrome to
be grouped into a single unifying network; and (ii) it can
link lesions to remote brain regions with a more direct or
more easily recognized role in the behavioural expression
of the lesion. This was demonstrated for each syndrome
studied. For example, peduncular hallucinosis lesions had
low levels of overlap that spanned multiple regions, but
almost every lesion localized to the same networks.
Moreover, sites of lesion overlap that did occur in pedun-
cular hallucinosis were not in visual areas, leaving it un-
clear how these sites related to the symptom of visual
hallucinations. In contrast, network overlap localized spe-
cifically to the extrastriate visual cortex, a region clearly
implicated in visual hallucinations based on prior func-
tional neuroimaging of patients (Dunn et al., 1983;
Asaad and Shapiro, 1986; Ffytche et al., 1998; Manford
and Andermann, 1998; Adachi et al., 2000; Vetrugno
et al., 2009).
Complimenting functionalneuroimaging of patients
Functional brain imaging in patients has been used to re-
late symptoms to the network effects of brain lesions
(Baron et al., 1986; Vuilleumier et al., 2004; Corbetta
et al., 2005; Sobesky et al., 2005; He et al., 2007a; Kim
et al., 2012). While similar in motivation, that approach is
different and complimentary to the technique presented
here. The most obvious difference is that that approach
requires functional neuroimaging data to be collected on
patients while the current approach does not. While there
is clear value to direct measurement of neurophysiological
effects in symptomatic patients, there is also value to
increased versatility. The present technique can be applied
to almost any neurological syndrome based solely on lesion
location. Second, post-lesion functional neuroimaging is not
able to investigate the physiology or connectivity of the
lesion location itself, as this tissue has been destroyed by
the lesion. This contrasts with our current technique, which
investigates properties of the lesion location based on a
cohort of intact subjects. Finally, functional neuroimaging
abnormalities in patients likely represent a combination of
direct lesion-induced functional changes and secondary
compensatory responses (Grefkes and Fink, 2014). Our
technique based on connectivity alone might isolate or at
least emphasize the direct lesion-induced functional
changes. In fact, combining the two techniques may
prove a powerful approach for differentiating direct
versus compensatory processes (see discussion on central
post-stroke pain below). The current method may also be
used to identify a priori regions of interest in which to
investigate the network effects of lesion patients undergoing
functional imaging.
The current study joins a limited number of other studies
that have begun to leverage normative human connectome
databases to predict network effects in patients. Examples
include predicting: cortical atrophy in stroke patients
(Kuceyeski et al., 2014), atrophy progression in patients
with neurodegenerative disease (Seeley et al., 2009; Zhou
et al., 2012), effects of focal brain stimulation (Fox et al.,
2014), and lesion-induced connectivity changes based on
computational modelling (Honey and Sporns, 2008;
Alstott et al., 2009). Because network effects of brain
lesions can impact prognosis (Gratton et al., 2012; Lim
et al., 2014; Warren et al., 2014) or be used to guide ther-
apy (Grefkes and Fink, 2014), these approaches may rep-
resent clinical applications of the human connectome
project (Van Essen et al., 2013).
Positive versus negative correlations
The current results suggest that heterogeneous lesions caus-
ing similar symptoms share functional connectivity to spe-
cific areas implicated in symptom expression. However, in
some cases this shared functional connectivity was based on
positive correlations, while in other cases it was based on
3070 | BRAIN 2015: 138; 3061–3075 A. D. Boes et al.
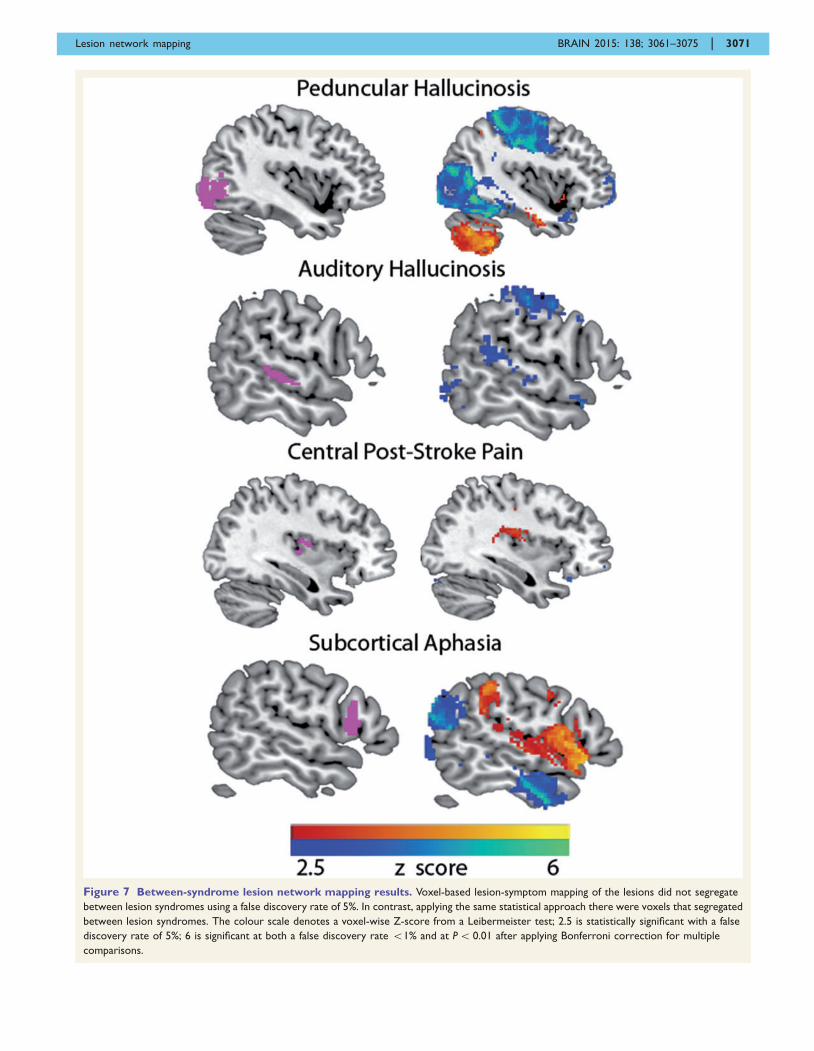
Figure 7 Between-syndrome lesion network mapping results. Voxel-based lesion-symptom mapping of the lesions did not segregate
between lesion syndromes using a false discovery rate of 5%. In contrast, applying the same statistical approach there were voxels that segregated
between lesion syndromes. The colour scale denotes a voxel-wise Z-score from a Leibermeister test; 2.5 is statistically significant with a false
discovery rate of 5%; 6 is significant at both a false discovery rate 51% and at P5 0.01 after applying Bonferroni correction for multiple
comparisons.
Lesion network mapping BRAIN 2015: 138; 3061–3075 | 3071
negative correlations. An important question is whether the
sign of the functional connectivity predicts what type of
remote functional effect will occur. For example, we
observed an anticorrelated relationship between subcortical
regions involved in release hallucinations and the cortical
regions hypothesized to be ‘released.’ This includes
extrastriate visual cortex in visual hallucinations and
superior temporal gyrus in auditory hallucinations.
Hypermetabolism has been demonstrated previously in
both cortical regions in association with hallucinations
(Ffytche et al., 1998; Adachi et al., 2000; Griffiths, 2000;
Allen et al., 2008; Kazui et al., 2009; Vetrugno et al., 2009;
Kumar et al., 2014), raising the possibility that sites of
anticorrelation predict sites of post-lesion hyperactivity.
Although there remains debate regarding the appropriate
interpretation of anticorrelated brain networks, the finding
that lesion sites are anticorrelated with cortical regions that
become hyperactive following the lesion suggests that antic-
orrelations may reflect causal functional interactions (Fox
et al., 2005, 2009b; Murphy et al., 2009; Carbonell et al.,
2011; Chai et al., 2012).
If negative correlation relates to post-lesion hyperperfu-
sion, one would predict that positive correlation would
relate to post-lesion hypoperfusion. Consistent with this
notion, positive network connectivity between lesion loca-
tion and language areas in subcortical aphasia corresponds
to post-lesion hypoperfusion previously observed in these
areas (de Boissezon et al., 2005; Choi et al., 2007; Kim
et al., 2012). In contrast, post-stroke pain appears to deviate
from this rule. Prior studies of central post-stroke pain have
shown increased activity in the insula and anterior cingulate
cortex (Peyron et al., 2004, 2013; Ducreux et al., 2006), yet
lesion network mapping showed positive correlation to these
areas (Figs 5 and 6C). One possible interpretation is that
insula and anterior cingulate hypermetabolism seen in cen-
tral post-stroke pain is not a direct effect of the lesion on
these brain areas, but is the result of reorganization and
neuroplasticity in these regions. Such an interpretation
would be consistent with the observation that central post-
stroke pain has a delay in symptom onset of weeks or
months after the injury (Klit et al., 2009), unlike other syn-
dromes studied here. This could suggest that lesion network
mapping predicts which remote brain areas are most likely
to undergo compensation and reorganization over an ex-
tended time course, a process that likely differs from the
immediate effects of the lesion on these same areas. Such a
hypothesis requires further validation.
Beyond a priori regions of interest
To validate our current approach, we focused on a priori
regions of interest already implicated in the symptom of
interest; however, interesting findings were also observed
outside these regions. One example was the positive net-
work overlap of peducular hallucinosis lesions in the lateral
geniculate nucleus (Fig. 6A). This finding raises the possi-
bility that visual hallucinations stemming from insult to the
direct visual pathway, variably termed cortical release hal-
lucinations or Charles Bonnet syndrome, share both clinical
features (Mocellin et al., 2006) and similar network local-
ization to peduncular hallicinosis. Another example from
subcortical aphasia was positive network overlap in the
right lateral cerebellum (Fig. 6B). This finding fits well
with an emerging literature on a role for the cerebellum
in language, which includes cerebellum lesions causing
aphasia (Marien et al., 1996, 2000; Fabbro et al., 2000;
Stoodley and Schmahmann, 2009). Together, these findings
suggest that our technique is capable of generating new
unexpected findings and insights, not just confirming exist-
ing hypotheses.
Limitations and conclusions
There are several limitations to the present work, some of
which provide important avenues for further research.
First, the goal of the present study was to provide valid-
ation of a technique for incorporating the network effects
of brain lesions into symptom localization, not to provide a
definitive explanation for four syndromes with historically
challenging and controversial brain–behaviour correlations.
Second, lesion network mapping appears capable of iden-
tifying which regions are likely to be functionally affected
by a lesion, but further work is needed to determine
whether we can predict how these regions will be affected.
There are dynamic compensatory mechanisms that unfold
after a lesion occurs and predicting these effects is likely to
require further work combining the present technique with
longitudinal post-lesion imaging of patients. Third, the pre-
sent analysis focused on shared network overlap across a
group of lesions. It remains unknown whether individual
differences in lesion-based networks relate to individual dif-
ferences in symptoms. Finally, there are limitations in MRI
resolution such that localizing results to specific brainstem
or thalamic nuclei is difficult. However, resting state func-
tional connectivity MRI has been used to study subcortical
connectivity in these areas (Zhang et al., 2010; Lu et al.,
2011) and the results of our specificity analyses suggest that
anatomical resolution with the current data is sufficient to
accurately resolve cortical connections of subcortical lesion
sites. Aside from the limitation imposed by MRI resolution
there are inherent limitations to the anatomical accuracy of
lesion mapping when voxels are analysed independently.
To circumvent this limitation, future studies may incorpor-
ate multivariate approaches to lesion inference mapping, as
recently introduced (Mah et al., 2014). Finally, the inter-
pretation of lesion networks in and adjacent to the lesions
themselves is challenging using the current approach, which
is why we focused here on cortical sites of network overlap
derived from subcortical lesions.
In conclusion, the current article links heterogeneous sub-
cortical lesions to cortical areas implicated in symptom gen-
eration across four separate conditions. We anticipate that
lesion network mapping will be an important addition to
lesion methodology, expanding localization of symptoms
3072 | BRAIN 2015: 138; 3061–3075 A. D. Boes et al.
from a focus on lesion sites to lesion networks. Finally,
such localization may facilitate tailored modulation of
connected networks using techniques like non-invasive
brain stimulation with the therapeutic aim of alleviating
clinical symptoms.
AcknowledgementsWe thank Randy Buckner and the Brain Genomics
Superstruct Project for contributing data and analysis
tools. We thank Drs Schultz, Chhatwal, and Sperling for
sharing functional connectivity data from a cohort of older
healthy adults and Dr Friebel for sharing the results of a
pain meta-analysis.
M.D.F. is listed as inventor on submitted or issued pa-
tents on guiding neurological interventions with fMRI.
A.P.L serves on the scientific advisory boards for
Nexstim, Neuronix, Starlab Neuroscience, Neuroelectrics,
Neosync, and Novavision, and is listed as inventor in
issued patents and patent applications on the real-time in-
tegration of transcranial magnetic stimulation (TMS) with
electroencephalography (EEG) and magnetic resonance
imaging (MRI).
FundingA.D.B. was supported by National Institute of
Health \ National Institute of Neurologial Disorders and
Stroke (Grant number 5R25NS065743-05) and the
Sidney R. Baer, Jr Foundation. H.L. was supported by
National Institute of Health \ National Institute of
Neurologial Disorders and Stroke (Grant number
K25NS069805) and the Brain & Behavior Research
Foundation NARSAD Young Investigator grant. M.D.F.
was supported by National Institute of Health \ National
Institute of Neurologial Disorders and Stroke (Grant num-
bers R25NS065743, K23NS083741), and the American
Brain Foundation. Work on this study was also supported
by grants from the National Institute of Health \ National
Center for Research Resources: Harvard Clinical and
Translational Science Center (Grant number UL1
RR025758). The National Institute of Health \ National
Institute on Aging funded the data collection for the older
cohort used in this study (Harvard Aging Brain Study,
Grant number P01AG036694).
Supplementary materialSupplementary material is available at Brain online.
ReferencesAdachi N, Watanabe T, Matsuda H, Onuma T. Hyperperfusion in the
lateral temporal cortex, the striatum and the thalamus during
complex visual hallucinations: single photon emission computed
tomography findings in patients with Charles Bonnet syndrome.
Psychiatry Clin Neurosci 2000; 54: 157–62.
Allen P, Larøi F, McGuire PK, Aleman A. The hallucinating brain: a
review of structural and functional neuroimaging studies of hallu-
cinations. Neurosci Biobehav Rev 2008; 32: 175–91.Alstott J, Breakspear M, Hagmann P, Cammoun L, Sporns O.
Modeling the impact of lesions in the human brain. PLoS Comput
Biol 2009; 5: e1000408.
Asaad G, Shapiro B. Hallucinations: theoretical and clinical overview.
Am J Psychiatry 1986; 143: 1088–97.
Baron JC, D’Antona R, Serdaru M, Pantano P, Bousser MG, Samson
Y. Cortical hypometabolism after a thalamic lesion in man: positron
tomography study [in French]. Rev Neurol (Paris) 1986; 142:
465–74.
Bartolomeo P. The quest for the ‘critical lesion site’ in cognitive def-
icits: problems and perspectives. Cortex 2011; 47: 1010–12.
Bates E, Wilson SM, Saygin AP, Dick F, Sereno MI, Knight RT, et al.
Voxel-based lesion-symptom mapping. Nat Neurosci 2003; 6:
448–50.
Behzadi Y, Restom K, Liau J, Liu TT. A component based noise cor-
rection method (CompCor) for BOLD and perfusion based fMRI.
Neuroimage 2007; 37: 90–101.Benke T. Peduncular hallucinosis: a syndrome of impaired reality
monitoring. J Neurol 2006; 253: 1561–71.
Brown-Sequard CE. Seance du 18 decembre. C R Soc Biol. 1875; 424.Buckner RL, Roffman JL, Smoller JW. Brain Genomics Superstruct
Project (GSP). Harvard Dataverse, V10; 2014. http://dx.doi.org/10.
7910/DVN/25833.
Burgel U, Amunts K, Hoemke L, Mohlberg H, Gilsbach JM, Zilles K.
White matter fiber tracts of the human brain: three-dimensional
mapping at microscopic resolution, topography and intersubject
variability. Neuroimage 2006; 29: 1092–105.Caplan LR. ‘Top of the basilar’ syndrome. Neurology 1980; 30: 72–9.
Carbonell F, Bellec P, Shmuel A. Global and system-specific resting-
state fMRI fluctuations are uncorrelated: principal component
analysis reveals anti-correlated networks. Brain Connect 2011; 1:
496–510.
Carrera E, Tononi G. Diaschisis: past, present, future. Brain 2014;
137: 2408–22.
Carter AR, Astafiev S V, Lang CE, Connor LT, Rengachary J, Strube
MJ, et al. Resting interhemispheric functional magnetic resonance
imaging connectivity predicts performance after stroke. Ann
Neurol 2010; 67: 365–75.
Carter AR, Shulman GL, Corbetta M. Why use a connectivity-based
approach to study stroke and recovery of function? Neuroimage
2012; 62: 2271–80.
Catani M, Dell’acqua F, Bizzi A, Forkel SJ, Williams SC, Simmons A,
et al. Beyond cortical localization in clinico-anatomical correlation.
Cortex 2012; 48: 1262–87.Chai XJ, Castanon AN, Ongur D, Whitfield-Gabrieli S.
Anticorrelations in resting state networks without global signal re-
gression. Neuroimage 2012; 59: 1420–8.
Choi JY, Lee KH, Na DL, Byun HS, Lee SJ, Kim H, et al. Subcortical
aphasia after striatocapsular infarction: quantitative analysis
of brain perfusion SPECT using statistical parametric mapping
and a statistical probabilistic anatomic map. J Nucl Med 2007;
48: 194–200.
Chung SJ, Im JH, Lee MC, Kim JS. Hemichorea after stroke: clinical-
radiological correlation. J Neurol 2004; 251: 725–9.
Corbetta M, Kincade MJ, Lewis C, Snyder AZ, Sapir A. Neural basis
and recovery of spatial attention deficits in spatial neglect. Nat
Neurosci 2005; 8: 1603–10.
Corbetta M, Ramsey L, Callejas A, Baldassarre A, Hacker CD, Siegel
JS, et al. Common behavioral clusters and subcortical anatomy in
stroke. Neuron 2015; 85: 927–41.Crosson B. Thalamic mechanisms in language: a reconsideration based
on recent findings and concepts. Brain Lang 2013; 126: 73–88.
Lesion network mapping BRAIN 2015: 138; 3061–3075 | 3073
Damasio H, Damasio AR. Lesion analysis in neuropsychology. New
York: Oxford University Press; 1989.
de Boissezon X, Demonet J-F, Puel M, Marie N, Raboyeau G,
Albucher J-F, et al. Subcortical aphasia: a longitudinal PET study.
Stroke 2005; 36: 1467–73.De Morsier G. Pathogenie de I’hallucinosepedonculaire: & pro- pos
d’un nouveau cas. Rev Neurol 1935; 64: 606–8.Desikan RS, Segonne F, Fischl B, Quinn BT, Dickerson BC, Blacker D,
et al. An automated labeling system for subdividing the human cere-
bral cortex on MRI scans into gyral based regions of interest.
Neuroimage 2006; 31: 968–80.
Dijkhuizen RM, Zaharchuk G, Otte WM. Assessment and modulation
of resting-state neural networks after stroke. Curr Opin Neurol
2014; 27: 637–43.
Ducreux D, Attal N, Parker F, Bouhassira D. Mechanisms of central
neuropathic pain: a combined psychophysical and fMRI study in
syringomyelia. Brain 2006; 129: 963–76.
Dunn DW, Weisberg LA, Nadell J. Peduncular hallucinations caused
by brainstem compression. Neurology 1983; 33: 1360–1.
Fabbro F, Moretti R, Bava A. Language impairments in patients with
cerebellar lesions. J. Neurolinguistics 2000; 13: 173–88.Feeney DM, Baron JC. Diaschisis. Stroke 1986; 17: 817–30.
Ferreira LK, Busatto GF. Resting-state functional connectivity in
normal brain aging. Neurosci Biobehav Rev 2013; 37: 384–400.
Ferro JM, Martins IP, Caeiro L. Behavioral neurology of stroke. In:
Brainin M, Heiss W-D, editors. Textbook of stroke medicine.
Cambridge, UK: Cambridge University Press; 2010. p. 178–202.
Ffytche DH, Howard RJ, Brammer MJ, David A, Woodruff P,
Williams S. The anatomy of conscious vision: an fMRI study of
visual hallucinations. Nat Neurosci 1998; 1: 738–42.
Fox MD, Buckner RL, Liu H, Chakravarty MM, Lozano a. M,
Pascual-Leone a. Resting-state networks link invasive and noninva-
sive brain stimulation across diverse psychiatric and neurological
diseases. Proc Natl Acad Sci USA 2014; 111: E4367–75.
Fox MD, Buckner RL, White MP, Greicius MD, Pascual-Leone A.
Efficacy of transcranial magnetic stimulation targets for depression
is related to intrinsic functional connectivity with the subgenual cin-
gulate. Biol Psychiatry 2012; 72: 595–603.
Fox MD, Raichle ME. Spontaneous fluctuations in brain activity
observed with functional magnetic resonance imaging. Nat Rev
Neurosci 2007; 8: 700–11.
Fox MD, Snyder AZ, Vincent JL, Corbetta M, Van Essen DC, Raichle
ME. The human brain is intrinsically organized into dynamic, antic-
orrelated functional networks. Proc Natl Acad Sci USA 2005; 102:
9673–8.
Fox MD, Zhang D, Snyder AZ, Raichle ME. The global signal and
observed anticorrelated resting state brain networks. J Neurophysiol
2009a; 101: 3270–83.Fox MD, Zhang D, Snyder AZ, Raichle ME. The global signal and
observed anticorrelated resting state brain networks. J Neurophysiol
2009b; 101: 3270–83.
Frank RJ, Damasio H, Grabowski TJ. Brainvox: an interactive, multi-
modal visualization and analysis system for neuroanatomical ima-
ging. Neuroimage 1997; 5: 13–30.
Friebel U, Eickhoff SB, Lotze M. Coordinate-based meta-analysis of
experimentally induced and chronic persistent neuropathic pain.
Neuroimage 2011; 58: 1070–80.
Garcia-Larrea L, Peyron R. Pain matrices and neuropathic pain matri-
ces: a review. Pain 2013; 154: S29–43.
Garcia-Larrea L. The posterior insular-opercular region and the search
of a primary cortex for pain. Neurophysiol Clin 2012; 42: 299–313.
Gratton C, Nomura EM, Perez F, D’Esposito M. Focal brain lesions to
critical locations cause widespread disruption of the modular organ-
ization of the brain. J Cogn Neurosci 2012; 24: 1275–85.Grefkes C, Fink GR. Connectivity-based approaches in stroke and
recovery of function. Lancet Neurol 2014; 13: 206–16.Griffiths TD. Musical hallucinosis in acquired deafness: phenomen-
ology and brain substrate. Brain 2000; 123: 2065–76.
He BJ, Shulman GL, Snyder AZ, Corbetta M. The role of impaired
neuronal communication in neurological disorders. Curr Opin
Neurol 2007a; 20: 655–60.
He BJ, Snyder AZ, Vincent JL, Epstein A, Shulman GL, Corbetta M.
Breakdown of functional connectivity in frontoparietal networks
underlies behavioral deficits in spatial neglect. Neuron 2007b; 53:
905–18.Honey CJ, Sporns O. Dynamical consequences of lesions in cortical
networks. Hum Brain Mapp 2008; 29: 802–9.Kazui H, Ishii R, Yoshida T, Ikezawa K, Takaya M, Tokunaga H,
et al. Neuroimaging studies in patients with Charles Bonnet
Syndrome. Psychogeriatrics 2009; 9: 77–84.
Kim YW, Kim HS, An Y-S. Statistical mapping analysis of brain me-
tabolism in patients with subcortical aphasia after intracerebral hem-
orrhage: a pilot study of F-18 FDG PET images. Yonsei Med J
2012; 53: 43–52.
Klit H, Finnerup NB, Jensen TS. Central post-stroke pain: clinical
characteristics, pathophysiology, and management. Lancet Neurol
2009; 8: 857–68.Kuceyeski A, Kamel H, Navi BB, Raj A, Iadecola C. Predicting future
brain tissue loss from white matter connectivity disruption in ische-
mic stroke. Stroke 2014; 45: 717–22.
Kumar S, Sedley W, Barnes GR, Teki S, Friston KJ, Griffiths TD. A
brain basis for musical hallucinations. Cortex 2014; 52: 86–97.
Lhermitte J. Syndrome de la calotte du pedoncule cerebral. Les trou-
bles psycho-sensorielsdans les lesions du mesodphale. Rev Neurol
1922; 38: 1359–65.
Lim JS, Kim N, Jang MU, Han MK, Kim S, Baek MJ, et al. Cortical
hubs and subcortical cholinergic pathways as neural substrates of
poststroke dementia. Stroke 2014; 45: 1069–76.
Lu J, Liu H, Zhang M, Wang D, Cao Y, Ma Q, et al. Focal pon-
tine lesions provide evidence that intrinsic functional connectivity
reflects polysynaptic anatomical pathways. J Neurosci 2011; 31:
15065–71.
Mah Y, Husain M, Rees G, Nachev P. Human brain lesion-deficit
inference remapped. Brain 2014; 137: 2522–31.
Manford M, Andermann F. Complex visual hallucinations. Clinical
and neurobiological insights. Brain 1998; 121 (Pt 1): 1819–40.
Marien P, Engelborghs S, Pickut BA, De Deyn PP. Aphasia following
cerebellar damage: fact or fallacy? J. Neurolinguistics 2000; 13:
145–71.
Marien P, Saerens J, Nanhoe R, Moens E, Nagels G, Pickut BA, et al.
Cerebellar induced aphasia: case report of cerebellar induced pre-
frontal aphasic language phenomena supported by SPECT findings.
J Neurol Sci 1996; 144: 34–43.McKee AC, Levine DN, Kowall NW, Richardson Jr. EP. Peduncular
hallucinosis associated with isolated infarction of the substantia
nigra pars reticulata. Ann Neurol 1990; 27: 500–4.
Mocellin R, Walterfang M, Velakoulis D. Neuropsychiatry of complex
visual hallucinations. Aust N Z J Psychiatry 2006; 40: 742–51.
Murphy K, Birn RM, Handwerker DA, Jones TB, Bandettini PA. The
impact of global signal regression on resting state correlations:
are anti-correlated networks introduced? Neuroimage 2009; 44:
893–905.
Nadeau SE, Crosson B. Subcortical aphasia. Brain Lang 1997; 58:
355–402; discussion 418–23.
Park C, Chang WH, Ohn SH, Kim ST, Bang OY, Pascual-Leone A,
et al. Longitudinal changes of resting-state functional con-
nectivity during motor recovery after stroke. Stroke 2011; 42:
1357–62.
Peyron R, Faillenot I, Pomares FB, Le Bars D, Garcia-Larrea L,
Laurent B. Mechanical allodynia in neuropathic pain. Where are
the brain representations located? A positron emission tomography
(PET) study. Eur J Pain 2013; 17: 1327–37.
Peyron R, Schneider F, Faillenot I, Convers P, Barral FG, Garcia-
Larrea L, et al. An fMRI study of cortical representation of mech-
anical allodynia in patients with neuropathic pain. Neurology 2004;
63: 1838–46.
3074 | BRAIN 2015: 138; 3061–3075 A. D. Boes et al.
Risser AH, Powell FC. Lhermitte’s peduncular hallucinosis. In: 45thAnnual Meeting of the American Academy of Neurology, New
York; 1993.
Robinson RG. Neuropsychiatric consequences of stroke. Annu Rev
Med 1997; 48: 217–29.Rorden C, Karnath H-O, Bonilha L. Improving lesion-symptom map-
ping. J Cogn Neurosci 2007; 19: 1081–8.
Saur D, Lange R, Baumgaertner A, Schraknepper V, Willmes K,
Rijntjes M, et al. Dynamics of language reorganization afterstroke. Brain 2006; 129: 1371–84.
Schultz AP, Chhatwal JP, Huijbers W, Hedden T, van Dijk KRA,
McLaren DG, et al. Template based rotation: a method for func-tional connectivity analysis with a priori templates. Neuroimage
2014; 102 (Pt 2): 620–36.
Seeley WW, Crawford RK, Zhou J, Miller BL, Greicius MD.
Neurodegenerative diseases target large-scale human brain networks.Neuron 2009; 62: 42–52.
Sobesky J, Thiel A, Ghaemi M, Hilker RH, Rudolf J, Jacobs AH, et al.
Crossed cerebellar diaschisis in acute human stroke: a PET study of
serial changes and response to supratentorial reperfusion. J CerebBlood Flow Metab 2005; 25: 1685–91.
Stoodley CJ, Schmahmann JD. Functional topography in the human
cerebellum: a meta-analysis of neuroimaging studies. Neuroimage
2009; 44: 489–501.Van Bogaert L. L’Hallucinose pedonculaire. Rev Neurol 1927; 1927:
608–17.
Van Dijk KR, Hedden T, Venkataraman A, Evans KC, Lazar SW,Buckner RL. Intrinsic functional connectivity as a tool for human
connectomics: theory, properties, and optimization. J Neurophysiol
2010; 103: 297–321.
Van Essen DC, Smith SM, Barch DM, Behrens TE, Yacoub E, UgurbilK. The WU-Minn human connectome project: an overview.
Neuroimage 2013; 80: 62–79.
Vetrugno R, Vella A, Mascalchi M, Alessandria M, D’Angelo R,Gallassi R, et al. Peduncular hallucinosis: a polysomnographic and
spect study of a patient and efficacy of serotonergic therapy. Sleep
Med 2009; 10: 1158–60.
Von Monakow C, Harris G. Die Lokalisation im Grosshirn:Undder Abbau der Funktion durch kortikale Herde.
Wiesbaden: Bergmann: In: Pribam KH, editor. Brain and
behavior I: Mood states and mind. Baltimore: Penguin 1969;
1914. p. 27–36.Vuilleumier P. Mapping the functional neuroanatomy of spatial neg-
lect and human parietal lobe functions: progress and challenges.
Ann N Y Acad Sci 2013; 1296: 50–74.Vuilleumier P, Richardson MP, Armony JL, Driver J, Dolan
RJ. Distant influences of amygdala lesion on visual cortical activa-
tion during emotional face processing. Nat Neurosci 2004; 7:
1271–8.Wang L, Yu C, Chen H, Qin W, He Y, Fan F, et al. Dynamic func-
tional reorganization of the motor execution network after stroke.
Brain 2010; 133: 1224–38.
Warren DE, Power JD, Bruss J, Denburg NL, Waldron EJ,Sun H, et al. Network measures predict neuropsychological out-
come after brain injury. Proc Natl Acad Sci USA 2014; 111:
14247–52.
Whitfield-Gabrieli S, Nieto-Castanon A. Conn: a functional connect-ivity toolbox for correlated and anticorrelated brain networks. Brain
Connect 2012; 2: 125–41.
Zhang D, Snyder AZ, Shimony JS, Fox MD, Raichle ME.Noninvasive functional and structural connectivity mapping of
the human thalamocortical system. Cereb Cortex 2010; 20:
1187–94.
Zhou J, Gennatas ED, Kramer JH, Miller BL, Seeley WW. Predictingregional neurodegeneration from the healthy brain functional con-
nectome. Neuron 2012; 73: 1216–27.
Lesion network mapping BRAIN 2015: 138; 3061–3075 | 3075