netiq appmanager for lotus domino management guide · domino appmanager for lotus domino provides...
TRANSCRIPT
NetIQ® AppManager® for Lotus Domino
Management Guide
March 2013
Legal Notice
THIS DOCUMENT AND THE SOFTWARE DESCRIBED IN THIS DOCUMENT ARE FURNISHED UNDER AND ARE SUBJECT TO THE TERMS OF A LICENSE AGREEMENT OR A NON-DISCLOSURE AGREEMENT. EXCEPT AS EXPRESSLY SET FORTH IN SUCH LICENSE AGREEMENT OR NON-DISCLOSURE AGREEMENT, NETIQ CORPORATION PROVIDES THIS DOCUMENT AND THE SOFTWARE DESCRIBED IN THIS DOCUMENT "AS IS" WITHOUT WARRANTY OF ANY KIND, EITHER EXPRESS OR IMPLIED, INCLUDING, BUT NOT LIMITED TO, THE IMPLIED WARRANTIES OF MERCHANTABILITY OR FITNESS FOR A PARTICULAR PURPOSE. SOME STATES DO NOT ALLOW DISCLAIMERS OF EXPRESS OR IMPLIED WARRANTIES IN CERTAIN TRANSACTIONS; THEREFORE, THIS STATEMENT MAY NOT APPLY TO YOU.
For purposes of clarity, any module, adapter or other similar material ("Module") is licensed under the terms and conditions of the End User License Agreement for the applicable version of the NetIQ product or software to which it relates or interoperates with, and by accessing, copying or using a Module you agree to be bound by such terms. If you do not agree to the terms of the End User License Agreement you are not authorized to use, access or copy a Module and you must destroy all copies of the Module and contact NetIQ for further instructions.
This document and the software described in this document may not be lent, sold, or given away without the prior written permission of NetIQ Corporation, except as otherwise permitted by law. Except as expressly set forth in such license agreement or non-disclosure agreement, no part of this document or the software described in this document may be reproduced, stored in a retrieval system, or transmitted in any form or by any means, electronic, mechanical, or otherwise, without the prior written consent of NetIQ Corporation. Some companies, names, and data in this document are used for illustration purposes and may not represent real companies, individuals, or data.
This document could include technical inaccuracies or typographical errors. Changes are periodically made to the information herein. These changes may be incorporated in new editions of this document. NetIQ Corporation may make improvements in or changes to the software described in this document at any time.
U.S. Government Restricted Rights: If the software and documentation are being acquired by or on behalf of the U.S. Government or by a U.S. Government prime contractor or subcontractor (at any tier), in accordance with 48 C.F.R. 227.7202-4 (for Department of Defense (DOD) acquisitions) and 48 C.F.R. 2.101 and 12.212 (for non-DOD acquisitions), the government’s rights in the software and documentation, including its rights to use, modify, reproduce, release, perform, display or disclose the software or documentation, will be subject in all respects to the commercial license rights and restrictions provided in the license agreement.
© 2013 NetIQ Corporation and its affiliates. All Rights Reserved.
For information about NetIQ trademarks, see https://www.netiq.com/company/legal/.
Contents
About this Book and the Library 5About NetIQ Corporation 7
1 Introducing AppManager for Lotus Domino 9
2 Installing AppManager for Lotus Domino 11
2.1 System Requirements . . . . . . . . . . . . . . . . . . . . . . . . . . . . . . . . . . . . . . . . . . . . . . . . . . . . . . . . . . . . 112.2 Preinstallation Considerations . . . . . . . . . . . . . . . . . . . . . . . . . . . . . . . . . . . . . . . . . . . . . . . . . . . . . . 122.3 Permissions for Running Knowledge Scripts . . . . . . . . . . . . . . . . . . . . . . . . . . . . . . . . . . . . . . . . . . . 122.4 Installing the Module . . . . . . . . . . . . . . . . . . . . . . . . . . . . . . . . . . . . . . . . . . . . . . . . . . . . . . . . . . . . . 122.5 Deploying the Module with Control Center. . . . . . . . . . . . . . . . . . . . . . . . . . . . . . . . . . . . . . . . . . . . . 142.6 Silently Installing the Module . . . . . . . . . . . . . . . . . . . . . . . . . . . . . . . . . . . . . . . . . . . . . . . . . . . . . . . 142.7 Discovering Lotus Domino Resources . . . . . . . . . . . . . . . . . . . . . . . . . . . . . . . . . . . . . . . . . . . . . . . . 152.8 Upgrading Knowledge Script Jobs . . . . . . . . . . . . . . . . . . . . . . . . . . . . . . . . . . . . . . . . . . . . . . . . . . . 162.9 Configuring AppManager for Lotus Domino. . . . . . . . . . . . . . . . . . . . . . . . . . . . . . . . . . . . . . . . . . . . 182.10 Accessing and Viewing the netiq.nsf Database . . . . . . . . . . . . . . . . . . . . . . . . . . . . . . . . . . . . . . . . . 18
3 Domino Knowledge Scripts 19
3.1 Connectivity . . . . . . . . . . . . . . . . . . . . . . . . . . . . . . . . . . . . . . . . . . . . . . . . . . . . . . . . . . . . . . . . . . . . 213.2 ConsoleCommand . . . . . . . . . . . . . . . . . . . . . . . . . . . . . . . . . . . . . . . . . . . . . . . . . . . . . . . . . . . . . . . 233.3 CPUUtil . . . . . . . . . . . . . . . . . . . . . . . . . . . . . . . . . . . . . . . . . . . . . . . . . . . . . . . . . . . . . . . . . . . . . . . 253.4 DbACLChanged . . . . . . . . . . . . . . . . . . . . . . . . . . . . . . . . . . . . . . . . . . . . . . . . . . . . . . . . . . . . . . . . . 263.5 DBCacheHit . . . . . . . . . . . . . . . . . . . . . . . . . . . . . . . . . . . . . . . . . . . . . . . . . . . . . . . . . . . . . . . . . . . . 283.6 DBDocNumber . . . . . . . . . . . . . . . . . . . . . . . . . . . . . . . . . . . . . . . . . . . . . . . . . . . . . . . . . . . . . . . . . . 303.7 DBReplicating . . . . . . . . . . . . . . . . . . . . . . . . . . . . . . . . . . . . . . . . . . . . . . . . . . . . . . . . . . . . . . . . . . 313.8 DBSizes . . . . . . . . . . . . . . . . . . . . . . . . . . . . . . . . . . . . . . . . . . . . . . . . . . . . . . . . . . . . . . . . . . . . . . . 333.9 DBWhiteSpace. . . . . . . . . . . . . . . . . . . . . . . . . . . . . . . . . . . . . . . . . . . . . . . . . . . . . . . . . . . . . . . . . . 353.10 GetStat . . . . . . . . . . . . . . . . . . . . . . . . . . . . . . . . . . . . . . . . . . . . . . . . . . . . . . . . . . . . . . . . . . . . . . . . 373.11 HTTPAccessStat . . . . . . . . . . . . . . . . . . . . . . . . . . . . . . . . . . . . . . . . . . . . . . . . . . . . . . . . . . . . . . . . 393.12 InetPortCheck . . . . . . . . . . . . . . . . . . . . . . . . . . . . . . . . . . . . . . . . . . . . . . . . . . . . . . . . . . . . . . . . . . 413.13 LogSniff . . . . . . . . . . . . . . . . . . . . . . . . . . . . . . . . . . . . . . . . . . . . . . . . . . . . . . . . . . . . . . . . . . . . . . . 433.14 MailThruput . . . . . . . . . . . . . . . . . . . . . . . . . . . . . . . . . . . . . . . . . . . . . . . . . . . . . . . . . . . . . . . . . . . . 453.15 MemBusy . . . . . . . . . . . . . . . . . . . . . . . . . . . . . . . . . . . . . . . . . . . . . . . . . . . . . . . . . . . . . . . . . . . . . . 473.16 NetworkBusy . . . . . . . . . . . . . . . . . . . . . . . . . . . . . . . . . . . . . . . . . . . . . . . . . . . . . . . . . . . . . . . . . . . 493.17 NotesMailStats . . . . . . . . . . . . . . . . . . . . . . . . . . . . . . . . . . . . . . . . . . . . . . . . . . . . . . . . . . . . . . . . . . 503.18 OldestDocInDB . . . . . . . . . . . . . . . . . . . . . . . . . . . . . . . . . . . . . . . . . . . . . . . . . . . . . . . . . . . . . . . . . 533.19 OpenDBResponseTime . . . . . . . . . . . . . . . . . . . . . . . . . . . . . . . . . . . . . . . . . . . . . . . . . . . . . . . . . . . 553.20 ReplicationTime . . . . . . . . . . . . . . . . . . . . . . . . . . . . . . . . . . . . . . . . . . . . . . . . . . . . . . . . . . . . . . . . . 563.21 Report_Connectivity . . . . . . . . . . . . . . . . . . . . . . . . . . . . . . . . . . . . . . . . . . . . . . . . . . . . . . . . . . . . . . 583.22 Report_DatabaseSize . . . . . . . . . . . . . . . . . . . . . . . . . . . . . . . . . . . . . . . . . . . . . . . . . . . . . . . . . . . . 603.23 Report_MailThroughputDeadMails . . . . . . . . . . . . . . . . . . . . . . . . . . . . . . . . . . . . . . . . . . . . . . . . . . 633.24 Report_MailThroughputFailureMail . . . . . . . . . . . . . . . . . . . . . . . . . . . . . . . . . . . . . . . . . . . . . . . . . . 653.25 Report_MailThroughputPendingMails . . . . . . . . . . . . . . . . . . . . . . . . . . . . . . . . . . . . . . . . . . . . . . . . 683.26 Report_MailThroughputRoutedMail . . . . . . . . . . . . . . . . . . . . . . . . . . . . . . . . . . . . . . . . . . . . . . . . . . 713.27 Report_MailThruputDeliveredMail . . . . . . . . . . . . . . . . . . . . . . . . . . . . . . . . . . . . . . . . . . . . . . . . . . . 73
Contents 3
3.28 Report_ServerDown. . . . . . . . . . . . . . . . . . . . . . . . . . . . . . . . . . . . . . . . . . . . . . . . . . . . . . . . . . . . . . 763.29 Report_ServerUpTime . . . . . . . . . . . . . . . . . . . . . . . . . . . . . . . . . . . . . . . . . . . . . . . . . . . . . . . . . . . . 783.30 Report_TopNDatabases . . . . . . . . . . . . . . . . . . . . . . . . . . . . . . . . . . . . . . . . . . . . . . . . . . . . . . . . . . 803.31 Report_UserSessions . . . . . . . . . . . . . . . . . . . . . . . . . . . . . . . . . . . . . . . . . . . . . . . . . . . . . . . . . . . . 813.32 ServerAvailability . . . . . . . . . . . . . . . . . . . . . . . . . . . . . . . . . . . . . . . . . . . . . . . . . . . . . . . . . . . . . . . . 833.33 ServerDown . . . . . . . . . . . . . . . . . . . . . . . . . . . . . . . . . . . . . . . . . . . . . . . . . . . . . . . . . . . . . . . . . . . . 853.34 SMTPConnectivity . . . . . . . . . . . . . . . . . . . . . . . . . . . . . . . . . . . . . . . . . . . . . . . . . . . . . . . . . . . . . . . 863.35 TaskAvailability . . . . . . . . . . . . . . . . . . . . . . . . . . . . . . . . . . . . . . . . . . . . . . . . . . . . . . . . . . . . . . . . . 893.36 TaskDown . . . . . . . . . . . . . . . . . . . . . . . . . . . . . . . . . . . . . . . . . . . . . . . . . . . . . . . . . . . . . . . . . . . . . 923.37 TopNAccessDbs . . . . . . . . . . . . . . . . . . . . . . . . . . . . . . . . . . . . . . . . . . . . . . . . . . . . . . . . . . . . . . . . 943.38 TopNDatabases . . . . . . . . . . . . . . . . . . . . . . . . . . . . . . . . . . . . . . . . . . . . . . . . . . . . . . . . . . . . . . . . . 963.39 TopNMailDatabases. . . . . . . . . . . . . . . . . . . . . . . . . . . . . . . . . . . . . . . . . . . . . . . . . . . . . . . . . . . . . . 973.40 TopNUnUsedDBs. . . . . . . . . . . . . . . . . . . . . . . . . . . . . . . . . . . . . . . . . . . . . . . . . . . . . . . . . . . . . . . . 993.41 TopNUsers . . . . . . . . . . . . . . . . . . . . . . . . . . . . . . . . . . . . . . . . . . . . . . . . . . . . . . . . . . . . . . . . . . . . 1013.42 UserSessions . . . . . . . . . . . . . . . . . . . . . . . . . . . . . . . . . . . . . . . . . . . . . . . . . . . . . . . . . . . . . . . . . . 102
4 NetIQ AppManager for Lotus Domino Management Guide
About this Book and the Library
The NetIQ AppManager product (AppManager) is a comprehensive solution for managing, diagnosing, and analyzing performance, availability, and health for a broad spectrum of operating environments, applications, services, and server hardware.
AppManager provides system administrators with a central, easy-to-use console to view critical server and application resources across the enterprise. With AppManager, administrative staff can monitor computer and application resources, check for potential problems, initiate responsive actions, automate routine tasks, and gather performance data for real-time and historical reporting and analysis.
Intended AudienceThis guide provides information for individuals responsible for installing an AppManager module and monitoring specific applications with AppManager.
Other Information in the LibraryThe library provides the following information resources:
Installation Guide for AppManager Provides complete information about AppManager pre-installation requirements and step-by-step installation procedures for all AppManager components.
User Guide for AppManager Control Center Provides complete information about managing groups of computers, including running jobs, responding to events, creating reports, and working with Control Center. A separate guide is available for the AppManager Operator Console.
Administrator Guide for AppManager Provides information about maintaining an AppManager management site, managing security, using scripts to handle AppManager tasks, and leveraging advanced configuration options.
Upgrade and Migration Guide for AppManager Provides complete information about how to upgrade from a previous version of AppManager.
Management guides Provide information about installing and monitoring specific applications with AppManager.
Help Provides context-sensitive information and step-by-step guidance for common tasks, as well as definitions for each field on each window.
The AppManager library is available in Adobe Acrobat (PDF) format from the AppManager Documentation page of the NetIQ Web site.
About this Book and the Library 5

ConventionsThe library uses consistent conventions to help you identify items throughout the documentation. The following table summarizes these conventions.
Convention Use
Bold Window and menu items
Technical terms, when introduced
Italics Book and CD-ROM titles
Variable names and values
Emphasized words
Fixed Font File and folder names
Commands and code examples
Text you must type
Text (output) displayed in the command-line interface
Brackets, such as [value] Optional parameters of a command
Braces, such as {value} Required parameters of a command
Logical OR, such as value1|value2
Exclusive parameters. Choose one parameter.
(Conditional) “Conditional” means that users must perform an action if certain conditions exist. If the statement is conditional, insert (Conditional) before the statement.
For example:
(Conditional) If you use Control Center 7.x, run the module installer for each QDB attached to Control Center.
(Optional) “Optional” indicates that the users can choose to perform an action. If the statement is optional, insert (Optional) before the statement.
For example:
(Optional) Click Test in browser to open a browser and go to the URL you just specified.
6 NetIQ AppManager for Lotus Domino Management Guide
About NetIQ Corporation
We are a global, enterprise software company, with a focus on the three persistent challenges in your environment: Change, complexity and risk—and how we can help you control them.
Our ViewpointAdapting to change and managing complexity and risk are nothing new
In fact, of all the challenges you face, these are perhaps the most prominent variables that deny you the control you need to securely measure, monitor, and manage your physical, virtual, and cloud computing environments.
Enabling critical business services, better and faster We believe that providing as much control as possible to IT organizations is the only way to enable timelier and cost effective delivery of services. Persistent pressures like change and complexity will only continue to increase as organizations continue to change and the technologies needed to manage them become inherently more complex.
Our PhilosophySelling intelligent solutions, not just software
In order to provide reliable control, we first make sure we understand the real-world scenarios in which IT organizations like yours operate — day in and day out. That's the only way we can develop practical, intelligent IT solutions that successfully yield proven, measurable results. And that's so much more rewarding than simply selling software.
Driving your success is our passion We place your success at the heart of how we do business. From product inception to deployment, we understand that you need IT solutions that work well and integrate seamlessly with your existing investments; you need ongoing support and training post-deployment; and you need someone that is truly easy to work with — for a change. Ultimately, when you succeed, we all succeed.
Our Solutions Identity & Access Governance Access Management Security Management Systems & Application Management Workload Management Service Management
About NetIQ Corporation 7
Contacting Sales SupportFor questions about products, pricing, and capabilities, contact your local partner. If you cannot contact your partner, contact our Sales Support team.
Contacting Technical SupportFor specific product issues, contact our Technical Support team.
Contacting Documentation SupportOur goal is to provide documentation that meets your needs. If you have suggestions for improvements, click Add Comment at the bottom of any page in the HTML versions of the documentation posted at www.netiq.com/documentation. You can also email [email protected]. We value your input and look forward to hearing from you.
Contacting the Online User CommunityQmunity, the NetIQ online community, is a collaborative network connecting you to your peers and NetIQ experts. By providing more immediate information, useful links to helpful resources, and access to NetIQ experts, Qmunity helps ensure you are mastering the knowledge you need to realize the full potential of IT investments upon which you rely. For more information, visit http://community.netiq.com.
Worldwide: www.netiq.com/about_netiq/officelocations.asp
United States and Canada: 1-888-323-6768
Email: [email protected]
Web Site: www.netiq.com
Worldwide: www.netiq.com/support/contactinfo.asp
North and South America: 1-713-418-5555
Europe, Middle East, and Africa: +353 (0) 91-782 677
Email: [email protected]
Web Site: www.netiq.com/support
8 NetIQ AppManager for Lotus Domino Management Guide
1 1Introducing AppManager for Lotus Domino
AppManager for Lotus Domino provides Knowledge Scripts designed to give you a comprehensive view of how the Domino server performs. The capabilities of the Knowledge Scripts in the Domino category include the following:
Monitoring the status of Domino server and the activities occurring on the Domino server Generating reports about the Domino server and about the activities occurring on the Domino
server Checking the Domino log for errors Tracking the number of documents in a Domino database Monitoring the size of Domino databases and the percentage of data that is read from the
Domino database cache Monitoring the percentage of CPU resources used by Domino processes
Introducing AppManager for Lotus Domino 9

10 NetIQ AppManager for Lotus Domino Management Guide
2 2Installing AppManager for Lotus Domino
This chapter provides installation instructions and describes system requirements for AppManager for Lotus Domino.
This chapter assumes you have AppManager installed. For more information about installing AppManager or about AppManager system requirements, see the Installation Guide for AppManager, which is available on the AppManager Documentation page.
2.1 System RequirementsFor the latest information about supported software versions and the availability of module updates, visit the AppManager Supported Products page. Unless noted otherwise, this module supports all updates, hotfixes, and service packs for the releases listed below.
AppManager for Lotus Domino has the following system requirements:
If you encounter problems using this module with a later version of your application, contact NetIQ Technical Support.
Software/Hardware Version
NetIQ AppManager installed on the AppManager repository (QDB) computers, on the Lotus Domino computers you want to monitor (agents), and on all console computers
7.0 or later
Support for Windows Server 2008 on AppManager 7.x requires AppManager Windows Agent hotfix 71704 or later. For more information, see the AppManager Suite Hotfixes page.
Microsoft Windows operating system on agent computers
One of the following:
Windows Server 2008 R2
Windows Server 2008 (32-bit and 64-bit)
Windows Server 2003 R2 (32-bit and 64-bit)
AppManager for Microsoft Windows module installed on repository, agent, and console computers
Support for Windows Server 2008 R2 on AppManager 7.x requires the AppManager for Windows module, version 7.6.170.0 or later. For more information, see the AppManager Module Upgrades & Trials page.
Lotus Domino on agent computers Version 8.5.2, 8.5.1, 8.5, 8.0.1
Installing AppManager for Lotus Domino 11

2.2 Preinstallation ConsiderationsIf you are installing the latest version of AppManager for Lotus Domino on a server on which a previous version is already installed, follow normal unloading procedures to unload nnetiq.exe from the Domino server. For example, run the following command from a Domino server, or unload the task from the Administrator client:
tell nnetiq quit
2.3 Permissions for Running Knowledge ScriptsTo run the Knowledge Scripts in the Domino category, the AppManager agent needs certain secure permissions. The account under which the agent services (NetIQmc and NetIQccm) are running must have the following permissions on each monitored Domino server:
Ability to log on as a service. Membership in the Domain Admin group.
The agent services must run under a Windows user account, such as Domain Admin, with these permissions. Agent installation directs you to use the Windows Local System account for these services by default. You can change the account under which the agent services are currently running.
To update the agent services:
1 Navigate to the Control Panel, double-click Administrative Tools, and then double-click Services.
2 Right-click the NetIQ AppManager Client Communication Manager (netiqccm) service in the list of services, and select Properties.
3 On the Logon tab, specify the appropriate account to use and then click OK.4 Repeat steps 2 and 3 for the NetIQ AppManager Client Resource Monitor (netiqmc) service. 5 Restart both services.
2.4 Installing the ModuleRun the module installer only once on any computer. The module installer automatically identifies and updates all relevant AppManager components on a computer.
Access the AM70-Domino-7.x.x.0.msi module installer from the AM70_Domino-7.x.x.0.0 self-extracting installation package on the AppManager Module Upgrades & Trials page.
For Windows environments where User Account Control (UAC) is enabled, install the module using an account with administrative privileges. Use one of the following methods:
Log in to the server using the account named Administrator. Then, run AM70-Domino-7.x.x.0-7.x.x.0.msi from a command prompt or by double-clicking it.
Log in to the server as a user with administrative privileges and run AM70-Domino-7.x.x.0.msi as an administrator from a command prompt. To open a command-prompt window at the administrative level, right-click a command-prompt icon or a Windows menu item and select Run as administrator.
You can install the Knowledge Scripts and the Analysis Center reports into local or remote AppManager repositories (QDBs). Install these components only once per QDB.
12 NetIQ AppManager for Lotus Domino Management Guide
The module installer now installs Knowledge Scripts for each module directly into the QDB instead of installing the scripts in the \AppManager\qdb\kp folder as in previous releases of AppManager.
You can install the module manually, or you can use Control Center to deploy the module on a remote computer where an agent is installed. For more information, see Section 2.5, “Deploying the Module with Control Center,” on page 14. However, if you use Control Center to deploy the module, Control Center only installs the agent components of the module. The module installer installs the QDB and console components as well as the agent components on the agent computer.
To install the module manually:
1 Double-click the module installer .msi file. 2 Accept the license agreement. 3 Review the results of the pre-installation check. You can expect one of the following three
scenarios: No AppManager agent is present: In this scenario, the pre-installation check fails, and the
installer does not install agent components. An AppManager agent is present, but some other prerequisite fails: In this scenario, the
default is to not install agent components because of one or more missing prerequisites. However, you can override the default by selecting Install agent component locally. A missing application server for this particular module often causes this scenario. For example, installing the AppManager for Microsoft SharePoint module requires the presence of a Microsoft SharePoint server on the selected computer.
All prerequisites are met: In this scenario, the installer installs the agent components.4 To install the Knowledge Scripts into the QDB and to install the Analysis Center reports into the
Analysis Center Configuration Database:4a Select Install Knowledge Scripts to install the repository components, including the
Knowledge Scripts, object types, and SQL stored procedures.4b Select Install report package to install the Analysis Center reports. 4c Specify the SQL Server name of the server hosting the QDB, as well as the case-sensitive
QDB name. 4d Specify the SQL Server name of the server hosting the Analysis Center Configuration
Database.5 (Conditional) If you use Control Center 7.x, run the module installer for each QDB attached to
Control Center. 6 (Conditional) If you use Control Center 8.x, run the module installer only for the primary QDB,
and Control Center automatically replicates this module to secondary QDBs.7 Run the module installer on all console computers to install the Help and console extensions.8 Run the module installer on the Domino computers you want to monitor (agents) to install the
agent components.9 (Conditional) If you have not already discovered Domino resources, run the Section 2.7,
“Discovering Lotus Domino Resources,” on page 15 Knowledge Script on all agent computers where you installed the module.
10 To get the updates provided in this release, upgrade any running Knowledge Script jobs. For more information, see Section 2.8, “Upgrading Knowledge Script Jobs,” on page 16.
11 Load nnetiq.exe. If you receive an error message indicating that nnetiq.exe is not loaded, execute the following command on the Domino server:
load nnetiq.exe
Installing AppManager for Lotus Domino 13
After the installation has completed, you can find a record of problems encountered in the Domino_Install.log file, located in the \NetIQ\Temp\NetIQ_Debug\<ServerName> folder.
2.5 Deploying the Module with Control CenterYou can use Control Center to deploy the module on a remote computer where an agent is installed. This topic briefly describes the steps involved in deploying a module and provides instructions for checking in the module installation package. For more information, see the Control Center User Guide for AppManager, which is available on the AppManager Documentation page.
2.5.1 Deployment Overview
This section describes the tasks required to deploy the module on an agent computer.
To deploy the module on an agent computer:
1 Verify the default deployment credentials. 2 Check in an installation package. For more information, see Section 2.5.2, “Checking In the
Installation Package,” on page 14.3 Configure an email address to receive notification of a deployment. 4 Create a deployment rule or modify an out-of-the-box deployment rule. 5 Approve the deployment task. 6 View the results.
2.5.2 Checking In the Installation Package
You must check in the installation package, AM70-Domino-7.x.x.0.xml, before you can deploy the module on an agent computer.
To check in a module installation package:
1 Log on to Control Center using an account that is a member of a user group with deployment permissions.
2 Navigate to the Deployment tab (for AppManager 8.x) or Administration tab (for AppManager 7.x).
3 In the Deployment folder, select Packages.4 On the Tasks pane, click Check in Deployment Packages (for AppManager 8.x) or Check in
Packages (for AppManager 7.x).5 Navigate to the folder where you saved AM70-Domino-7.x.x.0.xml and select the file. 6 Click Open. The Deployment Package Check in Status dialog box displays the status of the
package check in.
2.6 Silently Installing the ModuleTo silently (without user intervention) install a module using the default settings, run the following command from the folder in which you saved the module installer:
msiexec.exe /i "AM70-Domino-7.x.x.0.msi" /qn
14 NetIQ AppManager for Lotus Domino Management Guide
where x.x is the actual version number of the module installer.
To create a log file that describes the operations of the module installer, add the following flag to the command noted above:
/L* "AM70-Domino.7.x.x.0.msi.log"
The log file is created in the folder in which you saved the module installer.
NOTE: To perform a silent install on an AppManager agent running Windows 2008 R2, open a command prompt at the administrative level and select Run as administrator before you run the silent install command listed above.
To silently install the module on a remote AppManager repository, you can use Windows authentication or SQL authentication.
Windows authentication:
AM70-Domino-7.x.x.0.msi /qn MO_B_QDBINSTALL=1 MO_B_SQLSVR_WINAUTH=1 MO_SQLSVR_NAME=SQL Server Name MO_QDBNAME=AM-Repository Name
SQL authentication:
AM70-Domino-7.x.x.0.msi /qn MO_B_QDBINSTALL=1 MO_B_SQLSVR_WINAUTH=0 MO_SQLSVR_USER=SQL login MO_SQLSVR_PWD=SQL Login Password MO_SQLSVR_NAME=SQL Server Name MO_QDBNAME=AM-Repository Name
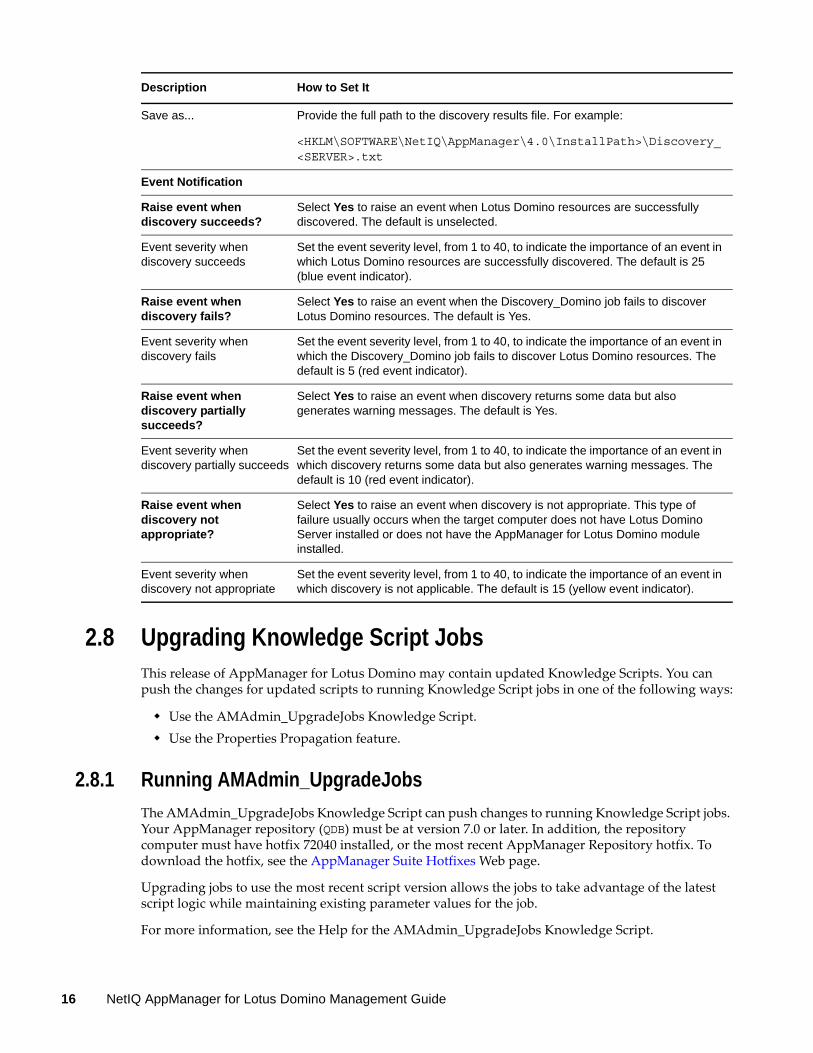
2.7 Discovering Lotus Domino ResourcesUse the Discovery_Domino Knowledge Script to discover the configuration and databases associated with Lotus Domino Servers, including partitioned servers. By default, this script runs once for each computer.
Description How to Set It
Discovery Targets
Database discovery level Because a server can have hundreds of Domino databases, use this parameter to control which databases are discovered.
Root=Discovers Notes data directory databases and mailboxes.
+Mail=Discovers root functionality + root\mail databases and all mailboxes below root.
All=Discovers all databases and mailboxes root and below.
User=Discovers only the databases specified in the Database names parameter.
The default is All.
Database names, including .nsf (when level=User)
If the database discovery level is set to User, provide the names of the specific databases you want to discover, separated by commas with no spaces. Each database name should be relative to the Notes data directory. For example:
MyData.nsf,mail\mymail.box
Save the discovery results file?
Select Yes to save the discovery results file. The default is Yes.
Installing AppManager for Lotus Domino 15
2.8 Upgrading Knowledge Script JobsThis release of AppManager for Lotus Domino may contain updated Knowledge Scripts. You can push the changes for updated scripts to running Knowledge Script jobs in one of the following ways:
Use the AMAdmin_UpgradeJobs Knowledge Script. Use the Properties Propagation feature.
2.8.1 Running AMAdmin_UpgradeJobs
The AMAdmin_UpgradeJobs Knowledge Script can push changes to running Knowledge Script jobs. Your AppManager repository (QDB) must be at version 7.0 or later. In addition, the repository computer must have hotfix 72040 installed, or the most recent AppManager Repository hotfix. To download the hotfix, see the AppManager Suite Hotfixes Web page.
Upgrading jobs to use the most recent script version allows the jobs to take advantage of the latest script logic while maintaining existing parameter values for the job.
For more information, see the Help for the AMAdmin_UpgradeJobs Knowledge Script.
Save as... Provide the full path to the discovery results file. For example:
<HKLM\SOFTWARE\NetIQ\AppManager\4.0\InstallPath>\Discovery_<SERVER>.txt
Event Notification
Raise event when discovery succeeds?
Select Yes to raise an event when Lotus Domino resources are successfully discovered. The default is unselected.
Event severity when discovery succeeds
Set the event severity level, from 1 to 40, to indicate the importance of an event in which Lotus Domino resources are successfully discovered. The default is 25 (blue event indicator).
Raise event when discovery fails?
Select Yes to raise an event when the Discovery_Domino job fails to discover Lotus Domino resources. The default is Yes.
Event severity when discovery fails
Set the event severity level, from 1 to 40, to indicate the importance of an event in which the Discovery_Domino job fails to discover Lotus Domino resources. The default is 5 (red event indicator).
Raise event when discovery partially succeeds?
Select Yes to raise an event when discovery returns some data but also generates warning messages. The default is Yes.
Event severity when discovery partially succeeds
Set the event severity level, from 1 to 40, to indicate the importance of an event in which discovery returns some data but also generates warning messages. The default is 10 (red event indicator).
Raise event when discovery not appropriate?
Select Yes to raise an event when discovery is not appropriate. This type of failure usually occurs when the target computer does not have Lotus Domino Server installed or does not have the AppManager for Lotus Domino module installed.
Event severity when discovery not appropriate
Set the event severity level, from 1 to 40, to indicate the importance of an event in which discovery is not applicable. The default is 15 (yellow event indicator).
Description How to Set It
16 NetIQ AppManager for Lotus Domino Management Guide
2.8.2 Propagating Knowledge Script Changes
You can propagate script changes to jobs that are running and to Knowledge Script Groups, including recommended Knowledge Script Groups and renamed Knowledge Scripts.
Before propagating script changes, verify that the script parameters are set to your specifications. Customized script parameters may have reverted to default parameters during the installation of the module. New parameters may need to be set appropriately for your environment or application.
You can choose to propagate only properties (specified in the Schedule and Values tabs), only the script (which is the logic of the Knowledge Script), or both. Unless you know specifically that changes affect only the script logic, you should propagate both properties and the script.
For more information about propagating Knowledge Script changes, see the “Running Monitoring Jobs” chapter of the Operator Console User Guide for AppManager.
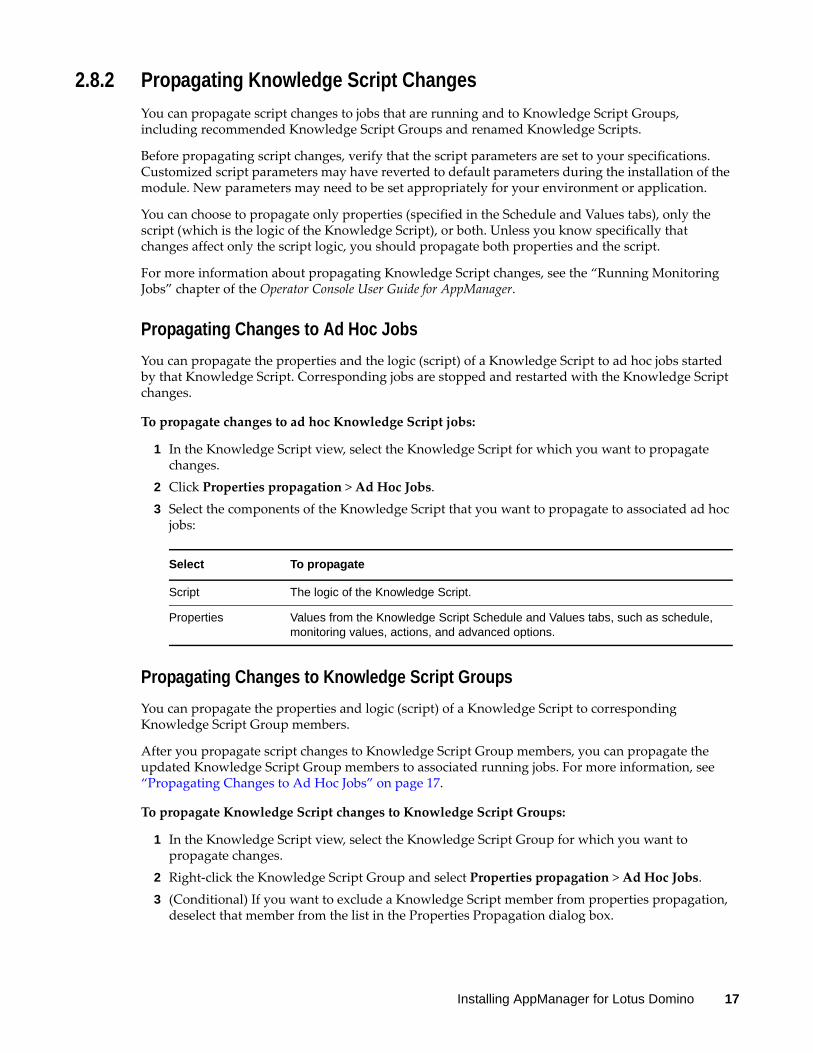
Propagating Changes to Ad Hoc Jobs
You can propagate the properties and the logic (script) of a Knowledge Script to ad hoc jobs started by that Knowledge Script. Corresponding jobs are stopped and restarted with the Knowledge Script changes.
To propagate changes to ad hoc Knowledge Script jobs:
1 In the Knowledge Script view, select the Knowledge Script for which you want to propagate changes.
2 Click Properties propagation > Ad Hoc Jobs.3 Select the components of the Knowledge Script that you want to propagate to associated ad hoc
jobs:
Propagating Changes to Knowledge Script Groups
You can propagate the properties and logic (script) of a Knowledge Script to corresponding Knowledge Script Group members.
After you propagate script changes to Knowledge Script Group members, you can propagate the updated Knowledge Script Group members to associated running jobs. For more information, see “Propagating Changes to Ad Hoc Jobs” on page 17.
To propagate Knowledge Script changes to Knowledge Script Groups:
1 In the Knowledge Script view, select the Knowledge Script Group for which you want to propagate changes.
2 Right-click the Knowledge Script Group and select Properties propagation > Ad Hoc Jobs.3 (Conditional) If you want to exclude a Knowledge Script member from properties propagation,
deselect that member from the list in the Properties Propagation dialog box.
Select To propagate
Script The logic of the Knowledge Script.
Properties Values from the Knowledge Script Schedule and Values tabs, such as schedule, monitoring values, actions, and advanced options.
Installing AppManager for Lotus Domino 17
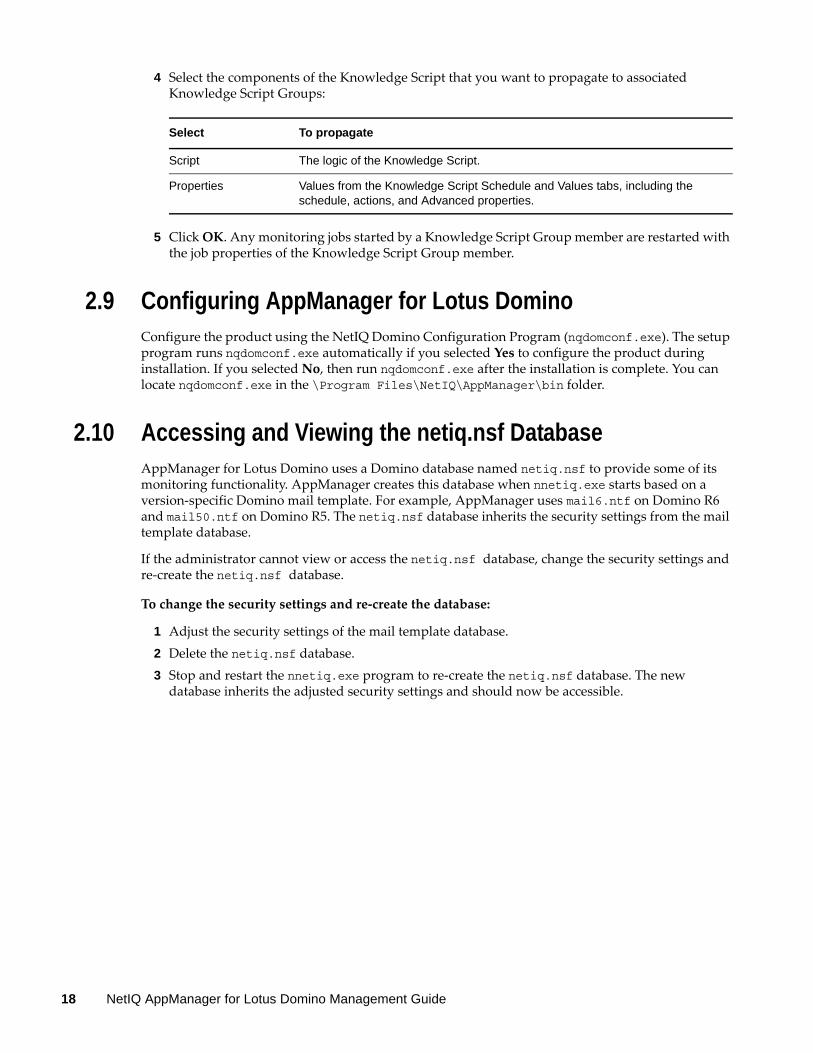
4 Select the components of the Knowledge Script that you want to propagate to associated Knowledge Script Groups:
5 Click OK. Any monitoring jobs started by a Knowledge Script Group member are restarted with the job properties of the Knowledge Script Group member.
2.9 Configuring AppManager for Lotus DominoConfigure the product using the NetIQ Domino Configuration Program (nqdomconf.exe). The setup program runs nqdomconf.exe automatically if you selected Yes to configure the product during installation. If you selected No, then run nqdomconf.exe after the installation is complete. You can locate nqdomconf.exe in the \Program Files\NetIQ\AppManager\bin folder.
2.10 Accessing and Viewing the netiq.nsf DatabaseAppManager for Lotus Domino uses a Domino database named netiq.nsf to provide some of its monitoring functionality. AppManager creates this database when nnetiq.exe starts based on a version-specific Domino mail template. For example, AppManager uses mail6.ntf on Domino R6 and mail50.ntf on Domino R5. The netiq.nsf database inherits the security settings from the mail template database.
If the administrator cannot view or access the netiq.nsf database, change the security settings and re-create the netiq.nsf database.
To change the security settings and re-create the database:
1 Adjust the security settings of the mail template database.2 Delete the netiq.nsf database.3 Stop and restart the nnetiq.exe program to re-create the netiq.nsf database. The new
database inherits the adjusted security settings and should now be accessible.
Select To propagate
Script The logic of the Knowledge Script.
Properties Values from the Knowledge Script Schedule and Values tabs, including the schedule, actions, and Advanced properties.
18 NetIQ AppManager for Lotus Domino Management Guide
3 3Domino Knowledge Scripts
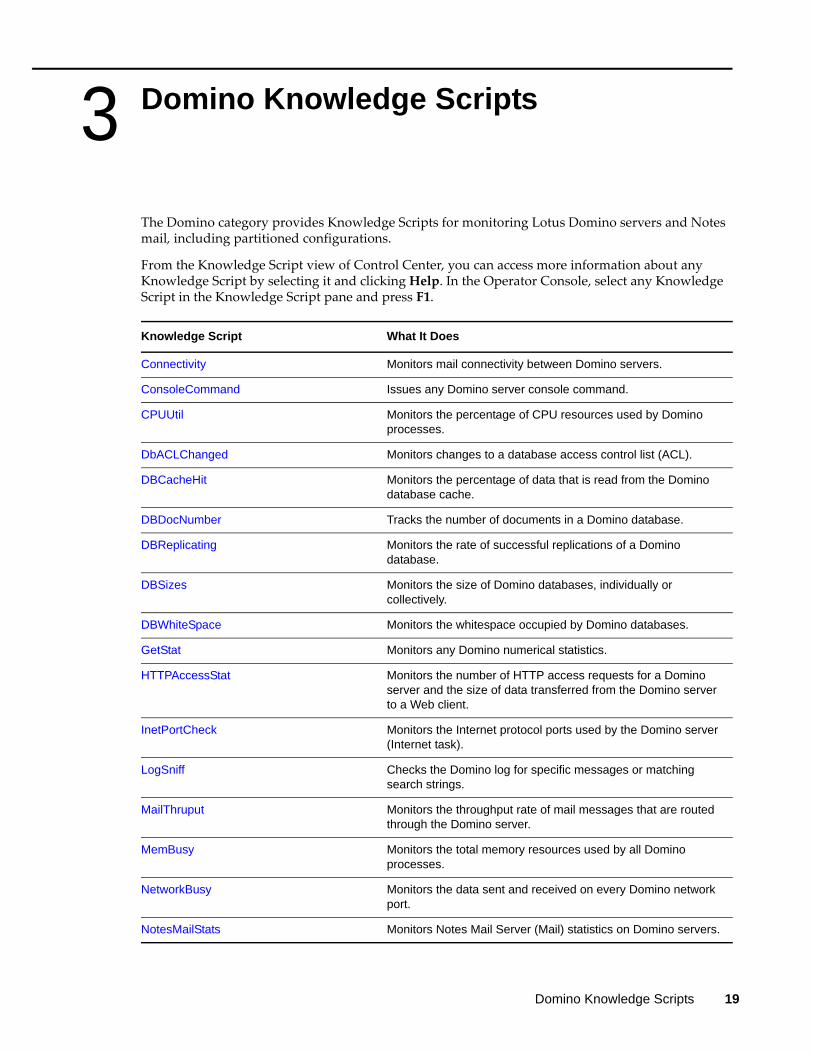
The Domino category provides Knowledge Scripts for monitoring Lotus Domino servers and Notes mail, including partitioned configurations.
From the Knowledge Script view of Control Center, you can access more information about any Knowledge Script by selecting it and clicking Help. In the Operator Console, select any Knowledge Script in the Knowledge Script pane and press F1.
Knowledge Script What It Does
Connectivity Monitors mail connectivity between Domino servers.
ConsoleCommand Issues any Domino server console command.
CPUUtil Monitors the percentage of CPU resources used by Domino processes.
DbACLChanged Monitors changes to a database access control list (ACL).
DBCacheHit Monitors the percentage of data that is read from the Domino database cache.
DBDocNumber Tracks the number of documents in a Domino database.
DBReplicating Monitors the rate of successful replications of a Domino database.
DBSizes Monitors the size of Domino databases, individually or collectively.
DBWhiteSpace Monitors the whitespace occupied by Domino databases.
GetStat Monitors any Domino numerical statistics.
HTTPAccessStat Monitors the number of HTTP access requests for a Domino server and the size of data transferred from the Domino server to a Web client.
InetPortCheck Monitors the Internet protocol ports used by the Domino server (Internet task).
LogSniff Checks the Domino log for specific messages or matching search strings.
MailThruput Monitors the throughput rate of mail messages that are routed through the Domino server.
MemBusy Monitors the total memory resources used by all Domino processes.
NetworkBusy Monitors the data sent and received on every Domino network port.
NotesMailStats Monitors Notes Mail Server (Mail) statistics on Domino servers.
Domino Knowledge Scripts 19
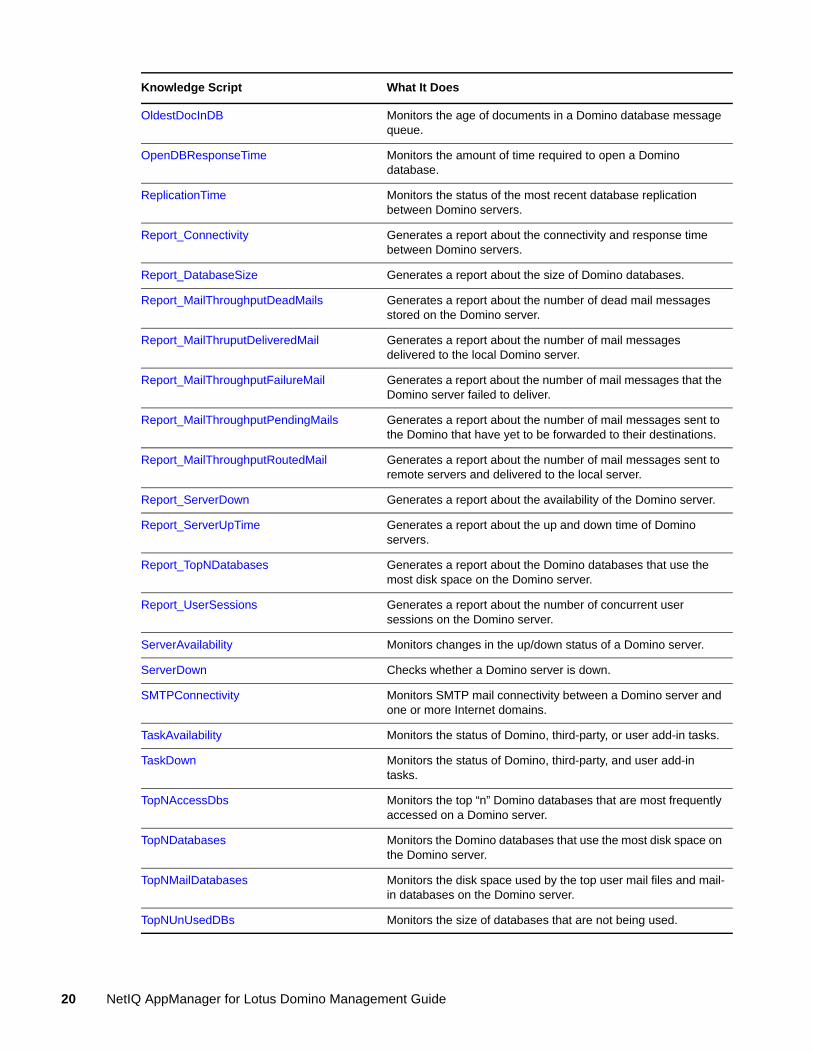
OldestDocInDB Monitors the age of documents in a Domino database message queue.
OpenDBResponseTime Monitors the amount of time required to open a Domino database.
ReplicationTime Monitors the status of the most recent database replication between Domino servers.
Report_Connectivity Generates a report about the connectivity and response time between Domino servers.
Report_DatabaseSize Generates a report about the size of Domino databases.
Report_MailThroughputDeadMails Generates a report about the number of dead mail messages stored on the Domino server.
Report_MailThruputDeliveredMail Generates a report about the number of mail messages delivered to the local Domino server.
Report_MailThroughputFailureMail Generates a report about the number of mail messages that the Domino server failed to deliver.
Report_MailThroughputPendingMails Generates a report about the number of mail messages sent to the Domino that have yet to be forwarded to their destinations.
Report_MailThroughputRoutedMail Generates a report about the number of mail messages sent to remote servers and delivered to the local server.
Report_ServerDown Generates a report about the availability of the Domino server.
Report_ServerUpTime Generates a report about the up and down time of Domino servers.
Report_TopNDatabases Generates a report about the Domino databases that use the most disk space on the Domino server.
Report_UserSessions Generates a report about the number of concurrent user sessions on the Domino server.
ServerAvailability Monitors changes in the up/down status of a Domino server.
ServerDown Checks whether a Domino server is down.
SMTPConnectivity Monitors SMTP mail connectivity between a Domino server and one or more Internet domains.
TaskAvailability Monitors the status of Domino, third-party, or user add-in tasks.
TaskDown Monitors the status of Domino, third-party, and user add-in tasks.
TopNAccessDbs Monitors the top “n” Domino databases that are most frequently accessed on a Domino server.
TopNDatabases Monitors the Domino databases that use the most disk space on the Domino server.
TopNMailDatabases Monitors the disk space used by the top user mail files and mail-in databases on the Domino server.
TopNUnUsedDBs Monitors the size of databases that are not being used.
Knowledge Script What It Does
20 NetIQ AppManager for Lotus Domino Management Guide
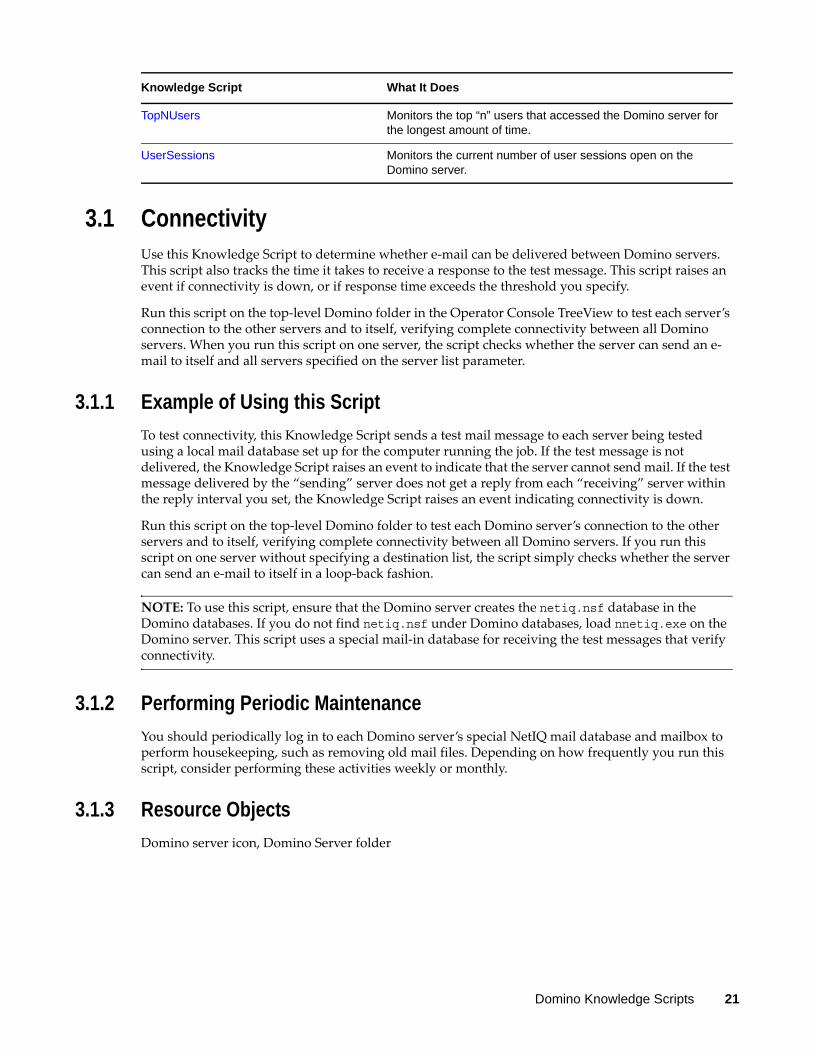
3.1 ConnectivityUse this Knowledge Script to determine whether e-mail can be delivered between Domino servers. This script also tracks the time it takes to receive a response to the test message. This script raises an event if connectivity is down, or if response time exceeds the threshold you specify.
Run this script on the top-level Domino folder in the Operator Console TreeView to test each server’s connection to the other servers and to itself, verifying complete connectivity between all Domino servers. When you run this script on one server, the script checks whether the server can send an e-mail to itself and all servers specified on the server list parameter.
3.1.1 Example of Using this Script
To test connectivity, this Knowledge Script sends a test mail message to each server being tested using a local mail database set up for the computer running the job. If the test message is not delivered, the Knowledge Script raises an event to indicate that the server cannot send mail. If the test message delivered by the “sending” server does not get a reply from each “receiving” server within the reply interval you set, the Knowledge Script raises an event indicating connectivity is down.
Run this script on the top-level Domino folder to test each Domino server’s connection to the other servers and to itself, verifying complete connectivity between all Domino servers. If you run this script on one server without specifying a destination list, the script simply checks whether the server can send an e-mail to itself in a loop-back fashion.
NOTE: To use this script, ensure that the Domino server creates the netiq.nsf database in the Domino databases. If you do not find netiq.nsf under Domino databases, load nnetiq.exe on the Domino server. This script uses a special mail-in database for receiving the test messages that verify connectivity.
3.1.2 Performing Periodic Maintenance
You should periodically log in to each Domino server’s special NetIQ mail database and mailbox to perform housekeeping, such as removing old mail files. Depending on how frequently you run this script, consider performing these activities weekly or monthly.
3.1.3 Resource Objects
Domino server icon, Domino Server folder
TopNUsers Monitors the top “n” users that accessed the Domino server for the longest amount of time.
UserSessions Monitors the current number of user sessions open on the Domino server.
Knowledge Script What It Does
Domino Knowledge Scripts 21
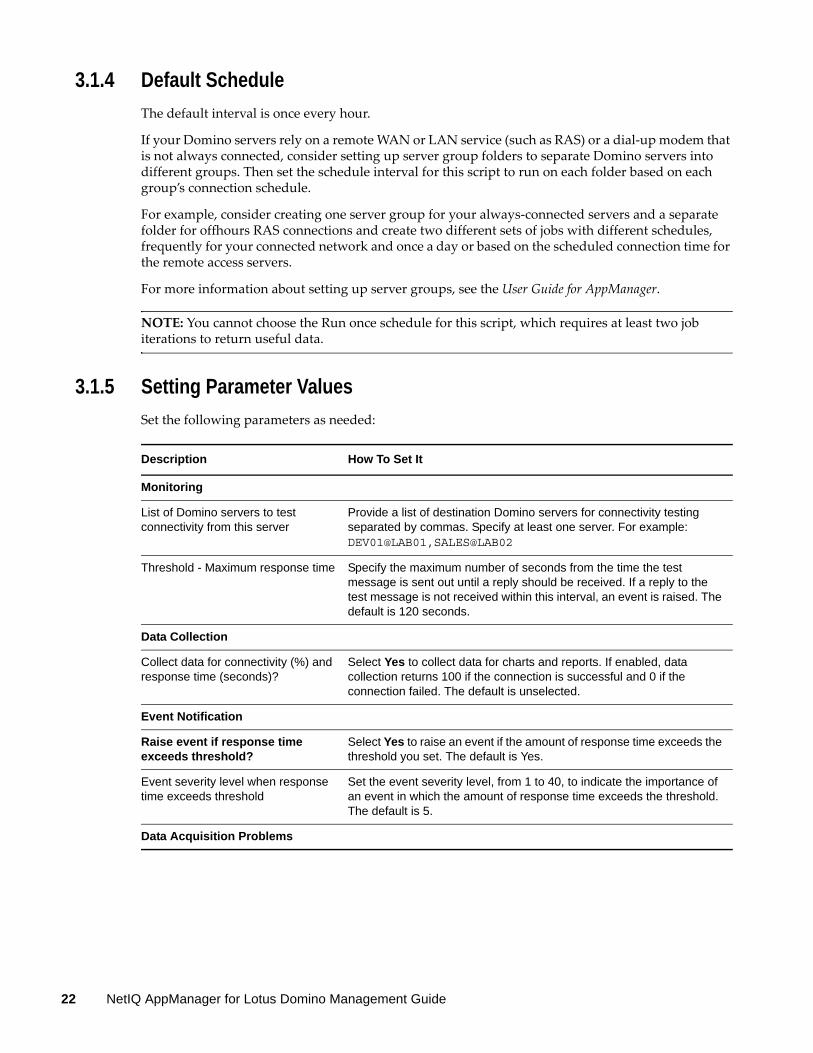
3.1.4 Default Schedule
The default interval is once every hour.
If your Domino servers rely on a remote WAN or LAN service (such as RAS) or a dial-up modem that is not always connected, consider setting up server group folders to separate Domino servers into different groups. Then set the schedule interval for this script to run on each folder based on each group’s connection schedule.
For example, consider creating one server group for your always-connected servers and a separate folder for offhours RAS connections and create two different sets of jobs with different schedules, frequently for your connected network and once a day or based on the scheduled connection time for the remote access servers.
For more information about setting up server groups, see the User Guide for AppManager.
NOTE: You cannot choose the Run once schedule for this script, which requires at least two job iterations to return useful data.
3.1.5 Setting Parameter Values
Set the following parameters as needed:
Description How To Set It
Monitoring
List of Domino servers to test connectivity from this server
Provide a list of destination Domino servers for connectivity testing separated by commas. Specify at least one server. For example: DEV01@LAB01,SALES@LAB02
Threshold - Maximum response time Specify the maximum number of seconds from the time the test message is sent out until a reply should be received. If a reply to the test message is not received within this interval, an event is raised. The default is 120 seconds.
Data Collection
Collect data for connectivity (%) and response time (seconds)?
Select Yes to collect data for charts and reports. If enabled, data collection returns 100 if the connection is successful and 0 if the connection failed. The default is unselected.
Event Notification
Raise event if response time exceeds threshold?
Select Yes to raise an event if the amount of response time exceeds the threshold you set. The default is Yes.
Event severity level when response time exceeds threshold
Set the event severity level, from 1 to 40, to indicate the importance of an event in which the amount of response time exceeds the threshold. The default is 5.
Data Acquisition Problems
22 NetIQ AppManager for Lotus Domino Management Guide
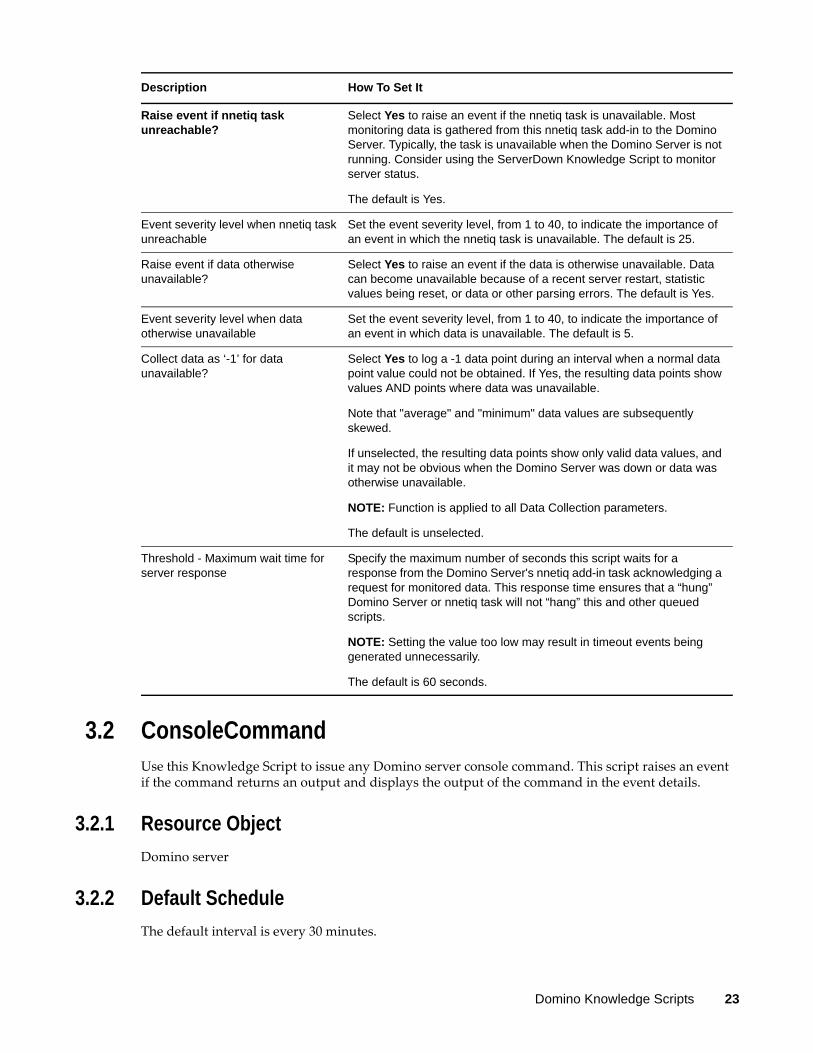
3.2 ConsoleCommandUse this Knowledge Script to issue any Domino server console command. This script raises an event if the command returns an output and displays the output of the command in the event details.
3.2.1 Resource Object
Domino server
3.2.2 Default Schedule
The default interval is every 30 minutes.
Raise event if nnetiq task unreachable?
Select Yes to raise an event if the nnetiq task is unavailable. Most monitoring data is gathered from this nnetiq task add-in to the Domino Server. Typically, the task is unavailable when the Domino Server is not running. Consider using the ServerDown Knowledge Script to monitor server status.
The default is Yes.
Event severity level when nnetiq task unreachable
Set the event severity level, from 1 to 40, to indicate the importance of an event in which the nnetiq task is unavailable. The default is 25.
Raise event if data otherwise unavailable?
Select Yes to raise an event if the data is otherwise unavailable. Data can become unavailable because of a recent server restart, statistic values being reset, or data or other parsing errors. The default is Yes.
Event severity level when data otherwise unavailable
Set the event severity level, from 1 to 40, to indicate the importance of an event in which data is unavailable. The default is 5.
Collect data as ‘-1’ for data unavailable?
Select Yes to log a -1 data point during an interval when a normal data point value could not be obtained. If Yes, the resulting data points show values AND points where data was unavailable.
Note that "average" and "minimum" data values are subsequently skewed.
If unselected, the resulting data points show only valid data values, and it may not be obvious when the Domino Server was down or data was otherwise unavailable.
NOTE: Function is applied to all Data Collection parameters.
The default is unselected.
Threshold - Maximum wait time for server response
Specify the maximum number of seconds this script waits for a response from the Domino Server's nnetiq add-in task acknowledging a request for monitored data. This response time ensures that a “hung” Domino Server or nnetiq task will not “hang” this and other queued scripts.
NOTE: Setting the value too low may result in timeout events being generated unnecessarily.
The default is 60 seconds.
Description How To Set It
Domino Knowledge Scripts 23
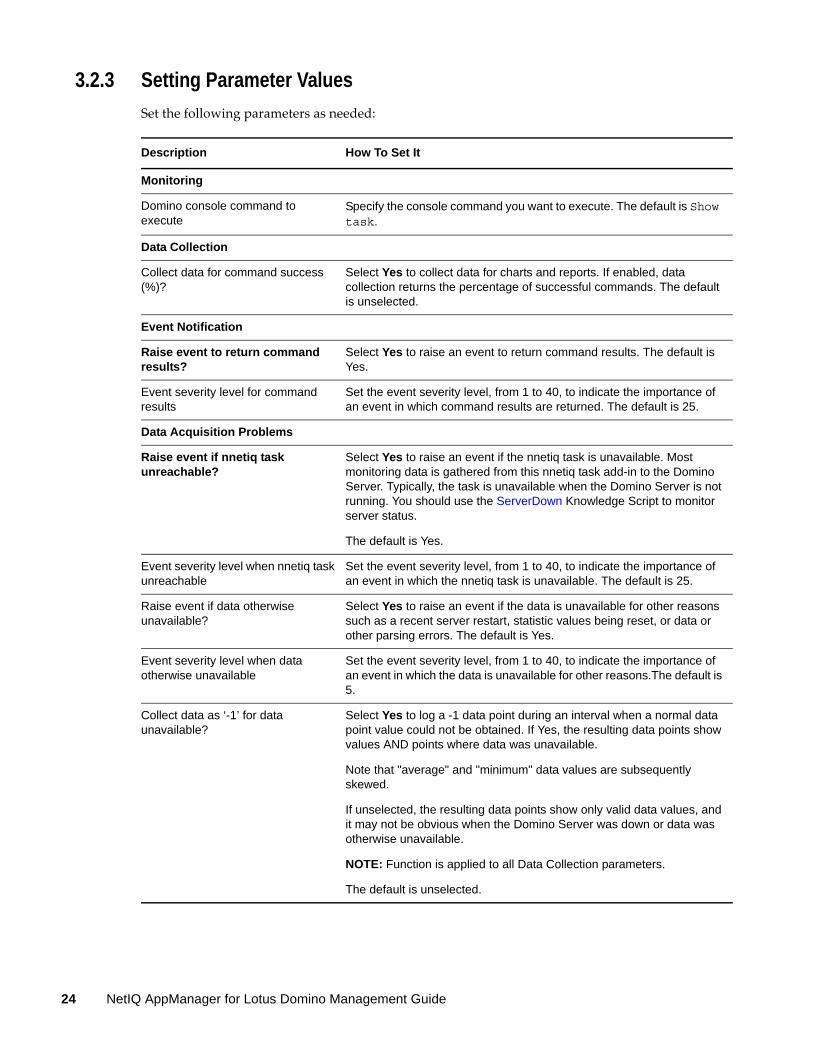
3.2.3 Setting Parameter Values
Set the following parameters as needed:
Description How To Set It
Monitoring
Domino console command to execute
Specify the console command you want to execute. The default is Show task.
Data Collection
Collect data for command success (%)?
Select Yes to collect data for charts and reports. If enabled, data collection returns the percentage of successful commands. The default is unselected.
Event Notification
Raise event to return command results?
Select Yes to raise an event to return command results. The default is Yes.
Event severity level for command results
Set the event severity level, from 1 to 40, to indicate the importance of an event in which command results are returned. The default is 25.
Data Acquisition Problems
Raise event if nnetiq task unreachable?
Select Yes to raise an event if the nnetiq task is unavailable. Most monitoring data is gathered from this nnetiq task add-in to the Domino Server. Typically, the task is unavailable when the Domino Server is not running. You should use the ServerDown Knowledge Script to monitor server status.
The default is Yes.
Event severity level when nnetiq task unreachable
Set the event severity level, from 1 to 40, to indicate the importance of an event in which the nnetiq task is unavailable. The default is 25.
Raise event if data otherwise unavailable?
Select Yes to raise an event if the data is unavailable for other reasons such as a recent server restart, statistic values being reset, or data or other parsing errors. The default is Yes.
Event severity level when data otherwise unavailable
Set the event severity level, from 1 to 40, to indicate the importance of an event in which the data is unavailable for other reasons.The default is 5.
Collect data as ‘-1’ for data unavailable?
Select Yes to log a -1 data point during an interval when a normal data point value could not be obtained. If Yes, the resulting data points show values AND points where data was unavailable.
Note that "average" and "minimum" data values are subsequently skewed.
If unselected, the resulting data points show only valid data values, and it may not be obvious when the Domino Server was down or data was otherwise unavailable.
NOTE: Function is applied to all Data Collection parameters.
The default is unselected.
24 NetIQ AppManager for Lotus Domino Management Guide
3.3 CPUUtilUse this Knowledge Script to monitor the percentage of CPU resources used by Domino processes, including the Domino server and all additional task processes. This script raises an event if CPU usage exceeds the threshold you set.
3.3.1 Resource Object
Domino server
3.3.2 Default Schedule
The default interval is every 10 minutes.
NOTE: You cannot choose the Run once schedule for this script, which requires at least two job iterations to return useful data.
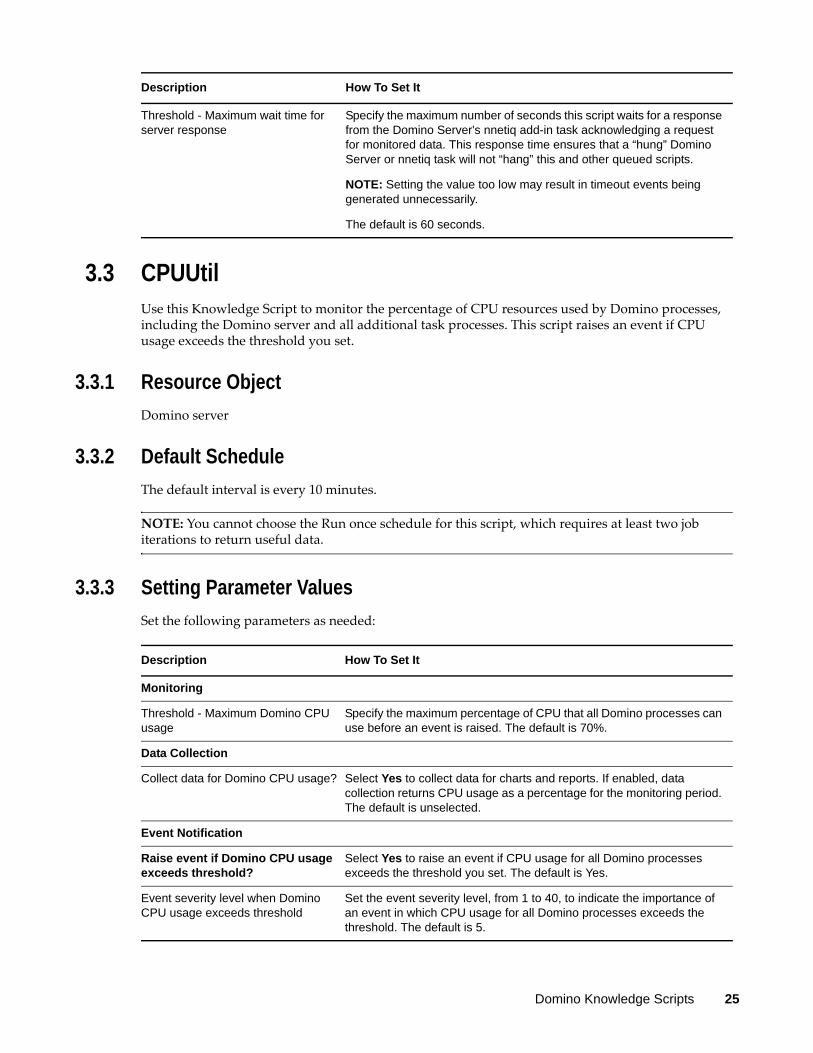
3.3.3 Setting Parameter Values
Set the following parameters as needed:
Threshold - Maximum wait time for server response
Specify the maximum number of seconds this script waits for a response from the Domino Server's nnetiq add-in task acknowledging a request for monitored data. This response time ensures that a “hung” Domino Server or nnetiq task will not “hang” this and other queued scripts.
NOTE: Setting the value too low may result in timeout events being generated unnecessarily.
The default is 60 seconds.
Description How To Set It
Description How To Set It
Monitoring
Threshold - Maximum Domino CPU usage
Specify the maximum percentage of CPU that all Domino processes can use before an event is raised. The default is 70%.
Data Collection
Collect data for Domino CPU usage? Select Yes to collect data for charts and reports. If enabled, data collection returns CPU usage as a percentage for the monitoring period. The default is unselected.
Event Notification
Raise event if Domino CPU usage exceeds threshold?
Select Yes to raise an event if CPU usage for all Domino processes exceeds the threshold you set. The default is Yes.
Event severity level when Domino CPU usage exceeds threshold
Set the event severity level, from 1 to 40, to indicate the importance of an event in which CPU usage for all Domino processes exceeds the threshold. The default is 5.
Domino Knowledge Scripts 25
3.4 DbACLChangedUse this Knowledge Script to monitor changes to a database access control list (ACL). This script raises an event if the ACL changed during the last number of minutes you specify.
3.4.1 Resource Object
Domino server
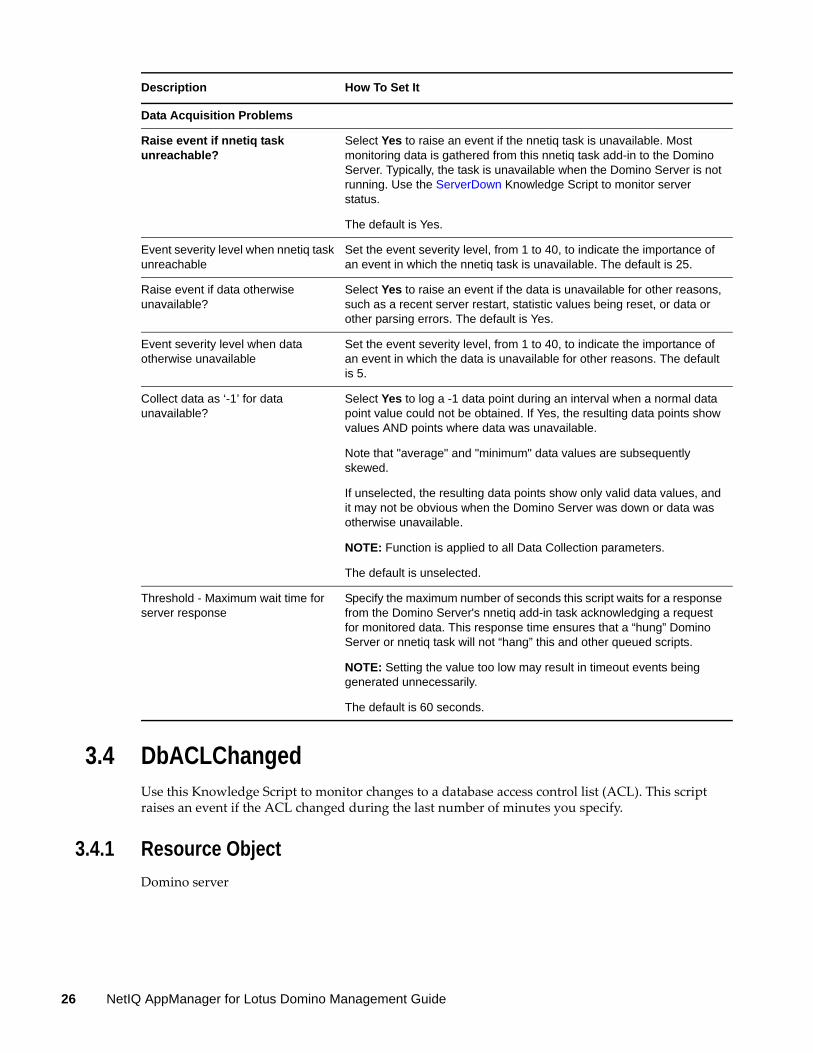
Data Acquisition Problems
Raise event if nnetiq task unreachable?
Select Yes to raise an event if the nnetiq task is unavailable. Most monitoring data is gathered from this nnetiq task add-in to the Domino Server. Typically, the task is unavailable when the Domino Server is not running. Use the ServerDown Knowledge Script to monitor server status.
The default is Yes.
Event severity level when nnetiq task unreachable
Set the event severity level, from 1 to 40, to indicate the importance of an event in which the nnetiq task is unavailable. The default is 25.
Raise event if data otherwise unavailable?
Select Yes to raise an event if the data is unavailable for other reasons, such as a recent server restart, statistic values being reset, or data or other parsing errors. The default is Yes.
Event severity level when data otherwise unavailable
Set the event severity level, from 1 to 40, to indicate the importance of an event in which the data is unavailable for other reasons. The default is 5.
Collect data as ‘-1’ for data unavailable?
Select Yes to log a -1 data point during an interval when a normal data point value could not be obtained. If Yes, the resulting data points show values AND points where data was unavailable.
Note that "average" and "minimum" data values are subsequently skewed.
If unselected, the resulting data points show only valid data values, and it may not be obvious when the Domino Server was down or data was otherwise unavailable.
NOTE: Function is applied to all Data Collection parameters.
The default is unselected.
Threshold - Maximum wait time for server response
Specify the maximum number of seconds this script waits for a response from the Domino Server's nnetiq add-in task acknowledging a request for monitored data. This response time ensures that a “hung” Domino Server or nnetiq task will not “hang” this and other queued scripts.
NOTE: Setting the value too low may result in timeout events being generated unnecessarily.
The default is 60 seconds.
Description How To Set It
26 NetIQ AppManager for Lotus Domino Management Guide
3.4.2 Default Schedule
The default interval is once every day.
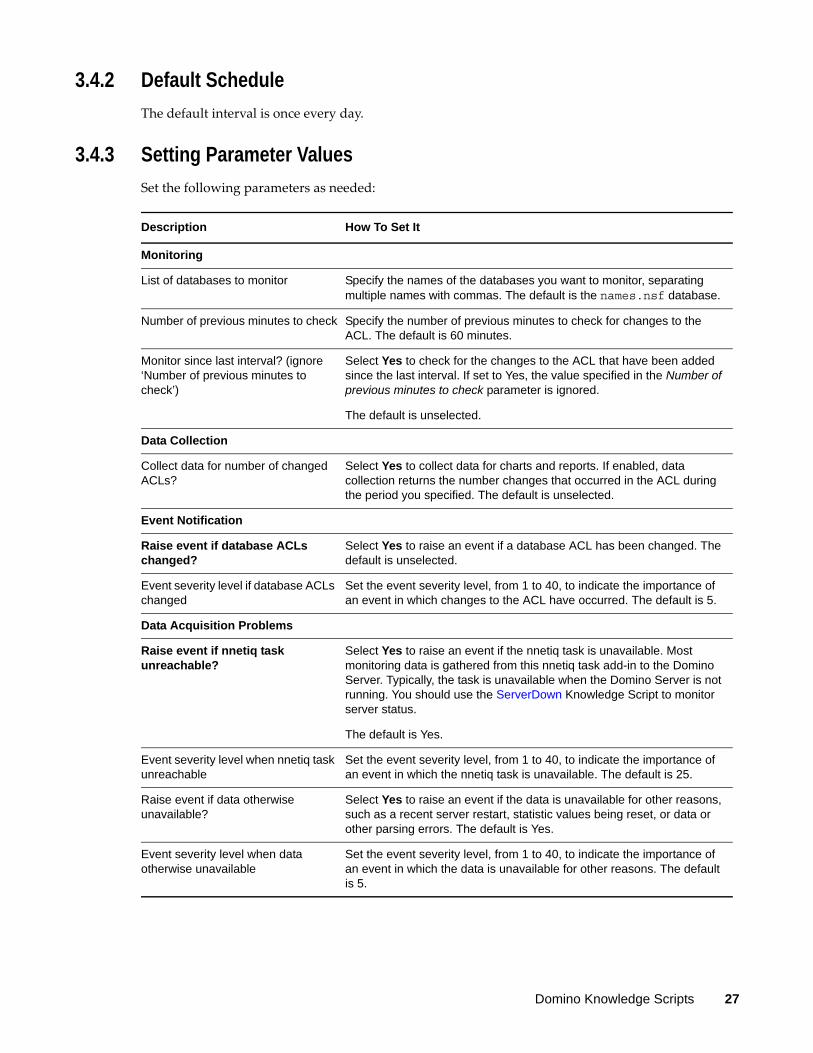
3.4.3 Setting Parameter Values
Set the following parameters as needed:
Description How To Set It
Monitoring
List of databases to monitor Specify the names of the databases you want to monitor, separating multiple names with commas. The default is the names.nsf database.
Number of previous minutes to check Specify the number of previous minutes to check for changes to the ACL. The default is 60 minutes.
Monitor since last interval? (ignore ‘Number of previous minutes to check’)
Select Yes to check for the changes to the ACL that have been added since the last interval. If set to Yes, the value specified in the Number of previous minutes to check parameter is ignored.
The default is unselected.
Data Collection
Collect data for number of changed ACLs?
Select Yes to collect data for charts and reports. If enabled, data collection returns the number changes that occurred in the ACL during the period you specified. The default is unselected.
Event Notification
Raise event if database ACLs changed?
Select Yes to raise an event if a database ACL has been changed. The default is unselected.
Event severity level if database ACLs changed
Set the event severity level, from 1 to 40, to indicate the importance of an event in which changes to the ACL have occurred. The default is 5.
Data Acquisition Problems
Raise event if nnetiq task unreachable?
Select Yes to raise an event if the nnetiq task is unavailable. Most monitoring data is gathered from this nnetiq task add-in to the Domino Server. Typically, the task is unavailable when the Domino Server is not running. You should use the ServerDown Knowledge Script to monitor server status.
The default is Yes.
Event severity level when nnetiq task unreachable
Set the event severity level, from 1 to 40, to indicate the importance of an event in which the nnetiq task is unavailable. The default is 25.
Raise event if data otherwise unavailable?
Select Yes to raise an event if the data is unavailable for other reasons, such as a recent server restart, statistic values being reset, or data or other parsing errors. The default is Yes.
Event severity level when data otherwise unavailable
Set the event severity level, from 1 to 40, to indicate the importance of an event in which the data is unavailable for other reasons. The default is 5.
Domino Knowledge Scripts 27
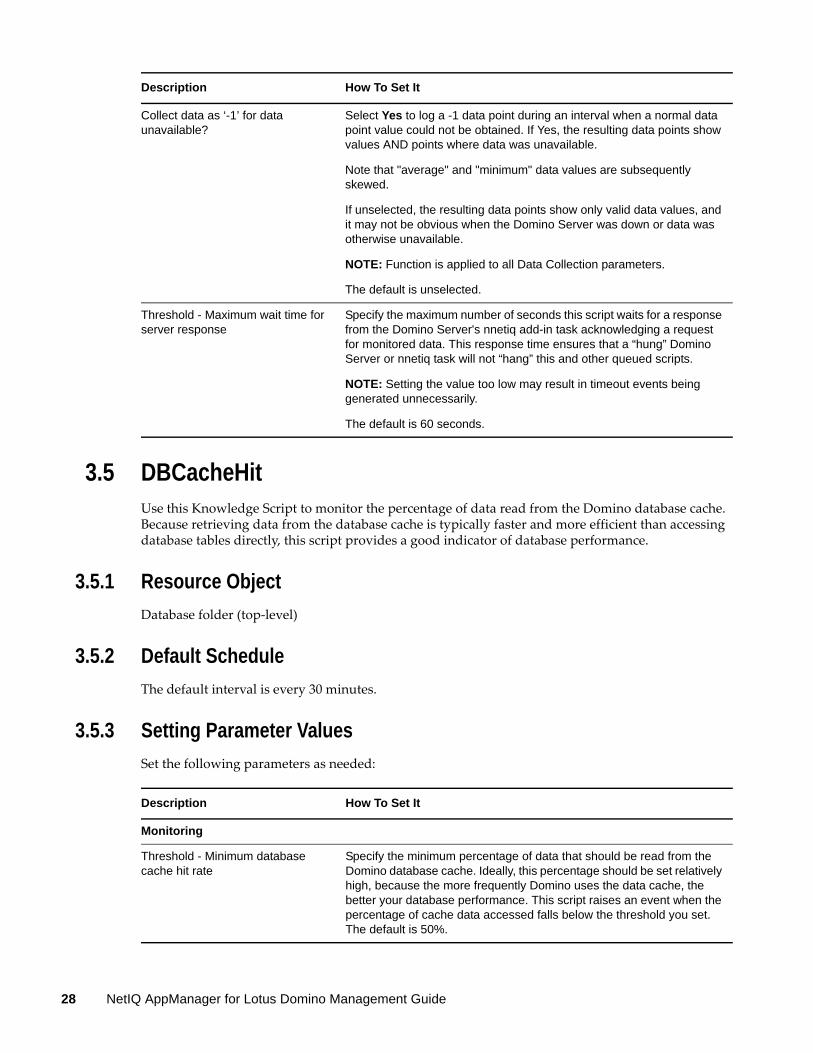
3.5 DBCacheHitUse this Knowledge Script to monitor the percentage of data read from the Domino database cache. Because retrieving data from the database cache is typically faster and more efficient than accessing database tables directly, this script provides a good indicator of database performance.
3.5.1 Resource Object
Database folder (top-level)
3.5.2 Default Schedule
The default interval is every 30 minutes.
3.5.3 Setting Parameter Values
Set the following parameters as needed:
Collect data as ‘-1’ for data unavailable?
Select Yes to log a -1 data point during an interval when a normal data point value could not be obtained. If Yes, the resulting data points show values AND points where data was unavailable.
Note that "average" and "minimum" data values are subsequently skewed.
If unselected, the resulting data points show only valid data values, and it may not be obvious when the Domino Server was down or data was otherwise unavailable.
NOTE: Function is applied to all Data Collection parameters.
The default is unselected.
Threshold - Maximum wait time for server response
Specify the maximum number of seconds this script waits for a response from the Domino Server's nnetiq add-in task acknowledging a request for monitored data. This response time ensures that a “hung” Domino Server or nnetiq task will not “hang” this and other queued scripts.
NOTE: Setting the value too low may result in timeout events being generated unnecessarily.
The default is 60 seconds.
Description How To Set It
Description How To Set It
Monitoring
Threshold - Minimum database cache hit rate
Specify the minimum percentage of data that should be read from the Domino database cache. Ideally, this percentage should be set relatively high, because the more frequently Domino uses the data cache, the better your database performance. This script raises an event when the percentage of cache data accessed falls below the threshold you set. The default is 50%.
28 NetIQ AppManager for Lotus Domino Management Guide
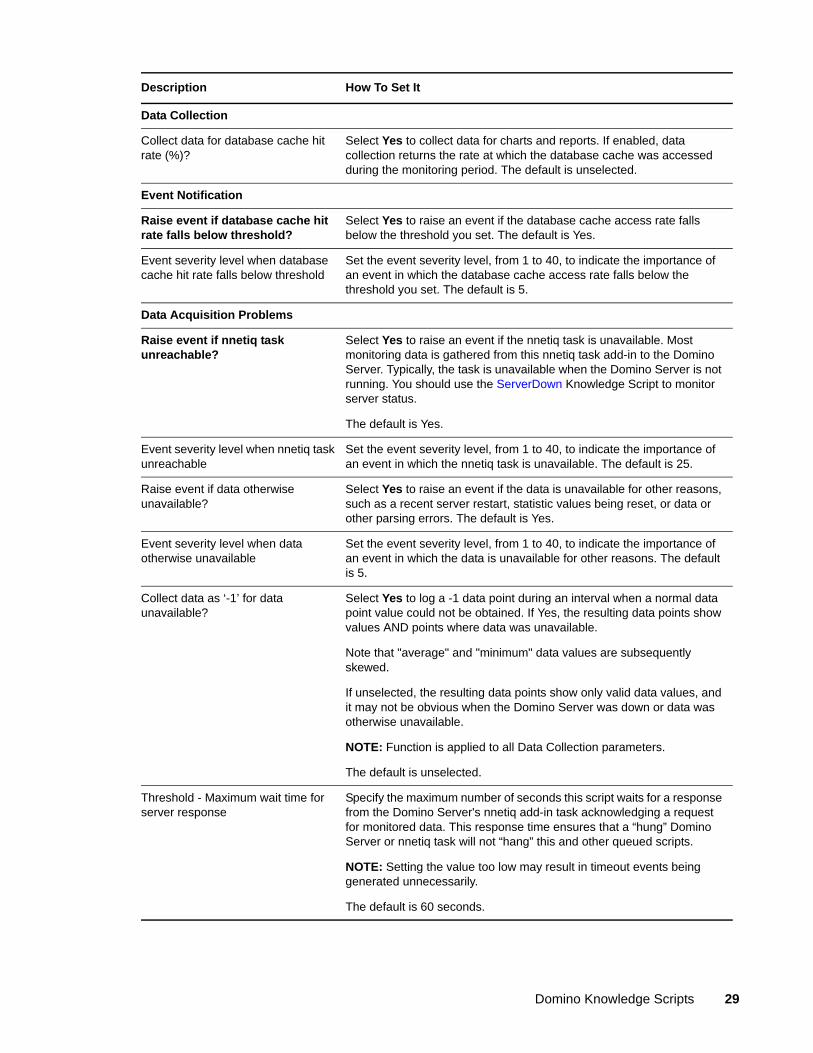
Data Collection
Collect data for database cache hit rate (%)?
Select Yes to collect data for charts and reports. If enabled, data collection returns the rate at which the database cache was accessed during the monitoring period. The default is unselected.
Event Notification
Raise event if database cache hit rate falls below threshold?
Select Yes to raise an event if the database cache access rate falls below the threshold you set. The default is Yes.
Event severity level when database cache hit rate falls below threshold
Set the event severity level, from 1 to 40, to indicate the importance of an event in which the database cache access rate falls below the threshold you set. The default is 5.
Data Acquisition Problems
Raise event if nnetiq task unreachable?
Select Yes to raise an event if the nnetiq task is unavailable. Most monitoring data is gathered from this nnetiq task add-in to the Domino Server. Typically, the task is unavailable when the Domino Server is not running. You should use the ServerDown Knowledge Script to monitor server status.
The default is Yes.
Event severity level when nnetiq task unreachable
Set the event severity level, from 1 to 40, to indicate the importance of an event in which the nnetiq task is unavailable. The default is 25.
Raise event if data otherwise unavailable?
Select Yes to raise an event if the data is unavailable for other reasons, such as a recent server restart, statistic values being reset, or data or other parsing errors. The default is Yes.
Event severity level when data otherwise unavailable
Set the event severity level, from 1 to 40, to indicate the importance of an event in which the data is unavailable for other reasons. The default is 5.
Collect data as ‘-1’ for data unavailable?
Select Yes to log a -1 data point during an interval when a normal data point value could not be obtained. If Yes, the resulting data points show values AND points where data was unavailable.
Note that "average" and "minimum" data values are subsequently skewed.
If unselected, the resulting data points show only valid data values, and it may not be obvious when the Domino Server was down or data was otherwise unavailable.
NOTE: Function is applied to all Data Collection parameters.
The default is unselected.
Threshold - Maximum wait time for server response
Specify the maximum number of seconds this script waits for a response from the Domino Server's nnetiq add-in task acknowledging a request for monitored data. This response time ensures that a “hung” Domino Server or nnetiq task will not “hang” this and other queued scripts.
NOTE: Setting the value too low may result in timeout events being generated unnecessarily.
The default is 60 seconds.
Description How To Set It
Domino Knowledge Scripts 29
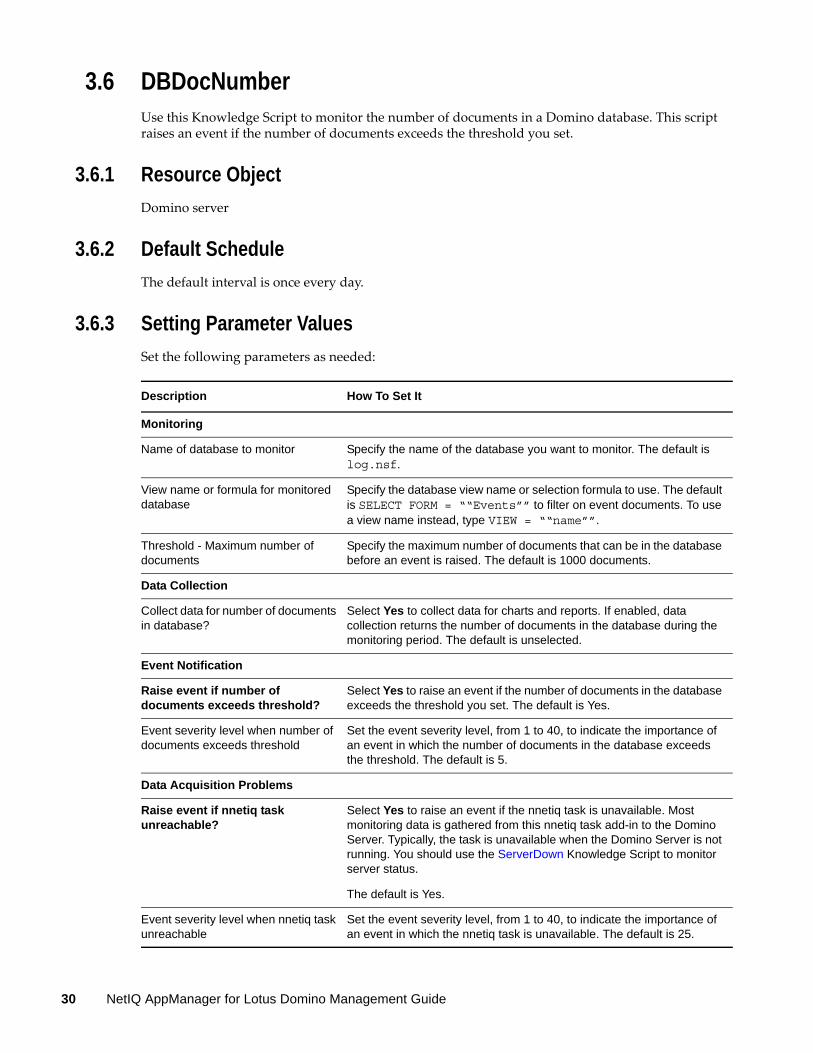
3.6 DBDocNumberUse this Knowledge Script to monitor the number of documents in a Domino database. This script raises an event if the number of documents exceeds the threshold you set.
3.6.1 Resource Object
Domino server
3.6.2 Default Schedule
The default interval is once every day.
3.6.3 Setting Parameter Values
Set the following parameters as needed:
Description How To Set It
Monitoring
Name of database to monitor Specify the name of the database you want to monitor. The default is log.nsf.
View name or formula for monitored database
Specify the database view name or selection formula to use. The default is SELECT FORM = ““Events”” to filter on event documents. To use a view name instead, type VIEW = ““name””.
Threshold - Maximum number of documents
Specify the maximum number of documents that can be in the database before an event is raised. The default is 1000 documents.
Data Collection
Collect data for number of documents in database?
Select Yes to collect data for charts and reports. If enabled, data collection returns the number of documents in the database during the monitoring period. The default is unselected.
Event Notification
Raise event if number of documents exceeds threshold?
Select Yes to raise an event if the number of documents in the database exceeds the threshold you set. The default is Yes.
Event severity level when number of documents exceeds threshold
Set the event severity level, from 1 to 40, to indicate the importance of an event in which the number of documents in the database exceeds the threshold. The default is 5.
Data Acquisition Problems
Raise event if nnetiq task unreachable?
Select Yes to raise an event if the nnetiq task is unavailable. Most monitoring data is gathered from this nnetiq task add-in to the Domino Server. Typically, the task is unavailable when the Domino Server is not running. You should use the ServerDown Knowledge Script to monitor server status.
The default is Yes.
Event severity level when nnetiq task unreachable
Set the event severity level, from 1 to 40, to indicate the importance of an event in which the nnetiq task is unavailable. The default is 25.
30 NetIQ AppManager for Lotus Domino Management Guide
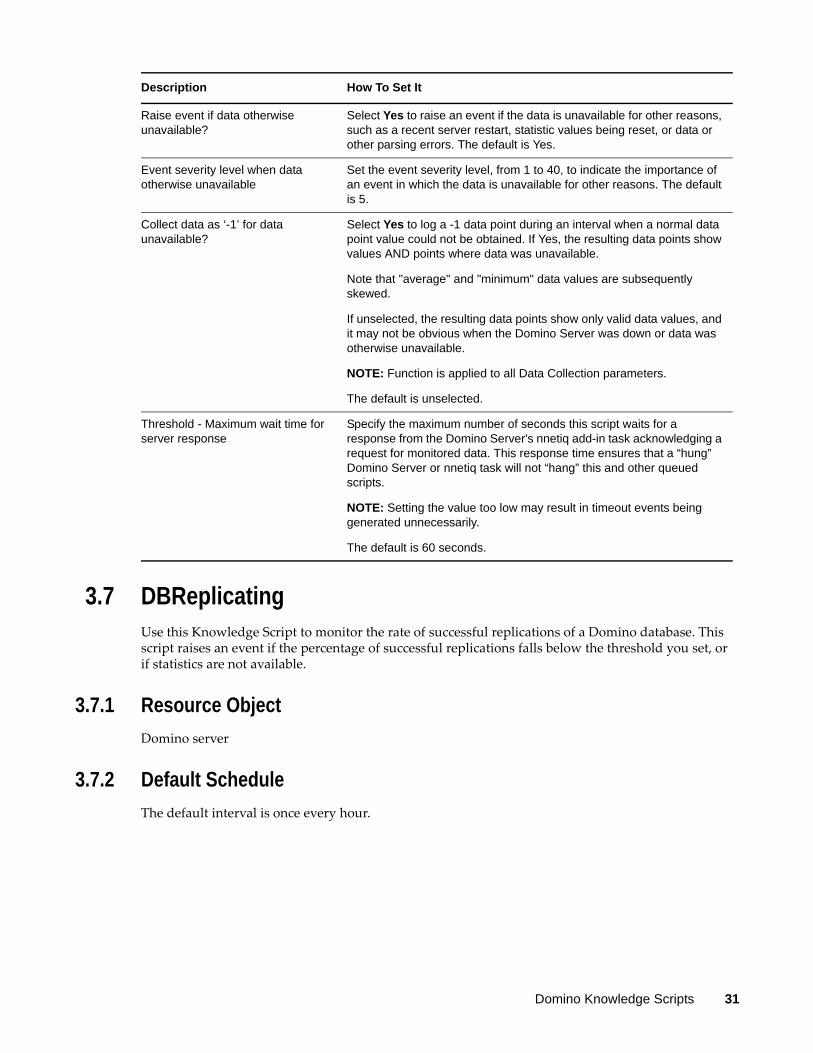
3.7 DBReplicatingUse this Knowledge Script to monitor the rate of successful replications of a Domino database. This script raises an event if the percentage of successful replications falls below the threshold you set, or if statistics are not available.
3.7.1 Resource Object
Domino server
3.7.2 Default Schedule
The default interval is once every hour.
Raise event if data otherwise unavailable?
Select Yes to raise an event if the data is unavailable for other reasons, such as a recent server restart, statistic values being reset, or data or other parsing errors. The default is Yes.
Event severity level when data otherwise unavailable
Set the event severity level, from 1 to 40, to indicate the importance of an event in which the data is unavailable for other reasons. The default is 5.
Collect data as ‘-1’ for data unavailable?
Select Yes to log a -1 data point during an interval when a normal data point value could not be obtained. If Yes, the resulting data points show values AND points where data was unavailable.
Note that "average" and "minimum" data values are subsequently skewed.
If unselected, the resulting data points show only valid data values, and it may not be obvious when the Domino Server was down or data was otherwise unavailable.
NOTE: Function is applied to all Data Collection parameters.
The default is unselected.
Threshold - Maximum wait time for server response
Specify the maximum number of seconds this script waits for a response from the Domino Server's nnetiq add-in task acknowledging a request for monitored data. This response time ensures that a “hung” Domino Server or nnetiq task will not “hang” this and other queued scripts.
NOTE: Setting the value too low may result in timeout events being generated unnecessarily.
The default is 60 seconds.
Description How To Set It
Domino Knowledge Scripts 31
3.7.3 Setting Parameter Values
Set the following parameters as needed:
Description How To Set It
Monitoring
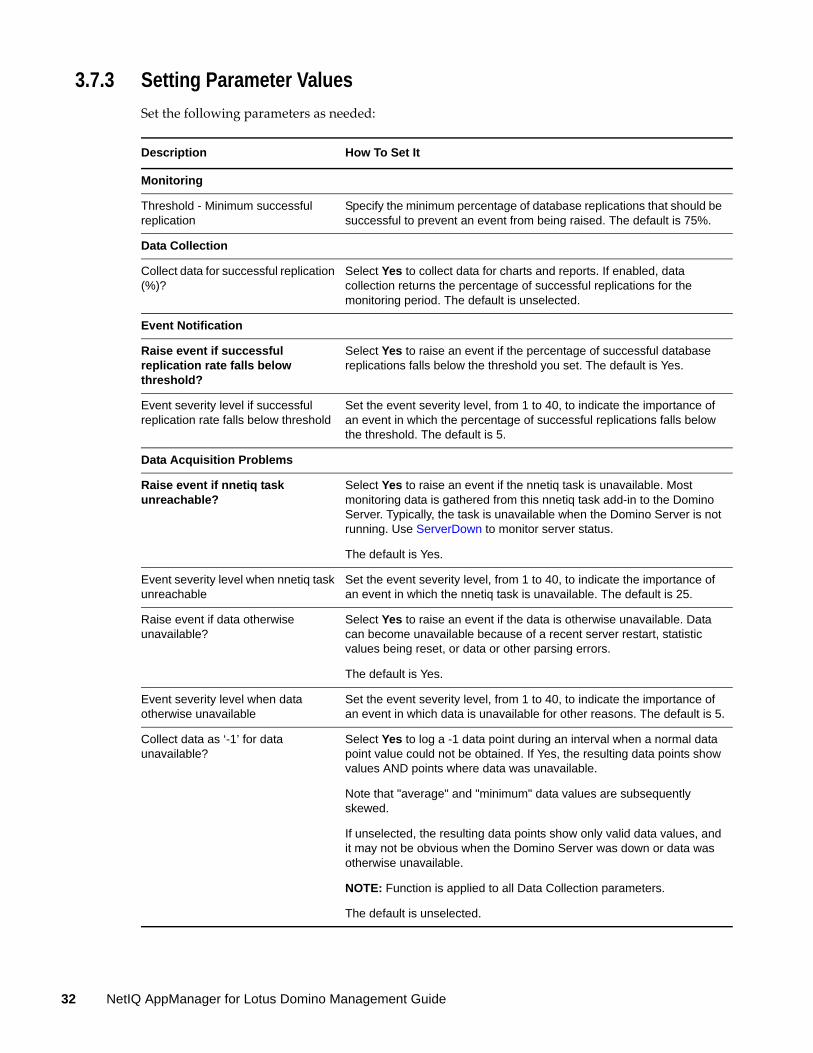
Threshold - Minimum successful replication
Specify the minimum percentage of database replications that should be successful to prevent an event from being raised. The default is 75%.
Data Collection
Collect data for successful replication (%)?
Select Yes to collect data for charts and reports. If enabled, data collection returns the percentage of successful replications for the monitoring period. The default is unselected.
Event Notification
Raise event if successful replication rate falls below threshold?
Select Yes to raise an event if the percentage of successful database replications falls below the threshold you set. The default is Yes.
Event severity level if successful replication rate falls below threshold
Set the event severity level, from 1 to 40, to indicate the importance of an event in which the percentage of successful replications falls below the threshold. The default is 5.
Data Acquisition Problems
Raise event if nnetiq task unreachable?
Select Yes to raise an event if the nnetiq task is unavailable. Most monitoring data is gathered from this nnetiq task add-in to the Domino Server. Typically, the task is unavailable when the Domino Server is not running. Use ServerDown to monitor server status.
The default is Yes.
Event severity level when nnetiq task unreachable
Set the event severity level, from 1 to 40, to indicate the importance of an event in which the nnetiq task is unavailable. The default is 25.
Raise event if data otherwise unavailable?
Select Yes to raise an event if the data is otherwise unavailable. Data can become unavailable because of a recent server restart, statistic values being reset, or data or other parsing errors.
The default is Yes.
Event severity level when data otherwise unavailable
Set the event severity level, from 1 to 40, to indicate the importance of an event in which data is unavailable for other reasons. The default is 5.
Collect data as ‘-1’ for data unavailable?
Select Yes to log a -1 data point during an interval when a normal data point value could not be obtained. If Yes, the resulting data points show values AND points where data was unavailable.
Note that "average" and "minimum" data values are subsequently skewed.
If unselected, the resulting data points show only valid data values, and it may not be obvious when the Domino Server was down or data was otherwise unavailable.
NOTE: Function is applied to all Data Collection parameters.
The default is unselected.
32 NetIQ AppManager for Lotus Domino Management Guide
3.8 DBSizesUse this Knowledge Script to monitor the size of Domino databases. Run this script on an individual database to monitor the size of that database. Run this script on a database folder to monitor the size of each database in the folder and the total size of all databases together. This script raises an event if the individual database size or total database size exceeds the threshold you set.
3.8.1 Resource Objects
Database icons, Database folder
3.8.2 Default Schedule
The default interval is once every hour.
3.8.3 Setting Parameter Values
Set the following parameters as needed:
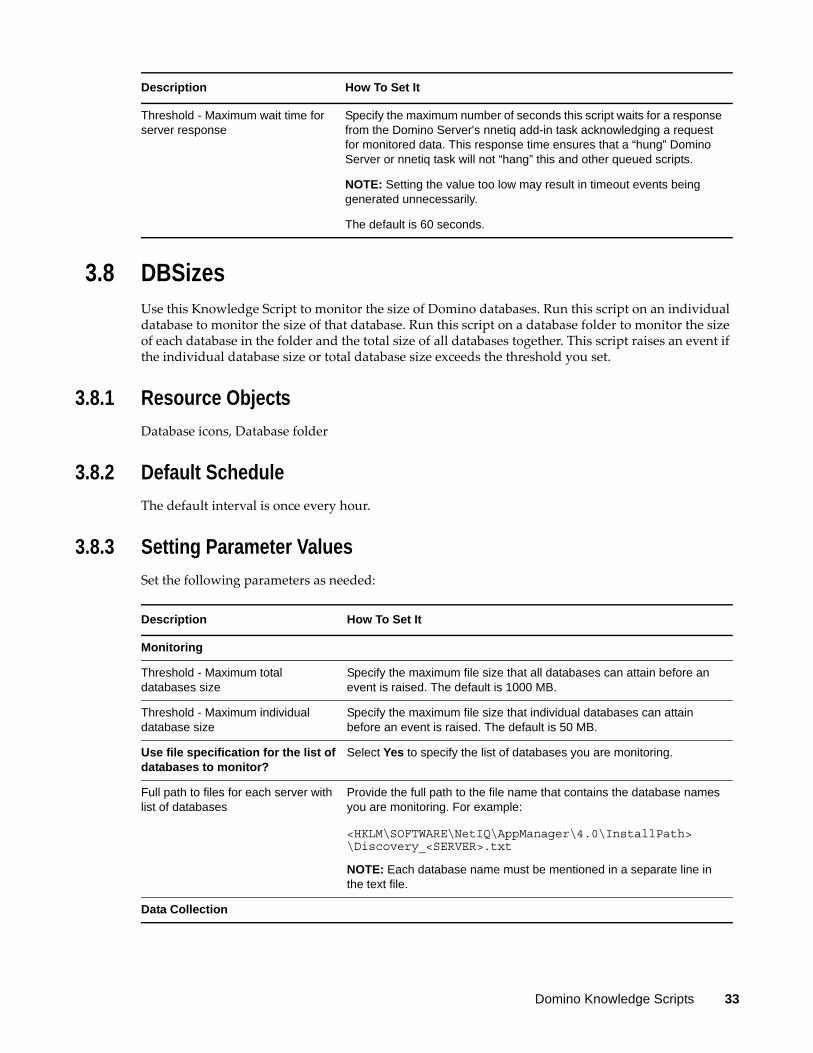
Threshold - Maximum wait time for server response
Specify the maximum number of seconds this script waits for a response from the Domino Server's nnetiq add-in task acknowledging a request for monitored data. This response time ensures that a “hung” Domino Server or nnetiq task will not “hang” this and other queued scripts.
NOTE: Setting the value too low may result in timeout events being generated unnecessarily.
The default is 60 seconds.
Description How To Set It
Description How To Set It
Monitoring
Threshold - Maximum total databases size
Specify the maximum file size that all databases can attain before an event is raised. The default is 1000 MB.
Threshold - Maximum individual database size
Specify the maximum file size that individual databases can attain before an event is raised. The default is 50 MB.
Use file specification for the list of databases to monitor?
Select Yes to specify the list of databases you are monitoring.
Full path to files for each server with list of databases
Provide the full path to the file name that contains the database names you are monitoring. For example:
<HKLM\SOFTWARE\NetIQ\AppManager\4.0\InstallPath>\Discovery_<SERVER>.txt
NOTE: Each database name must be mentioned in a separate line in the text file.
Data Collection
Domino Knowledge Scripts 33
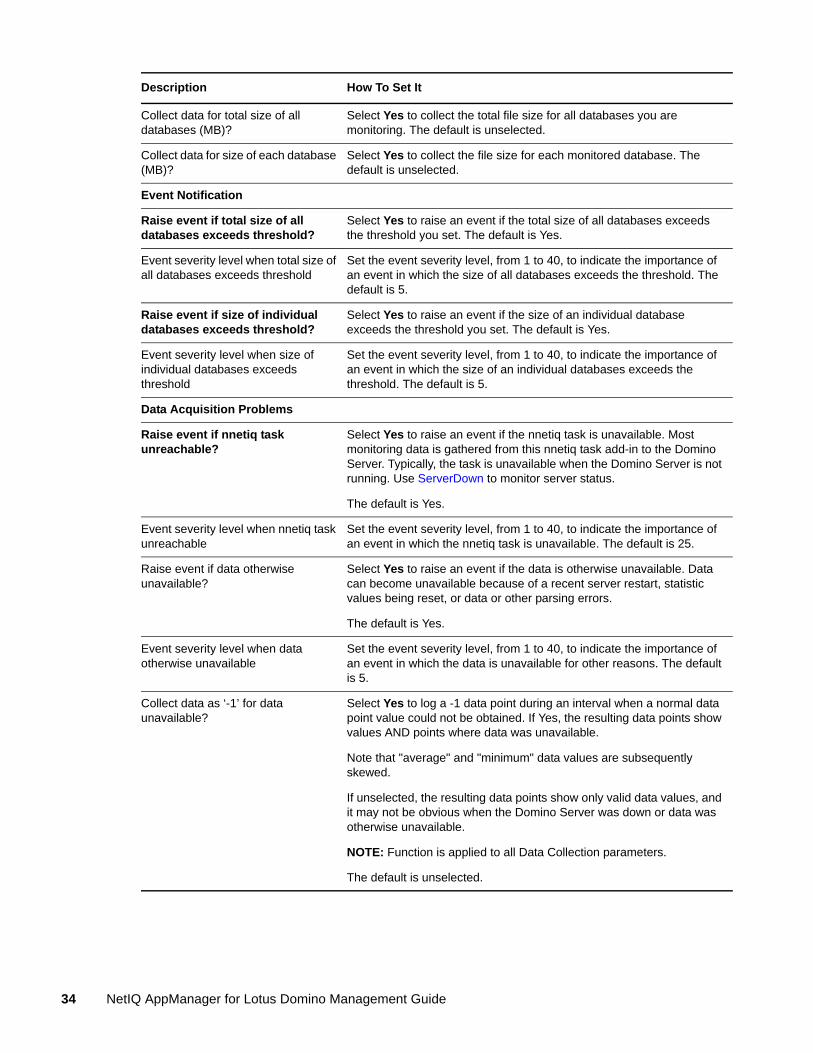
Collect data for total size of all databases (MB)?
Select Yes to collect the total file size for all databases you are monitoring. The default is unselected.
Collect data for size of each database (MB)?
Select Yes to collect the file size for each monitored database. The default is unselected.
Event Notification
Raise event if total size of all databases exceeds threshold?
Select Yes to raise an event if the total size of all databases exceeds the threshold you set. The default is Yes.
Event severity level when total size of all databases exceeds threshold
Set the event severity level, from 1 to 40, to indicate the importance of an event in which the size of all databases exceeds the threshold. The default is 5.
Raise event if size of individual databases exceeds threshold?
Select Yes to raise an event if the size of an individual database exceeds the threshold you set. The default is Yes.
Event severity level when size of individual databases exceeds threshold
Set the event severity level, from 1 to 40, to indicate the importance of an event in which the size of an individual databases exceeds the threshold. The default is 5.
Data Acquisition Problems
Raise event if nnetiq task unreachable?
Select Yes to raise an event if the nnetiq task is unavailable. Most monitoring data is gathered from this nnetiq task add-in to the Domino Server. Typically, the task is unavailable when the Domino Server is not running. Use ServerDown to monitor server status.
The default is Yes.
Event severity level when nnetiq task unreachable
Set the event severity level, from 1 to 40, to indicate the importance of an event in which the nnetiq task is unavailable. The default is 25.
Raise event if data otherwise unavailable?
Select Yes to raise an event if the data is otherwise unavailable. Data can become unavailable because of a recent server restart, statistic values being reset, or data or other parsing errors.
The default is Yes.
Event severity level when data otherwise unavailable
Set the event severity level, from 1 to 40, to indicate the importance of an event in which the data is unavailable for other reasons. The default is 5.
Collect data as ‘-1’ for data unavailable?
Select Yes to log a -1 data point during an interval when a normal data point value could not be obtained. If Yes, the resulting data points show values AND points where data was unavailable.
Note that "average" and "minimum" data values are subsequently skewed.
If unselected, the resulting data points show only valid data values, and it may not be obvious when the Domino Server was down or data was otherwise unavailable.
NOTE: Function is applied to all Data Collection parameters.
The default is unselected.
Description How To Set It
34 NetIQ AppManager for Lotus Domino Management Guide
3.9 DBWhiteSpaceUse this Knowledge Script to monitor the whitespace occupied by Domino databases. Database whitespace is disk space that the operating system allots to Domino but which Domino does not use. This script raises an event if the amount of whitespace and percentage of whitespace exceed the thresholds you set. You can choose to automatically initiate database compaction.
3.9.1 Resource Objects
Database icons, Database folder
3.9.2 Default Schedule
The default interval is once every hour.
3.9.3 Setting Parameter Values
Set the following parameters as needed:
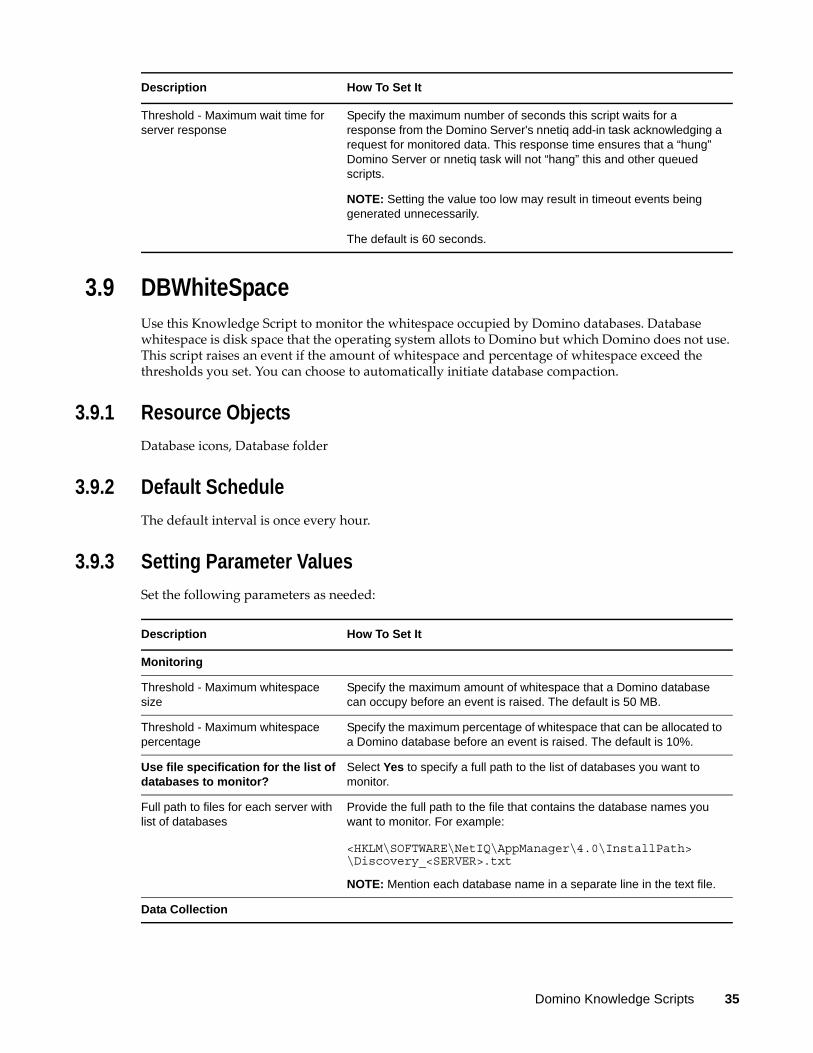
Threshold - Maximum wait time for server response
Specify the maximum number of seconds this script waits for a response from the Domino Server's nnetiq add-in task acknowledging a request for monitored data. This response time ensures that a “hung” Domino Server or nnetiq task will not “hang” this and other queued scripts.
NOTE: Setting the value too low may result in timeout events being generated unnecessarily.
The default is 60 seconds.
Description How To Set It
Description How To Set It
Monitoring
Threshold - Maximum whitespace size
Specify the maximum amount of whitespace that a Domino database can occupy before an event is raised. The default is 50 MB.
Threshold - Maximum whitespace percentage
Specify the maximum percentage of whitespace that can be allocated to a Domino database before an event is raised. The default is 10%.
Use file specification for the list of databases to monitor?
Select Yes to specify a full path to the list of databases you want to monitor.
Full path to files for each server with list of databases
Provide the full path to the file that contains the database names you want to monitor. For example:
<HKLM\SOFTWARE\NetIQ\AppManager\4.0\InstallPath>\Discovery_<SERVER>.txt
NOTE: Mention each database name in a separate line in the text file.
Data Collection
Domino Knowledge Scripts 35
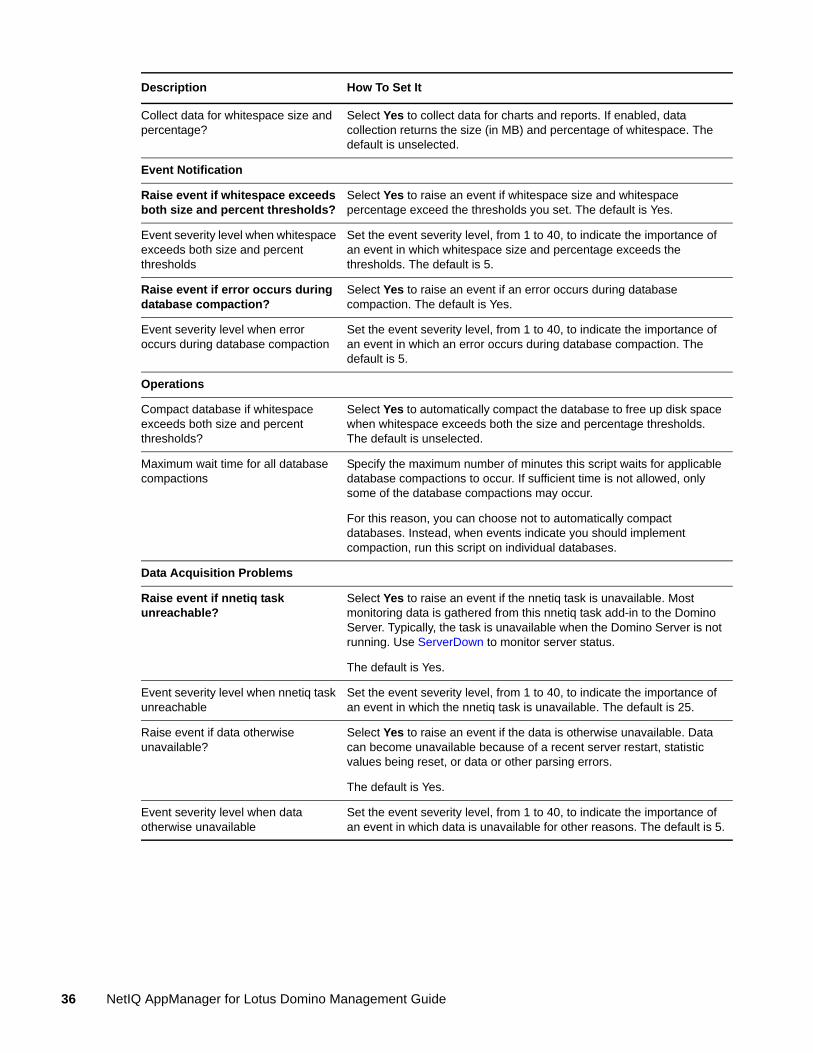
Collect data for whitespace size and percentage?
Select Yes to collect data for charts and reports. If enabled, data collection returns the size (in MB) and percentage of whitespace. The default is unselected.
Event Notification
Raise event if whitespace exceeds both size and percent thresholds?
Select Yes to raise an event if whitespace size and whitespace percentage exceed the thresholds you set. The default is Yes.
Event severity level when whitespace exceeds both size and percent thresholds
Set the event severity level, from 1 to 40, to indicate the importance of an event in which whitespace size and percentage exceeds the thresholds. The default is 5.
Raise event if error occurs during database compaction?
Select Yes to raise an event if an error occurs during database compaction. The default is Yes.
Event severity level when error occurs during database compaction
Set the event severity level, from 1 to 40, to indicate the importance of an event in which an error occurs during database compaction. The default is 5.
Operations
Compact database if whitespace exceeds both size and percent thresholds?
Select Yes to automatically compact the database to free up disk space when whitespace exceeds both the size and percentage thresholds. The default is unselected.
Maximum wait time for all database compactions
Specify the maximum number of minutes this script waits for applicable database compactions to occur. If sufficient time is not allowed, only some of the database compactions may occur.
For this reason, you can choose not to automatically compact databases. Instead, when events indicate you should implement compaction, run this script on individual databases.
Data Acquisition Problems
Raise event if nnetiq task unreachable?
Select Yes to raise an event if the nnetiq task is unavailable. Most monitoring data is gathered from this nnetiq task add-in to the Domino Server. Typically, the task is unavailable when the Domino Server is not running. Use ServerDown to monitor server status.
The default is Yes.
Event severity level when nnetiq task unreachable
Set the event severity level, from 1 to 40, to indicate the importance of an event in which the nnetiq task is unavailable. The default is 25.
Raise event if data otherwise unavailable?
Select Yes to raise an event if the data is otherwise unavailable. Data can become unavailable because of a recent server restart, statistic values being reset, or data or other parsing errors.
The default is Yes.
Event severity level when data otherwise unavailable
Set the event severity level, from 1 to 40, to indicate the importance of an event in which data is unavailable for other reasons. The default is 5.
Description How To Set It
36 NetIQ AppManager for Lotus Domino Management Guide
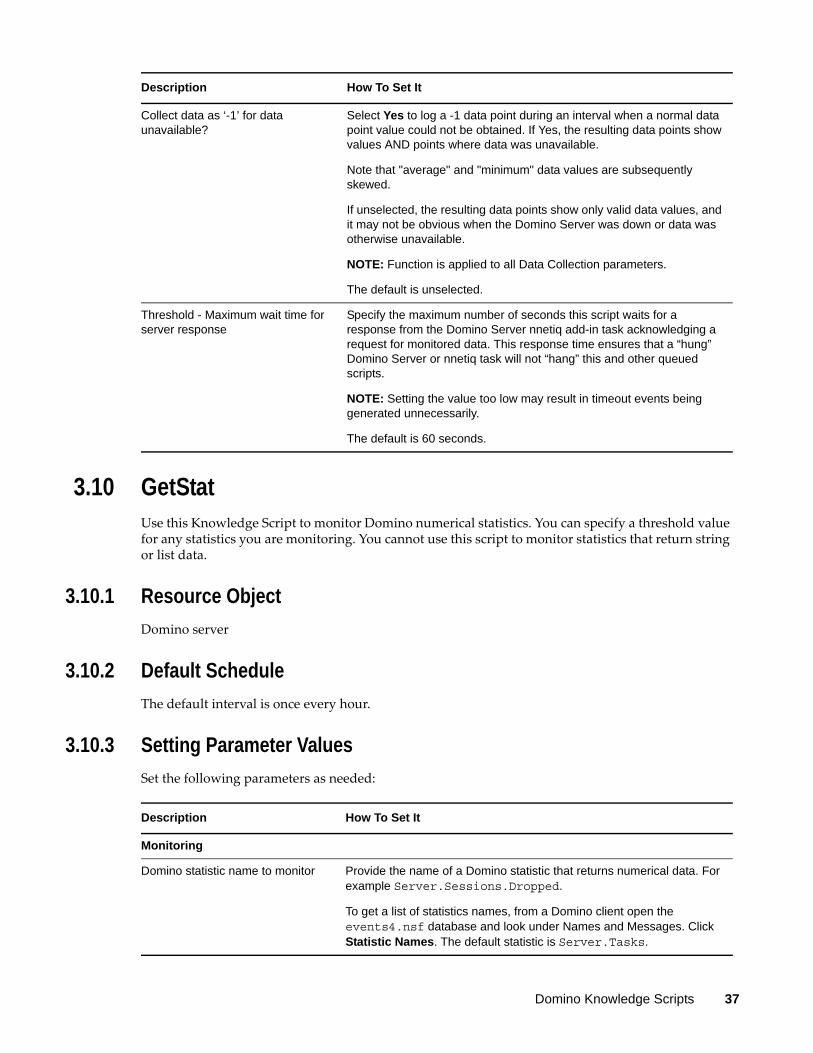
3.10 GetStatUse this Knowledge Script to monitor Domino numerical statistics. You can specify a threshold value for any statistics you are monitoring. You cannot use this script to monitor statistics that return string or list data.
3.10.1 Resource Object
Domino server
3.10.2 Default Schedule
The default interval is once every hour.
3.10.3 Setting Parameter Values
Set the following parameters as needed:
Collect data as ‘-1’ for data unavailable?
Select Yes to log a -1 data point during an interval when a normal data point value could not be obtained. If Yes, the resulting data points show values AND points where data was unavailable.
Note that "average" and "minimum" data values are subsequently skewed.
If unselected, the resulting data points show only valid data values, and it may not be obvious when the Domino Server was down or data was otherwise unavailable.
NOTE: Function is applied to all Data Collection parameters.
The default is unselected.
Threshold - Maximum wait time for server response
Specify the maximum number of seconds this script waits for a response from the Domino Server nnetiq add-in task acknowledging a request for monitored data. This response time ensures that a “hung” Domino Server or nnetiq task will not “hang” this and other queued scripts.
NOTE: Setting the value too low may result in timeout events being generated unnecessarily.
The default is 60 seconds.
Description How To Set It
Description How To Set It
Monitoring
Domino statistic name to monitor Provide the name of a Domino statistic that returns numerical data. For example Server.Sessions.Dropped.
To get a list of statistics names, from a Domino client open the events4.nsf database and look under Names and Messages. Click Statistic Names. The default statistic is Server.Tasks.
Domino Knowledge Scripts 37
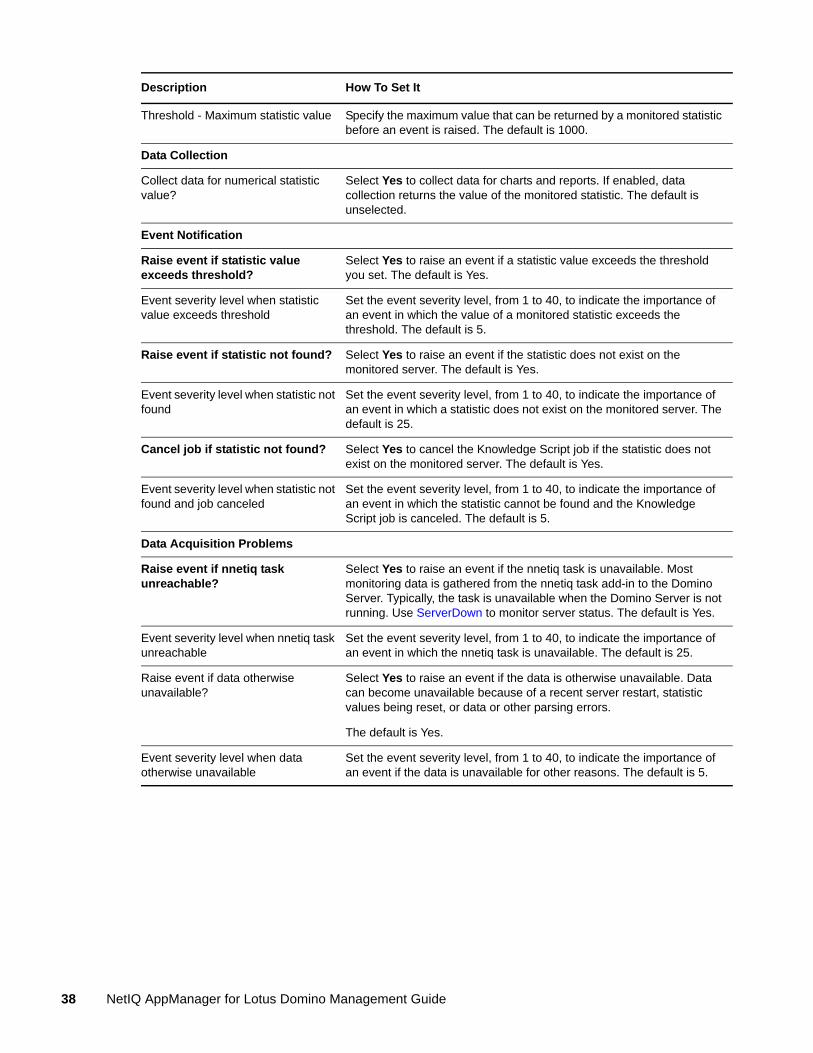
Threshold - Maximum statistic value Specify the maximum value that can be returned by a monitored statistic before an event is raised. The default is 1000.
Data Collection
Collect data for numerical statistic value?
Select Yes to collect data for charts and reports. If enabled, data collection returns the value of the monitored statistic. The default is unselected.
Event Notification
Raise event if statistic value exceeds threshold?
Select Yes to raise an event if a statistic value exceeds the threshold you set. The default is Yes.
Event severity level when statistic value exceeds threshold
Set the event severity level, from 1 to 40, to indicate the importance of an event in which the value of a monitored statistic exceeds the threshold. The default is 5.
Raise event if statistic not found? Select Yes to raise an event if the statistic does not exist on the monitored server. The default is Yes.
Event severity level when statistic not found
Set the event severity level, from 1 to 40, to indicate the importance of an event in which a statistic does not exist on the monitored server. The default is 25.
Cancel job if statistic not found? Select Yes to cancel the Knowledge Script job if the statistic does not exist on the monitored server. The default is Yes.
Event severity level when statistic not found and job canceled
Set the event severity level, from 1 to 40, to indicate the importance of an event in which the statistic cannot be found and the Knowledge Script job is canceled. The default is 5.
Data Acquisition Problems
Raise event if nnetiq task unreachable?
Select Yes to raise an event if the nnetiq task is unavailable. Most monitoring data is gathered from the nnetiq task add-in to the Domino Server. Typically, the task is unavailable when the Domino Server is not running. Use ServerDown to monitor server status. The default is Yes.
Event severity level when nnetiq task unreachable
Set the event severity level, from 1 to 40, to indicate the importance of an event in which the nnetiq task is unavailable. The default is 25.
Raise event if data otherwise unavailable?
Select Yes to raise an event if the data is otherwise unavailable. Data can become unavailable because of a recent server restart, statistic values being reset, or data or other parsing errors.
The default is Yes.
Event severity level when data otherwise unavailable
Set the event severity level, from 1 to 40, to indicate the importance of an event if the data is unavailable for other reasons. The default is 5.
Description How To Set It
38 NetIQ AppManager for Lotus Domino Management Guide
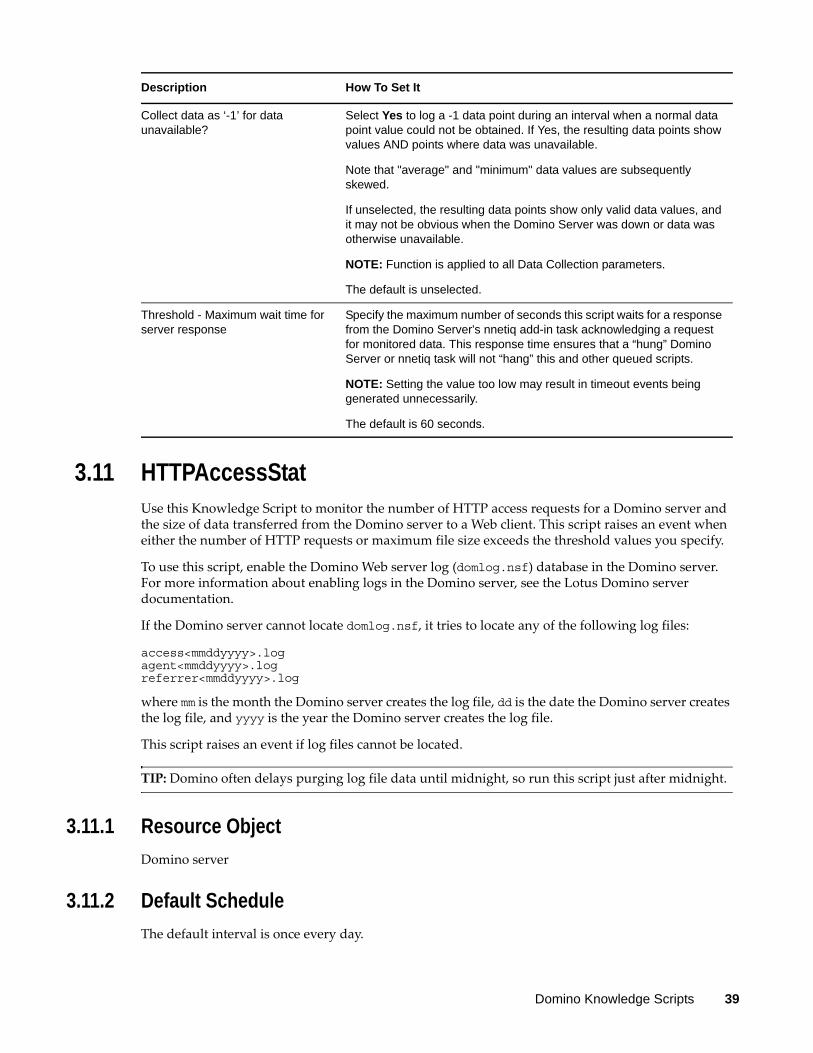
3.11 HTTPAccessStatUse this Knowledge Script to monitor the number of HTTP access requests for a Domino server and the size of data transferred from the Domino server to a Web client. This script raises an event when either the number of HTTP requests or maximum file size exceeds the threshold values you specify.
To use this script, enable the Domino Web server log (domlog.nsf) database in the Domino server. For more information about enabling logs in the Domino server, see the Lotus Domino server documentation.
If the Domino server cannot locate domlog.nsf, it tries to locate any of the following log files:
access<mmddyyyy>.logagent<mmddyyyy>.logreferrer<mmddyyyy>.log
where mm is the month the Domino server creates the log file, dd is the date the Domino server creates the log file, and yyyy is the year the Domino server creates the log file.
This script raises an event if log files cannot be located.
TIP: Domino often delays purging log file data until midnight, so run this script just after midnight.
3.11.1 Resource Object
Domino server
3.11.2 Default Schedule
The default interval is once every day.
Collect data as ‘-1’ for data unavailable?
Select Yes to log a -1 data point during an interval when a normal data point value could not be obtained. If Yes, the resulting data points show values AND points where data was unavailable.
Note that "average" and "minimum" data values are subsequently skewed.
If unselected, the resulting data points show only valid data values, and it may not be obvious when the Domino Server was down or data was otherwise unavailable.
NOTE: Function is applied to all Data Collection parameters.
The default is unselected.
Threshold - Maximum wait time for server response
Specify the maximum number of seconds this script waits for a response from the Domino Server's nnetiq add-in task acknowledging a request for monitored data. This response time ensures that a “hung” Domino Server or nnetiq task will not “hang” this and other queued scripts.
NOTE: Setting the value too low may result in timeout events being generated unnecessarily.
The default is 60 seconds.
Description How To Set It
Domino Knowledge Scripts 39
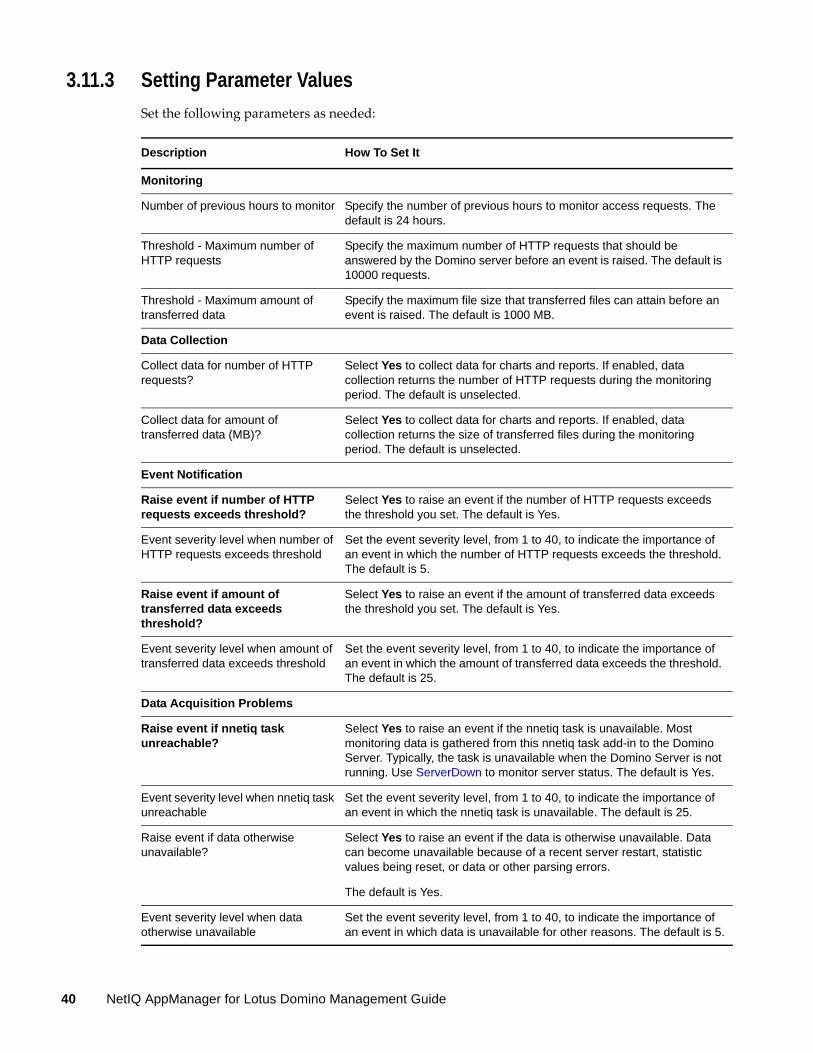
3.11.3 Setting Parameter Values
Set the following parameters as needed:
Description How To Set It
Monitoring
Number of previous hours to monitor Specify the number of previous hours to monitor access requests. The default is 24 hours.
Threshold - Maximum number of HTTP requests
Specify the maximum number of HTTP requests that should be answered by the Domino server before an event is raised. The default is 10000 requests.
Threshold - Maximum amount of transferred data
Specify the maximum file size that transferred files can attain before an event is raised. The default is 1000 MB.
Data Collection
Collect data for number of HTTP requests?
Select Yes to collect data for charts and reports. If enabled, data collection returns the number of HTTP requests during the monitoring period. The default is unselected.
Collect data for amount of transferred data (MB)?
Select Yes to collect data for charts and reports. If enabled, data collection returns the size of transferred files during the monitoring period. The default is unselected.
Event Notification
Raise event if number of HTTP requests exceeds threshold?
Select Yes to raise an event if the number of HTTP requests exceeds the threshold you set. The default is Yes.
Event severity level when number of HTTP requests exceeds threshold
Set the event severity level, from 1 to 40, to indicate the importance of an event in which the number of HTTP requests exceeds the threshold. The default is 5.
Raise event if amount of transferred data exceeds threshold?
Select Yes to raise an event if the amount of transferred data exceeds the threshold you set. The default is Yes.
Event severity level when amount of transferred data exceeds threshold
Set the event severity level, from 1 to 40, to indicate the importance of an event in which the amount of transferred data exceeds the threshold. The default is 25.
Data Acquisition Problems
Raise event if nnetiq task unreachable?
Select Yes to raise an event if the nnetiq task is unavailable. Most monitoring data is gathered from this nnetiq task add-in to the Domino Server. Typically, the task is unavailable when the Domino Server is not running. Use ServerDown to monitor server status. The default is Yes.
Event severity level when nnetiq task unreachable
Set the event severity level, from 1 to 40, to indicate the importance of an event in which the nnetiq task is unavailable. The default is 25.
Raise event if data otherwise unavailable?
Select Yes to raise an event if the data is otherwise unavailable. Data can become unavailable because of a recent server restart, statistic values being reset, or data or other parsing errors.
The default is Yes.
Event severity level when data otherwise unavailable
Set the event severity level, from 1 to 40, to indicate the importance of an event in which data is unavailable for other reasons. The default is 5.
40 NetIQ AppManager for Lotus Domino Management Guide
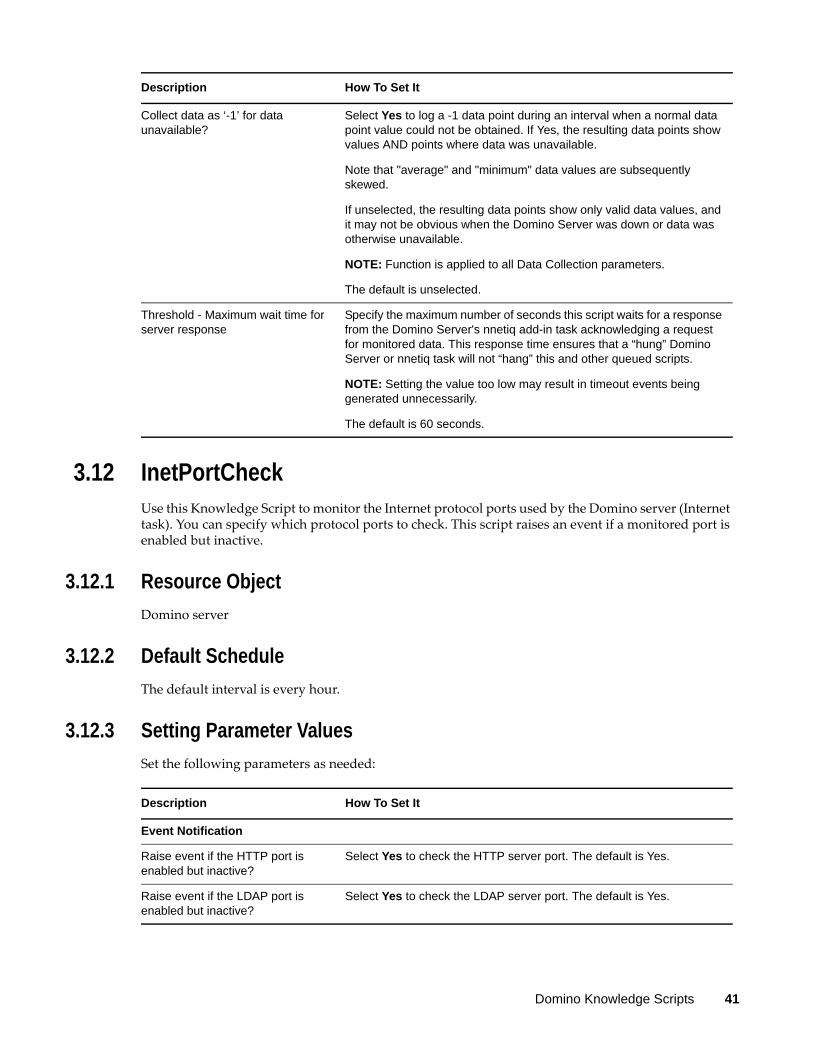
3.12 InetPortCheckUse this Knowledge Script to monitor the Internet protocol ports used by the Domino server (Internet task). You can specify which protocol ports to check. This script raises an event if a monitored port is enabled but inactive.
3.12.1 Resource Object
Domino server
3.12.2 Default Schedule
The default interval is every hour.
3.12.3 Setting Parameter Values
Set the following parameters as needed:
Collect data as ‘-1’ for data unavailable?
Select Yes to log a -1 data point during an interval when a normal data point value could not be obtained. If Yes, the resulting data points show values AND points where data was unavailable.
Note that "average" and "minimum" data values are subsequently skewed.
If unselected, the resulting data points show only valid data values, and it may not be obvious when the Domino Server was down or data was otherwise unavailable.
NOTE: Function is applied to all Data Collection parameters.
The default is unselected.
Threshold - Maximum wait time for server response
Specify the maximum number of seconds this script waits for a response from the Domino Server's nnetiq add-in task acknowledging a request for monitored data. This response time ensures that a “hung” Domino Server or nnetiq task will not “hang” this and other queued scripts.
NOTE: Setting the value too low may result in timeout events being generated unnecessarily.
The default is 60 seconds.
Description How To Set It
Description How To Set It
Event Notification
Raise event if the HTTP port is enabled but inactive?
Select Yes to check the HTTP server port. The default is Yes.
Raise event if the LDAP port is enabled but inactive?
Select Yes to check the LDAP server port. The default is Yes.
Domino Knowledge Scripts 41
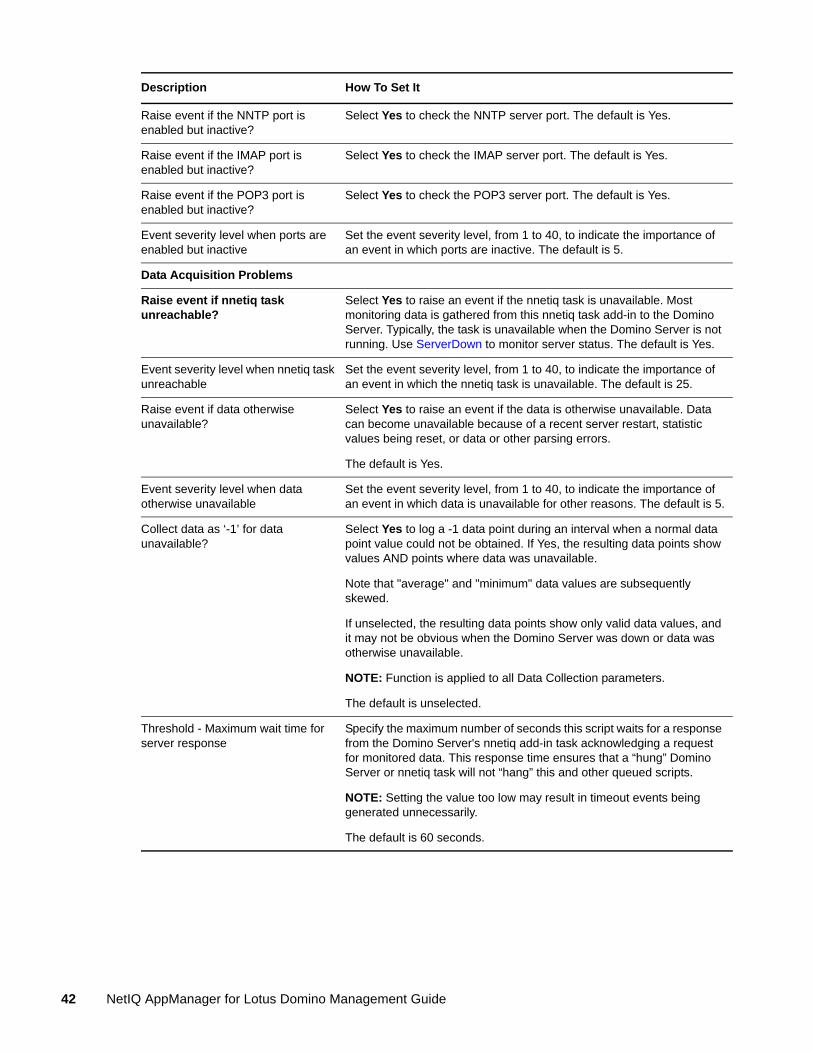
Raise event if the NNTP port is enabled but inactive?
Select Yes to check the NNTP server port. The default is Yes.
Raise event if the IMAP port is enabled but inactive?
Select Yes to check the IMAP server port. The default is Yes.
Raise event if the POP3 port is enabled but inactive?
Select Yes to check the POP3 server port. The default is Yes.
Event severity level when ports are enabled but inactive
Set the event severity level, from 1 to 40, to indicate the importance of an event in which ports are inactive. The default is 5.
Data Acquisition Problems
Raise event if nnetiq task unreachable?
Select Yes to raise an event if the nnetiq task is unavailable. Most monitoring data is gathered from this nnetiq task add-in to the Domino Server. Typically, the task is unavailable when the Domino Server is not running. Use ServerDown to monitor server status. The default is Yes.
Event severity level when nnetiq task unreachable
Set the event severity level, from 1 to 40, to indicate the importance of an event in which the nnetiq task is unavailable. The default is 25.
Raise event if data otherwise unavailable?
Select Yes to raise an event if the data is otherwise unavailable. Data can become unavailable because of a recent server restart, statistic values being reset, or data or other parsing errors.
The default is Yes.
Event severity level when data otherwise unavailable
Set the event severity level, from 1 to 40, to indicate the importance of an event in which data is unavailable for other reasons. The default is 5.
Collect data as ‘-1’ for data unavailable?
Select Yes to log a -1 data point during an interval when a normal data point value could not be obtained. If Yes, the resulting data points show values AND points where data was unavailable.
Note that "average" and "minimum" data values are subsequently skewed.
If unselected, the resulting data points show only valid data values, and it may not be obvious when the Domino Server was down or data was otherwise unavailable.
NOTE: Function is applied to all Data Collection parameters.
The default is unselected.
Threshold - Maximum wait time for server response
Specify the maximum number of seconds this script waits for a response from the Domino Server's nnetiq add-in task acknowledging a request for monitored data. This response time ensures that a “hung” Domino Server or nnetiq task will not “hang” this and other queued scripts.
NOTE: Setting the value too low may result in timeout events being generated unnecessarily.
The default is 60 seconds.
Description How To Set It
42 NetIQ AppManager for Lotus Domino Management Guide
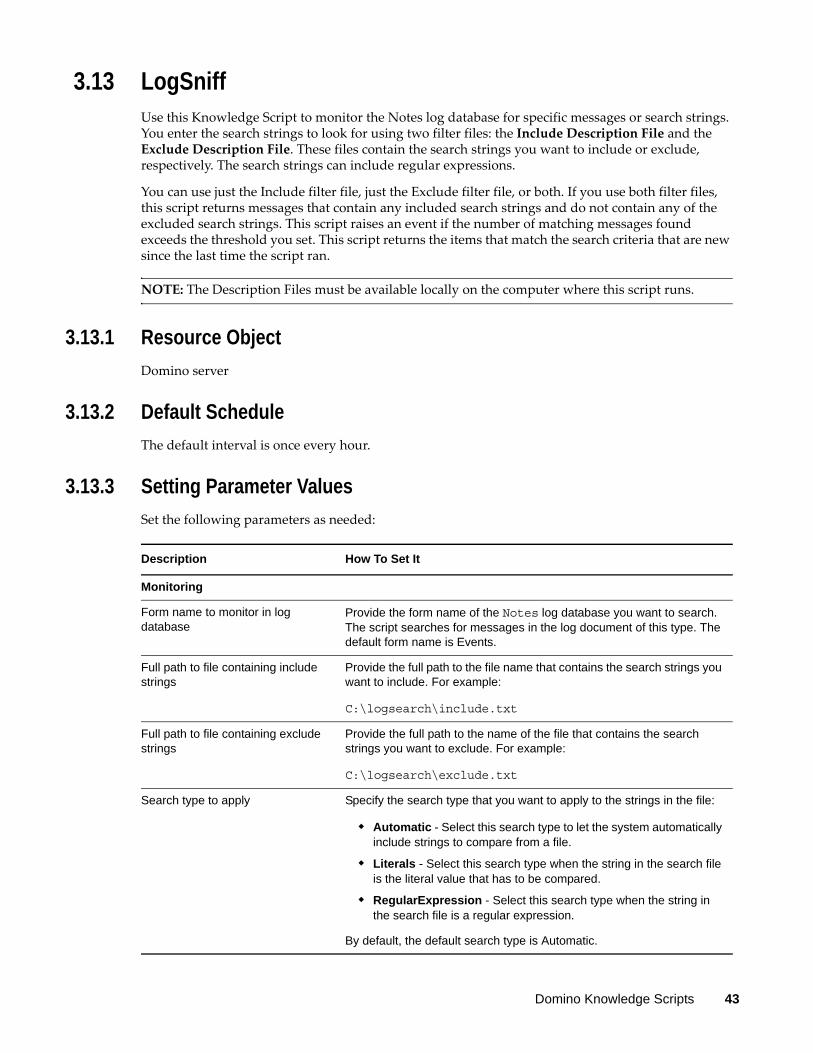
3.13 LogSniffUse this Knowledge Script to monitor the Notes log database for specific messages or search strings. You enter the search strings to look for using two filter files: the Include Description File and the Exclude Description File. These files contain the search strings you want to include or exclude, respectively. The search strings can include regular expressions.
You can use just the Include filter file, just the Exclude filter file, or both. If you use both filter files, this script returns messages that contain any included search strings and do not contain any of the excluded search strings. This script raises an event if the number of matching messages found exceeds the threshold you set. This script returns the items that match the search criteria that are new since the last time the script ran.
NOTE: The Description Files must be available locally on the computer where this script runs.
3.13.1 Resource Object
Domino server
3.13.2 Default Schedule
The default interval is once every hour.
3.13.3 Setting Parameter Values
Set the following parameters as needed:
Description How To Set It
Monitoring
Form name to monitor in log database
Provide the form name of the Notes log database you want to search. The script searches for messages in the log document of this type. The default form name is Events.
Full path to file containing include strings
Provide the full path to the file name that contains the search strings you want to include. For example:
C:\logsearch\include.txt
Full path to file containing exclude strings
Provide the full path to the name of the file that contains the search strings you want to exclude. For example:
C:\logsearch\exclude.txt
Search type to apply Specify the search type that you want to apply to the strings in the file:
Automatic - Select this search type to let the system automatically include strings to compare from a file.
Literals - Select this search type when the string in the search file is the literal value that has to be compared.
RegularExpression - Select this search type when the string in the search file is a regular expression.
By default, the default search type is Automatic.
Domino Knowledge Scripts 43
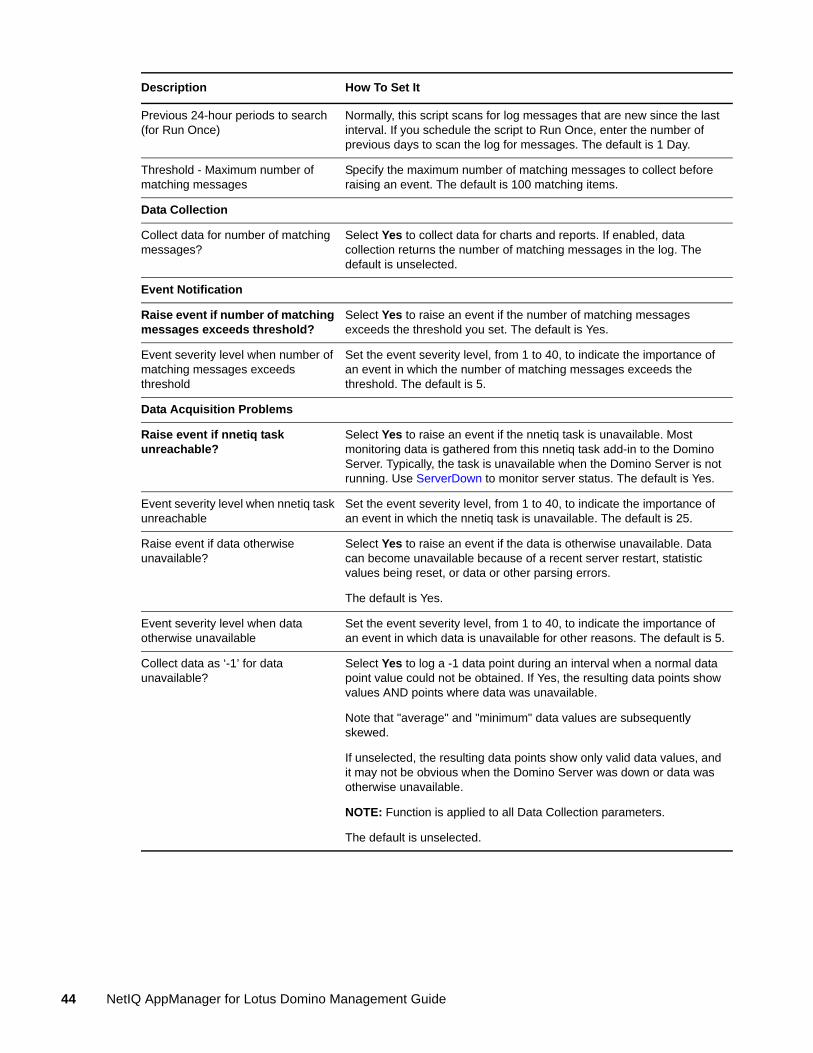
Previous 24-hour periods to search (for Run Once)
Normally, this script scans for log messages that are new since the last interval. If you schedule the script to Run Once, enter the number of previous days to scan the log for messages. The default is 1 Day.
Threshold - Maximum number of matching messages
Specify the maximum number of matching messages to collect before raising an event. The default is 100 matching items.
Data Collection
Collect data for number of matching messages?
Select Yes to collect data for charts and reports. If enabled, data collection returns the number of matching messages in the log. The default is unselected.
Event Notification
Raise event if number of matching messages exceeds threshold?
Select Yes to raise an event if the number of matching messages exceeds the threshold you set. The default is Yes.
Event severity level when number of matching messages exceeds threshold
Set the event severity level, from 1 to 40, to indicate the importance of an event in which the number of matching messages exceeds the threshold. The default is 5.
Data Acquisition Problems
Raise event if nnetiq task unreachable?
Select Yes to raise an event if the nnetiq task is unavailable. Most monitoring data is gathered from this nnetiq task add-in to the Domino Server. Typically, the task is unavailable when the Domino Server is not running. Use ServerDown to monitor server status. The default is Yes.
Event severity level when nnetiq task unreachable
Set the event severity level, from 1 to 40, to indicate the importance of an event in which the nnetiq task is unavailable. The default is 25.
Raise event if data otherwise unavailable?
Select Yes to raise an event if the data is otherwise unavailable. Data can become unavailable because of a recent server restart, statistic values being reset, or data or other parsing errors.
The default is Yes.
Event severity level when data otherwise unavailable
Set the event severity level, from 1 to 40, to indicate the importance of an event in which data is unavailable for other reasons. The default is 5.
Collect data as ‘-1’ for data unavailable?
Select Yes to log a -1 data point during an interval when a normal data point value could not be obtained. If Yes, the resulting data points show values AND points where data was unavailable.
Note that "average" and "minimum" data values are subsequently skewed.
If unselected, the resulting data points show only valid data values, and it may not be obvious when the Domino Server was down or data was otherwise unavailable.
NOTE: Function is applied to all Data Collection parameters.
The default is unselected.
Description How To Set It
44 NetIQ AppManager for Lotus Domino Management Guide
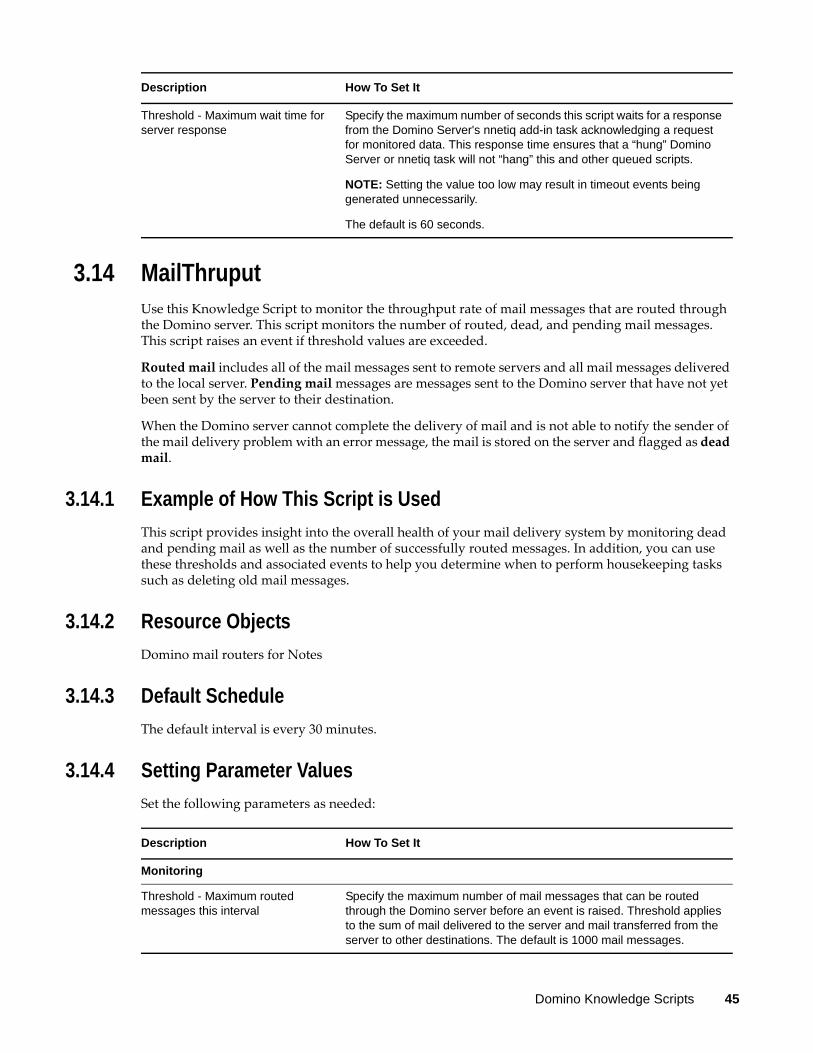
3.14 MailThruputUse this Knowledge Script to monitor the throughput rate of mail messages that are routed through the Domino server. This script monitors the number of routed, dead, and pending mail messages. This script raises an event if threshold values are exceeded.
Routed mail includes all of the mail messages sent to remote servers and all mail messages delivered to the local server. Pending mail messages are messages sent to the Domino server that have not yet been sent by the server to their destination.
When the Domino server cannot complete the delivery of mail and is not able to notify the sender of the mail delivery problem with an error message, the mail is stored on the server and flagged as dead mail.
3.14.1 Example of How This Script is Used
This script provides insight into the overall health of your mail delivery system by monitoring dead and pending mail as well as the number of successfully routed messages. In addition, you can use these thresholds and associated events to help you determine when to perform housekeeping tasks such as deleting old mail messages.
3.14.2 Resource Objects
Domino mail routers for Notes
3.14.3 Default Schedule
The default interval is every 30 minutes.
3.14.4 Setting Parameter Values
Set the following parameters as needed:
Threshold - Maximum wait time for server response
Specify the maximum number of seconds this script waits for a response from the Domino Server's nnetiq add-in task acknowledging a request for monitored data. This response time ensures that a “hung” Domino Server or nnetiq task will not “hang” this and other queued scripts.
NOTE: Setting the value too low may result in timeout events being generated unnecessarily.
The default is 60 seconds.
Description How To Set It
Description How To Set It
Monitoring
Threshold - Maximum routed messages this interval
Specify the maximum number of mail messages that can be routed through the Domino server before an event is raised. Threshold applies to the sum of mail delivered to the server and mail transferred from the server to other destinations. The default is 1000 mail messages.
Domino Knowledge Scripts 45
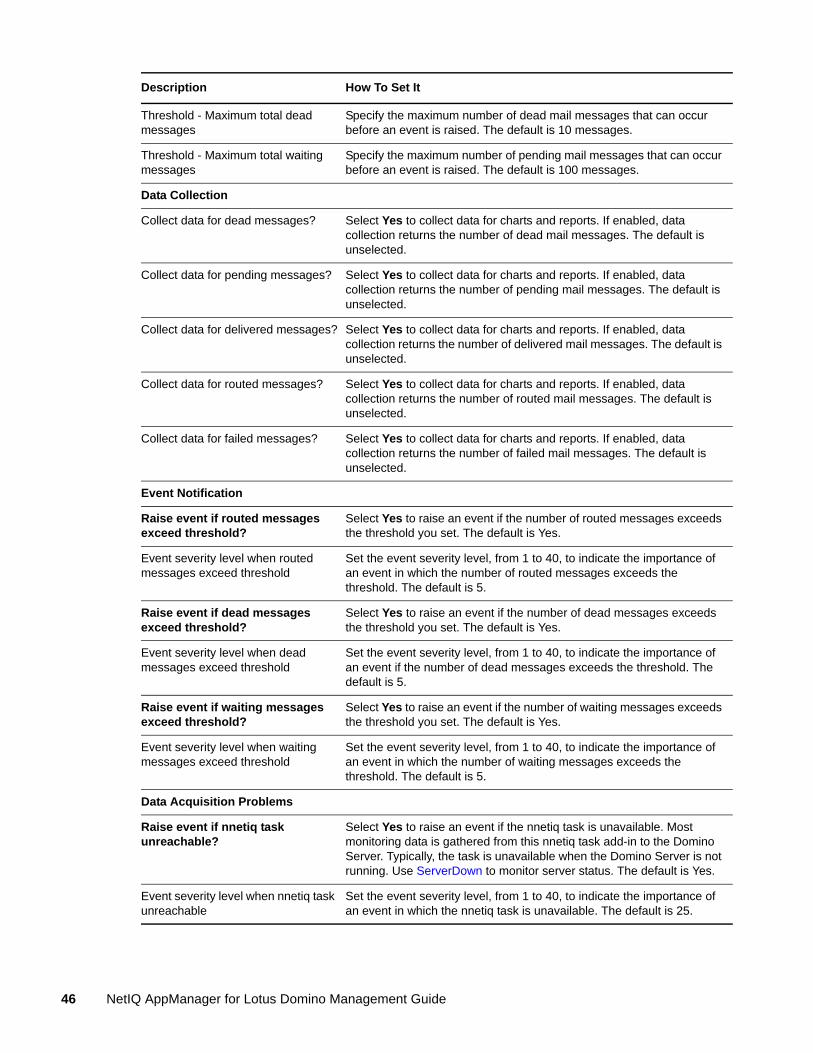
Threshold - Maximum total dead messages
Specify the maximum number of dead mail messages that can occur before an event is raised. The default is 10 messages.
Threshold - Maximum total waiting messages
Specify the maximum number of pending mail messages that can occur before an event is raised. The default is 100 messages.
Data Collection
Collect data for dead messages? Select Yes to collect data for charts and reports. If enabled, data collection returns the number of dead mail messages. The default is unselected.
Collect data for pending messages? Select Yes to collect data for charts and reports. If enabled, data collection returns the number of pending mail messages. The default is unselected.
Collect data for delivered messages? Select Yes to collect data for charts and reports. If enabled, data collection returns the number of delivered mail messages. The default is unselected.
Collect data for routed messages? Select Yes to collect data for charts and reports. If enabled, data collection returns the number of routed mail messages. The default is unselected.
Collect data for failed messages? Select Yes to collect data for charts and reports. If enabled, data collection returns the number of failed mail messages. The default is unselected.
Event Notification
Raise event if routed messages exceed threshold?
Select Yes to raise an event if the number of routed messages exceeds the threshold you set. The default is Yes.
Event severity level when routed messages exceed threshold
Set the event severity level, from 1 to 40, to indicate the importance of an event in which the number of routed messages exceeds the threshold. The default is 5.
Raise event if dead messages exceed threshold?
Select Yes to raise an event if the number of dead messages exceeds the threshold you set. The default is Yes.
Event severity level when dead messages exceed threshold
Set the event severity level, from 1 to 40, to indicate the importance of an event if the number of dead messages exceeds the threshold. The default is 5.
Raise event if waiting messages exceed threshold?
Select Yes to raise an event if the number of waiting messages exceeds the threshold you set. The default is Yes.
Event severity level when waiting messages exceed threshold
Set the event severity level, from 1 to 40, to indicate the importance of an event in which the number of waiting messages exceeds the threshold. The default is 5.
Data Acquisition Problems
Raise event if nnetiq task unreachable?
Select Yes to raise an event if the nnetiq task is unavailable. Most monitoring data is gathered from this nnetiq task add-in to the Domino Server. Typically, the task is unavailable when the Domino Server is not running. Use ServerDown to monitor server status. The default is Yes.
Event severity level when nnetiq task unreachable
Set the event severity level, from 1 to 40, to indicate the importance of an event in which the nnetiq task is unavailable. The default is 25.
Description How To Set It
46 NetIQ AppManager for Lotus Domino Management Guide

3.15 MemBusyUse this Knowledge Script to monitor the total memory resources used by all Domino processes. This script raises an event if the amount of memory used exceeds the threshold you set.
3.15.1 Resource Object
Domino server
3.15.2 Default Schedule
The default interval is every 30 minutes.
3.15.3 Setting Parameter Values
Set the following parameters as needed:
Raise event if data otherwise unavailable?
Select Yes to raise an event if the data is otherwise unavailable. Data can become unavailable because of a recent server restart, statistic values being reset, or data or other parsing errors.
The default is Yes.
Event severity level when data otherwise unavailable
Set the event severity level, from 1 to 40, to indicate the importance of an event in which data is unavailable for other reasons. The default is 5.
Collect data as ‘-1’ for data unavailable?
Select Yes to log a -1 data point during an interval when a normal data point value could not be obtained. If Yes, the resulting data points show values AND points where data was unavailable.
Note that "average" and "minimum" data values are subsequently skewed.
If unselected, the resulting data points show only valid data values, and it may not be obvious when the Domino Server was down or data was otherwise unavailable.
NOTE: Function is applied to all Data Collection parameters.
The default is unselected.
Threshold - Maximum wait time for server response
Specify the maximum number of seconds this script waits for a response from the Domino Server's nnetiq add-in task acknowledging a request for monitored data. This response time ensures that a “hung” Domino Server or nnetiq task will not “hang” this and other queued scripts.
NOTE: Setting the value too low may result in timeout events being generated unnecessarily.
The default is 60 seconds.
Description How To Set It
Description How To Set It
Monitoring
Domino Knowledge Scripts 47
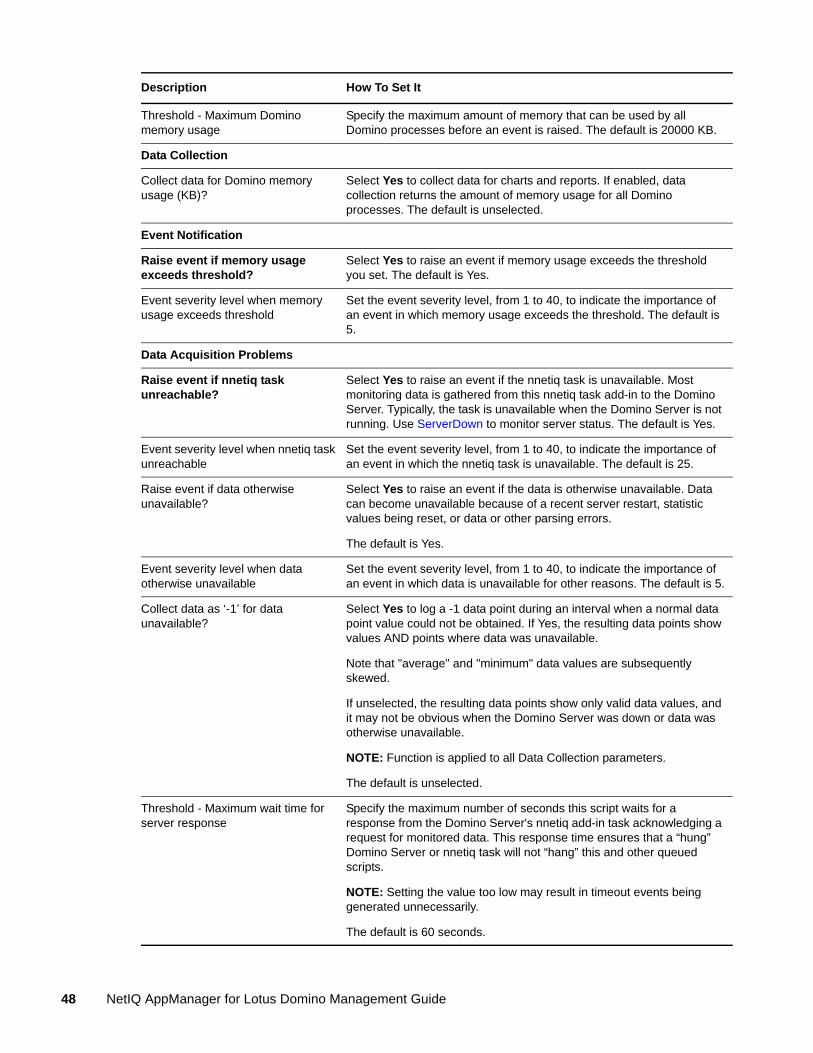
Threshold - Maximum Domino memory usage
Specify the maximum amount of memory that can be used by all Domino processes before an event is raised. The default is 20000 KB.
Data Collection
Collect data for Domino memory usage (KB)?
Select Yes to collect data for charts and reports. If enabled, data collection returns the amount of memory usage for all Domino processes. The default is unselected.
Event Notification
Raise event if memory usage exceeds threshold?
Select Yes to raise an event if memory usage exceeds the threshold you set. The default is Yes.
Event severity level when memory usage exceeds threshold
Set the event severity level, from 1 to 40, to indicate the importance of an event in which memory usage exceeds the threshold. The default is 5.
Data Acquisition Problems
Raise event if nnetiq task unreachable?
Select Yes to raise an event if the nnetiq task is unavailable. Most monitoring data is gathered from this nnetiq task add-in to the Domino Server. Typically, the task is unavailable when the Domino Server is not running. Use ServerDown to monitor server status. The default is Yes.
Event severity level when nnetiq task unreachable
Set the event severity level, from 1 to 40, to indicate the importance of an event in which the nnetiq task is unavailable. The default is 25.
Raise event if data otherwise unavailable?
Select Yes to raise an event if the data is otherwise unavailable. Data can become unavailable because of a recent server restart, statistic values being reset, or data or other parsing errors.
The default is Yes.
Event severity level when data otherwise unavailable
Set the event severity level, from 1 to 40, to indicate the importance of an event in which data is unavailable for other reasons. The default is 5.
Collect data as ‘-1’ for data unavailable?
Select Yes to log a -1 data point during an interval when a normal data point value could not be obtained. If Yes, the resulting data points show values AND points where data was unavailable.
Note that "average" and "minimum" data values are subsequently skewed.
If unselected, the resulting data points show only valid data values, and it may not be obvious when the Domino Server was down or data was otherwise unavailable.
NOTE: Function is applied to all Data Collection parameters.
The default is unselected.
Threshold - Maximum wait time for server response
Specify the maximum number of seconds this script waits for a response from the Domino Server's nnetiq add-in task acknowledging a request for monitored data. This response time ensures that a “hung” Domino Server or nnetiq task will not “hang” this and other queued scripts.
NOTE: Setting the value too low may result in timeout events being generated unnecessarily.
The default is 60 seconds.
Description How To Set It
48 NetIQ AppManager for Lotus Domino Management Guide
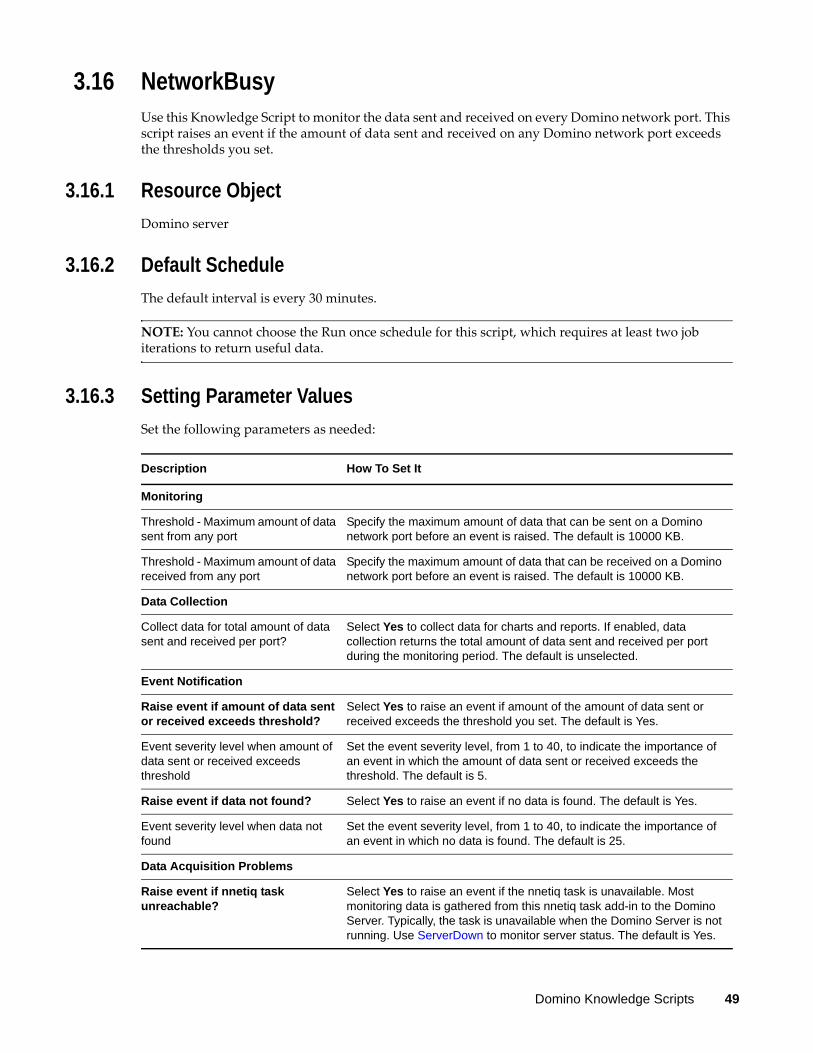
3.16 NetworkBusyUse this Knowledge Script to monitor the data sent and received on every Domino network port. This script raises an event if the amount of data sent and received on any Domino network port exceeds the thresholds you set.
3.16.1 Resource Object
Domino server
3.16.2 Default Schedule
The default interval is every 30 minutes.
NOTE: You cannot choose the Run once schedule for this script, which requires at least two job iterations to return useful data.
3.16.3 Setting Parameter Values
Set the following parameters as needed:
Description How To Set It
Monitoring
Threshold - Maximum amount of data sent from any port
Specify the maximum amount of data that can be sent on a Domino network port before an event is raised. The default is 10000 KB.
Threshold - Maximum amount of data received from any port
Specify the maximum amount of data that can be received on a Domino network port before an event is raised. The default is 10000 KB.
Data Collection
Collect data for total amount of data sent and received per port?
Select Yes to collect data for charts and reports. If enabled, data collection returns the total amount of data sent and received per port during the monitoring period. The default is unselected.
Event Notification
Raise event if amount of data sent or received exceeds threshold?
Select Yes to raise an event if amount of the amount of data sent or received exceeds the threshold you set. The default is Yes.
Event severity level when amount of data sent or received exceeds threshold
Set the event severity level, from 1 to 40, to indicate the importance of an event in which the amount of data sent or received exceeds the threshold. The default is 5.
Raise event if data not found? Select Yes to raise an event if no data is found. The default is Yes.
Event severity level when data not found
Set the event severity level, from 1 to 40, to indicate the importance of an event in which no data is found. The default is 25.
Data Acquisition Problems
Raise event if nnetiq task unreachable?
Select Yes to raise an event if the nnetiq task is unavailable. Most monitoring data is gathered from this nnetiq task add-in to the Domino Server. Typically, the task is unavailable when the Domino Server is not running. Use ServerDown to monitor server status. The default is Yes.
Domino Knowledge Scripts 49
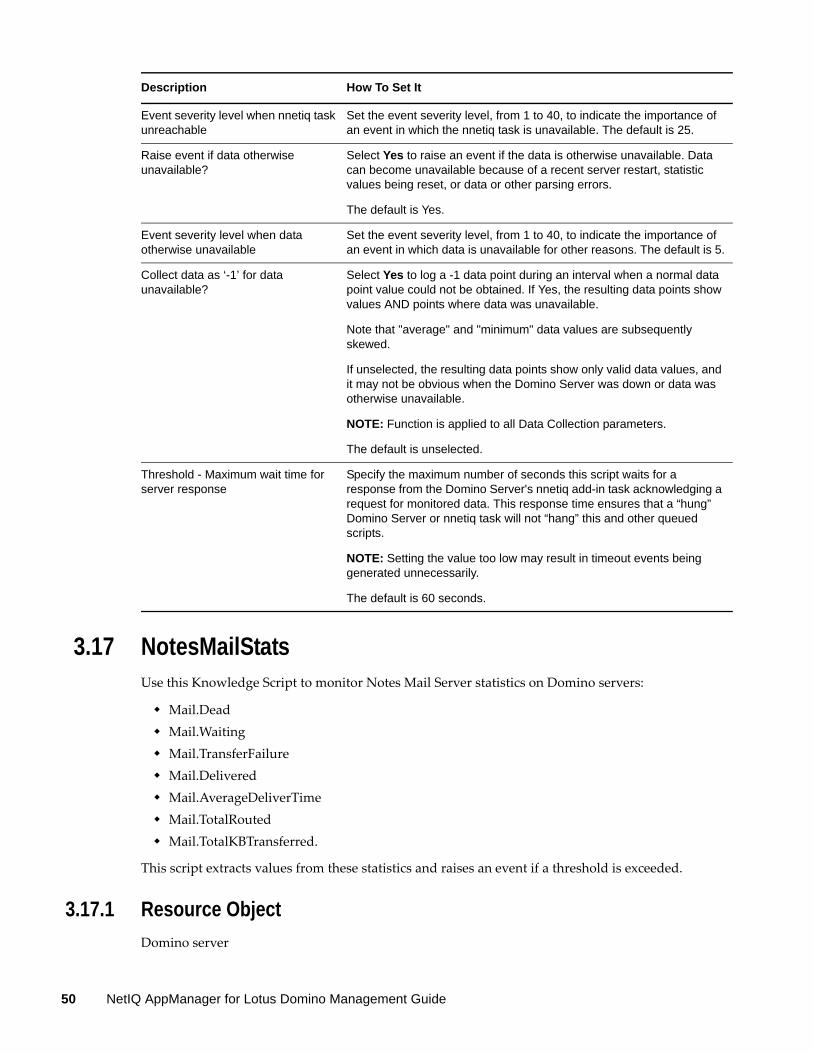
3.17 NotesMailStatsUse this Knowledge Script to monitor Notes Mail Server statistics on Domino servers:
Mail.Dead Mail.Waiting Mail.TransferFailure Mail.Delivered Mail.AverageDeliverTime Mail.TotalRouted Mail.TotalKBTransferred.
This script extracts values from these statistics and raises an event if a threshold is exceeded.
3.17.1 Resource Object
Domino server
Event severity level when nnetiq task unreachable
Set the event severity level, from 1 to 40, to indicate the importance of an event in which the nnetiq task is unavailable. The default is 25.
Raise event if data otherwise unavailable?
Select Yes to raise an event if the data is otherwise unavailable. Data can become unavailable because of a recent server restart, statistic values being reset, or data or other parsing errors.
The default is Yes.
Event severity level when data otherwise unavailable
Set the event severity level, from 1 to 40, to indicate the importance of an event in which data is unavailable for other reasons. The default is 5.
Collect data as ‘-1’ for data unavailable?
Select Yes to log a -1 data point during an interval when a normal data point value could not be obtained. If Yes, the resulting data points show values AND points where data was unavailable.
Note that "average" and "minimum" data values are subsequently skewed.
If unselected, the resulting data points show only valid data values, and it may not be obvious when the Domino Server was down or data was otherwise unavailable.
NOTE: Function is applied to all Data Collection parameters.
The default is unselected.
Threshold - Maximum wait time for server response
Specify the maximum number of seconds this script waits for a response from the Domino Server's nnetiq add-in task acknowledging a request for monitored data. This response time ensures that a “hung” Domino Server or nnetiq task will not “hang” this and other queued scripts.
NOTE: Setting the value too low may result in timeout events being generated unnecessarily.
The default is 60 seconds.
Description How To Set It
50 NetIQ AppManager for Lotus Domino Management Guide
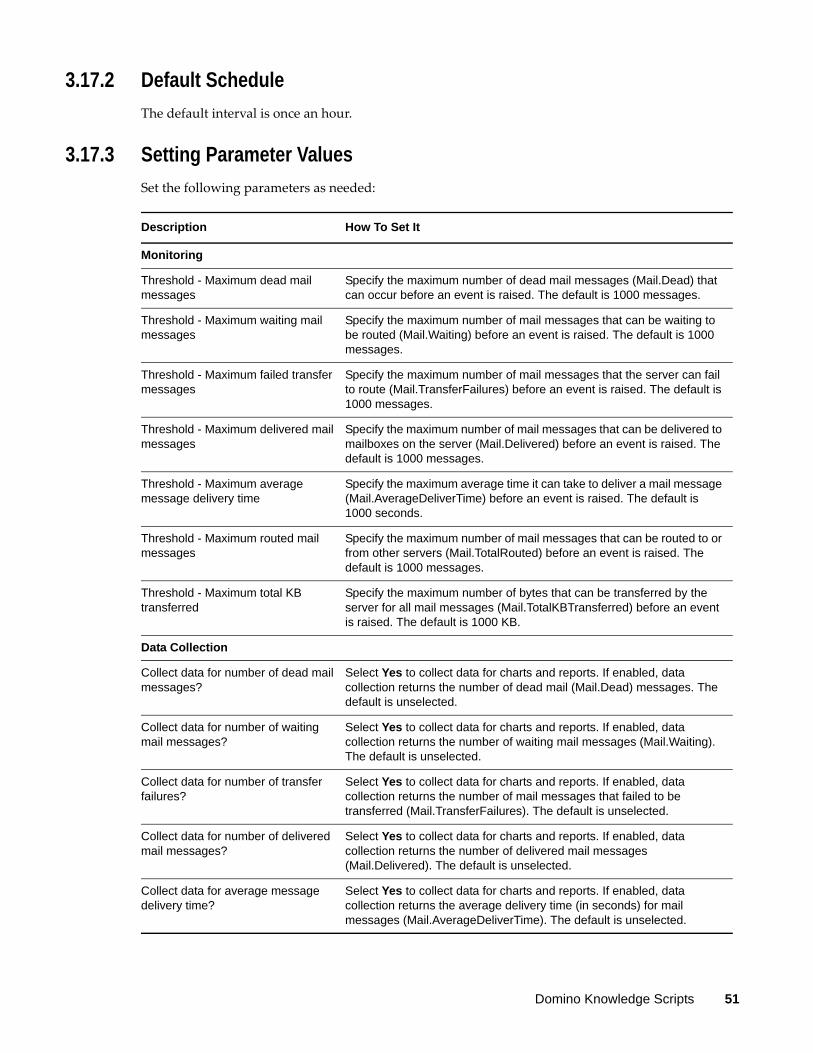
3.17.2 Default Schedule
The default interval is once an hour.
3.17.3 Setting Parameter Values
Set the following parameters as needed:
Description How To Set It
Monitoring
Threshold - Maximum dead mail messages
Specify the maximum number of dead mail messages (Mail.Dead) that can occur before an event is raised. The default is 1000 messages.
Threshold - Maximum waiting mail messages
Specify the maximum number of mail messages that can be waiting to be routed (Mail.Waiting) before an event is raised. The default is 1000 messages.
Threshold - Maximum failed transfer messages
Specify the maximum number of mail messages that the server can fail to route (Mail.TransferFailures) before an event is raised. The default is 1000 messages.
Threshold - Maximum delivered mail messages
Specify the maximum number of mail messages that can be delivered to mailboxes on the server (Mail.Delivered) before an event is raised. The default is 1000 messages.
Threshold - Maximum average message delivery time
Specify the maximum average time it can take to deliver a mail message (Mail.AverageDeliverTime) before an event is raised. The default is 1000 seconds.
Threshold - Maximum routed mail messages
Specify the maximum number of mail messages that can be routed to or from other servers (Mail.TotalRouted) before an event is raised. The default is 1000 messages.
Threshold - Maximum total KB transferred
Specify the maximum number of bytes that can be transferred by the server for all mail messages (Mail.TotalKBTransferred) before an event is raised. The default is 1000 KB.
Data Collection
Collect data for number of dead mail messages?
Select Yes to collect data for charts and reports. If enabled, data collection returns the number of dead mail (Mail.Dead) messages. The default is unselected.
Collect data for number of waiting mail messages?
Select Yes to collect data for charts and reports. If enabled, data collection returns the number of waiting mail messages (Mail.Waiting). The default is unselected.
Collect data for number of transfer failures?
Select Yes to collect data for charts and reports. If enabled, data collection returns the number of mail messages that failed to be transferred (Mail.TransferFailures). The default is unselected.
Collect data for number of delivered mail messages?
Select Yes to collect data for charts and reports. If enabled, data collection returns the number of delivered mail messages (Mail.Delivered). The default is unselected.
Collect data for average message delivery time?
Select Yes to collect data for charts and reports. If enabled, data collection returns the average delivery time (in seconds) for mail messages (Mail.AverageDeliverTime). The default is unselected.
Domino Knowledge Scripts 51
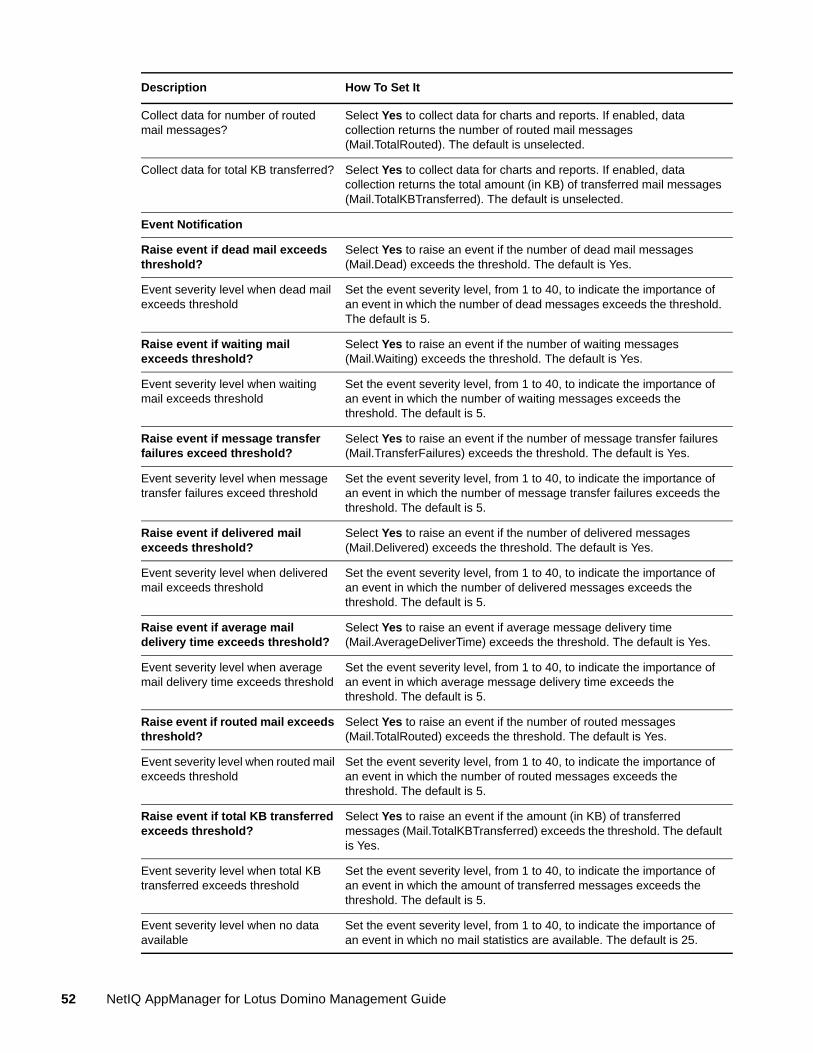
Collect data for number of routed mail messages?
Select Yes to collect data for charts and reports. If enabled, data collection returns the number of routed mail messages (Mail.TotalRouted). The default is unselected.
Collect data for total KB transferred? Select Yes to collect data for charts and reports. If enabled, data collection returns the total amount (in KB) of transferred mail messages (Mail.TotalKBTransferred). The default is unselected.
Event Notification
Raise event if dead mail exceeds threshold?
Select Yes to raise an event if the number of dead mail messages (Mail.Dead) exceeds the threshold. The default is Yes.
Event severity level when dead mail exceeds threshold
Set the event severity level, from 1 to 40, to indicate the importance of an event in which the number of dead messages exceeds the threshold. The default is 5.
Raise event if waiting mail exceeds threshold?
Select Yes to raise an event if the number of waiting messages (Mail.Waiting) exceeds the threshold. The default is Yes.
Event severity level when waiting mail exceeds threshold
Set the event severity level, from 1 to 40, to indicate the importance of an event in which the number of waiting messages exceeds the threshold. The default is 5.
Raise event if message transfer failures exceed threshold?
Select Yes to raise an event if the number of message transfer failures (Mail.TransferFailures) exceeds the threshold. The default is Yes.
Event severity level when message transfer failures exceed threshold
Set the event severity level, from 1 to 40, to indicate the importance of an event in which the number of message transfer failures exceeds the threshold. The default is 5.
Raise event if delivered mail exceeds threshold?
Select Yes to raise an event if the number of delivered messages (Mail.Delivered) exceeds the threshold. The default is Yes.
Event severity level when delivered mail exceeds threshold
Set the event severity level, from 1 to 40, to indicate the importance of an event in which the number of delivered messages exceeds the threshold. The default is 5.
Raise event if average mail delivery time exceeds threshold?
Select Yes to raise an event if average message delivery time (Mail.AverageDeliverTime) exceeds the threshold. The default is Yes.
Event severity level when average mail delivery time exceeds threshold
Set the event severity level, from 1 to 40, to indicate the importance of an event in which average message delivery time exceeds the threshold. The default is 5.
Raise event if routed mail exceeds threshold?
Select Yes to raise an event if the number of routed messages (Mail.TotalRouted) exceeds the threshold. The default is Yes.
Event severity level when routed mail exceeds threshold
Set the event severity level, from 1 to 40, to indicate the importance of an event in which the number of routed messages exceeds the threshold. The default is 5.
Raise event if total KB transferred exceeds threshold?
Select Yes to raise an event if the amount (in KB) of transferred messages (Mail.TotalKBTransferred) exceeds the threshold. The default is Yes.
Event severity level when total KB transferred exceeds threshold
Set the event severity level, from 1 to 40, to indicate the importance of an event in which the amount of transferred messages exceeds the threshold. The default is 5.
Event severity level when no data available
Set the event severity level, from 1 to 40, to indicate the importance of an event in which no mail statistics are available. The default is 25.
Description How To Set It
52 NetIQ AppManager for Lotus Domino Management Guide
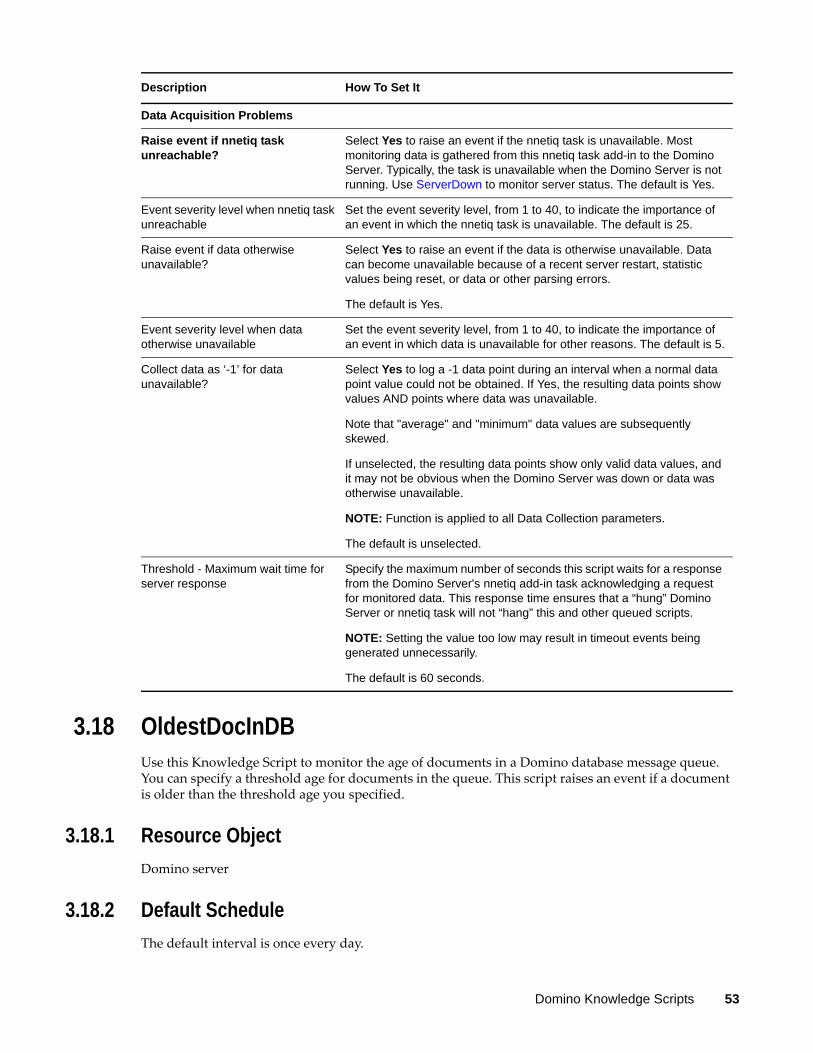
3.18 OldestDocInDBUse this Knowledge Script to monitor the age of documents in a Domino database message queue. You can specify a threshold age for documents in the queue. This script raises an event if a document is older than the threshold age you specified.
3.18.1 Resource Object
Domino server
3.18.2 Default Schedule
The default interval is once every day.
Data Acquisition Problems
Raise event if nnetiq task unreachable?
Select Yes to raise an event if the nnetiq task is unavailable. Most monitoring data is gathered from this nnetiq task add-in to the Domino Server. Typically, the task is unavailable when the Domino Server is not running. Use ServerDown to monitor server status. The default is Yes.
Event severity level when nnetiq task unreachable
Set the event severity level, from 1 to 40, to indicate the importance of an event in which the nnetiq task is unavailable. The default is 25.
Raise event if data otherwise unavailable?
Select Yes to raise an event if the data is otherwise unavailable. Data can become unavailable because of a recent server restart, statistic values being reset, or data or other parsing errors.
The default is Yes.
Event severity level when data otherwise unavailable
Set the event severity level, from 1 to 40, to indicate the importance of an event in which data is unavailable for other reasons. The default is 5.
Collect data as ‘-1’ for data unavailable?
Select Yes to log a -1 data point during an interval when a normal data point value could not be obtained. If Yes, the resulting data points show values AND points where data was unavailable.
Note that "average" and "minimum" data values are subsequently skewed.
If unselected, the resulting data points show only valid data values, and it may not be obvious when the Domino Server was down or data was otherwise unavailable.
NOTE: Function is applied to all Data Collection parameters.
The default is unselected.
Threshold - Maximum wait time for server response
Specify the maximum number of seconds this script waits for a response from the Domino Server's nnetiq add-in task acknowledging a request for monitored data. This response time ensures that a “hung” Domino Server or nnetiq task will not “hang” this and other queued scripts.
NOTE: Setting the value too low may result in timeout events being generated unnecessarily.
The default is 60 seconds.
Description How To Set It
Domino Knowledge Scripts 53
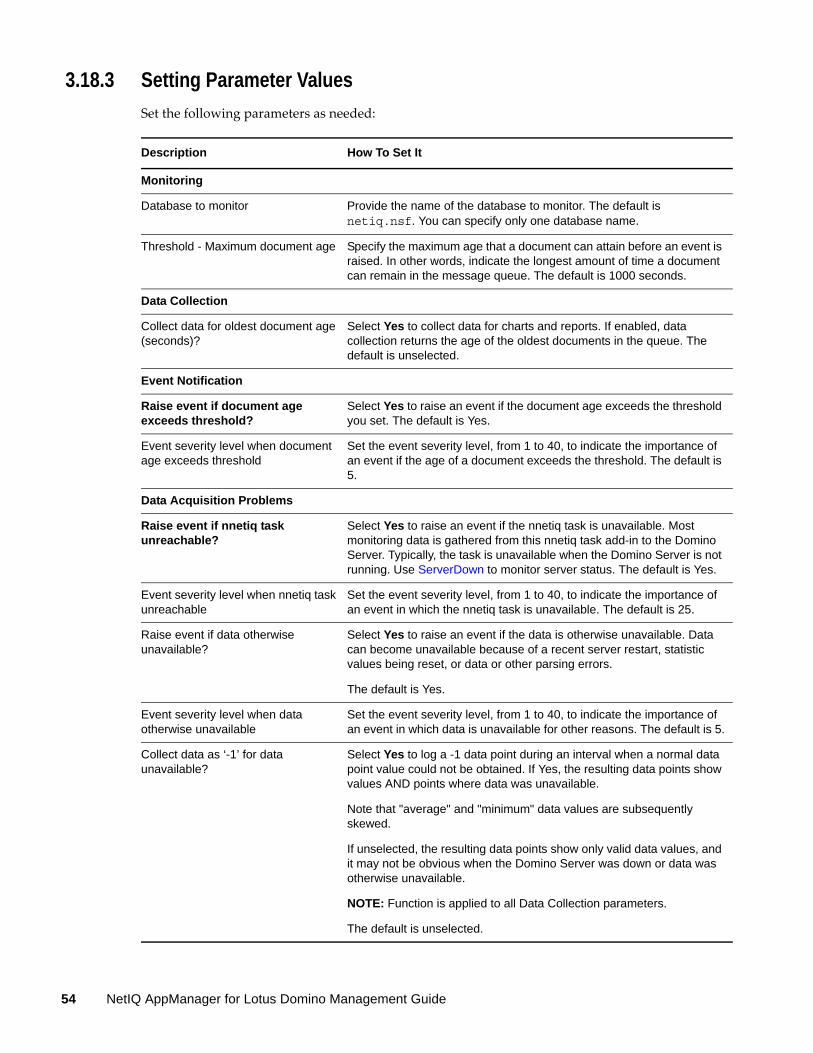
3.18.3 Setting Parameter Values
Set the following parameters as needed:
Description How To Set It
Monitoring
Database to monitor Provide the name of the database to monitor. The default is netiq.nsf. You can specify only one database name.
Threshold - Maximum document age Specify the maximum age that a document can attain before an event is raised. In other words, indicate the longest amount of time a document can remain in the message queue. The default is 1000 seconds.
Data Collection
Collect data for oldest document age (seconds)?
Select Yes to collect data for charts and reports. If enabled, data collection returns the age of the oldest documents in the queue. The default is unselected.
Event Notification
Raise event if document age exceeds threshold?
Select Yes to raise an event if the document age exceeds the threshold you set. The default is Yes.
Event severity level when document age exceeds threshold
Set the event severity level, from 1 to 40, to indicate the importance of an event if the age of a document exceeds the threshold. The default is 5.
Data Acquisition Problems
Raise event if nnetiq task unreachable?
Select Yes to raise an event if the nnetiq task is unavailable. Most monitoring data is gathered from this nnetiq task add-in to the Domino Server. Typically, the task is unavailable when the Domino Server is not running. Use ServerDown to monitor server status. The default is Yes.
Event severity level when nnetiq task unreachable
Set the event severity level, from 1 to 40, to indicate the importance of an event in which the nnetiq task is unavailable. The default is 25.
Raise event if data otherwise unavailable?
Select Yes to raise an event if the data is otherwise unavailable. Data can become unavailable because of a recent server restart, statistic values being reset, or data or other parsing errors.
The default is Yes.
Event severity level when data otherwise unavailable
Set the event severity level, from 1 to 40, to indicate the importance of an event in which data is unavailable for other reasons. The default is 5.
Collect data as ‘-1’ for data unavailable?
Select Yes to log a -1 data point during an interval when a normal data point value could not be obtained. If Yes, the resulting data points show values AND points where data was unavailable.
Note that "average" and "minimum" data values are subsequently skewed.
If unselected, the resulting data points show only valid data values, and it may not be obvious when the Domino Server was down or data was otherwise unavailable.
NOTE: Function is applied to all Data Collection parameters.
The default is unselected.
54 NetIQ AppManager for Lotus Domino Management Guide
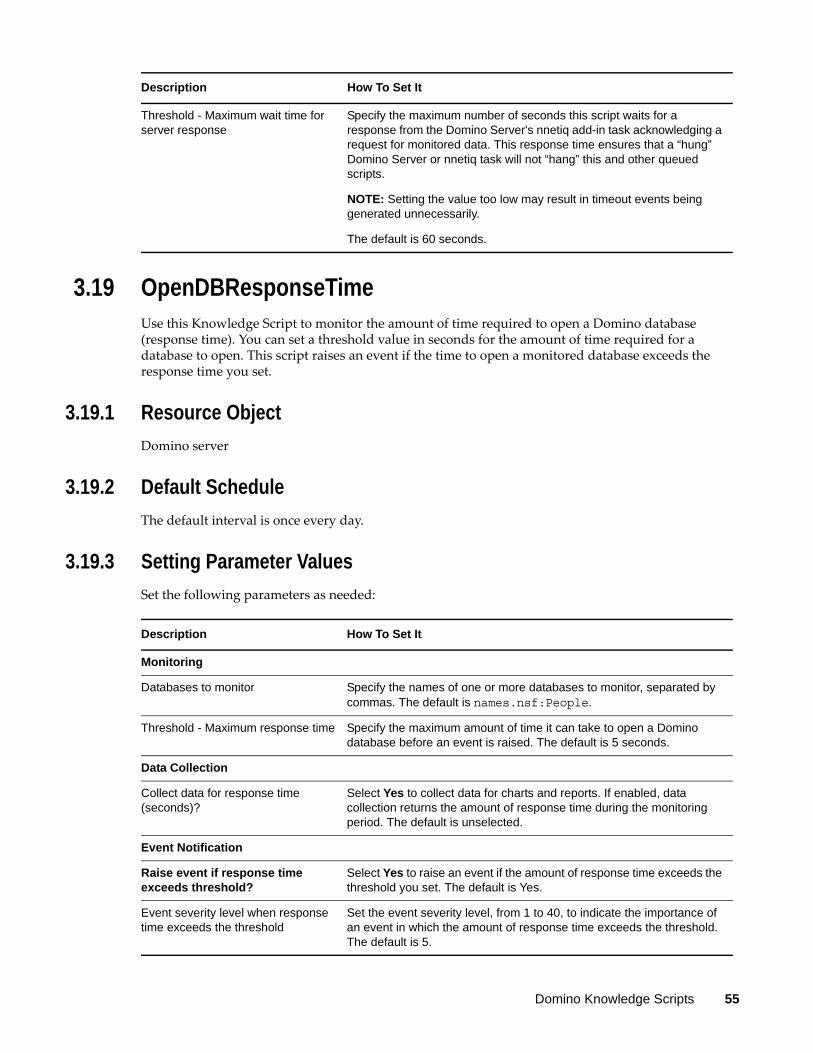
3.19 OpenDBResponseTimeUse this Knowledge Script to monitor the amount of time required to open a Domino database (response time). You can set a threshold value in seconds for the amount of time required for a database to open. This script raises an event if the time to open a monitored database exceeds the response time you set.
3.19.1 Resource Object
Domino server
3.19.2 Default Schedule
The default interval is once every day.
3.19.3 Setting Parameter Values
Set the following parameters as needed:
Threshold - Maximum wait time for server response
Specify the maximum number of seconds this script waits for a response from the Domino Server's nnetiq add-in task acknowledging a request for monitored data. This response time ensures that a “hung” Domino Server or nnetiq task will not “hang” this and other queued scripts.
NOTE: Setting the value too low may result in timeout events being generated unnecessarily.
The default is 60 seconds.
Description How To Set It
Description How To Set It
Monitoring
Databases to monitor Specify the names of one or more databases to monitor, separated by commas. The default is names.nsf:People.
Threshold - Maximum response time Specify the maximum amount of time it can take to open a Domino database before an event is raised. The default is 5 seconds.
Data Collection
Collect data for response time (seconds)?
Select Yes to collect data for charts and reports. If enabled, data collection returns the amount of response time during the monitoring period. The default is unselected.
Event Notification
Raise event if response time exceeds threshold?
Select Yes to raise an event if the amount of response time exceeds the threshold you set. The default is Yes.
Event severity level when response time exceeds the threshold
Set the event severity level, from 1 to 40, to indicate the importance of an event in which the amount of response time exceeds the threshold. The default is 5.
Domino Knowledge Scripts 55
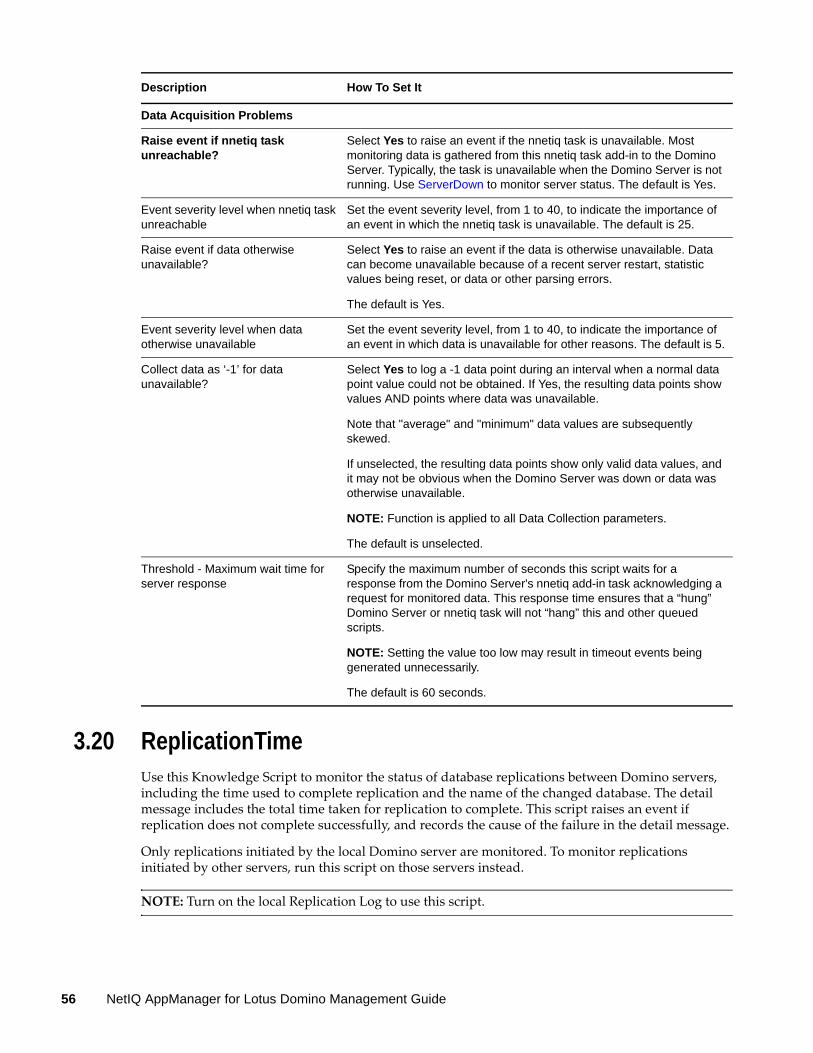
3.20 ReplicationTimeUse this Knowledge Script to monitor the status of database replications between Domino servers, including the time used to complete replication and the name of the changed database. The detail message includes the total time taken for replication to complete. This script raises an event if replication does not complete successfully, and records the cause of the failure in the detail message.
Only replications initiated by the local Domino server are monitored. To monitor replications initiated by other servers, run this script on those servers instead.
NOTE: Turn on the local Replication Log to use this script.
Data Acquisition Problems
Raise event if nnetiq task unreachable?
Select Yes to raise an event if the nnetiq task is unavailable. Most monitoring data is gathered from this nnetiq task add-in to the Domino Server. Typically, the task is unavailable when the Domino Server is not running. Use ServerDown to monitor server status. The default is Yes.
Event severity level when nnetiq task unreachable
Set the event severity level, from 1 to 40, to indicate the importance of an event in which the nnetiq task is unavailable. The default is 25.
Raise event if data otherwise unavailable?
Select Yes to raise an event if the data is otherwise unavailable. Data can become unavailable because of a recent server restart, statistic values being reset, or data or other parsing errors.
The default is Yes.
Event severity level when data otherwise unavailable
Set the event severity level, from 1 to 40, to indicate the importance of an event in which data is unavailable for other reasons. The default is 5.
Collect data as ‘-1’ for data unavailable?
Select Yes to log a -1 data point during an interval when a normal data point value could not be obtained. If Yes, the resulting data points show values AND points where data was unavailable.
Note that "average" and "minimum" data values are subsequently skewed.
If unselected, the resulting data points show only valid data values, and it may not be obvious when the Domino Server was down or data was otherwise unavailable.
NOTE: Function is applied to all Data Collection parameters.
The default is unselected.
Threshold - Maximum wait time for server response
Specify the maximum number of seconds this script waits for a response from the Domino Server's nnetiq add-in task acknowledging a request for monitored data. This response time ensures that a “hung” Domino Server or nnetiq task will not “hang” this and other queued scripts.
NOTE: Setting the value too low may result in timeout events being generated unnecessarily.
The default is 60 seconds.
Description How To Set It
56 NetIQ AppManager for Lotus Domino Management Guide
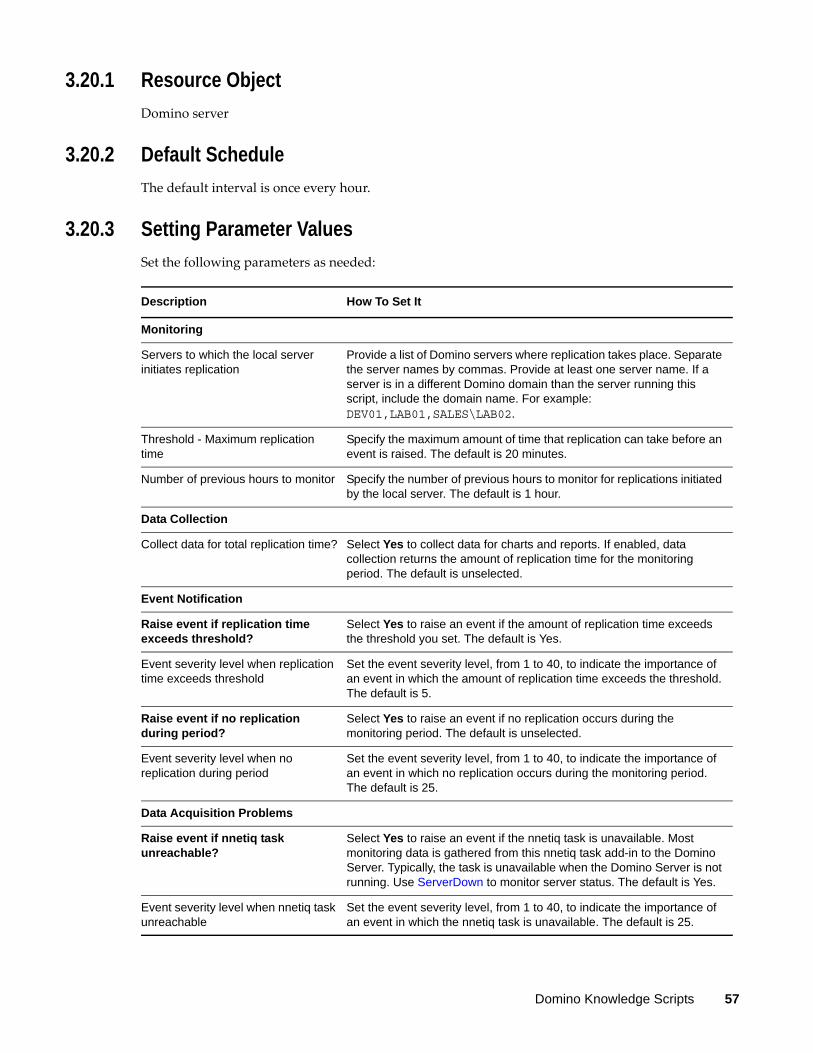
3.20.1 Resource Object
Domino server
3.20.2 Default Schedule
The default interval is once every hour.
3.20.3 Setting Parameter Values
Set the following parameters as needed:
Description How To Set It
Monitoring
Servers to which the local server initiates replication
Provide a list of Domino servers where replication takes place. Separate the server names by commas. Provide at least one server name. If a server is in a different Domino domain than the server running this script, include the domain name. For example: DEV01,LAB01,SALES\LAB02.
Threshold - Maximum replication time
Specify the maximum amount of time that replication can take before an event is raised. The default is 20 minutes.
Number of previous hours to monitor Specify the number of previous hours to monitor for replications initiated by the local server. The default is 1 hour.
Data Collection
Collect data for total replication time? Select Yes to collect data for charts and reports. If enabled, data collection returns the amount of replication time for the monitoring period. The default is unselected.
Event Notification
Raise event if replication time exceeds threshold?
Select Yes to raise an event if the amount of replication time exceeds the threshold you set. The default is Yes.
Event severity level when replication time exceeds threshold
Set the event severity level, from 1 to 40, to indicate the importance of an event in which the amount of replication time exceeds the threshold. The default is 5.
Raise event if no replication during period?
Select Yes to raise an event if no replication occurs during the monitoring period. The default is unselected.
Event severity level when no replication during period
Set the event severity level, from 1 to 40, to indicate the importance of an event in which no replication occurs during the monitoring period. The default is 25.
Data Acquisition Problems
Raise event if nnetiq task unreachable?
Select Yes to raise an event if the nnetiq task is unavailable. Most monitoring data is gathered from this nnetiq task add-in to the Domino Server. Typically, the task is unavailable when the Domino Server is not running. Use ServerDown to monitor server status. The default is Yes.
Event severity level when nnetiq task unreachable
Set the event severity level, from 1 to 40, to indicate the importance of an event in which the nnetiq task is unavailable. The default is 25.
Domino Knowledge Scripts 57
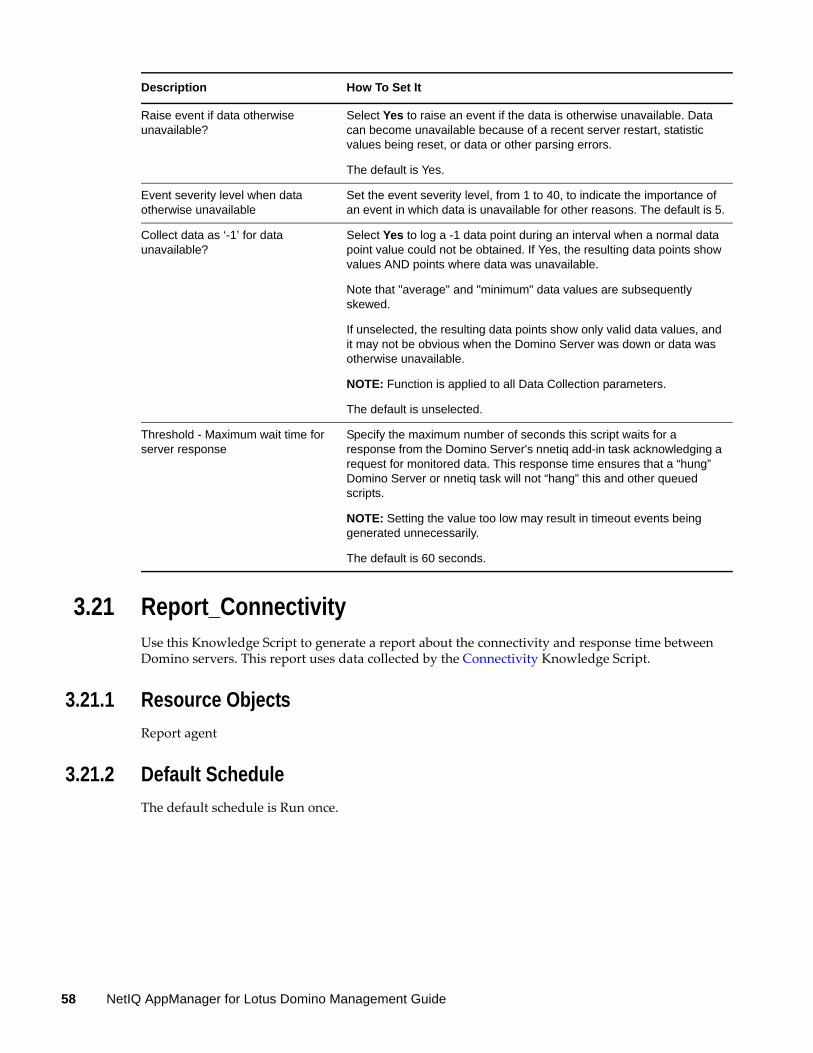
3.21 Report_ConnectivityUse this Knowledge Script to generate a report about the connectivity and response time between Domino servers. This report uses data collected by the Connectivity Knowledge Script.
3.21.1 Resource Objects
Report agent
3.21.2 Default Schedule
The default schedule is Run once.
Raise event if data otherwise unavailable?
Select Yes to raise an event if the data is otherwise unavailable. Data can become unavailable because of a recent server restart, statistic values being reset, or data or other parsing errors.
The default is Yes.
Event severity level when data otherwise unavailable
Set the event severity level, from 1 to 40, to indicate the importance of an event in which data is unavailable for other reasons. The default is 5.
Collect data as ‘-1’ for data unavailable?
Select Yes to log a -1 data point during an interval when a normal data point value could not be obtained. If Yes, the resulting data points show values AND points where data was unavailable.
Note that "average" and "minimum" data values are subsequently skewed.
If unselected, the resulting data points show only valid data values, and it may not be obvious when the Domino Server was down or data was otherwise unavailable.
NOTE: Function is applied to all Data Collection parameters.
The default is unselected.
Threshold - Maximum wait time for server response
Specify the maximum number of seconds this script waits for a response from the Domino Server's nnetiq add-in task acknowledging a request for monitored data. This response time ensures that a “hung” Domino Server or nnetiq task will not “hang” this and other queued scripts.
NOTE: Setting the value too low may result in timeout events being generated unnecessarily.
The default is 60 seconds.
Description How To Set It
58 NetIQ AppManager for Lotus Domino Management Guide

3.21.3 Setting Parameter Values
Set the following parameters as needed:
Description How To Set It
Data Source
Select computers Select the computers to include in your report.
Select time range Set a specific or sliding time range for data to include in your report.
Select peak weekdays Select the days of the week to include in your report.
Data Settings
Hours or percentage on chart
Select whether to illustrate availability by number of hours or by percentage.
Select sorting/display option
Select whether data is sorted, or the method of display:
No sort: Data is not sorted
Sort: Data is sorted by value. Lowest to highest from front to back; highest to lowest from left to right
Top %: Chart only the top N % of selected data (sorted by default)
Top N: Chart only the top N of selected data (sorted by default)
Bottom %: Chart only the bottom N % of data (sorted by default)
Bottom N: Chart only the bottom N of selected data (sorted by default)
Percentage/count for top/bottom
Specify a value for either the percentage or count defined in the previous parameter. For example, Top 10%, or Top 10. The default is 25.
Truncate top/bottom? If set to yes, then the data table shows only the top or bottom N or %. For example, only the top 10%.
Otherwise, the table shows all data.
The default is no.
Report Settings
Include parameter help table?
Set to yes to include a table in the report that lists parameter settings for the report script. The default is yes.
Include data stream table? Set to yes to include a table of data stream values in the report. The default is yes.
Include data stream chart? Set to yes to include a chart of data stream values in the report. The default is yes.
Select chart style Define the graphic properties of the charts in your report.
Select output folder Set properties for the output folder.
Add job ID to output folder name?
Set to yes to append the job ID to the name of the output folder.
A job ID helps you correlate a specific instance of a Report Script with the corresponding report.
The default is no.
Domino Knowledge Scripts 59
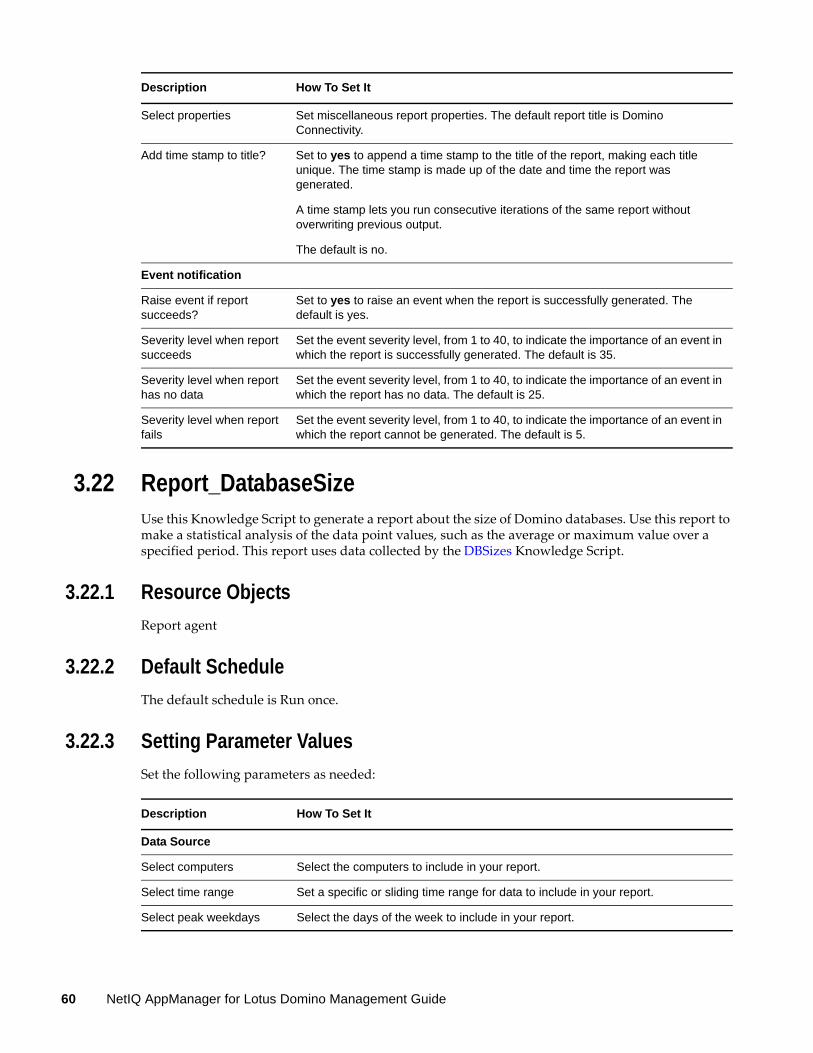
3.22 Report_DatabaseSizeUse this Knowledge Script to generate a report about the size of Domino databases. Use this report to make a statistical analysis of the data point values, such as the average or maximum value over a specified period. This report uses data collected by the DBSizes Knowledge Script.
3.22.1 Resource Objects
Report agent
3.22.2 Default Schedule
The default schedule is Run once.
3.22.3 Setting Parameter Values
Set the following parameters as needed:
Select properties Set miscellaneous report properties. The default report title is Domino Connectivity.
Add time stamp to title? Set to yes to append a time stamp to the title of the report, making each title unique. The time stamp is made up of the date and time the report was generated.
A time stamp lets you run consecutive iterations of the same report without overwriting previous output.
The default is no.
Event notification
Raise event if report succeeds?
Set to yes to raise an event when the report is successfully generated. The default is yes.
Severity level when report succeeds
Set the event severity level, from 1 to 40, to indicate the importance of an event in which the report is successfully generated. The default is 35.
Severity level when report has no data
Set the event severity level, from 1 to 40, to indicate the importance of an event in which the report has no data. The default is 25.
Severity level when report fails
Set the event severity level, from 1 to 40, to indicate the importance of an event in which the report cannot be generated. The default is 5.
Description How To Set It
Description How To Set It
Data Source
Select computers Select the computers to include in your report.
Select time range Set a specific or sliding time range for data to include in your report.
Select peak weekdays Select the days of the week to include in your report.
60 NetIQ AppManager for Lotus Domino Management Guide
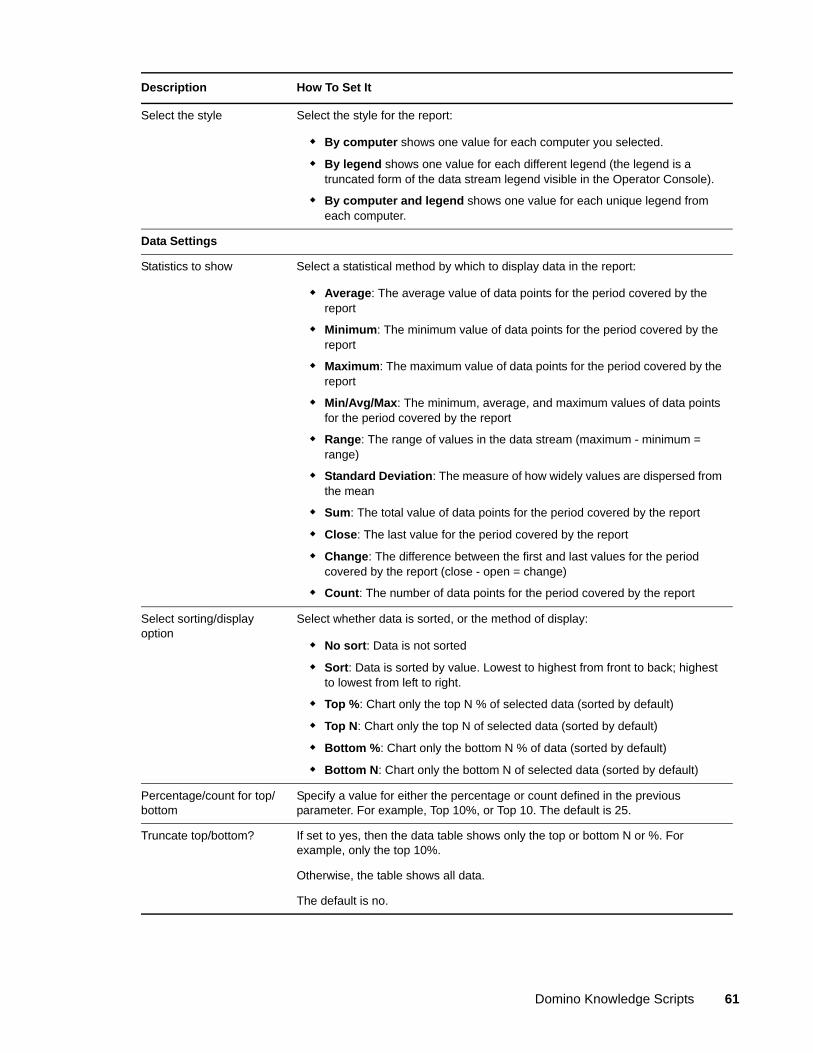
Select the style Select the style for the report:
By computer shows one value for each computer you selected.
By legend shows one value for each different legend (the legend is a truncated form of the data stream legend visible in the Operator Console).
By computer and legend shows one value for each unique legend from each computer.
Data Settings
Statistics to show Select a statistical method by which to display data in the report:
Average: The average value of data points for the period covered by the report
Minimum: The minimum value of data points for the period covered by the report
Maximum: The maximum value of data points for the period covered by the report
Min/Avg/Max: The minimum, average, and maximum values of data points for the period covered by the report
Range: The range of values in the data stream (maximum - minimum = range)
Standard Deviation: The measure of how widely values are dispersed from the mean
Sum: The total value of data points for the period covered by the report
Close: The last value for the period covered by the report
Change: The difference between the first and last values for the period covered by the report (close - open = change)
Count: The number of data points for the period covered by the report
Select sorting/display option
Select whether data is sorted, or the method of display:
No sort: Data is not sorted
Sort: Data is sorted by value. Lowest to highest from front to back; highest to lowest from left to right.
Top %: Chart only the top N % of selected data (sorted by default)
Top N: Chart only the top N of selected data (sorted by default)
Bottom %: Chart only the bottom N % of data (sorted by default)
Bottom N: Chart only the bottom N of selected data (sorted by default)
Percentage/count for top/bottom
Specify a value for either the percentage or count defined in the previous parameter. For example, Top 10%, or Top 10. The default is 25.
Truncate top/bottom? If set to yes, then the data table shows only the top or bottom N or %. For example, only the top 10%.
Otherwise, the table shows all data.
The default is no.
Description How To Set It
Domino Knowledge Scripts 61
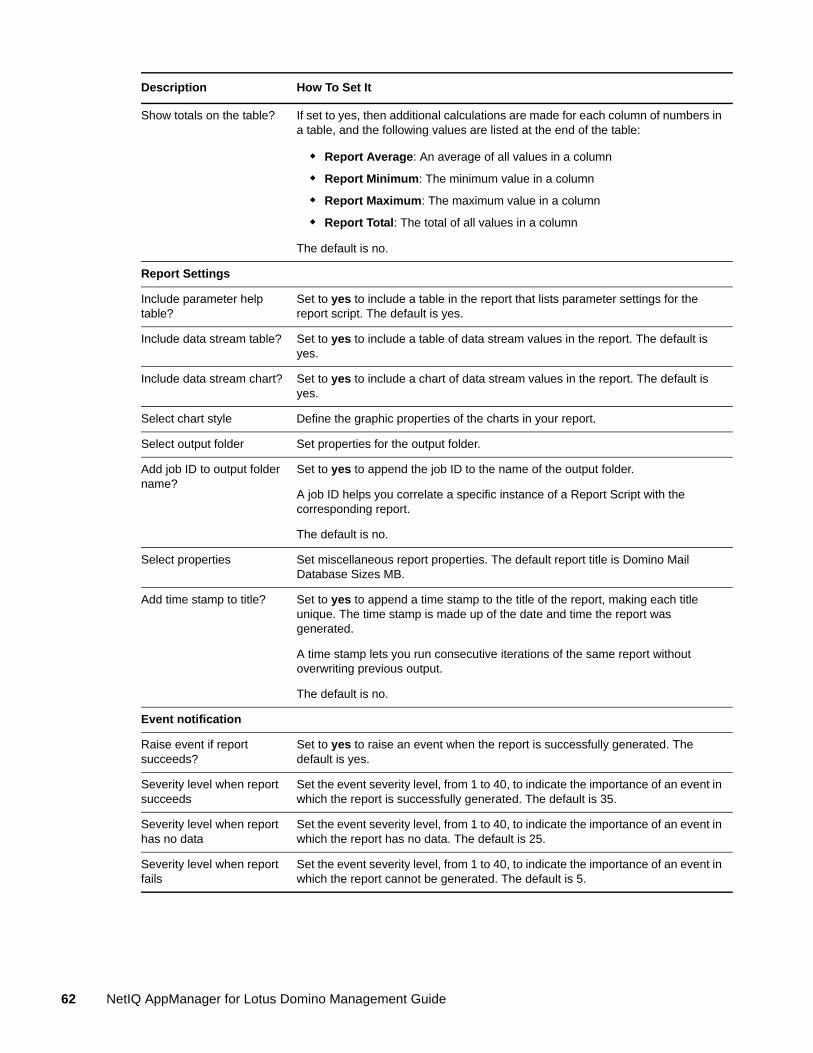
Show totals on the table? If set to yes, then additional calculations are made for each column of numbers in a table, and the following values are listed at the end of the table:
Report Average: An average of all values in a column
Report Minimum: The minimum value in a column
Report Maximum: The maximum value in a column
Report Total: The total of all values in a column
The default is no.
Report Settings
Include parameter help table?
Set to yes to include a table in the report that lists parameter settings for the report script. The default is yes.
Include data stream table? Set to yes to include a table of data stream values in the report. The default is yes.
Include data stream chart? Set to yes to include a chart of data stream values in the report. The default is yes.
Select chart style Define the graphic properties of the charts in your report.
Select output folder Set properties for the output folder.
Add job ID to output folder name?
Set to yes to append the job ID to the name of the output folder.
A job ID helps you correlate a specific instance of a Report Script with the corresponding report.
The default is no.
Select properties Set miscellaneous report properties. The default report title is Domino Mail Database Sizes MB.
Add time stamp to title? Set to yes to append a time stamp to the title of the report, making each title unique. The time stamp is made up of the date and time the report was generated.
A time stamp lets you run consecutive iterations of the same report without overwriting previous output.
The default is no.
Event notification
Raise event if report succeeds?
Set to yes to raise an event when the report is successfully generated. The default is yes.
Severity level when report succeeds
Set the event severity level, from 1 to 40, to indicate the importance of an event in which the report is successfully generated. The default is 35.
Severity level when report has no data
Set the event severity level, from 1 to 40, to indicate the importance of an event in which the report has no data. The default is 25.
Severity level when report fails
Set the event severity level, from 1 to 40, to indicate the importance of an event in which the report cannot be generated. The default is 5.
Description How To Set It
62 NetIQ AppManager for Lotus Domino Management Guide
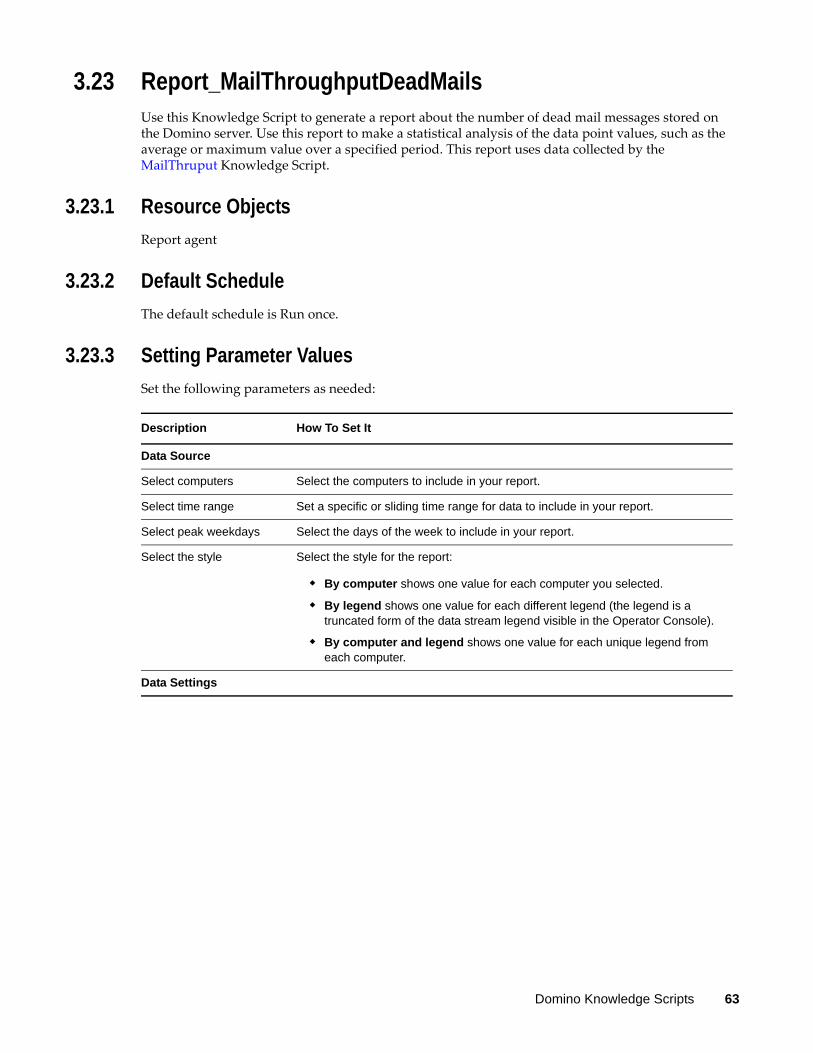
3.23 Report_MailThroughputDeadMailsUse this Knowledge Script to generate a report about the number of dead mail messages stored on the Domino server. Use this report to make a statistical analysis of the data point values, such as the average or maximum value over a specified period. This report uses data collected by the MailThruput Knowledge Script.
3.23.1 Resource Objects
Report agent
3.23.2 Default Schedule
The default schedule is Run once.
3.23.3 Setting Parameter Values
Set the following parameters as needed:
Description How To Set It
Data Source
Select computers Select the computers to include in your report.
Select time range Set a specific or sliding time range for data to include in your report.
Select peak weekdays Select the days of the week to include in your report.
Select the style Select the style for the report:
By computer shows one value for each computer you selected.
By legend shows one value for each different legend (the legend is a truncated form of the data stream legend visible in the Operator Console).
By computer and legend shows one value for each unique legend from each computer.
Data Settings
Domino Knowledge Scripts 63

Statistics to show Select a statistical method by which to display data in the report:
Average: The average value of data points for the period covered by the report
Minimum: The minimum value of data points for the period covered by the report
Maximum: The maximum value of data points for the period covered by the report
Min/Avg/Max: The minimum, average, and maximum values of data points for the period covered by the report
Range: The range of values in the data stream (maximum - minimum = range)
Standard Deviation: The measure of how widely values are dispersed from the mean
Sum: The total value of data points for the period covered by the report
Close: The last value for the period covered by the report
Change: The difference between the first and last values for the period covered by the report (close - open = change)
Count: The number of data points for the period covered by the report
Select sorting/display option
Select whether data is sorted, or the method of display:
No sort: Data is not sorted
Sort: Data is sorted by value (lowest to highest from front to back; highest to lowest from left to right)
Top %: Chart only the top N % of selected data (sorted by default)
Top N: Chart only the top N of selected data (sorted by default)
Bottom %: Chart only the bottom N % of data (sorted by default)
Bottom N: Chart only the bottom N of selected data (sorted by default)
Percentage/count for top/bottom
Specify a value for either the percentage or count defined in the previous parameter. For example, Top 10%, or Top 10.
The default is 25.
Truncate top/bottom? If set to yes, then the data table shows only the top or bottom N or %. For example, only the top 10%.
Otherwise, the table shows all data.
The default is no.
Show totals on the table? If set to yes, then additional calculations are made for each column of numbers in a table, and the following values are listed at the end of the table:
Report Average: An average of all values in a column
Report Minimum: The minimum value in a column
Report Maximum: The maximum value in a column
Report Total: The total of all values in a column
The default is no.
Description How To Set It
64 NetIQ AppManager for Lotus Domino Management Guide
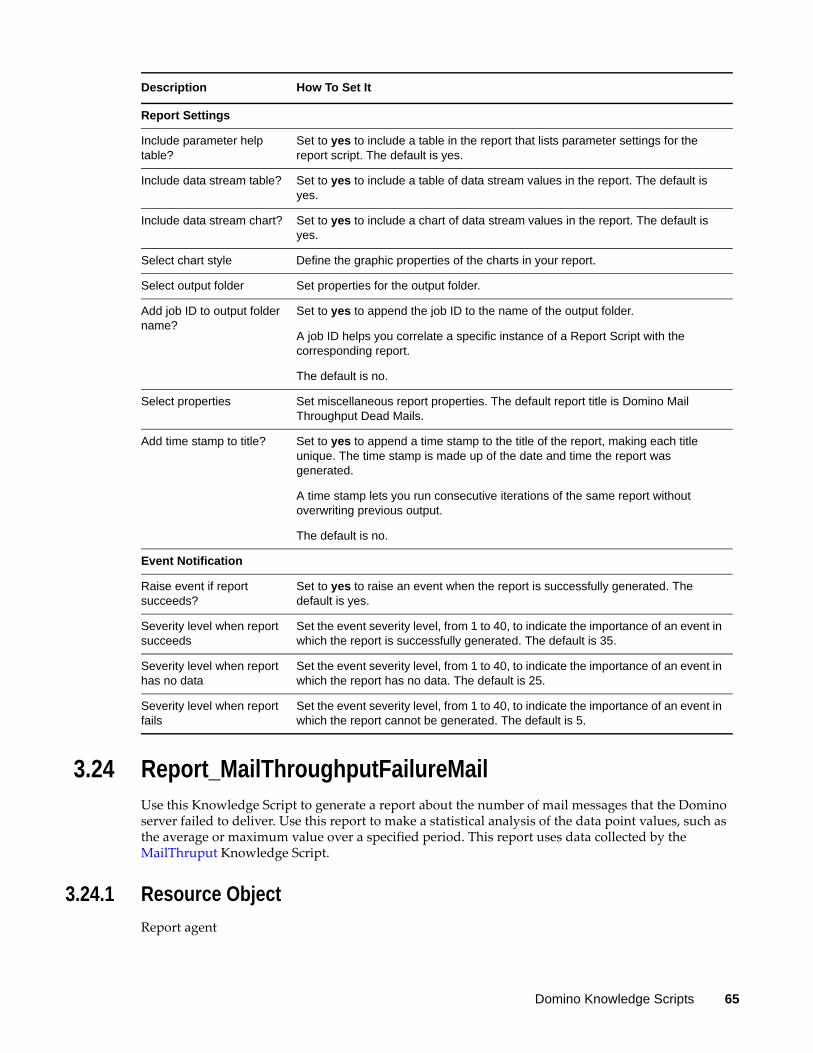
3.24 Report_MailThroughputFailureMailUse this Knowledge Script to generate a report about the number of mail messages that the Domino server failed to deliver. Use this report to make a statistical analysis of the data point values, such as the average or maximum value over a specified period. This report uses data collected by the MailThruput Knowledge Script.
3.24.1 Resource Object
Report agent
Report Settings
Include parameter help table?
Set to yes to include a table in the report that lists parameter settings for the report script. The default is yes.
Include data stream table? Set to yes to include a table of data stream values in the report. The default is yes.
Include data stream chart? Set to yes to include a chart of data stream values in the report. The default is yes.
Select chart style Define the graphic properties of the charts in your report.
Select output folder Set properties for the output folder.
Add job ID to output folder name?
Set to yes to append the job ID to the name of the output folder.
A job ID helps you correlate a specific instance of a Report Script with the corresponding report.
The default is no.
Select properties Set miscellaneous report properties. The default report title is Domino Mail Throughput Dead Mails.
Add time stamp to title? Set to yes to append a time stamp to the title of the report, making each title unique. The time stamp is made up of the date and time the report was generated.
A time stamp lets you run consecutive iterations of the same report without overwriting previous output.
The default is no.
Event Notification
Raise event if report succeeds?
Set to yes to raise an event when the report is successfully generated. The default is yes.
Severity level when report succeeds
Set the event severity level, from 1 to 40, to indicate the importance of an event in which the report is successfully generated. The default is 35.
Severity level when report has no data
Set the event severity level, from 1 to 40, to indicate the importance of an event in which the report has no data. The default is 25.
Severity level when report fails
Set the event severity level, from 1 to 40, to indicate the importance of an event in which the report cannot be generated. The default is 5.
Description How To Set It
Domino Knowledge Scripts 65
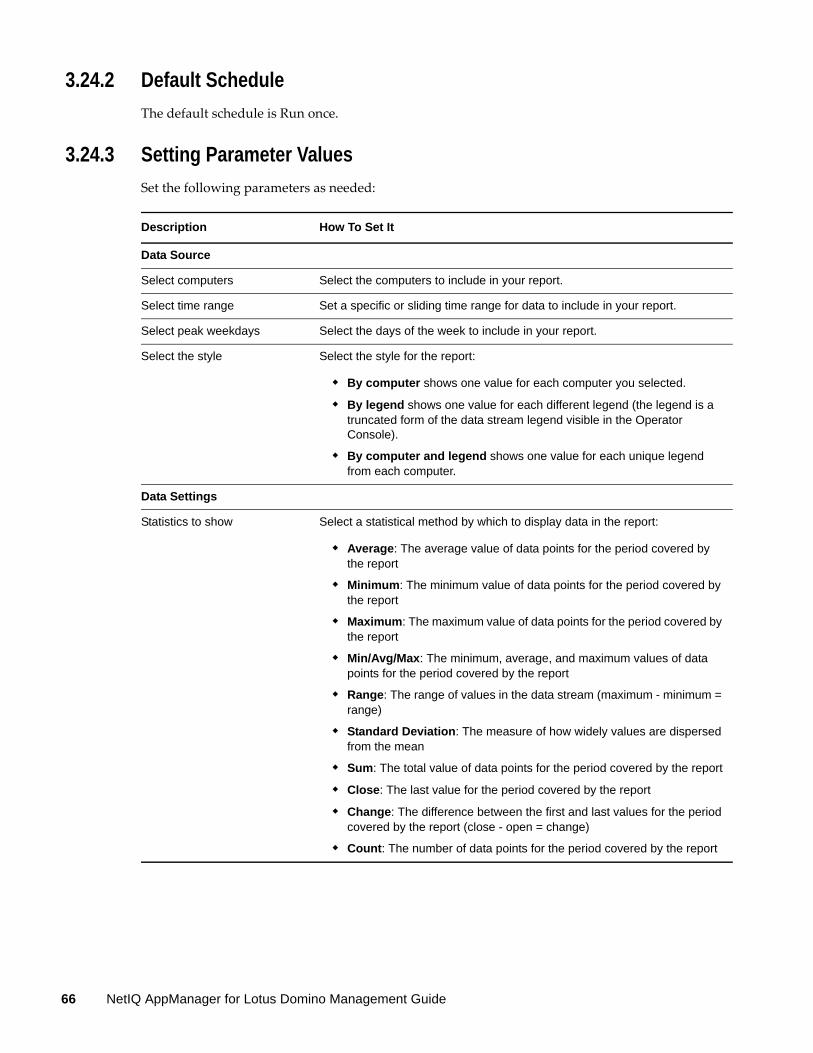
3.24.2 Default Schedule
The default schedule is Run once.
3.24.3 Setting Parameter Values
Set the following parameters as needed:
Description How To Set It
Data Source
Select computers Select the computers to include in your report.
Select time range Set a specific or sliding time range for data to include in your report.
Select peak weekdays Select the days of the week to include in your report.
Select the style Select the style for the report:
By computer shows one value for each computer you selected.
By legend shows one value for each different legend (the legend is a truncated form of the data stream legend visible in the Operator Console).
By computer and legend shows one value for each unique legend from each computer.
Data Settings
Statistics to show Select a statistical method by which to display data in the report:
Average: The average value of data points for the period covered by the report
Minimum: The minimum value of data points for the period covered by the report
Maximum: The maximum value of data points for the period covered by the report
Min/Avg/Max: The minimum, average, and maximum values of data points for the period covered by the report
Range: The range of values in the data stream (maximum - minimum = range)
Standard Deviation: The measure of how widely values are dispersed from the mean
Sum: The total value of data points for the period covered by the report
Close: The last value for the period covered by the report
Change: The difference between the first and last values for the period covered by the report (close - open = change)
Count: The number of data points for the period covered by the report
66 NetIQ AppManager for Lotus Domino Management Guide
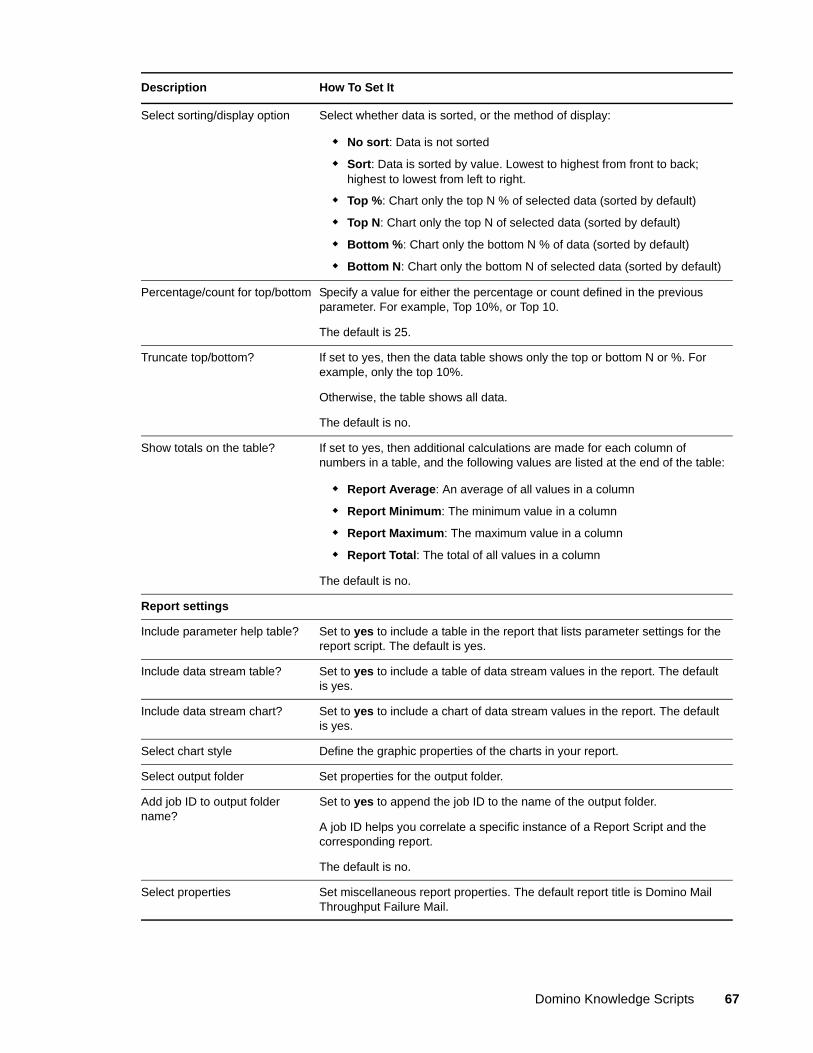
Select sorting/display option Select whether data is sorted, or the method of display:
No sort: Data is not sorted
Sort: Data is sorted by value. Lowest to highest from front to back; highest to lowest from left to right.
Top %: Chart only the top N % of selected data (sorted by default)
Top N: Chart only the top N of selected data (sorted by default)
Bottom %: Chart only the bottom N % of data (sorted by default)
Bottom N: Chart only the bottom N of selected data (sorted by default)
Percentage/count for top/bottom Specify a value for either the percentage or count defined in the previous parameter. For example, Top 10%, or Top 10.
The default is 25.
Truncate top/bottom? If set to yes, then the data table shows only the top or bottom N or %. For example, only the top 10%.
Otherwise, the table shows all data.
The default is no.
Show totals on the table? If set to yes, then additional calculations are made for each column of numbers in a table, and the following values are listed at the end of the table:
Report Average: An average of all values in a column
Report Minimum: The minimum value in a column
Report Maximum: The maximum value in a column
Report Total: The total of all values in a column
The default is no.
Report settings
Include parameter help table? Set to yes to include a table in the report that lists parameter settings for the report script. The default is yes.
Include data stream table? Set to yes to include a table of data stream values in the report. The default is yes.
Include data stream chart? Set to yes to include a chart of data stream values in the report. The default is yes.
Select chart style Define the graphic properties of the charts in your report.
Select output folder Set properties for the output folder.
Add job ID to output folder name?
Set to yes to append the job ID to the name of the output folder.
A job ID helps you correlate a specific instance of a Report Script and the corresponding report.
The default is no.
Select properties Set miscellaneous report properties. The default report title is Domino Mail Throughput Failure Mail.
Description How To Set It
Domino Knowledge Scripts 67
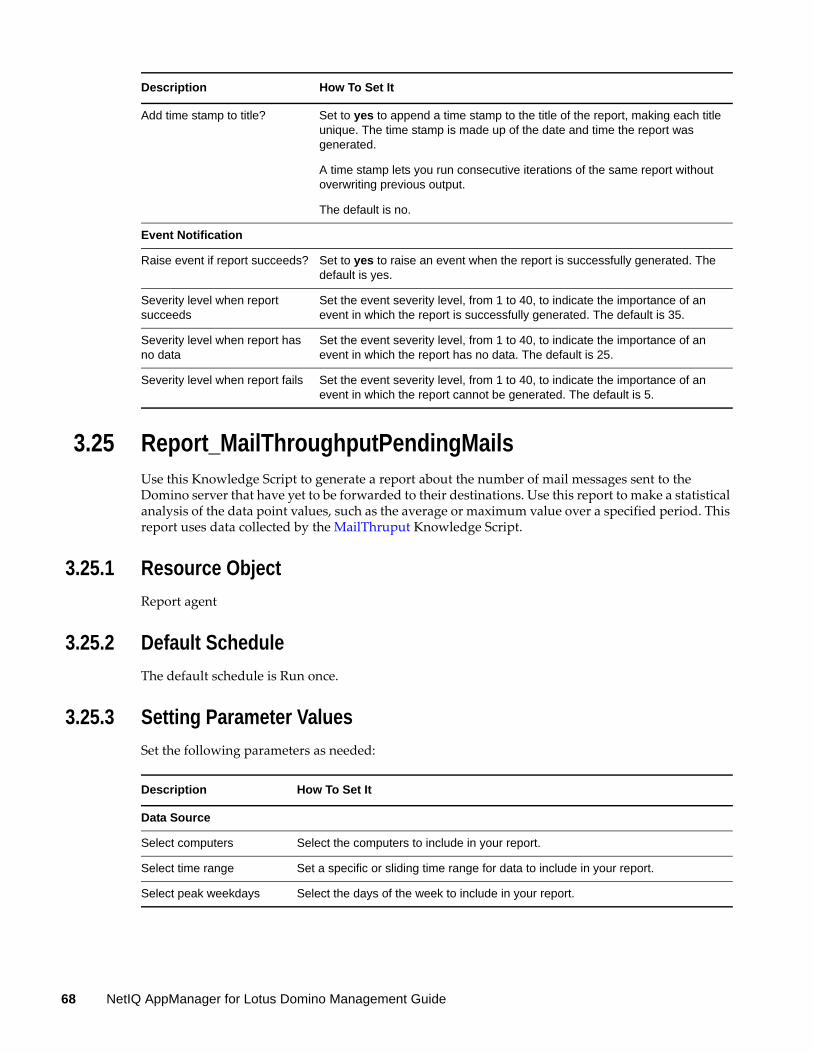
3.25 Report_MailThroughputPendingMailsUse this Knowledge Script to generate a report about the number of mail messages sent to the Domino server that have yet to be forwarded to their destinations. Use this report to make a statistical analysis of the data point values, such as the average or maximum value over a specified period. This report uses data collected by the MailThruput Knowledge Script.
3.25.1 Resource Object
Report agent
3.25.2 Default Schedule
The default schedule is Run once.
3.25.3 Setting Parameter Values
Set the following parameters as needed:
Add time stamp to title? Set to yes to append a time stamp to the title of the report, making each title unique. The time stamp is made up of the date and time the report was generated.
A time stamp lets you run consecutive iterations of the same report without overwriting previous output.
The default is no.
Event Notification
Raise event if report succeeds? Set to yes to raise an event when the report is successfully generated. The default is yes.
Severity level when report succeeds
Set the event severity level, from 1 to 40, to indicate the importance of an event in which the report is successfully generated. The default is 35.
Severity level when report has no data
Set the event severity level, from 1 to 40, to indicate the importance of an event in which the report has no data. The default is 25.
Severity level when report fails Set the event severity level, from 1 to 40, to indicate the importance of an event in which the report cannot be generated. The default is 5.
Description How To Set It
Description How To Set It
Data Source
Select computers Select the computers to include in your report.
Select time range Set a specific or sliding time range for data to include in your report.
Select peak weekdays Select the days of the week to include in your report.
68 NetIQ AppManager for Lotus Domino Management Guide
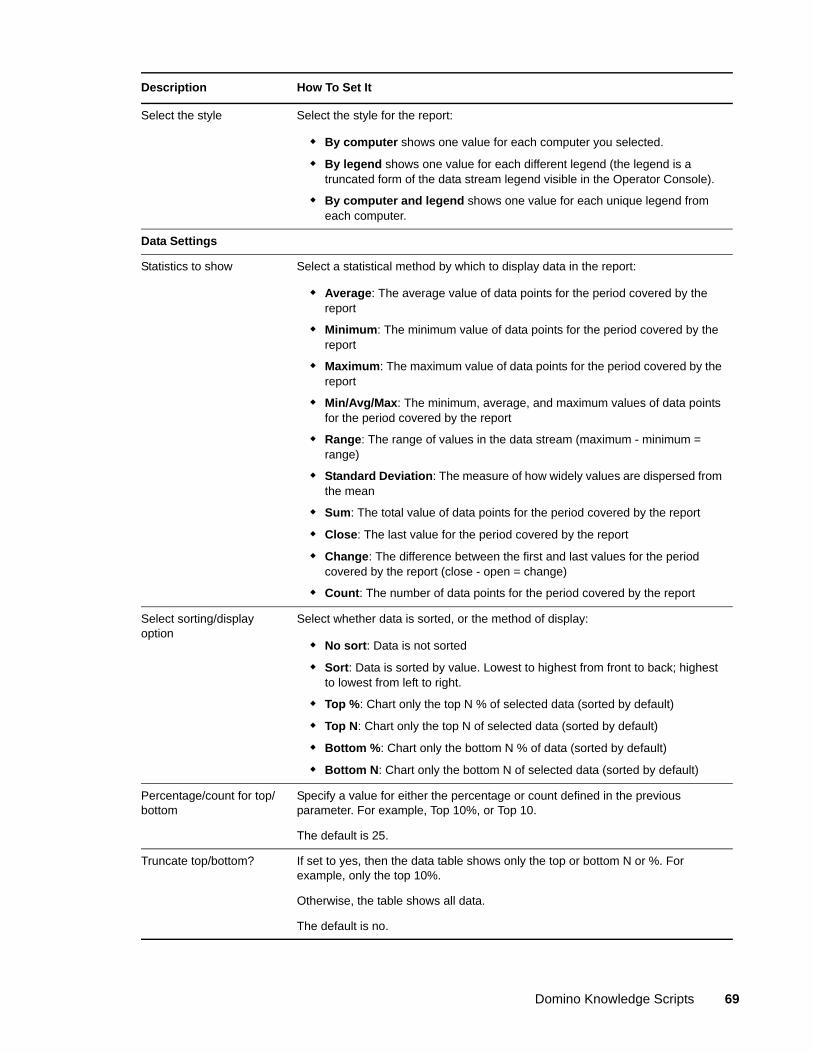
Select the style Select the style for the report:
By computer shows one value for each computer you selected.
By legend shows one value for each different legend (the legend is a truncated form of the data stream legend visible in the Operator Console).
By computer and legend shows one value for each unique legend from each computer.
Data Settings
Statistics to show Select a statistical method by which to display data in the report:
Average: The average value of data points for the period covered by the report
Minimum: The minimum value of data points for the period covered by the report
Maximum: The maximum value of data points for the period covered by the report
Min/Avg/Max: The minimum, average, and maximum values of data points for the period covered by the report
Range: The range of values in the data stream (maximum - minimum = range)
Standard Deviation: The measure of how widely values are dispersed from the mean
Sum: The total value of data points for the period covered by the report
Close: The last value for the period covered by the report
Change: The difference between the first and last values for the period covered by the report (close - open = change)
Count: The number of data points for the period covered by the report
Select sorting/display option
Select whether data is sorted, or the method of display:
No sort: Data is not sorted
Sort: Data is sorted by value. Lowest to highest from front to back; highest to lowest from left to right.
Top %: Chart only the top N % of selected data (sorted by default)
Top N: Chart only the top N of selected data (sorted by default)
Bottom %: Chart only the bottom N % of data (sorted by default)
Bottom N: Chart only the bottom N of selected data (sorted by default)
Percentage/count for top/bottom
Specify a value for either the percentage or count defined in the previous parameter. For example, Top 10%, or Top 10.
The default is 25.
Truncate top/bottom? If set to yes, then the data table shows only the top or bottom N or %. For example, only the top 10%.
Otherwise, the table shows all data.
The default is no.
Description How To Set It
Domino Knowledge Scripts 69
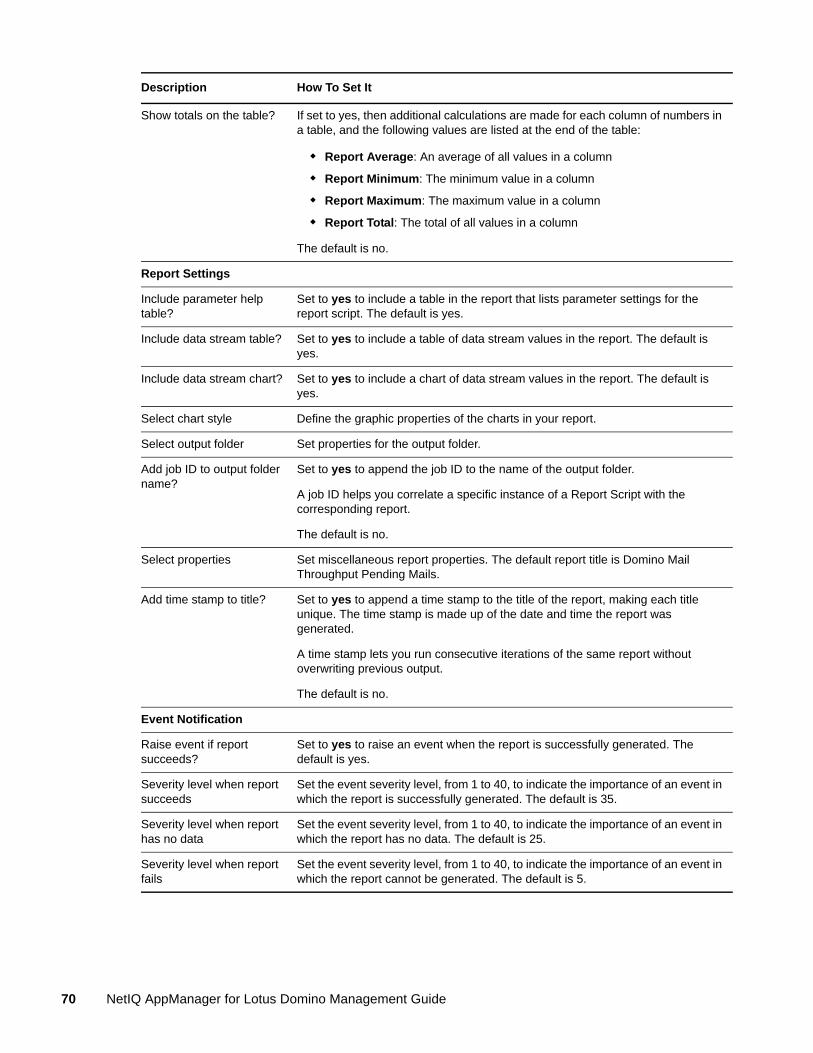
Show totals on the table? If set to yes, then additional calculations are made for each column of numbers in a table, and the following values are listed at the end of the table:
Report Average: An average of all values in a column
Report Minimum: The minimum value in a column
Report Maximum: The maximum value in a column
Report Total: The total of all values in a column
The default is no.
Report Settings
Include parameter help table?
Set to yes to include a table in the report that lists parameter settings for the report script. The default is yes.
Include data stream table? Set to yes to include a table of data stream values in the report. The default is yes.
Include data stream chart? Set to yes to include a chart of data stream values in the report. The default is yes.
Select chart style Define the graphic properties of the charts in your report.
Select output folder Set properties for the output folder.
Add job ID to output folder name?
Set to yes to append the job ID to the name of the output folder.
A job ID helps you correlate a specific instance of a Report Script with the corresponding report.
The default is no.
Select properties Set miscellaneous report properties. The default report title is Domino Mail Throughput Pending Mails.
Add time stamp to title? Set to yes to append a time stamp to the title of the report, making each title unique. The time stamp is made up of the date and time the report was generated.
A time stamp lets you run consecutive iterations of the same report without overwriting previous output.
The default is no.
Event Notification
Raise event if report succeeds?
Set to yes to raise an event when the report is successfully generated. The default is yes.
Severity level when report succeeds
Set the event severity level, from 1 to 40, to indicate the importance of an event in which the report is successfully generated. The default is 35.
Severity level when report has no data
Set the event severity level, from 1 to 40, to indicate the importance of an event in which the report has no data. The default is 25.
Severity level when report fails
Set the event severity level, from 1 to 40, to indicate the importance of an event in which the report cannot be generated. The default is 5.
Description How To Set It
70 NetIQ AppManager for Lotus Domino Management Guide

3.26 Report_MailThroughputRoutedMailUse this Knowledge Script to generate a report about the number of mail messages sent to remote servers and delivered to the local server. Use this report to make a statistical analysis of the data point values, such as the average or maximum value over a specified period. This report uses data collected by the MailThruput Knowledge Script.
3.26.1 Resource Object
Report agent
3.26.2 Default Schedule
The default schedule is Run once.
3.26.3 Setting Parameter Values
Set the following parameters as needed:
Description How To Set It
Data Source
Select computers Select the computers to include in your report.
Select time range Set a specific or sliding time range for data to include in your report.
Select peak weekdays Select the days of the week to include in your report.
Select the style Select the style for the report:
By computer shows one value for each computer you selected.
By legend shows one value for each different legend (the legend is a truncated form of the data stream legend visible in the Operator Console).
By computer and legend shows one value for each unique legend from each computer.
Data Settings
Domino Knowledge Scripts 71

Statistics to show Select a statistical method by which to display data in the report:
Average: The average value of data points for the period covered by the report
Minimum: The minimum value of data points for the period covered by the report
Maximum: The maximum value of data points for the period covered by the report
Min/Avg/Max: The minimum, average, and maximum values of data points for the period covered by the report
Range: The range of values in the data stream (maximum - minimum = range)
Standard Deviation: The measure of how widely values are dispersed from the mean
Sum: The total value of data points for the period covered by the report
Close: The last value for the period covered by the report
Change: The difference between the first and last values for the period covered by the report (close - open = change)
Count: The number of data points for the period covered by the report
Select sorting/display option
Select whether data is sorted, or the method of display:
No sort: Data is not sorted
Sort: Data is sorted by value. Lowest to highest from front to back; highest to lowest from left to right.
Top %: Chart only the top N % of selected data (sorted by default)
Top N: Chart only the top N of selected data (sorted by default)
Bottom %: Chart only the bottom N % of data (sorted by default)
Bottom N: Chart only the bottom N of selected data (sorted by default)
Percentage/count for top/bottom
Specify a value for either the percentage or count defined in the previous parameter. For example, Top 10%, or Top 10.
The default is 25.
Truncate top/bottom? If set to yes, then the data table shows only the top or bottom N or %. For example, only the top 10%.
Otherwise, the table shows all data.
The default is no.
Show totals on the table? If set to yes, then additional calculations are made for each column of numbers in a table, and the following values are listed at the end of the table:
Report Average: An average of all values in a column
Report Minimum: The minimum value in a column
Report Maximum: The maximum value in a column
Report Total: The total of all values in a column
The default is no.
Description How To Set It
72 NetIQ AppManager for Lotus Domino Management Guide
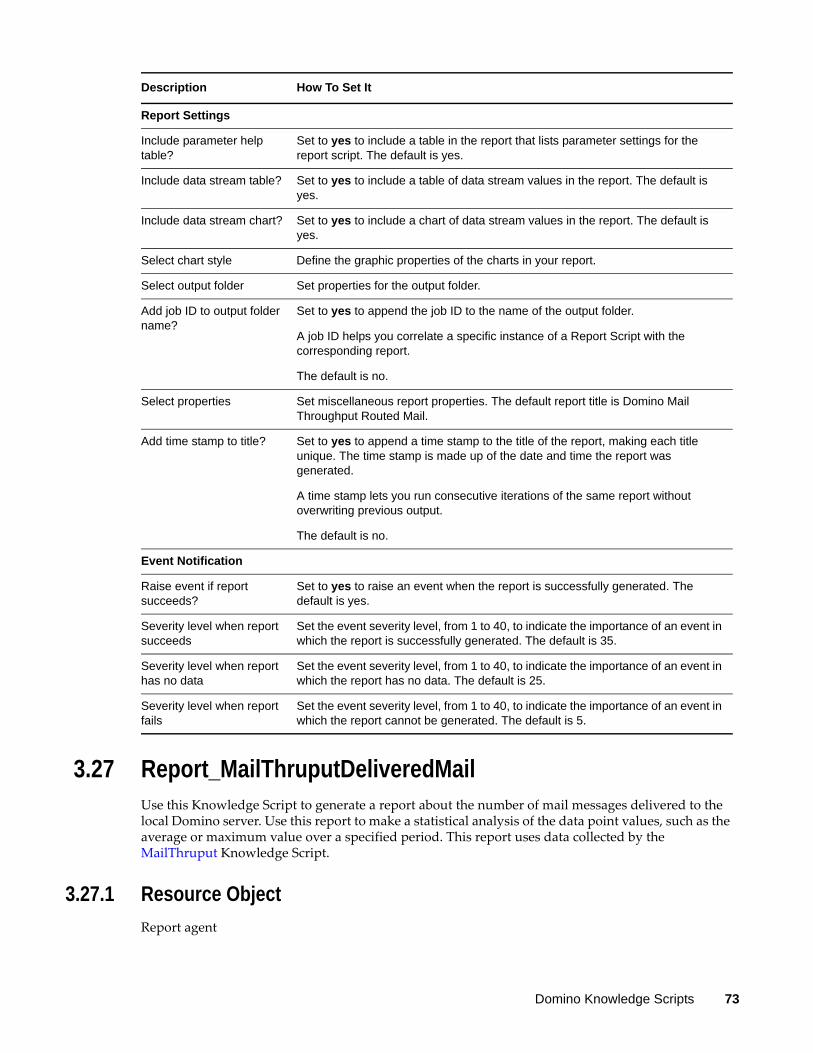
3.27 Report_MailThruputDeliveredMailUse this Knowledge Script to generate a report about the number of mail messages delivered to the local Domino server. Use this report to make a statistical analysis of the data point values, such as the average or maximum value over a specified period. This report uses data collected by the MailThruput Knowledge Script.
3.27.1 Resource Object
Report agent
Report Settings
Include parameter help table?
Set to yes to include a table in the report that lists parameter settings for the report script. The default is yes.
Include data stream table? Set to yes to include a table of data stream values in the report. The default is yes.
Include data stream chart? Set to yes to include a chart of data stream values in the report. The default is yes.
Select chart style Define the graphic properties of the charts in your report.
Select output folder Set properties for the output folder.
Add job ID to output folder name?
Set to yes to append the job ID to the name of the output folder.
A job ID helps you correlate a specific instance of a Report Script with the corresponding report.
The default is no.
Select properties Set miscellaneous report properties. The default report title is Domino Mail Throughput Routed Mail.
Add time stamp to title? Set to yes to append a time stamp to the title of the report, making each title unique. The time stamp is made up of the date and time the report was generated.
A time stamp lets you run consecutive iterations of the same report without overwriting previous output.
The default is no.
Event Notification
Raise event if report succeeds?
Set to yes to raise an event when the report is successfully generated. The default is yes.
Severity level when report succeeds
Set the event severity level, from 1 to 40, to indicate the importance of an event in which the report is successfully generated. The default is 35.
Severity level when report has no data
Set the event severity level, from 1 to 40, to indicate the importance of an event in which the report has no data. The default is 25.
Severity level when report fails
Set the event severity level, from 1 to 40, to indicate the importance of an event in which the report cannot be generated. The default is 5.
Description How To Set It
Domino Knowledge Scripts 73
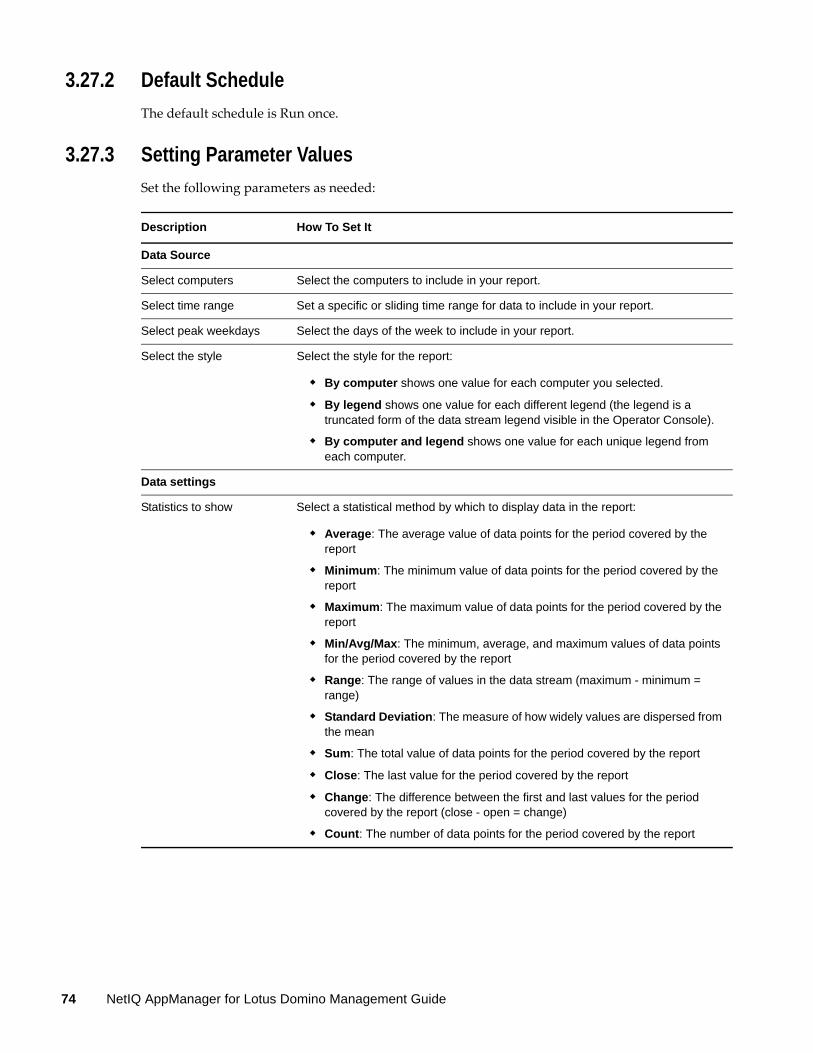
3.27.2 Default Schedule
The default schedule is Run once.
3.27.3 Setting Parameter Values
Set the following parameters as needed:
Description How To Set It
Data Source
Select computers Select the computers to include in your report.
Select time range Set a specific or sliding time range for data to include in your report.
Select peak weekdays Select the days of the week to include in your report.
Select the style Select the style for the report:
By computer shows one value for each computer you selected.
By legend shows one value for each different legend (the legend is a truncated form of the data stream legend visible in the Operator Console).
By computer and legend shows one value for each unique legend from each computer.
Data settings
Statistics to show Select a statistical method by which to display data in the report:
Average: The average value of data points for the period covered by the report
Minimum: The minimum value of data points for the period covered by the report
Maximum: The maximum value of data points for the period covered by the report
Min/Avg/Max: The minimum, average, and maximum values of data points for the period covered by the report
Range: The range of values in the data stream (maximum - minimum = range)
Standard Deviation: The measure of how widely values are dispersed from the mean
Sum: The total value of data points for the period covered by the report
Close: The last value for the period covered by the report
Change: The difference between the first and last values for the period covered by the report (close - open = change)
Count: The number of data points for the period covered by the report
74 NetIQ AppManager for Lotus Domino Management Guide
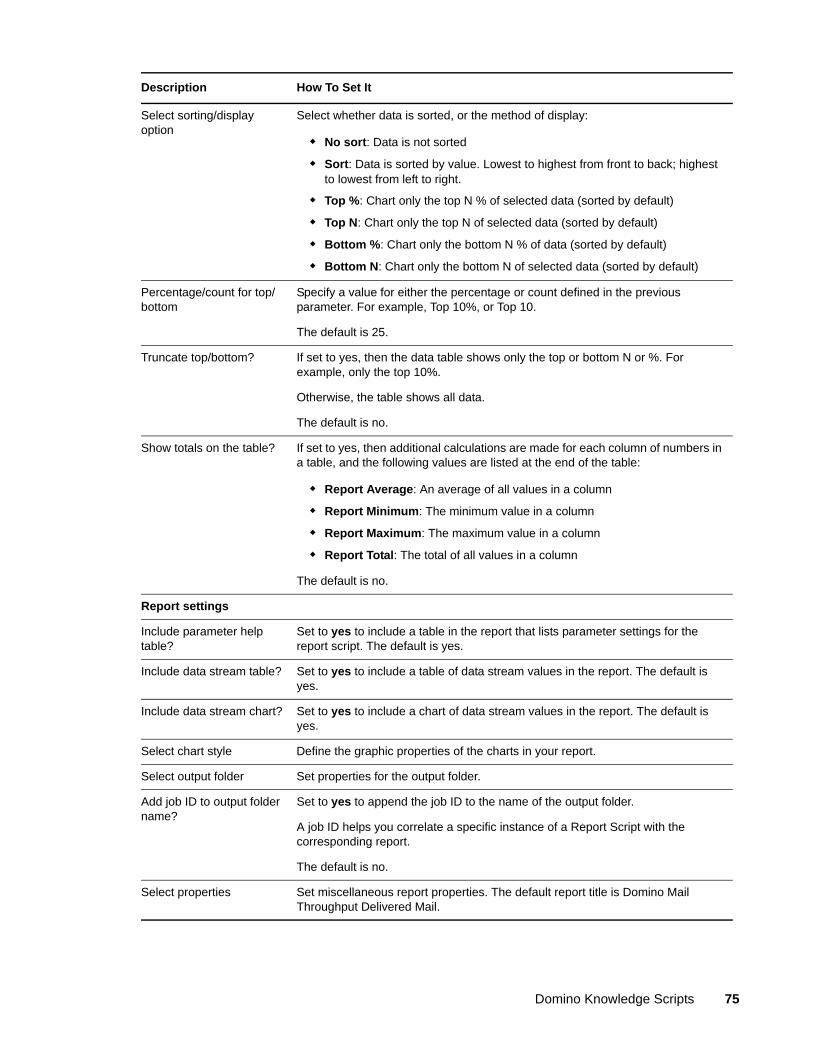
Select sorting/display option
Select whether data is sorted, or the method of display:
No sort: Data is not sorted
Sort: Data is sorted by value. Lowest to highest from front to back; highest to lowest from left to right.
Top %: Chart only the top N % of selected data (sorted by default)
Top N: Chart only the top N of selected data (sorted by default)
Bottom %: Chart only the bottom N % of data (sorted by default)
Bottom N: Chart only the bottom N of selected data (sorted by default)
Percentage/count for top/bottom
Specify a value for either the percentage or count defined in the previous parameter. For example, Top 10%, or Top 10.
The default is 25.
Truncate top/bottom? If set to yes, then the data table shows only the top or bottom N or %. For example, only the top 10%.
Otherwise, the table shows all data.
The default is no.
Show totals on the table? If set to yes, then additional calculations are made for each column of numbers in a table, and the following values are listed at the end of the table:
Report Average: An average of all values in a column
Report Minimum: The minimum value in a column
Report Maximum: The maximum value in a column
Report Total: The total of all values in a column
The default is no.
Report settings
Include parameter help table?
Set to yes to include a table in the report that lists parameter settings for the report script. The default is yes.
Include data stream table? Set to yes to include a table of data stream values in the report. The default is yes.
Include data stream chart? Set to yes to include a chart of data stream values in the report. The default is yes.
Select chart style Define the graphic properties of the charts in your report.
Select output folder Set properties for the output folder.
Add job ID to output folder name?
Set to yes to append the job ID to the name of the output folder.
A job ID helps you correlate a specific instance of a Report Script with the corresponding report.
The default is no.
Select properties Set miscellaneous report properties. The default report title is Domino Mail Throughput Delivered Mail.
Description How To Set It
Domino Knowledge Scripts 75

3.28 Report_ServerDownUse this Knowledge Script to generate a report about the availability of the Domino server. This report uses data collected by the ServerDown Knowledge Script.
3.28.1 Resource Object
Report agent
3.28.2 Default Schedule
The default schedule is Run once.
3.28.3 Setting Parameter Values
Set the following parameters as needed:
Add time stamp to title? Set to yes to append a time stamp to the title of the report, making each title unique. The time stamp is made up of the date and time the report was generated.
A time stamp lets you run consecutive iterations of the same report without overwriting previous output.
The default is no.
Event Notification
Raise event if report succeeds?
Set to yes to raise an event when the report is successfully generated. The default is yes.
Severity level when report succeeds
Set the event severity level, from 1 to 40, to indicate the importance of an event in which the report is successfully generated. The default is 35.
Severity level when report has no data
Set the event severity level, from 1 to 40, to indicate the importance of an event in which the report has no data. The default is 25.
Severity level when report fails
Set the event severity level, from 1 to 40, to indicate the importance of an event in which the report cannot be generated. The default is 5.
Description How To Set It
Description How To Set It
Data Source
Select computers Select the computers to include in your report.
Select time range Set a specific or sliding time range for data to include in your report.
Select peak weekdays Select the days of the week to include in your report.
Data Settings
Hours or percentage on chart
Select whether to illustrate availability by number of hours or by percentage.
76 NetIQ AppManager for Lotus Domino Management Guide
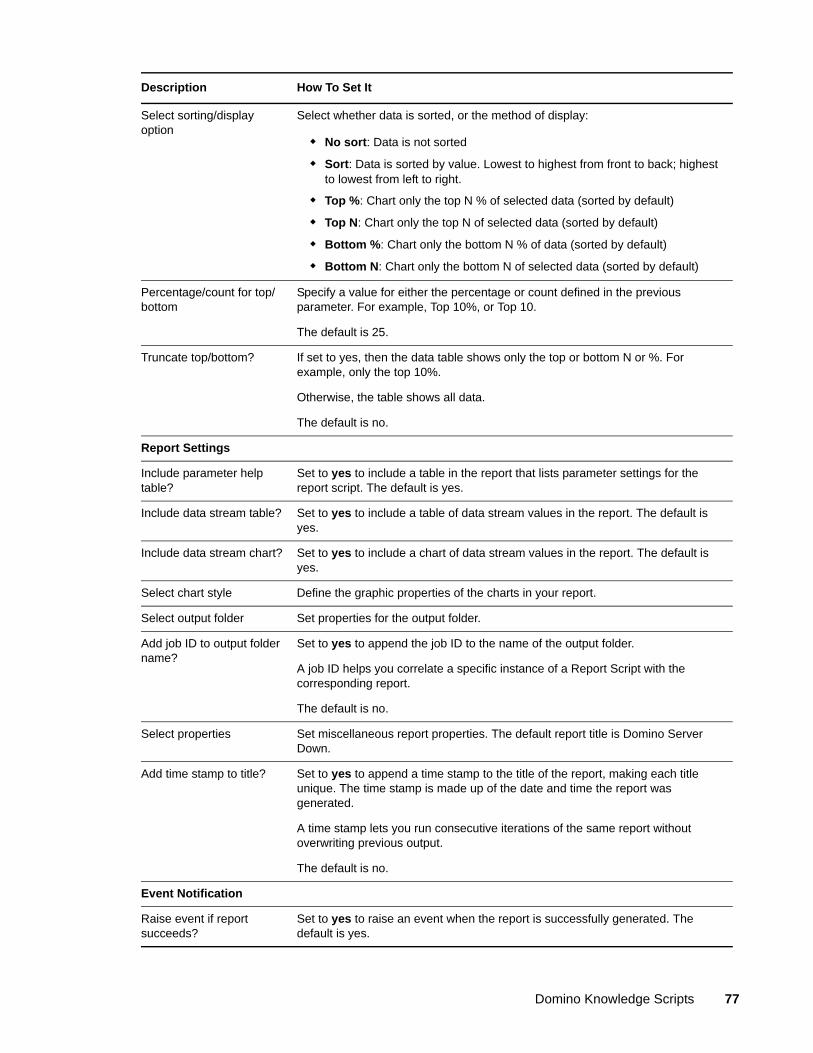
Select sorting/display option
Select whether data is sorted, or the method of display:
No sort: Data is not sorted
Sort: Data is sorted by value. Lowest to highest from front to back; highest to lowest from left to right.
Top %: Chart only the top N % of selected data (sorted by default)
Top N: Chart only the top N of selected data (sorted by default)
Bottom %: Chart only the bottom N % of data (sorted by default)
Bottom N: Chart only the bottom N of selected data (sorted by default)
Percentage/count for top/bottom
Specify a value for either the percentage or count defined in the previous parameter. For example, Top 10%, or Top 10.
The default is 25.
Truncate top/bottom? If set to yes, then the data table shows only the top or bottom N or %. For example, only the top 10%.
Otherwise, the table shows all data.
The default is no.
Report Settings
Include parameter help table?
Set to yes to include a table in the report that lists parameter settings for the report script. The default is yes.
Include data stream table? Set to yes to include a table of data stream values in the report. The default is yes.
Include data stream chart? Set to yes to include a chart of data stream values in the report. The default is yes.
Select chart style Define the graphic properties of the charts in your report.
Select output folder Set properties for the output folder.
Add job ID to output folder name?
Set to yes to append the job ID to the name of the output folder.
A job ID helps you correlate a specific instance of a Report Script with the corresponding report.
The default is no.
Select properties Set miscellaneous report properties. The default report title is Domino Server Down.
Add time stamp to title? Set to yes to append a time stamp to the title of the report, making each title unique. The time stamp is made up of the date and time the report was generated.
A time stamp lets you run consecutive iterations of the same report without overwriting previous output.
The default is no.
Event Notification
Raise event if report succeeds?
Set to yes to raise an event when the report is successfully generated. The default is yes.
Description How To Set It
Domino Knowledge Scripts 77
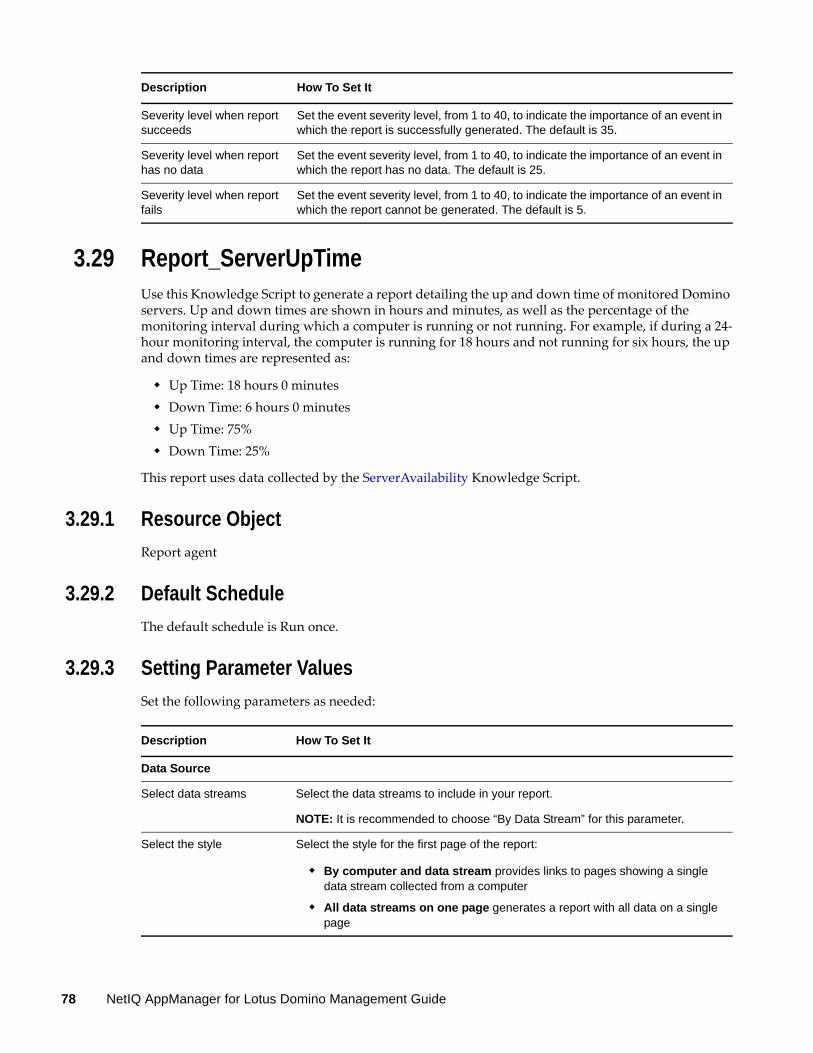
3.29 Report_ServerUpTimeUse this Knowledge Script to generate a report detailing the up and down time of monitored Domino servers. Up and down times are shown in hours and minutes, as well as the percentage of the monitoring interval during which a computer is running or not running. For example, if during a 24-hour monitoring interval, the computer is running for 18 hours and not running for six hours, the up and down times are represented as:
Up Time: 18 hours 0 minutes Down Time: 6 hours 0 minutes Up Time: 75% Down Time: 25%
This report uses data collected by the ServerAvailability Knowledge Script.
3.29.1 Resource Object
Report agent
3.29.2 Default Schedule
The default schedule is Run once.
3.29.3 Setting Parameter Values
Set the following parameters as needed:
Severity level when report succeeds
Set the event severity level, from 1 to 40, to indicate the importance of an event in which the report is successfully generated. The default is 35.
Severity level when report has no data
Set the event severity level, from 1 to 40, to indicate the importance of an event in which the report has no data. The default is 25.
Severity level when report fails
Set the event severity level, from 1 to 40, to indicate the importance of an event in which the report cannot be generated. The default is 5.
Description How To Set It
Description How To Set It
Data Source
Select data streams Select the data streams to include in your report.
NOTE: It is recommended to choose “By Data Stream” for this parameter.
Select the style Select the style for the first page of the report:
By computer and data stream provides links to pages showing a single data stream collected from a computer
All data streams on one page generates a report with all data on a single page
78 NetIQ AppManager for Lotus Domino Management Guide
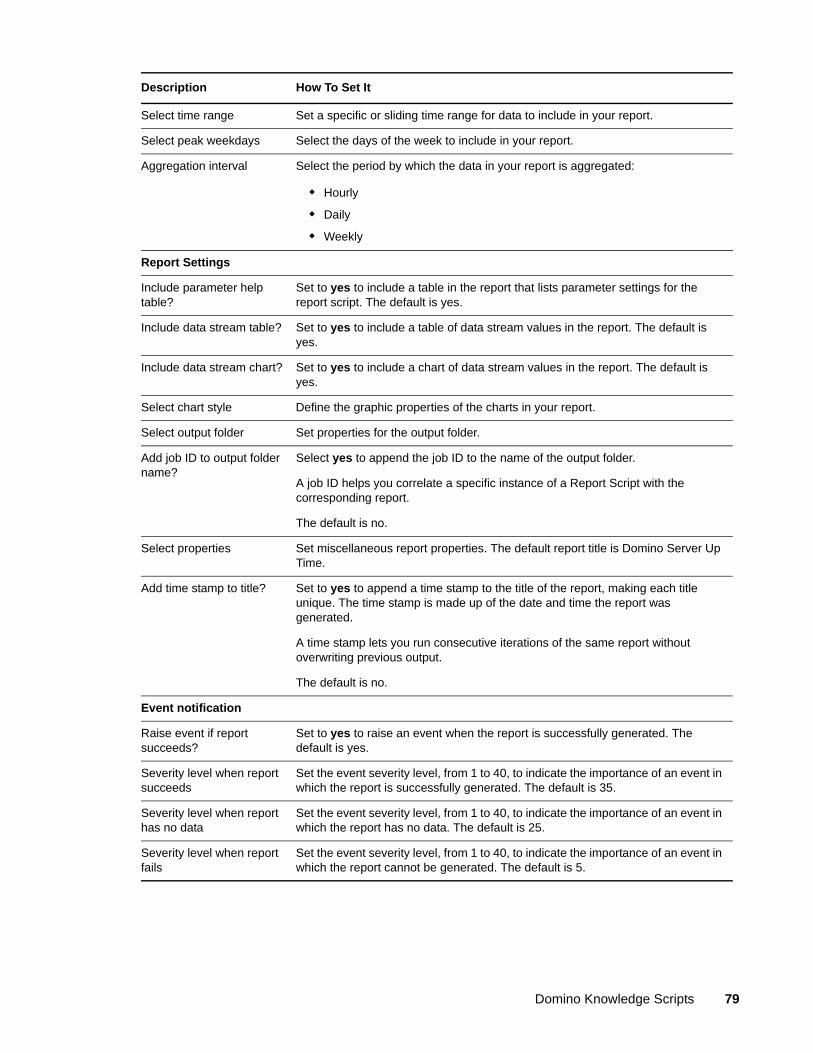
Select time range Set a specific or sliding time range for data to include in your report.
Select peak weekdays Select the days of the week to include in your report.
Aggregation interval Select the period by which the data in your report is aggregated:
Hourly
Daily
Weekly
Report Settings
Include parameter help table?
Set to yes to include a table in the report that lists parameter settings for the report script. The default is yes.
Include data stream table? Set to yes to include a table of data stream values in the report. The default is yes.
Include data stream chart? Set to yes to include a chart of data stream values in the report. The default is yes.
Select chart style Define the graphic properties of the charts in your report.
Select output folder Set properties for the output folder.
Add job ID to output folder name?
Select yes to append the job ID to the name of the output folder.
A job ID helps you correlate a specific instance of a Report Script with the corresponding report.
The default is no.
Select properties Set miscellaneous report properties. The default report title is Domino Server Up Time.
Add time stamp to title? Set to yes to append a time stamp to the title of the report, making each title unique. The time stamp is made up of the date and time the report was generated.
A time stamp lets you run consecutive iterations of the same report without overwriting previous output.
The default is no.
Event notification
Raise event if report succeeds?
Set to yes to raise an event when the report is successfully generated. The default is yes.
Severity level when report succeeds
Set the event severity level, from 1 to 40, to indicate the importance of an event in which the report is successfully generated. The default is 35.
Severity level when report has no data
Set the event severity level, from 1 to 40, to indicate the importance of an event in which the report has no data. The default is 25.
Severity level when report fails
Set the event severity level, from 1 to 40, to indicate the importance of an event in which the report cannot be generated. The default is 5.
Description How To Set It
Domino Knowledge Scripts 79
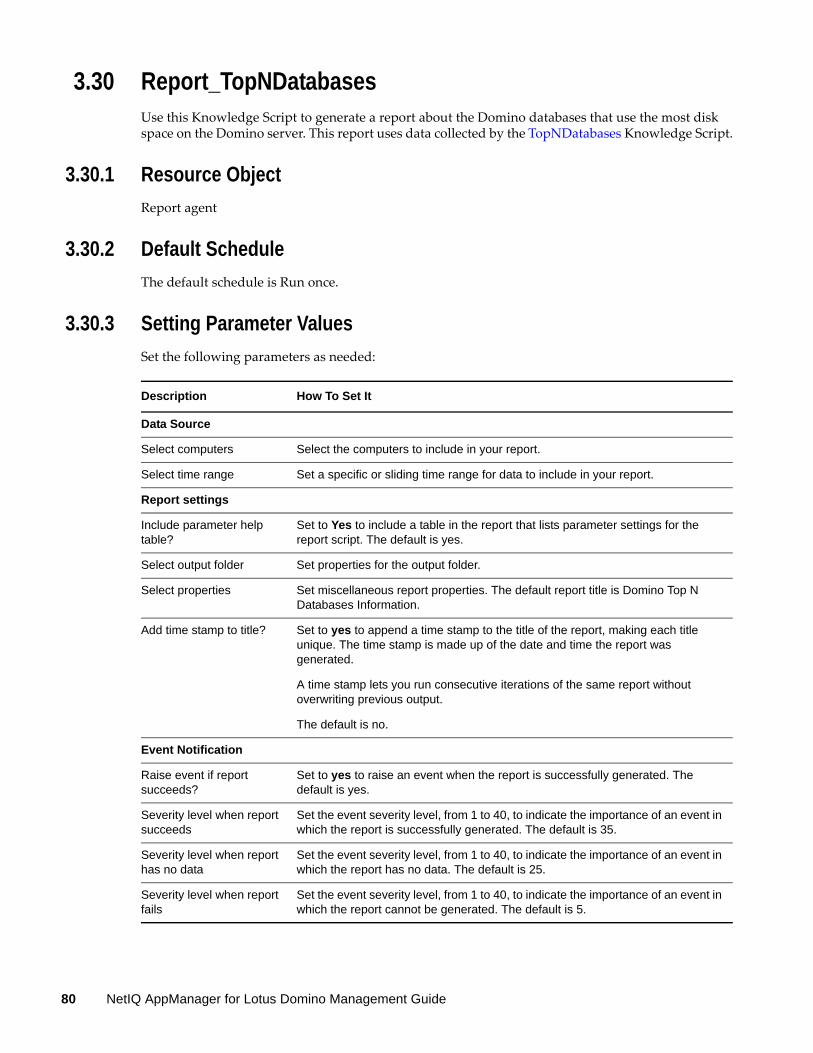
3.30 Report_TopNDatabasesUse this Knowledge Script to generate a report about the Domino databases that use the most disk space on the Domino server. This report uses data collected by the TopNDatabases Knowledge Script.
3.30.1 Resource Object
Report agent
3.30.2 Default Schedule
The default schedule is Run once.
3.30.3 Setting Parameter Values
Set the following parameters as needed:
Description How To Set It
Data Source
Select computers Select the computers to include in your report.
Select time range Set a specific or sliding time range for data to include in your report.
Report settings
Include parameter help table?
Set to Yes to include a table in the report that lists parameter settings for the report script. The default is yes.
Select output folder Set properties for the output folder.
Select properties Set miscellaneous report properties. The default report title is Domino Top N Databases Information.
Add time stamp to title? Set to yes to append a time stamp to the title of the report, making each title unique. The time stamp is made up of the date and time the report was generated.
A time stamp lets you run consecutive iterations of the same report without overwriting previous output.
The default is no.
Event Notification
Raise event if report succeeds?
Set to yes to raise an event when the report is successfully generated. The default is yes.
Severity level when report succeeds
Set the event severity level, from 1 to 40, to indicate the importance of an event in which the report is successfully generated. The default is 35.
Severity level when report has no data
Set the event severity level, from 1 to 40, to indicate the importance of an event in which the report has no data. The default is 25.
Severity level when report fails
Set the event severity level, from 1 to 40, to indicate the importance of an event in which the report cannot be generated. The default is 5.
80 NetIQ AppManager for Lotus Domino Management Guide
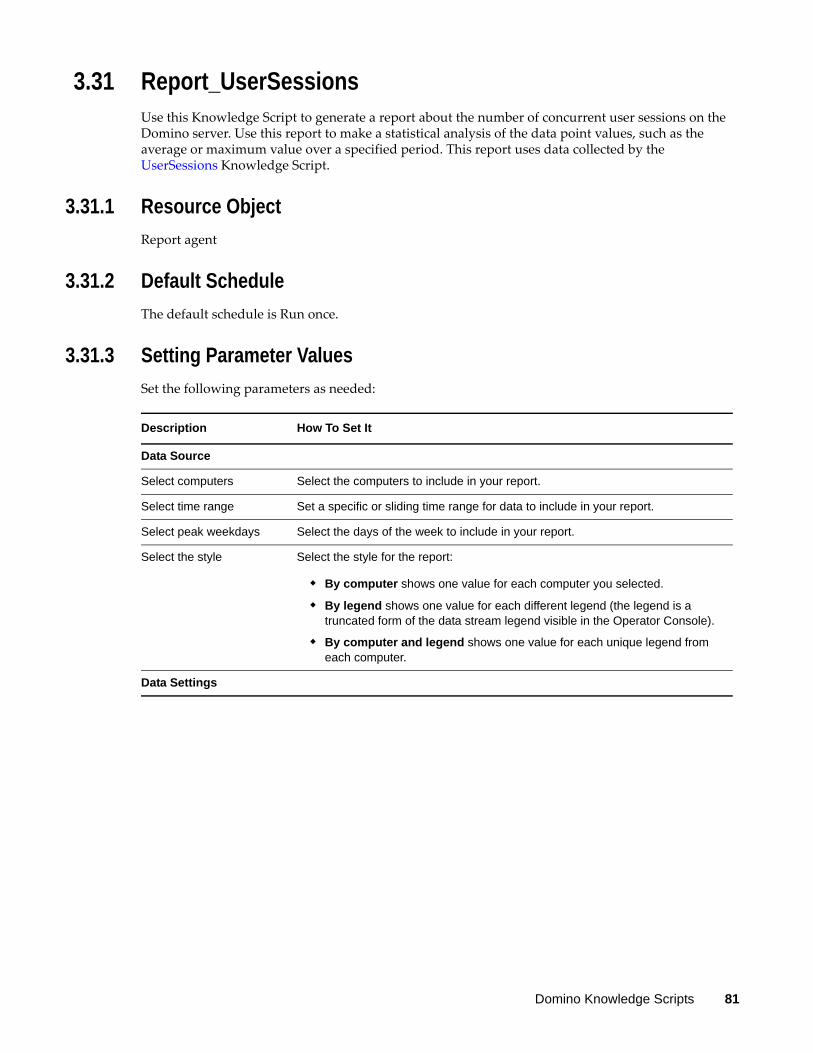
3.31 Report_UserSessionsUse this Knowledge Script to generate a report about the number of concurrent user sessions on the Domino server. Use this report to make a statistical analysis of the data point values, such as the average or maximum value over a specified period. This report uses data collected by the UserSessions Knowledge Script.
3.31.1 Resource Object
Report agent
3.31.2 Default Schedule
The default schedule is Run once.
3.31.3 Setting Parameter Values
Set the following parameters as needed:
Description How To Set It
Data Source
Select computers Select the computers to include in your report.
Select time range Set a specific or sliding time range for data to include in your report.
Select peak weekdays Select the days of the week to include in your report.
Select the style Select the style for the report:
By computer shows one value for each computer you selected.
By legend shows one value for each different legend (the legend is a truncated form of the data stream legend visible in the Operator Console).
By computer and legend shows one value for each unique legend from each computer.
Data Settings
Domino Knowledge Scripts 81
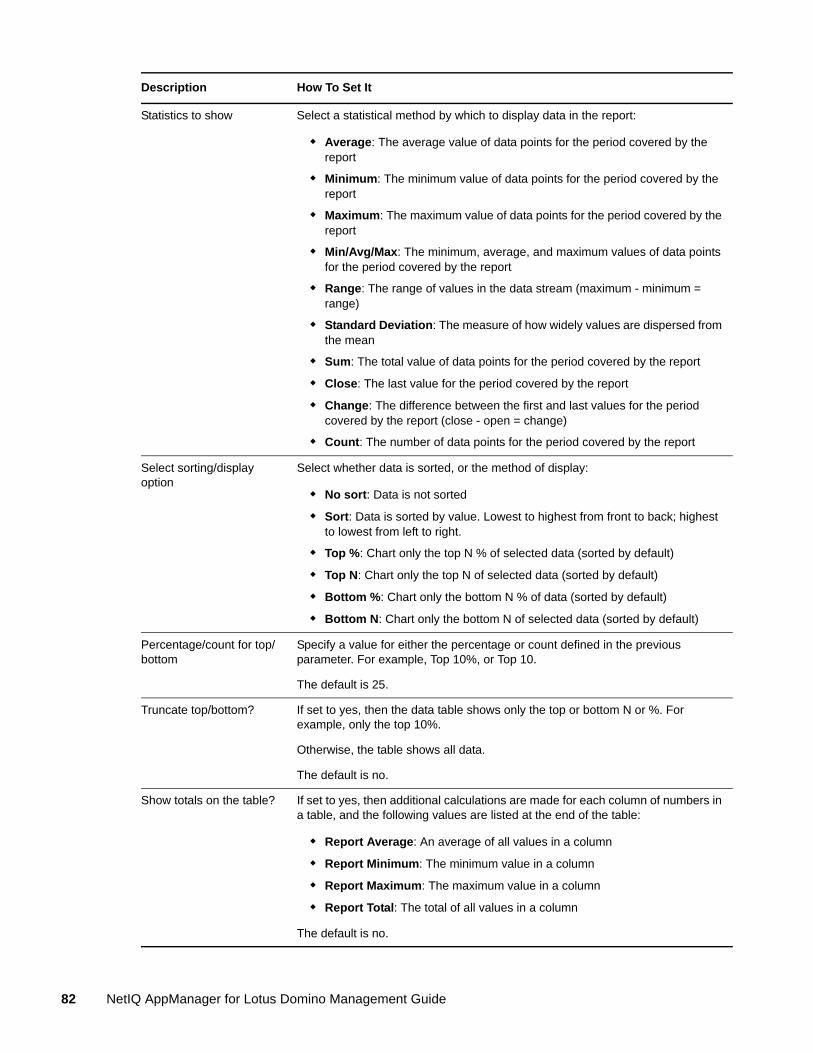
Statistics to show Select a statistical method by which to display data in the report:
Average: The average value of data points for the period covered by the report
Minimum: The minimum value of data points for the period covered by the report
Maximum: The maximum value of data points for the period covered by the report
Min/Avg/Max: The minimum, average, and maximum values of data points for the period covered by the report
Range: The range of values in the data stream (maximum - minimum = range)
Standard Deviation: The measure of how widely values are dispersed from the mean
Sum: The total value of data points for the period covered by the report
Close: The last value for the period covered by the report
Change: The difference between the first and last values for the period covered by the report (close - open = change)
Count: The number of data points for the period covered by the report
Select sorting/display option
Select whether data is sorted, or the method of display:
No sort: Data is not sorted
Sort: Data is sorted by value. Lowest to highest from front to back; highest to lowest from left to right.
Top %: Chart only the top N % of selected data (sorted by default)
Top N: Chart only the top N of selected data (sorted by default)
Bottom %: Chart only the bottom N % of data (sorted by default)
Bottom N: Chart only the bottom N of selected data (sorted by default)
Percentage/count for top/bottom
Specify a value for either the percentage or count defined in the previous parameter. For example, Top 10%, or Top 10.
The default is 25.
Truncate top/bottom? If set to yes, then the data table shows only the top or bottom N or %. For example, only the top 10%.
Otherwise, the table shows all data.
The default is no.
Show totals on the table? If set to yes, then additional calculations are made for each column of numbers in a table, and the following values are listed at the end of the table:
Report Average: An average of all values in a column
Report Minimum: The minimum value in a column
Report Maximum: The maximum value in a column
Report Total: The total of all values in a column
The default is no.
Description How To Set It
82 NetIQ AppManager for Lotus Domino Management Guide
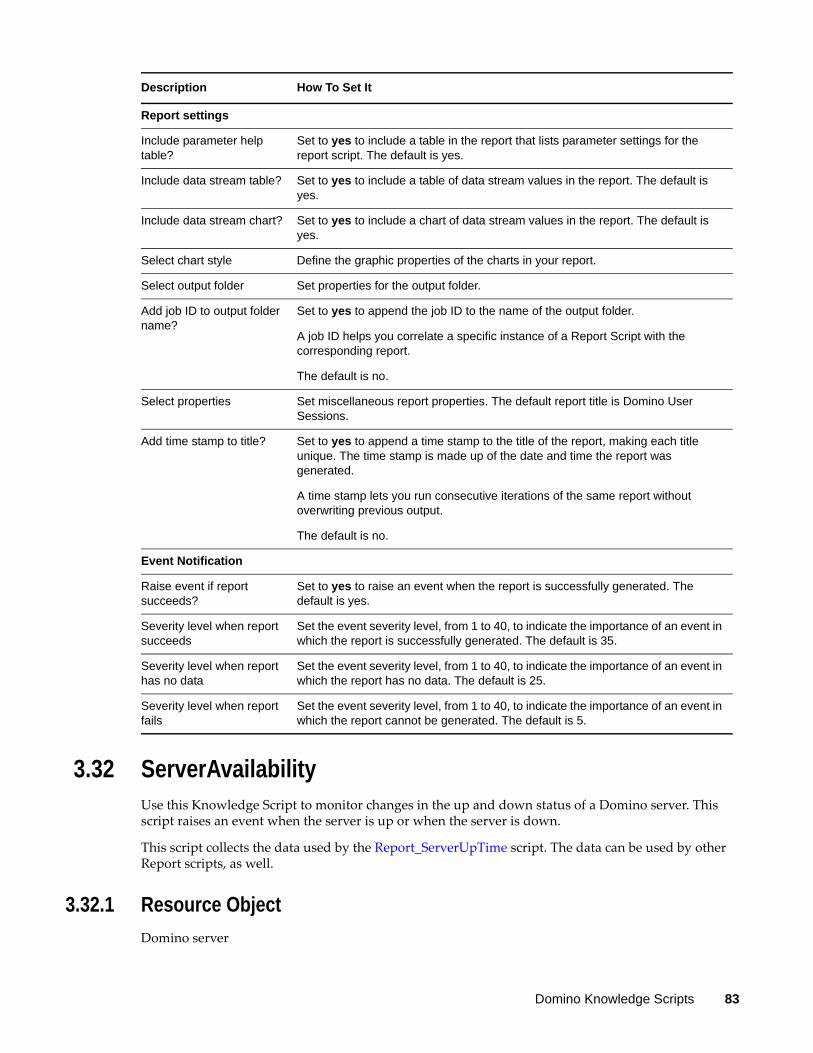
3.32 ServerAvailabilityUse this Knowledge Script to monitor changes in the up and down status of a Domino server. This script raises an event when the server is up or when the server is down.
This script collects the data used by the Report_ServerUpTime script. The data can be used by other Report scripts, as well.
3.32.1 Resource Object
Domino server
Report settings
Include parameter help table?
Set to yes to include a table in the report that lists parameter settings for the report script. The default is yes.
Include data stream table? Set to yes to include a table of data stream values in the report. The default is yes.
Include data stream chart? Set to yes to include a chart of data stream values in the report. The default is yes.
Select chart style Define the graphic properties of the charts in your report.
Select output folder Set properties for the output folder.
Add job ID to output folder name?
Set to yes to append the job ID to the name of the output folder.
A job ID helps you correlate a specific instance of a Report Script with the corresponding report.
The default is no.
Select properties Set miscellaneous report properties. The default report title is Domino User Sessions.
Add time stamp to title? Set to yes to append a time stamp to the title of the report, making each title unique. The time stamp is made up of the date and time the report was generated.
A time stamp lets you run consecutive iterations of the same report without overwriting previous output.
The default is no.
Event Notification
Raise event if report succeeds?
Set to yes to raise an event when the report is successfully generated. The default is yes.
Severity level when report succeeds
Set the event severity level, from 1 to 40, to indicate the importance of an event in which the report is successfully generated. The default is 35.
Severity level when report has no data
Set the event severity level, from 1 to 40, to indicate the importance of an event in which the report has no data. The default is 25.
Severity level when report fails
Set the event severity level, from 1 to 40, to indicate the importance of an event in which the report cannot be generated. The default is 5.
Description How To Set It
Domino Knowledge Scripts 83
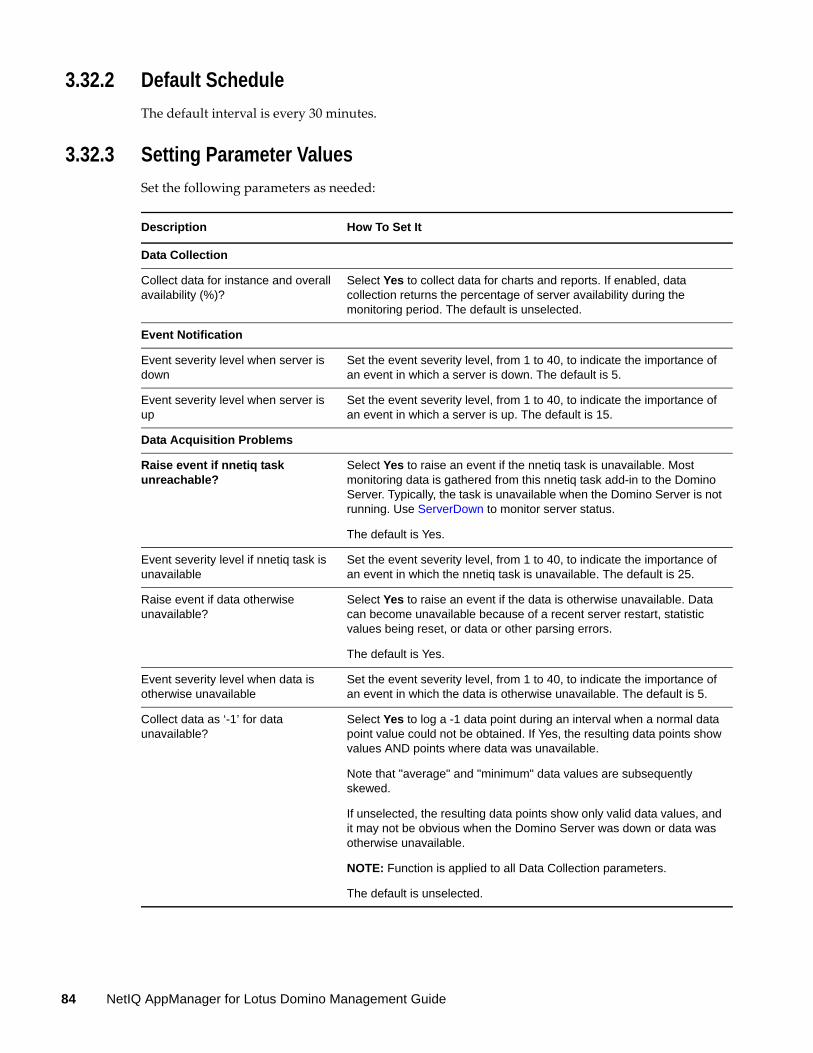
3.32.2 Default Schedule
The default interval is every 30 minutes.
3.32.3 Setting Parameter Values
Set the following parameters as needed:
Description How To Set It
Data Collection
Collect data for instance and overall availability (%)?
Select Yes to collect data for charts and reports. If enabled, data collection returns the percentage of server availability during the monitoring period. The default is unselected.
Event Notification
Event severity level when server is down
Set the event severity level, from 1 to 40, to indicate the importance of an event in which a server is down. The default is 5.
Event severity level when server is up
Set the event severity level, from 1 to 40, to indicate the importance of an event in which a server is up. The default is 15.
Data Acquisition Problems
Raise event if nnetiq task unreachable?
Select Yes to raise an event if the nnetiq task is unavailable. Most monitoring data is gathered from this nnetiq task add-in to the Domino Server. Typically, the task is unavailable when the Domino Server is not running. Use ServerDown to monitor server status.
The default is Yes.
Event severity level if nnetiq task is unavailable
Set the event severity level, from 1 to 40, to indicate the importance of an event in which the nnetiq task is unavailable. The default is 25.
Raise event if data otherwise unavailable?
Select Yes to raise an event if the data is otherwise unavailable. Data can become unavailable because of a recent server restart, statistic values being reset, or data or other parsing errors.
The default is Yes.
Event severity level when data is otherwise unavailable
Set the event severity level, from 1 to 40, to indicate the importance of an event in which the data is otherwise unavailable. The default is 5.
Collect data as ‘-1’ for data unavailable?
Select Yes to log a -1 data point during an interval when a normal data point value could not be obtained. If Yes, the resulting data points show values AND points where data was unavailable.
Note that "average" and "minimum" data values are subsequently skewed.
If unselected, the resulting data points show only valid data values, and it may not be obvious when the Domino Server was down or data was otherwise unavailable.
NOTE: Function is applied to all Data Collection parameters.
The default is unselected.
84 NetIQ AppManager for Lotus Domino Management Guide
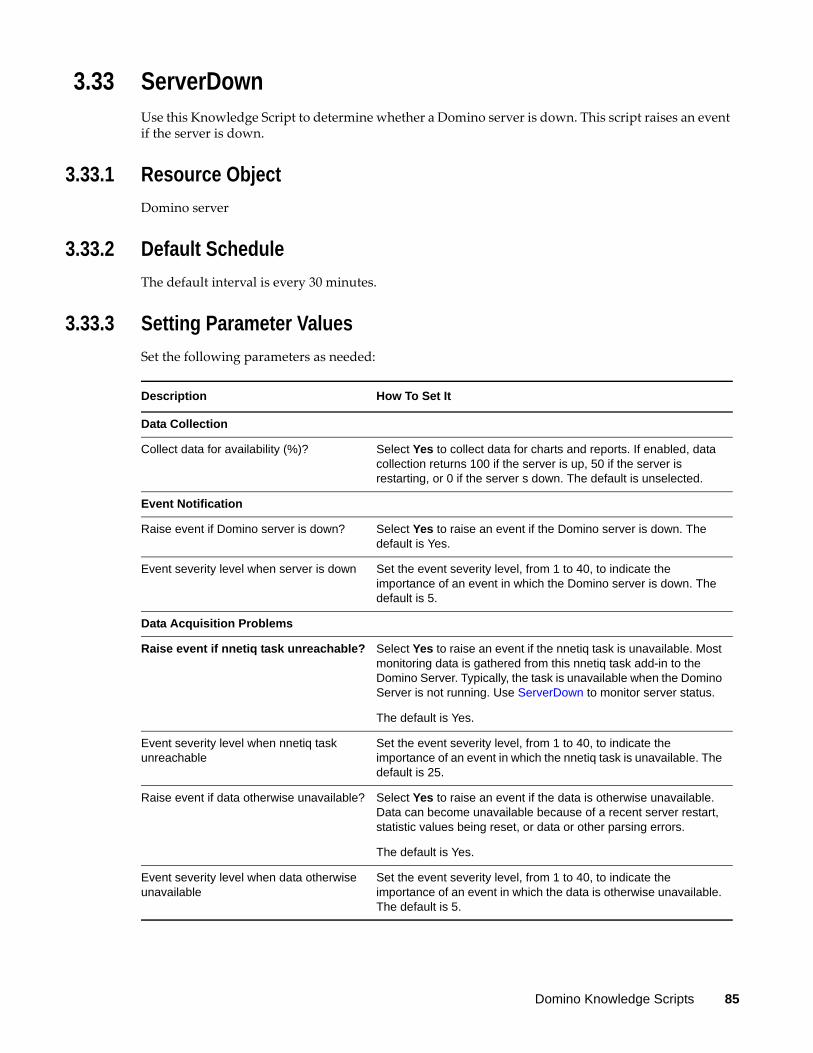
3.33 ServerDownUse this Knowledge Script to determine whether a Domino server is down. This script raises an event if the server is down.
3.33.1 Resource Object
Domino server
3.33.2 Default Schedule
The default interval is every 30 minutes.
3.33.3 Setting Parameter Values
Set the following parameters as needed:
Description How To Set It
Data Collection
Collect data for availability (%)? Select Yes to collect data for charts and reports. If enabled, data collection returns 100 if the server is up, 50 if the server is restarting, or 0 if the server s down. The default is unselected.
Event Notification
Raise event if Domino server is down? Select Yes to raise an event if the Domino server is down. The default is Yes.
Event severity level when server is down Set the event severity level, from 1 to 40, to indicate the importance of an event in which the Domino server is down. The default is 5.
Data Acquisition Problems
Raise event if nnetiq task unreachable? Select Yes to raise an event if the nnetiq task is unavailable. Most monitoring data is gathered from this nnetiq task add-in to the Domino Server. Typically, the task is unavailable when the Domino Server is not running. Use ServerDown to monitor server status.
The default is Yes.
Event severity level when nnetiq task unreachable
Set the event severity level, from 1 to 40, to indicate the importance of an event in which the nnetiq task is unavailable. The default is 25.
Raise event if data otherwise unavailable? Select Yes to raise an event if the data is otherwise unavailable. Data can become unavailable because of a recent server restart, statistic values being reset, or data or other parsing errors.
The default is Yes.
Event severity level when data otherwise unavailable
Set the event severity level, from 1 to 40, to indicate the importance of an event in which the data is otherwise unavailable. The default is 5.
Domino Knowledge Scripts 85
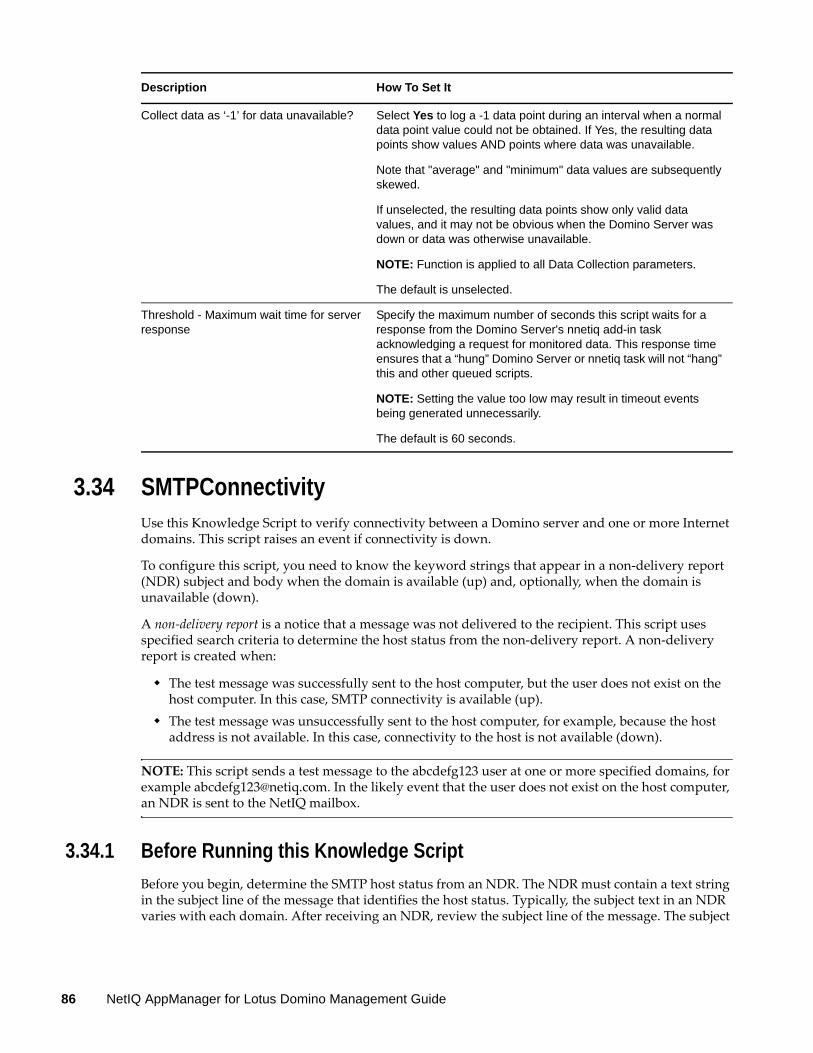
3.34 SMTPConnectivityUse this Knowledge Script to verify connectivity between a Domino server and one or more Internet domains. This script raises an event if connectivity is down.
To configure this script, you need to know the keyword strings that appear in a non-delivery report (NDR) subject and body when the domain is available (up) and, optionally, when the domain is unavailable (down).
A non-delivery report is a notice that a message was not delivered to the recipient. This script uses specified search criteria to determine the host status from the non-delivery report. A non-delivery report is created when:
The test message was successfully sent to the host computer, but the user does not exist on the host computer. In this case, SMTP connectivity is available (up).
The test message was unsuccessfully sent to the host computer, for example, because the host address is not available. In this case, connectivity to the host is not available (down).
NOTE: This script sends a test message to the abcdefg123 user at one or more specified domains, for example [email protected]. In the likely event that the user does not exist on the host computer, an NDR is sent to the NetIQ mailbox.
3.34.1 Before Running this Knowledge Script
Before you begin, determine the SMTP host status from an NDR. The NDR must contain a text string in the subject line of the message that identifies the host status. Typically, the subject text in an NDR varies with each domain. After receiving an NDR, review the subject line of the message. The subject
Collect data as ‘-1’ for data unavailable? Select Yes to log a -1 data point during an interval when a normal data point value could not be obtained. If Yes, the resulting data points show values AND points where data was unavailable.
Note that "average" and "minimum" data values are subsequently skewed.
If unselected, the resulting data points show only valid data values, and it may not be obvious when the Domino Server was down or data was otherwise unavailable.
NOTE: Function is applied to all Data Collection parameters.
The default is unselected.
Threshold - Maximum wait time for server response
Specify the maximum number of seconds this script waits for a response from the Domino Server's nnetiq add-in task acknowledging a request for monitored data. This response time ensures that a “hung” Domino Server or nnetiq task will not “hang” this and other queued scripts.
NOTE: Setting the value too low may result in timeout events being generated unnecessarily.
The default is 60 seconds.
Description How To Set It
86 NetIQ AppManager for Lotus Domino Management Guide

line must contain a keyword string that identifies the host status. For example, user account inactive indicates the host computer is available, but the user does not exist on the host computer. A subject such as no route indicates connectivity is down.
3.34.2 Understanding How Keyword Strings Work
AppManager compares the text in the subject of the NDR to the specified keyword strings for the host status parameters in the script.
The specified keyword strings must match the actual string that appears in the NDR, including spaces. AppManager searches the subject line from left to right. The search is not case-sensitive.
When specifying one or more host status parameters, note the following:
NOTE: By default, this script sends a test message to one or more specified domains using the abcdefg123 user name. This user name may appear in the NDR subject or body.
3.34.3 Performing Routine Maintenance
Periodically remove old messages from the Domino server’s mailbox and the NetIQ mail database.
3.34.4 Resource Object
Domino server
3.34.5 Default Schedule
The default interval for this script is once every hour.
NOTE: You cannot choose the Run once schedule for this script, which requires at least two job iterations to return useful data.
3.34.6 Setting Parameter Values
Set the following parameters as needed:
If a text string in the NDR matches* the keyword string specified for AppManager reports the status as
Subject keywords when host is up Up
Subject keywords when host is down Down
Subject keywords when host is both up and down Down
Description How To Set It
Monitoring
Domino Knowledge Scripts 87
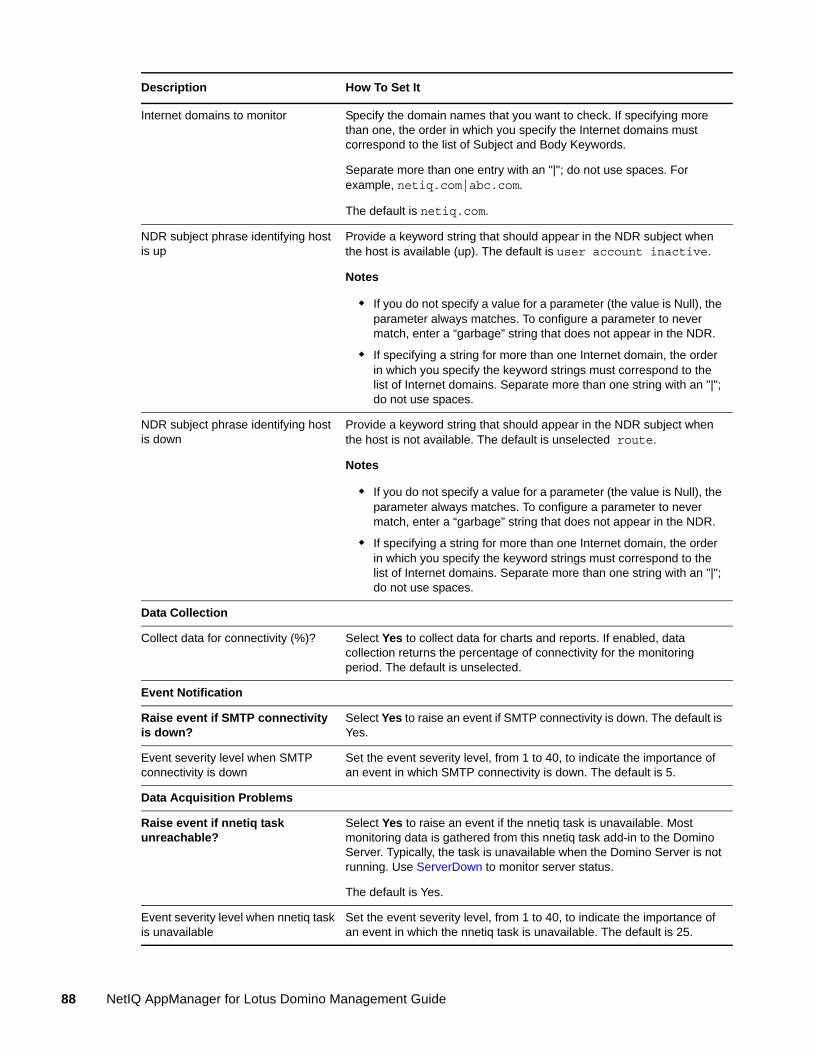
Internet domains to monitor Specify the domain names that you want to check. If specifying more than one, the order in which you specify the Internet domains must correspond to the list of Subject and Body Keywords.
Separate more than one entry with an "|"; do not use spaces. For example, netiq.com|abc.com.
The default is netiq.com.
NDR subject phrase identifying host is up
Provide a keyword string that should appear in the NDR subject when the host is available (up). The default is user account inactive.
Notes
If you do not specify a value for a parameter (the value is Null), the parameter always matches. To configure a parameter to never match, enter a “garbage” string that does not appear in the NDR.
If specifying a string for more than one Internet domain, the order in which you specify the keyword strings must correspond to the list of Internet domains. Separate more than one string with an "|"; do not use spaces.
NDR subject phrase identifying host is down
Provide a keyword string that should appear in the NDR subject when the host is not available. The default is unselected route.
Notes
If you do not specify a value for a parameter (the value is Null), the parameter always matches. To configure a parameter to never match, enter a “garbage” string that does not appear in the NDR.
If specifying a string for more than one Internet domain, the order in which you specify the keyword strings must correspond to the list of Internet domains. Separate more than one string with an "|"; do not use spaces.
Data Collection
Collect data for connectivity (%)? Select Yes to collect data for charts and reports. If enabled, data collection returns the percentage of connectivity for the monitoring period. The default is unselected.
Event Notification
Raise event if SMTP connectivity is down?
Select Yes to raise an event if SMTP connectivity is down. The default is Yes.
Event severity level when SMTP connectivity is down
Set the event severity level, from 1 to 40, to indicate the importance of an event in which SMTP connectivity is down. The default is 5.
Data Acquisition Problems
Raise event if nnetiq task unreachable?
Select Yes to raise an event if the nnetiq task is unavailable. Most monitoring data is gathered from this nnetiq task add-in to the Domino Server. Typically, the task is unavailable when the Domino Server is not running. Use ServerDown to monitor server status.
The default is Yes.
Event severity level when nnetiq task is unavailable
Set the event severity level, from 1 to 40, to indicate the importance of an event in which the nnetiq task is unavailable. The default is 25.
Description How To Set It
88 NetIQ AppManager for Lotus Domino Management Guide
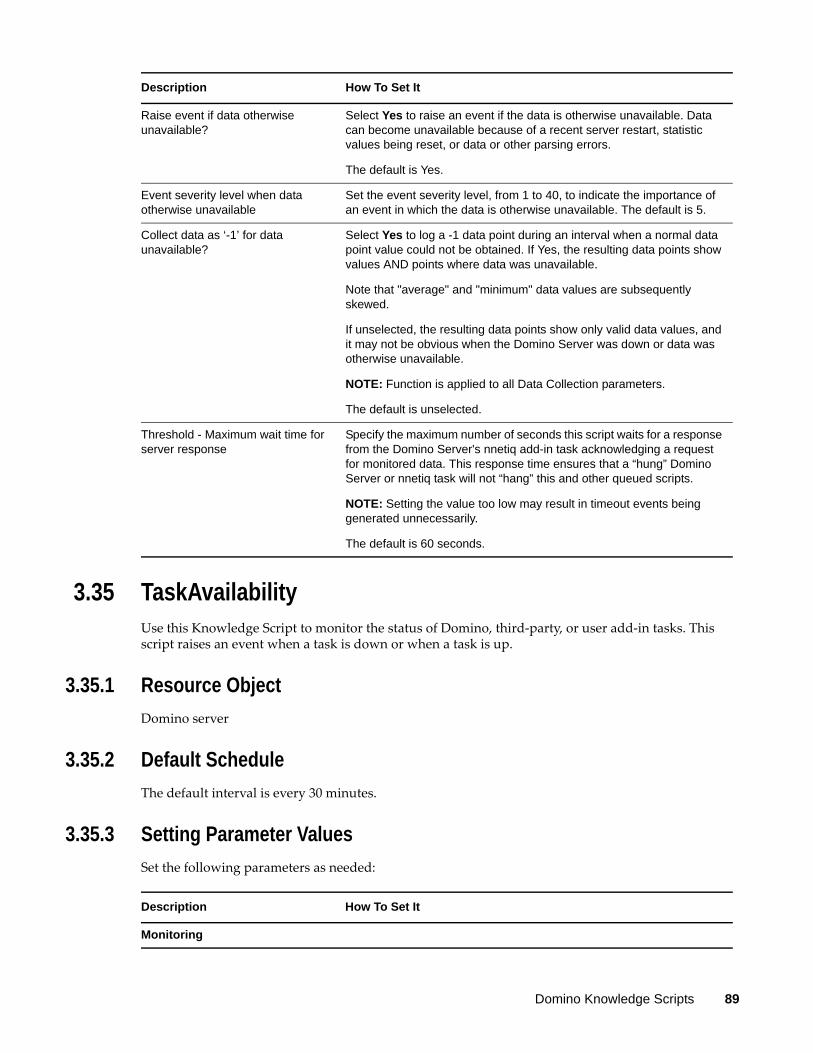
3.35 TaskAvailabilityUse this Knowledge Script to monitor the status of Domino, third-party, or user add-in tasks. This script raises an event when a task is down or when a task is up.
3.35.1 Resource Object
Domino server
3.35.2 Default Schedule
The default interval is every 30 minutes.
3.35.3 Setting Parameter Values
Set the following parameters as needed:
Raise event if data otherwise unavailable?
Select Yes to raise an event if the data is otherwise unavailable. Data can become unavailable because of a recent server restart, statistic values being reset, or data or other parsing errors.
The default is Yes.
Event severity level when data otherwise unavailable
Set the event severity level, from 1 to 40, to indicate the importance of an event in which the data is otherwise unavailable. The default is 5.
Collect data as ‘-1’ for data unavailable?
Select Yes to log a -1 data point during an interval when a normal data point value could not be obtained. If Yes, the resulting data points show values AND points where data was unavailable.
Note that "average" and "minimum" data values are subsequently skewed.
If unselected, the resulting data points show only valid data values, and it may not be obvious when the Domino Server was down or data was otherwise unavailable.
NOTE: Function is applied to all Data Collection parameters.
The default is unselected.
Threshold - Maximum wait time for server response
Specify the maximum number of seconds this script waits for a response from the Domino Server's nnetiq add-in task acknowledging a request for monitored data. This response time ensures that a “hung” Domino Server or nnetiq task will not “hang” this and other queued scripts.
NOTE: Setting the value too low may result in timeout events being generated unnecessarily.
The default is 60 seconds.
Description How To Set It
Description How To Set It
Monitoring
Domino Knowledge Scripts 89
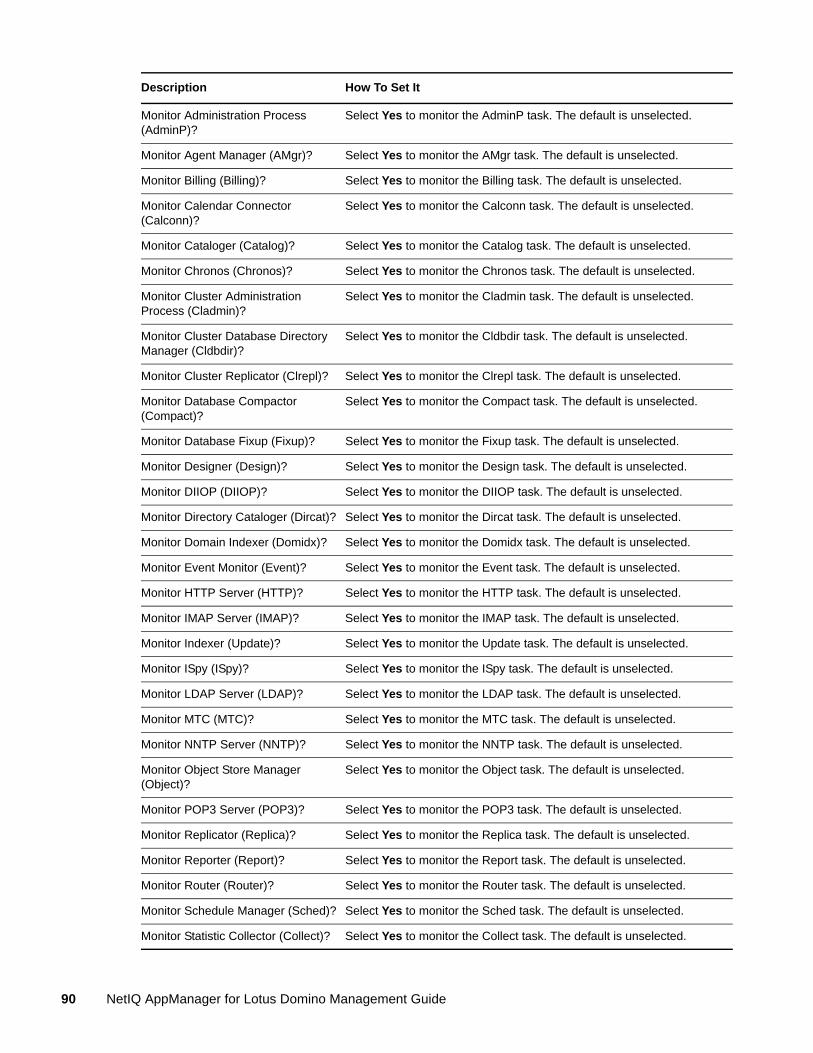
Monitor Administration Process (AdminP)?
Select Yes to monitor the AdminP task. The default is unselected.
Monitor Agent Manager (AMgr)? Select Yes to monitor the AMgr task. The default is unselected.
Monitor Billing (Billing)? Select Yes to monitor the Billing task. The default is unselected.
Monitor Calendar Connector (Calconn)?
Select Yes to monitor the Calconn task. The default is unselected.
Monitor Cataloger (Catalog)? Select Yes to monitor the Catalog task. The default is unselected.
Monitor Chronos (Chronos)? Select Yes to monitor the Chronos task. The default is unselected.
Monitor Cluster Administration Process (Cladmin)?
Select Yes to monitor the Cladmin task. The default is unselected.
Monitor Cluster Database Directory Manager (Cldbdir)?
Select Yes to monitor the Cldbdir task. The default is unselected.
Monitor Cluster Replicator (Clrepl)? Select Yes to monitor the Clrepl task. The default is unselected.
Monitor Database Compactor (Compact)?
Select Yes to monitor the Compact task. The default is unselected.
Monitor Database Fixup (Fixup)? Select Yes to monitor the Fixup task. The default is unselected.
Monitor Designer (Design)? Select Yes to monitor the Design task. The default is unselected.
Monitor DIIOP (DIIOP)? Select Yes to monitor the DIIOP task. The default is unselected.
Monitor Directory Cataloger (Dircat)? Select Yes to monitor the Dircat task. The default is unselected.
Monitor Domain Indexer (Domidx)? Select Yes to monitor the Domidx task. The default is unselected.
Monitor Event Monitor (Event)? Select Yes to monitor the Event task. The default is unselected.
Monitor HTTP Server (HTTP)? Select Yes to monitor the HTTP task. The default is unselected.
Monitor IMAP Server (IMAP)? Select Yes to monitor the IMAP task. The default is unselected.
Monitor Indexer (Update)? Select Yes to monitor the Update task. The default is unselected.
Monitor ISpy (ISpy)? Select Yes to monitor the ISpy task. The default is unselected.
Monitor LDAP Server (LDAP)? Select Yes to monitor the LDAP task. The default is unselected.
Monitor MTC (MTC)? Select Yes to monitor the MTC task. The default is unselected.
Monitor NNTP Server (NNTP)? Select Yes to monitor the NNTP task. The default is unselected.
Monitor Object Store Manager (Object)?
Select Yes to monitor the Object task. The default is unselected.
Monitor POP3 Server (POP3)? Select Yes to monitor the POP3 task. The default is unselected.
Monitor Replicator (Replica)? Select Yes to monitor the Replica task. The default is unselected.
Monitor Reporter (Report)? Select Yes to monitor the Report task. The default is unselected.
Monitor Router (Router)? Select Yes to monitor the Router task. The default is unselected.
Monitor Schedule Manager (Sched)? Select Yes to monitor the Sched task. The default is unselected.
Monitor Statistic Collector (Collect)? Select Yes to monitor the Collect task. The default is unselected.
Description How To Set It
90 NetIQ AppManager for Lotus Domino Management Guide
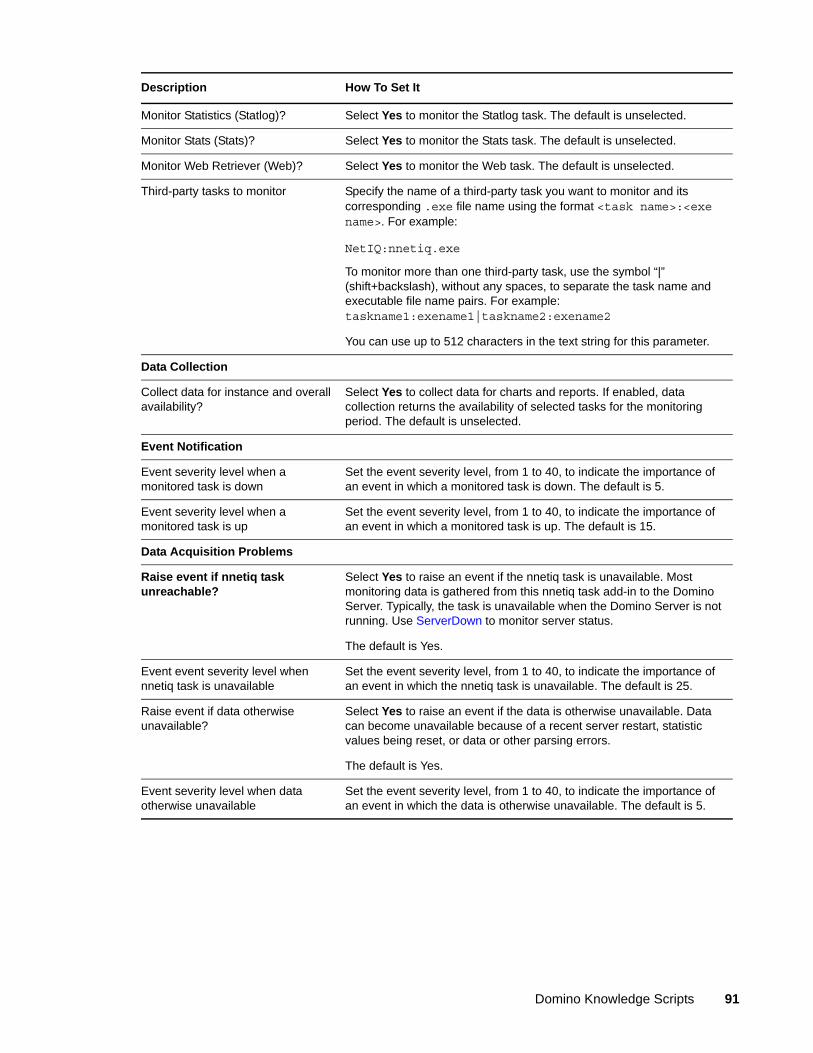
Monitor Statistics (Statlog)? Select Yes to monitor the Statlog task. The default is unselected.
Monitor Stats (Stats)? Select Yes to monitor the Stats task. The default is unselected.
Monitor Web Retriever (Web)? Select Yes to monitor the Web task. The default is unselected.
Third-party tasks to monitor Specify the name of a third-party task you want to monitor and its corresponding .exe file name using the format <task name>:<exe name>. For example:
NetIQ:nnetiq.exe
To monitor more than one third-party task, use the symbol “|” (shift+backslash), without any spaces, to separate the task name and executable file name pairs. For example: taskname1:exename1|taskname2:exename2
You can use up to 512 characters in the text string for this parameter.
Data Collection
Collect data for instance and overall availability?
Select Yes to collect data for charts and reports. If enabled, data collection returns the availability of selected tasks for the monitoring period. The default is unselected.
Event Notification
Event severity level when a monitored task is down
Set the event severity level, from 1 to 40, to indicate the importance of an event in which a monitored task is down. The default is 5.
Event severity level when a monitored task is up
Set the event severity level, from 1 to 40, to indicate the importance of an event in which a monitored task is up. The default is 15.
Data Acquisition Problems
Raise event if nnetiq task unreachable?
Select Yes to raise an event if the nnetiq task is unavailable. Most monitoring data is gathered from this nnetiq task add-in to the Domino Server. Typically, the task is unavailable when the Domino Server is not running. Use ServerDown to monitor server status.
The default is Yes.
Event event severity level when nnetiq task is unavailable
Set the event severity level, from 1 to 40, to indicate the importance of an event in which the nnetiq task is unavailable. The default is 25.
Raise event if data otherwise unavailable?
Select Yes to raise an event if the data is otherwise unavailable. Data can become unavailable because of a recent server restart, statistic values being reset, or data or other parsing errors.
The default is Yes.
Event severity level when data otherwise unavailable
Set the event severity level, from 1 to 40, to indicate the importance of an event in which the data is otherwise unavailable. The default is 5.
Description How To Set It
Domino Knowledge Scripts 91
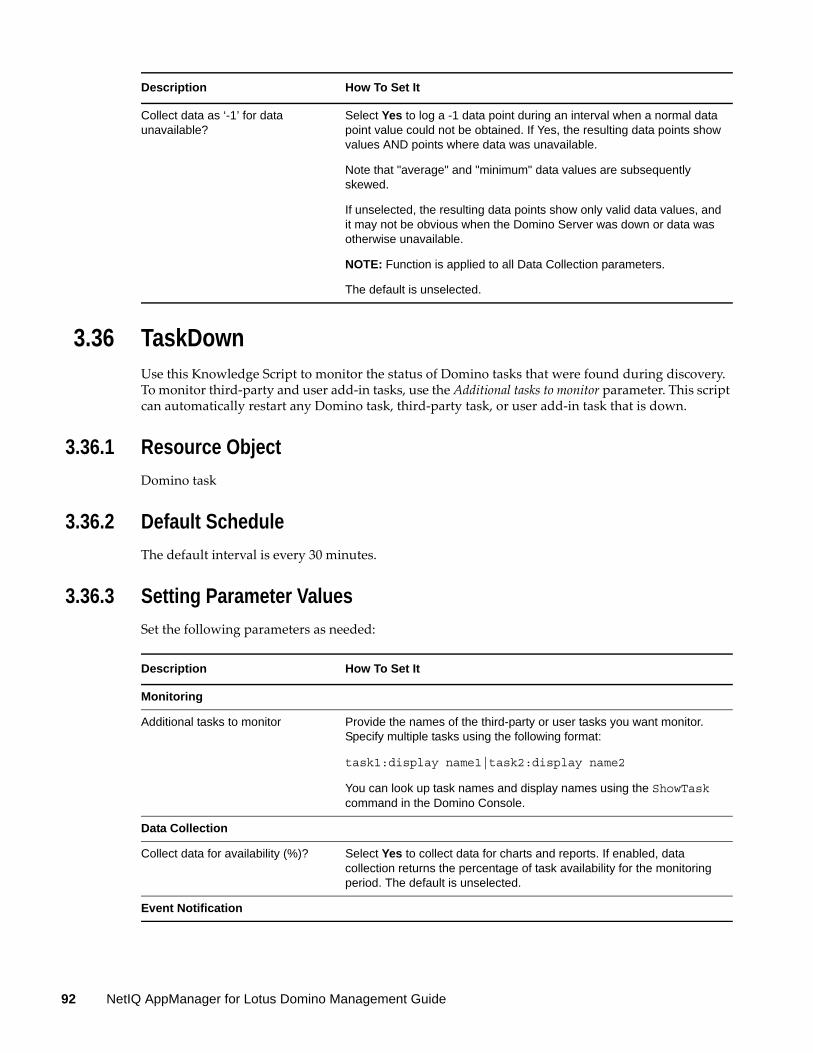
3.36 TaskDownUse this Knowledge Script to monitor the status of Domino tasks that were found during discovery. To monitor third-party and user add-in tasks, use the Additional tasks to monitor parameter. This script can automatically restart any Domino task, third-party task, or user add-in task that is down.
3.36.1 Resource Object
Domino task
3.36.2 Default Schedule
The default interval is every 30 minutes.
3.36.3 Setting Parameter Values
Set the following parameters as needed:
Collect data as ‘-1’ for data unavailable?
Select Yes to log a -1 data point during an interval when a normal data point value could not be obtained. If Yes, the resulting data points show values AND points where data was unavailable.
Note that "average" and "minimum" data values are subsequently skewed.
If unselected, the resulting data points show only valid data values, and it may not be obvious when the Domino Server was down or data was otherwise unavailable.
NOTE: Function is applied to all Data Collection parameters.
The default is unselected.
Description How To Set It
Description How To Set It
Monitoring
Additional tasks to monitor Provide the names of the third-party or user tasks you want monitor. Specify multiple tasks using the following format:
task1:display name1|task2:display name2
You can look up task names and display names using the ShowTask command in the Domino Console.
Data Collection
Collect data for availability (%)? Select Yes to collect data for charts and reports. If enabled, data collection returns the percentage of task availability for the monitoring period. The default is unselected.
Event Notification
92 NetIQ AppManager for Lotus Domino Management Guide

Raise event if task is down? Select Yes to raise an event for each task that is down. The default is Yes.
Event severity level when auto-start is disabled
Set the event severity level, from 1 to 40, to indicate the importance of an event in which the Auto-start task(s) if found down? parameter is disabled. The default is 18.
Event severity level when auto-start succeeds
Set the event severity level, from 1 to 40, to indicate the importance of an event in which AppManager successfully restarts a monitored task. The default is 25.
Event severity level when auto-start fails
Set the event severity level, from 1 to 40, to indicate the importance of an event in which AppManager cannot restart a monitored task. The default is 5.
Operations
Auto-start tasks that are down? Select Yes to automatically restart monitored tasks that are down. The default is Yes.
Data Acquisition Problems
Raise event if nnetiq task unreachable?
Select Yes to raise an event if the nnetiq task is unavailable. Most monitoring data is gathered from this nnetiq task add-in to the Domino Server. Typically, the task is unavailable when the Domino Server is not running. Use ServerDown to monitor server status.
The default is Yes.
Event severity level when nnetiq task unreachable
Set the event severity level, from 1 to 40, to indicate the importance of an event in which the nnetiq task is unavailable. The default is 25.
Raise event if data otherwise unavailable?
Select Yes to raise an event if the data is otherwise unavailable. Data can become unavailable because of a recent server restart, statistic values being reset, or data or other parsing errors.
The default is Yes.
Event severity level when data otherwise unavailable
Set the event severity level, from 1 to 40, to indicate the importance of an event in which the data is otherwise unavailable. The default is 5.
Collect data as ‘-1’ for data unavailable?
Select Yes to log a -1 data point during an interval when a normal data point value could not be obtained. If Yes, the resulting data points show values AND points where data was unavailable.
Note that "average" and "minimum" data values are subsequently skewed.
If unselected, the resulting data points show only valid data values, and it may not be obvious when the Domino Server was down or data was otherwise unavailable.
NOTE: Function is applied to all Data Collection parameters.
The default is unselected.
Description How To Set It
Domino Knowledge Scripts 93

3.37 TopNAccessDbsUse this Knowledge Script to monitor the top
n
Domino databases that are most frequently accessed on a Domino server. This script raises an event if the number of access requests exceeds the threshold you set.
The detail message includes the database name, the number of times the database was accessed, the database size, and the database whitespace for each top
n
database.
3.37.1 Resource Object
Domino server
3.37.2 Default Schedule
The default interval is once every day.
3.37.3 Setting Parameter Values
Set the following parameters as needed:
Threshold - Maximum wait time for server response
Specify the maximum number of seconds this script waits for a response from the Domino Server's nnetiq add-in task acknowledging a request for monitored data. This response time ensures that a “hung” Domino Server or nnetiq task will not “hang” this and other queued scripts.
NOTE: Setting the value too low may result in timeout events being generated unnecessarily.
The default is 60 seconds.
Description How To Set It
Description How To Set It
Monitoring
Top “n” accessed databases to monitor
Specify the number of top databases you want to monitor. For example, to see the five databases that receive the most access requests, enter 5. The default is 10. Enter 0 to include all databases.
Number of previous hours to monitor Specify the number of previous hours to monitor. The default is 24 hours.
Threshold - Maximum total requests during monitoring period
Specify the maximum number of access requests that can occur before an event is raised. The default is 1000 requests.
Data Collection
94 NetIQ AppManager for Lotus Domino Management Guide
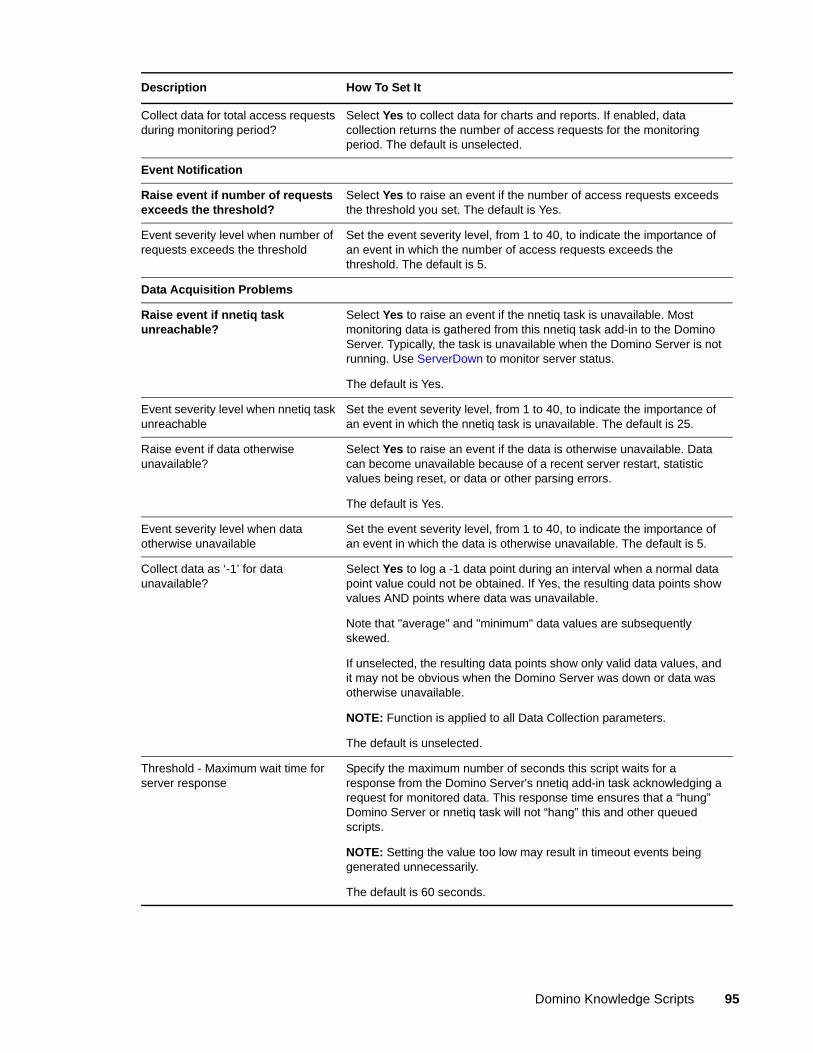
Collect data for total access requests during monitoring period?
Select Yes to collect data for charts and reports. If enabled, data collection returns the number of access requests for the monitoring period. The default is unselected.
Event Notification
Raise event if number of requests exceeds the threshold?
Select Yes to raise an event if the number of access requests exceeds the threshold you set. The default is Yes.
Event severity level when number of requests exceeds the threshold
Set the event severity level, from 1 to 40, to indicate the importance of an event in which the number of access requests exceeds the threshold. The default is 5.
Data Acquisition Problems
Raise event if nnetiq task unreachable?
Select Yes to raise an event if the nnetiq task is unavailable. Most monitoring data is gathered from this nnetiq task add-in to the Domino Server. Typically, the task is unavailable when the Domino Server is not running. Use ServerDown to monitor server status.
The default is Yes.
Event severity level when nnetiq task unreachable
Set the event severity level, from 1 to 40, to indicate the importance of an event in which the nnetiq task is unavailable. The default is 25.
Raise event if data otherwise unavailable?
Select Yes to raise an event if the data is otherwise unavailable. Data can become unavailable because of a recent server restart, statistic values being reset, or data or other parsing errors.
The default is Yes.
Event severity level when data otherwise unavailable
Set the event severity level, from 1 to 40, to indicate the importance of an event in which the data is otherwise unavailable. The default is 5.
Collect data as ‘-1’ for data unavailable?
Select Yes to log a -1 data point during an interval when a normal data point value could not be obtained. If Yes, the resulting data points show values AND points where data was unavailable.
Note that "average" and "minimum" data values are subsequently skewed.
If unselected, the resulting data points show only valid data values, and it may not be obvious when the Domino Server was down or data was otherwise unavailable.
NOTE: Function is applied to all Data Collection parameters.
The default is unselected.
Threshold - Maximum wait time for server response
Specify the maximum number of seconds this script waits for a response from the Domino Server's nnetiq add-in task acknowledging a request for monitored data. This response time ensures that a “hung” Domino Server or nnetiq task will not “hang” this and other queued scripts.
NOTE: Setting the value too low may result in timeout events being generated unnecessarily.
The default is 60 seconds.
Description How To Set It
Domino Knowledge Scripts 95
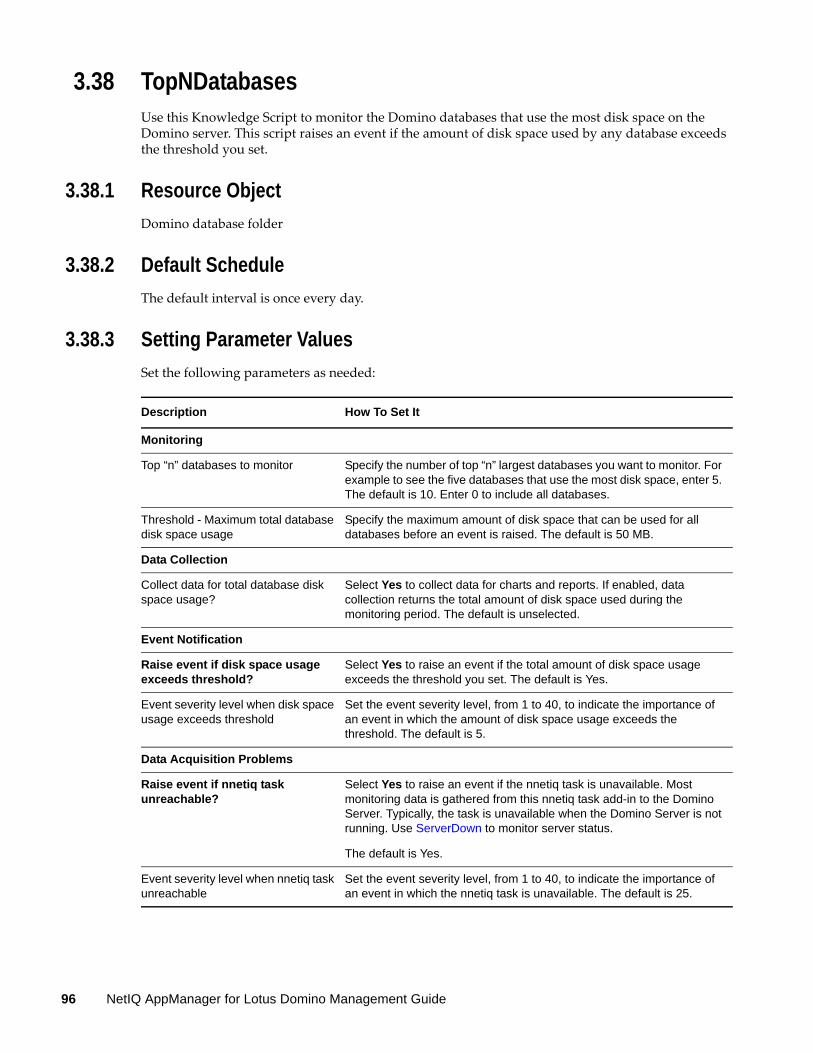
3.38 TopNDatabasesUse this Knowledge Script to monitor the Domino databases that use the most disk space on the Domino server. This script raises an event if the amount of disk space used by any database exceeds the threshold you set.
3.38.1 Resource Object
Domino database folder
3.38.2 Default Schedule
The default interval is once every day.
3.38.3 Setting Parameter Values
Set the following parameters as needed:
Description How To Set It
Monitoring
Top “n” databases to monitor Specify the number of top “n” largest databases you want to monitor. For example to see the five databases that use the most disk space, enter 5. The default is 10. Enter 0 to include all databases.
Threshold - Maximum total database disk space usage
Specify the maximum amount of disk space that can be used for all databases before an event is raised. The default is 50 MB.
Data Collection
Collect data for total database disk space usage?
Select Yes to collect data for charts and reports. If enabled, data collection returns the total amount of disk space used during the monitoring period. The default is unselected.
Event Notification
Raise event if disk space usage exceeds threshold?
Select Yes to raise an event if the total amount of disk space usage exceeds the threshold you set. The default is Yes.
Event severity level when disk space usage exceeds threshold
Set the event severity level, from 1 to 40, to indicate the importance of an event in which the amount of disk space usage exceeds the threshold. The default is 5.
Data Acquisition Problems
Raise event if nnetiq task unreachable?
Select Yes to raise an event if the nnetiq task is unavailable. Most monitoring data is gathered from this nnetiq task add-in to the Domino Server. Typically, the task is unavailable when the Domino Server is not running. Use ServerDown to monitor server status.
The default is Yes.
Event severity level when nnetiq task unreachable
Set the event severity level, from 1 to 40, to indicate the importance of an event in which the nnetiq task is unavailable. The default is 25.
96 NetIQ AppManager for Lotus Domino Management Guide

3.39 TopNMailDatabasesUse this Knowledge Script to monitor the disk space used by the top n user mail files and mail-in databases on the Domino server. This script raises an event if the disk space used exceeds the threshold you set.
3.39.1 Resource Objects
Mail icon
3.39.2 Default Schedule
The default interval is once every day.
Raise event if data otherwise unavailable?
Select Yes to raise an event if the data is otherwise unavailable. Data can become unavailable because of a recent server restart, statistic values being reset, or data or other parsing errors.
The default is Yes.
Event severity level when data otherwise unavailable
Set the event severity level, from 1 to 40, to indicate the importance of an event in which the data is otherwise unavailable. The default is 5.
Collect data as ‘-1’ for data unavailable?
Select Yes to log a -1 data point during an interval when a normal data point value could not be obtained. If Yes, the resulting data points show values AND points where data was unavailable.
Note that "average" and "minimum" data values are subsequently skewed.
If unselected, the resulting data points show only valid data values, and it may not be obvious when the Domino Server was down or data was otherwise unavailable.
NOTE: Function is applied to all Data Collection parameters.
The default is unselected.
Threshold - Maximum wait time for server response
Specify the maximum number of seconds this script waits for a response from the Domino Server's nnetiq add-in task acknowledging a request for monitored data. This response time ensures that a “hung” Domino Server or nnetiq task will not “hang” this and other queued scripts.
NOTE: Setting the value too low may result in timeout events being generated unnecessarily.
The default is 60 seconds.
Description How To Set It
Domino Knowledge Scripts 97
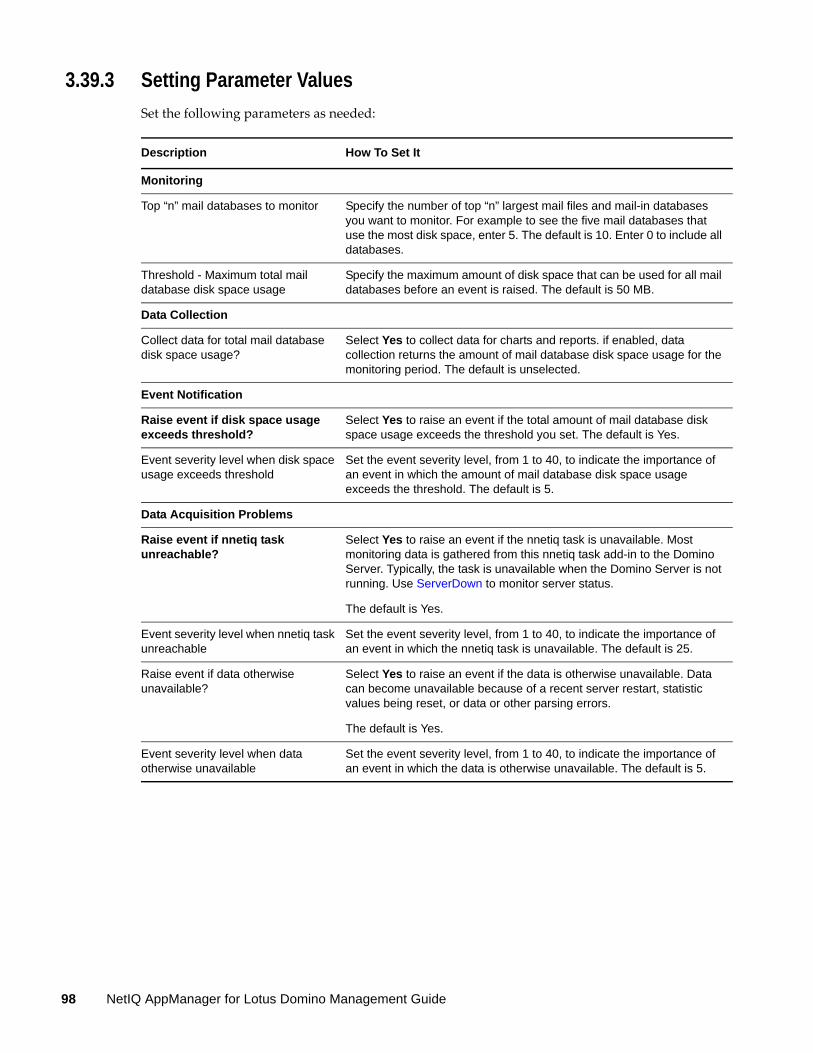
3.39.3 Setting Parameter Values
Set the following parameters as needed:
Description How To Set It
Monitoring
Top “n” mail databases to monitor Specify the number of top “n” largest mail files and mail-in databases you want to monitor. For example to see the five mail databases that use the most disk space, enter 5. The default is 10. Enter 0 to include all databases.
Threshold - Maximum total mail database disk space usage
Specify the maximum amount of disk space that can be used for all mail databases before an event is raised. The default is 50 MB.
Data Collection
Collect data for total mail database disk space usage?
Select Yes to collect data for charts and reports. if enabled, data collection returns the amount of mail database disk space usage for the monitoring period. The default is unselected.
Event Notification
Raise event if disk space usage exceeds threshold?
Select Yes to raise an event if the total amount of mail database disk space usage exceeds the threshold you set. The default is Yes.
Event severity level when disk space usage exceeds threshold
Set the event severity level, from 1 to 40, to indicate the importance of an event in which the amount of mail database disk space usage exceeds the threshold. The default is 5.
Data Acquisition Problems
Raise event if nnetiq task unreachable?
Select Yes to raise an event if the nnetiq task is unavailable. Most monitoring data is gathered from this nnetiq task add-in to the Domino Server. Typically, the task is unavailable when the Domino Server is not running. Use ServerDown to monitor server status.
The default is Yes.
Event severity level when nnetiq task unreachable
Set the event severity level, from 1 to 40, to indicate the importance of an event in which the nnetiq task is unavailable. The default is 25.
Raise event if data otherwise unavailable?
Select Yes to raise an event if the data is otherwise unavailable. Data can become unavailable because of a recent server restart, statistic values being reset, or data or other parsing errors.
The default is Yes.
Event severity level when data otherwise unavailable
Set the event severity level, from 1 to 40, to indicate the importance of an event in which the data is otherwise unavailable. The default is 5.
98 NetIQ AppManager for Lotus Domino Management Guide
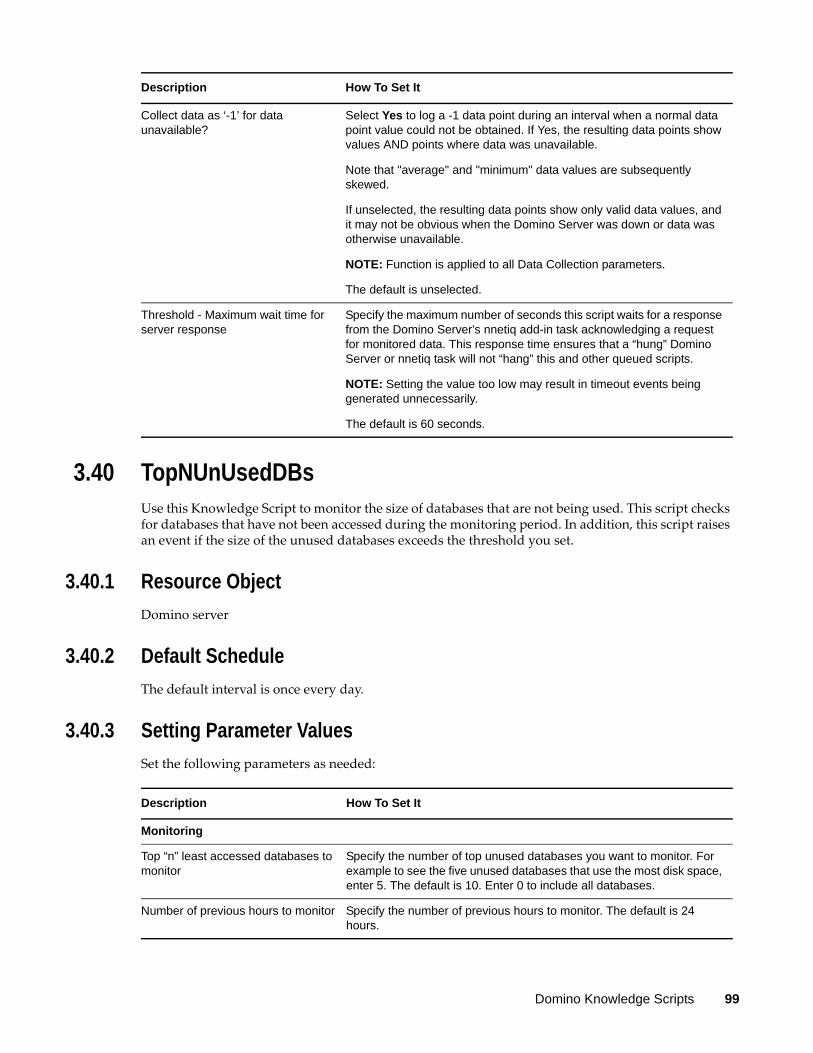
3.40 TopNUnUsedDBsUse this Knowledge Script to monitor the size of databases that are not being used. This script checks for databases that have not been accessed during the monitoring period. In addition, this script raises an event if the size of the unused databases exceeds the threshold you set.
3.40.1 Resource Object
Domino server
3.40.2 Default Schedule
The default interval is once every day.
3.40.3 Setting Parameter Values
Set the following parameters as needed:
Collect data as ‘-1’ for data unavailable?
Select Yes to log a -1 data point during an interval when a normal data point value could not be obtained. If Yes, the resulting data points show values AND points where data was unavailable.
Note that "average" and "minimum" data values are subsequently skewed.
If unselected, the resulting data points show only valid data values, and it may not be obvious when the Domino Server was down or data was otherwise unavailable.
NOTE: Function is applied to all Data Collection parameters.
The default is unselected.
Threshold - Maximum wait time for server response
Specify the maximum number of seconds this script waits for a response from the Domino Server's nnetiq add-in task acknowledging a request for monitored data. This response time ensures that a “hung” Domino Server or nnetiq task will not “hang” this and other queued scripts.
NOTE: Setting the value too low may result in timeout events being generated unnecessarily.
The default is 60 seconds.
Description How To Set It
Description How To Set It
Monitoring
Top “n” least accessed databases to monitor
Specify the number of top unused databases you want to monitor. For example to see the five unused databases that use the most disk space, enter 5. The default is 10. Enter 0 to include all databases.
Number of previous hours to monitor Specify the number of previous hours to monitor. The default is 24 hours.
Domino Knowledge Scripts 99
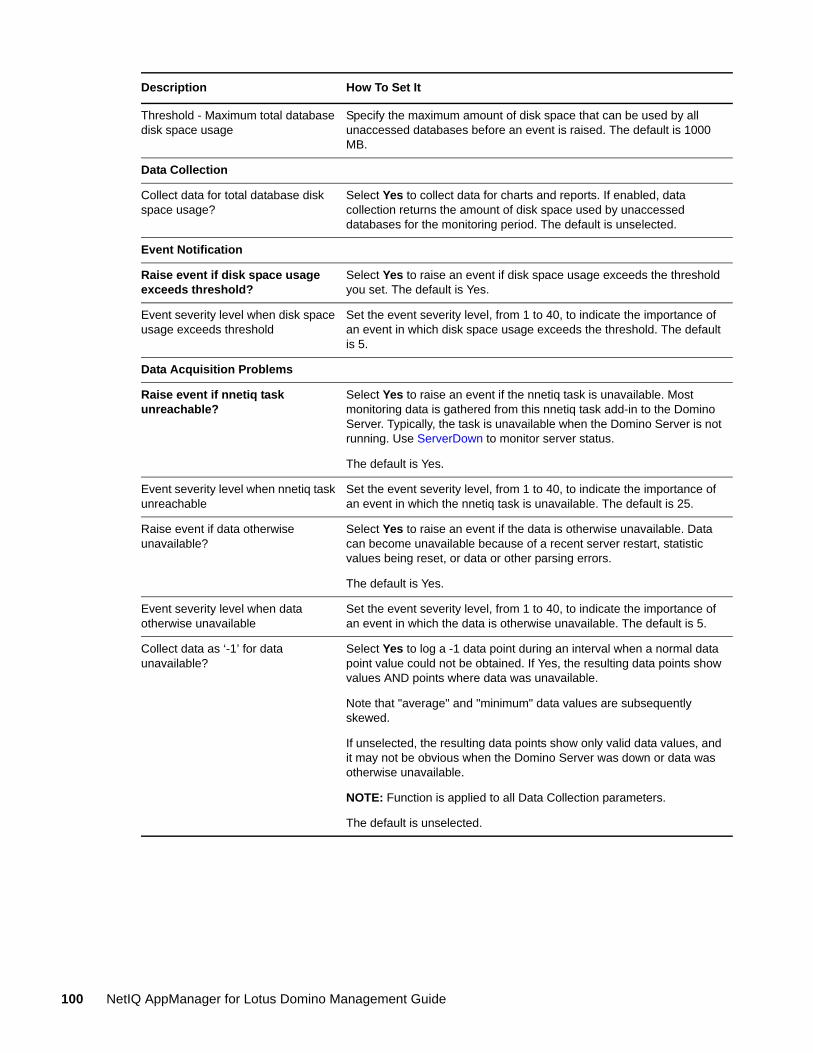
Threshold - Maximum total database disk space usage
Specify the maximum amount of disk space that can be used by all unaccessed databases before an event is raised. The default is 1000 MB.
Data Collection
Collect data for total database disk space usage?
Select Yes to collect data for charts and reports. If enabled, data collection returns the amount of disk space used by unaccessed databases for the monitoring period. The default is unselected.
Event Notification
Raise event if disk space usage exceeds threshold?
Select Yes to raise an event if disk space usage exceeds the threshold you set. The default is Yes.
Event severity level when disk space usage exceeds threshold
Set the event severity level, from 1 to 40, to indicate the importance of an event in which disk space usage exceeds the threshold. The default is 5.
Data Acquisition Problems
Raise event if nnetiq task unreachable?
Select Yes to raise an event if the nnetiq task is unavailable. Most monitoring data is gathered from this nnetiq task add-in to the Domino Server. Typically, the task is unavailable when the Domino Server is not running. Use ServerDown to monitor server status.
The default is Yes.
Event severity level when nnetiq task unreachable
Set the event severity level, from 1 to 40, to indicate the importance of an event in which the nnetiq task is unavailable. The default is 25.
Raise event if data otherwise unavailable?
Select Yes to raise an event if the data is otherwise unavailable. Data can become unavailable because of a recent server restart, statistic values being reset, or data or other parsing errors.
The default is Yes.
Event severity level when data otherwise unavailable
Set the event severity level, from 1 to 40, to indicate the importance of an event in which the data is otherwise unavailable. The default is 5.
Collect data as ‘-1’ for data unavailable?
Select Yes to log a -1 data point during an interval when a normal data point value could not be obtained. If Yes, the resulting data points show values AND points where data was unavailable.
Note that "average" and "minimum" data values are subsequently skewed.
If unselected, the resulting data points show only valid data values, and it may not be obvious when the Domino Server was down or data was otherwise unavailable.
NOTE: Function is applied to all Data Collection parameters.
The default is unselected.
Description How To Set It
100 NetIQ AppManager for Lotus Domino Management Guide
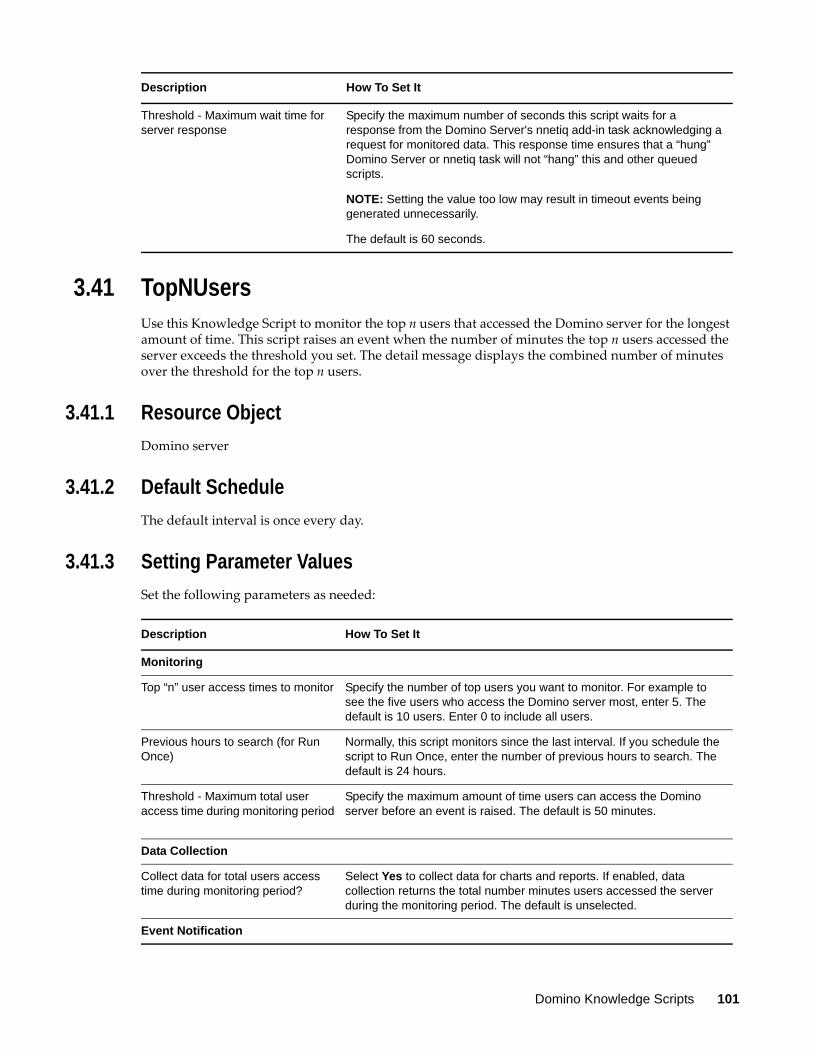
3.41 TopNUsersUse this Knowledge Script to monitor the top n users that accessed the Domino server for the longest amount of time. This script raises an event when the number of minutes the top n users accessed the server exceeds the threshold you set. The detail message displays the combined number of minutes over the threshold for the top n users.
3.41.1 Resource Object
Domino server
3.41.2 Default Schedule
The default interval is once every day.
3.41.3 Setting Parameter Values
Set the following parameters as needed:
Threshold - Maximum wait time for server response
Specify the maximum number of seconds this script waits for a response from the Domino Server's nnetiq add-in task acknowledging a request for monitored data. This response time ensures that a “hung” Domino Server or nnetiq task will not “hang” this and other queued scripts.
NOTE: Setting the value too low may result in timeout events being generated unnecessarily.
The default is 60 seconds.
Description How To Set It
Description How To Set It
Monitoring
Top “n” user access times to monitor Specify the number of top users you want to monitor. For example to see the five users who access the Domino server most, enter 5. The default is 10 users. Enter 0 to include all users.
Previous hours to search (for Run Once)
Normally, this script monitors since the last interval. If you schedule the script to Run Once, enter the number of previous hours to search. The default is 24 hours.
Threshold - Maximum total user access time during monitoring period
Specify the maximum amount of time users can access the Domino server before an event is raised. The default is 50 minutes.
Data Collection
Collect data for total users access time during monitoring period?
Select Yes to collect data for charts and reports. If enabled, data collection returns the total number minutes users accessed the server during the monitoring period. The default is unselected.
Event Notification
Domino Knowledge Scripts 101
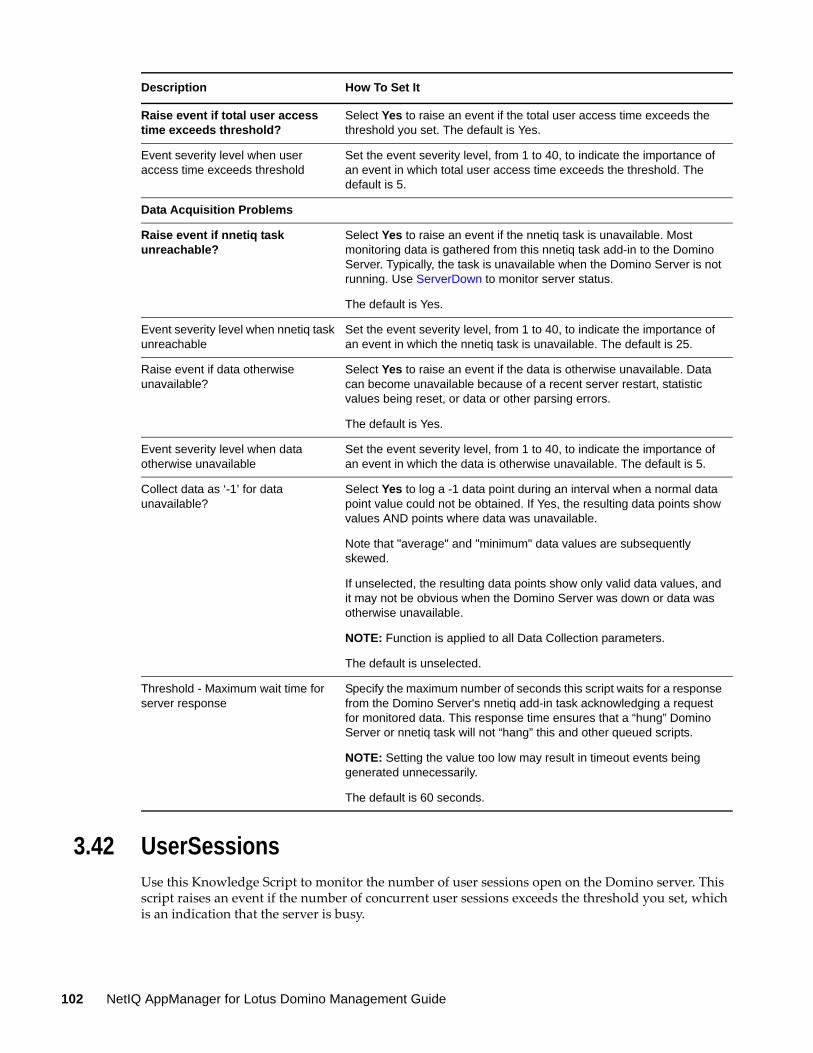
3.42 UserSessionsUse this Knowledge Script to monitor the number of user sessions open on the Domino server. This script raises an event if the number of concurrent user sessions exceeds the threshold you set, which is an indication that the server is busy.
Raise event if total user access time exceeds threshold?
Select Yes to raise an event if the total user access time exceeds the threshold you set. The default is Yes.
Event severity level when user access time exceeds threshold
Set the event severity level, from 1 to 40, to indicate the importance of an event in which total user access time exceeds the threshold. The default is 5.
Data Acquisition Problems
Raise event if nnetiq task unreachable?
Select Yes to raise an event if the nnetiq task is unavailable. Most monitoring data is gathered from this nnetiq task add-in to the Domino Server. Typically, the task is unavailable when the Domino Server is not running. Use ServerDown to monitor server status.
The default is Yes.
Event severity level when nnetiq task unreachable
Set the event severity level, from 1 to 40, to indicate the importance of an event in which the nnetiq task is unavailable. The default is 25.
Raise event if data otherwise unavailable?
Select Yes to raise an event if the data is otherwise unavailable. Data can become unavailable because of a recent server restart, statistic values being reset, or data or other parsing errors.
The default is Yes.
Event severity level when data otherwise unavailable
Set the event severity level, from 1 to 40, to indicate the importance of an event in which the data is otherwise unavailable. The default is 5.
Collect data as ‘-1’ for data unavailable?
Select Yes to log a -1 data point during an interval when a normal data point value could not be obtained. If Yes, the resulting data points show values AND points where data was unavailable.
Note that "average" and "minimum" data values are subsequently skewed.
If unselected, the resulting data points show only valid data values, and it may not be obvious when the Domino Server was down or data was otherwise unavailable.
NOTE: Function is applied to all Data Collection parameters.
The default is unselected.
Threshold - Maximum wait time for server response
Specify the maximum number of seconds this script waits for a response from the Domino Server's nnetiq add-in task acknowledging a request for monitored data. This response time ensures that a “hung” Domino Server or nnetiq task will not “hang” this and other queued scripts.
NOTE: Setting the value too low may result in timeout events being generated unnecessarily.
The default is 60 seconds.
Description How To Set It
102 NetIQ AppManager for Lotus Domino Management Guide
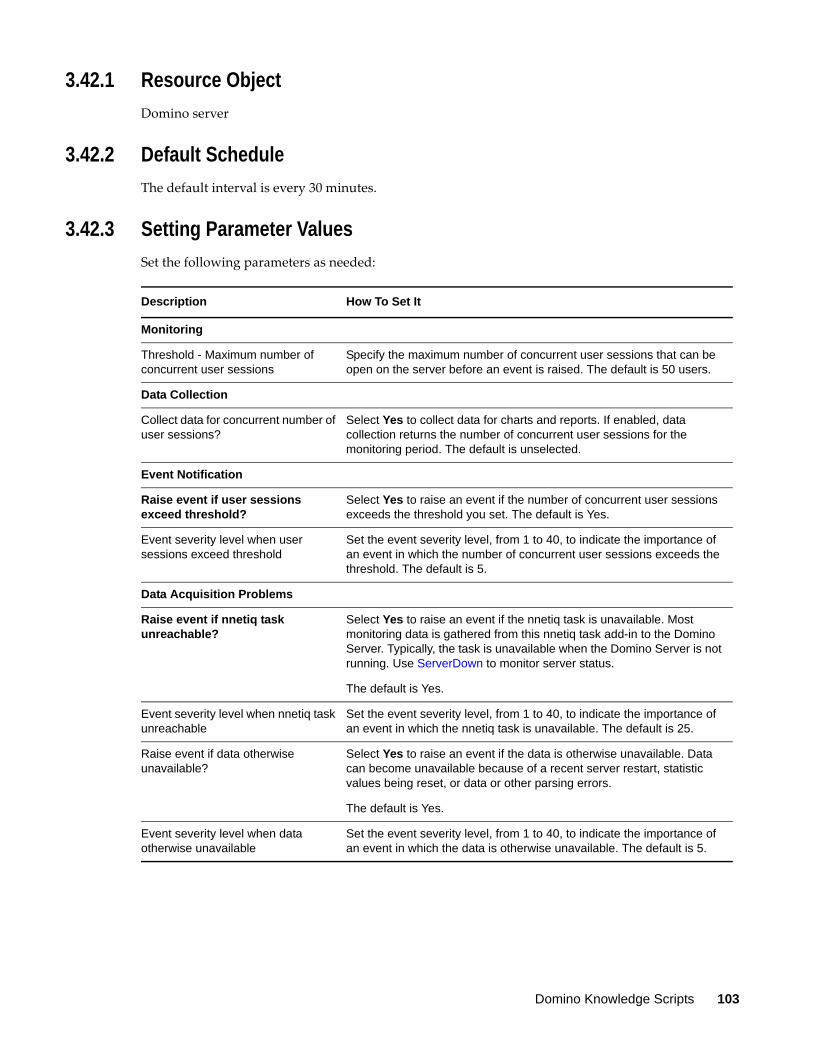
3.42.1 Resource Object
Domino server
3.42.2 Default Schedule
The default interval is every 30 minutes.
3.42.3 Setting Parameter Values
Set the following parameters as needed:
Description How To Set It
Monitoring
Threshold - Maximum number of concurrent user sessions
Specify the maximum number of concurrent user sessions that can be open on the server before an event is raised. The default is 50 users.
Data Collection
Collect data for concurrent number of user sessions?
Select Yes to collect data for charts and reports. If enabled, data collection returns the number of concurrent user sessions for the monitoring period. The default is unselected.
Event Notification
Raise event if user sessions exceed threshold?
Select Yes to raise an event if the number of concurrent user sessions exceeds the threshold you set. The default is Yes.
Event severity level when user sessions exceed threshold
Set the event severity level, from 1 to 40, to indicate the importance of an event in which the number of concurrent user sessions exceeds the threshold. The default is 5.
Data Acquisition Problems
Raise event if nnetiq task unreachable?
Select Yes to raise an event if the nnetiq task is unavailable. Most monitoring data is gathered from this nnetiq task add-in to the Domino Server. Typically, the task is unavailable when the Domino Server is not running. Use ServerDown to monitor server status.
The default is Yes.
Event severity level when nnetiq task unreachable
Set the event severity level, from 1 to 40, to indicate the importance of an event in which the nnetiq task is unavailable. The default is 25.
Raise event if data otherwise unavailable?
Select Yes to raise an event if the data is otherwise unavailable. Data can become unavailable because of a recent server restart, statistic values being reset, or data or other parsing errors.
The default is Yes.
Event severity level when data otherwise unavailable
Set the event severity level, from 1 to 40, to indicate the importance of an event in which the data is otherwise unavailable. The default is 5.
Domino Knowledge Scripts 103
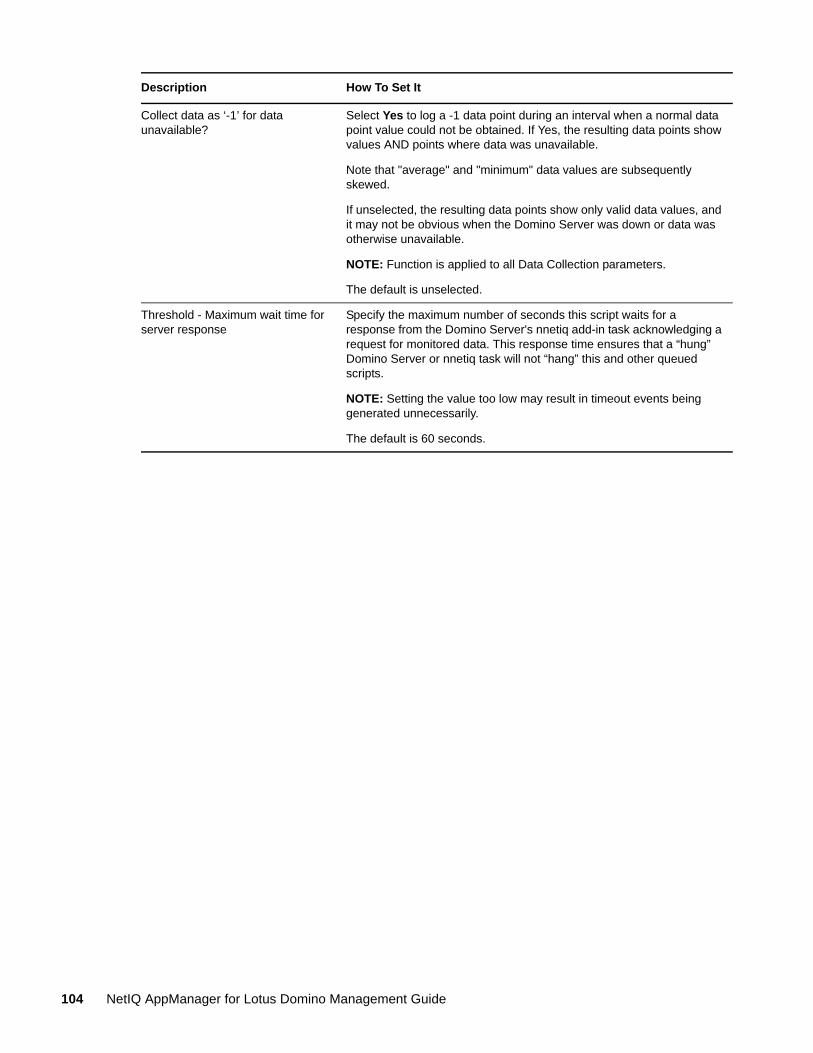
Collect data as ‘-1’ for data unavailable?
Select Yes to log a -1 data point during an interval when a normal data point value could not be obtained. If Yes, the resulting data points show values AND points where data was unavailable.
Note that "average" and "minimum" data values are subsequently skewed.
If unselected, the resulting data points show only valid data values, and it may not be obvious when the Domino Server was down or data was otherwise unavailable.
NOTE: Function is applied to all Data Collection parameters.
The default is unselected.
Threshold - Maximum wait time for server response
Specify the maximum number of seconds this script waits for a response from the Domino Server's nnetiq add-in task acknowledging a request for monitored data. This response time ensures that a “hung” Domino Server or nnetiq task will not “hang” this and other queued scripts.
NOTE: Setting the value too low may result in timeout events being generated unnecessarily.
The default is 60 seconds.
Description How To Set It
104 NetIQ AppManager for Lotus Domino Management Guide