netflix inc. (nyse: nflx) - tippie college of business...
TRANSCRIPT
`
Analysts:
Jordyn Steinkritz [email protected] Chase Koschmeder [email protected]
Company Overview Netflix, Inc. is the largest internet television network in the world. Created in 1997, Netflix’s original business was sending DVD’s to its members through the mail. While Netflix’s DVD mail business still exists, it is much smaller than its streaming services. Today, the company streams movies, television shows, and documentaries with no commercials to members for a small monthly fee. Since beginning its online streaming service in 2007, Netflix has exponentially grown its domestic and international memberships. Netflix’s early and large capital expenditures in licensed and original content has given the company a significant competitive advantage over its competitors. Internationally, Netflix operates in over 190 countries, and is constantly looking to expand into new markets.
Stock Performance Highlights 52 Week High $148.29
52 Week Low $84.50
Beta 1.2
Share Highlights Market Capitalization 63.38B
Shares Outstanding 429,520,000
P/E (forward) 100.17
Gross Margin 32.0%
EPS (2016) $0.44
Company Performance Highlights ROA 2.0%
ROE 7.0%
Financial Ratios Current Ratio 21.96
Debt to Equity 4.07
Current Price: $147.25
Target Price Range: $160.21 - $166.41
Key Investment Highlights
• Favorable Economic Outlook – Key macroeconomic factors such as rising real GDP and increasing consumer spending are creating a variety of investment opportunities within the consumer discretionary sector. Consumer confidence is at an all-time high and driving growth in the discretionary goods and services market.
• Original content creates a competitive advantage – Netflix will continue spending billions of dollars to produce award winning original content that viewers cannot access anywhere else, creating a strong sense of brand loyalty as well as giving the company a competitive advantage over peer companies.
• Opportunities for international membership growth – Currently operating in 190 markets, Netflix plans to continue to expand into new countries and inspire strong membership growth rates by creating a more diversified content library.
• Limited revenue streams and increasing competition – The large dependence on monthly membership rates reduces Netflix's capability to generate revenue from other business activities. Competitors like Amazon and Hulu are making large headway when it comes to streaming content and producing original series, which will force Netflix to keep rates low.
• Negative free cash flow – high costs to produce premium original content and obtain licensing has resulted in historical and expected negative free cash flow in the near future.
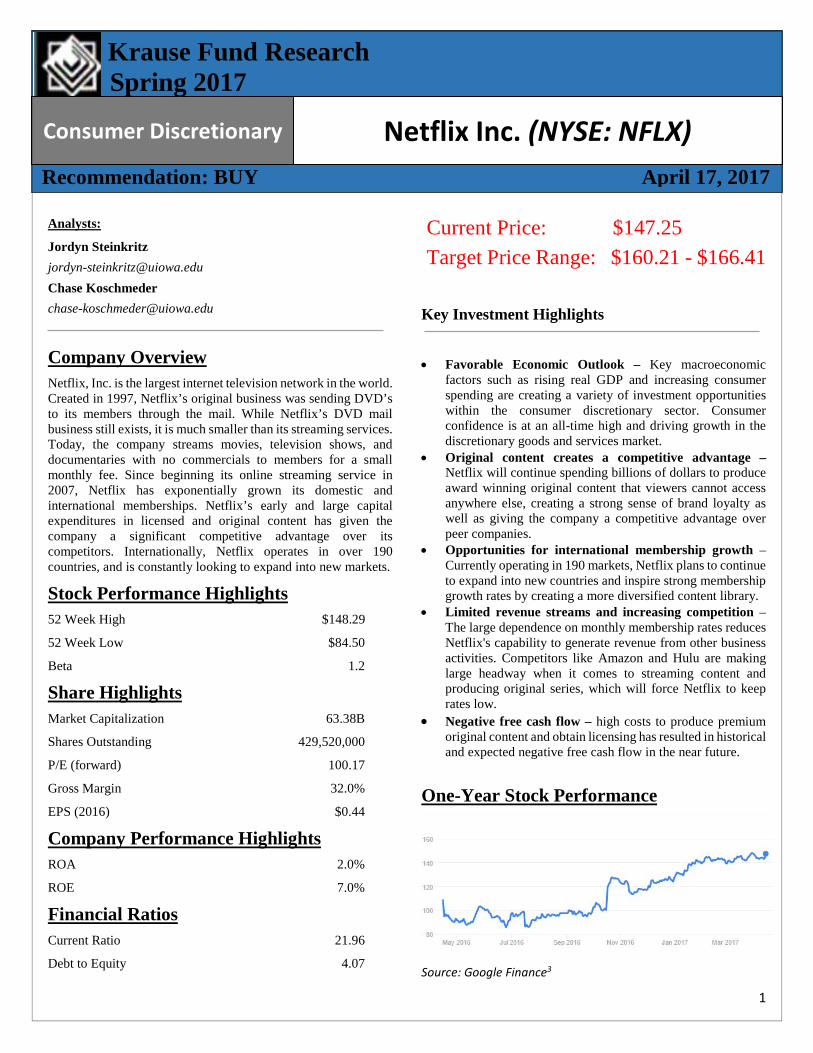
One-Year Stock Performance
Source: Google Finance3
Krause Fund Research Spring 2017
Recommendation: BUY April 17, 2017
Consumer Discretionary Netflix Inc. (NYSE: NFLX)
1
As of April 18, 2017 our University of Iowa Krause Fund analyst team recommends a “buy” rating for Netflix Inc. stock. There are many factors we considered when determining a target price for the stock. Those factors are explained in detail in the following report. One key factor that led to our “buy” rating of Netflix is the company’s plethora of growth opportunities domestically and internationally that are expected to expand Netflix’s total subscriber base to over 200 million people. Netflix plans to expand its award-winning original content line-up and slowly decrease its dependence on licensing content – a move we expect to increase margins over time. We also expect Netflix's operating and revenue margins to greatly improve in 2020 when growth rates begin to slow down and the company shifts its focus to increasing cost efficiency. Our primary concerns with the company arise from their limited revenue generating business segments as the entirety of their business is based on their membership base. With a favorable economic outlook and trends shifting to online TV, we believe Netflix will become a common household commodity.
U.S. Real Gross Domestic Product
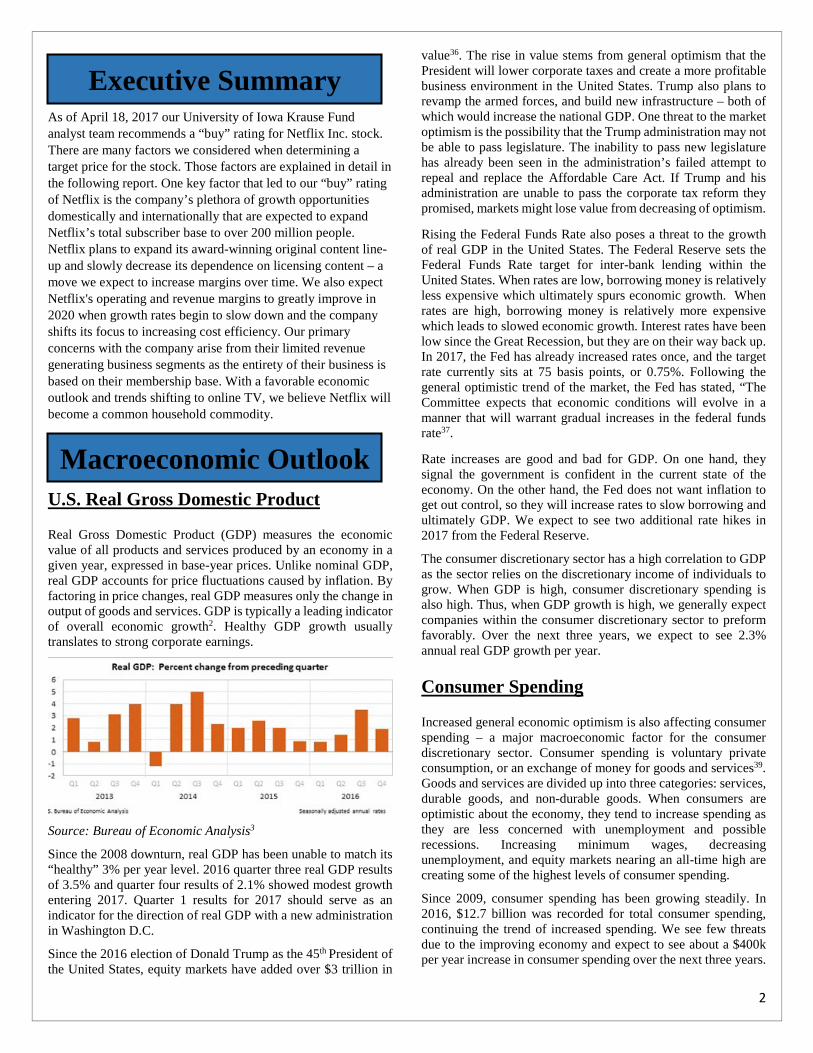
Real Gross Domestic Product (GDP) measures the economic value of all products and services produced by an economy in a given year, expressed in base-year prices. Unlike nominal GDP, real GDP accounts for price fluctuations caused by inflation. By factoring in price changes, real GDP measures only the change in output of goods and services. GDP is typically a leading indicator of overall economic growth2. Healthy GDP growth usually translates to strong corporate earnings.
Source: Bureau of Economic Analysis3
Since the 2008 downturn, real GDP has been unable to match its “healthy” 3% per year level. 2016 quarter three real GDP results of 3.5% and quarter four results of 2.1% showed modest growth entering 2017. Quarter 1 results for 2017 should serve as an indicator for the direction of real GDP with a new administration in Washington D.C.
Since the 2016 election of Donald Trump as the 45th President of the United States, equity markets have added over $3 trillion in
value36. The rise in value stems from general optimism that the President will lower corporate taxes and create a more profitable business environment in the United States. Trump also plans to revamp the armed forces, and build new infrastructure – both of which would increase the national GDP. One threat to the market optimism is the possibility that the Trump administration may not be able to pass legislature. The inability to pass new legislature has already been seen in the administration’s failed attempt to repeal and replace the Affordable Care Act. If Trump and his administration are unable to pass the corporate tax reform they promised, markets might lose value from decreasing of optimism.
Rising the Federal Funds Rate also poses a threat to the growth of real GDP in the United States. The Federal Reserve sets the Federal Funds Rate target for inter-bank lending within the United States. When rates are low, borrowing money is relatively less expensive which ultimately spurs economic growth. When rates are high, borrowing money is relatively more expensive which leads to slowed economic growth. Interest rates have been low since the Great Recession, but they are on their way back up. In 2017, the Fed has already increased rates once, and the target rate currently sits at 75 basis points, or 0.75%. Following the general optimistic trend of the market, the Fed has stated, “The Committee expects that economic conditions will evolve in a manner that will warrant gradual increases in the federal funds rate37.
Rate increases are good and bad for GDP. On one hand, they signal the government is confident in the current state of the economy. On the other hand, the Fed does not want inflation to get out control, so they will increase rates to slow borrowing and ultimately GDP. We expect to see two additional rate hikes in 2017 from the Federal Reserve.
The consumer discretionary sector has a high correlation to GDP as the sector relies on the discretionary income of individuals to grow. When GDP is high, consumer discretionary spending is also high. Thus, when GDP growth is high, we generally expect companies within the consumer discretionary sector to preform favorably. Over the next three years, we expect to see 2.3% annual real GDP growth per year.
Consumer Spending
Increased general economic optimism is also affecting consumer spending – a major macroeconomic factor for the consumer discretionary sector. Consumer spending is voluntary private consumption, or an exchange of money for goods and services39. Goods and services are divided up into three categories: services, durable goods, and non-durable goods. When consumers are optimistic about the economy, they tend to increase spending as they are less concerned with unemployment and possible recessions. Increasing minimum wages, decreasing unemployment, and equity markets nearing an all-time high are creating some of the highest levels of consumer spending.
Since 2009, consumer spending has been growing steadily. In 2016, $12.7 billion was recorded for total consumer spending, continuing the trend of increased spending. We see few threats due to the improving economy and expect to see about a $400k per year increase in consumer spending over the next three years.
Macroeconomic Outlook
Executive Summary
2
Source: Bureau of Economic Analysis 40
Consumer Confidence Index The Consumer Confidence Index (CCI) measures the level of consumer optimism or pessimism with regards to the economy. Five thousand homes are surveyed every month with five questions to calculate the CCI index. If the index shows consumers are more optimistic, then they are more likely to purchase goods and services – stimulating the economy.
Source: Bloomberg25
The CCI is currently at an all-time high due to high future expectations about the U.S. economy. We predict that the CCI will increase at a slower rate as excitement from the recent U.S. election wears off. High consumer confidence levels positively affect the consumer discretionary sector. Therefore, we believe companies within the sector are in a better position to perform well relative to other sectors.
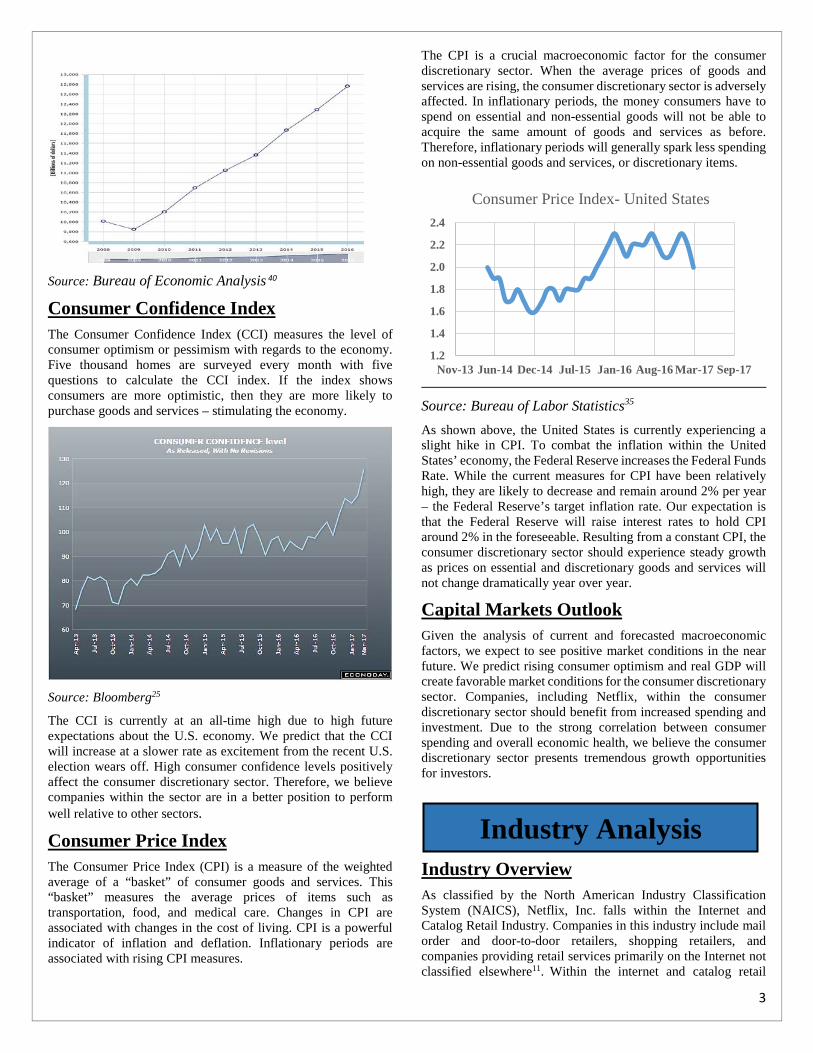
Consumer Price Index The Consumer Price Index (CPI) is a measure of the weighted average of a “basket” of consumer goods and services. This “basket” measures the average prices of items such as transportation, food, and medical care. Changes in CPI are associated with changes in the cost of living. CPI is a powerful indicator of inflation and deflation. Inflationary periods are associated with rising CPI measures.
The CPI is a crucial macroeconomic factor for the consumer discretionary sector. When the average prices of goods and services are rising, the consumer discretionary sector is adversely affected. In inflationary periods, the money consumers have to spend on essential and non-essential goods will not be able to acquire the same amount of goods and services as before. Therefore, inflationary periods will generally spark less spending on non-essential goods and services, or discretionary items.
Source: Bureau of Labor Statistics35
As shown above, the United States is currently experiencing a slight hike in CPI. To combat the inflation within the United States’ economy, the Federal Reserve increases the Federal Funds Rate. While the current measures for CPI have been relatively high, they are likely to decrease and remain around 2% per year – the Federal Reserve’s target inflation rate. Our expectation is that the Federal Reserve will raise interest rates to hold CPI around 2% in the foreseeable. Resulting from a constant CPI, the consumer discretionary sector should experience steady growth as prices on essential and discretionary goods and services will not change dramatically year over year.
Capital Markets Outlook Given the analysis of current and forecasted macroeconomic factors, we expect to see positive market conditions in the near future. We predict rising consumer optimism and real GDP will create favorable market conditions for the consumer discretionary sector. Companies, including Netflix, within the consumer discretionary sector should benefit from increased spending and investment. Due to the strong correlation between consumer spending and overall economic health, we believe the consumer discretionary sector presents tremendous growth opportunities for investors.
Industry Overview As classified by the North American Industry Classification System (NAICS), Netflix, Inc. falls within the Internet and Catalog Retail Industry. Companies in this industry include mail order and door-to-door retailers, shopping retailers, and companies providing retail services primarily on the Internet not classified elsewhere11. Within the internet and catalog retail
1.2
1.4
1.6
1.8
2.0
2.2
2.4
Nov-13 Jun-14 Dec-14 Jul-15 Jan-16 Aug-16 Mar-17 Sep-17
Consumer Price Index- United States
Industry Analysis
3
industry, Netflix competes with other companies to provide quality content to viewers around the world.
Traditional cable companies like Disney, NBC, and Fox have competed for decades over the best "prime time" line-ups of television shows. "Prime-time" has traditionally been 8:00 p.m. to 11:00 p.m. Monday through Friday. However, diversifying consumer preferences have shifted the notion of "prime time." Today, viewers want to watch content in their free time, not necessarily at a set time every day. Due to changing consumer preferences, the industry has begun a major shift in the way content is offered. Instead of watching on actual television sets, viewers want the convenience of watching their favorite content anywhere at any time. Advancements in mobile technology have enabled change within the industry, and have provided opportunities for new companies to enter the market. Companies like Netflix, Amazon, and Hulu have begun competing head-to-head with the traditional companies that originally offered content through television sets.
Up from 42% in 2015, 50% of all households in the United States had monthly subscriptions to Netflix, Amazon, or Hulu in 201612. As more consumers purchase monthly subscriptions, the average time people are watching live TV is declining. From 2015 to 2016, the number of live TV hours watched per week by people under the age of 24 decreased by two hours. 24 to 35-year old's watched an hour less per week of live TV on average in 201612. Based on the growth of the millennial generation and shift in viewing preferences, we predict the percentage of households with a monthly video streaming subscription to reach 60% in the next five years.
Source: Statista13
Above is historical data for video subscription revenue in the United States since 2011. Following the trend of expanding revenues over the past six years, we expect to see the total revenue from streaming video subscriptions grow at 10% CAGR (Compounded Annual Growth Rate) for the next three years. Continuous technological advancements that enable individuals to access the internet more easily are a key catalyst for companies in the industry. We expect continual viewership preference changes, and ease of access to online content to expand the total revenue within the United States.
Industry Leaders & Followers
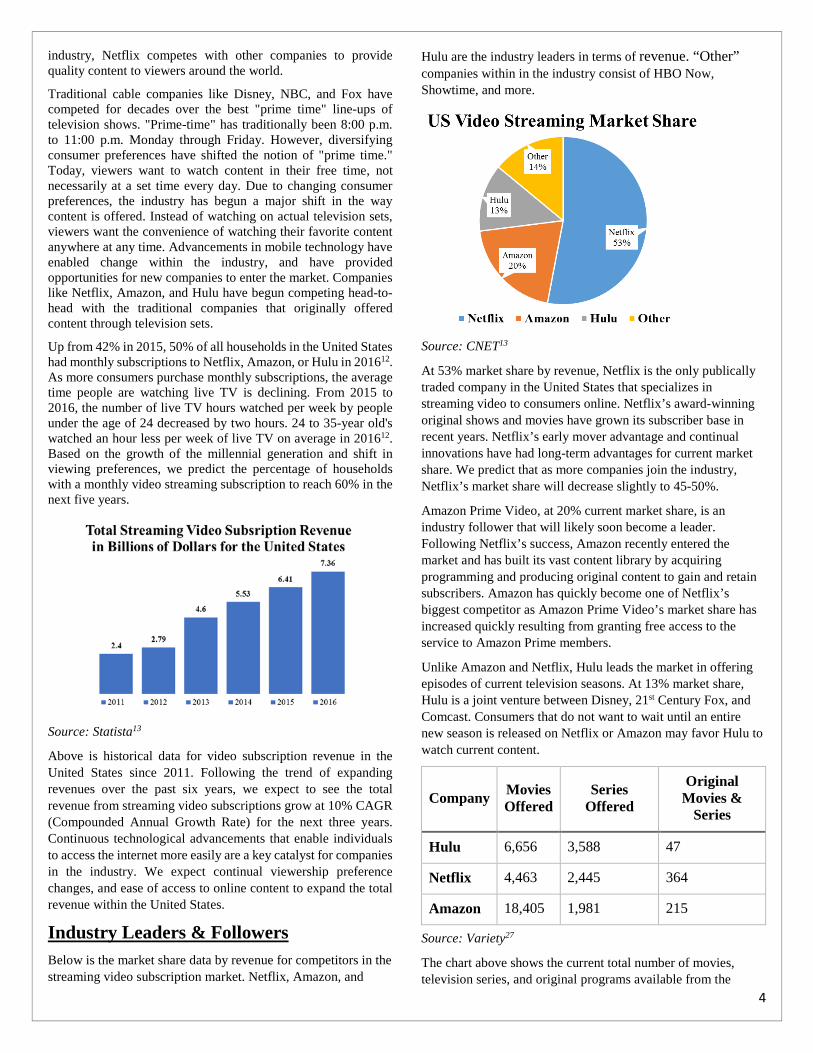
Below is the market share data by revenue for competitors in the streaming video subscription market. Netflix, Amazon, and
Hulu are the industry leaders in terms of revenue. “Other” companies within in the industry consist of HBO Now, Showtime, and more.
Source: CNET13
At 53% market share by revenue, Netflix is the only publically traded company in the United States that specializes in streaming video to consumers online. Netflix’s award-winning original shows and movies have grown its subscriber base in recent years. Netflix’s early mover advantage and continual innovations have had long-term advantages for current market share. We predict that as more companies join the industry, Netflix’s market share will decrease slightly to 45-50%.
Amazon Prime Video, at 20% current market share, is an industry follower that will likely soon become a leader. Following Netflix’s success, Amazon recently entered the market and has built its vast content library by acquiring programming and producing original content to gain and retain subscribers. Amazon has quickly become one of Netflix’s biggest competitor as Amazon Prime Video’s market share has increased quickly resulting from granting free access to the service to Amazon Prime members.
Unlike Amazon and Netflix, Hulu leads the market in offering episodes of current television seasons. At 13% market share, Hulu is a joint venture between Disney, 21st Century Fox, and Comcast. Consumers that do not want to wait until an entire new season is released on Netflix or Amazon may favor Hulu to watch current content.
Company Movies Offered
Series Offered
Original Movies &
Series
Hulu 6,656 3,588 47
Netflix 4,463 2,445 364
Amazon 18,405 1,981 215
Source: Variety27
The chart above shows the current total number of movies, television series, and original programs available from the
4
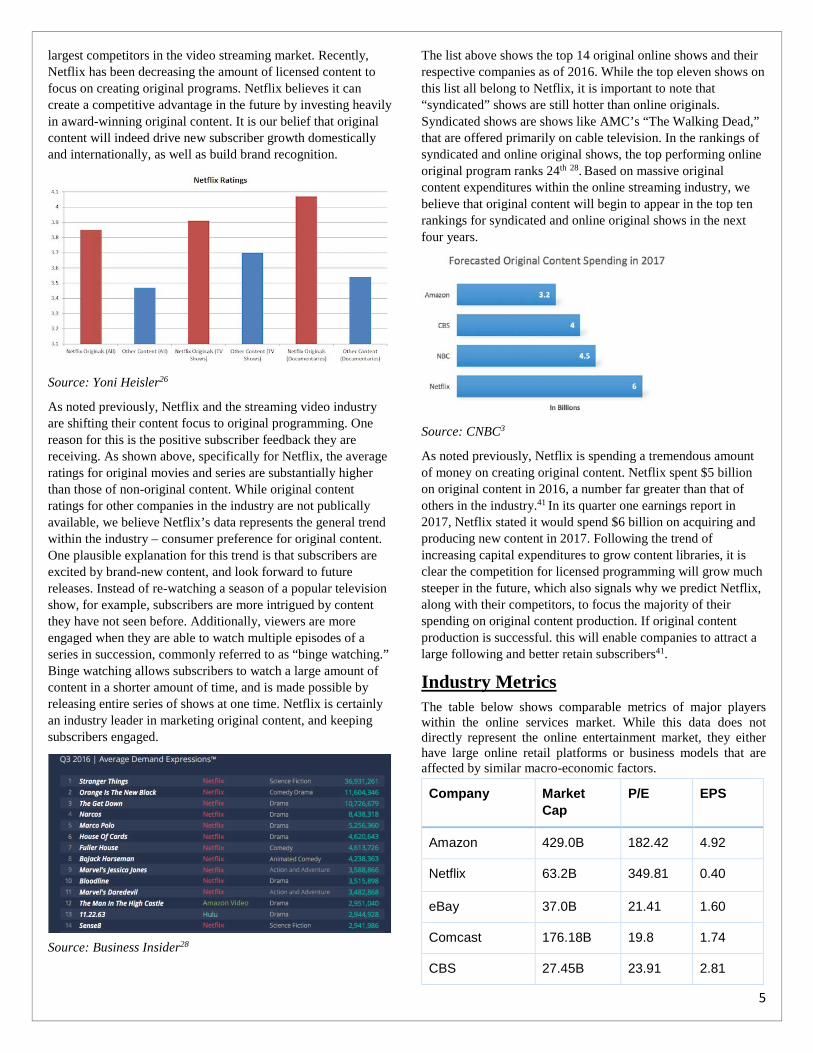
largest competitors in the video streaming market. Recently, Netflix has been decreasing the amount of licensed content to focus on creating original programs. Netflix believes it can create a competitive advantage in the future by investing heavily in award-winning original content. It is our belief that original content will indeed drive new subscriber growth domestically and internationally, as well as build brand recognition.
Source: Yoni Heisler26
As noted previously, Netflix and the streaming video industry are shifting their content focus to original programming. One reason for this is the positive subscriber feedback they are receiving. As shown above, specifically for Netflix, the average ratings for original movies and series are substantially higher than those of non-original content. While original content ratings for other companies in the industry are not publically available, we believe Netflix’s data represents the general trend within the industry – consumer preference for original content. One plausible explanation for this trend is that subscribers are excited by brand-new content, and look forward to future releases. Instead of re-watching a season of a popular television show, for example, subscribers are more intrigued by content they have not seen before. Additionally, viewers are more engaged when they are able to watch multiple episodes of a series in succession, commonly referred to as “binge watching.” Binge watching allows subscribers to watch a large amount of content in a shorter amount of time, and is made possible by releasing entire series of shows at one time. Netflix is certainly an industry leader in marketing original content, and keeping subscribers engaged.
Source: Business Insider28
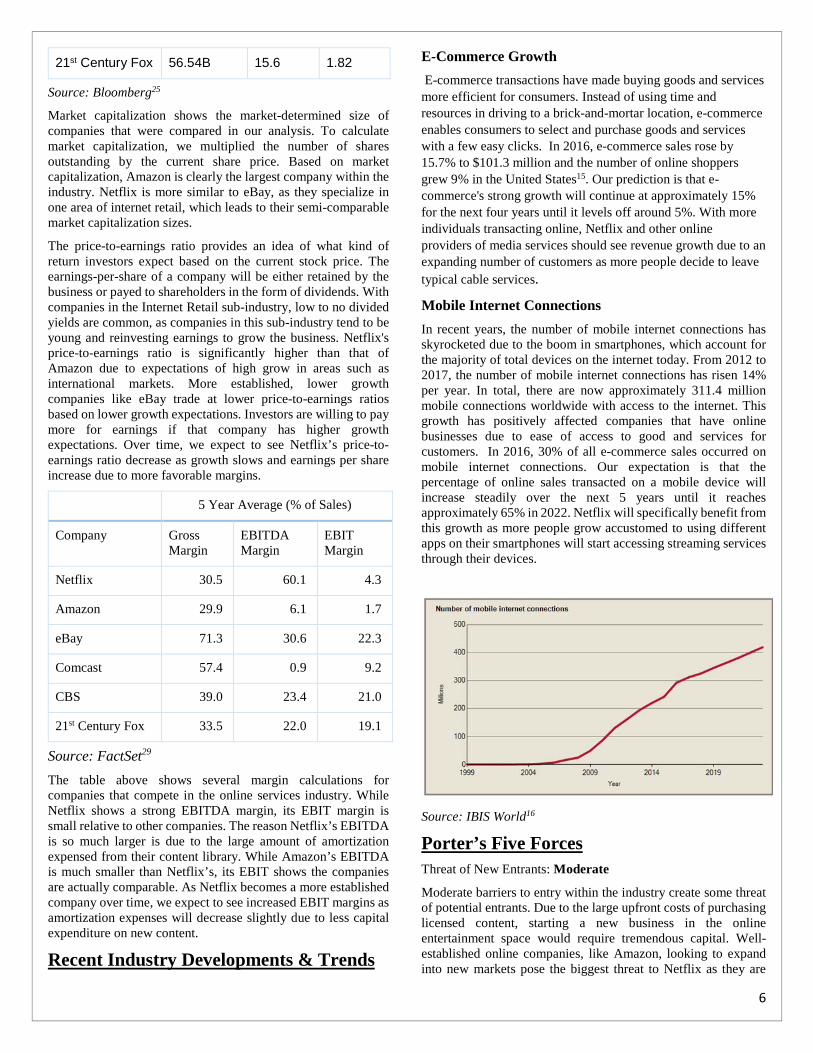
The list above shows the top 14 original online shows and their respective companies as of 2016. While the top eleven shows on this list all belong to Netflix, it is important to note that “syndicated” shows are still hotter than online originals. Syndicated shows are shows like AMC’s “The Walking Dead,” that are offered primarily on cable television. In the rankings of syndicated and online original shows, the top performing online original program ranks 24th 28. Based on massive original content expenditures within the online streaming industry, we believe that original content will begin to appear in the top ten rankings for syndicated and online original shows in the next four years.
Source: CNBC3
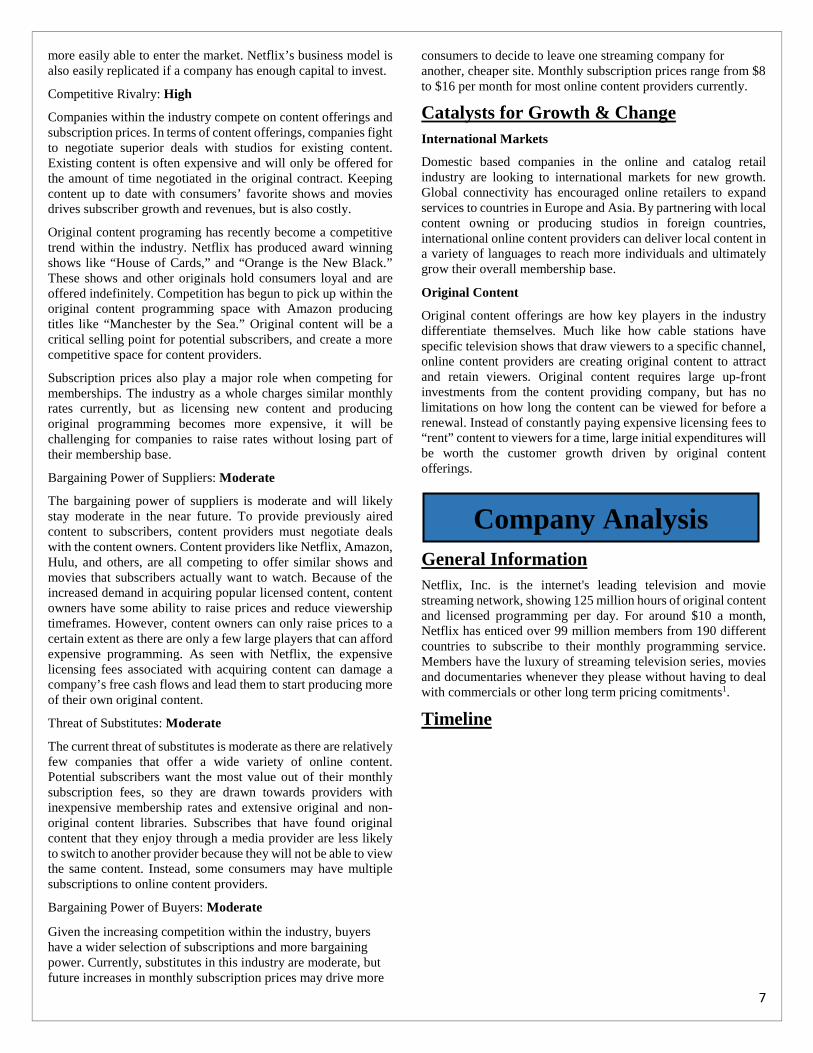
As noted previously, Netflix is spending a tremendous amount of money on creating original content. Netflix spent $5 billion on original content in 2016, a number far greater than that of others in the industry.41 In its quarter one earnings report in 2017, Netflix stated it would spend $6 billion on acquiring and producing new content in 2017. Following the trend of increasing capital expenditures to grow content libraries, it is clear the competition for licensed programming will grow much steeper in the future, which also signals why we predict Netflix, along with their competitors, to focus the majority of their spending on original content production. If original content production is successful. this will enable companies to attract a large following and better retain subscribers41.
Industry Metrics The table below shows comparable metrics of major players within the online services market. While this data does not directly represent the online entertainment market, they either have large online retail platforms or business models that are affected by similar macro-economic factors.
Company Market Cap
P/E EPS
Amazon 429.0B 182.42 4.92
Netflix 63.2B 349.81 0.40
eBay 37.0B 21.41 1.60
Comcast 176.18B 19.8 1.74
CBS 27.45B 23.91 2.81
5
21st Century Fox 56.54B 15.6 1.82
Source: Bloomberg25
Market capitalization shows the market-determined size of companies that were compared in our analysis. To calculate market capitalization, we multiplied the number of shares outstanding by the current share price. Based on market capitalization, Amazon is clearly the largest company within the industry. Netflix is more similar to eBay, as they specialize in one area of internet retail, which leads to their semi-comparable market capitalization sizes.
The price-to-earnings ratio provides an idea of what kind of return investors expect based on the current stock price. The earnings-per-share of a company will be either retained by the business or payed to shareholders in the form of dividends. With companies in the Internet Retail sub-industry, low to no divided yields are common, as companies in this sub-industry tend to be young and reinvesting earnings to grow the business. Netflix's price-to-earnings ratio is significantly higher than that of Amazon due to expectations of high grow in areas such as international markets. More established, lower growth companies like eBay trade at lower price-to-earnings ratios based on lower growth expectations. Investors are willing to pay more for earnings if that company has higher growth expectations. Over time, we expect to see Netflix’s price-to-earnings ratio decrease as growth slows and earnings per share increase due to more favorable margins.
5 Year Average (% of Sales)
Company Gross Margin
EBITDA Margin
EBIT Margin
Netflix 30.5 60.1 4.3
Amazon 29.9 6.1 1.7
eBay 71.3 30.6 22.3
Comcast 57.4 0.9 9.2
CBS 39.0 23.4 21.0
21st Century Fox 33.5 22.0 19.1
Source: FactSet29
The table above shows several margin calculations for companies that compete in the online services industry. While Netflix shows a strong EBITDA margin, its EBIT margin is small relative to other companies. The reason Netflix’s EBITDA is so much larger is due to the large amount of amortization expensed from their content library. While Amazon’s EBITDA is much smaller than Netflix’s, its EBIT shows the companies are actually comparable. As Netflix becomes a more established company over time, we expect to see increased EBIT margins as amortization expenses will decrease slightly due to less capital expenditure on new content.
Recent Industry Developments & Trends
E-Commerce Growth E-commerce transactions have made buying goods and services more efficient for consumers. Instead of using time and resources in driving to a brick-and-mortar location, e-commerce enables consumers to select and purchase goods and services with a few easy clicks. In 2016, e-commerce sales rose by 15.7% to $101.3 million and the number of online shoppers grew 9% in the United States15. Our prediction is that e-commerce's strong growth will continue at approximately 15% for the next four years until it levels off around 5%. With more individuals transacting online, Netflix and other online providers of media services should see revenue growth due to an expanding number of customers as more people decide to leave typical cable services.
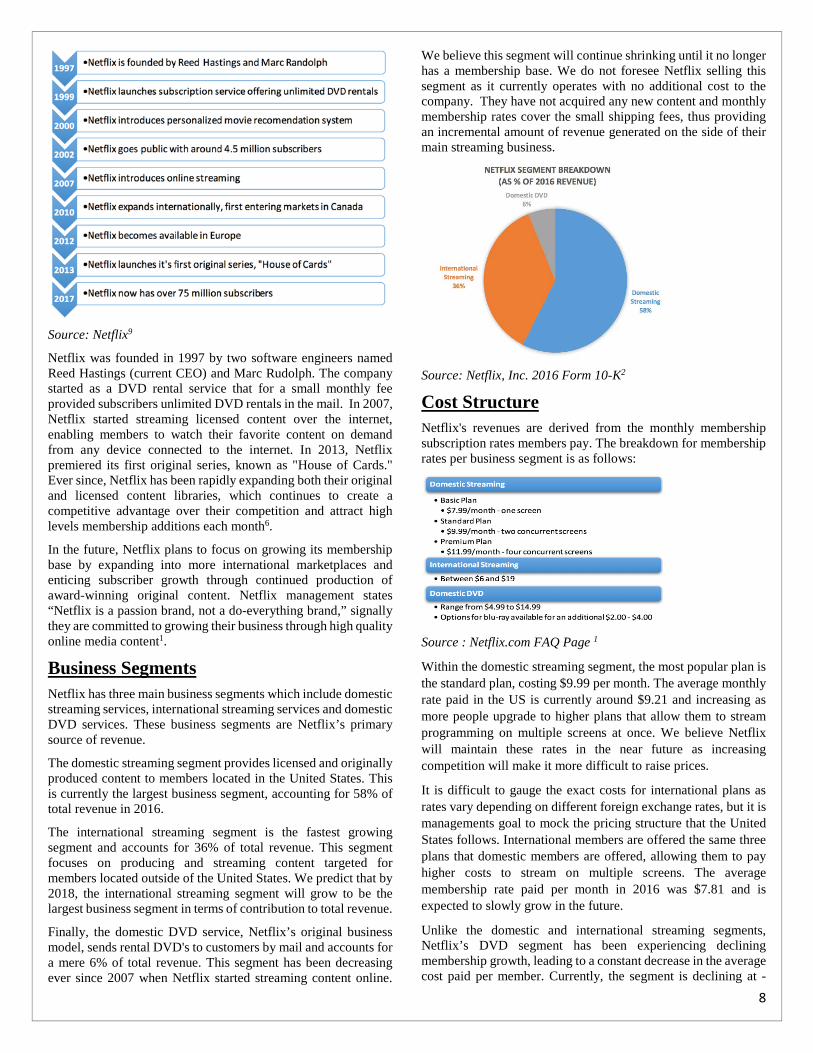
Mobile Internet Connections In recent years, the number of mobile internet connections has skyrocketed due to the boom in smartphones, which account for the majority of total devices on the internet today. From 2012 to 2017, the number of mobile internet connections has risen 14% per year. In total, there are now approximately 311.4 million mobile connections worldwide with access to the internet. This growth has positively affected companies that have online businesses due to ease of access to good and services for customers. In 2016, 30% of all e-commerce sales occurred on mobile internet connections. Our expectation is that the percentage of online sales transacted on a mobile device will increase steadily over the next 5 years until it reaches approximately 65% in 2022. Netflix will specifically benefit from this growth as more people grow accustomed to using different apps on their smartphones will start accessing streaming services through their devices.
Source: IBIS World16
Porter’s Five Forces Threat of New Entrants: Moderate
Moderate barriers to entry within the industry create some threat of potential entrants. Due to the large upfront costs of purchasing licensed content, starting a new business in the online entertainment space would require tremendous capital. Well-established online companies, like Amazon, looking to expand into new markets pose the biggest threat to Netflix as they are
6
more easily able to enter the market. Netflix’s business model is also easily replicated if a company has enough capital to invest.
Competitive Rivalry: High
Companies within the industry compete on content offerings and subscription prices. In terms of content offerings, companies fight to negotiate superior deals with studios for existing content. Existing content is often expensive and will only be offered for the amount of time negotiated in the original contract. Keeping content up to date with consumers’ favorite shows and movies drives subscriber growth and revenues, but is also costly.
Original content programing has recently become a competitive trend within the industry. Netflix has produced award winning shows like “House of Cards,” and “Orange is the New Black.” These shows and other originals hold consumers loyal and are offered indefinitely. Competition has begun to pick up within the original content programming space with Amazon producing titles like “Manchester by the Sea.” Original content will be a critical selling point for potential subscribers, and create a more competitive space for content providers.
Subscription prices also play a major role when competing for memberships. The industry as a whole charges similar monthly rates currently, but as licensing new content and producing original programming becomes more expensive, it will be challenging for companies to raise rates without losing part of their membership base.
Bargaining Power of Suppliers: Moderate
The bargaining power of suppliers is moderate and will likely stay moderate in the near future. To provide previously aired content to subscribers, content providers must negotiate deals with the content owners. Content providers like Netflix, Amazon, Hulu, and others, are all competing to offer similar shows and movies that subscribers actually want to watch. Because of the increased demand in acquiring popular licensed content, content owners have some ability to raise prices and reduce viewership timeframes. However, content owners can only raise prices to a certain extent as there are only a few large players that can afford expensive programming. As seen with Netflix, the expensive licensing fees associated with acquiring content can damage a company’s free cash flows and lead them to start producing more of their own original content.
Threat of Substitutes: Moderate
The current threat of substitutes is moderate as there are relatively few companies that offer a wide variety of online content. Potential subscribers want the most value out of their monthly subscription fees, so they are drawn towards providers with inexpensive membership rates and extensive original and non-original content libraries. Subscribes that have found original content that they enjoy through a media provider are less likely to switch to another provider because they will not be able to view the same content. Instead, some consumers may have multiple subscriptions to online content providers.
Bargaining Power of Buyers: Moderate
Given the increasing competition within the industry, buyers have a wider selection of subscriptions and more bargaining power. Currently, substitutes in this industry are moderate, but future increases in monthly subscription prices may drive more
consumers to decide to leave one streaming company for another, cheaper site. Monthly subscription prices range from $8 to $16 per month for most online content providers currently.
Catalysts for Growth & Change International Markets
Domestic based companies in the online and catalog retail industry are looking to international markets for new growth. Global connectivity has encouraged online retailers to expand services to countries in Europe and Asia. By partnering with local content owning or producing studios in foreign countries, international online content providers can deliver local content in a variety of languages to reach more individuals and ultimately grow their overall membership base.
Original Content
Original content offerings are how key players in the industry differentiate themselves. Much like how cable stations have specific television shows that draw viewers to a specific channel, online content providers are creating original content to attract and retain viewers. Original content requires large up-front investments from the content providing company, but has no limitations on how long the content can be viewed for before a renewal. Instead of constantly paying expensive licensing fees to “rent” content to viewers for a time, large initial expenditures will be worth the customer growth driven by original content offerings.
General Information Netflix, Inc. is the internet's leading television and movie streaming network, showing 125 million hours of original content and licensed programming per day. For around $10 a month, Netflix has enticed over 99 million members from 190 different countries to subscribe to their monthly programming service. Members have the luxury of streaming television series, movies and documentaries whenever they please without having to deal with commercials or other long term pricing comitments1.
Timeline
Company Analysis
7
Source: Netflix9
Netflix was founded in 1997 by two software engineers named Reed Hastings (current CEO) and Marc Rudolph. The company started as a DVD rental service that for a small monthly fee provided subscribers unlimited DVD rentals in the mail. In 2007, Netflix started streaming licensed content over the internet, enabling members to watch their favorite content on demand from any device connected to the internet. In 2013, Netflix premiered its first original series, known as "House of Cards." Ever since, Netflix has been rapidly expanding both their original and licensed content libraries, which continues to create a competitive advantage over their competition and attract high levels membership additions each month6.
In the future, Netflix plans to focus on growing its membership base by expanding into more international marketplaces and enticing subscriber growth through continued production of award-winning original content. Netflix management states “Netflix is a passion brand, not a do-everything brand,” signally they are committed to growing their business through high quality online media content1.
Business Segments Netflix has three main business segments which include domestic streaming services, international streaming services and domestic DVD services. These business segments are Netflix’s primary source of revenue.
The domestic streaming segment provides licensed and originally produced content to members located in the United States. This is currently the largest business segment, accounting for 58% of total revenue in 2016.
The international streaming segment is the fastest growing segment and accounts for 36% of total revenue. This segment focuses on producing and streaming content targeted for members located outside of the United States. We predict that by 2018, the international streaming segment will grow to be the largest business segment in terms of contribution to total revenue.
Finally, the domestic DVD service, Netflix’s original business model, sends rental DVD's to customers by mail and accounts for a mere 6% of total revenue. This segment has been decreasing ever since 2007 when Netflix started streaming content online.
We believe this segment will continue shrinking until it no longer has a membership base. We do not foresee Netflix selling this segment as it currently operates with no additional cost to the company. They have not acquired any new content and monthly membership rates cover the small shipping fees, thus providing an incremental amount of revenue generated on the side of their main streaming business.
Source: Netflix, Inc. 2016 Form 10-K2
Cost Structure Netflix's revenues are derived from the monthly membership subscription rates members pay. The breakdown for membership rates per business segment is as follows:
Source : Netflix.com FAQ Page 1
Within the domestic streaming segment, the most popular plan is the standard plan, costing $9.99 per month. The average monthly rate paid in the US is currently around $9.21 and increasing as more people upgrade to higher plans that allow them to stream programming on multiple screens at once. We believe Netflix will maintain these rates in the near future as increasing competition will make it more difficult to raise prices.
It is difficult to gauge the exact costs for international plans as rates vary depending on different foreign exchange rates, but it is managements goal to mock the pricing structure that the United States follows. International members are offered the same three plans that domestic members are offered, allowing them to pay higher costs to stream on multiple screens. The average membership rate paid per month in 2016 was $7.81 and is expected to slowly grow in the future.
Unlike the domestic and international streaming segments, Netflix’s DVD segment has been experiencing declining membership growth, leading to a constant decrease in the average cost paid per member. Currently, the segment is declining at -
8
0.8% per average monthly membership rate paid. We expect this growth rate to remain constant overtime.
Membership Growth Rates Netflix currently has over 99 million members worldwide, a substantial growth since 2007 when they first introduced their streaming service with a mere 6 million domestic members. From 2007 to 2011, Netflix grew its membership base 43% year over year. Since Netflix expanded their business into international markets in 2012, international membership additions have increased by an astounding 72% year over year2. Strong growth in membership rates is essential to the success of Netflix as the entire business model relies on membership rates to generate revenue.
In 2016, 4.6 million domestic memberships were added throughout the course of the year, totaling around 49 million domestic memberships. The average growth rate for membership additions in the U.S. market is still strong, around 10%, but is slowly declining as more and more households in America are subscribed to an internet streaming service. Long term, it is Netflix's goal to have 60-90 million domestic membership accounts. That being said, we have forecasted Netflix to continue growing at a slow rate until 2024, where we believe a steady rate of 3% growth in memberships will be reached.
17 million international memberships were added in 2016 as Netflix officially entered into over 130 new markets last year. No exact guidance is given in regards to the future goal of the international membership base size, but we believe growth rates will remain strong as Netflix continues to expand into new markets and produce more international focused content to intrigue a larger international membership base. Once strict regulation is lifted, Netflix plans on also entering the Chinese market in a few years which will substantially boost the total numbers of international subscribers. Our prediction for international membership growth in the long term is around 5% in the terminal year.
Source: CNBC3
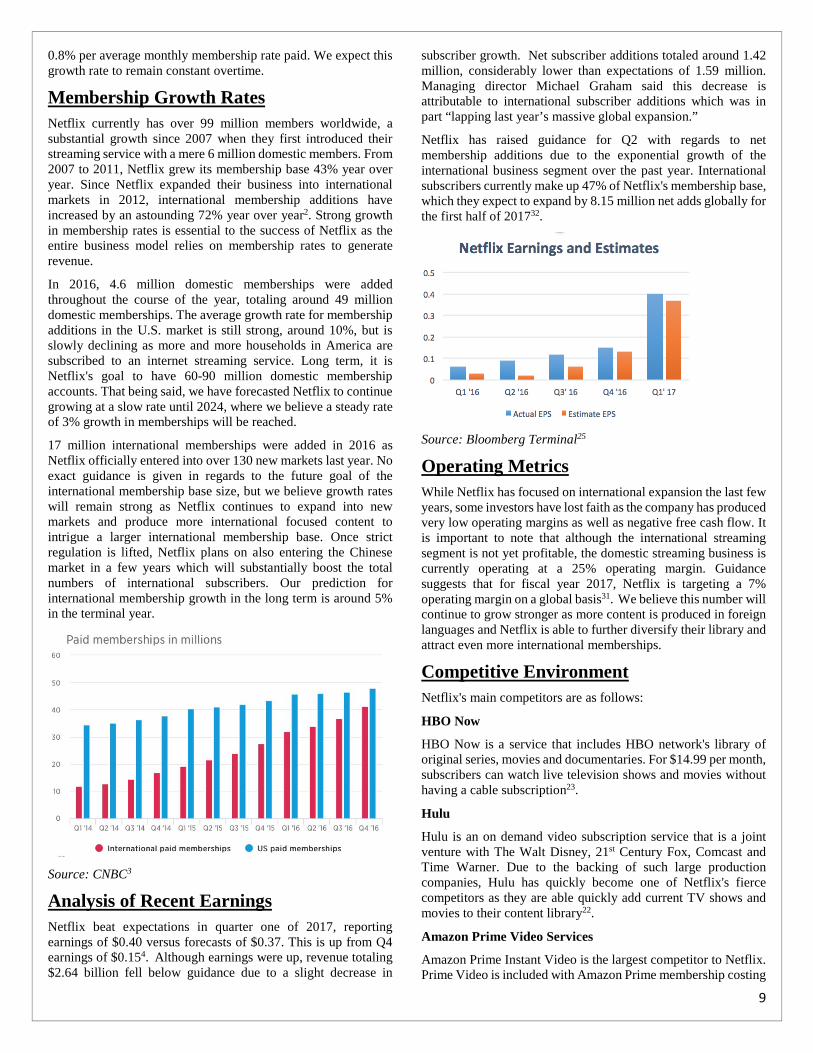
Analysis of Recent Earnings Netflix beat expectations in quarter one of 2017, reporting earnings of $0.40 versus forecasts of $0.37. This is up from Q4 earnings of $0.154. Although earnings were up, revenue totaling $2.64 billion fell below guidance due to a slight decrease in
subscriber growth. Net subscriber additions totaled around 1.42 million, considerably lower than expectations of 1.59 million. Managing director Michael Graham said this decrease is attributable to international subscriber additions which was in part “lapping last year’s massive global expansion.”
Netflix has raised guidance for Q2 with regards to net membership additions due to the exponential growth of the international business segment over the past year. International subscribers currently make up 47% of Netflix's membership base, which they expect to expand by 8.15 million net adds globally for the first half of 201732.
Source: Bloomberg Terminal25
Operating Metrics While Netflix has focused on international expansion the last few years, some investors have lost faith as the company has produced very low operating margins as well as negative free cash flow. It is important to note that although the international streaming segment is not yet profitable, the domestic streaming business is currently operating at a 25% operating margin. Guidance suggests that for fiscal year 2017, Netflix is targeting a 7% operating margin on a global basis31. We believe this number will continue to grow stronger as more content is produced in foreign languages and Netflix is able to further diversify their library and attract even more international memberships.
Competitive Environment Netflix's main competitors are as follows:
HBO Now
HBO Now is a service that includes HBO network's library of original series, movies and documentaries. For $14.99 per month, subscribers can watch live television shows and movies without having a cable subscription23.
Hulu
Hulu is an on demand video subscription service that is a joint venture with The Walt Disney, 21st Century Fox, Comcast and Time Warner. Due to the backing of such large production companies, Hulu has quickly become one of Netflix's fierce competitors as they are able quickly add current TV shows and movies to their content library22.
Amazon Prime Video Services
Amazon Prime Instant Video is the largest competitor to Netflix. Prime Video is included with Amazon Prime membership costing
9
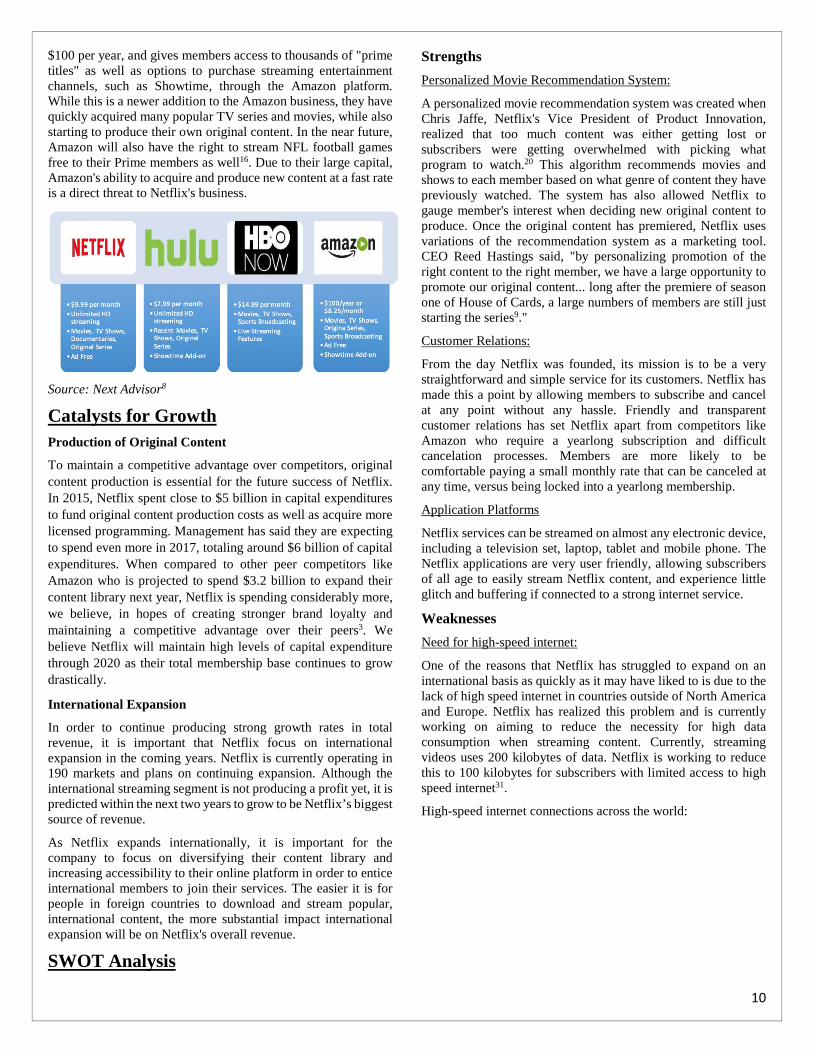
$100 per year, and gives members access to thousands of "prime titles" as well as options to purchase streaming entertainment channels, such as Showtime, through the Amazon platform. While this is a newer addition to the Amazon business, they have quickly acquired many popular TV series and movies, while also starting to produce their own original content. In the near future, Amazon will also have the right to stream NFL football games free to their Prime members as well16. Due to their large capital, Amazon's ability to acquire and produce new content at a fast rate is a direct threat to Netflix's business.
Source: Next Advisor8
Catalysts for Growth Production of Original Content
To maintain a competitive advantage over competitors, original content production is essential for the future success of Netflix. In 2015, Netflix spent close to $5 billion in capital expenditures to fund original content production costs as well as acquire more licensed programming. Management has said they are expecting to spend even more in 2017, totaling around $6 billion of capital expenditures. When compared to other peer competitors like Amazon who is projected to spend $3.2 billion to expand their content library next year, Netflix is spending considerably more, we believe, in hopes of creating stronger brand loyalty and maintaining a competitive advantage over their peers3. We believe Netflix will maintain high levels of capital expenditure through 2020 as their total membership base continues to grow drastically.
International Expansion
In order to continue producing strong growth rates in total revenue, it is important that Netflix focus on international expansion in the coming years. Netflix is currently operating in 190 markets and plans on continuing expansion. Although the international streaming segment is not producing a profit yet, it is predicted within the next two years to grow to be Netflix’s biggest source of revenue.
As Netflix expands internationally, it is important for the company to focus on diversifying their content library and increasing accessibility to their online platform in order to entice international members to join their services. The easier it is for people in foreign countries to download and stream popular, international content, the more substantial impact international expansion will be on Netflix's overall revenue.
SWOT Analysis
Strengths Personalized Movie Recommendation System:
A personalized movie recommendation system was created when Chris Jaffe, Netflix's Vice President of Product Innovation, realized that too much content was either getting lost or subscribers were getting overwhelmed with picking what program to watch.20 This algorithm recommends movies and shows to each member based on what genre of content they have previously watched. The system has also allowed Netflix to gauge member's interest when deciding new original content to produce. Once the original content has premiered, Netflix uses variations of the recommendation system as a marketing tool. CEO Reed Hastings said, "by personalizing promotion of the right content to the right member, we have a large opportunity to promote our original content... long after the premiere of season one of House of Cards, a large numbers of members are still just starting the series9."
Customer Relations:
From the day Netflix was founded, its mission is to be a very straightforward and simple service for its customers. Netflix has made this a point by allowing members to subscribe and cancel at any point without any hassle. Friendly and transparent customer relations has set Netflix apart from competitors like Amazon who require a yearlong subscription and difficult cancelation processes. Members are more likely to be comfortable paying a small monthly rate that can be canceled at any time, versus being locked into a yearlong membership.
Application Platforms
Netflix services can be streamed on almost any electronic device, including a television set, laptop, tablet and mobile phone. The Netflix applications are very user friendly, allowing subscribers of all age to easily stream Netflix content, and experience little glitch and buffering if connected to a strong internet service.
Weaknesses Need for high-speed internet:
One of the reasons that Netflix has struggled to expand on an international basis as quickly as it may have liked to is due to the lack of high speed internet in countries outside of North America and Europe. Netflix has realized this problem and is currently working on aiming to reduce the necessity for high data consumption when streaming content. Currently, streaming videos uses 200 kilobytes of data. Netflix is working to reduce this to 100 kilobytes for subscribers with limited access to high speed internet31.
High-speed internet connections across the world:
10
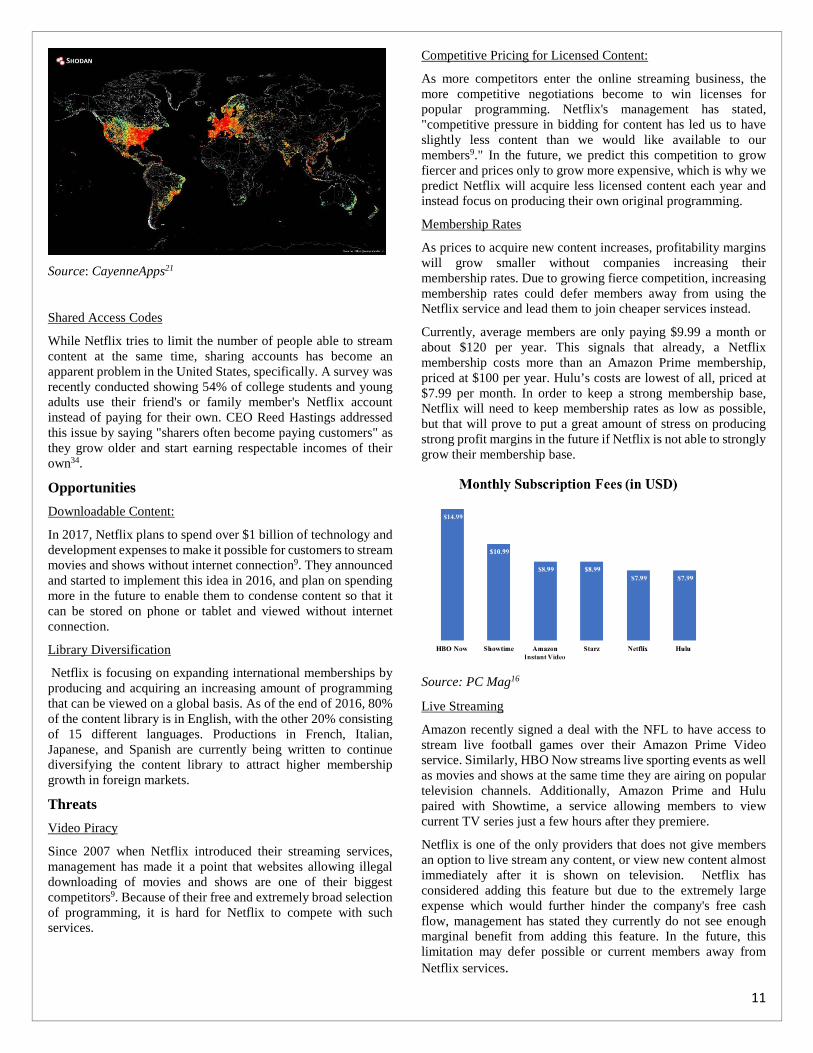
Source: CayenneApps21
Shared Access Codes
While Netflix tries to limit the number of people able to stream content at the same time, sharing accounts has become an apparent problem in the United States, specifically. A survey was recently conducted showing 54% of college students and young adults use their friend's or family member's Netflix account instead of paying for their own. CEO Reed Hastings addressed this issue by saying "sharers often become paying customers" as they grow older and start earning respectable incomes of their own34.
Opportunities Downloadable Content:
In 2017, Netflix plans to spend over $1 billion of technology and development expenses to make it possible for customers to stream movies and shows without internet connection9. They announced and started to implement this idea in 2016, and plan on spending more in the future to enable them to condense content so that it can be stored on phone or tablet and viewed without internet connection.
Library Diversification
Netflix is focusing on expanding international memberships by producing and acquiring an increasing amount of programming that can be viewed on a global basis. As of the end of 2016, 80% of the content library is in English, with the other 20% consisting of 15 different languages. Productions in French, Italian, Japanese, and Spanish are currently being written to continue diversifying the content library to attract higher membership growth in foreign markets.
Threats Video Piracy
Since 2007 when Netflix introduced their streaming services, management has made it a point that websites allowing illegal downloading of movies and shows are one of their biggest competitors9. Because of their free and extremely broad selection of programming, it is hard for Netflix to compete with such services.
Competitive Pricing for Licensed Content:
As more competitors enter the online streaming business, the more competitive negotiations become to win licenses for popular programming. Netflix's management has stated, "competitive pressure in bidding for content has led us to have slightly less content than we would like available to our members9." In the future, we predict this competition to grow fiercer and prices only to grow more expensive, which is why we predict Netflix will acquire less licensed content each year and instead focus on producing their own original programming.
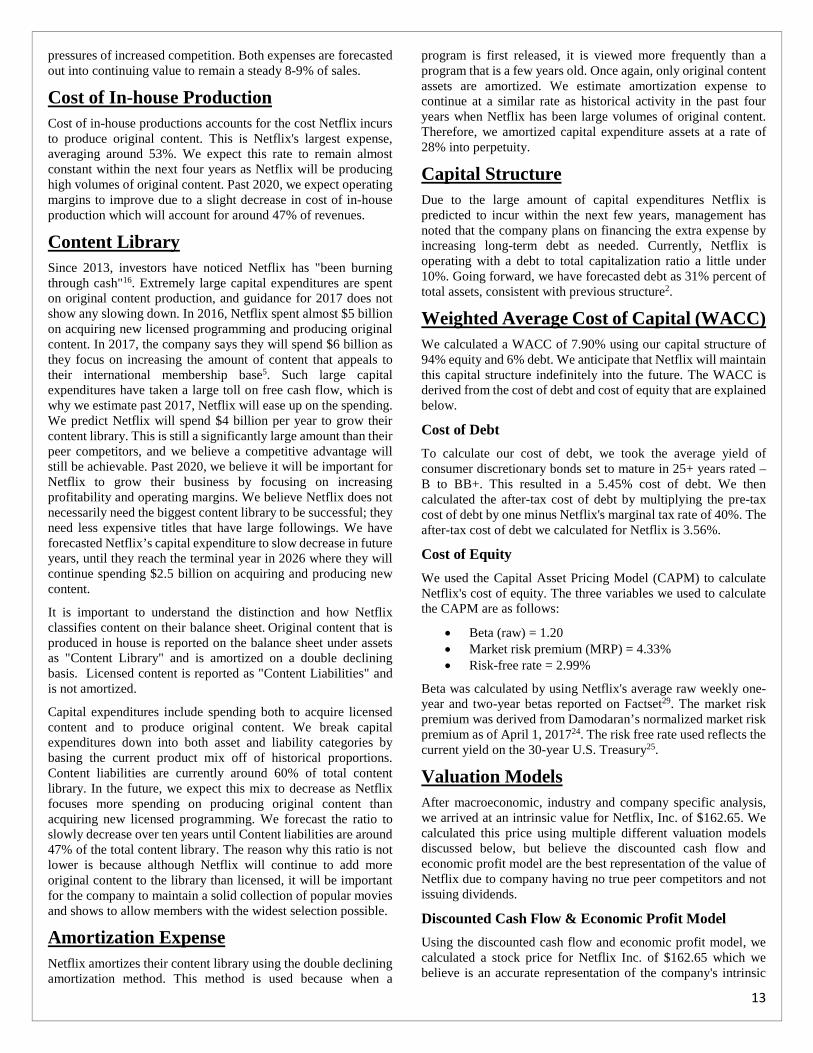
Membership Rates
As prices to acquire new content increases, profitability margins will grow smaller without companies increasing their membership rates. Due to growing fierce competition, increasing membership rates could defer members away from using the Netflix service and lead them to join cheaper services instead.
Currently, average members are only paying $9.99 a month or about $120 per year. This signals that already, a Netflix membership costs more than an Amazon Prime membership, priced at $100 per year. Hulu’s costs are lowest of all, priced at $7.99 per month. In order to keep a strong membership base, Netflix will need to keep membership rates as low as possible, but that will prove to put a great amount of stress on producing strong profit margins in the future if Netflix is not able to strongly grow their membership base.
Source: PC Mag16
Live Streaming
Amazon recently signed a deal with the NFL to have access to stream live football games over their Amazon Prime Video service. Similarly, HBO Now streams live sporting events as well as movies and shows at the same time they are airing on popular television channels. Additionally, Amazon Prime and Hulu paired with Showtime, a service allowing members to view current TV series just a few hours after they premiere.
Netflix is one of the only providers that does not give members an option to live stream any content, or view new content almost immediately after it is shown on television. Netflix has considered adding this feature but due to the extremely large expense which would further hinder the company's free cash flow, management has stated they currently do not see enough marginal benefit from adding this feature. In the future, this limitation may defer possible or current members away from Netflix services.
11

Investment Positives • Production of original content has created strong brand
recognition leading to a loyal membership base. • Large opportunities for future growth are present in
international markets. o Netflix has the opportunity to continue diversifying its
library in order to intrigue more members o Netflix’s innovative platform will enable consumers
with limited internet connectivity to access programming through downloadable content
Investment Negatives • Lack of diversified product mix creates significant
exposure to declining revenue growth as more competitors enter the industry with new content and more membership features.
• Significant capital expenditures have caused negative free cash flow
Using a discounted cash flow and economic profit model analyses, we concluded that Netflix have a BUY rating with an intrinsic stock price below the current trading price of $162.65. To arrive to this price, we forecasted future cash flows into year 2026. We chose this forecast horizon to allow time for Netflix to fully expand on an international basis, as well as accommodate to stronger competitors. Our forecasted estimates take into consideration management guidance, historical patterns, and personal predictions. Over the last four years, Netflix has experience a lot of change in their spending habits leading to decreased profitability and operating margins. This is due to their continued capital expenditure in order to obtain new licensed content, but more notably produce their own original programming. Although their expenses have grown by a large amount, our expectations are in line with management guidance of large membership growth rates in the coming years. Aggressive growth rates in the coming four years are accompanied with higher expenses. We predict the next four years will be the time frame in which Netflix will grow its largest, while trying to outrun competition. Past 2020, we believe that growth rate and expenses will normalize over the next six years to reach a steady growth rate of 3.356% in perpetuity.
Revenue Growth Netflix’s revenue is driven from monthly subscription fees paid by the membership base. Since 2013 Netflix has reported an average increase in revenue around 30% per year over year and a 20% year over year increase in membership base. To forecast revenue accurately, we had to first forecast membership growth rates and the average monthly rates paid by members in each business segment.
Breaking down revenue into business segments, domestic membership has grown at 18% per year. International Streaming membership has grown over 74% per year. Finally, Domestic
DVD memberships account for the smallest contribution to total revenue, and continue to decrease at a rate of around 15% per year.
Source: Netflix Form 10-K2
Going forward, in 2017 we believe similar momentum will be kept by all three business segments. We expect domestic membership growth to increase by 5 million (10%), international membership growth to increase by 13 million (30%) and DVD members to continue declining by 18%. This will result in net membership additions of 22 million. On average over the next four years, membership rates will increase domestically on average by 8.25% year over year, compared with 24.5% internationally and –18% per the DVD segment. Past 2020, growth rates will slow down to 5% domestically, 8% internationally, and –12% in the DVD segment. Finally, in the terminal year, membership rates will steady around 3% domestically, 4% internationally, and –10% per the DVD segment,
Source: Netflix 10-Q 2017
These predictions for membership growth will cause revenue to grow in 2017 to almost $12 billion. Over the next four years, revenue growth will be 20% year over year. Six years following that, revenue will grow on average 7.8% year over year. Finally, in the terminal year, revenue will grow in perpetuity at 4.6%.
Other Operating Expenses To meet expectations of high membership growth rates in the coming years, Netflix plans to increase marketing, as well as technology and development expenses in 2017. Per guidance, we expect Netflix to spend over $1 billion in each of these areas. Further into the future we do not see Netflix decreasing their amount of spending on technology or marketing due to the
Valuation Analysis
12
pressures of increased competition. Both expenses are forecasted out into continuing value to remain a steady 8-9% of sales.
Cost of In-house Production Cost of in-house productions accounts for the cost Netflix incurs to produce original content. This is Netflix's largest expense, averaging around 53%. We expect this rate to remain almost constant within the next four years as Netflix will be producing high volumes of original content. Past 2020, we expect operating margins to improve due to a slight decrease in cost of in-house production which will account for around 47% of revenues.
Content Library Since 2013, investors have noticed Netflix has "been burning through cash"16. Extremely large capital expenditures are spent on original content production, and guidance for 2017 does not show any slowing down. In 2016, Netflix spent almost $5 billion on acquiring new licensed programming and producing original content. In 2017, the company says they will spend $6 billion as they focus on increasing the amount of content that appeals to their international membership base5. Such large capital expenditures have taken a large toll on free cash flow, which is why we estimate past 2017, Netflix will ease up on the spending. We predict Netflix will spend $4 billion per year to grow their content library. This is still a significantly large amount than their peer competitors, and we believe a competitive advantage will still be achievable. Past 2020, we believe it will be important for Netflix to grow their business by focusing on increasing profitability and operating margins. We believe Netflix does not necessarily need the biggest content library to be successful; they need less expensive titles that have large followings. We have forecasted Netflix’s capital expenditure to slow decrease in future years, until they reach the terminal year in 2026 where they will continue spending $2.5 billion on acquiring and producing new content.
It is important to understand the distinction and how Netflix classifies content on their balance sheet. Original content that is produced in house is reported on the balance sheet under assets as "Content Library" and is amortized on a double declining basis. Licensed content is reported as "Content Liabilities" and is not amortized.
Capital expenditures include spending both to acquire licensed content and to produce original content. We break capital expenditures down into both asset and liability categories by basing the current product mix off of historical proportions. Content liabilities are currently around 60% of total content library. In the future, we expect this mix to decrease as Netflix focuses more spending on producing original content than acquiring new licensed programming. We forecast the ratio to slowly decrease over ten years until Content liabilities are around 47% of the total content library. The reason why this ratio is not lower is because although Netflix will continue to add more original content to the library than licensed, it will be important for the company to maintain a solid collection of popular movies and shows to allow members with the widest selection possible.
Amortization Expense Netflix amortizes their content library using the double declining amortization method. This method is used because when a
program is first released, it is viewed more frequently than a program that is a few years old. Once again, only original content assets are amortized. We estimate amortization expense to continue at a similar rate as historical activity in the past four years when Netflix has been large volumes of original content. Therefore, we amortized capital expenditure assets at a rate of 28% into perpetuity.
Capital Structure Due to the large amount of capital expenditures Netflix is predicted to incur within the next few years, management has noted that the company plans on financing the extra expense by increasing long-term debt as needed. Currently, Netflix is operating with a debt to total capitalization ratio a little under 10%. Going forward, we have forecasted debt as 31% percent of total assets, consistent with previous structure2.
Weighted Average Cost of Capital (WACC) We calculated a WACC of 7.90% using our capital structure of 94% equity and 6% debt. We anticipate that Netflix will maintain this capital structure indefinitely into the future. The WACC is derived from the cost of debt and cost of equity that are explained below.
Cost of Debt To calculate our cost of debt, we took the average yield of consumer discretionary bonds set to mature in 25+ years rated –B to BB+. This resulted in a 5.45% cost of debt. We then calculated the after-tax cost of debt by multiplying the pre-tax cost of debt by one minus Netflix's marginal tax rate of 40%. The after-tax cost of debt we calculated for Netflix is 3.56%.
Cost of Equity We used the Capital Asset Pricing Model (CAPM) to calculate Netflix's cost of equity. The three variables we used to calculate the CAPM are as follows:
• Beta (raw) = 1.20 • Market risk premium (MRP) = 4.33% • Risk-free rate = 2.99%
Beta was calculated by using Netflix's average raw weekly one-year and two-year betas reported on Factset29. The market risk premium was derived from Damodaran’s normalized market risk premium as of April 1, 201724. The risk free rate used reflects the current yield on the 30-year U.S. Treasury25.
Valuation Models After macroeconomic, industry and company specific analysis, we arrived at an intrinsic value for Netflix, Inc. of $162.65. We calculated this price using multiple different valuation models discussed below, but believe the discounted cash flow and economic profit model are the best representation of the value of Netflix due to company having no true peer competitors and not issuing dividends.
Discounted Cash Flow & Economic Profit Model Using the discounted cash flow and economic profit model, we calculated a stock price for Netflix Inc. of $162.65 which we believe is an accurate representation of the company's intrinsic
13
value. Important assumptions made in this model included the terminal value growth rate of 3.56%, which was derived from the terminal growth rate of NOPLAT in year 2024. Free cash flows carry a negative balance into 2017, but then recover thereafter. Negative free cash flow represents guidance predicting Netflix will spend $6 billion in capital expenditures in the coming year.
Dividend Discount Model (DDM) We do not believe the dividend discount model is a most accurate representation of the current value of Netflix as the company does not currently pay dividends and management has stated they do not plan on issuing dividends any time in the near future. That being said, we calculated Netflix’s stock price using expected future earnings per share and a hypothetical dividend Netflix would be able to pay in the terminal year, which was estimated to be $11.08. After discounting these values, we arrived at a stock price of $194.83.
Relative Valuation We used a relative valuation model to compare different metrics of Netflix to a group of close competitors which included Alphabet, Time Warner, Walt Disney, Twenty First Century, CBS, Viacom and Discovery Communications. Because of Netflix's specialization in only internet streaming services, no true comparable peer exists for this analysis. Therefore, we chose a group of peers from similar industries with similar market capitalizations. Enterprise value multiples were useful when conducting this analysis as they do not take into account amortization effects, therefore showing stronger earnings. Netflix's EV/EBIT multiple prices well above Amazon and other competitors at 116.7. 2017 EPS estimates of $1.47 results in a lower forward P/E ratio of 100.5 compared to Amazon's 128.1, but still considerably higher than the rest of Netflix's competitors. A final metric worth noting is the forward PEG ratio, currently calculated at 249.7. Such strong metrics indicates Netflix is expected to have strong growth and earnings compared to their competitors in the future.
Source: Factset29
Because Netflix is the first company of its kind to specialize in Internet Streaming Services, we used a series of sensitivity analysis tests to determine the significance of small changes in assumptions to see the affect they have on our model as a whole. The results are as follows:
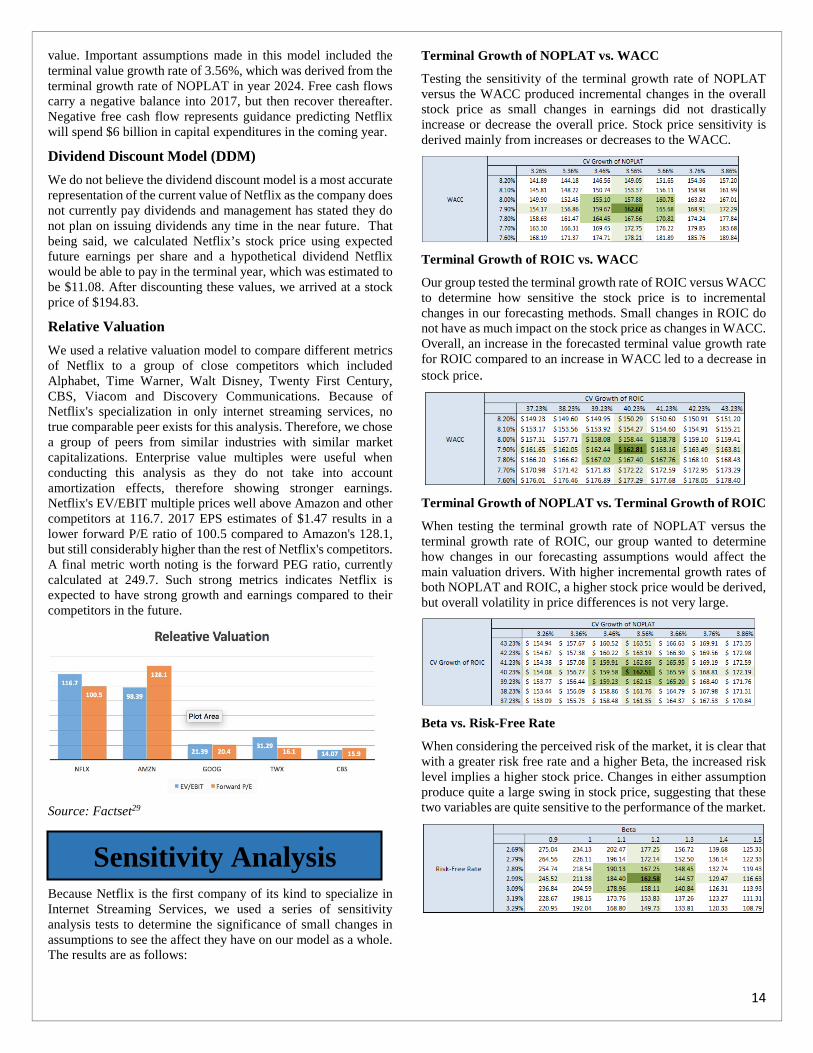
Terminal Growth of NOPLAT vs. WACC
Testing the sensitivity of the terminal growth rate of NOPLAT versus the WACC produced incremental changes in the overall stock price as small changes in earnings did not drastically increase or decrease the overall price. Stock price sensitivity is derived mainly from increases or decreases to the WACC.
Terminal Growth of ROIC vs. WACC
Our group tested the terminal growth rate of ROIC versus WACC to determine how sensitive the stock price is to incremental changes in our forecasting methods. Small changes in ROIC do not have as much impact on the stock price as changes in WACC. Overall, an increase in the forecasted terminal value growth rate for ROIC compared to an increase in WACC led to a decrease in stock price.
Terminal Growth of NOPLAT vs. Terminal Growth of ROIC
When testing the terminal growth rate of NOPLAT versus the terminal growth rate of ROIC, our group wanted to determine how changes in our forecasting assumptions would affect the main valuation drivers. With higher incremental growth rates of both NOPLAT and ROIC, a higher stock price would be derived, but overall volatility in price differences is not very large.
Beta vs. Risk-Free Rate
When considering the perceived risk of the market, it is clear that with a greater risk free rate and a higher Beta, the increased risk level implies a higher stock price. Changes in either assumption produce quite a large swing in stock price, suggesting that these two variables are quite sensitive to the performance of the market.
Sensitivity Analysis
14
References 1. Netflix. "Top Investor Questions." Netflix: Top
Investor Questions. N.p., 2017. Web. 16 Apr. 2017. 2. Netflix 10K - 2016 3. Wang, Christine. "Netflix Posts Its Biggest-ever
Quarterly Subscriber Growth, Stock Surges 8%." CNBC. CNBC, 19 Jan. 2017. Web. 15 Apr. 2017.
4. Nasdaq. "Netflix, Inc. (NFLX) Earnings Report." NASDAQ.com. N.p., 2017. Web. 15 Apr. 2017.
5. Netflix Earnings Report - Q4 2016 6. CNN. "A Brief History of Netflix." CNN. Cable
News Network, 21 July 2014. Web. 15 Apr. 2017. 7. JP Morgan & Chase. Netflix Earnings Analysis. Rep.
N.p., 2017. Print. 8. Barron, Jessa. "Netflix, Amazon Instant Video and
Hulu Plus: How Do the Big 3 Compare?" Netflix, Amazon Instant Video and Hulu Plus: How Do the Big 3 Compare? - Next Advisor Blog. Next Advisor, 28 Aug. 2015. Web. 15 Apr. 2017.
9. Netflix. "Overview." Netflix: Overview. Investor Relations, 2017. Web. 15 Apr. 2017.
10. U.S. Investing & Online Trading | Charles Schwab. N.p., n.d. Web. 18 Apr. 2017.
11. "Industry Reports." IBISWorld. N.p., n.d. Web. 18 Apr. 2017.
12. Koblin, John. "How Much Do We Love TV? Let Us Count the Ways." The New York Times. N.p., 30 June 2016. Web. 16 Apr. 2017.
13. Steven Musil April 11, 2017 4:55 AM PDT. "Samsung Galaxy S8 Hits Launch Snag with Bixby Voice Assistant." CNET. N.p., 11 Apr. 2017. Web. 16 Apr. 2017.
14. Albanesius, Chloe. "Which Video Streaming Service Is Best for You?" PCMAG. PCMAG.COM, 20 Dec. 2016. Web. 16 Apr. 2017.
15. All Products Require an Annual Contract. Prices Do Not Include Sales Tax (New York Residents Only). The Reduced Price / Month Applies to. "Streaming Video Subscription Revenue in the U.S. 2016 | Statistic." Statista. N.p., n.d. Web. 16 Apr. 2017.
16. Castillo, Michelle. "Netflix Plans to Spend $6 Billion on New Shows, Blowing Away All but One of Its Rivals." CNBC. CNBC, 18 Oct. 2016. Web. 17 Apr. 2017.
17. Yahoo!Finance. "NFLX: Summary for Netflix, Inc. - Yahoo Finance." Yahoo! N.p., 2017. Web. 16 Apr. 2017.
18. Bureau, US Census. Census.gov. N.p., n.d. Web. 18 Apr. 2017.
19. IBIS. "Industry Reports." IBISWorld. N.p., 2017. Web. 16 Apr. 2017.
20. O'Reilly, Lara. "Netflix Lifted the Lid on How the Algorithm That Recommends You Titles to Watch Actually Works." Business Insider. Business Insider, 26 Feb. 2016. Web. 16 Apr. 2017.
21. "Netflix – SWOT Analysis." CayenneApps Blog. N.p., 17 July 2016. Web. 16 Apr. 2017.
22. Nations, Daniel. "Is Hulu Better Than Netflix?" Lifewire. N.p., n.d. Web. 16 Apr. 2017.
23. Newman, Jared. "HBO Now Explained: Everything We Know, and a Few Things We Don't." TechHive. TechHive, 10 Apr. 2015. Web. 16 Apr. 2017.
24. Damodaran, Swath. "Implied Equity Risk Premium Update." Damodaran Online: Home Page for Aswath Damodaran. N.p., 2017. Web. 16 Apr. 2017.
25. Bloomberg Terminal 26. Heisler, Yoni. "Netflix’s Obsession with Original
Programming Is Paying off Big Time." BGR. N.p., 24 Oct. 2016. Web. 16 Apr. 2017.
27. Spangler, Todd. "Amazon Prime Video Has 4 Times Netflix’s Movie Lineup, But Size Isn’t Everything." Variety. N.p., 25 Apr. 2016. Web. 16 Apr. 2017.
28. Lubin, Gus. "Netflix's Original Shows Are Crushing Amazon and Hulu in Demand." Business Insider. N.p., 27 Dec. 2016. Web. 16 Apr. 2017.
29. Manager. Financial Research | Investment Analytics Tools - FactSet Research Systems. N.p., 25 July 2016. Web. 18 Apr. 2017.
30. Google Finance: Stock Market Quotes, News, Currency Conversions & More. Google, n.d. Web. 18 Apr. 2017.
31. Shirley Pelts | Apr 11, 2017 9:18 Pm EDT. "A Look at Netflix’s Valuation Metrics." A Look at Netflix's Valuation Metrics - Market Realist. N.p., n.d. Web. 18 Apr. 2017.
32. Netflix 10Q – 2016 33. Balakrishnan, Anita. "Netflix Adds Fewer-than-
expected Subscribers." CNBC. CNBC, 17 Apr. 2017. Web. 18 Apr. 2017.
34. Fottrell, Quentin. "Most Millennials Don't Want to Pay for Netflix." MarketWatch. N.p., 17 Apr. 2017. Web. 18 Apr. 2017.
35. "Graph: Consumer Price Index for All Urban Consumers: U.S.City Average, All Items and All Items Less Food and Energy." U.S. Bureau of Labor Statistics. U.S. Bureau of Labor Statistics, n.d. Web. 17 Apr. 2017.
36. Mullaney, Tim. "The Real Reason the 'Trump Rally' Can't Continue: It's Not about Him." CNBC. CNBC, 02 Mar. 2017. Web. 17 Apr. 2017.
37. Noguchi, Yuki. "Federal Reserve Raises Key Interest Rate, Signals 2 More Increases This Year." NPR. NPR, 15 Mar. 2017. Web. 17 Apr. 2017.
38. Staff, Investopedia. "Consumer Confidence Index - CCI." Investopedia. N.p., 29 Jan. 2016. Web. 17 Apr. 2017.
39. Staff, Investopedia. "Consumer Spending." Investopedia. N.p., 26 Aug. 2009. Web. 17 Apr. 2017.
40. US Department of Commerce, BEA, Bureau of Economic Analysis. "Bureau of Economic Analysis." U.S. Bureau of Economic Analysis (BEA). N.p., n.d. Web. 17 Apr. 2017.
15
Important Disclaimer This report was created by students enrolled in the Security Analysis (FIN:4250) class at the University of Iowa. The report was originally created to offer an internal investment recommendation for the University of Iowa Krause Fund and its advisory board. The report also provides potential employers and other interested parties an example of the students’ skills, knowledge and abilities. Members of the Krause Fund are not registered investment advisors, brokers or officially licensed financial professionals. The investment advice contained in this report does not represent an offer or solicitation to buy or sell any of the securities mentioned. Unless otherwise noted, facts and figures included in this report are from publicly available sources. This report is not a complete compilation of data, and its accuracy is not guaranteed. From time to time, the University of Iowa, its faculty, staff, students, or the Krause Fund may hold a financial interest in the companies mentioned in this report.
16
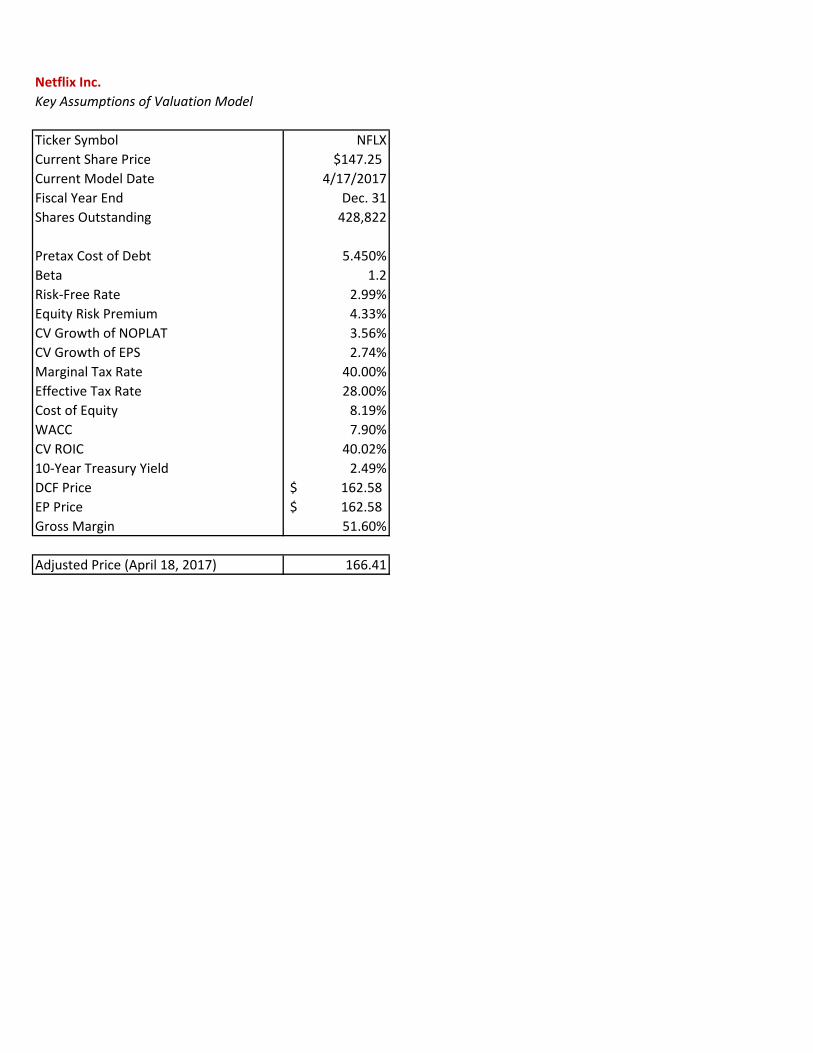
Netflix Inc.Key Assumptions of Valuation Model
Ticker Symbol NFLXCurrent Share Price $147.25Current Model Date 4/17/2017Fiscal Year End Dec. 31Shares Outstanding 428,822
Pretax Cost of Debt 5.450%Beta 1.2Risk-Free Rate 2.99%Equity Risk Premium 4.33%CV Growth of NOPLAT 3.56%CV Growth of EPS 2.74%Marginal Tax Rate 40.00%Effective Tax Rate 28.00%Cost of Equity 8.19%WACC 7.90%CV ROIC 40.02%10-Year Treasury Yield 2.49%DCF Price 162.58$ EP Price 162.58$ Gross Margin 51.60%
Adjusted Price (April 18, 2017) 166.41
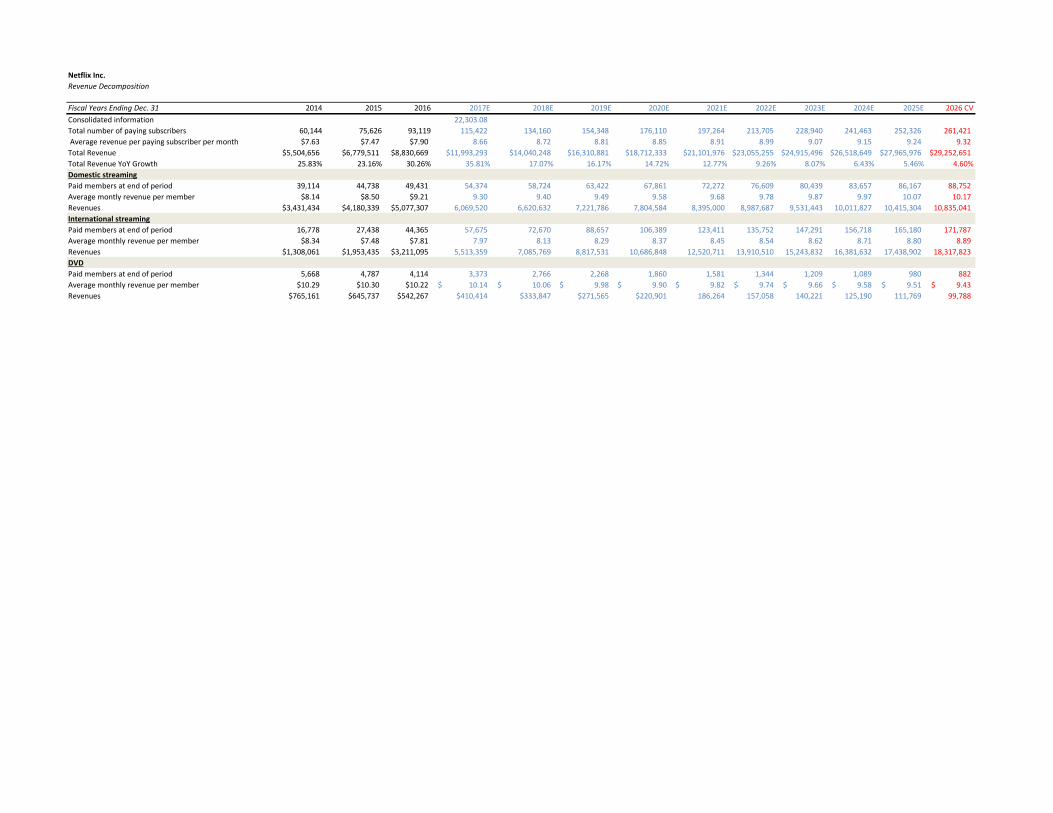
Netflix Inc.Revenue Decomposition
Fiscal Years Ending Dec. 31 2014 2015 2016 2017E 2018E 2019E 2020E 2021E 2022E 2023E 2024E 2025E 2026 CVConsolidated information 22,303.08 Total number of paying subscribers 60,144 75,626 93,119 115,422 134,160 154,348 176,110 197,264 213,705 228,940 241,463 252,326 261,421 Average revenue per paying subscriber per month $7.63 $7.47 $7.90 8.66 8.72 8.81 8.85 8.91 8.99 9.07 9.15 9.24 9.32 Total Revenue $5,504,656 $6,779,511 $8,830,669 $11,993,293 $14,040,248 $16,310,881 $18,712,333 $21,101,976 $23,055,255 $24,915,496 $26,518,649 $27,965,976 $29,252,651Total Revenue YoY Growth 25.83% 23.16% 30.26% 35.81% 17.07% 16.17% 14.72% 12.77% 9.26% 8.07% 6.43% 5.46% 4.60%Domestic streamingPaid members at end of period 39,114 44,738 49,431 54,374 58,724 63,422 67,861 72,272 76,609 80,439 83,657 86,167 88,752 Average montly revenue per member $8.14 $8.50 $9.21 9.30 9.40 9.49 9.58 9.68 9.78 9.87 9.97 10.07 10.17 Revenues $3,431,434 $4,180,339 $5,077,307 6,069,520 6,620,632 7,221,786 7,804,584 8,395,000 8,987,687 9,531,443 10,011,827 10,415,304 10,835,041 International streamingPaid members at end of period 16,778 27,438 44,365 57,675 72,670 88,657 106,389 123,411 135,752 147,291 156,718 165,180 171,787 Average monthly revenue per member $8.34 $7.48 $7.81 7.97 8.13 8.29 8.37 8.45 8.54 8.62 8.71 8.80 8.89 Revenues $1,308,061 $1,953,435 $3,211,095 5,513,359 7,085,769 8,817,531 10,686,848 12,520,711 13,910,510 15,243,832 16,381,632 17,438,902 18,317,823 DVDPaid members at end of period 5,668 4,787 4,114 3,373 2,766 2,268 1,860 1,581 1,344 1,209 1,089 980 882 Average monthly revenue per member $10.29 $10.30 $10.22 10.14$ 10.06$ 9.98$ 9.90$ 9.82$ 9.74$ 9.66$ 9.58$ 9.51$ 9.43$ Revenues $765,161 $645,737 $542,267 $410,414 $333,847 $271,565 $220,901 186,264 157,058 140,221 125,190 111,769 99,788
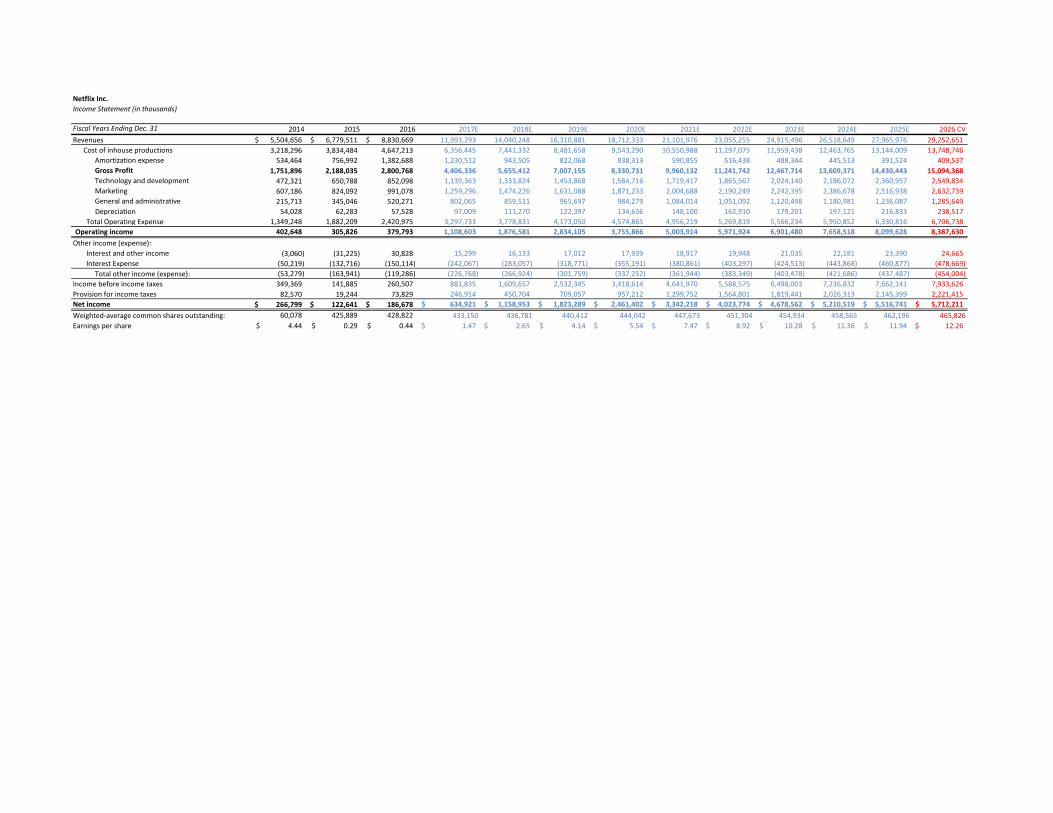
Netflix Inc.Income Statement (in thousands)
Fiscal Years Ending Dec. 31 2014 2015 2016 2017E 2018E 2019E 2020E 2021E 2022E 2023E 2024E 2025E 2026 CVRevenues 5,504,656$ 6,779,511$ 8,830,669$ 11,993,293 14,040,248 16,310,881 18,712,333 21,101,976 23,055,255 24,915,496 26,518,649 27,965,976 29,252,651 Cost of inhouse productions 3,218,296 3,834,484 4,647,213 6,356,445 7,441,332 8,481,658 9,543,290 10,550,988 11,297,075 11,959,438 12,463,765 13,144,009 13,748,746
Amortization expense 534,464 756,992 1,382,688 1,230,512 943,505 822,068 838,313 590,855 516,438 488,344 445,513 391,524 409,537 Gross Profit 1,751,896 2,188,035 2,800,768 4,406,336 5,655,412 7,007,155 8,330,731 9,960,132 11,241,742 12,467,714 13,609,371 14,430,443 15,094,368 Technology and development 472,321 650,788 852,098 1,139,363 1,333,824 1,453,868 1,584,716 1,719,417 1,865,567 2,024,140 2,186,072 2,360,957 2,549,834 Marketing 607,186 824,092 991,078 1,259,296 1,474,226 1,631,088 1,871,233 2,004,688 2,190,249 2,242,395 2,386,678 2,516,938 2,632,739 General and administrative 215,713 345,046 520,271 802,065 859,511 965,697 984,279 1,084,014 1,051,092 1,120,498 1,180,981 1,236,087 1,285,649
Depreciation 54,028 62,283 57,528 97,009 111,270 122,397 134,636 148,100 162,910 179,201 197,121 216,833 238,517 Total Operating Expense 1,349,248 1,882,209 2,420,975 3,297,733 3,778,831 4,173,050 4,574,865 4,956,219 5,269,819 5,566,234 5,950,852 6,330,816 6,706,738
Operating income 402,648 305,826 379,793 1,108,603 1,876,581 2,834,105 3,755,866 5,003,914 5,971,924 6,901,480 7,658,518 8,099,628 8,387,630 Other income (expense):
Interest and other income (3,060) (31,225) 30,828 15,299 16,133 17,012 17,939 18,917 19,948 21,035 22,181 23,390 24,665 Interest Expense (50,219) (132,716) (150,114) (242,067) (283,057) (318,771) (355,191) (380,861) (403,297) (424,513) (443,868) (460,877) (478,669)
Total other income (expense): (53,279) (163,941) (119,286) (226,768) (266,924) (301,759) (337,252) (361,944) (383,349) (403,478) (421,686) (437,487) (454,004) Income before income taxes 349,369 141,885 260,507 881,835 1,609,657 2,532,345 3,418,614 4,641,970 5,588,575 6,498,003 7,236,832 7,662,141 7,933,626 Provision for income taxes 82,570 19,244 73,829 246,914 450,704 709,057 957,212 1,299,752 1,564,801 1,819,441 2,026,313 2,145,399 2,221,415 Net income 266,799$ 122,641$ 186,678$ 634,921$ 1,158,953$ 1,823,289$ 2,461,402$ 3,342,218$ 4,023,774$ 4,678,562$ 5,210,519$ 5,516,741$ 5,712,211$ Weighted-average common shares outstanding: 60,078 425,889 428,822 433,150 436,781 440,412 444,042 447,673 451,304 454,934 458,565 462,196 465,826Earnings per share 4.44$ 0.29$ 0.44$ 1.47$ 2.65$ 4.14$ 5.54$ 7.47$ 8.92$ 10.28$ 11.36$ 11.94$ 12.26$
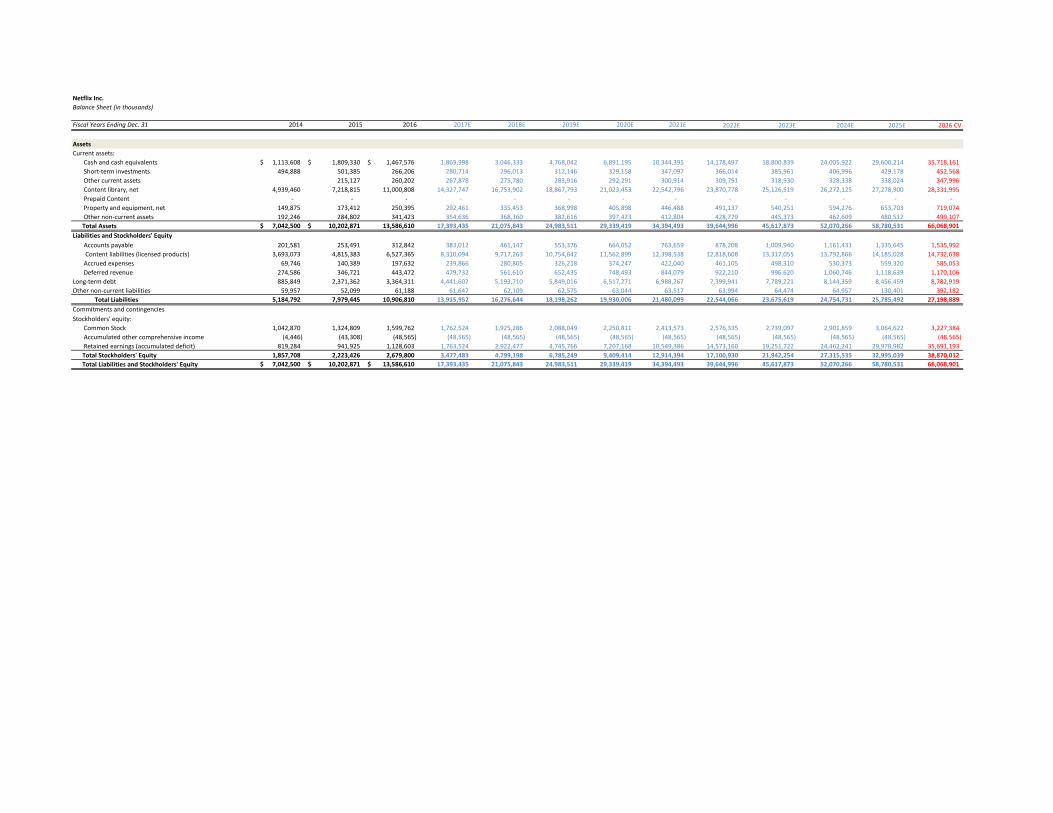
Netflix Inc.Balance Sheet (in thousands)
Fiscal Years Ending Dec. 31 2014 2015 2016 2017E 2018E 2019E 2020E 2021E 2022E 2023E 2024E 2025E 2026 CV
AssetsCurrent assets:
Cash and cash equivalents 1,113,608$ 1,809,330$ 1,467,576$ 1,869,998 3,046,333 4,768,042 6,891,195 10,344,395 14,178,497 18,800,839 24,005,922 29,600,214 35,718,161Short-term investments 494,888 501,385 266,206 280,714 296,013 312,146 329,158 347,097 366,014 385,961 406,996 429,178 452,568Other current assets 215,127 260,202 267,878 275,780 283,916 292,291 300,914 309,791 318,930 328,338 338,024 347,996Content library, net 4,939,460 7,218,815 11,000,808 14,327,747 16,753,902 18,867,793 21,023,453 22,542,796 23,870,778 25,126,519 26,272,125 27,278,900 28,331,995Prepaid Content - - - - - - - - - - - - - Property and equipment, net 149,875 173,412 250,395 292,461 335,453 368,998 405,898 446,488 491,137 540,251 594,276 653,703 719,074 Other non-current assets 192,246 284,802 341,423 354,636 368,360 382,616 397,423 412,804 428,779 445,373 462,609 480,512 499,107
Total Assets 7,042,500$ 10,202,871$ 13,586,610 17,393,435 21,075,843 24,983,511 29,339,419 34,394,493 39,644,996 45,617,873 52,070,266 58,780,531 66,068,901Liabilities and Stockholders' Equity
Accounts payable 201,581 253,491 312,842 383,012 461,147 553,376 664,052 763,659 878,208 1,009,940 1,161,431 1,335,645 1,535,992 Content liabilities (licensed products) 3,693,073 4,815,383 6,527,365 8,310,094 9,717,263 10,754,642 11,562,899 12,398,538 12,818,608 13,317,055 13,792,866 14,185,028 14,732,638 Accrued expenses 69,746 140,389 197,632 239,866 280,805 326,218 374,247 422,040 461,105 498,310 530,373 559,320 585,053 Deferred revenue 274,586 346,721 443,472 479,732 561,610 652,435 748,493 844,079 922,210 996,620 1,060,746 1,118,639 1,170,106
Long-term debt 885,849 2,371,362 3,364,311 4,441,602 5,193,710 5,849,016 6,517,271 6,988,267 7,399,941 7,789,221 8,144,359 8,456,459 8,782,919 Other non-current liabilities 59,957 52,099 61,188 61,647 62,109 62,575 63,044 63,517 63,994 64,474 64,957 130,401 392,182
Total Liabilities 5,184,792 7,979,445 10,906,810 13,915,952 16,276,644 18,198,262 19,930,006 21,480,099 22,544,066 23,675,619 24,754,731 25,785,492 27,198,889Commitments and contingenciesStockholders' equity:
Common Stock 1,042,870 1,324,809 1,599,762 1,762,524 1,925,286 2,088,049 2,250,811 2,413,573 2,576,335 2,739,097 2,901,859 3,064,622 3,227,384 Accumulated other comprehensive income (4,446) (43,308) (48,565) (48,565) (48,565) (48,565) (48,565) (48,565) (48,565) (48,565) (48,565) (48,565) (48,565)Retained earnings (accumulated deficit) 819,284 941,925 1,128,603 1,763,524 2,922,477 4,745,766 7,207,168 10,549,386 14,573,160 19,251,722 24,462,241 29,978,982 35,691,193
Total Stockholders' Equity 1,857,708 2,223,426 2,679,800 3,477,483 4,799,198 6,785,249 9,409,414 12,914,394 17,100,930 21,942,254 27,315,535 32,995,039 38,870,012 Total Liabilities and Stockholders' Equity 7,042,500$ 10,202,871$ 13,586,610$ 17,393,435 21,075,843 24,983,511 29,339,419 34,394,493 39,644,996 45,617,873 52,070,266 58,780,531 66,068,901
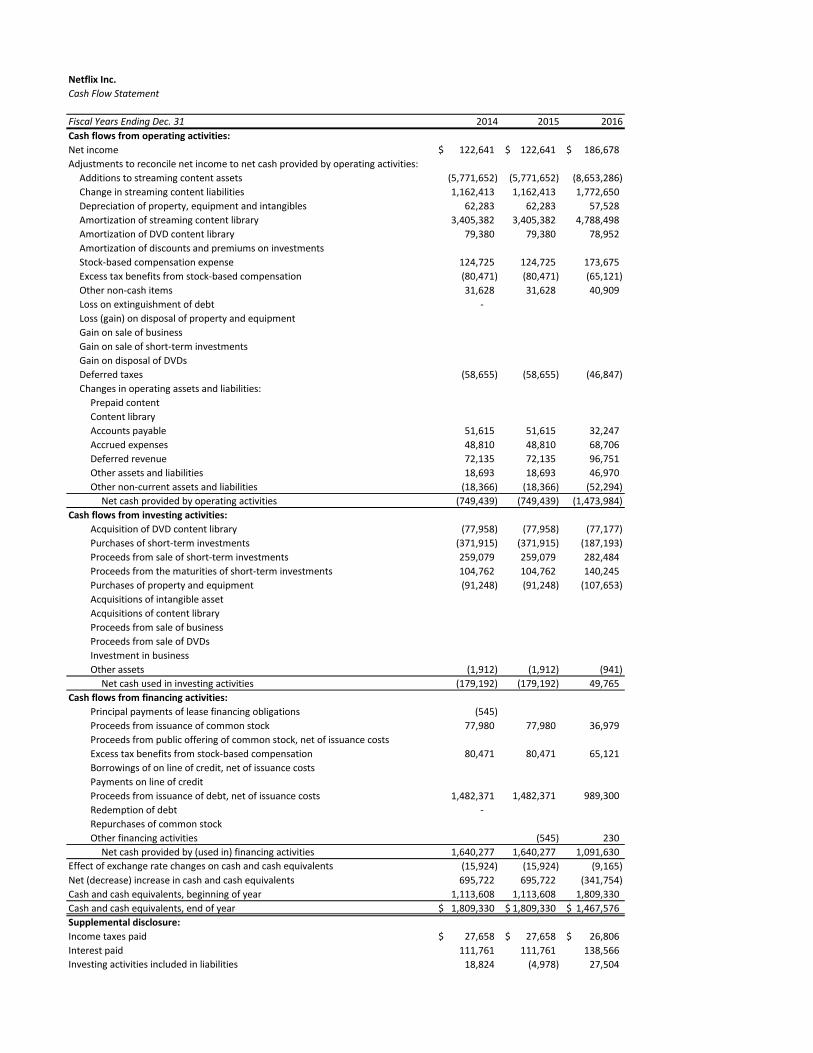
Netflix Inc.Cash Flow Statement
Fiscal Years Ending Dec. 31 2014 2015 2016Cash flows from operating activities:Net income 122,641$ 122,641$ 186,678$ Adjustments to reconcile net income to net cash provided by operating activities:
Additions to streaming content assets (5,771,652) (5,771,652) (8,653,286)Change in streaming content liabilities 1,162,413 1,162,413 1,772,650Depreciation of property, equipment and intangibles 62,283 62,283 57,528Amortization of streaming content library 3,405,382 3,405,382 4,788,498Amortization of DVD content library 79,380 79,380 78,952Amortization of discounts and premiums on investmentsStock-based compensation expense 124,725 124,725 173,675Excess tax benefits from stock-based compensation (80,471) (80,471) (65,121)Other non-cash items 31,628 31,628 40,909Loss on extinguishment of debt - Loss (gain) on disposal of property and equipmentGain on sale of businessGain on sale of short-term investmentsGain on disposal of DVDsDeferred taxes (58,655) (58,655) (46,847)Changes in operating assets and liabilities:
Prepaid contentContent libraryAccounts payable 51,615 51,615 32,247Accrued expenses 48,810 48,810 68,706Deferred revenue 72,135 72,135 96,751Other assets and liabilities 18,693 18,693 46,970Other non-current assets and liabilities (18,366) (18,366) (52,294)
Net cash provided by operating activities (749,439) (749,439) (1,473,984)Cash flows from investing activities:
Acquisition of DVD content library (77,958) (77,958) (77,177)Purchases of short-term investments (371,915) (371,915) (187,193)Proceeds from sale of short-term investments 259,079 259,079 282,484Proceeds from the maturities of short-term investments 104,762 104,762 140,245Purchases of property and equipment (91,248) (91,248) (107,653)Acquisitions of intangible assetAcquisitions of content libraryProceeds from sale of businessProceeds from sale of DVDsInvestment in businessOther assets (1,912) (1,912) (941)
Net cash used in investing activities (179,192) (179,192) 49,765Cash flows from financing activities:
Principal payments of lease financing obligations (545)Proceeds from issuance of common stock 77,980 77,980 36,979Proceeds from public offering of common stock, net of issuance costsExcess tax benefits from stock-based compensation 80,471 80,471 65,121Borrowings of on line of credit, net of issuance costsPayments on line of creditProceeds from issuance of debt, net of issuance costs 1,482,371 1,482,371 989,300 Redemption of debt - Repurchases of common stockOther financing activities (545) 230
Net cash provided by (used in) financing activities 1,640,277 1,640,277 1,091,630Effect of exchange rate changes on cash and cash equivalents (15,924) (15,924) (9,165)Net (decrease) increase in cash and cash equivalents 695,722 695,722 (341,754)Cash and cash equivalents, beginning of year 1,113,608 1,113,608 1,809,330Cash and cash equivalents, end of year 1,809,330$ 1,809,330$ 1,467,576$ Supplemental disclosure:Income taxes paid 27,658$ 27,658$ 26,806$ Interest paid 111,761 111,761 138,566Investing activities included in liabilities 18,824 (4,978) 27,504
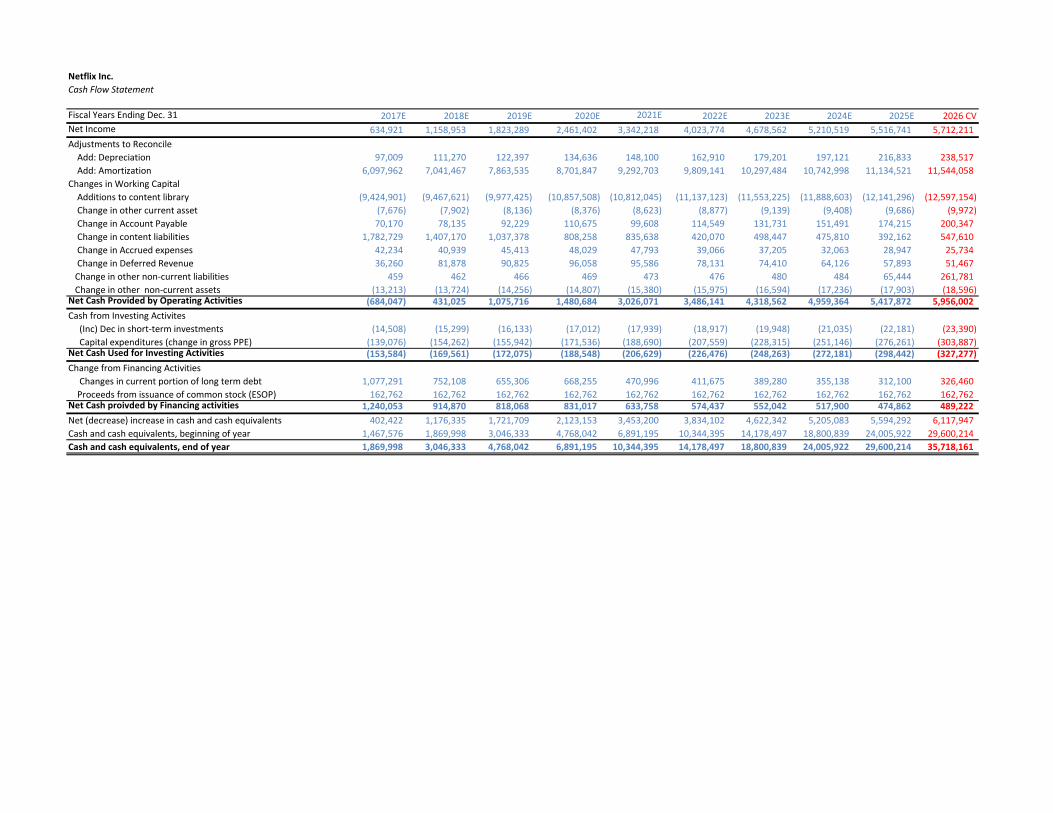
Netflix Inc.Cash Flow Statement
Fiscal Years Ending Dec. 31 2017E 2018E 2019E 2020E 2021E 2022E 2023E 2024E 2025E 2026 CVNet Income 634,921 1,158,953 1,823,289 2,461,402 3,342,218 4,023,774 4,678,562 5,210,519 5,516,741 5,712,211 Adjustments to Reconcile Add: Depreciation 97,009 111,270 122,397 134,636 148,100 162,910 179,201 197,121 216,833 238,517 Add: Amortization 6,097,962 7,041,467 7,863,535 8,701,847 9,292,703 9,809,141 10,297,484 10,742,998 11,134,521 11,544,058 Changes in Working Capital Additions to content library (9,424,901) (9,467,621) (9,977,425) (10,857,508) (10,812,045) (11,137,123) (11,553,225) (11,888,603) (12,141,296) (12,597,154) Change in other current asset (7,676) (7,902) (8,136) (8,376) (8,623) (8,877) (9,139) (9,408) (9,686) (9,972) Change in Account Payable 70,170 78,135 92,229 110,675 99,608 114,549 131,731 151,491 174,215 200,347 Change in content liabilities 1,782,729 1,407,170 1,037,378 808,258 835,638 420,070 498,447 475,810 392,162 547,610 Change in Accrued expenses 42,234 40,939 45,413 48,029 47,793 39,066 37,205 32,063 28,947 25,734 Change in Deferred Revenue 36,260 81,878 90,825 96,058 95,586 78,131 74,410 64,126 57,893 51,467 Change in other non-current liabilities 459 462 466 469 473 476 480 484 65,444 261,781 Change in other non-current assets (13,213) (13,724) (14,256) (14,807) (15,380) (15,975) (16,594) (17,236) (17,903) (18,596) Net Cash Provided by Operating Activities (684,047) 431,025 1,075,716 1,480,684 3,026,071 3,486,141 4,318,562 4,959,364 5,417,872 5,956,002 Cash from Investing Activites (Inc) Dec in short-term investments (14,508) (15,299) (16,133) (17,012) (17,939) (18,917) (19,948) (21,035) (22,181) (23,390) Capital expenditures (change in gross PPE) (139,076) (154,262) (155,942) (171,536) (188,690) (207,559) (228,315) (251,146) (276,261) (303,887) Net Cash Used for Investing Activities (153,584) (169,561) (172,075) (188,548) (206,629) (226,476) (248,263) (272,181) (298,442) (327,277) Change from Financing Activities Changes in current portion of long term debt 1,077,291 752,108 655,306 668,255 470,996 411,675 389,280 355,138 312,100 326,460 Proceeds from issuance of common stock (ESOP) 162,762 162,762 162,762 162,762 162,762 162,762 162,762 162,762 162,762 162,762 Net Cash proivded by Financing activities 1,240,053 914,870 818,068 831,017 633,758 574,437 552,042 517,900 474,862 489,222 Net (decrease) increase in cash and cash equivalents 402,422 1,176,335 1,721,709 2,123,153 3,453,200 3,834,102 4,622,342 5,205,083 5,594,292 6,117,947 Cash and cash equivalents, beginning of year 1,467,576 1,869,998 3,046,333 4,768,042 6,891,195 10,344,395 14,178,497 18,800,839 24,005,922 29,600,214 Cash and cash equivalents, end of year 1,869,998 3,046,333 4,768,042 6,891,195 10,344,395 14,178,497 18,800,839 24,005,922 29,600,214 35,718,161
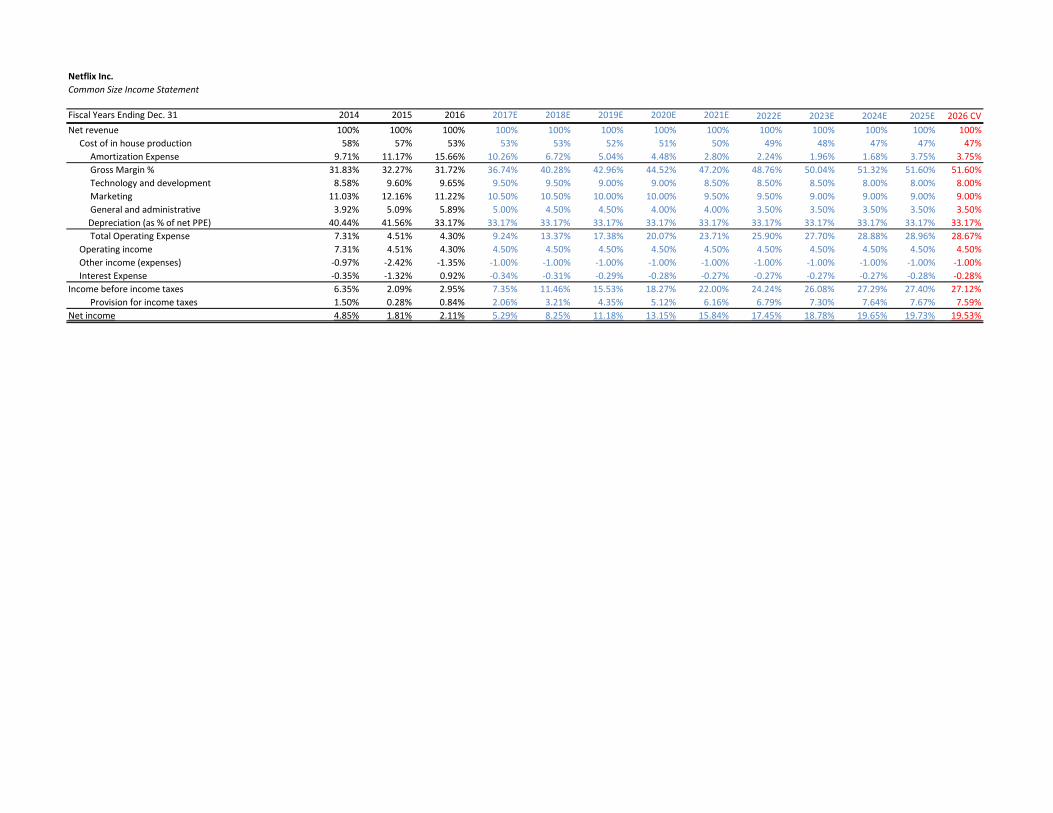
Netflix Inc.Common Size Income Statement
Fiscal Years Ending Dec. 31 2014 2015 2016 2017E 2018E 2019E 2020E 2021E 2022E 2023E 2024E 2025E 2026 CVNet revenue 100% 100% 100% 100% 100% 100% 100% 100% 100% 100% 100% 100% 100% Cost of in house production 58% 57% 53% 53% 53% 52% 51% 50% 49% 48% 47% 47% 47%
Amortization Expense 9.71% 11.17% 15.66% 10.26% 6.72% 5.04% 4.48% 2.80% 2.24% 1.96% 1.68% 3.75% 3.75%Gross Margin % 31.83% 32.27% 31.72% 36.74% 40.28% 42.96% 44.52% 47.20% 48.76% 50.04% 51.32% 51.60% 51.60%Technology and development 8.58% 9.60% 9.65% 9.50% 9.50% 9.00% 9.00% 8.50% 8.50% 8.50% 8.00% 8.00% 8.00%Marketing 11.03% 12.16% 11.22% 10.50% 10.50% 10.00% 10.00% 9.50% 9.50% 9.00% 9.00% 9.00% 9.00%General and administrative 3.92% 5.09% 5.89% 5.00% 4.50% 4.50% 4.00% 4.00% 3.50% 3.50% 3.50% 3.50% 3.50%
Depreciation (as % of net PPE) 40.44% 41.56% 33.17% 33.17% 33.17% 33.17% 33.17% 33.17% 33.17% 33.17% 33.17% 33.17% 33.17%Total Operating Expense 7.31% 4.51% 4.30% 9.24% 13.37% 17.38% 20.07% 23.71% 25.90% 27.70% 28.88% 28.96% 28.67%
Operating income 7.31% 4.51% 4.30% 4.50% 4.50% 4.50% 4.50% 4.50% 4.50% 4.50% 4.50% 4.50% 4.50%Other income (expenses) -0.97% -2.42% -1.35% -1.00% -1.00% -1.00% -1.00% -1.00% -1.00% -1.00% -1.00% -1.00% -1.00%Interest Expense -0.35% -1.32% 0.92% -0.34% -0.31% -0.29% -0.28% -0.27% -0.27% -0.27% -0.27% -0.28% -0.28%
Income before income taxes 6.35% 2.09% 2.95% 7.35% 11.46% 15.53% 18.27% 22.00% 24.24% 26.08% 27.29% 27.40% 27.12%Provision for income taxes 1.50% 0.28% 0.84% 2.06% 3.21% 4.35% 5.12% 6.16% 6.79% 7.30% 7.64% 7.67% 7.59%
Net income 4.85% 1.81% 2.11% 5.29% 8.25% 11.18% 13.15% 15.84% 17.45% 18.78% 19.65% 19.73% 19.53%
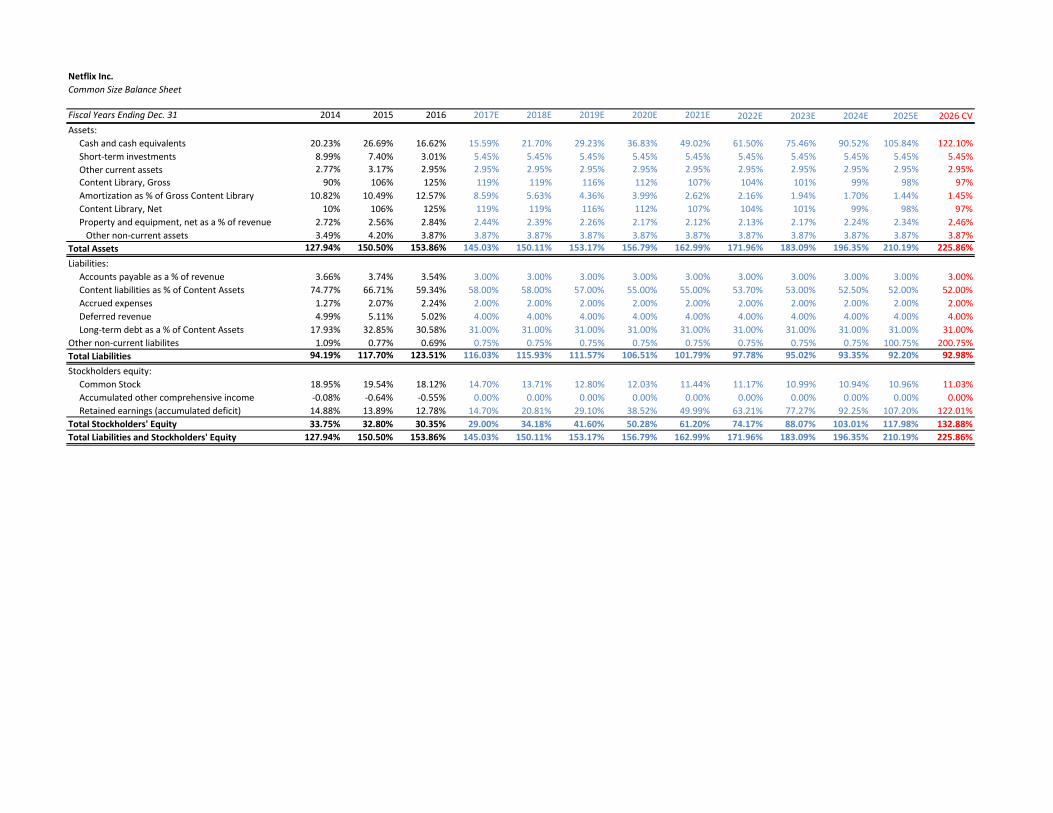
Netflix Inc.Common Size Balance Sheet
Fiscal Years Ending Dec. 31 2014 2015 2016 2017E 2018E 2019E 2020E 2021E 2022E 2023E 2024E 2025E 2026 CVAssets:
Cash and cash equivalents 20.23% 26.69% 16.62% 15.59% 21.70% 29.23% 36.83% 49.02% 61.50% 75.46% 90.52% 105.84% 122.10%Short-term investments 8.99% 7.40% 3.01% 5.45% 5.45% 5.45% 5.45% 5.45% 5.45% 5.45% 5.45% 5.45% 5.45%Other current assets 2.77% 3.17% 2.95% 2.95% 2.95% 2.95% 2.95% 2.95% 2.95% 2.95% 2.95% 2.95% 2.95%Content Library, Gross 90% 106% 125% 119% 119% 116% 112% 107% 104% 101% 99% 98% 97%Amortization as % of Gross Content Library 10.82% 10.49% 12.57% 8.59% 5.63% 4.36% 3.99% 2.62% 2.16% 1.94% 1.70% 1.44% 1.45%Content Library, Net 10% 106% 125% 119% 119% 116% 112% 107% 104% 101% 99% 98% 97%Property and equipment, net as a % of revenue 2.72% 2.56% 2.84% 2.44% 2.39% 2.26% 2.17% 2.12% 2.13% 2.17% 2.24% 2.34% 2.46% Other non-current assets 3.49% 4.20% 3.87% 3.87% 3.87% 3.87% 3.87% 3.87% 3.87% 3.87% 3.87% 3.87% 3.87%
Total Assets 127.94% 150.50% 153.86% 145.03% 150.11% 153.17% 156.79% 162.99% 171.96% 183.09% 196.35% 210.19% 225.86%
Liabilities:Accounts payable as a % of revenue 3.66% 3.74% 3.54% 3.00% 3.00% 3.00% 3.00% 3.00% 3.00% 3.00% 3.00% 3.00% 3.00%Content liabilities as % of Content Assets 74.77% 66.71% 59.34% 58.00% 58.00% 57.00% 55.00% 55.00% 53.70% 53.00% 52.50% 52.00% 52.00%Accrued expenses 1.27% 2.07% 2.24% 2.00% 2.00% 2.00% 2.00% 2.00% 2.00% 2.00% 2.00% 2.00% 2.00%Deferred revenue 4.99% 5.11% 5.02% 4.00% 4.00% 4.00% 4.00% 4.00% 4.00% 4.00% 4.00% 4.00% 4.00%Long-term debt as a % of Content Assets 17.93% 32.85% 30.58% 31.00% 31.00% 31.00% 31.00% 31.00% 31.00% 31.00% 31.00% 31.00% 31.00%
Other non-current liabilites 1.09% 0.77% 0.69% 0.75% 0.75% 0.75% 0.75% 0.75% 0.75% 0.75% 0.75% 100.75% 200.75%Total Liabilities 94.19% 117.70% 123.51% 116.03% 115.93% 111.57% 106.51% 101.79% 97.78% 95.02% 93.35% 92.20% 92.98%
Stockholders equity:Common Stock 18.95% 19.54% 18.12% 14.70% 13.71% 12.80% 12.03% 11.44% 11.17% 10.99% 10.94% 10.96% 11.03%Accumulated other comprehensive income -0.08% -0.64% -0.55% 0.00% 0.00% 0.00% 0.00% 0.00% 0.00% 0.00% 0.00% 0.00% 0.00%Retained earnings (accumulated deficit) 14.88% 13.89% 12.78% 14.70% 20.81% 29.10% 38.52% 49.99% 63.21% 77.27% 92.25% 107.20% 122.01%
Total Stockholders' Equity 33.75% 32.80% 30.35% 29.00% 34.18% 41.60% 50.28% 61.20% 74.17% 88.07% 103.01% 117.98% 132.88%Total Liabilities and Stockholders' Equity 127.94% 150.50% 153.86% 145.03% 150.11% 153.17% 156.79% 162.99% 171.96% 183.09% 196.35% 210.19% 225.86%
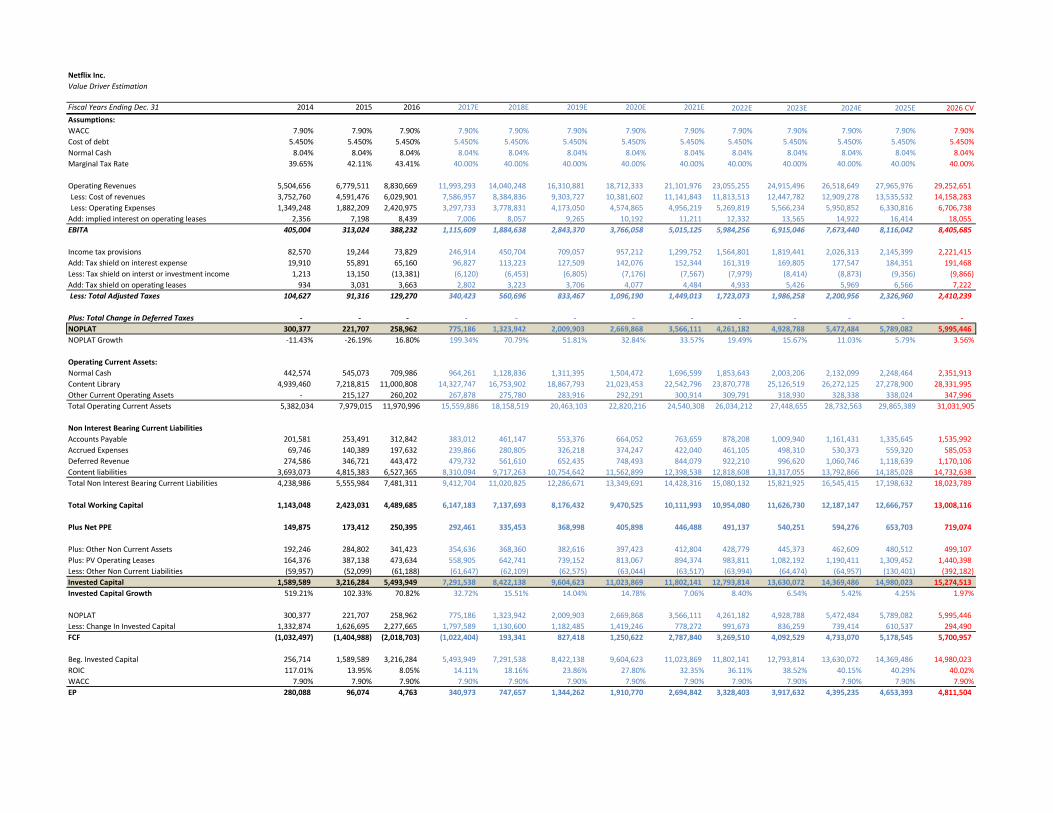
Netflix Inc.Value Driver Estimation
Fiscal Years Ending Dec. 31 2014 2015 2016 2017E 2018E 2019E 2020E 2021E 2022E 2023E 2024E 2025E 2026 CVAssumptions:WACC 7.90% 7.90% 7.90% 7.90% 7.90% 7.90% 7.90% 7.90% 7.90% 7.90% 7.90% 7.90% 7.90%Cost of debt 5.450% 5.450% 5.450% 5.450% 5.450% 5.450% 5.450% 5.450% 5.450% 5.450% 5.450% 5.450% 5.450%Normal Cash 8.04% 8.04% 8.04% 8.04% 8.04% 8.04% 8.04% 8.04% 8.04% 8.04% 8.04% 8.04% 8.04%Marginal Tax Rate 39.65% 42.11% 43.41% 40.00% 40.00% 40.00% 40.00% 40.00% 40.00% 40.00% 40.00% 40.00% 40.00%
Operating Revenues 5,504,656 6,779,511 8,830,669 11,993,293 14,040,248 16,310,881 18,712,333 21,101,976 23,055,255 24,915,496 26,518,649 27,965,976 29,252,651 Less: Cost of revenues 3,752,760 4,591,476 6,029,901 7,586,957 8,384,836 9,303,727 10,381,602 11,141,843 11,813,513 12,447,782 12,909,278 13,535,532 14,158,283 Less: Operating Expenses 1,349,248 1,882,209 2,420,975 3,297,733 3,778,831 4,173,050 4,574,865 4,956,219 5,269,819 5,566,234 5,950,852 6,330,816 6,706,738
Add: implied interest on operating leases 2,356 7,198 8,439 7,006 8,057 9,265 10,192 11,211 12,332 13,565 14,922 16,414 18,055 EBITA 405,004 313,024 388,232 1,115,609 1,884,638 2,843,370 3,766,058 5,015,125 5,984,256 6,915,046 7,673,440 8,116,042 8,405,685
Income tax provisions 82,570 19,244 73,829 246,914 450,704 709,057 957,212 1,299,752 1,564,801 1,819,441 2,026,313 2,145,399 2,221,415 Add: Tax shield on interest expense 19,910 55,891 65,160 96,827 113,223 127,509 142,076 152,344 161,319 169,805 177,547 184,351 191,468 Less: Tax shield on interst or investment income 1,213 13,150 (13,381) (6,120) (6,453) (6,805) (7,176) (7,567) (7,979) (8,414) (8,873) (9,356) (9,866) Add: Tax shield on operating leases 934 3,031 3,663 2,802 3,223 3,706 4,077 4,484 4,933 5,426 5,969 6,566 7,222 Less: Total Adjusted Taxes 104,627 91,316 129,270 340,423 560,696 833,467 1,096,190 1,449,013 1,723,073 1,986,258 2,200,956 2,326,960 2,410,239
Plus: Total Change in Deferred Taxes - - - - - - - - - - - - - NOPLAT 300,377 221,707 258,962 775,186 1,323,942 2,009,903 2,669,868 3,566,111 4,261,182 4,928,788 5,472,484 5,789,082 5,995,446 NOPLAT Growth -11.43% -26.19% 16.80% 199.34% 70.79% 51.81% 32.84% 33.57% 19.49% 15.67% 11.03% 5.79% 3.56%
Operating Current Assets:Normal Cash 442,574 545,073 709,986 964,261 1,128,836 1,311,395 1,504,472 1,696,599 1,853,643 2,003,206 2,132,099 2,248,464 2,351,913 Content Library 4,939,460 7,218,815 11,000,808 14,327,747 16,753,902 18,867,793 21,023,453 22,542,796 23,870,778 25,126,519 26,272,125 27,278,900 28,331,995 Other Current Operating Assets - 215,127 260,202 267,878 275,780 283,916 292,291 300,914 309,791 318,930 328,338 338,024 347,996 Total Operating Current Assets 5,382,034 7,979,015 11,970,996 15,559,886 18,158,519 20,463,103 22,820,216 24,540,308 26,034,212 27,448,655 28,732,563 29,865,389 31,031,905
Non Interest Bearing Current LiabilitiesAccounts Payable 201,581 253,491 312,842 383,012 461,147 553,376 664,052 763,659 878,208 1,009,940 1,161,431 1,335,645 1,535,992 Accrued Expenses 69,746 140,389 197,632 239,866 280,805 326,218 374,247 422,040 461,105 498,310 530,373 559,320 585,053 Deferred Revenue 274,586 346,721 443,472 479,732 561,610 652,435 748,493 844,079 922,210 996,620 1,060,746 1,118,639 1,170,106 Content liabilities 3,693,073 4,815,383 6,527,365 8,310,094 9,717,263 10,754,642 11,562,899 12,398,538 12,818,608 13,317,055 13,792,866 14,185,028 14,732,638 Total Non Interest Bearing Current Liabilities 4,238,986 5,555,984 7,481,311 9,412,704 11,020,825 12,286,671 13,349,691 14,428,316 15,080,132 15,821,925 16,545,415 17,198,632 18,023,789
Total Working Capital 1,143,048 2,423,031 4,489,685 6,147,183 7,137,693 8,176,432 9,470,525 10,111,993 10,954,080 11,626,730 12,187,147 12,666,757 13,008,116
Plus Net PPE 149,875 173,412 250,395 292,461 335,453 368,998 405,898 446,488 491,137 540,251 594,276 653,703 719,074
Plus: Other Non Current Assets 192,246 284,802 341,423 354,636 368,360 382,616 397,423 412,804 428,779 445,373 462,609 480,512 499,107 Plus: PV Operating Leases 164,376 387,138 473,634 558,905 642,741 739,152 813,067 894,374 983,811 1,082,192 1,190,411 1,309,452 1,440,398 Less: Other Non Current Liabilities (59,957) (52,099) (61,188) (61,647) (62,109) (62,575) (63,044) (63,517) (63,994) (64,474) (64,957) (130,401) (392,182) Invested Capital 1,589,589 3,216,284 5,493,949 7,291,538 8,422,138 9,604,623 11,023,869 11,802,141 12,793,814 13,630,072 14,369,486 14,980,023 15,274,513 Invested Capital Growth 519.21% 102.33% 70.82% 32.72% 15.51% 14.04% 14.78% 7.06% 8.40% 6.54% 5.42% 4.25% 1.97%
NOPLAT 300,377 221,707 258,962 775,186 1,323,942 2,009,903 2,669,868 3,566,111 4,261,182 4,928,788 5,472,484 5,789,082 5,995,446 Less: Change In Invested Capital 1,332,874 1,626,695 2,277,665 1,797,589 1,130,600 1,182,485 1,419,246 778,272 991,673 836,259 739,414 610,537 294,490 FCF (1,032,497) (1,404,988) (2,018,703) (1,022,404) 193,341 827,418 1,250,622 2,787,840 3,269,510 4,092,529 4,733,070 5,178,545 5,700,957
Beg. Invested Capital 256,714 1,589,589 3,216,284 5,493,949 7,291,538 8,422,138 9,604,623 11,023,869 11,802,141 12,793,814 13,630,072 14,369,486 14,980,023 ROIC 117.01% 13.95% 8.05% 14.11% 18.16% 23.86% 27.80% 32.35% 36.11% 38.52% 40.15% 40.29% 40.02%WACC 7.90% 7.90% 7.90% 7.90% 7.90% 7.90% 7.90% 7.90% 7.90% 7.90% 7.90% 7.90% 7.90%EP 280,088 96,074 4,763 340,973 747,657 1,344,262 1,910,770 2,694,842 3,328,403 3,917,632 4,395,235 4,653,393 4,811,504
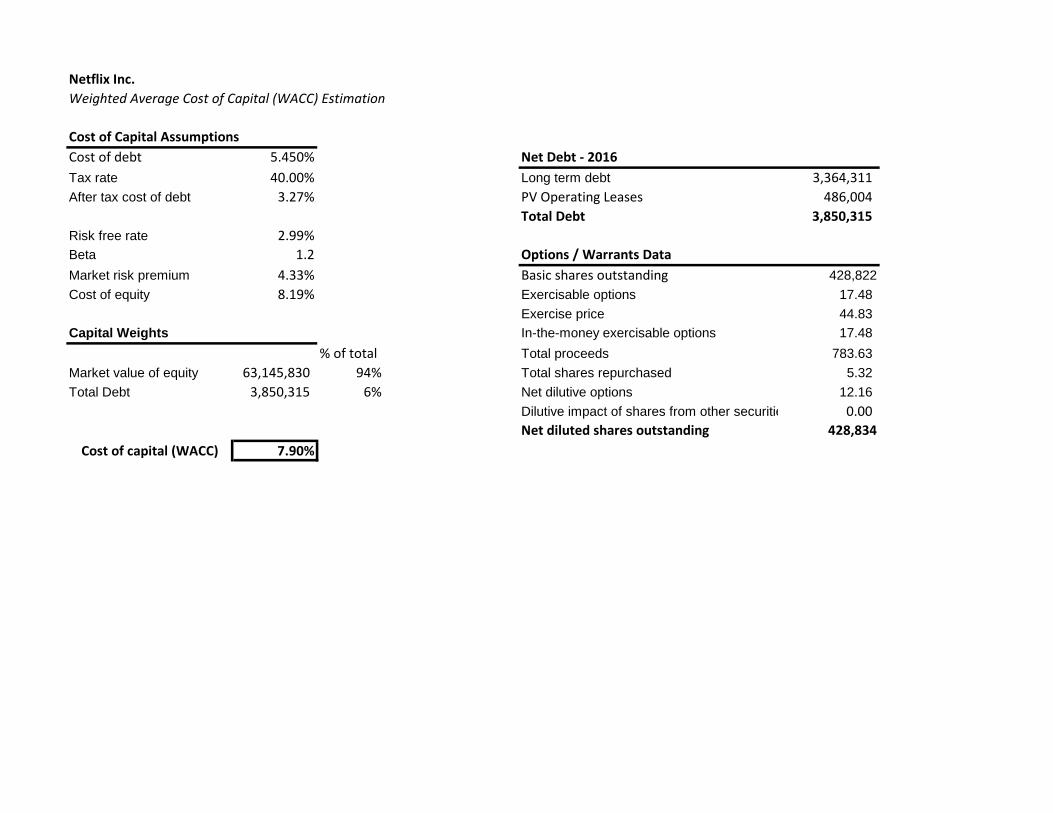
Netflix Inc.Weighted Average Cost of Capital (WACC) Estimation
Cost of debt 5.450% Net Debt - 2016Tax rate 40.00% Long term debt 3,364,311After tax cost of debt 3.27% PV Operating Leases 486,004
Total Debt 3,850,315Risk free rate 2.99%Beta 1.2 Options / Warrants DataMarket risk premium 4.33% Basic shares outstanding 428,822Cost of equity 8.19% Exercisable options 17.48
Exercise price 44.83In-the-money exercisable options 17.48
% of total Total proceeds 783.63Market value of equity 63,145,830 94% Total shares repurchased 5.32Total Debt 3,850,315 6% Net dilutive options 12.16
Dilutive impact of shares from other securitie 0.00Net diluted shares outstanding 428,834
7.90%Cost of capital (WACC)
Cost of Capital Assumptions
Capital Weights
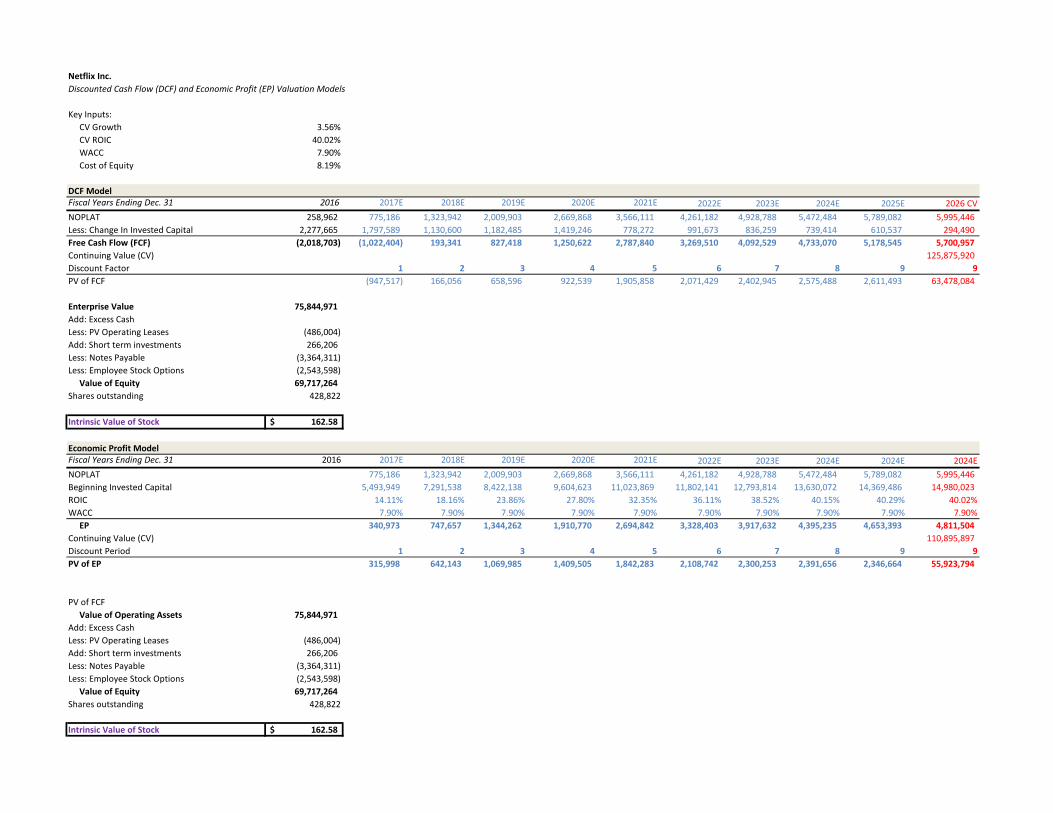
Netflix Inc.Discounted Cash Flow (DCF) and Economic Profit (EP) Valuation Models
Key Inputs: CV Growth 3.56% CV ROIC 40.02% WACC 7.90% Cost of Equity 8.19%
DCF ModelFiscal Years Ending Dec. 31 2016 2017E 2018E 2019E 2020E 2021E 2022E 2023E 2024E 2025E 2026 CVNOPLAT 258,962 775,186 1,323,942 2,009,903 2,669,868 3,566,111 4,261,182 4,928,788 5,472,484 5,789,082 5,995,446 Less: Change In Invested Capital 2,277,665 1,797,589 1,130,600 1,182,485 1,419,246 778,272 991,673 836,259 739,414 610,537 294,490 Free Cash Flow (FCF) (2,018,703) (1,022,404) 193,341 827,418 1,250,622 2,787,840 3,269,510 4,092,529 4,733,070 5,178,545 5,700,957 Continuing Value (CV) 125,875,920 Discount Factor 1 2 3 4 5 6 7 8 9 9PV of FCF (947,517) 166,056 658,596 922,539 1,905,858 2,071,429 2,402,945 2,575,488 2,611,493 63,478,084
Enterprise Value 75,844,971 Add: Excess CashLess: PV Operating Leases (486,004) Add: Short term investments 266,206 Less: Notes Payable (3,364,311) Less: Employee Stock Options (2,543,598) Value of Equity 69,717,264 Shares outstanding 428,822
Intrinsic Value of Stock 162.58$
Economic Profit ModelFiscal Years Ending Dec. 31 2016 2017E 2018E 2019E 2020E 2021E 2022E 2023E 2024E 2024E 2024ENOPLAT 775,186 1,323,942 2,009,903 2,669,868 3,566,111 4,261,182 4,928,788 5,472,484 5,789,082 5,995,446 Beginning Invested Capital 5,493,949 7,291,538 8,422,138 9,604,623 11,023,869 11,802,141 12,793,814 13,630,072 14,369,486 14,980,023 ROIC 14.11% 18.16% 23.86% 27.80% 32.35% 36.11% 38.52% 40.15% 40.29% 40.02%WACC 7.90% 7.90% 7.90% 7.90% 7.90% 7.90% 7.90% 7.90% 7.90% 7.90% EP 340,973 747,657 1,344,262 1,910,770 2,694,842 3,328,403 3,917,632 4,395,235 4,653,393 4,811,504 Continuing Value (CV) 110,895,897 Discount Period 1 2 3 4 5 6 7 8 9 9PV of EP 315,998 642,143 1,069,985 1,409,505 1,842,283 2,108,742 2,300,253 2,391,656 2,346,664 55,923,794
PV of FCF Value of Operating Assets 75,844,971 Add: Excess CashLess: PV Operating Leases (486,004) Add: Short term investments 266,206 Less: Notes Payable (3,364,311) Less: Employee Stock Options (2,543,598) Value of Equity 69,717,264 Shares outstanding 428,822
Intrinsic Value of Stock 162.58$
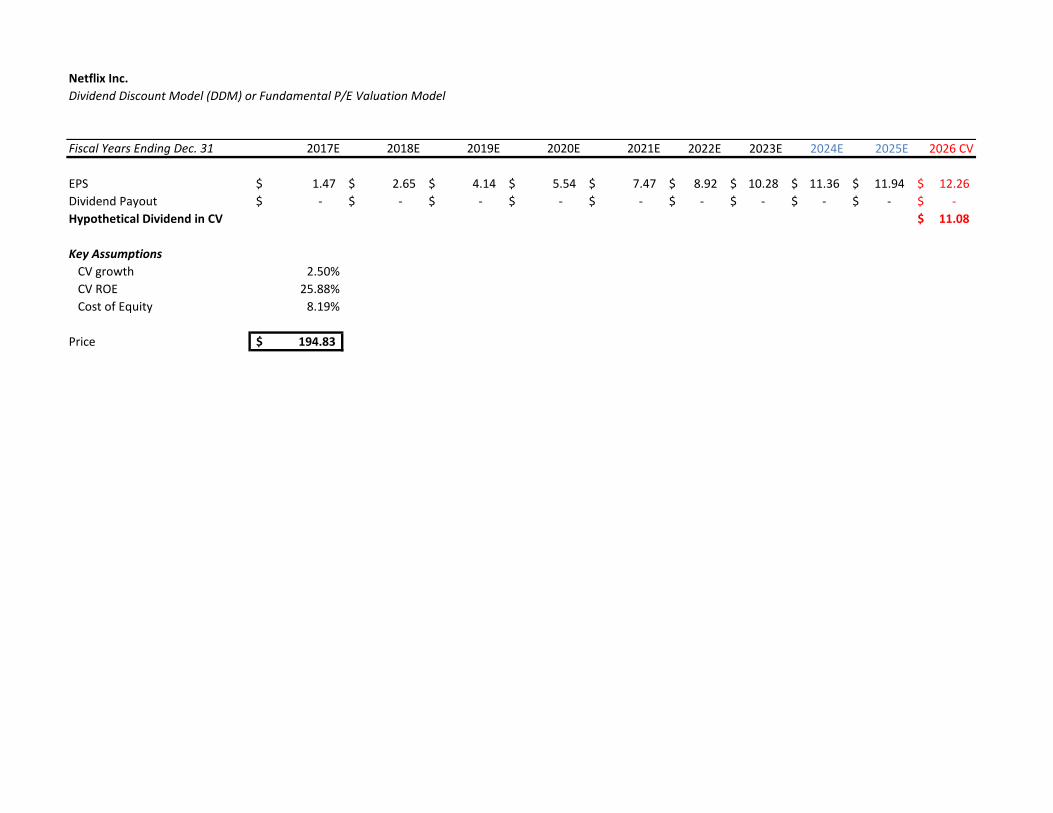
Netflix Inc.Dividend Discount Model (DDM) or Fundamental P/E Valuation Model
Fiscal Years Ending Dec. 31 2017E 2018E 2019E 2020E 2021E 2022E 2023E 2024E 2025E 2026 CV
EPS 1.47$ 2.65$ 4.14$ 5.54$ 7.47$ 8.92$ 10.28$ 11.36$ 11.94$ 12.26$ Dividend Payout -$ -$ -$ -$ -$ -$ -$ -$ -$ -$ Hypothetical Dividend in CV 11.08$
Key Assumptions CV growth 2.50% CV ROE 25.88% Cost of Equity 8.19%
Price 194.83$
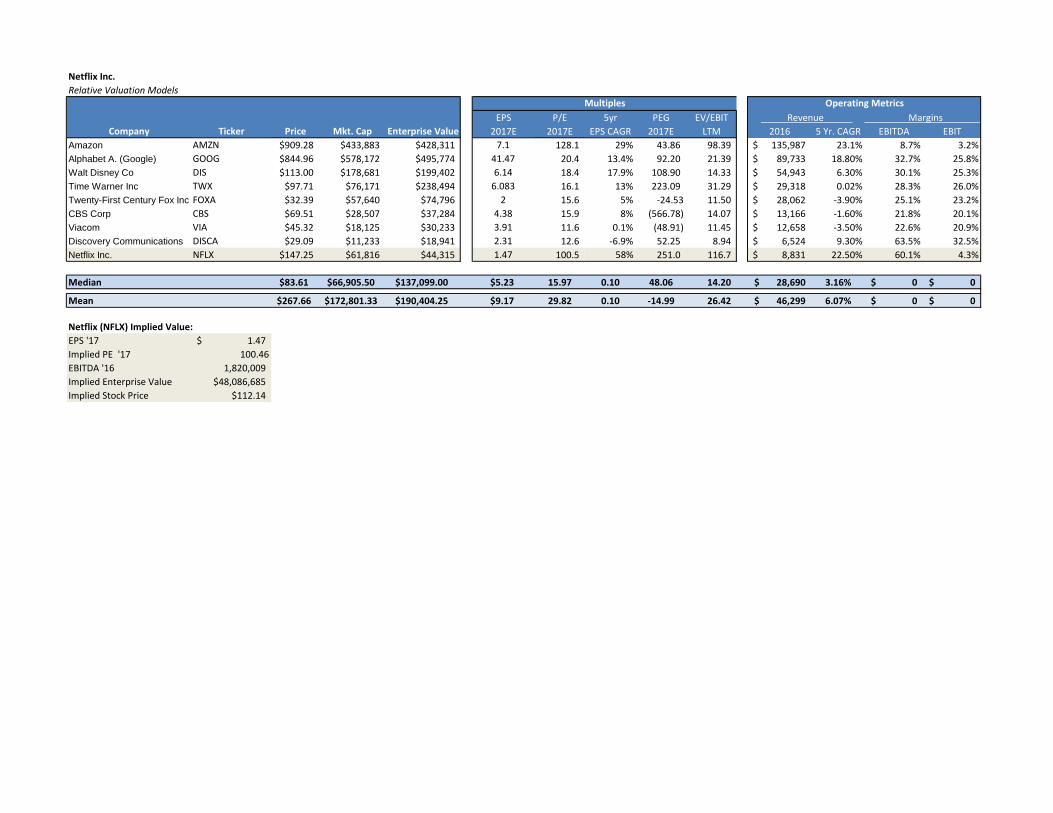
Netflix Inc.Relative Valuation Models
EPS P/E 5yr PEG EV/EBITCompany Ticker Price Mkt. Cap Enterprise Value 2017E 2017E EPS CAGR 2017E LTM 2016 5 Yr. CAGR EBITDA EBIT
Amazon AMZN $909.28 $433,883 $428,311 7.1 128.1 29% 43.86 98.39 135,987$ 23.1% 8.7% 3.2%Alphabet A. (Google) GOOG $844.96 $578,172 $495,774 41.47 20.4 13.4% 92.20 21.39 89,733$ 18.80% 32.7% 25.8%Walt Disney Co DIS $113.00 $178,681 $199,402 6.14 18.4 17.9% 108.90 14.33 54,943$ 6.30% 30.1% 25.3%Time Warner Inc TWX $97.71 $76,171 $238,494 6.083 16.1 13% 223.09 31.29 29,318$ 0.02% 28.3% 26.0%Twenty-First Century Fox Inc FOXA $32.39 $57,640 $74,796 2 15.6 5% -24.53 11.50 28,062$ -3.90% 25.1% 23.2%CBS Corp CBS $69.51 $28,507 $37,284 4.38 15.9 8% (566.78) 14.07 13,166$ -1.60% 21.8% 20.1%Viacom VIA $45.32 $18,125 $30,233 3.91 11.6 0.1% (48.91) 11.45 12,658$ -3.50% 22.6% 20.9%Discovery Communications DISCA $29.09 $11,233 $18,941 2.31 12.6 -6.9% 52.25 8.94 6,524$ 9.30% 63.5% 32.5%Netflix Inc. NFLX $147.25 $61,816 $44,315 1.47 100.5 58% 251.0 116.7 8,831$ 22.50% 60.1% 4.3%
Median $83.61 $66,905.50 $137,099.00 $5.23 15.97 0.10 48.06 14.20 28,690$ 3.16% 0$ 0$
Mean $267.66 $172,801.33 $190,404.25 $9.17 29.82 0.10 -14.99 26.42 46,299$ 6.07% 0$ 0$
Netflix (NFLX) Implied Value:EPS '17 1.47$ Implied PE '17 100.46EBITDA '16 1,820,009 Implied Enterprise Value $48,086,685Implied Stock Price $112.14
Multiples Revenue Margins
Operating Metrics
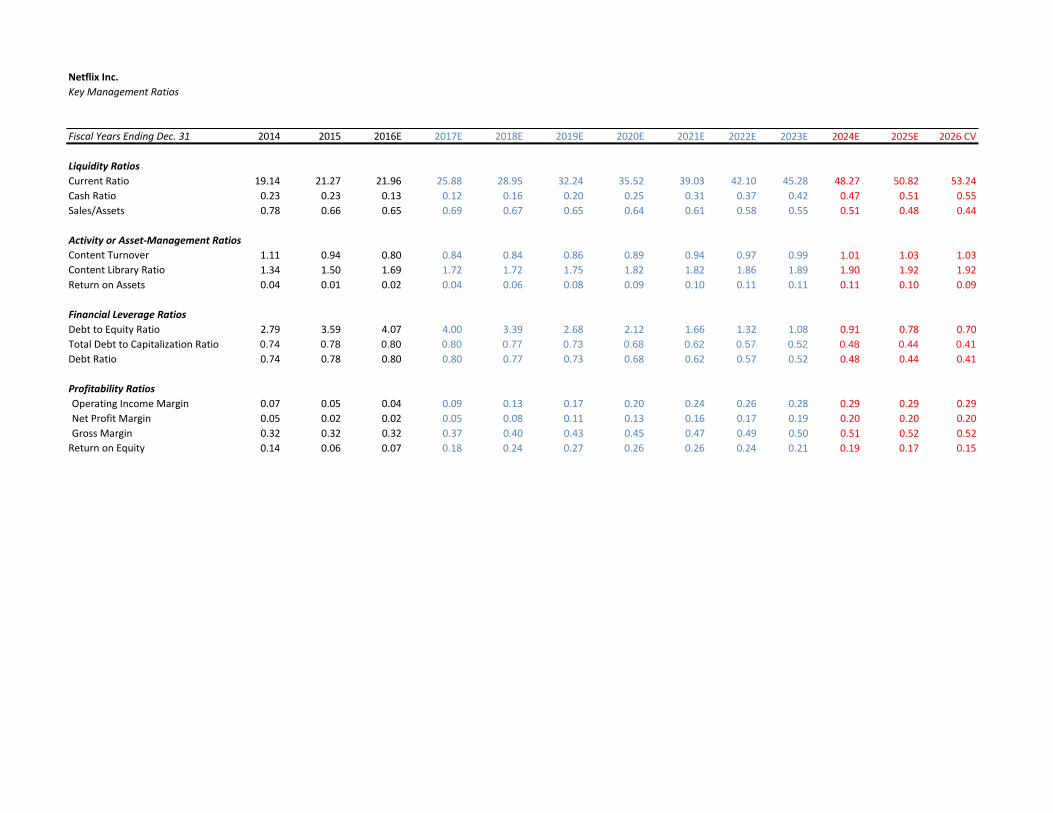
Netflix Inc.Key Management Ratios
Fiscal Years Ending Dec. 31 2014 2015 2016E 2017E 2018E 2019E 2020E 2021E 2022E 2023E 2024E 2025E 2026 CV
Liquidity RatiosCurrent Ratio 19.14 21.27 21.96 25.88 28.95 32.24 35.52 39.03 42.10 45.28 48.27 50.82 53.24Cash Ratio 0.23 0.23 0.13 0.12 0.16 0.20 0.25 0.31 0.37 0.42 0.47 0.51 0.55Sales/Assets 0.78 0.66 0.65 0.69 0.67 0.65 0.64 0.61 0.58 0.55 0.51 0.48 0.44
Activity or Asset-Management RatiosContent Turnover 1.11 0.94 0.80 0.84 0.84 0.86 0.89 0.94 0.97 0.99 1.01 1.03 1.03Content Library Ratio 1.34 1.50 1.69 1.72 1.72 1.75 1.82 1.82 1.86 1.89 1.90 1.92 1.92Return on Assets 0.04 0.01 0.02 0.04 0.06 0.08 0.09 0.10 0.11 0.11 0.11 0.10 0.09
Financial Leverage RatiosDebt to Equity Ratio 2.79 3.59 4.07 4.00 3.39 2.68 2.12 1.66 1.32 1.08 0.91 0.78 0.70Total Debt to Capitalization Ratio 0.74 0.78 0.80 0.80 0.77 0.73 0.68 0.62 0.57 0.52 0.48 0.44 0.41Debt Ratio 0.74 0.78 0.80 0.80 0.77 0.73 0.68 0.62 0.57 0.52 0.48 0.44 0.41
Profitability RatiosOperating Income Margin 0.07 0.05 0.04 0.09 0.13 0.17 0.20 0.24 0.26 0.28 0.29 0.29 0.29Net Profit Margin 0.05 0.02 0.02 0.05 0.08 0.11 0.13 0.16 0.17 0.19 0.20 0.20 0.20Gross Margin 0.32 0.32 0.32 0.37 0.40 0.43 0.45 0.47 0.49 0.50 0.51 0.52 0.52
Return on Equity 0.14 0.06 0.07 0.18 0.24 0.27 0.26 0.26 0.24 0.21 0.19 0.17 0.15
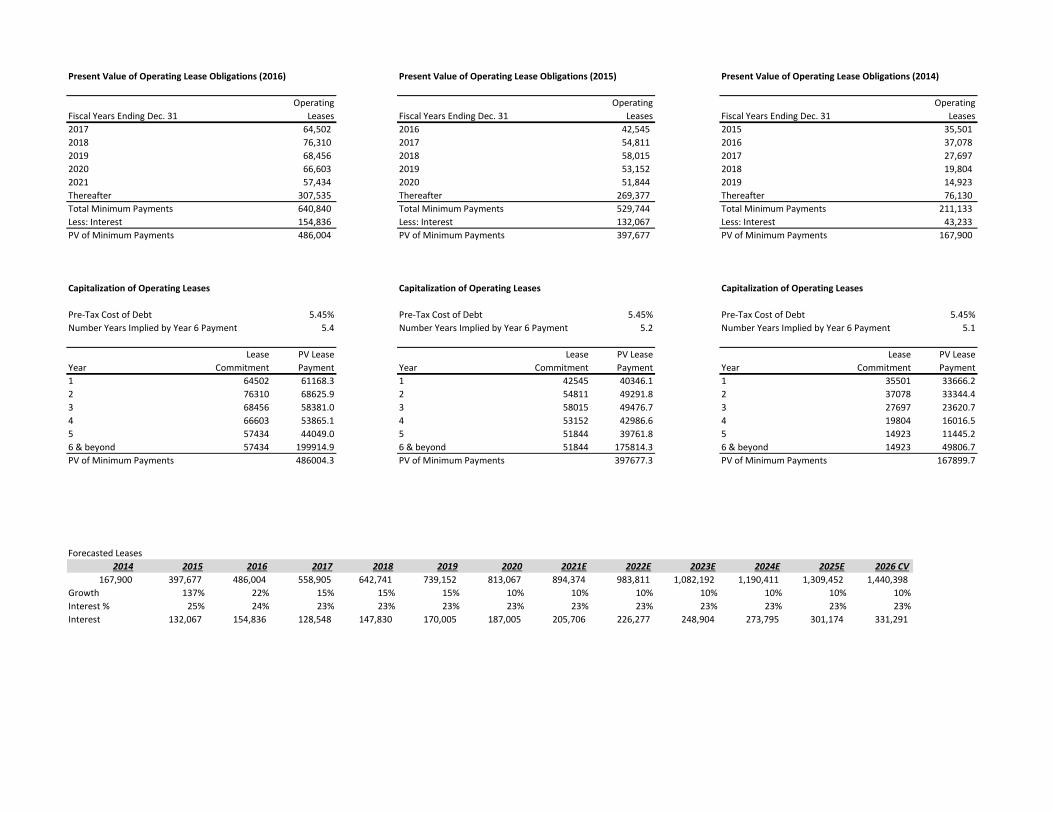
Present Value of Operating Lease Obligations (2016) Present Value of Operating Lease Obligations (2015) Present Value of Operating Lease Obligations (2014)
Operating Operating OperatingFiscal Years Ending Dec. 31 Leases Fiscal Years Ending Dec. 31 Leases Fiscal Years Ending Dec. 31 Leases2017 64,502 2016 42,545 2015 35,501 2018 76,310 2017 54,811 2016 37,078 2019 68,456 2018 58,015 2017 27,697 2020 66,603 2019 53,152 2018 19,804 2021 57,434 2020 51,844 2019 14,923 Thereafter 307,535 Thereafter 269,377 Thereafter 76,130 Total Minimum Payments 640,840 Total Minimum Payments 529,744 Total Minimum Payments 211,133 Less: Interest 154,836 Less: Interest 132,067 Less: Interest 43,233 PV of Minimum Payments 486,004 PV of Minimum Payments 397,677 PV of Minimum Payments 167,900
Capitalization of Operating Leases Capitalization of Operating Leases Capitalization of Operating Leases
Pre-Tax Cost of Debt 5.45% Pre-Tax Cost of Debt 5.45% Pre-Tax Cost of Debt 5.45%Number Years Implied by Year 6 Payment 5.4 Number Years Implied by Year 6 Payment 5.2 Number Years Implied by Year 6 Payment 5.1
Lease PV Lease Lease PV Lease Lease PV LeaseYear Commitment Payment Year Commitment Payment Year Commitment Payment1 64502 61168.3 1 42545 40346.1 1 35501 33666.22 76310 68625.9 2 54811 49291.8 2 37078 33344.43 68456 58381.0 3 58015 49476.7 3 27697 23620.74 66603 53865.1 4 53152 42986.6 4 19804 16016.55 57434 44049.0 5 51844 39761.8 5 14923 11445.26 & beyond 57434 199914.9 6 & beyond 51844 175814.3 6 & beyond 14923 49806.7PV of Minimum Payments 486004.3 PV of Minimum Payments 397677.3 PV of Minimum Payments 167899.7
Forecasted Leases2014 2015 2016 2017 2018 2019 2020 2021E 2022E 2023E 2024E 2025E 2026 CV
167,900 397,677 486,004 558,905 642,741 739,152 813,067 894,374 983,811 1,082,192 1,190,411 1,309,452 1,440,398 Growth 137% 22% 15% 15% 15% 10% 10% 10% 10% 10% 10% 10%Interest % 25% 24% 23% 23% 23% 23% 23% 23% 23% 23% 23% 23%Interest 132,067 154,836 128,548 147,830 170,005 187,005 205,706 226,277 248,904 273,795 301,174 331,291
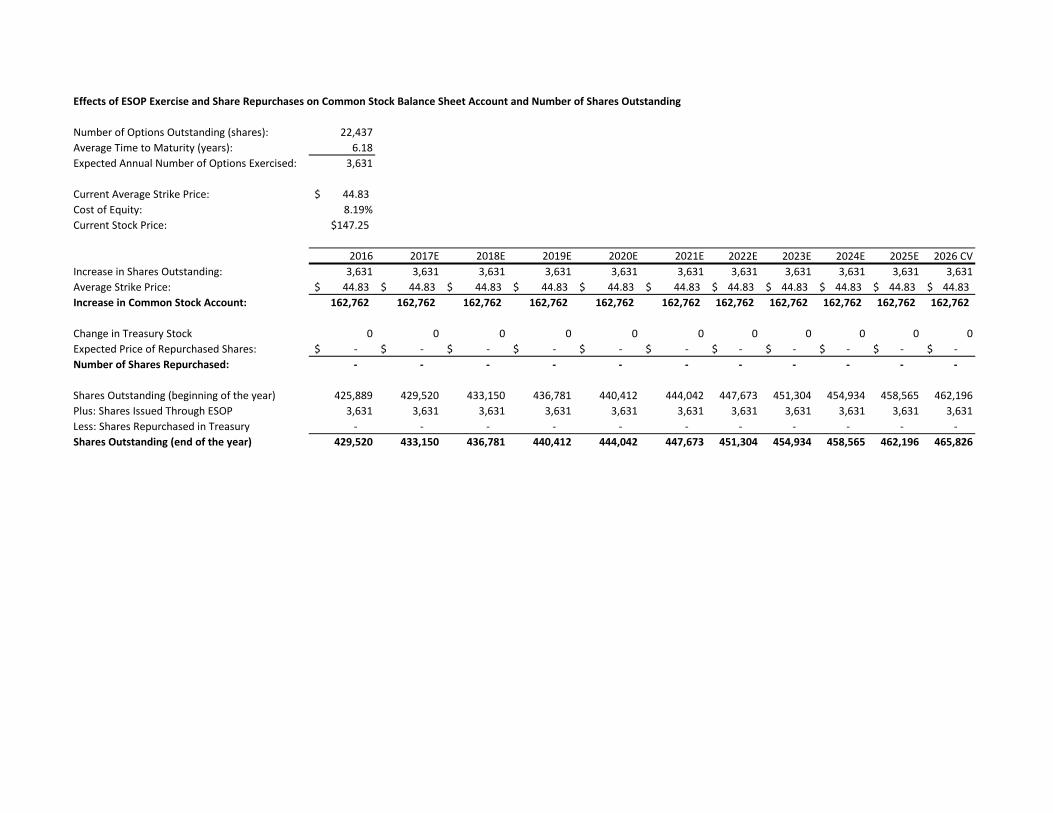
Effects of ESOP Exercise and Share Repurchases on Common Stock Balance Sheet Account and Number of Shares Outstanding
Number of Options Outstanding (shares): 22,437Average Time to Maturity (years): 6.18Expected Annual Number of Options Exercised: 3,631
Current Average Strike Price: 44.83$ Cost of Equity: 8.19%Current Stock Price: $147.25
2016 2017E 2018E 2019E 2020E 2021E 2022E 2023E 2024E 2025E 2026 CVIncrease in Shares Outstanding: 3,631 3,631 3,631 3,631 3,631 3,631 3,631 3,631 3,631 3,631 3,631Average Strike Price: 44.83$ 44.83$ 44.83$ 44.83$ 44.83$ 44.83$ 44.83$ 44.83$ 44.83$ 44.83$ 44.83$ Increase in Common Stock Account: 162,762 162,762 162,762 162,762 162,762 162,762 162,762 162,762 162,762 162,762 162,762
Change in Treasury Stock 0 0 0 0 0 0 0 0 0 0 0Expected Price of Repurchased Shares: -$ -$ -$ -$ -$ -$ -$ -$ -$ -$ -$ Number of Shares Repurchased: - - - - - - - - - - -
Shares Outstanding (beginning of the year) 425,889 429,520 433,150 436,781 440,412 444,042 447,673 451,304 454,934 458,565 462,196Plus: Shares Issued Through ESOP 3,631 3,631 3,631 3,631 3,631 3,631 3,631 3,631 3,631 3,631 3,631Less: Shares Repurchased in Treasury - - - - - - - - - - - Shares Outstanding (end of the year) 429,520 433,150 436,781 440,412 444,042 447,673 451,304 454,934 458,565 462,196 465,826
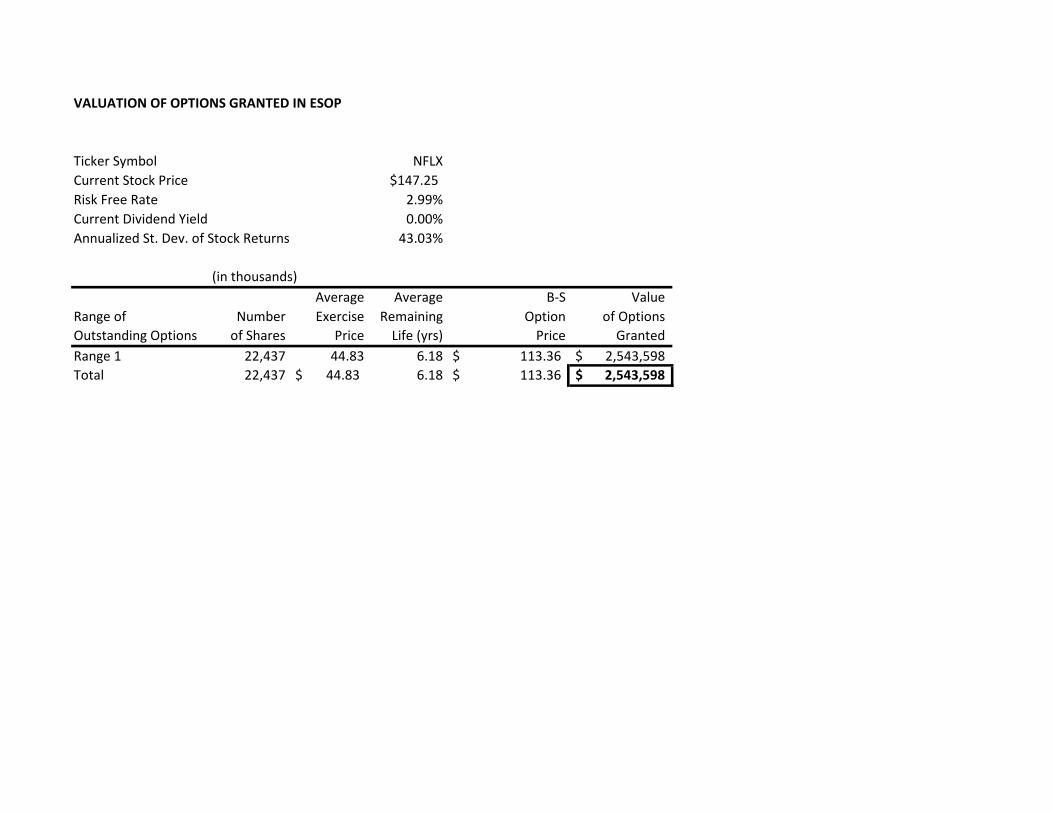
VALUATION OF OPTIONS GRANTED IN ESOP
Ticker Symbol NFLXCurrent Stock Price $147.25Risk Free Rate 2.99%Current Dividend Yield 0.00%Annualized St. Dev. of Stock Returns 43.03%
(in thousands)Average Average B-S Value
Range of Number Exercise Remaining Option of OptionsOutstanding Options of Shares Price Life (yrs) Price GrantedRange 1 22,437 44.83 6.18 113.36$ 2,543,598$ Total 22,437 44.83$ 6.18 113.36$ 2,543,598$
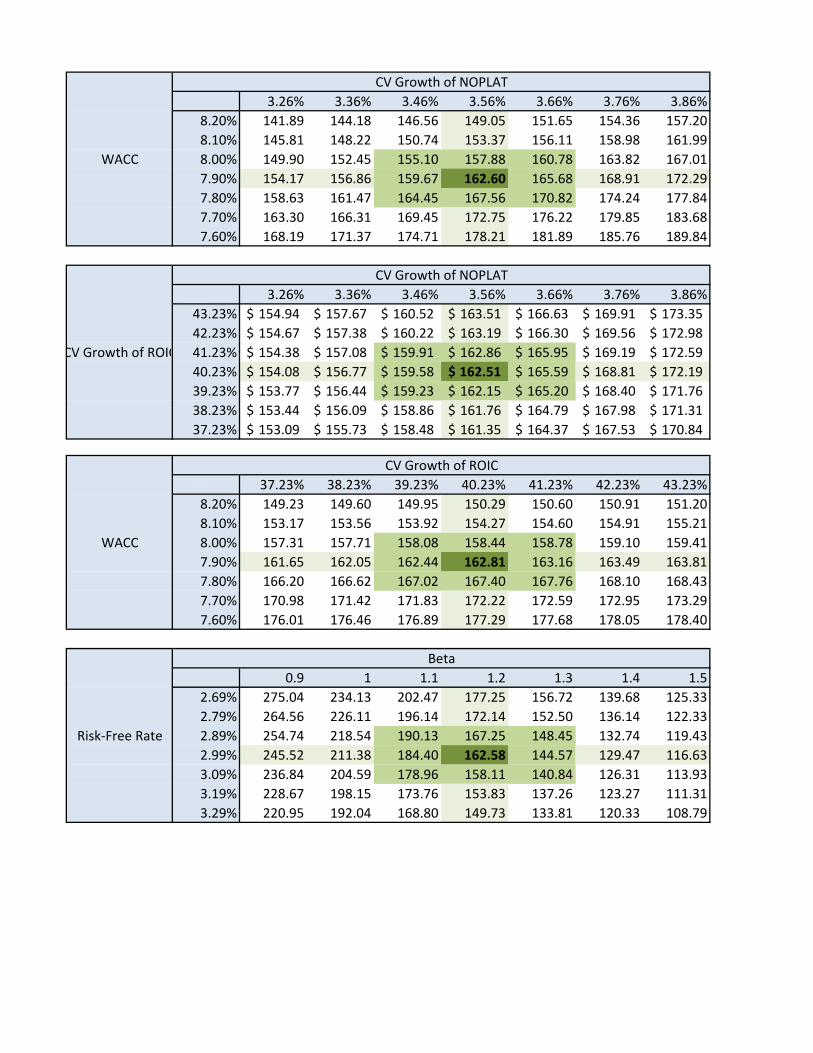
#REF! 3.26% 3.36% 3.46% 3.56% 3.66% 3.76% 3.86%8.20% 141.89 144.18 146.56 149.05 151.65 154.36 157.208.10% 145.81 148.22 150.74 153.37 156.11 158.98 161.99
WACC 8.00% 149.90 152.45 155.10 157.88 160.78 163.82 167.017.90% 154.17 156.86 159.67 162.60 165.68 168.91 172.297.80% 158.63 161.47 164.45 167.56 170.82 174.24 177.847.70% 163.30 166.31 169.45 172.75 176.22 179.85 183.687.60% 168.19 171.37 174.71 178.21 181.89 185.76 189.84
#REF! 3.26% 3.36% 3.46% 3.56% 3.66% 3.76% 3.86%43.23% 154.94$ 157.67$ 160.52$ 163.51$ 166.63$ 169.91$ 173.35$ 42.23% 154.67$ 157.38$ 160.22$ 163.19$ 166.30$ 169.56$ 172.98$
CV Growth of ROIC 41.23% 154.38$ 157.08$ 159.91$ 162.86$ 165.95$ 169.19$ 172.59$ 40.23% 154.08$ 156.77$ 159.58$ 162.51$ 165.59$ 168.81$ 172.19$ 39.23% 153.77$ 156.44$ 159.23$ 162.15$ 165.20$ 168.40$ 171.76$ 38.23% 153.44$ 156.09$ 158.86$ 161.76$ 164.79$ 167.98$ 171.31$ 37.23% 153.09$ 155.73$ 158.48$ 161.35$ 164.37$ 167.53$ 170.84$
#REF! 37.23% 38.23% 39.23% 40.23% 41.23% 42.23% 43.23%8.20% 149.23 149.60 149.95 150.29 150.60 150.91 151.208.10% 153.17 153.56 153.92 154.27 154.60 154.91 155.21
WACC 8.00% 157.31 157.71 158.08 158.44 158.78 159.10 159.417.90% 161.65 162.05 162.44 162.81 163.16 163.49 163.817.80% 166.20 166.62 167.02 167.40 167.76 168.10 168.437.70% 170.98 171.42 171.83 172.22 172.59 172.95 173.297.60% 176.01 176.46 176.89 177.29 177.68 178.05 178.40
#REF! 0.9 1 1.1 1.2 1.3 1.4 1.52.69% 275.04 234.13 202.47 177.25 156.72 139.68 125.332.79% 264.56 226.11 196.14 172.14 152.50 136.14 122.33
Risk-Free Rate 2.89% 254.74 218.54 190.13 167.25 148.45 132.74 119.432.99% 245.52 211.38 184.40 162.58 144.57 129.47 116.633.09% 236.84 204.59 178.96 158.11 140.84 126.31 113.933.19% 228.67 198.15 173.76 153.83 137.26 123.27 111.313.29% 220.95 192.04 168.80 149.73 133.81 120.33 108.79
CV Growth of NOPLAT
CV Growth of ROIC
CV Growth of NOPLAT
Beta