netapp private cloud capacity planning guide · 2018-08-31 · capacity concepts capacity planning...
TRANSCRIPT

NetApp Private Cloud Capacity Planning Guide
By Glenn Sizemore, Andrew Sullivan, NetApp
NetApp, Inc.495 East Java DriveSunnyvale, CA 94089U.S.
Telephone: +1 (408) 822-6000Fax: +1 (408) 822-4501Support telephone: +1 (888) 463-8277Web: www.netapp.comFeedback: [email protected]
Part number: TR-4329September 2014


Contents
Executive Summary ..................................................................................... 4Private Cloud Infrastructure Capacity Planning Introduction ..................................... 4
Capacity Concepts ........................................................................................ 5Characterized Workloads ............................................................................................ 5
Uncharacterized Workloads ........................................................................................ 5
Service Levels ............................................................................................................. 6
Resource Pools ............................................................................................................ 8
Capacity Planning Methodology ................................................................. 9Resource Budget ......................................................................................................... 9
Compute Resources ......................................................................................... 9
Storage Resources ......................................................................................... 10
How Capacity Planning Works ................................................................. 12Practical Examples .................................................................................................... 14
VM Sizing per Resource Pool ................................................................................... 15
Conclusion ................................................................................................... 18IMT compliance .......................................................................................... 19Copyright information ............................................................................... 20Trademark information ............................................................................. 21How to send your comments ...................................................................... 22Index ............................................................................................................. 23
Table of Contents | 3
Executive Summary
This guide is designed to help organizations quickly develop and implement private cloudinfrastructures while reducing both cost and risk.
Private Cloud Infrastructure Capacity Planning IntroductionIn general, cloud computing enables customers to efficiently provision resources on demand in a self-service model. Resources such as CPU, memory, storage capacity, and performance are optimized inthe cloud through resource pooling. Resource pooling allows physical and virtual resources to bedynamically reassigned according to the customer's current and future demands.
A private cloud infrastructure is operated solely for an organization. It can be managed by theorganization or a third party and can exist on or off site. Although private cloud infrastructures canbe thoroughly agnostic in terms of hardware and software, NetApp® storage efficiency technologiescan be used to increase performance.
NetApp refers to each instance of hardware as a pod, and each pod is designed to be fully self-contained, if necessary. Although each customer's environment can vary in its exact configuration,after the private cloud infrastructure is built, it is easily scalable when requirements and demandschange. This includes vertical scaling (adding additional resources within a pod), as well ashorizontal scaling (adding additional pods). Examples of vertical scaling include:
• Deploying additional or different rack-mount servers, blades, and chassis to increase computecapacity
• Deploying additional disk shelves to improve input/output (I/O) capacity and throughput
• Adding special hardware or software to introduce new features
The NetApp Private Cloud Infrastructure Capacity Planning Guide provides a blueprint for asuccessful private cloud deployment by aligning sizing and provisioning models into oneconsolidated, easy-to-use methodology.
4 | TR-4329: NetApp Private Cloud Capacity Planning Guide

Capacity Concepts
Capacity planning relies on workloads, resource pools, and a capacity budget. Workloads in ITenvironments generally fall into two categories: characterized workloads and uncharacterizedworkloads. Effective capacity planning requires a basic understanding of these distinct workloads.
Characterized WorkloadsCharacterized workloads are well studied, well understood, and well defined. Characterizedworkloads are generally associated with major applications that have wide adoption rates. In general,because the workload is well known and well understood, precise sizing tools already exist forcharacterized workloads.
This document focuses on uncharacterized workloads. For characterized workloads, NetApprecommends working with your storage and application providers to accurately size workloads withthe available tools. Contact your NetApp sale representative for information about characterizedworkload sizing.
Uncharacterized WorkloadsUncharacterized workloads vary widely and are neither well defined nor well understood. In general,no capacity planning or sizing tools are available for uncharacterized workloads. Both public andprivate cloud general-purpose virtualized client and server workloads tend to fall into theuncharacterized category.
A wide variety of virtual machine (VM) workloads exist, which makes it difficult to prescriptivelydefine resource pools to support them. The resource consumption of a virtual desktop, for example, isnot the same as the resource consumption of a departmental Microsoft® SharePoint® server. NetAppprivate cloud capacity planning divides the varying workloads into a relatively small number ofbuckets or VM classes. NetApp uses the terms small, medium, large, and extra large to define VMclasses, for example:
• Virtual desktops or small infrequently used application servers are considered small VMs.
• A wide variety of infrastructure roles, such as Microsoft Active Directory® servers, areconsidered medium VMs.
• Departmental applications leveraging Microsoft SQL Server® and departmental SharePointservers are examples of large VMs.
• Large online transaction processing (OLTP) workloads such as Oracle® Real Application Clusters(RAC) are considered extra large VMs.
5
Note: At this scale, it is likely that the workload is in fact a characterized workload and shouldbe sized independently by using the dedicated tools for such workloads.
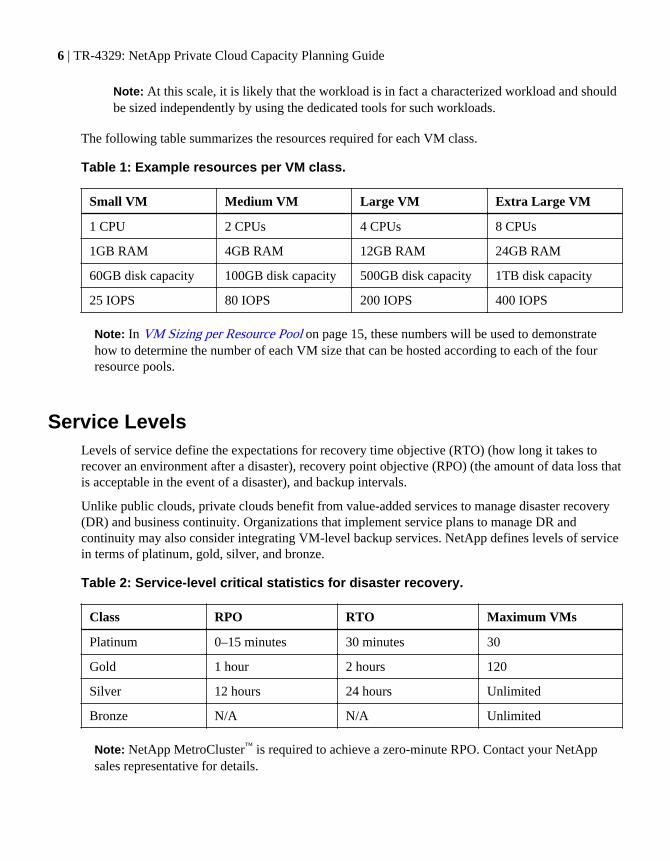
The following table summarizes the resources required for each VM class.
Table 1: Example resources per VM class.
Small VM Medium VM Large VM Extra Large VM
1 CPU 2 CPUs 4 CPUs 8 CPUs
1GB RAM 4GB RAM 12GB RAM 24GB RAM
60GB disk capacity 100GB disk capacity 500GB disk capacity 1TB disk capacity
25 IOPS 80 IOPS 200 IOPS 400 IOPS
Note: In VM Sizing per Resource Pool on page 15, these numbers will be used to demonstratehow to determine the number of each VM size that can be hosted according to each of the fourresource pools.
Service LevelsLevels of service define the expectations for recovery time objective (RTO) (how long it takes torecover an environment after a disaster), recovery point objective (RPO) (the amount of data loss thatis acceptable in the event of a disaster), and backup intervals.
Unlike public clouds, private clouds benefit from value-added services to manage disaster recovery(DR) and business continuity. Organizations that implement service plans to manage DR andcontinuity may also consider integrating VM-level backup services. NetApp defines levels of servicein terms of platinum, gold, silver, and bronze.
Table 2: Service-level critical statistics for disaster recovery.
Class RPO RTO Maximum VMs
Platinum 0–15 minutes 30 minutes 30
Gold 1 hour 2 hours 120
Silver 12 hours 24 hours Unlimited
Bronze N/A N/A Unlimited
Note: NetApp MetroCluster™ is required to achieve a zero-minute RPO. Contact your NetAppsales representative for details.
6 | TR-4329: NetApp Private Cloud Capacity Planning Guide
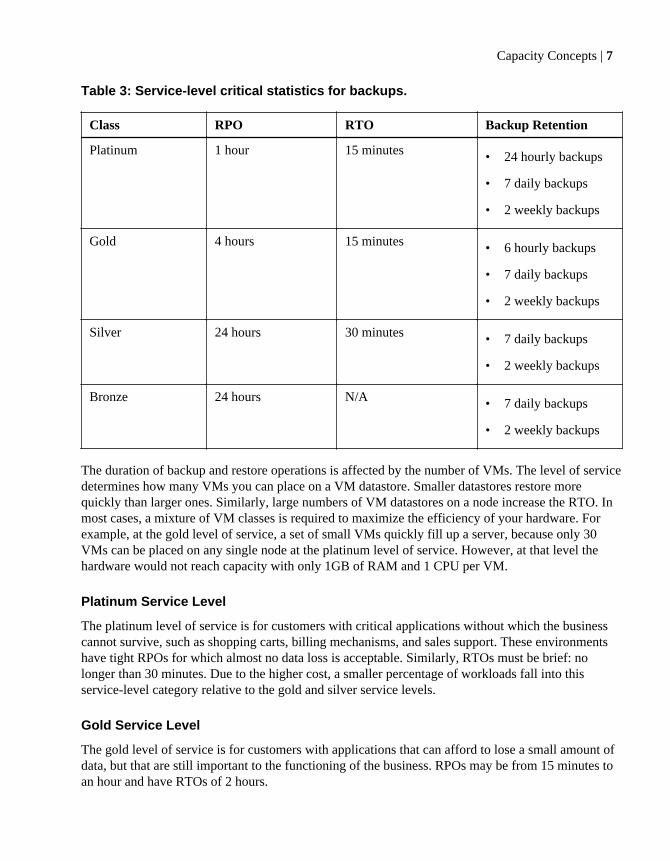
Table 3: Service-level critical statistics for backups.
Class RPO RTO Backup Retention
Platinum 1 hour 15 minutes • 24 hourly backups
• 7 daily backups
• 2 weekly backups
Gold 4 hours 15 minutes • 6 hourly backups
• 7 daily backups
• 2 weekly backups
Silver 24 hours 30 minutes • 7 daily backups
• 2 weekly backups
Bronze 24 hours N/A • 7 daily backups
• 2 weekly backups
The duration of backup and restore operations is affected by the number of VMs. The level of servicedetermines how many VMs you can place on a VM datastore. Smaller datastores restore morequickly than larger ones. Similarly, large numbers of VM datastores on a node increase the RTO. Inmost cases, a mixture of VM classes is required to maximize the efficiency of your hardware. Forexample, at the gold level of service, a set of small VMs quickly fill up a server, because only 30VMs can be placed on any single node at the platinum level of service. However, at that level thehardware would not reach capacity with only 1GB of RAM and 1 CPU per VM.
Platinum Service Level
The platinum level of service is for customers with critical applications without which the businesscannot survive, such as shopping carts, billing mechanisms, and sales support. These environmentshave tight RPOs for which almost no data loss is acceptable. Similarly, RTOs must be brief: nolonger than 30 minutes. Due to the higher cost, a smaller percentage of workloads fall into thisservice-level category relative to the gold and silver service levels.
Gold Service Level
The gold level of service is for customers with applications that can afford to lose a small amount ofdata, but that are still important to the functioning of the business. RPOs may be from 15 minutes toan hour and have RTOs of 2 hours.
Capacity Concepts | 7
Silver Service Level
The silver level of service is for customers with applications that are important to the business, butare not critical, and the temporary loss of which does not unduly affect the business. RPO for thesilver level of service may be up to 12 hours and an RTO of 24 hours.
Bronze Service Level
The bronze level of service is for any data that is not important to the day-to-day running of thebusiness, such as personal web hosts or development build servers. These servers carry no disasterrecovery requirement, because they can be rebuilt if they are lost. The servers are still backed up, butonly as long as the prior tiers' services levels are being met.
Resource PoolsWithin shared infrastructures, resources are managed by grouping similar resources together intoresource pools.
A public or private cloud resource can be compute (CPU or memory), storage (performance orcapacity), or bandwidth (both external for client connectivity and internal for connectivity betweenVMs or between VMs and other resources, such as storage). The combination of these resource poolsis the basis of a resource budget.
8 | TR-4329: NetApp Private Cloud Capacity Planning Guide
Capacity Planning Methodology
Capacity planning relies on defining a set of resource pools that when combined become the resourcebudget.
Characterized workloads are sized using usual processes and tools, and the result is subtracted fromthe resource budget. What remains is applied to uncharacterized workloads. This methodologycategorizes uncharacterized workloads into averaged buckets, which are then subtracted from theresource budget.
Resource BudgetThere are many types of resources within a public or private cloud environment. For the purposes ofthis guide, the network capabilities are assumed, and we focus our attention instead on compute andstorage resource types.
Compute Resources
There are two general categories of compute resources: CPU and memory. When you create VMs ona hypervisor, decide early how much CPU and RAM to give the VM.
To optimize private cloud infrastructures, it is important to balance resource pools and increaseefficiency. Oversubscribing hardware, or fanning out, helps to balance resource pool utilization.When you oversubscribe processing resources, you set up a fanned-out environment in which nosingle resource operates at 100% capacity. Rather, an ideal fan-out ratio creates an environment likea time share in which individual resources within the group operate at 40% to 70% utilization toaccount for failover and burst capacity.
NetApp supports most virtualization technologies on the market, and the guidance provided here iswidely applicable and can be adapted as necessary. However, this document focuses primarily onMicrosoft Hyper-V® and VMware vSphere®.
All hypervisors use the concept of logical processors to define CPU resources. A logical processorcan have either a physical or a hyperthreaded core. It is generally acceptable to count a hyperthreadedcore as half a physical core. Therefore, if a physical blade has 2 sockets with 6 cores each andhyperthreading is enabled, then the physical blade is said to contain 18 logical processors, 12physical cores, and 6 hyperthreaded cores. After the number of logical processors is known, fan-outratios are applied to determine how many virtual processors can be supported in total.
Although Microsoft Hyper-V has no logical CPU limit, NetApp recommends a starting maximumfan-out ratio of 8:1 for server workloads and 12:1 for virtual desktop infrastructure (VDI) workloads.As of the time of this writing, VMware vSphere 5.5 supports a maximum fan-out ratio of 32:1;however, NetApp recommends a starting maximum of 8:1 for server workloads and 12:1 for VDI.These values are merely suggested starting points; actual fan-out ratios should be determined by
9

monitoring ready time to make sure that all running VMs are satisfied. If a low ready time isobserved, the ratio can be safely increased. A high ready time indicates that the ratio should bedecreased. A conservative starting point for fan-out ratios is 4:1 for servers and 6:1 for VDI.
Generally speaking, most hypervisors support two methods for memory allocation: fixed or thin.Using the fixed method, all of the allocated RAM is fully assigned and removed from the availablepool. When using fixed allocation, you cannot oversubscribe the memory resources.
The thin method allocates memory at the host level as it is consumed by VMs. This enables you tooversubscribe the physical resources of the host. Thin memory allocation systems should be used toincrease VM density; they are not a means to increase the available memory pool. In general, a safeoversubscription ratio of 2:1 can be implemented.
Some hypervisors enable additional memory efficiency through methods such as transparent pagesharing, which is the equivalent of memory deduplication and/or a more tunable memory-allocationsubsystem. Regardless of hypervisor, you must decide whether or not to oversubscribe memoryresources.
Note: When oversubscribing memory, do not exhaust the available physical resources, orprohibitive performance impacts will result.
Remember, not all hypervisors are the same. Therefore, analyze your requirements to determine theappropriate fan-out ratio for your private cloud infrastructure.
Storage Resources
Storage resources are broadly categorized in terms of storage performance and storage capacity.
Capacity refers to the amount of data that can be stored on a disk. Performance refers to input/outputoperations per second (IOPS, which refers to how quickly data can be read or written) and latency(how long it takes to process a single data request).
From a sizing perspective, capacity utilization can affect performance. No storage pool should everbe filled to 100% utilization. NetApp recommends 20% free space to account for unexpected growthand technologies such as volume-level NetApp Snapshot™ copies.
Random-access workloads often place significant demands on the throughput of individual diskdrives. Systems must be configured with enough disk drives to meet the IOPS and latency needs ofthe applications, even if this results in excess capacity. NetApp recommends that customers mitigateany potential capacity and performance imbalances by purchasing disks with performance that isappropriate for the desired latency of operations that are not serviced from cache or by implementingthe appropriate virtual storage tiering (VST) technologies, such as NetApp Flash Pool™ or NetAppFlash Cache™.
Relationship Between Storage and Service Levels
When defining storage resource pools, it is desirable to have more than one storage pool, each withits own unique capacity and performance characteristics. Representative workloads for the extra-large VM class, for example, might include databases with high transaction rates such as enterprise
10 | TR-4329: NetApp Private Cloud Capacity Planning Guide

resource planning (ERP) or OLTP. Representative applications include Oracle and SAP®. Theseworkloads typically exhibit a high write/read ratio, but also exhibit a high write/overwrite ratio.
Note: Overwrite is the replacement of an existing block of storage with new data, versus theadditional write of a new block.
Typically, extra-large VM workloads fall into the characterized class and should be sizedindependently on dedicated storage. Extra-large workloads can still be virtualized and placed into theshared cloud. However, using the general storage pools for such workloads could prematurelyexhaust either capacity or performance.
Typically, large VM workloads utilize high-performance applications, are often latency sensitive,and need less than 10ms latency. SAS drives with Flash Pool for read and overwrite accelerationprovide the lowest cost performance that satisfies the need for fast retrieval and overwrite offrequently accessed blocks with low latency.
The medium VM class generally makes up the majority of the cloud infrastructure. These workloadshave a roughly equal 50/50 read/write ratio. Average latency should be less than 15ms, withacceptable peaks up to 20ms. High-speed SAS drives with Flash Cache for read acceleration providethe lowest cost performance that satisfies the need for fast retrieval of frequently accessed blocks.
The small VM class is only applicable to nonessential workloads such as web servers, desktops, andso forth. Due to the low performance requirements, the average latency should be less than 20ms,with acceptable peaks up to 40ms. SATA drives with Flash Cache for read acceleration provide thelowest cost capacity that satisfies the need for fast retrieval of frequently accessed blocks.
Unfortunately, there are no well-defined rules for storage, but certain approaches can be used.Depending on the size and scope of the cloud infrastructure, as well as the anticipated VMdeployments, it might make sense to have multiple, separate, dedicated pools. Likewise, it might bemore fiscally responsible to run a single pool using quality of service (QoS) to control how muchperformance each VM is allowed to consume. Generally speaking, though, NetApp has the tools andtechnologies to help build any pool at a fraction of the cost, all while enabling IT to combat shadowIT by offering value-added services, such as backup and DR, at a fraction of what such solutionswould cost in the public cloud.
Capacity Planning Methodology | 11

How Capacity Planning Works
Within shared infrastructures, when any one resource pool—such as CPU, RAM, IOPS, or storagecapacity—is exhausted, the entire cloud is exhausted. Therefore, to design a well-balancedenvironment, the environment should be sized so that resources are consumed at approximately thesame rate.
To determine system capacity, create containers that represent compute resources (CPU and RAM)and storage resources (IOPS and disk capacity). Apply modifiers to the raw resource numbers toaccount for overprovisioning, and create templates that represent the amount of allocatable resources.The environment can then be sized from any one of four perspectives: memory, CPU, storagecapacity, or storage performance. To assess your environment, you must calculate utilization from allfour perspectives to make sure that no single resource pool is exhausted prematurely.
Note: The numbers used in the following equations are for example only. You must determine thenumber of resources required based on the features supported in your unique private cloudinfrastructure.
Calculate Compute Resources
To calculate compute resources, determine the sum of the CPU cores for all servers and multiply bythe oversubscription or fan-out ratio. Determine the physical processor core count by taking thenumber of cores per socket, and then multiply by the number of sockets. For example, a two-socketquad-core host would have eight physical cores. Generally speaking, it is acceptable to counthyperthreading as half a core per thread, in which case, a 2-socket quad-core with hyperthreadingenabled would have 12 physical cores.
Use the following formula to calculate the total logical CPU count:
physical cores × fan-out ratio = logical CPU count
Calculate Memory Resources
Memory resources can be calculated for fixed or thin provisioning. For fixed provisioning, the totalamount of memory resources is the sum of the physical RAM. To determine the amount ofprovisionable RAM when using thin provisioning, the total amount of physical RAM is multiplied bythe oversubscription or fan-out ratio.
Use the following formula to calculate the memory resources for thin provisioning:
total physical RAM × fan-out ratio = logical RAM count
Calculate Storage Resources
Provisioning storage is slightly more complex. A drive has two separate resource pools: capacity andperformance (IOPS). Overall storage capacity is extinguished when one of those resources is
12 | TR-4329: NetApp Private Cloud Capacity Planning Guide

exhausted before the other. There is a natural imbalance on a drive between IOPS and capacity.Therefore, to avoid isolating capacity or IOPS, determine the more critical storage resource andoverprovision based on that.
Depending on the type of drive in use, either IOPS or capacity will be scarce. For example, a largeSATA drive typically has a large capacity but only a small amount of performance that can beallocated. Therefore, SATA drives are better suited for large data warehouse and other low-performance applications. In contrast, SSDs have a comparatively small amount of capacity, but alarge amount of performance; in this case, capacity is the scare resource.
To mitigate the imbalance, determine the GB:IOPS ratio for your storage pool and allocate resourcesbased on that ratio. When one resource is provisioned, an amount according to the GB:IOPS ratio ofthe opposing resource is also allocated. This can be difficult to predict due to virtual storage tiering(VST) technologies and their ability to artificially inject performance into the storage pool.
To determine the GB:IOPS ratio, ascertain the projected IOPS capacity (accounting for performanceaccelerators, such as Flash Pool or Flash Cache) and the projected GB capacity (accounting forNetApp storage efficiency technologies, such as deduplication and compression).
In the absence of formal NetApp sizing assistance, use the following assumptions:
• Storage efficiency of 50% (or .5)
• Performance acceleration of 100% (or 2)
Note: If you are not using Flash Cache or Flash Pool, assume a performance accelerator of20% (or .2)
Use the following formula to calculate the GB:IOPS ratio:
[physical capacity × (1 + storage efficiency)] ÷ (physical IOPS ×
performance accelerator) = GB:IOPS ratio
The GB:IOPS ratio is used during provisioning to maintain a balance between the two resources. Thepreceding formula yields the number of GB per one IOPS and will most commonly be more than a1:1 ratio unless you're using an all-flash storage controller.
Calculate Provisionable VM Count
After the total capacity of the compute, memory, and storage resource pools is determined, theprovisionable VM count can be calculated by combining the VM class with the service level todetermine the resource needs per VM. After a per-VM resource requirement is established, the totalprovisionable VM count can be derived by dividing the per VM resource by the available resourcepool on a per–resource pool basis. The smallest number in the following set of equations is themaximum number of VMs that can be safely hosted:
• Maximum VMs = sum pCPU ÷ desired number of vCPU per VM
Note: pCPU is physical CPU.
• Maximum VMs = sum pRAM ÷ desired RAM per VM
How Capacity Planning Works | 13

Note: pRAM is physical RAM.
• Maximum VMs = total IOPS ÷ (desired GB per VM × IOPS per GB)
• Maximum VMs = total GB ÷ (desired IOPS per VM × GB per IOPS)
Practical ExamplesThe numbers used in the following equations are for example only.
Determine the number of resources required for your environment by using the methods described in How Capacity Planning Works on page 12. Assume a FlexPod® environment has 8 hosts with 24physical CPUs (pCPUs) each (or 2 × 12 core CPUs with hyperthreading) and 192GB of RAM. Thestorage is configured with 5 shelves (118 disks) of 10k RPM 900GB SAS drives and 1 shelf of 10200GB SSDs to create Flash Pool aggregates. Using this example, the following equationsdemonstrate how to calculate the available resources.
Calculate Compute Resource Pool
1. Calculate the physical cores:(24 pCPUs + 12 hyperthreaded CPUs per host) × 8 hosts = 288 pCPUs
2. Calculate the logical CPU count:288 pCPUs × 4 = 1152 logical CPUs
Note: Assume a 4:1 overcommit ratio.
Calculate Memory Resource Pool
1. Calculate the physical RAM:192GB per host × 8 host = 1.5TB of pRAM
2. Calculate the logical RAM:1.5TB × 1.5 = 2.25TB logical RAM
Note: Assume a 50% overcommit ratio.
Calculate Storage Capacity Pool
1. Calculate the capacity:88 disks × 900GB per disk = 77TB storage
Note: Some drives have been removed to account for parity and spares.
2. Calculate the provisionable capacity:77TB storage × 1.5 = 115TB storage
14 | TR-4329: NetApp Private Cloud Capacity Planning Guide

Note: Assume storage efficiency of 50%.
Calculate Storage Performance Pool
1. Calculate the raw IOPS:88 disks × 140 IOPS per disk = 12,000 disk IOPS
2. Calculate the provisionable IOPS capacity:12,000 IOPS × 4 = 48,000 IOPS
Note: By using Flash Pool technology, we are significantly increasing the performanceaccelerator. Consult your NetApp sales team for accurate numbers for your environment.
Calculate GB:IOPS Ratio
115TB ÷ 48,000 IOPS = 2.5GB:1 IOPS
For every IOPS provisioned, 2.5GB of capacity is provisioned. Likewise, for every 2.5GB ofcapacity provisioned, 1 IOPS is provisioned. If you extrapolate this to a standard VM HDD size of60GB, the VM would receive approximately 24 IOPS of performance.
These equations provide a basic understanding of the resource pool sizing. Determining how manyVMs can be provisioned is now a matter of simple division.
VM Sizing per Resource PoolAfter sizing the four resource pools (compute, memory, storage capacity, and storage performance),you can apply NetApp VM class prescriptions to size VMs per resource pool.
Uncharacterized Workloads on page 5, summarized the required CPU, RAM, storage capacity, andstorage performance resources per VM class. Those numbers are now employed to ascertain thenumber of each VM class that can be hosted according to each of the four resource pools.
CPU
To determine the number of each VM size that can be hosted according to CPU, divide the size of theresource pool by the number of desired vCPUs:
• Small: 1,152 resource pool CPUs ÷ 1 vCPU per VM = 1,152 small VMs
• Medium: 1,152 resource pool CPUs ÷ 2 vCPUs per VM = 576 medium VMs
• Large: 1,152 resource pool CPUs ÷ 4 vCPUs per VM = 288 large VMs
• Extra large: 1,152 resource pool CPUs ÷ 8 vCPUs per VM = 144 extra large VMs
How Capacity Planning Works | 15

RAM
To determine the number of each VM size that can be hosted according to RAM, divide the size ofthe pool by the amount of desired RAM:
• Small: 2304GB resource pool RAM ÷ 1GB per VM = 2,304 small VMs
• Medium: 2304GB resource pool RAM ÷ 4GB per VM = 576 medium VMs
• Large: 2304GB resource pool RAM ÷ 12GB per VM = 192 large VMs
• Extra large: 2304GB resource pool RAM ÷ 24GB per VM = 96 extra large VMs
Capacity
To determine the number of each VM size that can be hosted according to storage capacity, dividethe size of the pool by the number of desired GB per VM:
• Small: 115TB resource pool capacity ÷ 60GB per VM = 1,962 small VMs
• Medium: 115TB resource pool capacity ÷ 100GB per VM = 1,177 medium VMs
• Large: 115TB resource pool capacity ÷ 500GB per VM = 235 large VMs
• Extra large: 115TB resource pool capacity ÷ 1TB per VM = 115 extra large VMs
Performance
To determine the number of each VM size that can be hosted according to storage performance(IOPS), divide the size of the pool by the number of desired IOPS:
• Small: 48K resource pool IOPS ÷ 25 IOPS per VM = 1,920 small VMs
• Medium: 48K resource pool IOPS ÷ 80 IOPS per VM = 600 medium VMs
• Large: 48K resource pool IOPS ÷ 200 IOPS per VM = 240 large VMs
• Extra large: 48K resource pool IOPS ÷ 400 IOPS per VM = 120 extra large VMs
To determine the maximum number of VMs that can be hosted for each VM class, it is easier to viewthem in the following table.
Note: Each size is restricted by the smallest number for each different resource pool. For example,a maximum of 192 large VMs can be hosted, because 192 is the smallest number in the large VMrow.
16 | TR-4329: NetApp Private Cloud Capacity Planning Guide

Table 4: Maximum VMs hosted per VM class.
VM Class CPU RAM Capacity Performance
Number of smallVMs
1,152 2,304 1,962 1,920
Number ofmedium VMs
576 576 1,177 600
Number of largeVMs
288 192 235 240
Number of extralarge VMs
144 96 115 120
How Capacity Planning Works | 17
Conclusion
Using the described methodology to categorize uncharacterized workloads, you can size your privatecloud infrastructure to make sure of sufficient storage capacity and performance, CPU, and memoryto support a fully provisioned pod.
However, this is just the first step to getting maximum utilization from your assets. To make sure thatyou use your system to its full potential, it is essential that you periodically perform cycles ofmonitoring, adjusting/tuning, verifying that the adjustments were beneficial, and making additionalcorrective actions. This series of steps, commonly called the Deming Cycle, makes sure that as theresources used by your organization change, so does your policy of allocation and management.
Effective monitoring, which is used for trend analysis, is critical for predicting when resourceexhaustion will occur and for preventing shortages. Utilizing tool sets already in place in yourorganization or products from NetApp, such as NetApp OnCommand® Insight or OnCommandUnified Manager, helps you to observe the current status of the capacity and performance of theequipment and additionally provide long-term statistics for analyzing the effectiveness of yourcapacity assumptions.
For example, if your assumption during the planning cycle was that your organization wouldconsume approximately 60% small VMs, 20% medium VMs, 15% large VMs, and 5% extra-largeVMs, you should validate those assumptions over time. If the ratios are incorrect, you might not beable to host as many VMs as originally planned, or conversely, you might end up with many moreVMs, which could affect other areas of your infrastructure and procurement process. Analyzing thedata to make sure that the sizing of your service offerings is correct might also assist these processesby proving that your initial sizing assumptions were undersized or oversized, thereby affecting thenumber of VMs that can be hosted.
Monitoring also plays an important role in determining optimal times for maintenance and batch jobscheduling. Using a monitoring system that allows you, the administrator, to view system utilizationover a long period of time will facilitate decisions regarding the best time to execute backup jobs andscheduling storage system maintenance with minimal impact.
If your organization uses a bill-back or show-back model for consumption of resources, monitoring iskey to making sure that those numbers are accurate and reflect the true utilization by customers.Customers who feel they are being unfairly overcharged are less likely to want to continue usingyour services. Likewise, if your budget is based on utilization, make sure that every CPU cycle, byteof RAM, and megabyte of disk space is accounted for to make sure that you are not underchargingcustomers.
Capacity planning is an art based on point-in-time assumptions during the planning phase. Tomaximize the use of your equipment, you must continually monitor, adjust, and improve theassumptions that were made. This practice not only assists with managing current resources, but alsowill make sizing the next infrastructure architecture significantly easier because you will have good,reliable data available upon which to base your decisions.
18 | TR-4329: NetApp Private Cloud Capacity Planning Guide

IMT compliance
Refer to the Interoperability Matrix Tool (IMT) on the NetApp Support site to validate that the exactproduct and feature versions described in this document are supported for your specific environment.The NetApp IMT defines the product components and versions that can be used to constructconfigurations that are supported by NetApp. Specific results depend on each customer's installationin accordance with published specifications.
19

Copyright information
Copyright © 1994–2014 NetApp, Inc. All rights reserved. Printed in the U.S.
No part of this document covered by copyright may be reproduced in any form or by any means—graphic, electronic, or mechanical, including photocopying, recording, taping, or storage in anelectronic retrieval system—without prior written permission of the copyright owner.
Software derived from copyrighted NetApp material is subject to the following license anddisclaimer:
THIS SOFTWARE IS PROVIDED BY NETAPP "AS IS" AND WITHOUT ANY EXPRESS ORIMPLIED WARRANTIES, INCLUDING, BUT NOT LIMITED TO, THE IMPLIEDWARRANTIES OF MERCHANTABILITY AND FITNESS FOR A PARTICULAR PURPOSE,WHICH ARE HEREBY DISCLAIMED. IN NO EVENT SHALL NETAPP BE LIABLE FOR ANYDIRECT, INDIRECT, INCIDENTAL, SPECIAL, EXEMPLARY, OR CONSEQUENTIALDAMAGES (INCLUDING, BUT NOT LIMITED TO, PROCUREMENT OF SUBSTITUTEGOODS OR SERVICES; LOSS OF USE, DATA, OR PROFITS; OR BUSINESSINTERRUPTION) HOWEVER CAUSED AND ON ANY THEORY OF LIABILITY, WHETHERIN CONTRACT, STRICT LIABILITY, OR TORT (INCLUDING NEGLIGENCE OROTHERWISE) ARISING IN ANY WAY OUT OF THE USE OF THIS SOFTWARE, EVEN IFADVISED OF THE POSSIBILITY OF SUCH DAMAGE.
NetApp reserves the right to change any products described herein at any time, and without notice.NetApp assumes no responsibility or liability arising from the use of products described herein,except as expressly agreed to in writing by NetApp. The use or purchase of this product does notconvey a license under any patent rights, trademark rights, or any other intellectual property rights ofNetApp.
The product described in this manual may be protected by one or more U.S. patents, foreign patents,or pending applications.
RESTRICTED RIGHTS LEGEND: Use, duplication, or disclosure by the government is subject torestrictions as set forth in subparagraph (c)(1)(ii) of the Rights in Technical Data and ComputerSoftware clause at DFARS 252.277-7103 (October 1988) and FAR 52-227-19 (June 1987).
20 | TR-4329: NetApp Private Cloud Capacity Planning Guide

Trademark information
NetApp, the NetApp logo, Network Appliance, the Network Appliance logo, Akorri,ApplianceWatch, ASUP, AutoSupport, BalancePoint, BalancePoint Predictor, Bycast, CampaignExpress, ComplianceClock, Customer Fitness, Cryptainer, CryptoShred, CyberSnap, Data CenterFitness, Data ONTAP, DataFabric, DataFort, Decru, Decru DataFort, DenseStak, Engenio, Engeniologo, E-Stack, ExpressPod, FAServer, FastStak, FilerView, Fitness, Flash Accel, Flash Cache, FlashPool, FlashRay, FlexCache, FlexClone, FlexPod, FlexScale, FlexShare, FlexSuite, FlexVol, FPolicy,GetSuccessful, gFiler, Go further, faster, Imagine Virtually Anything, Lifetime Key Management,LockVault, Manage ONTAP, Mars, MetroCluster, MultiStore, NearStore, NetCache, NOW (NetAppon the Web), Onaro, OnCommand, ONTAPI, OpenKey, PerformanceStak, RAID-DP, ReplicatorX,SANscreen, SANshare, SANtricity, SecureAdmin, SecureShare, Select, Service Builder, ShadowTape, Simplicity, Simulate ONTAP, SnapCopy, Snap Creator, SnapDirector, SnapDrive, SnapFilter,SnapIntegrator, SnapLock, SnapManager, SnapMigrator, SnapMirror, SnapMover, SnapProtect,SnapRestore, Snapshot, SnapSuite, SnapValidator, SnapVault, StorageGRID, StoreVault, theStoreVault logo, SyncMirror, Tech OnTap, The evolution of storage, Topio, VelocityStak, vFiler,VFM, Virtual File Manager, VPolicy, WAFL, Web Filer, and XBB are trademarks or registeredtrademarks of NetApp, Inc. in the United States, other countries, or both.
IBM, the IBM logo, and ibm.com are trademarks or registered trademarks of International BusinessMachines Corporation in the United States, other countries, or both. A complete and current list ofother IBM trademarks is available on the web at www.ibm.com/legal/copytrade.shtml.
Apple is a registered trademark and QuickTime is a trademark of Apple, Inc. in the United Statesand/or other countries. Microsoft is a registered trademark and Windows Media is a trademark ofMicrosoft Corporation in the United States and/or other countries. RealAudio, RealNetworks,RealPlayer, RealSystem, RealText, and RealVideo are registered trademarks and RealMedia,RealProxy, and SureStream are trademarks of RealNetworks, Inc. in the United States and/or othercountries.
All other brands or products are trademarks or registered trademarks of their respective holders andshould be treated as such.
NetApp, Inc. is a licensee of the CompactFlash and CF Logo trademarks.
NetApp, Inc. NetCache is certified RealSystem compatible.
21

How to send your comments
You can help us to improve the quality of our documentation by sending us your feedback.
Your feedback is important in helping us to provide the most accurate and high-quality information.If you have suggestions for improving this document, send us your comments by email to [email protected]. To help us direct your comments to the correct division, include in thesubject line the product name, version, and operating system.
You can also contact us in the following ways:
• NetApp, Inc., 495 East Java Drive, Sunnyvale, CA 94089 U.S.
• Telephone: +1 (408) 822-6000
• Fax: +1 (408) 822-4501
• Support telephone: +1 (888) 463-8277
22 | TR-4329: NetApp Private Cloud Capacity Planning Guide

Index
C
characterized workloads 5comments
how to send feedback about documentation 22compute resources
CPU 9memory 9
CPU 9, 15
D
doccommentshow to send feedback about documentation by using22
documentationhow to send feedback about 22
F
feedbackhow to send comments about documentation 22
H
high-quality informationhow to send feedback about improvingdocumentation 22
I
informationhow to send feedback about improvingdocumentation 22
M
memory 9, 15
Q
quality documentationhow to send feedback about improving 22
R
resource pools 8–10
S
service levels 6, 10sizing
compute resources 12, 14, 15storage resources 12, 14, 15
storage capacity 10, 15storage performance 10, 15storage resources
storage capacity 10storage performance 10
suggestionshow to send feedback about documentation 22
U
uncharacterized workloads 5
V
VM classes 5, 10
W
workloadscharacterized workloads 5uncharacterized workloads 5
Index | 23