net migration flows, neighbourhood change and spatial ... · selective migration and neighbourhood...
TRANSCRIPT
Working Paper No.11
October 2007
Selective Migration and Neighbourhood Deprivation: evidence from 2001
Census Migration Data for England and Scotland
Nick Bailey Mark Livingston
Department of Urban Studies Department of Urban Studies
University of Glasgow University of Glasgow Corresponding author: Nick Bailey ([email protected])
SELECTIVE MIGRATION AND NEIGHBOURHOOD DEPRIVATION
2
ABSTRACT
Selective migration flows are thought to be a key means by which the intended benefits of
area-based initiatives “leak out” of target areas, undermining their effectiveness. To date,
direct evidence on the scale or impact of these flows has been weak since they are difficult to
assess using survey methods. Using 2001 Census data for England and Scotland, this paper
looks at the scale and composition of flows for deprived neighbourhoods with a particular
focus on educational attainment. It analyses the impacts of these flows on the characteristics
of deprived areas, exploring differences between regions and comparing neighbourhoods
involved in two major regeneration programmes with other deprived areas. The paper shows
that selective migration flows do serve to reinforce spatial segregation but that the scale of
this effect appears very modest and that impacts vary between regions. Flows for the
regeneration areas are less adverse than for similarly deprived neighbourhoods.
3
1. INTRODUCTION
There is a long-standing concern in both academic research and public policy over the extent
of spatial segregation within towns and cities and, consequently, over the concentration of the
poorest households into “deprived neighbourhoods”. One kind of policy response (most
common in North America) has been to promote mobility of individuals away from deprived
neighbourhoods so limitting individual exposure to these “damaging environments”, as for
example in the Gautreaux project (Rosenbaum et al, 2002). Such approaches are open to the
criticism that, while they may benefit the individuals who move (and the evidence on that
question is mixed), this is at the expense of the neighbourhoods they leave. An alternative
response (more common in European countries) has been to target selected areas with
additional resources through “area-based initiatives” (ABIs) (Parkinson, 1998). ABIs have
been criticised on several grounds: that they tackle symptoms (localised concentrations of
deprived households) rather than underlying causes (social inequality); that they are low-cost,
tokenistic interventions done largely for political reasons; and that they are inequitable as
only a limited proportion of “deprived households” live in “deprived neighbourhoods”
(Kleinman, 1999). This paper is concerned with another possible criticism: that area-based
initiatives are likely to be ineffective means of reducing spatial segregation because selective
migration processes constantly erode any gains – the idea that “those who get on, get out”
(SEU, 2001) to be replaced by individuals with higher levels of need.
The concern with selective migration also fuels the debate about whether the role of
regeneration programmes is to target “people” or “places”. People-focussed interventions are
those designed to alleviate household deprivation directly; examples might include the
provision of additional health services, support for children or families, or employment and
training programmes. Place-focussed interventions try to enhance the quality of housing and
the physical environment, partly to benefit existing residents and partly to make the area
attractive to less deprived households, thereby reducing the concentration of deprivation;
examples might include housing or environmental improvements, or the improvement or
social or economic amenities. Critics of people-focussed approaches argue that concentrating
effort on individuals means that programme benefits may “leak away” as people move out of
the area so that the overall level of deprivation may remain unchanged in spite of many years
of intensive local action (McGregor and Fitzpatrick, 1995; ODPM Select Committee, 2003).
It has even been argued that particular kinds of people-focussed programmes, notably those
that focus on improving residents’ employability, may exacerbate selective migration by
SELECTIVE MIGRATION AND NEIGHBOURHOOD DEPRIVATION
4
increasing the number of people able to move and speeding up their replacement with
households with higher levels of need (Cheshire et al, 2003). In this view, equal or greater
effort needs to be spent on improving places. .
In spite of the importance of this issue, the evidence on the scale, composition and impacts of
migration flows for deprived areas is very poor. The main reason is that these flows are very
difficult to measure reliably (Dabinett et al, 2001; Carley, 2002; PMSU/ODPM, 2005). While
it is relatively easy to identify recent in-migrants to an area through surveys, it is much more
difficult to obtain a representative sample of those who have left. Without an understanding
of the flows in both directions, it is impossible to assess the impacts of migration on area
characteristics. This paper takes advantage of the unique strengths of the Census through the
question on place of residence one year previously. This makes it possible to identify both in-
and out-migrants for every small area in the country. From this, it is possible to measure the
net flows and to assess the impact these have on the characteristics of the area.
The structure of the paper is as follows. The second section reviews the existing research on
the scale and impacts of net migration in deprived neighbourhoods. It examines the different
approaches that have been taken to try to shed light on this issue, and assesses their relative
merits as well as the evidence they provide. The third section provides details on the data
sources and methods used for the present study. Findings are presented in the fourth section
while the fifth provides conclusions and a discussion of the implications for policy.
2. THE EVIDENCE ON NET MIGRATION FLOWS AND SPATIAL
SEGREGATION
A number of studies provide evidence on selective migration in deprived neighbourhoods.
For the purposes of this review, these have been grouped by the methods or data sources used
because these have a significant bearing on the quality and scope of the evidence the studies
offer. There are two issues in particular. First, the general measurement issues of bias and
reliability are particularly important in this area. Net migration flows cannot be measured
directly but must be derived from differences between in- and out-migration flows. A bias in
the measurement of either of the latter will provide misleading estimates of the first,
particular since net flows are often quite small in relation to gross flows. Second, caution
SELECTIVE MIGRATION AND NEIGHBOURHOOD DEPRIVATION
5
needs to be exercised with studies which cover only a limited number of deprived
neighbourhoods. Many moves from one deprived area end in another deprived area. They are
“horizontal” rather than “vertical” (Bailey and Livingston, 2007; Green et al, 2005) so one
neighbourhood’s loss may be another’s gain.
Administrative data
One approach to assessing migration flows for deprived areas is to make use of
administrative data from systems with much broader geographic coverage, most obviously
national welfare benefit systems. This has the advantage that it should provide equal coverage
of in- and out-movers and that it should be possible to extract large quantities of information
relatively cheaply. The main limitation is that these sources provide flows only for part of the
population (e.g. claimants of the relevant benefit) so they cannot reveal the impact of
migration on neighbourhood population composition.
As part of their study of the impacts of employment and training programmes in a major
Scottish ABI (the Urban Partnership areas), McGregor and Fitzpatrick (1995) used
administrative data on claimants of unemployment benefit. One significant finding is that
there are substantial flows of claimants into and out of the target areas and that, by
comparison, net flows are very small. In one neighbourhood over a three year period, around
2000 unemployed people moved in or out but the net flow was a reduction in the number of
unemployed of just 11. In the other area, with gross flows of around 600, there was a net
reduction of 100. Without knowing how many employed people moved in each direction,
however, it is impossible to identify the impacts of migration on the unemployment rates for
these areas.
Mover surveys
Several studies of ABIs have used surveys of movers to try to identify the scale of selective
migration. In contrast to administrative data, mover surveys offer the possibility of a
representative picture covering all migrants. The main limitation of these surveys is the
difficulty and expense of tracking out-migrants, with the danger that samples of this critical
group tend to be small and may suffer from bias. In particular, there is a concern that more
disadvantaged out-migrants with less stable lives will be more difficult to trace and will
therefore be under-represented. This may lead to out-migrants appearing to be less
SELECTIVE MIGRATION AND NEIGHBOURHOOD DEPRIVATION
6
disadvantaged than they would otherwise, exaggerating any tendency for selective migration
to increase the concentration of deprivation in more deprived neighbourhoods.
Four British mover surveys have been identifed (McGregor and Fitzpatrick, 1995; Cheshire
et al, 1998; Green et al, 2005; CRESR, 2005). Perhaps the most widely cited of these was
Cheshire et al’s (1998) evaluation of the Harlesden City Challenge (Cheshire et al, 1998),
elements of which are also reported in Cheshire et al (2003). (City Challenge was an English
neighbourhood regeneration programme which targetted large-scale, multi-sectoral
interventions on 31 deprived neighbourhoods during the early 1990s (Russell et al, 2000).)
Cheshire et al found that unemployment rates in the target area actually rose relative to other
deprived areas over the five-year life of the initiative in spite of evidence of an effective
programme of training and employment interventions. This finding was attributed directly to
selective migration. The movers survey showed that out-migrants were significantly less
likely to be unemployed than in-movers (9 per cent compared with 21 per cent for in-movers)
and a much higher proportion were in full-time employment.
"Paradoxically, therefore, the very success of the programme - because it had induced
selective mobility - had led to the deterioration in the unemployment rate of current
residents at the end of the period." (Cheshire et al, 2003: p92)
CRESR (2005) is based on data from very large surveys undertaken for the national
evaluation of the the largest neighbourhood regeneration programme under New Labour, the
New Deal for Communities. As expected, the survey found that out-movers were less
disadvantaged than either in-movers or stayers (CRESR 2005). The other two studies also
report the same overall result.
In spite of the apparent unanimity, some caution should be exercised with these results. First,
the samples involved are relatively small. In the case of Cheshire et al (1998), they are based
on 63 in-movers and 48 out-movers (p92). CRESR (2005) is the largest in scale but still
manages just 335 out-migrants. All four studies had fewer out-migrants than in-migrants in
their samples. With Cheshire et al (1998), out-migrants were traced through the Electoral
Register. Where movers were identified, there was a very high response rate (personal
correspondence with the author). Nevertheless, there must be a concern that this source is
likely to cover only a proportion of those leaving the target area, Raising questions about
SELECTIVE MIGRATION AND NEIGHBOURHOOD DEPRIVATION
7
possible bias. With the CRESR (2005) study, the response rate for the movers survey was 51
per cent compared with 70 per cent for the main household survey (MORI, 2005).
Furthermore, all of these studies focus on a small number of deprived areas. None provides
an overview of selective migration across all deprived areas.
National surveys
A broader picture of the impacts of migration flows on deprived areas could be gathered from
national surveys using either a longitudinal design or a retrospective question on mobility.
For longitudinal designs, the ability of the survey to retain migrants and more deprived
households will be a key concern while, for retrospective questions, the usual problems of
recall will apply. Overall sample sizes will also be an issue, especially for cross-sectional
surveys, given the need to capture sufficient numbers migrating from deprived
neighbourhoods over a single time-period.
In spite of the possibilities, such sources have not been exploited to a great extent to date. An
extensive literature has examined the determinants of individual mobility, discussing in
particular the relative contribution of housing and neighbourhood factors (for example:
Speare, 1974; Newman and Duncan, 1979; Lee et al, 1994; Clark and Huang, 2003; Kearns
and Parkes, 2003). As South and Crowder (1997) note, much of this literature takes no
account of the geography of moves – whether individuals move to or from deprived
neighbourhoods. Their study addressed that gap, and has been followed by further studies in
the US and Europe (South et al, 2005; Bolt and van Kempen, 2003). These studies identify
the factors which tend to aid escape from poor neighbourhoods or reduce the risk of entry.
They confirm that more affluent groups are more likely to leave poor neighbourhoods and
that less affluent groups are more likely to enter, supporting what South and Crowder (1997)
term the human capital/life-stage model of mobility (the idea that individuals adjust their
neighbourhood location to fit with changes in income driven largely driven by human capital
development but also by changing preferences over the life-course such as the arrival of
children). Quillian (2003) extends this work by looking at the factors that influence durations
in poor neighbourhoods. What none of these studies do is to document the scale of the effect
that these differentials in migration have on the concentration of poverty or the extent of
segregation.
SELECTIVE MIGRATION AND NEIGHBOURHOOD DEPRIVATION
8
Census- and register-based studies
Census- or register-based studies offer several potential advantages over both administrative
data and survey-based approaches. With (near) full population coverage, they not only
provide evidence on all population groups, they are also able to provide detail for all deprived
areas. This can be used to explore how selective migration flows are affected by the broader
economic and housing market context within which the neighbourhood is located, through
comparisons between regions and/or time periods. The main limitation is the relative lack of
information on personal or household characteristics; with the UK Census, at least, almost all
the personal data relates to the Census date, after any moves have taken place. In spite of
these advantages, relatively little analysis has been conducted on the impacts of migration at
the neighbourhood level.
The strongest evidence comes from two Scaninavian studies that take advantage of the
sophisticated register-based datasets. Graversen et al (1997) examine migration in to and out
of “problem housing estates” in Denmark in the early 1990s. Andersson and Bråmå (2004)
look at flows for deprived areas in the Stockholm region. In both studies, net migration flows
were seen to reinforce deprivation in these areas. A range of outcome measures were
employed including labour market position, income and benefit dependency. Andersson and
Bråmå (2004) also show that the patterns were consistent in two time periods with very
different macro-economic context (the early 1990s when the Swedish economy saw a severe
recession and the late 1990s when it grew fairly strongly).
In the study that comes closest to the analysis reported in this paper, Nord (1998) uses US
Census data to examine differences in poverty-specific migration flows between poor and
non-poor areas although his geographic focus is the US county, broadly equivalent to local
authorities in the UK in terms of scale. Nord shows that net flows act to reinforce spatial
segregation and, uniquely among studies examined here, he estimates the scale of the impact
this had. Looking at the working-age population (30-64), the poorest quintile of counties has
a poverty rate of 16 per cent and the effect of migration flows is to raise this by 0.5 per cent
over the five years to 1990 (p338). The richest quintile has a poverty rate of 4 per cent and
migration flows reduce this by 0.3 per cent. With an initial gap of 12 percentage points,
migration flows act to increase this by 0.7 per cent. Furthermore, it is the net migration flows
of both poor and non-poor that contribute to these outcomes. Poor people move away from
affluent areas and to poor areas while non-poor move in the opposite direction.
SELECTIVE MIGRATION AND NEIGHBOURHOOD DEPRIVATION
9
Conclusions
There is a consistent finding across the studies reviewed here that net migration flows act to
maintain the gap between deprived areas and the average and, as a result, work to undermine
efforts to regenerate deprived neighbourhoods. At the same time, doubts remain over the
scale of these effects, especially in the UK where there has been a heavy reliance on mover
surveys in particular. Net flows appear small in relation to in- and out-flows and therefore
sensitive to the measurement of the latter. Although there is some evidence that net migration
flows are not affected by macro-economic cycles, relatively little is known about whether
they vary between different areas of the UK which have quite different labour and housing
market contexts.
3. DATA AND METHODS
This paper is based largely on 2001 Census data for neighbourhoods in England and
Scotland, although it also uses data from official indices of area deprivation. Separate
analyses must be conducted for each country as the deprivation indices are not directly
comparable. A decision was therefore taken to limit the analyses to the two largest countries
within the UK, omitting Wales and Northern Ireland, on grounds of resources and the likely
diminishing returns that would be obtained from extending the work further. Population
coverage within the Census is very high (an estimated 94 per cent in England and 96 per cent
in Scotland) and the response rate to the question on migration is also very good (95 per cent
in both countries) (ONS, 2005; GRO, 2003a). The ‘One Number Census’ methodology
makes adjustments to the data before publication to allow for both individual and item non-
response (ONS, 2005). Missing values are imputed or estimated by using the characteristics
of an individual or household believed to be similar in other respects. All analyses in this
paper are based on the adjusted data.
Alongside its strengths, certain limitations should be acknowledged. First, around nine per
cent of all moves are missed where people move more than once within a year, or move but
die before the Census (Rees et al, 2002). Second, around one-in-ten responses to the
migration question has been imputed as noted above. Wholly-missing individuals are most
likely to be in their early twenties but there is also a higher incidence for very young children
SELECTIVE MIGRATION AND NEIGHBOURHOOD DEPRIVATION
10
(0-4) and the oldest age groups. These are also the groups with the highest migration rates. It
follows that migration data is particularly dependent on the quality of the imputation
methodology. Census microdata have been used to examine the determinants of individual
migration and, with that data, it is possible to distinguish between actual and imputed
responses. Although not published, these analyses showed that the determinants were very
similar for the two groups. This is not the same, however, as being able to say that imputed
records correctly represent the missing responses. Third, Census data is affected by the steps
taken to protect individual confidentiality, introducing limited random error (ONS, 2005).
In this paper, the geographical units chosen to represent the “neighbourhood” are the Super
Output Area (SOA) for England and the Datazone (DZ) for Scotland. These units were
developed as part of the programme of work to improve neighbourhood statistics in the UK
in support of neighbourhood renewal efforts, and they have several advantages over previous
alternatives such as the ward. They are smaller than wards and closer to most individuals’
understanding of their neighbourhood; SOAs have an average population of 1500 and DZs
750 whereas wards averaged around 5-6,000. They are also much more even in size across
the country whereas wards tended to be several times larger in cities than in rural areas. The
new units have a policy significance as they are employed for official area deprivation indices
- the Indices of Multiple Deprivation (IMD) for England and the Scottish Indices of Multiple
Deprivation (SIMD) (ODPM, 2004; Scottish Executive, 2004). Based largely on data for
2001/2 and using very similar methods, these Indices provide a relative ranking of
neighbourhoods within each country (Noble et al, 2006). As they are purely relative
measures, the Indices cannot be used to make comparisons between countries so all analyses
are conducted for England and Scotland separately.
The present study is based on a precise definition of the term “migrant” rather than just taking
all those captured by the Census question. First, our definition focuses on the household
population only. Residents in communal establishments are excluded on the basis that their
moves are either determined by others (prisoners or those in military establishments, for
example) or based on a very limited choice (students in halls or residence or people in
nursing homes, for example). In addition, many of those in communal establishments have
little or no interaction with the neighbourhood population or are very transient (prisoners or
students, for example). Second, people who moved into the UK from elsewhere are excluded
(around 5 per cent of all migrants). The Census does not capture those who left the UK so
SELECTIVE MIGRATION AND NEIGHBOURHOOD DEPRIVATION
11
including in-migrants from overseas would create an imbalance in the measurement of net
flows. Third, people with no usual address one year before the Census were treated as non-
migrants, i.e. it was assumed that they had been resident in the same area where they were
enumerated at the Census. As no information is recorded on where they were usually resident
one year before the Census, it is not possible to assess whether they have made a contribution
to net flows or not.
The Census provides very little information on individual characteristics one year prior to the
Census, with the exception of place of residence. This is an important limitation if we want to
examine the impacts of migration flows on the social composition of an area. In some cases,
characteristics one year ago can be inferred (age, ethnicity) but others may have altered. The
analysis presented below therefore focuses on educational attainment for 25-74 year olds.
The small size of the flows in many areas led to the use of a binary classification of
qualifications (higher or lower) to minimise the impacts of disclosure control measures on the
data. The classification of educational attainment varies slightly between England and
Scotland, reflecting differences in educational systems. In England, the lower category covers
people with qualifications up to and including “Level 1” in the Census classification (CSEs
only, 1-4 O-levels, or NVQ Level 1, for example). In Scotland, it covers those up to and
including “Group 1” (any number of Standard Grades or an SVQ Level 2, for example). The
Scottish threshold is therefore slightly higher but, in both cases, the cut-off divides the
population 25-74 broadly in half.
It would have been desirable to examine a wider range of indicators of deprivation such as
employment status or health. Confidentiality constraints meant that Office for National
Statistics would only produce the necessary tables for migration broken down by a single
variable (in addition to age). Education appeared the strongest single indicator for a number
of reasons. First, there is a strong correlation between educational attainment and deprivation,
at both individual and area level. Having fewer qualifications puts an individual at much
greater risk of unemployment or low income, and hence of poverty (Card and DiNardo, 2002;
Bailey, 2006). According to the Census data, the most deprived decile of areas in England has
72 per cent of people with low qualifications compared to just 42 per cent in the least
deprived decile. In Scotland, the comparable figures are 80 and 35 per cent. Second,
educational attainment changes only slowly over time and gains cannot be reversed. We can
therefore say with some confidence how net migration flows have altered the educational
SELECTIVE MIGRATION AND NEIGHBOURHOOD DEPRIVATION
12
composition of each area even though attainment has only been measured after moves have
taken place; Green et al (2005) use educational attainment for the same reason. This
assumption is obviously more problematic for young adults who may have completed their
formal education in the year prior to the Census and that is why we exclude those under 25
from this analysis. Third, there is little reason to think that a move would be strongly linked
to a change in educational attainment, at least for those 25 and over. With employment status,
on the other hand, a change in status may be a trigger for a move or a move may be
undertaken to change the status. It is much easier therefore to talk about the impacts of
migration on the educational composition of an area than to talk about the impacts on
employment composition.
The Census does not record whether migrants lived in a household or in a communal
establishment one year prior to the Census, only their place of origin. Implicitly, a migrant’s
status in this respect is assumed not to have changed. As a result, areas that have a communal
establishment with a large number of people arriving from or going to private households
each year can see a severe distortion in their migration figures. People who leave the
communal establishment and are part of the household population at the Census are recorded
as out-migrants from the household population at their place of origin. In Scotland, for
example, Datazone 2028 close to Edinburgh University records a net loss of 1470 people
from the household population (against a total at the Census date of 724) and a net increase of
1474 in the communal establishment population (against a total at the Census of 1638). The
areas thought to be most affected (around one per cent of the total) are therefore omitted;
these are fairly evenly distributed across deprivation deciles.
Part of the analysis below seeks to compare selective migration patterns in different regional
contexts within England. With net migration flows broken down by educational attainment
and by deprivation, there is a limit to the number of geographic categories that could be
covered before noise in the data became problematic. It was also important to work with
whole functional city-regions to avoid migration related to life-stage (of young people into
the most urban areas, and older adults with families towards suburbs and smaller towns)
distorting the picture. A decision was therefore taken to use four broad regional groups,
chosen to maximise differences in housing and labour market context. The North covers three
standard regions (North-East, North-West and Yorkshire and Humberside) while the
Midlands covers two (West Midlands, East Midlands). London is the city-region is defined
SELECTIVE MIGRATION AND NEIGHBOURHOOD DEPRIVATION
13
according to the boundaries developed by Coombes et al (1996) to encompass the wider
functional area; the population is approximately double that for the administrative area
known as Greater London. South is the rest of the three regions (East, South-East and South-
West) outside London. Based on a range of indicators, the North and the Midlands are both
characterised by relatively loose housing and labour markets compared with London and the
South, with the North especially weak.
4. FINDINGS
Net population change
For neighbourhoods in England and Scotland, the average net change in population through
within-UK migration was close to zero as there were no significant population shifts between
England, Scotland and other parts of the UK in 2000-1. As noted above, however, around one
per cent of neighbourhoods has the kind of communal establishment that appears to lead to a
highly distorted measurement of migration flows for the household population. Since these
areas all record net migration losses for the household population, excluding them leaves the
remainder with an average net migration gain of 0.2 per cent in both England and Scotland.
All subsequent results quoted are based on this slightly reduced set of neighbourhoods unless
otherwise noted.
There are wide variations in net flows between neighbourhoods (Table 1). At the extremes,
net change can vary from a decline of 34 per cent to a growth of 152 per cent in a single year
– a range of over 180 per cent. The asymmetry reflects the choice of population at the start of
the time period as the denominator when calculating rates. The Scottish figures have greater
variations, and this is partly, if not wholly, because the spatial units there are much smaller.
More commonly, net change is relatively modest. Half the neighbourhoods in England have a
net change between +/- 1.3 per cent while, in Scotland, half fall between +1.4/-1.8 per cent.
In absolute terms, this represents a net change of +19 to –19 people out of an average
population of 1480 in England and +12 to -14 people out of 760 in Scotland. Since an
individual household can comprise several people, it is clear that the timing of one or two
moves relative to the Census could have a significant impact on the net migration figures,
especially in Scotland. We should be cautious about attaching too much importance to figures
for individual neighbourhoods, especially when looking at flows for population sub-groups.
SELECTIVE MIGRATION AND NEIGHBOURHOOD DEPRIVATION
14
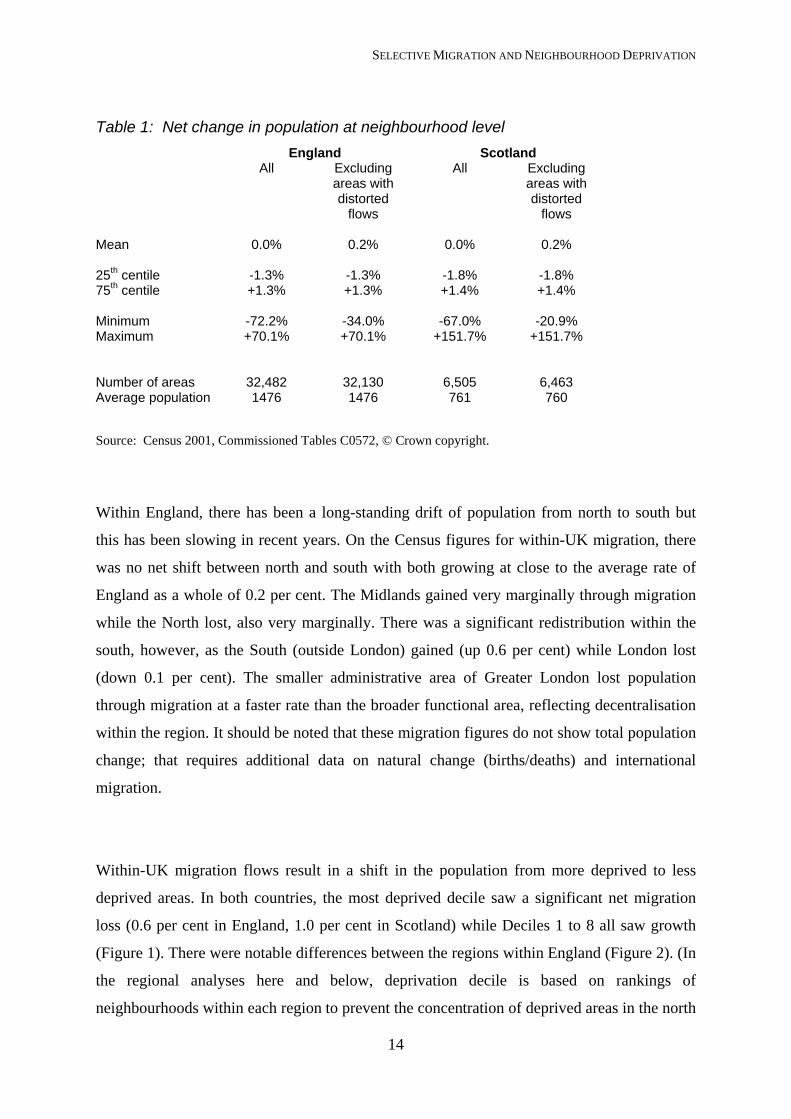
Table 1: Net change in population at neighbourhood level England Scotland All Excluding
areas with distorted
flows
All Excluding areas with distorted
flows Mean 0.0% 0.2% 0.0% 0.2% 25th centile -1.3% -1.3% -1.8% -1.8% 75th centile +1.3% +1.3% +1.4% +1.4% Minimum -72.2% -34.0% -67.0% -20.9% Maximum +70.1% +70.1% +151.7% +151.7% Number of areas 32,482 32,130 6,505 6,463 Average population 1476 1476 761 760 Source: Census 2001, Commissioned Tables C0572, © Crown copyright.
Within England, there has been a long-standing drift of population from north to south but
this has been slowing in recent years. On the Census figures for within-UK migration, there
was no net shift between north and south with both growing at close to the average rate of
England as a whole of 0.2 per cent. The Midlands gained very marginally through migration
while the North lost, also very marginally. There was a significant redistribution within the
south, however, as the South (outside London) gained (up 0.6 per cent) while London lost
(down 0.1 per cent). The smaller administrative area of Greater London lost population
through migration at a faster rate than the broader functional area, reflecting decentralisation
within the region. It should be noted that these migration figures do not show total population
change; that requires additional data on natural change (births/deaths) and international
migration.
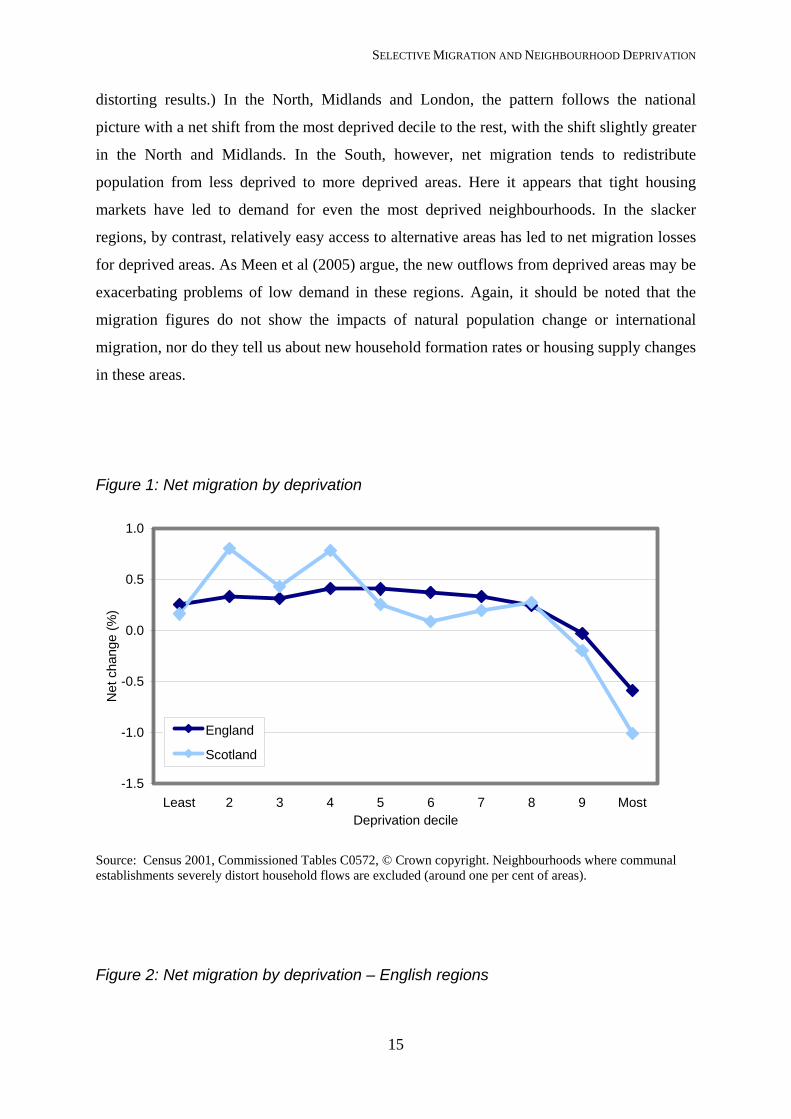
Within-UK migration flows result in a shift in the population from more deprived to less
deprived areas. In both countries, the most deprived decile saw a significant net migration
loss (0.6 per cent in England, 1.0 per cent in Scotland) while Deciles 1 to 8 all saw growth
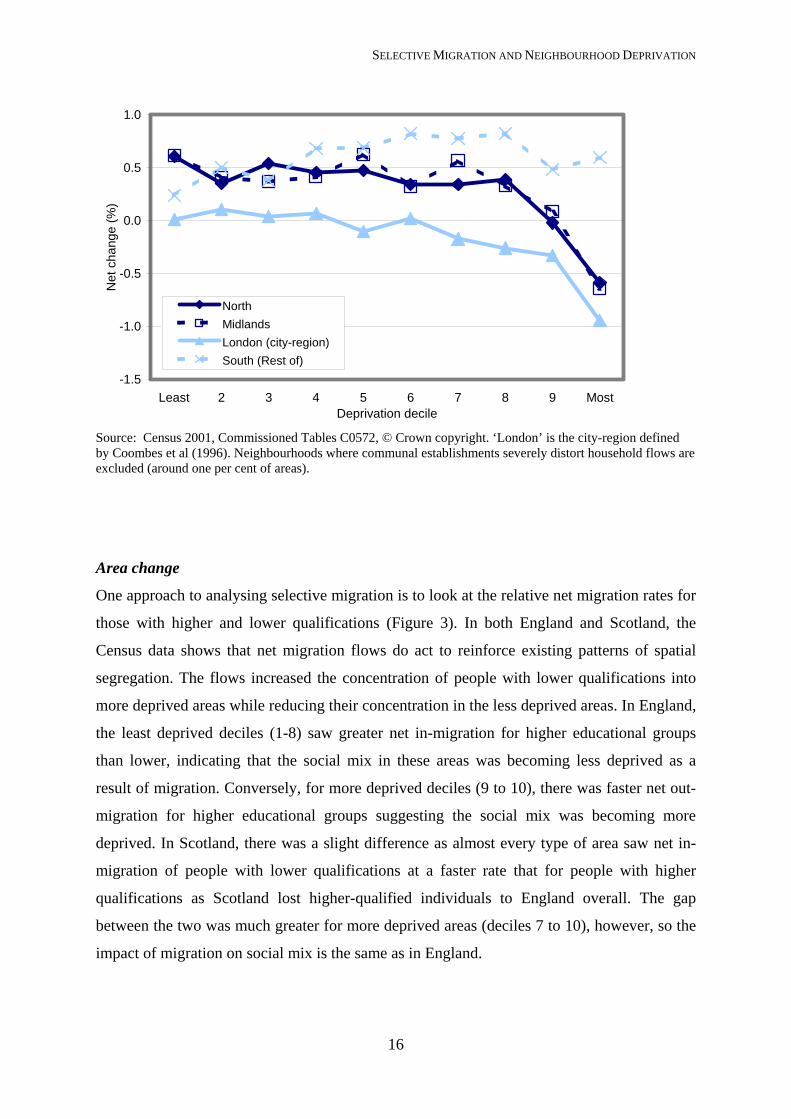
(Figure 1). There were notable differences between the regions within England (Figure 2). (In
the regional analyses here and below, deprivation decile is based on rankings of
neighbourhoods within each region to prevent the concentration of deprived areas in the north
SELECTIVE MIGRATION AND NEIGHBOURHOOD DEPRIVATION
15
distorting results.) In the North, Midlands and London, the pattern follows the national
picture with a net shift from the most deprived decile to the rest, with the shift slightly greater
in the North and Midlands. In the South, however, net migration tends to redistribute
population from less deprived to more deprived areas. Here it appears that tight housing
markets have led to demand for even the most deprived neighbourhoods. In the slacker
regions, by contrast, relatively easy access to alternative areas has led to net migration losses
for deprived areas. As Meen et al (2005) argue, the new outflows from deprived areas may be
exacerbating problems of low demand in these regions. Again, it should be noted that the
migration figures do not show the impacts of natural population change or international
migration, nor do they tell us about new household formation rates or housing supply changes
in these areas.
Figure 1: Net migration by deprivation
-1.5
-1.0
-0.5
0.0
0.5
1.0
Least 2 3 4 5 6 7 8 9 MostDeprivation decile
Net
cha
nge
(%)
England
Scotland
Source: Census 2001, Commissioned Tables C0572, © Crown copyright. Neighbourhoods where communal establishments severely distort household flows are excluded (around one per cent of areas).
Figure 2: Net migration by deprivation – English regions
SELECTIVE MIGRATION AND NEIGHBOURHOOD DEPRIVATION
16
-1.5
-1.0
-0.5
0.0
0.5
1.0
Least 2 3 4 5 6 7 8 9 MostDeprivation decile
Net
cha
nge
(%)
NorthMidlandsLondon (city-region)South (Rest of)
Source: Census 2001, Commissioned Tables C0572, © Crown copyright. ‘London’ is the city-region defined by Coombes et al (1996). Neighbourhoods where communal establishments severely distort household flows are excluded (around one per cent of areas).
Area change
One approach to analysing selective migration is to look at the relative net migration rates for
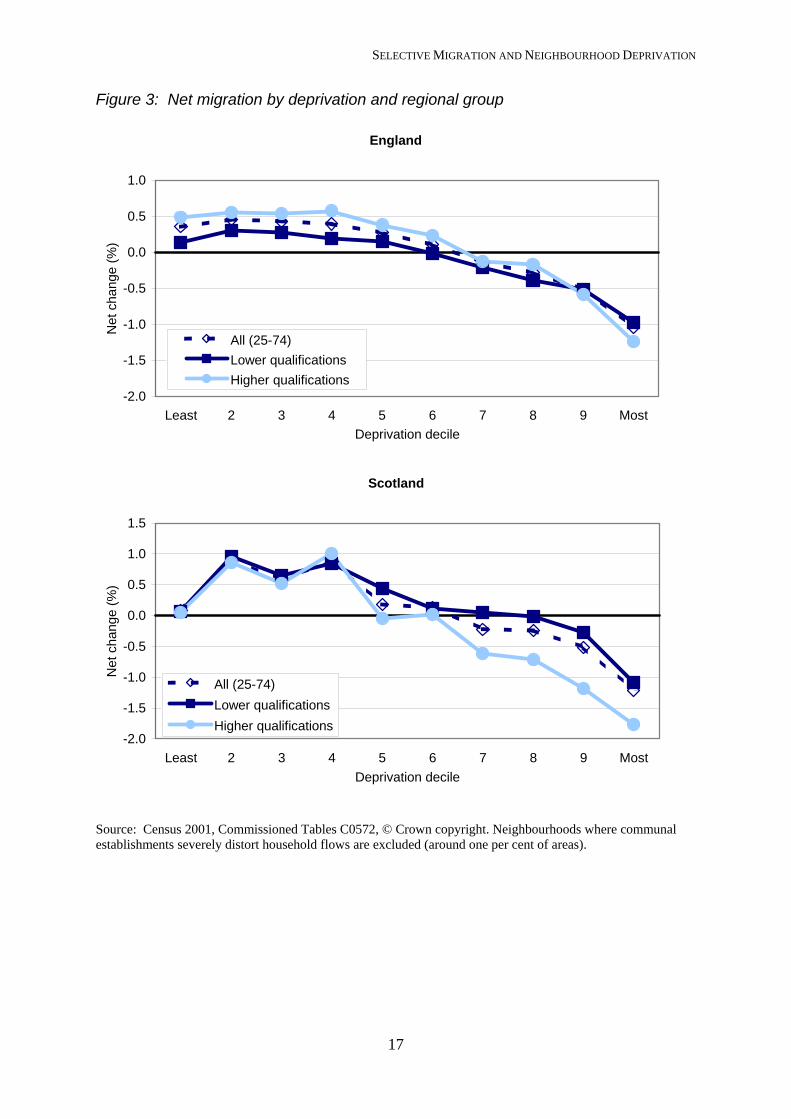
those with higher and lower qualifications (Figure 3). In both England and Scotland, the
Census data shows that net migration flows do act to reinforce existing patterns of spatial
segregation. The flows increased the concentration of people with lower qualifications into
more deprived areas while reducing their concentration in the less deprived areas. In England,
the least deprived deciles (1-8) saw greater net in-migration for higher educational groups
than lower, indicating that the social mix in these areas was becoming less deprived as a
result of migration. Conversely, for more deprived deciles (9 to 10), there was faster net out-
migration for higher educational groups suggesting the social mix was becoming more
deprived. In Scotland, there was a slight difference as almost every type of area saw net in-
migration of people with lower qualifications at a faster rate that for people with higher
qualifications as Scotland lost higher-qualified individuals to England overall. The gap
between the two was much greater for more deprived areas (deciles 7 to 10), however, so the
impact of migration on social mix is the same as in England.
SELECTIVE MIGRATION AND NEIGHBOURHOOD DEPRIVATION
17
Figure 3: Net migration by deprivation and regional group
England
-2.0
-1.5
-1.0
-0.5
0.0
0.5
1.0
Least 2 3 4 5 6 7 8 9 MostDeprivation decile
Net
cha
nge
(%)
All (25-74)Lower qualificationsHigher qualifications
Scotland
-2.0
-1.5
-1.0
-0.5
0.0
0.5
1.0
1.5
Least 2 3 4 5 6 7 8 9 MostDeprivation decile
Net
cha
nge
(%)
All (25-74)Lower qualificationsHigher qualifications
Source: Census 2001, Commissioned Tables C0572, © Crown copyright. Neighbourhoods where communal establishments severely distort household flows are excluded (around one per cent of areas).
SELECTIVE MIGRATION AND NEIGHBOURHOOD DEPRIVATION
18
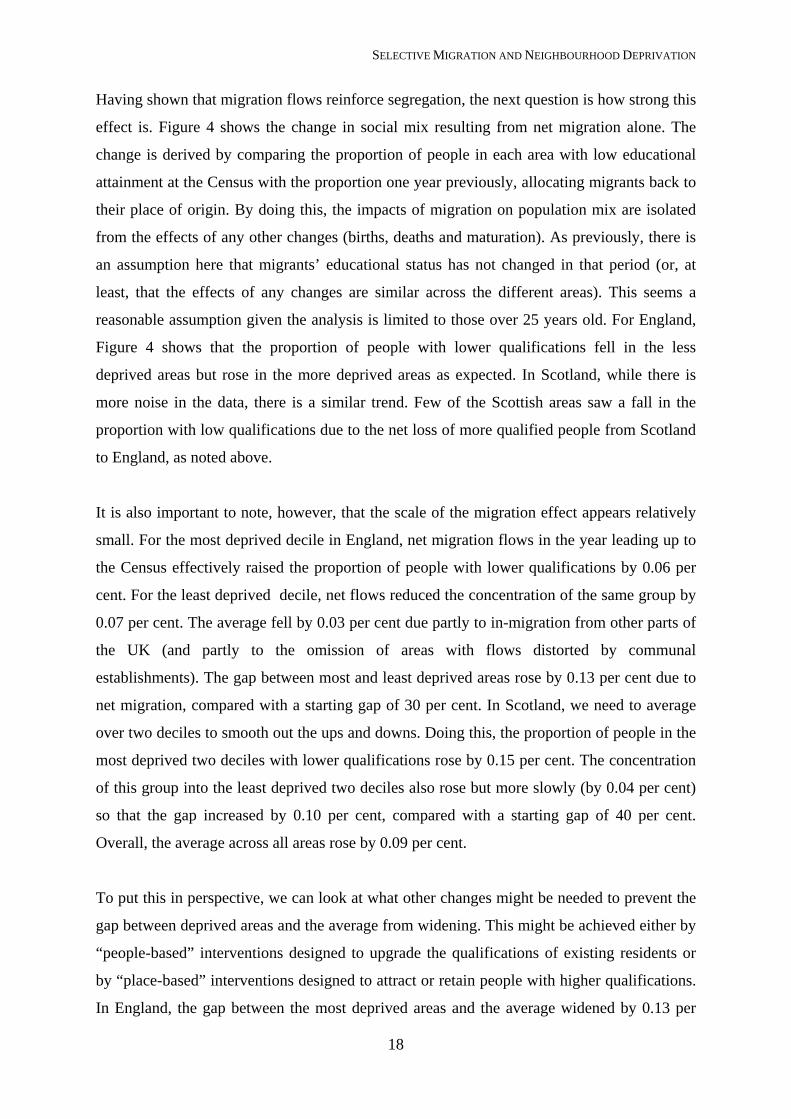
Having shown that migration flows reinforce segregation, the next question is how strong this
effect is. Figure 4 shows the change in social mix resulting from net migration alone. The
change is derived by comparing the proportion of people in each area with low educational
attainment at the Census with the proportion one year previously, allocating migrants back to
their place of origin. By doing this, the impacts of migration on population mix are isolated
from the effects of any other changes (births, deaths and maturation). As previously, there is
an assumption here that migrants’ educational status has not changed in that period (or, at
least, that the effects of any changes are similar across the different areas). This seems a
reasonable assumption given the analysis is limited to those over 25 years old. For England,
Figure 4 shows that the proportion of people with lower qualifications fell in the less
deprived areas but rose in the more deprived areas as expected. In Scotland, while there is
more noise in the data, there is a similar trend. Few of the Scottish areas saw a fall in the
proportion with low qualifications due to the net loss of more qualified people from Scotland
to England, as noted above.
It is also important to note, however, that the scale of the migration effect appears relatively
small. For the most deprived decile in England, net migration flows in the year leading up to
the Census effectively raised the proportion of people with lower qualifications by 0.06 per
cent. For the least deprived decile, net flows reduced the concentration of the same group by
0.07 per cent. The average fell by 0.03 per cent due partly to in-migration from other parts of
the UK (and partly to the omission of areas with flows distorted by communal
establishments). The gap between most and least deprived areas rose by 0.13 per cent due to
net migration, compared with a starting gap of 30 per cent. In Scotland, we need to average
over two deciles to smooth out the ups and downs. Doing this, the proportion of people in the
most deprived two deciles with lower qualifications rose by 0.15 per cent. The concentration
of this group into the least deprived two deciles also rose but more slowly (by 0.04 per cent)
so that the gap increased by 0.10 per cent, compared with a starting gap of 40 per cent.
Overall, the average across all areas rose by 0.09 per cent.
To put this in perspective, we can look at what other changes might be needed to prevent the
gap between deprived areas and the average from widening. This might be achieved either by
“people-based” interventions designed to upgrade the qualifications of existing residents or
by “place-based” interventions designed to attract or retain people with higher qualifications.
In England, the gap between the most deprived areas and the average widened by 0.13 per
SELECTIVE MIGRATION AND NEIGHBOURHOOD DEPRIVATION
19
cent. The movement of 1.3 residents per thousand from lower to higher educational groups
would be enough to offset this change. Alternatively, the attraction of 1.8 more in-migrants
with higher educational qualifications per thousand residents would achieve the same result.
In Scotland, the equivalent figures were 1.0 and 1.3 per thousand residents as the gap
widened by 0.10 per cent. On the face of it, these do not appear to be impossible targets.
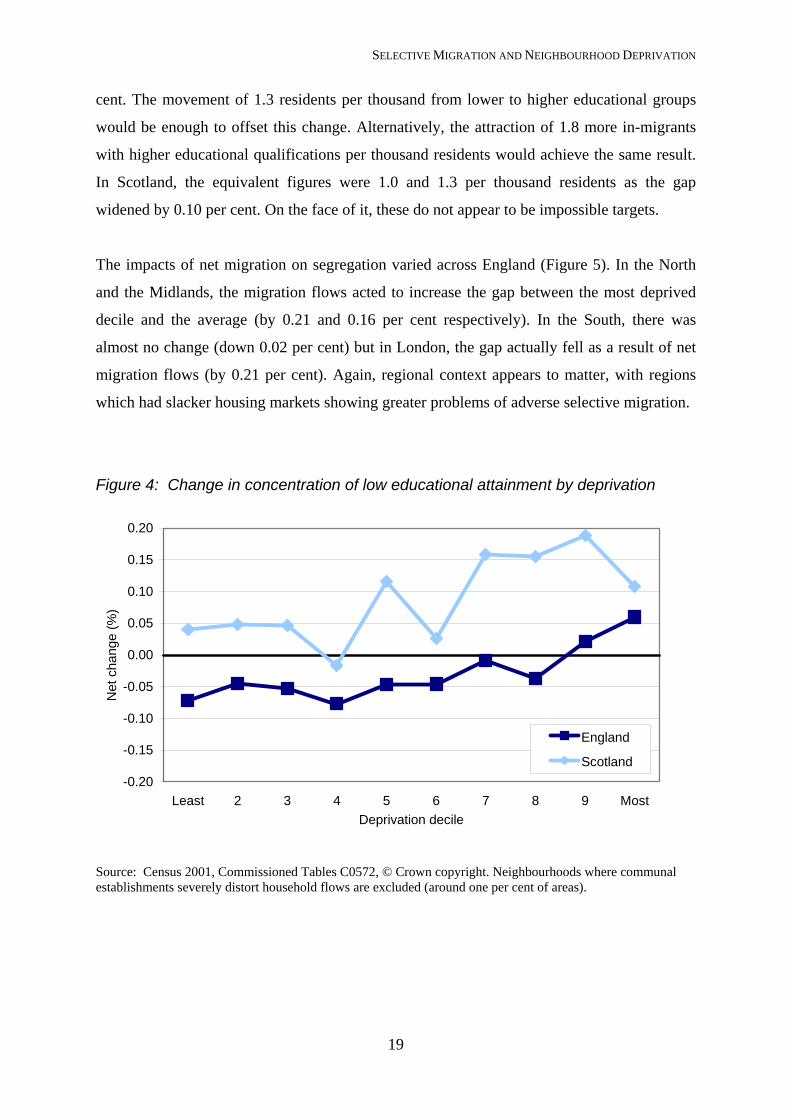
The impacts of net migration on segregation varied across England (Figure 5). In the North
and the Midlands, the migration flows acted to increase the gap between the most deprived
decile and the average (by 0.21 and 0.16 per cent respectively). In the South, there was
almost no change (down 0.02 per cent) but in London, the gap actually fell as a result of net
migration flows (by 0.21 per cent). Again, regional context appears to matter, with regions
which had slacker housing markets showing greater problems of adverse selective migration.
Figure 4: Change in concentration of low educational attainment by deprivation
-0.20
-0.15
-0.10
-0.05
0.00
0.05
0.10
0.15
0.20
Least 2 3 4 5 6 7 8 9 MostDeprivation decile
Net
cha
nge
(%)
England
Scotland
Source: Census 2001, Commissioned Tables C0572, © Crown copyright. Neighbourhoods where communal establishments severely distort household flows are excluded (around one per cent of areas).
SELECTIVE MIGRATION AND NEIGHBOURHOOD DEPRIVATION
20
Figure 5: Change in concentration of low educational attainment by deprivation and
by region
-0.30
-0.25
-0.20
-0.15
-0.10
-0.05
0.00
0.05
0.10
0.15
0.20
1 2 3 4 5 6 7 8 9 10Deprivation decile - relative
Net
cha
nge
(%)
NorthMidlandsLondon CRSouth (Rest of)
Source: Census 2001, Commissioned Tables C0572, © Crown copyright. Neighbourhoods where communal establishments severely distort household flows are excluded (around one per cent of areas). Area deprivation is measured within each region.
Regeneration areas
As discussed above, there have been criticisms of some kinds of ABIs (especially those that
focus on improving residents’ employment opportunities) that they may inadvertently fuel
selective migration (Cheshire et al, 2003). This hypothesis cannot be tested directly without
detailed knowledge of the range of ABIs in operation in 2000/1 and an understanding of the
approach that each was adopting. Such data is not readily available. Nevertheless, it is
possible to examine whether the migration flows varied between neighbourhoods that were in
one of the two major regeneration initiatives at that time and other similarly deprived areas.
For simplicity, these are termed “intervention” and “non-intervention” areas respectively. In
England, the intervention areas are defined as those which were part of the New Deal for
Communities (NDC) programme, a national programme with a very high level of funding
that started in 1998/9 (CRESR, 2005). In Scotland, the equivalent areas are the Social
Inclusion Partnerships (SIPs), also a well-funded national programme , started in 1999 (CEA,
2003). (Some SIPs were thematic or client-group focussed rather than area-based but the
SELECTIVE MIGRATION AND NEIGHBOURHOOD DEPRIVATION
21
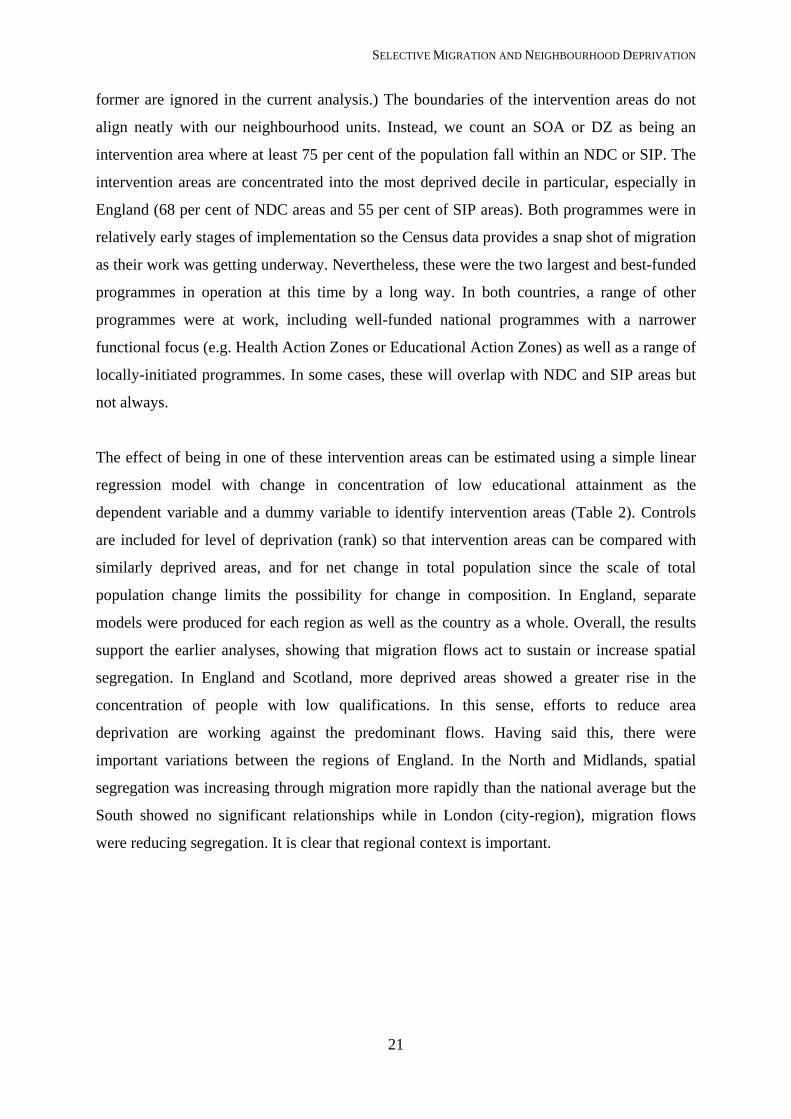
former are ignored in the current analysis.) The boundaries of the intervention areas do not
align neatly with our neighbourhood units. Instead, we count an SOA or DZ as being an
intervention area where at least 75 per cent of the population fall within an NDC or SIP. The
intervention areas are concentrated into the most deprived decile in particular, especially in
England (68 per cent of NDC areas and 55 per cent of SIP areas). Both programmes were in
relatively early stages of implementation so the Census data provides a snap shot of migration
as their work was getting underway. Nevertheless, these were the two largest and best-funded
programmes in operation at this time by a long way. In both countries, a range of other
programmes were at work, including well-funded national programmes with a narrower
functional focus (e.g. Health Action Zones or Educational Action Zones) as well as a range of
locally-initiated programmes. In some cases, these will overlap with NDC and SIP areas but
not always.
The effect of being in one of these intervention areas can be estimated using a simple linear
regression model with change in concentration of low educational attainment as the
dependent variable and a dummy variable to identify intervention areas (Table 2). Controls
are included for level of deprivation (rank) so that intervention areas can be compared with
similarly deprived areas, and for net change in total population since the scale of total
population change limits the possibility for change in composition. In England, separate
models were produced for each region as well as the country as a whole. Overall, the results
support the earlier analyses, showing that migration flows act to sustain or increase spatial
segregation. In England and Scotland, more deprived areas showed a greater rise in the
concentration of people with low qualifications. In this sense, efforts to reduce area
deprivation are working against the predominant flows. Having said this, there were
important variations between the regions of England. In the North and Midlands, spatial
segregation was increasing through migration more rapidly than the national average but the
South showed no significant relationships while in London (city-region), migration flows
were reducing segregation. It is clear that regional context is important.
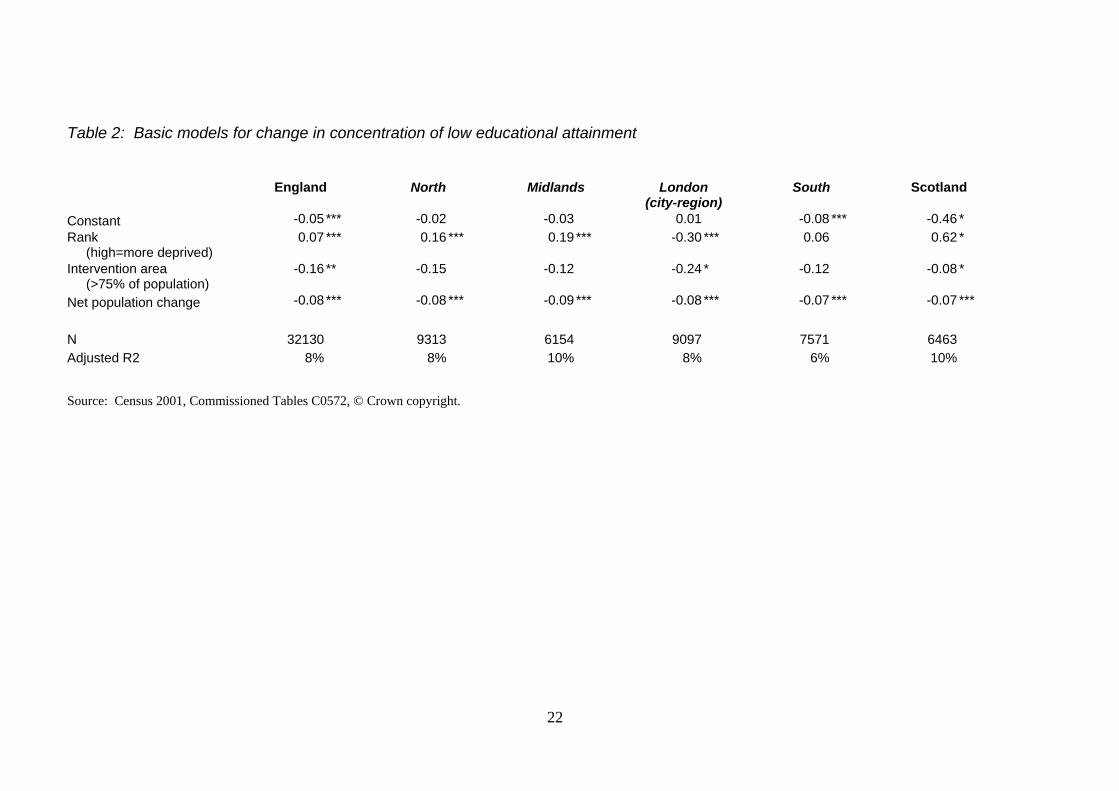
Table 2: Basic models for change in concentration of low educational attainment
England North Midlands London
(city-region) South Scotland
Constant -0.05 *** -0.02 -0.03 0.01 -0.08 *** -0.46 * Rank (high=more deprived)
0.07 *** 0.16 *** 0.19 *** -0.30 *** 0.06 0.62 *
Intervention area (>75% of population)
-0.16 ** -0.15 -0.12 -0.24 * -0.12 -0.08 *
Net population change -0.08 *** -0.08 *** -0.09 *** -0.08 *** -0.07 *** -0.07 *** N 32130 9313 6154 9097 7571 6463 Adjusted R2 8% 8% 10% 8% 6% 10% Source: Census 2001, Commissioned Tables C0572, © Crown copyright.
22
1
In addition, the models show that being in an intervention area was associated with less
adverse selective migration rather than more. Intervention areas were more likely to show a
reduction in the concentration of deprivation through migration than non-intervention area
with similar levels of deprivation – or they showed less of a rise in the concentration of
deprivation. The effect was significant at national level (England and Scotland) and in
London but the direction of the effect was the same in every other region.
5. CONCLUSIONS AND DISCUSSION
The most general finding from this work is that migration flows do tend to reinforce spatial
segregation as expected, increasing the concentration of groups with low educational
attainment in the more deprived areas. Individuals with higher levels of qualifications (and
hence higher incomes and lower risks of unemployment, on average) tend to gravitate away
from deprived areas. On the other hand, the strength of this selective migration appears more
modest than previous studies have suggested. If the educational attainment of just one or two
residents per thousand in deprived areas could be raised from the lower to the higher category
each year, this would be enough to cancel out the effects of net migration flows and prevent
the gap between deprived areas and the average from widening. The attraction or retention of
a similar proportion of more highly-qualified individuals would have the same effect. This is
quite a striking finding and is clearly at odds with much of the conventional wisdom about
deprived areas, including many statements in policy.
The evidence presented here might be seen as partial, being based on educational attainment
alone and omitting a group of adults (18-25 year olds) with high mobility rates. An income
measure, for example, might be expected to yield evidence of more adverse selective
migration; there might be nearly equal number of people with degrees moving into and out of
deprived areas but we might expect those moving in to have lower incomes than those
moving out. Educational attainment on its own may therefore understate the problem to some
extent. The exclusion of young adults, however, seems likely to have the opposite effect.
Deprived areas overall see a net in-flow of young adults, and young adults tend to have higher
levels of qualifications than older adults (Bailey and Livingston, 2007). Overall, the strong
impacts of educational attainment on employment rates and wages, and hence on risks of
household deprivation, mean that educational attainment appears to be a very good indicator
SELECTIVE MIGRATION AND NEIGHBOURHOOD DEPRIVATION
2
for this work. Alternative explanations for the divergence between this and earlier British
studies might be made by looking at methods. For reasons identified above, mover surveys
may have over-stated problems of adverse migration through biases in the measurement of
out-migration. In addition, the use of Census data has enabled this analysis to examine all
deprived areas and not just a small subset, giving a more complete picture than previous
assessments. In particular, the impact of moves between deprived areas is taken into account.
In relation to policies to reduce spatial segregation, the findings support the idea that ABIs are
fighting an uphill struggle, with selective migration undermining their efforts, but they also
suggest that the scale of this problem should not be overstated. At the same time, this raises
new questions. If the effects of migration on segregation are relatively weak, this suggests
either that past efforts to reduce segregation have been correspondingly ineffectual or that
other factors must play a greater role in explaining the persistence of this phenomenon. One
alternative explanation is that area effects may be more significant than past research has
suggested: i.e. segregation is maintained due to the erosion of opportunities and damage to
outcomes from living in areas with concentrated deprivation. The direct quantitative evidence
for this has been weak or inconclusive but it is also an area where measurement and analysis
are difficult.
The findings also show that the migration dynamics of neighbourhoods are influenced by
regional context. Adverse selective migration was more significant in the slacker housing
markets of the north of England than in London or the South. In the latter two regions, the
ability of groups on moderate incomes to move away from deprived areas appears more
constrained. Indeed, in the South (outside London), migration flows were tending to reduce
spatial segregation, at least as measured by educational attainment. This suggests there may
be a role for efforts at higher spatial scales to contribute to reducing spatial segregation,
including the policies of regional planning bodies and strategic regeneration partnerships such
as those that operate at the local authority-level in England and Scotland. Effort to reduce the
over-supply of housing in parts of the north and to tackle problems of low demand at an
authority- or city-wide scale would appear to support efforts to reduce concentrations of
deprivation.
For the set of areas included in the two major ABI programmes in 2000/1, the selective
migration flows were less adverse than for similarly deprived areas. Previous studies of
SELECTIVE MIGRATION AND NEIGHBOURHOOD DEPRIVATION
3
migration in ABIs have looked only at the flows in initiative areas and not in comparable non-
intervention areas. As noted above, the current analysis is not intended as a direct test of
Cheshire et al’s hypothesis which concerns the impacts of particular kinds of interventions. It
relates to one group of ABIs undertaking a range of people- and place-focussed interventions,
and in their early years of operation. The less adverse flows in the ABIs covered here may
reflect a focus on “place” rather than “people”, for example. Alternatively, the extent of
selective migration may be affected by the stage of an intervention as well as the nature of the
intervention. The declaration of a major ABI for an area may lead to a “bounce” in demand as
people who might have left defer moving to see how the initiative works. This might be
followed in later years by raised levels of adverse selective migration where hopes are not
subsequently realised. The results of evaluations might therefore be sensitive to the timing of
the measurements.
ACKNOWLEDGEMENTS
The authors are extremely grateful to the Joseph Rowntree Foundation for funding and
supporting the work on which this paper was based. The views expressed remain those of the
authors alone.
Census output is Crown copyright and is reproduced with the permission of the Controller of
HMSO and the Queen’s Printer for Scotland. © Crown Copyright and database right of the
Crown 2003. All rights reserved.
4
REFERENCES
Bailey, N. (2006) Does work pay? Employment, poverty and social exclusion, in Pantazis, C.,
Gordon, D., & Levitas, R. (eds) Poverty and social exclusion in Britain: the
Millennium Survey, 163-190. Bristol: Policy Press.
Bailey, N. and Livingston, M. (2007) Population turnover and area deprivation. Bristol:
Policy Press.
Bolt, G. and van Kempen, R. (2003) Escaping poverty neighbourhoods in the Netherlands,
Housing, Theory and Society 20 (4): 209-22.
Card, D. and DiNardo, J. E. (2002) Skill biased technological change and rising wage
inequality: some problems and puzzles. NBER Working Paper 8769. Cambridge,
Mass.: National Bureau of Economic Research.
Carley, M. (2002) Community regeneration and neighbourhood renewal: a review of the
evidence. Edinburgh: Scottish Executive.
Centre for Regional, Economic and Social Research (CRESR) (2005) New Deal for
Communities 2001-5: an interim evaluation. Research Report 17. London:
NRU/ODPM.
Cheshire, P., Flynn, N., and Jones, D. A. (1998) Harlesden City Challenge: final evaluation.
London: LSE.
Cheshire, P., Monastiriotis, V., and Sheppard, S. (2003) Income inequality and residential
segregation: labour market sorting and the demand for positional goods, in Martin, R.
& Morrison, P. S. (eds) Geographies of labour market inequality, 83-109. London:
Routledge .
Clark, W. A. V. and Huang, Y. (2003) The life course and residential mobility in British
housing markets, Environment and Planning A 35: 323-39.
Clark, W. A. V., Deurloo, M. C., and Dieleman, F. M. (2006) Residential mobility and
neighbourhood outcomes, Housing Studies 21 (3): 323-42.
Communities Scotland (2004) Evaluation of social inclusion partnerships (SIPs). Edinburgh:
Communities Scotland.
Coombes, Mike, Wymer, Colin, Atkins, David, and Openshaw, Stan. Localities and city-
regions. 96. 2006.
Dabinett, G., Lawless, P., Rhodes, J., and Tyler, P. (2001) A review of the evidence base for
regeneration policy and practice. London: DETR.
General Registers Office for Scotland (GROS) (2003) Census Update 19: data quality.
SELECTIVE MIGRATION AND NEIGHBOURHOOD DEPRIVATION
5
Edinburgh: GROS.
General Registers Office for Scotland (GROS) (2003) The Registrar General's 2001 Census
report to the Scottish Parliament. Edinburgh: GROS.
Graversen, B. K., Hummelgaard, H., Lemmich, D., and Nielsen, J. B. (1997) Residential
mobility in Danish problem housing estates. Copenhagen: Institute of Local
Government Studies (AKF).
Green, G., Grimsley, M., and Stafford, B. (2005) The dynamics of neighbourhood
sustainability. York: JRF.
Kearns, A. and Parkes, A. (2003) Living in and leaving poor neighbourhood conditions in
England, Housing Studies 18 (6): 827-51.
Kleinman, M. (1999) There goes the neighbourhood: area policies and social exclusion, New
Economy 6 (4): 188-92.
Lawless, P. (2006) Area-based urban interventions: rationale and outcomes: the New Deal for
Communities programme in England, Urban Studies 43 (11): 1991-2011.
Lee, B. A., Oropesa, R. S., and Kanan, J. W. (1994) Neighborhood context and residential
mobility, Demography 31 (2): 249-70.
McGregor, A. and Fitzpatrick, I. (1995) The impact of urban regeneration partnerships on
unemployment, Scottish Economic Bulletin 51: 15-28.
Meen, G., Gibb, K., Goody, J., McGrath, T., and Mackinnon, J. (2005) Economic segregation
in England: causes, consequence and policy. Bristol: Policy Press.
MORI (2005) New Deal for Communities mvers survey 2004: technical report. London:
MORI.
Newman, S. J. and Duncan, G. J. (1979) Residential problems, dissatisfaction and mobility,
Journal of the American Planning Association 45 (2): 154-62.
Noble, M., Wright, G., Smith, G., and Dibben, C. (2006) Measuring multiple deprivation at
the small-area level, Environment and Planning A 38 (1): 169-85.
Nord, M. (1998) Poor people on the move: county-county migration and the spatial
concentration of poverty, Journal of regional science 38 (2): 329-51.
North, D. and Syrett, S. ( 2006) The dynamics of local economies and deprived
neighbourhoods. London: DCLG.
ODPM: Housing, Planning, Local Government and the Regions Select Committee (ODPM
Select Committee) (2003) The effectiveness of Government regeneration
interventions: Volume 1 - HC 76-1. London: The Stationery Office.
Office for National Statistics (ONS) (2005) Census 2001: quality report for England and
SELECTIVE MIGRATION AND NEIGHBOURHOOD DEPRIVATION
6
Wales. London: ONS.
Office of the Deputy Prime Minister (ODPM) (2004) The English Indices of Deprivation
2004 (revised). London: ODPM.
Parkinson, M. (1998) Combating social exclusion: lessons from area-based programmes in
Europe. York: JRF.
Prime Minister's Strategy Unit/Office of the Deputy Prime Minister (PMSU/ODPM) (2005)
Improving the prospects of people living in areas of multiple deprivation in England.
London: Cabinet Office.
Quillian, L. (2003) how long are exposures to poor neighbourhoods? The long-term dynamics
of entry and exit from poor neighbourhoods, Population Research and Policy Review
22: 221-49.
Rees, P., Thomas, F., and Duke-Williams, O. (2002) Migration data from the Census, in
Rees, P., Martin, D., & Williamson, P. (eds) The Census data system, 245-268.
Chichester: John Wiley and Sons.
Rosenbaum, J. E., Reynolds, L., and Deluca, S. (2002) how do places matter? The geography
of opportunity, self-efficacy and a look inside the black box of residential mobility,
Housing Studies 17 (1): 71-82.
Scottish Executive (SE) (2004) Scottish Index of Multiple Deprivation 2004: summary
technical report. Edinburgh: Scottish Executive.
Social Exclusion Unit (SEU) (2001) A new commitment to neighbourhood renewal: national
strategy action plan. London: Cabinet Office.
South, S. J., Crowder, K., and Chavez, E. (2005) Exiting and entering high-poverty
neighborhoods: Latinos, Blacks and Anglos compared, Social Forces 84 (2): 873-900.
South, S. J. and Crowder, K. D. (1997) Escaping distressed neighborhoods: individual,
community and metropolitan influences, American Journal of Sociology 102 (4):
1040-84.
Speare, A. (1974) Residential satisfaction as an intervening variable in residential mobility,
Demography 11 (2): 173-88.
Wilcox, S. (2006) The geography of affordable and unaffordable housing: local measures of
the limits to the ability of working households to become home owners. York: JRF.