neighborhood and crime: a comparative study · 4.1.2. collective efficacy ... key words:...
TRANSCRIPT

NEIGHBORHOOD AND CRIME: A
COMPARATIVE STUDY
AUTHOR: ARIADNA ANDREU VILLASEVIL
ADVISOR: JOSEP CID MOLINÉ
30/05/2014
Final Research Project. 4th year, Major in Criminology
Words: 12.664

NEIGHBORHOOD AND CRIME: A COMPARATIVE STUDY
1
In this project I have learnt many things, but the most important one is that it is very difficult to
develop a research alone. I have needed a lot of help of many people without them I would not
have been able to finish this project. For this reason, I want to express my gratitude first of all to
my advisor, Josep Cid, because he helped me not only during the Final Research Project, but also
during these four years. Secondly, to Municipal Police of Sabadell, particularly to David Barceló
and José Miguel Durán, for accepting me in their institution and motivating me to improve.
Thirdly, to Suman Kakar for her help and dedication during the last 5 months. Finally, to Fran
Toledo for his help conducting the surveys and his permanent unconditional support.
Very grateful,

NEIGHBORHOOD AND CRIME: A COMPARATIVE STUDY
2
INDEX
1. INTRODUCTION .................................................................................................................................... 4
2. THEORETICAL FRAMEWORK ............................................................................................................ 5
2.1. THEORETICAL REVIEW ...................................................................................................... 6
2.2.THEORETICAL FRAMEWORK AND HYPOTHESIS ........................................................... 9
3.METHODOLOGY .................................................................................................................................. 11
3.1. STUDY LOCATION ............................................................................................................... 11
3.2.SMALL UNITS: DISTRICTS AND STREETS ....................................................................... 11
3.3.DATA COLLECTION ............................................................................................................. 13
3.3.1.DEPENDENT VARIABLE: CRIME RATES ................................................................... 13
3.3.2.INDEPENDENT VARIABLES ........................................................................................ 19
4. RESULTS ............................................................................................................................................... 24
4.1. SABADELL ................................................................................................................................ 24
4.1.1. SOCIAL DISORGANIZATION THEORY ........................................................................ 24
4.1.2. COLLECTIVE EFFICACY ................................................................................................. 27
4.1.3. ROUTINE ACTIVITIES THEORY .................................................................................... 30
4.2. MIAMI ........................................................................................................................................ 32
4.2.1.SOCIAL DISORGANIZATION THEORY ......................................................................... 32
4.2.2. COLLECTIVE EFFICACY ................................................................................................. 35
4.3.3. ROUTINE ACTIVITIES THEORY .................................................................................... 36
5. CONCLUSIONS ............................................................................................................................. 38
5.1.COMPARATIVE RESULTS .................................................................................................. 38
5.2.DISCUSSION .......................................................................................................................... 40
5.3.LIMITATIONS ........................................................................................................................ 41
5.4.THEORETICAL AND PRACTICAL IMPLICATIONS ........................................................ 41
6. BIBLIOGRAPHY ............................................................................................................................... 43
NEIGHBORHOOD AND CRIME: A COMPARATIVE STUDY
3
ABSTRACT
This project is defined in the broad field of the socio-spatial Criminology, particularly it tries to
test three main theories: social disorganization, collective efficacy and routine activities theory.
Many studies tried testing these theories and the results are indeterminate. However, in my
opinion these three theories could have explanatory capacity in determine the crime rate in a
particular place. For this reason, this research has tried to look for the best explanation of crime
in a certain location. Nevertheless, not only one theory could explain the phenomenon but also
the mix of them. Moreover, I developed the same research in two different cities of two different
countries to test if the results in both cities are the same, despite the many social and cultural
differences.
Key words: socio-spatial criminology; social disorganization; collective efficacy; routine
activities theory; crime rate.

NEIGHBORHOOD AND CRIME: A COMPARATIVE STUDY
4
1. INTRODUCTION
Criminology is a huge and broad area which tries to explain the causes of delinquency
and their methods of control. During the years different kinds of theories arose to achieve this
goal. There are some theories focused on individual factors such as biological, social or
psychological. On the other hand, there are others centered in structural factors such as cultural
or social. However, we can affirm there is not a definitive theory to explain the causes of
delinquency. The best way to explain it is a mix of all these theories and factors. Nevertheless,
the integration of theories is not easy.
There is a broad perspective in criminology which focuses on the concentration of
delinquency in a particular place called socio- spatial criminology. The social disorganization
theory was one of the first theories trying to explain the variations of crime rates related to
geographical situation. However, the field of socio- spatial criminology is huge and it takes into
account more perspectives. According to Bottoms (2011), the socio spatial criminology is
composed by three main branches. First, those studying the social structures and social dynamics
of neighborhoods like Social Disorganization Theory. Second, the study of criminal events
adopting a routine activities or a rational choice perspective. Finally, those following an
ethnographic and cultural criminology approach.
Knowing from the precedents that the study of only one of these theories is not enough to
explain the differences in crime rates per area, I will focus on three different theories, the Social
Disorganization Theory (called from now SDT), the Collective Efficacy Theory (CET) and the
Routine Activities Theory (RAT) to explain the different crime rates. Therefore, the main goal of
this project is trying to find which one explains better the variations of crime rates related to the
geographical location. On the other hand, different authors also stressed the validity of these
theories could vary between countries because different factors could affect. Therefore, the
objective is not only proving some theories but also checking if there are different explanatory
factors in two different countries, Spain and United States.

NEIGHBORHOOD AND CRIME: A COMPARATIVE STUDY
5
2. THEORETICAL FRAMEWORK
The ecological theories of delinquency or socio-spatial criminology began when clinical
criminology felt into crisis. That is, the more individualist criminology, which focuses
exclusively the individual, dropped sharply because criminologist realized that the environment
is also important. In this way, sociological theories started to be important.
According to Sampson (2012) the ecological theory is previous to the Chicago School
because some authors like Guerry were interested in variations of the crime rates between
countries. He demonstrated that crime was more prevalent in some places and affirmed that
besides biological and psychological factors, social factors influence crime rates. Therefore,
crime was not randomly distributed. It maintains a logical explanation. According to Sampson
(2012), another precedent is Mayhew affirming that crime was a learned behavior, and it spread
in poor areas affected by alcoholism and economic insecurity. He started the theory that Shaw
and Mckay would explain later and connected the idea of prevalence of crime with some
opportunities. Therefore, this author started connecting the idea of social disorganization with the
opportunity theory.
The most important precedent in this criminology’s branch is SDT formulated by Shaw
and McKay in 1942 that at the same time was based on ideas developed by Park and Burgess
(Steenbeeck and Hipp, 2011). These authors stood up for the existence and persistence of
"delinquency areas" and the theory that juvenile delinquency is associated with the physical
structure of the city and other human problems, e.g., adult crime, poverty, disease and family
instability.
According to Bruinsma et al. (2013) Shaw and McKay’s empirical study of the city of
Chicago inspired other researchers to study the spatial distribution of crime in other American
cities. Nevertheless, in the 60s and 70s, the social disorganization paradigm was given up
because of methodological problems in geographic criminology. In the 80s, social
disorganization and the study of the role of communities in individual crime and crime
distributions returned on the research agenda and since then, a revival of disorganization studies
emerged in the United States (Bruinsma, 2013). According to Bottoms (2011), socio-spatial
criminology includes three different perspectives. Firstly, these theories focus on the study of
criminal events; secondly, those studying the social structures and social dynamics of

NEIGHBORHOOD AND CRIME: A COMPARATIVE STUDY
6
neighborhoods; and thirdly, those following a more ethnographic or cultural criminology
approach. Although, one of the most important problems in the socio-spatial criminology is
every theory is tested individually. Mixing together for achieving a good empirical and
theoretical integration is necessary (Bottoms, 2011).
2.1. THEORETICAL REVIEW
2.1.1. Social Dynamics of neighborhoods and Neighborhood Effects
As I commented, the history of the ecological theory is previous to the Chicago School.
However, the precedents of the spatial dimensions of criminality began in earnest in University
of Chicago between the two World Wars. The main criminological work of the Chicago School
started mapping the location of offender residences (especially juvenile delinquents), initially in
Chicago and later in other cities. Researchers then attempted to explain those observed
distributions by reference to wider understandings of the city, as derived from the field of urban
sociology (Bottoms, 2011).
The Chicago researchers noted that, over time, the rates of offender residence remained
highest in the same inner city neighborhoods despite the fact that such neighborhoods were
successively occupied by waves of immigrants from different countries. Hence, Chicago School
researchers made the claim that the social conditions of these neighborhoods helped to generate
delinquency in a process that recently has been named as the production of a neighborhood effect
(Sampson, 2012). With this study, the Chicago school achieved three important conclusions: (i)
Juvenile delinquency was more concentrated in transitions zones; (ii) other problematic social
signs followed the same spatial pattern; (iii) delinquency taxes were stable in the time in spite of
nationality changes (Cid and Larrauri, 2001).
In order to explain these findings, authors were focused in cultural heterogeneity and the
population movement in zone transitions. As a consequence, economical factor was important,
but it was not the focus of the theory. Hence, transitional zones, physical deterioration,
population movement and population heterogeneity were seen as a debilitating in the social
structural because they induce a cultural fragmentation (Bottoms, 2011).

NEIGHBORHOOD AND CRIME: A COMPARATIVE STUDY
7
a) Social disorganization
From the previous study in Chicago appeared the SDT. The basic premise of this theory is
neighborhoods with high residential instability, low socioeconomic status, and high level of
ethnic heterogeneity experience more disorder than others. The underlying mechanism is that
people in these neighborhoods are less able to organize themselves against threats than people in
other neighborhoods. The residents themselves may move to and from the neighborhood, but the
characteristics at the neighborhood level persist and it remains socially disorganized (Shaw and
Mckay, 1942).
Sampson and Groves (1989) added additional indicators of social disorganization like
urbanization and structural density. Structural density refers to an area’s concentration of high-
rise flats and also to the clustering of children in the same household unit. It is assumed that
structural density reduces area supervision and collective problem-solving behavior. Moreover,
Sampson and Groves introduced mediating mechanisms like local friendship networks, low
organizational participation and unsupervised teenage peer groups.
However, some authors have criticized the theory because they argued that not necessarily all
the communities with low residential stability, low socioeconomic status and higher ethnic
heterogeneity experience more disorder. Therefore, they found that there are many
neighborhoods with these characteristics having high social cohesion (Steenbeek and Hipp,
2011).
b) Collective efficacy theory
To solve the problems that the social disorganization theory presents, Sampson et al. (1997)
proposed the collective efficacy theory. This includes two different mechanisms: social cohesion
and social control. These authors explained that social and organizational characteristics of
neighborhoods explain variations in crime rates that are not solely attributable to the aggregated
demographic characteristics of individuals. They proposed that the differential ability of
neighborhoods to realize the common values of residents and maintain effective social controls is
a major source of neighborhood variation in violence. Although social control is often a response
to deviant behavior, it should not be equated with formal regulation or forced conformity such as

NEIGHBORHOOD AND CRIME: A COMPARATIVE STUDY
8
the police. Somewhat, social control refers generally to the capacity of a group to regulate its
members according to desired principles—to realize collective, as opposed to forced, goals. One
central goal is the desire of community residents to live in safe and orderly environments that are
free of predatory crime, especially interpersonal violence.
Sampson et al. (1997) focused on the effectiveness of informal mechanisms by which the
residents themselves achieve public order. It follows that socially cohesive neighborhoods will
prove the most fertile contexts for the realization of informal social control. In sum, it is the
linkage of mutual trust and the willingness to intervene for the common good that defines the
neighborhood context of collective efficacy.
Finally, it is important to stress that collective efficacy does not exist in a vacuum. It is
embedded in structural contexts and a wider political economy that stratifies places of residence
by key social characteristics. Consider the destabilizing potential of rapid population change on
neighborhood social organization. A high rate of residential mobility, especially in areas of
decreasing population, fosters institutional disruption and weakened social controls over
collective life. A major reason is that the formation of social ties takes time (Sampson et al,
1997).
2.2.2. Focusing on criminal events
The research of Chicago School in the geography of crime focused on data plotting the
areas where offenders lived. Although offenders do not always commit crimes close to home, so
an alternative focus for socio-spatial criminology is to undertake a detailed study of the location
of offences (Bottoms, 2011).
The two leading theoretical frameworks deployed to analyze crime events have been
routine activities theory and the rational choice perspective. RAT was originally developed by
Cohen and Felson (1979) in a paper where they sought to explain crime rate trends by reference
not to offenders’ dispositions, but rather to social changes leading to increased opportunities for
crime. Therefore, Cohen and Felson (1979) specify that crime rate trends are related to patterns
of what they have called routine activities1. Thus, it has been well stated that RAT embodies two
1 They define these as any recurrent and prevalent activities which provide for basic population and
individual needs, whatever their biological or cultural origins. Thus routine activities would include formalized

NEIGHBORHOOD AND CRIME: A COMPARATIVE STUDY
9
key ideas: first, the structure of routine activities in a society influences what kinds of situations
emerge, and second, that people commit acts of crime in response to situational conditions
(Bottoms, 2011). Cohen and Felson (1979) stated that to understand crime rate trends is
necessary the convergence in time and space of three elements (motivated offenders, suitable
targets, and the absence of capable guardians). Moreover, they affirmed the lack of any of these
elements is sufficient to prevent the occurrence of a crime. The convergence in time and space of
suitable targets and the absence of capable guardians can lead to large increases in crime rates
without any increase or change in the structural conditions that motivate individuals to engage in
crime. It is important to note that the capable guardian dimension allows connections between
RAT and CET. It is because, on average, the residents in a neighborhood with high collective
efficacy are more capable guardians.
The second main theoretical approach was the rational choice perspective developed by
Clarke and Cornish. This approach was based on the insight derived from psychological
research, that often human behavior is situation-specific; it follows therefore that people might
act in a different way if the immediate context is altered. Although they are not identical, there
are some important similarities between RAT and the rational choice approach (Bottoms, 2011).
2.2. THEORETICAL FRAMEWORK AND HYPOTHESIS
I adopted an integrated perspective because I think that the three theories which I
summarized before (SDT, CET and RAT) could have explanatory ability to understand the
geographical distribution of delinquency. Therefore, the main objective of my research is
proving some hypothesis of every theory.
In other words, I want to prove in my research the SDT taking into account that the
characteristics defined by the SDT are given in these areas with high crime rate.
On the other hand, I want to prove also the CET. For this reason, I will assume that this
theory is valid if the collective efficacy is low in these areas with high crime rates. I want to
work, as well as the provision of standard food, shelter, sexual outlet, leisure, social interaction, learning and
childrearing.

NEIGHBORHOOD AND CRIME: A COMPARATIVE STUDY
10
prove also that the collective efficacy is lower in these areas where the variables of the SDT are
given.
Finally, I want to test the RAT taking into account that there are higher crime rates in these
districts with more opportunities. On the other hand, there are less capable guardians and more
motivated offenders in these areas with more crime.
To sum up, I tested the previous hypothesis because I want to know which one have more
explanatory ability in the places chosen like study object.

NEIGHBORHOOD AND CRIME: A COMPARATIVE STUDY
11
3. METHODOLOGY
3.1. STUDY LOCATION
Some authors like Sutherland et al. (2013) criticized that some of the theories considered
in this research are applicable only in some cities or countries with particular cultural and social
aspects. It is necessary to test the same theories in different contexts to affirm whether we can
apply them all over the world. This is a difficult aspect not only in socio-spatial criminology, but
also in all the theories which compose the field of criminology. For this reason, I decided to
build the same design in two cities of two different countries taking advantage the opportunity to
finish my bachelor in Criminology abroad. The cities where I started to analyze the crime data
and other indicators were Sabadell and Miami Beach2. Sabadell is one of the two capitals in
Vallès Occidental in Catalonia, 20 km north from the main city of Barcelona. Sabadell was an
important city during the Industrial Revolution, overall in the textile industry. For this reason, the
city received a lot of immigrant populations and grew from the center to the suburbs3. According
to the City Council, Sabadell had a population of 208.318 in 2012 with a density of 5.506
(inhabitants/ km2). The city is divided into 7 districts and every district contains different
neighborhoods4. On the other hand, Miami Beach is a city of the Miami Dade County located in
southeastern Florida, USA. Miami Beach was incorporated in 1915 in the Miami Dade County
and quickly became one of America's top vacation spots. Nowadays, Miami Beach is an urban
center with a multicultural ambience and a strong economy based on tourism and other
industries5. It is an Island of 19.7 Km
2 with a population of 90,588 inhabitants. This island is
formed by three main Districts formed at the same time for different smallest “neighborhoods”6.
3.2. SMALL UNITS: DISTRICTS AND STREETS
Another fact to remark is the definition and delimitation of the area I considered like a
neighborhood for my research. It is difficult to define an area like a neighborhood; moreover the
2 In the first stage of this project, the research field of this final bachelor dissertation was Tarragona (Spain) and
Miami (United States). Both cities were chosen taking into account that I could access to data easily because I had to
start the internship in the Municipal Police of Tarragona (from September to December 2013). However, finally I
could not start the internship there because they had some personnel and coordination problems. 3 Information from the city council and the enciclopedia.cat.
4 See the chart 1 in the appendix with the different neighborhoods of every district.
5 Information from the web citytown.info
6 See chart 2 in the appendix about neighborhoods in Miami Beach.

NEIGHBORHOOD AND CRIME: A COMPARATIVE STUDY
12
cities not always recorded data considering the same administrative division. Some authors, like
Bursik and Grasmick (1993) discussed about this issue and affirmed that there is not a clear
consensus about how to define it. Sutherland et al. (2013) also stress this challenge in their
research and explain that in the United Kingdom they worked with postcode sectors, electoral
wards and other administrative boundaries. In my case, I decided to base my research in two
levels taking into account the smallest areas with a minimum sense of belonging of every city
where I could obtain data.
The first level is the analysis of the SDT and RAT in a district level choosing these
districts with a highest crime rate and comparing their characteristics to the others7. The second
level is the analysis of the CET through smaller units. I wanted to study this variable through
higher units like districts. However, it was too much work for only one student. Therefore, the
analysis unit for the CET is in a street level. In the case of Sabadell, in the District with the
highest crime rate, I chose two streets with many offenses and two streets with few offenses or
no offenses next to the streets with more crime. On the other hand, in Miami I selected two
streets with many offenses in the District with the highest crime rate and two streets with few or
no offenses near to the District with more offenses.
7 I have used a District level like the analysis unit because is the smaller unit where I could obtain data for testing the
social disorganization theory and the routine activities theory.

NEIGHBORHOOD AND CRIME: A COMPARATIVE STUDY
13
3.3.DATA COLLECTION
3.3.1. DEPENDENT VARIABLE: CRIME RATES
The crime rates of every city are the dependent variable of my research. I measured this
variable with law enforcement data of every municipal police. However, the method used for
every city was different because every country has a different record method. For this reason, I
prefer explaining the followed process separately per city.
a) Sabadell Crime Rate
The crime rate of Sabadell was obtained by the data of the Municipal Police of Sabadell
of the year 2012. They had a database with all the criminal acts committed in Sabadell per
month8. In this database, there is different information like type of offense, date, where the act
was lapsed, opening and closing date of investigation, among others. However, the only required
information for my research was the type of offense and the particular place. The first
information to create the offense typology I wanted to take into account. The second one was to
obtain the district with most offences in Sabadell and the crime rate per district. Nevertheless, the
original database did not contain the particular district where the act was committed, only the
exactly street and number. For this reason, I looked for the particular district where the street
belongs through a program that the Municipal Police uses. On the other hand, I classified the
different offenses in five main groups: property, violent, drug dealing offences, domestic
violence and others. In this database there were some acts that could not been identified like
crime like incivility.
Having this database of the Municipal police of Sabadell I calculated the crime rate
per every district (number of offenses per 100 inhabitants) to compare the characteristics of these
districts with higher crime rates with these districts with lower crime rates. However, I will take
as a reference for the comparison the district with the highest crime rate, in this case District 5
with a 9%.
8 The database is shared with Mossos D’Esquadra. It means that in this database there are data registered by both,
MMEE and Municipal Police depending who has arrived first to the act.

NEIGHBORHOOD AND CRIME: A COMPARATIVE STUDY
14
Source: own graphic built with data of Municipal Police of Sabadell.
It is necessary to test also if delinquency typologies are represented in every district in a
similar way. In order to verify it, I did a chi square test to compare independent observed
proportions. This test affirms that the typology of crime is related with every district. It means,
every district has the same kind of crime, where the vast majority of crimes are against property,
while the second place is violent crime9. However, district 5 does not follow this tendency
because the second typology is Drug dealing offences.
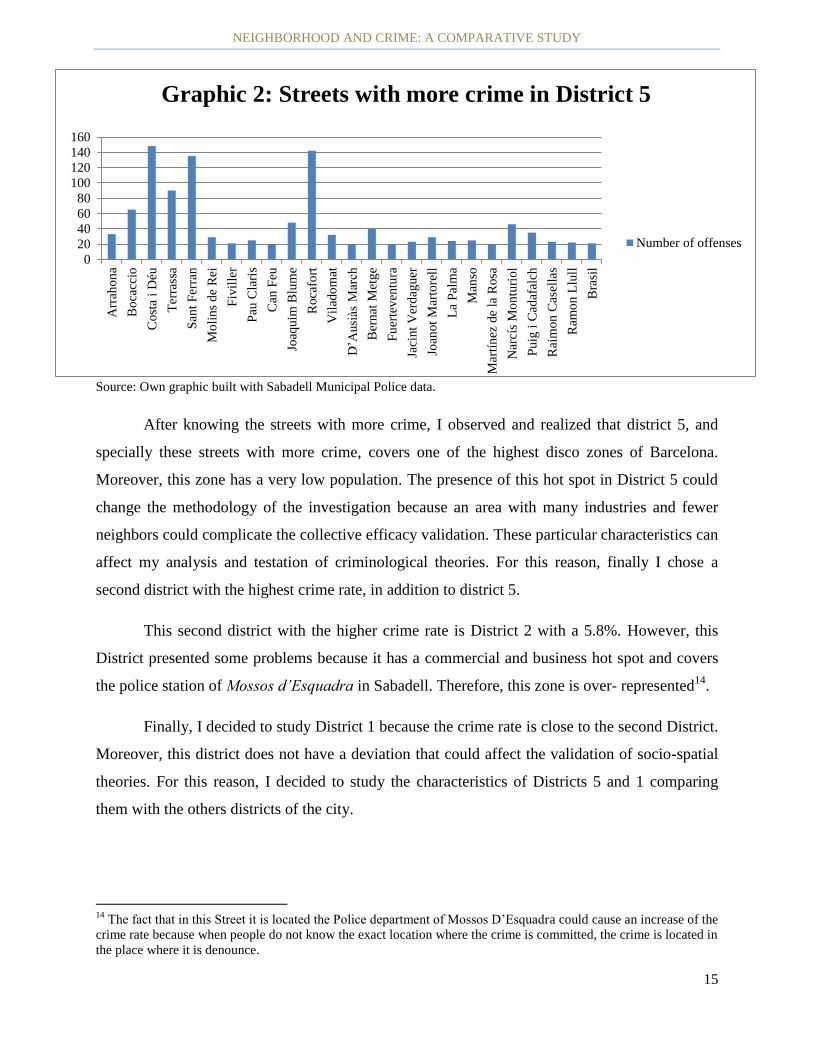
As you can see in the graphic 1, District 5 is the area with a higher crime rate. it is
necessary to know which streets receive more offenses because I need to know these streets to
carry out my collective efficacy survey. Finally, these streets with more crime, in absolute
numbers12
, in district 5 were Costa i Déu, Rocafort and Sant Ferran.
9 See in the appendix tables 3 for the complete analysis.
12 I used the total number offenses and not the crime rate because I did not have access to the number of people who
live in every street.
0,00%
1,00%
2,00%
3,00%
4,00%
5,00%
6,00%
7,00%
8,00%
9,00%
10,00%
District
1
District
2
District
3
District
4
District
5
District
6
District
7
Total
Graphic 1: Crime Rate per District
Crime Rate
NEIGHBORHOOD AND CRIME: A COMPARATIVE STUDY
15
Source: Own graphic built with Sabadell Municipal Police data.
After knowing the streets with more crime, I observed and realized that district 5, and
specially these streets with more crime, covers one of the highest disco zones of Barcelona.
Moreover, this zone has a very low population. The presence of this hot spot in District 5 could
change the methodology of the investigation because an area with many industries and fewer
neighbors could complicate the collective efficacy validation. These particular characteristics can
affect my analysis and testation of criminological theories. For this reason, finally I chose a
second district with the highest crime rate, in addition to district 5.
This second district with the higher crime rate is District 2 with a 5.8%. However, this
District presented some problems because it has a commercial and business hot spot and covers
the police station of Mossos d’Esquadra in Sabadell. Therefore, this zone is over- represented14
.
Finally, I decided to study District 1 because the crime rate is close to the second District.
Moreover, this district does not have a deviation that could affect the validation of socio-spatial
theories. For this reason, I decided to study the characteristics of Districts 5 and 1 comparing
them with the others districts of the city.
14
The fact that in this Street it is located the Police department of Mossos D’Esquadra could cause an increase of the
crime rate because when people do not know the exact location where the crime is committed, the crime is located in
the place where it is denounce.
0
20
40
60
80
100
120
140
160
Arr
aho
na
Boca
ccio
Cost
a i
Déu
Ter
rass
a
San
t F
erra
n
Mo
lin
s d
e R
ei
Fiv
ille
r
Pau
Cla
ris
Can
Feu
Joaq
uim
Blu
me
Roca
fort
Vil
ado
mat
D’A
usi
às M
arch
Ber
nat
Met
ge
Fu
erte
ven
tura
Jaci
nt
Ver
dag
uer
Joan
ot
Mar
tore
ll
La
Pal
ma
Man
so
Mar
tín
ez d
e la
Rosa
Nar
cís
Mo
ntu
riol
Pu
ig i
Cad
afal
ch
Rai
mon
Cas
ella
s
Ram
on
Llu
ll
Bra
sil
Graphic 2: Streets with more crime in District 5
Number of offenses

NEIGHBORHOOD AND CRIME: A COMPARATIVE STUDY
16
Source: Own graphic built with Sabadell Municipal Police data
According to the graphic 3, District 1 has a crime concentration in the more commercial
area (Rambla and Tres Creus) while the other streets maintains a similar number of offenses. The
chosen street with more offenses to conduct the surveys in District 1 was La Rambla, the most
commercial street of the city and also a residential place. In this case, the residences are
apartments with floors, many of them with more than 6 apartments per floor. For this reason, the
density is higher. The chosen street with less crime where I conducted the survey in this District
was Montserrat, more residential, with lower houses and with many elderly people, but also
young families. On the other hand, the chosen streets in District 5 were Sant Ferran, the street
with a higher crime rate in that District. There are big apartments or small flats. Finally,
Permanyer and Frederic Soler were the chosen streets with less crime in District 5. These streets
are composed by small houses.
b) Miami Beach crime rate
The initial idea was analyzing the city of Miami by districts with municipal police data
like in Sabadell. However, when I tried to get the crime data of Miami, the police said they have
this data, but they only way to obtain it is paying a particular fee per year. For this reason, I
followed another methodology to study the socio-spatial theories in USA. First of all, I obtained
0
50
100
150
200
250B
arce
lon
a
Alf
ons
Sal
a
Alf
ons
XII
I
Bel
lesg
uar
d
Cal
assa
nç
Du
ran
Cal
der
ón
Cer
van
tes
Cov
adon
ga
Gü
ell
i F
erre
r
De
la I
nd
úst
ria
Lac
y
Lat
orr
e
Tre
s cr
eus
Po
nen
t
San
t R
oc
So
l i
Pad
rís
Tet
uan
Zam
enh
off
Mar
quès
de
Com
illa
s
Mer
cat
Del
Val
lès
Del
s M
on
tcad
a
Ram
bla
Graphic 3: Streets with more crime in District 1
Number of offenses

NEIGHBORHOOD AND CRIME: A COMPARATIVE STUDY
17
data from UCR, law enforcement data gathered by the Federal Bureau of Investigation. UCR
classify the crimes between: violent crime (murder, forcible rape, robbery and aggravate assault)
and property crime (burglary, larceny theft, motor vehicle theft and arson)15
. Therefore, it is not
the same classification that I used in Sabadell, but it is enough to localize the area with more
crime. However, the problem with the UCR data is that the smallest area where you can find data
is a city. This last aspect it was not too important because the structure of US is not like in Spain.
For example, Miami-Dade County has a lot of cities. The main one is Miami, but this city is not
as big as other important cities in Spain like Barcelona. This city is surrounded by small cities
that sometimes you can confuse as neighborhoods. For this reason, I chose cities next to the
center of Miami with small population and with a sense of belonging. These cities are West
Miami, Coral Gables, Miami Beach, North Miami, North Miami Beach, South Miami, Miami
Shores and Miami Springs.
Table 1: Crime rate per City
Source: own table built with UCR data
Once I had the total crime rate of 2012 for all these cities, I chose the city with the higher
crime rate. The initial idea was using these cities like districts in the case of Sabadell because I
could not obtain crime data for smaller units. According to the table 1, Miami Beach has the
highest crime rate in property and violent crime. For this reason, I chose this city to work with.
However, Miami Beach is the city with the highest population and dealing with all the area with
the same characteristics and indicators could be an error. Therefore, I was in contact with the
15
There are no data available about drug dealing offenses, gender violence or other kind of crime.

NEIGHBORHOOD AND CRIME: A COMPARATIVE STUDY
18
police of Miami Beach in order that they provided me the data. They have a specific department
called “records” where they are in charge to record all kind of information and every month they
sent a report with the offenses committed to a department in Florida International University.
This department has an online program where you can obtain a sample of 200 offenses every
month. It is a strong limitation for the work. However, it is the most reliable data I could obtain.
For this reason, I used this data and created my own database classifying the dependent variable
in four categories: property, violent, drug dealing and miscellaneous17
. However, the most
popular typology is property offenses and miscellaneous in second place18
. On the other hand,
Miami Beach does not have noticeable neighborhoods or districts and the city does not have data
available about small areas. Finally, I decided to analyze the data according to the zip code. I
found enough data considering these limits and it allows me to distinguish different areas. The
main “districts” of Miami Beach taking into account the zip code were three. First, the South Part
called South Beach is from 1st Street to 22th Street with 33139 Zip Code called District 1. This is
the more touristic and commercial part of Miami Beach. The center part is from 23th Street to
68th
Street with 33140 Zip Code, called District 2. Finally, the north part is from 69th
street to
87th
Street, which has 33141 as a Zip Code and called District 3.
According to the database the District with the highest crime rate was District 1 with a
4.3%. Once I had the District with more crime I selected these streets with more crime and less
crime of the Miami Beach city in order to conduct the collective efficacy survey. In the graphic 4
is visible that the crime is assembled between the 1st Street and Lincoln19
.
However, Lincoln road is the main hot spot, and 16th
and 1st street more or less have the
same number of offences. Finally, I worked on District 1 and particularly, in Lincoln Road and
16th
Street for the collective efficacy survey like these streets with more offenses. On the other
hand, Flamingo Drive and Pine Tree in District 2 as the streets with less crime and nearest to the
District with more offenses20
.
17
The same four main typologies that I have used in Sabadell less gender violence. I could not find any offense
related to this typology, probably because the police record this particular crime as rape or harassment 18
See Tables 4 for the complete analysis per typologies. 19
In the graphic there are only these streets with more than 50 offenses per year. 20
In the case of Miami Beach, I used two streets in two different districts, not like in Sabadell. The main reason is
because these streets are the first streets in Miami Beach nearer to Lincoln without crime.

NEIGHBORHOOD AND CRIME: A COMPARATIVE STUDY
19
Source: own graphic built with Miami Beach Police department data.
3.3.2. INDEPENDENT VARIABLES
a) Social Disorganization Theory
0
50
100
150
200
250
300
Graphic 4: Offences per street in District 1

NEIGHBORHOOD AND CRIME: A COMPARATIVE STUDY
20
The variables that composed the social disorganization theory are the independent
variables, which could affect the crime rate in every district. In the case of Sabadell the data was
obtained by the city council and the police department. On the other hand, in Miami Beach this
kind of data was obtained by the webpage of US Census Bureau. All the data was obtained of the
year 2012 and is presented in relation with 100 inhabitants.
To test this theory I looked for some indicators given by the main authors of the social
disorganization theory, which cause a disorganized society. The first variable that I measured in
every District is heterogeneity because it was thought to stop the ability of residents to achieve
consensus. In Sabadell I measured this characteristic like the rate of population with no Spanish
nationality per district. On the other hand, in Miami Beach I used the rate of foreign born
population per district. Moreover, in Miami Beach I also calculated the percentage of Latin
American population23
.
The second variable was mobility because it was hypothesized to disrupt a community's
network of social relation (Sampson and Groves, 1989). In Sabadell I measured this variable like
the natural growth plus the immigration growth. With this figures I measured the percentage per
district. In Miami Beach, I calculated the population difference per district between 2010- 2012.
The third factor is transition zone. According to SDT, high crime areas are characterized
by people trying to move to a better neighborhood when they have more money. In Sabadell I
measured this variable with the number of address changes in the last year24
, while in Miami
Beach I used two indicators. The first one, people moved in 2010 or later, it means that the
District with a higher rate will have more transition zone. Secondly, by the number of rented
dwellings because it means that people prefer to rent the house instead of buying it because they
will move to another place when they are able.
23
It is important to know the concentration of Latin American population in Miami Beach because there are many
Latin American immigrants in Miami Dade County. 24
The indicator measures how many people have moved to another address during the year 2012 inside Sabadell. It
could be that people have moved to District 1 from another district and so on. It means that the chart below shows
the final changes, it have made a calculation of people have left and people have arrived.

NEIGHBORHOOD AND CRIME: A COMPARATIVE STUDY
21
Another variable of this theory is the physical deterioration, and I measured it like
Weisburd (2012) by the number of incivilities reported to the police in the year 2012. I obtained
this data with the same crime database.
It is also important to consider the poverty concentration in every district because
according to Sampson and Groves (1989), low-socioeconomic-status communities suffer from a
weaker organizational base than higher-status communities. Therefore, I calculated this variable
in Sabadell with the number of families who receive social assistance and the number of students
in a private school per district. On the other hand, in Miami Beach I used four different
indicators: percentage of people below the poverty level; per capita income; enrolled students in
a private school and median home value.
I also considered the recent contribution of Sampson and Groves (1989) of family
disruption which argued that marital and family disruption may decrease informal social controls
at the community level. I only measured this indicator in Miami Beach because I did not have it
for Sabadell. The indicator was the number of one single parent families per district.
Finally, the last indicator is structural density, which mostly refers to an area’s
concentration of high-rise flats and also to the clustering of children in the same household unit.
Structural density is assumed to reduce area supervision and collective problem-solving
behavior. Therefore, I measured the density in both cities like density in the area. Moreover, in
Miami Beach I introduced the average of inhabitants in the household unit.
b) Collective efficacy theory
In both cities I measured this theory with the same tool: the collective efficacy survey. To
measure collective efficacy, I followed Sampson et al. (1997), combining a series of questions
covering social cohesion and informal social control. Individuals were asked to report on five-
point Likert scales from “strongly agree” (5) to “strongly disagree” (1)25
. The higher scores
represented greater pro-social efficacy and I used the six items to produce a “collective efficacy”
score for each informant. These were aggregated to the street level. Although, this survey has
been validated for different studies, I measured the Cronbach alpha for my own study and this is
25
See Appendix 5 for details of questions used.

NEIGHBORHOOD AND CRIME: A COMPARATIVE STUDY
22
low, with a 0.7, because it does not arrive to minimum level of 0.826
. On the other hand, I added
more indicators in the survey. 1) Unsupervised peer groups (one item) 2) Local friendship
network (three items); 3) Neighborhood participation (three items); 4) Heterogeneity of the value
system of the neighborhood or moral cynicism (eight items)27
.
The correct way to carry out this study is selecting a representative sample. However, it is
too much work for only one student to conduct a survey to a significant sample. For this reason,
my advisor and I decided to make the survey in those streets with a highest rate and those streets
with a lowest rate taking into account that according to Raudenbush and Sampson (1999, cited in
Bruinsman et al. 2013) 20–30 respondents is sufficient to reliably measure neighborhood social
characteristics. Therefore, I conducted 80 surveys in Sabadell during December 2013 and 40 in
Miami Beach during April 2014.
c) Routine Activity Theory
The variables of the RAT are the independent variables. As the first group of variables,
these indicators for this theory were obtained by the police department and the city council of
26
See Appendix 6.1. for details about the Cronbach alpha. 27
See Appendix 6 for details about the questionnaire.

NEIGHBORHOOD AND CRIME: A COMPARATIVE STUDY
23
Sabadell, and the US Census Bureau. The data is of the year 2012 and some of them are
presented in absolute numbers and other in proportion to the population28
.
I measured the variable target with different indicators depending on the case of every
city and I tried to use different indicators taking into account the type of crime because according
to Bennet (1991) the effect of specific variables on crime incidence is mediated by the type of
crime. In Sabadell I used the number of public services per district (libraries, museums, public
transport…) because these facilities are responsible for gathering crowds and therefore, may
increase the attraction of new offenders looking for suitable targets. The same indicator was used
in Miami Beach. Nevertheless, it is not only includes public services, but also stores and
business. A second indicator for target is the number of shops and restaurants per district because
these kinds of stores attract many people and could increase the number of property offenses. In
Sabadell I measured this variable like number of stores and restaurants, but in Miami Beach
these indicators are included in the service indicator. A third indicator for target is the number of
vehicles because if in a particular place there are many cars available is likely that it attracts
more offenders than in a place without cars. For this reason, I used the indicator number of
vehicles per district in the case of Sabadell and the correspondent measure in the case of Miami
Beach, households without car per district. Fourthly, I used the indicator of number of nightclubs
in the case of Sabadell and Miami Beach because it can stimulates drug dealing and violent
crimes29
. Finally, in Sabadell I measured the number of streets markets per districts because it
could increase the hot spot for pickpocketing and other property crime. However, I do not have
this measure for Miami Beach.
Another variable of RAT is motivated offender. These variables usually have been
measured through indicators of unemployment or low education success because it seems that
people without job have more motivation and time to commit crime, and teenagers with low
commitment with studies are more prone to commit crime. I used the indicator of unemployment
28
I have considered that in the case of the variable target is not necessary and does not make sense calculate the rate
because it means that the suitable target can attract people from others districts. For this reason, it is not important
the rate per 100 inhabitants, but also the major concentration of these kind of targets in a particular place. However,
it is important to present other indicators. 29
I found this particular indicator through the localization of a city council map.

NEIGHBORHOOD AND CRIME: A COMPARATIVE STUDY
24
rate in both cities. However, I only use the indicator of teenagers between 18 and 24 years old
without high school education in Miami Beach.
Finally, the last element of the theory called capable guard refers to the figure which is
capable to prevent violations. It is not necessary to be a person; it could be an object like an
alarm. However, my indicators for this element are: number of police stations and fire stations
per district. Moreover in the case of Miami Beach I measured the rate of unoccupied houses
because it means that there is less surveillance in the area.
4. RESULTS
4.1.SABADELL
4.1.1. SOCIAL DISORGANIZATION THEORY
As I commented before, these Districts with a higher crime rate are taken like Districts of
reference to arrive to a definitive conclusion. However, they will be compared with the others.
District 5 has an area of 4.67 km2
and a population of 19.097 inhabitants in 2012, with a density of
4.089 persons/ km2. On the other hand, the gender is very similar in the district with 49% men
and 51% women and the most popular age is in the range between 35-39 years old.
Photo 1: Carrer Sant Ferran, Sabadell
Source: Google.maps.
On the other hand, District 1 has an area of 4.07 km2
and a population of 51.712, with a
density of 12.705 inhabitants/ Km2. Therefore, it is one of the Districts more populated. The
gender composition of the district is 47.6% men and 52.4% women and the most popular age is
also between 35-39 years old.

NEIGHBORHOOD AND CRIME: A COMPARATIVE STUDY
25
Photo 2: La Rambla, Sabadell
Source: Google.maps
According to the SDT indicators, District 5 has a growth rate of 1% meaning that this
district has a low mobility rate. The same with District 1, which has a growth rate of 1.2%. All
the districts in Sabadell have a similar growth rate; moreover, there is no district with decreasing
population rate. The district with a highest growth rate is District 7, the others are similar. It
means that these districts have a high capacity to transmit positive values. Therefore, if the
neighborhood has a low mobility there is no social disorganization31
.
On the other hand, District 1 and 5 received more population than left. It means that
people prefers to move to District 1, 4 and 5 and leaving the others. According to the social
disorganization theory, these areas with more people trying to leave the neighborhoods reflect
that people do not want to live in these areas. When they have the opportunity to change their
home, they prefer to move to another area of the city. However, there are more neighbors who
chose living in Districts 1 and 5 in the last year than these people who left the area. District 5 has
only 21 positive changes while District 1 has 217 in the year 2012. Therefore, according to the
social disorganization theory, District 1 and 5 is not a transition zone.
Another variable of social disorganization theory is heterogeneity and according the data,
District 5 has a normal immigrant concentration (11%), similar with other districts, while District
1 has the lowest with 7.9%. Meanwhile, Districts 2, 6 and 7 have a highest percentage. It means
that in Districts 1 and 5 are not complicated to transmit common values. Therefore, these
districts with a lower heterogeneity have less social disorganization32
.
31
See appendix 8.1 for more information about growth rate. 32
See table number 8.3 in the appendix for more information.

NEIGHBORHOOD AND CRIME: A COMPARATIVE STUDY
26
S
Source: own graphic built with city council of Sabadell data.
According to the data used to test the socioeconomic variable, District 5 is the poorest
neighborhood because it has more population helped by the social services with a 4.2%, while
District 1 has the lowest rate with a 1.5%. It means that in District 5 families will have to work
more than others with more money and parents will have less time to spread moral values.
However, District 5 presents the highest rate because in this district there is La Serra area, which
is one of the most disadvantage areas of Sabadell according to this statistics. Nevertheless, this
area is not the most affected by crime. In District 5 Gracia is the sector which receives more
crime. Moreover, Gracia is one of the areas with less population attended by social services with
a rate of 20.9% assisted per 1000 inhabitants. For this reason, this is one of the weaker points of
using a big area like a District instead of very small units. In order to contrast the result obtained
for this indicator I used the number of students enrolled in private school and District 5 does not
have any student enrolled in private school, while District 1 has a 2.2%. District 4 has the highest
rate with 27%. Therefore both indicators used for measuring this variable give the same
information. District 1 is one of the districts with less poverty concentration, while District 5 is
one of the districts with more poverty concentration.
Finally, the last variable that I analyzed in Sabadell is the physical disorder. Some authors
like Steenbeek and Hipp (2011) suggest that disorder has large consequences for subsequent
levels of social control and residential instability, thus leading to more disorder. In other words,
it is the statement that the broken windows theory tries to test. District 1 has a normal incivility
rate in the average of the incivilities rate of Sabadell (1.4)33
. However, District 5 is the second
33
See table 8.4 for more information.

NEIGHBORHOOD AND CRIME: A COMPARATIVE STUDY
27
District in Sabadell with more disorder (1.9), for this reason it could have an effect in the social
disorganization.
With all these indicators I can affirm that Districts 1 and 5 only accomplish with some
SDT variables. District 1 has the highest density with 12.705 inhabitants/ Km2 while district 5
has a lower density with 4.089 persons/ km2. Secondly, both districts have a growing population,
but higher in District 1 than District 5. Thirdly, there are more people that want to leave from
District 5 than from District 1. In other words, there are more positive address changes in District
1. Fourthly, District 1 has the lowest foreign rate with a 7.9%, while District 5 remains in the
average of Sabadell with 11%. Proportionally District 1 is the district with less poverty
concentration while District 5 is the most helped. The conclusion of this theory is that District 1
joins all the characteristics of disorganization theory for not being affected by delinquency less
density. The same happens with District 5, but in a lower rate.
4.1.2. COLLECTIVE EFFICACY
In the case of District 1, the results of the survey show that there is 0.5 points of
difference in the collective efficacy rate between the street with more crime, La Rambla, and the
street with less crime, Montserrat. The collective efficacy in Rambla is 2.2 while in Montserrat is
2.7. Therefore, the average of collective efficacy in Montserrat is a little bit high and talking with
the neighbors, they commented that they can trust with the others and it is usual to do activities
together. However, the answers vary depending of the kind of residence (more collective
efficacy in low houses than in high flats, despite they are close each other). In the case of La
Rambla the neighbors answered that years ago there was a very strong relationship in the area
and they knew each other in the flat. However, in the last years that people started dying and the

NEIGHBORHOOD AND CRIME: A COMPARATIVE STUDY
28
apartments were occupied for young people. These new residents are less social and few times
talk each other. Surprisingly, the difference between variables of collective efficacy, local
friendship network, neighborhood participation and heterogeneity of the value system of the
neighborhood are small and the differences are not significant.
In the case of District 5 there are very few differences in the different variables between
this street with less crime (Frederic Soler and Permanyer) and this street with more crime (Sant
Ferran). The Collective Efficacy rate in San Ferran is 2.7, while it is 3.1 in Frederic Soler and
Permanyer. There are no significant differences between streets. The same occurs with the other
variables of social ties in the neighborhood, neighborhood engagement and moral values.
In the particular case of Sant Ferran, neighbors do not have very strong ties or are
interested with the neighborhood. I can affirm it not only for the survey, but also with my
observation during the surveys. They usually commented that they do not have strong
relationship with their neighbors. One of the reasons was that they were moved recently from
another district. In Sant Ferran the measure of heterogeneity of the value system is 3.6 meaning
that these neighbors do not permit incivilities.

NEIGHBORHOOD AND CRIME: A COMPARATIVE STUDY
29
Source: Own chart built with the survey results.
Apparently, it seems that there are very few differences between collective efficacies. For
this reason, I did a Kruskall Wallis test for independent k median variables and there are no
significant differences between streets of the same District with more offenses and less offenses.
The only significant difference is between Rambla and Frederic Soler, which are in different
districts34
. In conclusion, it seems that there are only significant differences between streets of
two districts. When I obtained this result I did another test in order to test if there are significant
differences in the collective efficacy between districts, regardless the streets. I did a T test for
independent samples and I obtained that there are significant differences between District 1 and
5, where 5 has the highest collective efficacy rate (2.9).
34
See appendix 9 for the complete analysis.
0
0,5
1
1,5
2
2,5
3
3,5
Rambla (+) Montserrat
(-)
Frederic
Soler (-)
Sant Ferran
(+)
Graphic 5: Colelctive Efficacy
Colelctive Efficacy

NEIGHBORHOOD AND CRIME: A COMPARATIVE STUDY
30
4.1.3. ROUTINE ACTIVITIES THEORY
Table 5: Indicators for the RAT in Sabadell
Source: own table built with city council data
The results for the indicator of social services in every district show that District 1 is the
district with more services (71). On the other hand, District 5 has 22, below of the average. The
concentration of public services in District 1 proves that this area could attract a lot of people and
the offenders too because this concentration of people in a reduced place make them easy targets.
The same occurs with the number of stores in every district. The vast majority of them are in
District 1, in particular the commercial area of La Rambla. The result is the same an increased in
the number of available targets and then, an increased in the number of property crimes.
Thirdly, it is also important street markets in every district because in these events there
are a lot of people and according to the Municipal police of Sabadell they have to dedicate many
resources in this activities. One more time, District 5 and District 1 are the places with more
streets markets per week. It means that these events attract a lot of people and then the number of
targets increase.
On the other hand, Districts 1 and 5 are the areas with more opportunities related with
vehicle theft because there are the places with more cars. Finally, related with the number of bars
and discotheques District 1 and 5 are those areas with more nightclubs.
Finally, related with the second element of the theory in Sabadell, there are two
municipal police stations, one of them in District 5 and another one in District 3. On the other

NEIGHBORHOOD AND CRIME: A COMPARATIVE STUDY
31
hand, there is a Mossos D’Esquadra police station in District 2. Finally, there is also a police
station of National police in District 2. Therefore, the district with more police stations is District
2. On the other hand, the only one fire station of Sabadell is in the boundary between District 1
and 5 and very close to the Municipal Police Station.
Finally, I considered the element of motivated offender with the indicator of
unemployment rate per district. The district with a highest unemployment rate is District 7,
followed by Districts 3 and 4. However, I do not think that this is the correct and more accurate
indicator. For this reason, I used this indicator with more caution. According to this theory, I
understand that motivated offender does not have to live in the area where he or she commits the
crime. In this case, I would be affirming that the offenders do not move to commit crime; they
commit crime in the same area where they reside. In my opinion this is not the idea of the
opportunity theory. I understand that offenders attend to these areas with more opportunity to
commit crime without danger to be detected35
.
To sum up, District 1 and 5 are the areas with more opportunities. District 1 has more
opportunities to property, violent and health public crime because it includes shops, restaurants
and nightclubs. On the other hand, District 5 does not have a commercial area like District 1, but
it has the largest street market, a lot of vehicles and the largest nightlife area.
35
See appendix number 10 for more information about this variable.

NEIGHBORHOOD AND CRIME: A COMPARATIVE STUDY
32
4.2.MIAMI
4.2.1. SOCIAL DISORGANIZATION THEORY
District 1 has an area of 6.9 km² and a population of 38,665 inhabitants in 2012 with a
density of 5,603 persons/ km2. On the other hand, the gender is 58.9 % men and 41.1% women
and the most popular age is in the range between 25-34 years old.
Photo 3: Lincoln Road, Miami Beach.
Source: googlemaps.com .
In order to compare the District with more crime (District 1) I used the others Districts as
a reference (Districts 2 and 3). Overall District 2 because is very close to District 1 and it has a
very low crime rate in comparison to District 1. This district has an area of 7.7 km2
and a
population of 21.210, with a density of 2,754 inhabitants/ Km2. Therefore, it is one of the
Districts less crowded. The gender composition of the district is 51% men and 49% women and
the most popular age is in the range between 25-34 years old like District 1.
Photo 4: Pine Tree, Miami Beach
Source: Googlemaps.com

NEIGHBORHOOD AND CRIME: A COMPARATIVE STUDY
33
Taking into account the indicators for the social disorganization theory, the variable of
mobility is positive for all the Districts. It means that the population is increasing in every
district. However, District 1 has a very low growth; the population in this district has increased
only 0.13% in two years. On the other hand, District 3 has the highest population growth with
2.95%. Therefore, District 1 does not have a decreasing population, but almost.
The second variable is transition zone and the indicators show that District 1 has a high
mobility because it has the highest rate of people who moved in 2010 or later in the area36
. It
means that, there are a lot of new people and they do not use to live too much time in the same
house. Finally, District 1 has the highest rate of people who live renting an apartment. However,
this rate is similar to District 3. In other words, they do not buy the house because they will try to
move to another part when the economic situation improves. In conclusion, it seems that District
1 is considered a transition zone37
.
Table 6: Indicators for the SDT in Miami Beach
Source: own chart built with census data.
The heterogeneity is very important in all Miami Beach Districts. All these Districts have
a very high percentage of foreign population; almost the fifty percent of population was born in
another country. District 1 has a high rate (51,62%). However, District 3 has the highest rate and
District 2 the lowest. An interesting aspect of this variable is the vast majority of foreign
population is from Latin American. It means that the proportion of foreign population is very
high; nevertheless almost 60% of the population is Latin. Then, district 1 has a high
heterogeneity, but almost the 80% of foreign population is from Latin America. It means that the
proportion of foreigners is very high, but almost all of them are from the same place. The same
36
This District has the highest rate of people moved in 2010 or later and then, the lowest rate of people in the same
house at least from 1999. It means that there are more new people in District 1 than the others. See appendix chart
11.2 for more information. 37
See appendix number 11.1 for more information.

NEIGHBORHOOD AND CRIME: A COMPARATIVE STUDY
34
pattern is followed by District 3, but not for District 2 which had the lowest foreign rate but also
the lowest Latin American population rate.
District 1 is the second District in Miami Beach with low socio-economic factors in
connection with the others Districts of the city. The factor of socio-economic disadvantage seems
that it is more prevalent in the vast majority of indicators in District 3. On the other hand, District
2 seems to be the most wellbeing one because all the indicators are higher than the others.
However, in connection with the mean of all Districts, the area of south beach is one of the most
affected by socio-economic factors.
The variable of physical disorder shows that District 1 has the highest incivility rate.
However, District 2 and 3 has a very low rate. In my opinion, the problem is the same than in the
crime rate which I described previously38
. In this case, this District with more incivilities is the
District with more crime too.
Finally, the indicator of one single families shows that District 1 has the lowest rate of
one single parent families; the rate is too high in the other Districts. It means that in District 1
children will be more supervised because they have two parents. According to the theory these
kids with only one parent are less supervised because the parent have to work more to maintain
the family.
To sum up, this descriptive analysis about the structural variables affirms that District 1,
which has the highest crime rate, match almost totally with the SDT. District 1 has the lowest
population growth in Miami Beach, it sustains that the population is not decreasing, but it almost
does. This district also accomplish with the variable of transition zones because it has the highest
rate of people who live there since 2010. District 1 has also a high rate of foreign population and
one of the least rich. On the other hand, District 1 has the highest physical disorder rate and the
highest density. The only indicator which is not accomplished is one parent family’s rate.
38
Like I commented before, the crime rate per District that I obtained it is not a complete record of all the offenses
committed during one entire month. It is a sample of 200 offenses per month. Therefore, District 1 is the District
with more offenses, but I ignore if it cause of the little sample or there are other causes of recording involve in it.

NEIGHBORHOOD AND CRIME: A COMPARATIVE STUDY
35
4.2.2. COLLECTIVE EFFICACY
Table 7: Collective efficacy results in Miami Beach
In this case, the collective efficacy comparison is between Lincoln Road and 16th
street
(District 1) and Flamingo Drive and Pine Tree (District 2)39
. The results of the survey show that
the average of residence time in the Flamingo Drive area is 16.6, the double that in the case of
the Lincoln Road area. On the other hand, the collective efficacy is higher in Flamingo (3.3.)
than in Lincoln Road (2.6)40
. I did a T test for independent samples assuming equal variances
(alpha higher than 0.05) and it shows that there are differences41
. Therefore, in Flamingo there
are more informal social control and the neighbors trust in each other. I realized while I was
conducting the surveys that in Flamingo neighbors know each other and they have good
relationship. On the other hand, in Lincoln Road neighbors were very different each other and
they did not know anybody in the area. Therefore, Flamingo is a very close area where the
neighbors trust each other and they are capable to exercise control.
The other variables measured with the survey are higher in Flamingo than Lincoln. The
smallest difference is in the indicator of social ties with a 2.3 in Flamingo and 1.8 in Lincoln.
Moreover, roughly the half of the interviewed neighbors affirms taking part of the neighborhood
39
I stressed before that in the case of Sabadell I choose two streets of the same District, but one of them with a lot of
offenses and the other with fewer. However, in Miami Beach, in particular District 1, crime is spread more or less in
the same intensity per streets. Therefore, I thought that it could be more interesting to analyze an area next to the
place with more crime, but with more differences in the crime rate. The nearest area was Pine Tree and Flamingo
(District 2). 40
It seems that the indicators for the variable control are a little bit higher than the indicators for the cohesion.
Therefore, neighbors think that neighbors in the area are likely to act. However, the relationship between them is
weak. 41
See Appendix number 12 for the complete analysis.

NEIGHBORHOOD AND CRIME: A COMPARATIVE STUDY
36
association, while in Lincoln only a 13%. However, some neighbors in Lincoln Road answered
that they do not take part of it because there are not associations in the area.
The highest variable in Flamingo and Pine Tree is moral cynicism with 3.9, almost 4. It
means that the population of this area is very conscious about the good behavior and bad
behavior. On the other hand, this variable in Lincoln area is lower. Mainly, because the vast
majority of the interviewed sample affirmed that drinking in the street, skating in banned places
and exceeding the speed limit is acceptable in almost every case. However, they answered that is
totally unacceptable stealing something, scratching cars or throwing trash in the street42
.
Finally, it is also important consider the perception of insecurity that these sample have.
The measure indicates that the insecurity perception is 0.42 in Flamingo while it is 0.6 in
Lincoln. The majority of people in Flamingo have affirmed that the most likely danger is theft or
Justin Bieber driving under the influence of drugs, but not the other categories. In the case of
Lincoln more people answered that the other typologies could be possible.
To sum up, it seems that the CET is acceptable in the particular case of these two areas of
Miami Beach. Lincoln Road and 16th
Street has less collective efficacy than Pine Tree and
Flamingo Drive, and also all the other indicators have resulted lower. However, it is also
important to stress that in both cases the measures are very high in comparison with the cases of
Sabadell, but it will be compared later.
4.2.3. ROUTINE ACTIVITIES THEORY
District 1 seems to have the highest rate of services in comparison with the others
because like I mentioned, this District is known for being one of the most touristic places and
includes a lot of shops and restaurants. Therefore, these services attract a lot of population in
specific points. The second indicator is the number of residents in the area. In this case, like I
stressed, district 1 has the highest population and the highest density too. Moreover, it is
important to mention that this area has a high quantity of tourism.
On the other hand, District 1 has the lowest rate of available cars. Therefore, this area
would not be a good target for the vehicle theft offenses. However, this indicator only takes into

NEIGHBORHOOD AND CRIME: A COMPARATIVE STUDY
37
account residents’ vehicles, it does not take into account that this area has a lot of tourism and
the foreign people usually bring the car there. Finally, I considered also the number of nightclubs
in Miami Beach like in Sabadell. All of them are in District 1 (from 1st street to 23
rd street), while
in the other Districts there are no clubs (only one in 44th
street). In conclusion, in this District
there are more opportunities for crime than the others43
.
The other element in the RAT is surveillance absence, and according to Miami Beach
data, District 1 has little surveillance. For example, Miami Beach has only one police station for
the entire city and it is in District 1. On the other hand, there are four fire stations in the city of
Miami Beach44
, but only one in District 1. Consequently, Miami Beach has little formal control
because there is only one police station and it could cause the perception that the reaction time
could be slow. Finally, according the last indicator used for the surveillance absence District 1
has a 35% of vacant houses, it is the second District with more vacant houses. It means that in
this area there is less informal social control because there are more vacant houses.
Finally, the last element of the RAT is the motivated offender and according to the
indicators used, District 1 would have the vast majority of motivated offenders because it has the
highest rate of teenagers (between 18 and 24 years old) that does not have high school (it means
the minimum education) and the second highest unemployed rate (4.5%). Therefore, District 1
has the element of motivated offender for the opportunity theory. However, I have the same
opinion that I commented in the analysis of Sabadell, offenders not always live in the area where
they commit crime.
In conclusion, taking into account all the elements of the RAT seems that District 1 is the
most affected for all the factors of this theory because it has high opportunity, little surveillance
and a high rate of motivated offenders45
.
43
See appendix number 13 for more information about suitable target. 44
The first one is in Jefferson Avenue (District 1); the second one in Pine tree Drive (District 2); the third one in
Collins Avenue (Second District) and the last one in Indian Creek Drive (third District) 45
See appendix number 13 for more information about the data.

NEIGHBORHOOD AND CRIME: A COMPARATIVE STUDY
38
5. CONCLUSIONS
5.1. COMPARATIVE RESULTS
The conclusion of this research is likely the same that a lot of authors affirmed during
years. The variables of the social disorganization theory are not capable to explain the crime
rates in a specific place completely without error. Some variables can be given in a particular
place and not in others, depending on the structure, culture and other factors.
Therefore, the social disorganization theory is not confirmed in my research in Sabadell,
but it is confirmed in Miami Beach. However, the common factors which seem to be present in
both cities are density and physical disorder. Moreover, one of the Districts in Sabadell (District
1) contradicts totally this theory.
Table 8: Summary SDT
On the other hand, the CET is also partially confirmed, one more time for the American
city, which has obtained significant differences between a place with crime and a place without.
In the Catalan city, the collective efficacy difference exists between areas with more crime and
less crime, but the difference is very small and there are no significant differences. The only
significance difference is between the street with more offenses in District 1 and the street with
fewer offenses in District 5 or if I mix the results of both street and I calculated the collective
efficacy per district.

NEIGHBORHOOD AND CRIME: A COMPARATIVE STUDY
39
Table 9: Summary CET
Another important fact of the survey is in both cases local friendship has positive
correlation with collective efficacy. In other words, if neighbors have good friends, do activities
together and ask for favors between them the collective efficacy is higher.
However, only in Miami Beach there are correlation between neighborhood participation
and heterogeneity of the values system. Therefore, in Miami Beach if neighbors are involved in
the neighborhood they have a higher collective efficacy. On the other hand, the correlation
between the values system and collective efficacy is negative (as less values system less
collective efficacy)46
.
Finally, the RAT seems to be proved in both cities. The results are almost the same
because in both cities are given the fact that more opportunities to crime more crime. Moreover,
46
See appendix number 14.

NEIGHBORHOOD AND CRIME: A COMPARATIVE STUDY
40
in Sabadell I could analyze many indicators for every typology of crime and it seems that the
kind of opportunity is related with the kind of crime more committed in every district. The only
variable that does not have relation with the crime rate in both cities is the motivated offender. In
Sabadell, the district with more motivated offenders does not have more crime. However, in
Miami Beach the area with more crime has motivated offenders. In conclusion, the essential key
of the theory is the target. For this reason, the opportunity theory developed by Cohen et al.
(1979) could be a better approach to study in future researches.
Table 10: Summary RAT
5.2.DISCUSSION
The main objective of this research was the comparative study between two cities to
observe if the theories have the same results. Apparently, it seems that in the American city the
differences are bigger than in the Catalan one. However, I want to stress the word apparently
because both cities are very different and both have a very different dynamics. For this reason,
the results obtained in this research could be caused by the differences between both cities.
Therefore, the comparative study seems to indicate that we need to study the structural variables
carefully in every city because they could vary. However, I would like to stress three main
points. First of all, RAT seems valid in both cases, overall for the opportunity element.

NEIGHBORHOOD AND CRIME: A COMPARATIVE STUDY
41
Secondly, the differences in SDT do not show clear results. However, the District in
Miami Beach with more crime accomplish with almost all the characteristics.
Finally, the CET is very remarkable in Miami Beach because the collective efficacy is
lower in the District with crime. I did not obtain the same results in Sabadell; the differences are
too small to affirm that there are differences. Probably, it is caused by the small area segments
where I conducted the survey. However, in my opinion it is important the fact that in Miami
Beach the survey with less crime was conducted in a different area than the survey with more
crime, while in Sabadell both surveys were inside the same district. Therefore, the difference
between cities could be caused by this factor or the selection of only small areas (like in the case
of Weisburd research, 2012).
5.3. LIMITATIONS
Once I finished the research I realized that it has been a very hard work and I am
conscious that my research has a lot of limitations. However, I would like to stress the main
ones. Firstly, the main problem that I found was the lack of data, not only in Spain, but also in
US. Moreover, it is very difficult to collect the same data for two different countries. Therefore,
confronting all the problems I tried to do the most accurate work that I could. Secondly, the
neighbor border is a big problem that many authors stressed because it is difficult to determine
where a neighborhood finishes and starts. However, I had more problems because it is not only
determine the borders of a neighbor, but also having the access to data to study it. Finally, a great
limitation is the sample that I used to study CET because it is very small. Although, Sampson
(1997) affirms that with some informants per street is enough, I think that with a bigger sample I
could analyze better this theory.
5.4. THEORETICAL AND PRACTICAL IMPLICATIONS
Firstly, like a theoretical implication I want to stress the integration of theories because
only one theory cannot explain a big phenomenon like crime. Another theoretical implication
that I desire to stress is the use of small units to study the field of socio-spatial criminology.
During my research I realized that if I use big units and then you reduce the same part in smaller
units the characteristics and the results are different. Finally, according to my results, overall in

NEIGHBORHOOD AND CRIME: A COMPARATIVE STUDY
42
Sabadell I realized that the areas, which accomplish with the social organization theory are these
areas with less crime. Therefore, this pattern seems like potential offenders live in these areas,
but they move to another place of the city to commit the offenses. For this reason, if I would be
able to continue with the research I would like to introduce the place where the offenders lived
(like Shaw and Mckay, 1942).
Secondly, it is necessary to expand practical implications according to the main results of
the research. However, these implications will be different depending on the analyzed part of the
city. Firstly, in District 1 of Sabadell, the theory which explains better the crime rate is RAT and
CET. It means that the practical implications should follow a perspective more focused to the
crime prevention through environmental design (CPTED). Moreover, the area of La Rambla has
a low collective efficacy, for this reason it would be necessary to increase the neighbor cohesion
through activities and other measures. District 5 in Sabadell follows almost the same pattern than
District 1, but the opportunity theory is not too strong than District 1, and SDT is more stated.
For this reason, it would be important implement some situational prevention in the most
conflictive area of nightclubs and other structural measures in other part of the area. Finally, in
Miami Beach the district with more crime accomplishes with almost all the studied theories. For
this reason, I think that District 1 needs implications related with all the theories. First of all,
introduce more surveillance in the streets with more offenses (Lincoln Road and the streets
around there). On the other hand, some policies related with collective efficacy, creating a
stronger neighborhood association in the area. Finally, in a more structural level would be
positive remodel some areas and apartments to attract more residents.

NEIGHBORHOOD AND CRIME: A COMPARATIVE STUDY
43
6. BIBLIOGRAPHY
Bennett, R. (1991). Routine activities: A cross-national assessment of a criminological
perspective. Social Forces, 70(1), 147-163.
Bottoms, A. (2011). “Developing socio-spatial criminology”. in Maguire, M. The oxford
Handbook of Criminology. Fifht Edition. Oxford: Oxford University press.
Bruinsma, G. et al. (2013). “Social disorganization, social capital, collective efficacy and the
spatial distribution of crime and offenders. An Empirical Test of Six Neighbourhood Models for
a Dutch City”. British Journal of Criminology. 53 (5), 942-963.
Bursik, R., and Grasmick, H. G. (1993). Neighborhoods and crime: The dimensions of effective
community control. New York: Lexington Books.
Cohen, L. E. and Felson, M. (1979). “Social change and crime rate trends: A routine activity
approach”. American sociological review, 44 (4), 588-608.
Cid, J. I Larrauri, E. (2001). Terorías criminológicas. Barcelona: Bosch,
Sampson, R. and Groves, W. (1989). “Community structure and crime: Testing social-
disorganization theory”. American journal of sociology, 94 (4), 774-802.
Sampson, R., Raudenbush, S., Earls, F. (1997). Neighborhoods and Violent Crime: A Multilevel
Study of Collective Efficacy. Science. 277, 918-924.
Sampson, R. (2012). Great American City: Chicago and the enduring neighborhood effect.
Chicago: The university of Chicago Press.
Roh, S. Kim, E. Yun, M (2010). “Criminal victimization in South Korea: a multilevel approach”.
Journal of Criminal Justice. 38, 301-310.
Shaw, C., and McKay, H. (1942). “Juvenile delinquency and urban areas”. American
sociological review. 35 (2), 407- 408.
Steenbeek, W., Hipp, J. (2011). “A longitudinal test of social disorganization theory: feedback
effects among cohesion, social control, and disorder”. American Society of Criminology. 49, (3),
833-871.
NEIGHBORHOOD AND CRIME: A COMPARATIVE STUDY
44
Sutherland, A. et al (2013). “Collective efficacy, deprivation and violence in London”. British
Journal of criminology. 53, 1050-1074.
Weisburd, D; et al. (2012). The criminology of place. Street segments and our understanding of
the crime problem. Oxford: Oxford University Press.
Used webpages:
Sabadell historical information: http://www.sabadell.cat/es/
http://www.enciclopedia.cat/enciclop%C3%A8dies/gran-enciclop%C3%A8dia-catalana/EC-
GEC-0057505.xml?s.rows=10&s.start=150&s.q=abril+1914
Miami Beach historical information: http://www.citytown.info
Data sources:
Sabadell structural data: http://opendata.sabadell.cat/ca/
Miami Dade County data: http://www.ucrdatatool.gov/
Miami Beach structural data:
http://factfinder2.census.gov/faces/nav/jsf/pages/community_facts.xhtml
Miami Beach crime data: http://vn4.cs.fiu.edu/cgi-
bin/arquery.cgi?more=1&tester=&gnis0=1&matchprop=2&y1=25.790&x1=-
80.1291&category=crime_dade&vid=herald41.com&arcriteria=1&OIIncidentFromDateTime%3
E=2014-01-01
Maps: https://www.google.es/maps/preview