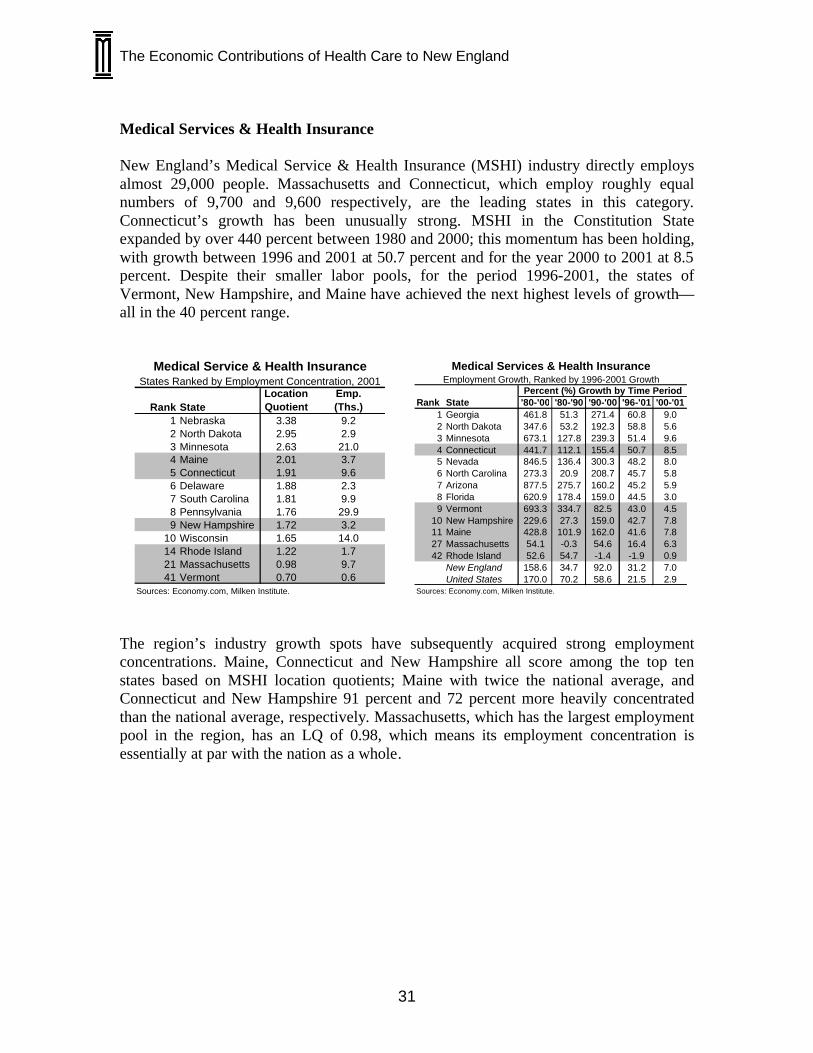
nehi report 02-16-03 - milken...
TRANSCRIPT
The Economic Contributions of Health Care to New England PREPARED FOR: NEW ENGLAND HEALTHCARE INSTITUTE
BY: ROSS DEVOL
ROB KOEPP WITH PERRY WONG AND ARMEN BEDROUSSIAN
MILKEN INSTITUTE 1250 FOURTH STREET, 2/FL SANTA MONICA, CA 90401 310-570-4600 FEBRUARY 2003
The Economic Contributions of Health Care to New England
ii
Acknowledgements
About MI: The Milken Institute is an independent economic think tank whose mission is to improve the lives and economic conditions of diverse populations in the U.S. and around the world by helping business and public policy leaders identify and implement innovative ideas for creating broad-based prosperity. We put research to work with the goal of revitalizing regions and finding new ways to generate capital for people with original ideas.
We do this by focusing on human capital – the talent, knowledge and experience of people, and their value to organizations, economies and society; financial capital – innovations that allocate financial resources efficiently, especially to those who ordinarily would not have access to it, but who can best use it to build companies, create jobs and solve long-standing social and economic problems; and social capital – the bonds of society, including schools, health care, cultural institutions and government services, that underlie economic advancement.
By creating ways to spread the benefits of human, financial and social capital to as many people as possible – the democratization of capital – we hope to contribute to prosperity and freedom in all corners of the globe. We are nonprofit, nonpartisan and publicly supported.
About NEHI: Founded in 2002, the New England Healthcare Institute (NEHI) is a regional, applied research health policy institute focused on enabling innovation in health care. NEHI is dedicated to identifying, analyzing and solving critical health care issues facing the people of New England. NEHI represents all sectors of the health care industry including members of the biotechnology, medical device, hospital, physician, researcher, employer and insurer communities.
Our vision is to improve the health and health care of all people in New England. Our mission is two fold: first, to find workable solutions to the most critical health care issues; and second, to drive change within the public and private sectors.
Established as a 501(c)3 non-profit organization, NEHI is funded through grants, membership dues and donations.
The Milken Institute would like to thank the entire NEHI team including Wendy Everett, President; Valerie Fleishman, Vice President; David Fleming, Special Advisor to NEHI, Genzyme Corporation; and Joe Alviani, Senior Advisor to NEHI, Alviani and Associates. The Milken Institute and NEHI would also like to thank Janice Bourque, Massachusetts Biotechnology Council; Mitch Adams, Tom Hubbard, and Bob Kispert, Massachusetts Technology Collaborative; and Tom Sommer, Massachusetts Medical Device Industry Council. We also appreciate the forum session that NEHI organized of key stakeholders in New England health care and the insightful feedback and advice that was shared. The research and production of this report was truly a collaborative effort. The authors are grateful to Judith Gordon for her editing which greatly improved the quality of this report. Lastly, we thank Sallylynn James’ outstanding design work.
The Economic Contributions of Health Care to New England
iii
Table of Contents
Health Care Industry in New England 1. Executive Summary.................................................................................................1 2. Industry Analysis.....................................................................................................9 § Pharmaceuticals (Drugs) ................................................................................. 15 § Research and Testing Services (Includes Biotechnology Research) .............. 20
§ Medical Devices (Medical Instruments and Supplies).................................... 23 § Hospitals........................................................................................................... 26 § Medical Services & Health Insurance............................................................. 31 § Other Health Care Services............................................................................. 33
3. Multiplier Analysis ................................................................................................ 36 4. Innovation Pipeline Analysis ................................................................................. 41 5. Conclusion.............................................................................................................. 51 6. Appendix................................................................................................................ 53

The Economic Contributions of Health Care to New England
iv

The Economic Contributions of Health Care to New England
1
1. Executive Summary Introduction For the past few decades, the health care sector has been among the fastest growing sectors of the U.S. economy. The industry ranges from health services, such as health practitioners and hospitals, drugs and pharmaceuticals, medical instruments and supplies, medical service and health insurance to research and testing services where much of the burgeoning biotechnology sector is recorded. Nurturing expansion in health care is increasingly vital to global, national and regional economic prosperity. Population growth, due in part to dramatic advances in medical science, the aging of the baby boomer generation and increased wealth are stimulating demand and opportunities in health care fields. Pharmaceutical and biotechnology companies have, through their discoveries, improved the quality of human life and extended the lifespan of many individuals. Scientific discovery, innovation and commercialization in the medical devices industry have greatly benefited the human race. Medical devices allow less expensive and more accurate tests for a wide array of diseases. In the foreseeable future, we could see a range of innovative means of improved drug delivery, ranging from ultrasound and electricity to micromachined implants. Wristwatches may be available for diabetics to monitor blood sugar levels and constantly deliver the appropriate dosage of insulin. Health care consumption has doubled, from 7 percent of U.S. GDP in 1970, to slightly more than 14 percent in 2001. By 2011, health care consumption expenditures in the U.S. are projected to reach 17 percent of GDP according to the Centers for Medicare & Medicaid Services. Perhaps the anticipated high returns on investment in health care will enhance the longevity and quality of life for future generations. Senior citizens, who will account for 30 percent of the population in 10 years, represent 15 percent of the population and purchase one-third of all prescription medications dispensed in the United States. Even more dramatic demographic aging patterns will occur in Japan and Western Europe. On a global basis, the over-65 population is expected to expand from 600 million in 2000 to over one billion by 2020, according to the World Health Organization. The major biotechnology, pharmaceuticals and medical device firms recognize the potential financial returns that these changing demographics imply and are making significant investments in research and development. Biotechnology and biomedicine may mean to the first half of the 21st century what electronics and computers meant to the latter half of the 20th century. We are likely to see a fusing of the information and biotechnology/biomedical industries into a powerful technological and global economic force. There is an important race underway—the one to determine which locations will be the dominant health care centers.
The Economic Contributions of Health Care to New England
2
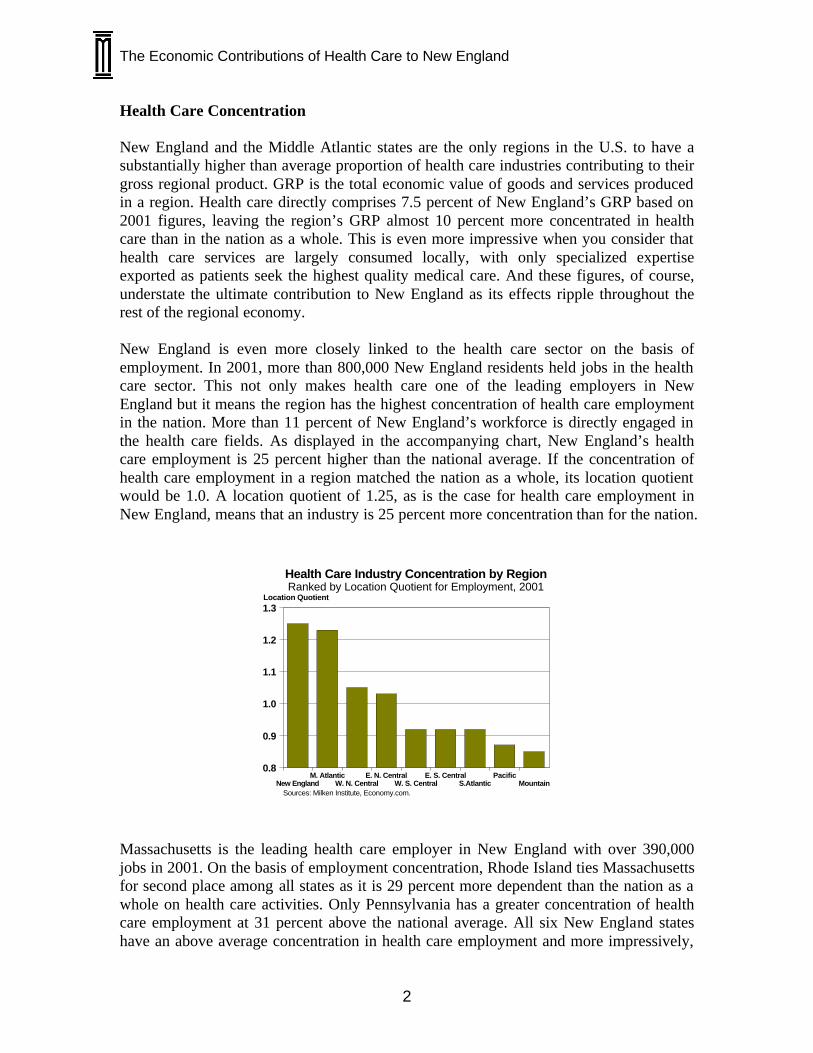
Health Care Concentration New England and the Middle Atlantic states are the only regions in the U.S. to have a substantially higher than average proportion of health care industries contributing to their gross regional product. GRP is the total economic value of goods and services produced in a region. Health care directly comprises 7.5 percent of New England’s GRP based on 2001 figures, leaving the region’s GRP almost 10 percent more concentrated in health care than in the nation as a whole. This is even more impressive when you consider that health care services are largely consumed locally, with only specialized expertise exported as patients seek the highest quality medical care. And these figures, of course, understate the ultimate contribution to New England as its effects ripple throughout the rest of the regional economy. New England is even more closely linked to the health care sector on the basis of employment. In 2001, more than 800,000 New England residents held jobs in the health care sector. This not only makes health care one of the leading employers in New England but it means the region has the highest concentration of health care employment in the nation. More than 11 percent of New England’s workforce is directly engaged in the health care fields. As displayed in the accompanying chart, New England’s health care employment is 25 percent higher than the national average. If the concentration of health care employment in a region matched the nation as a whole, its location quotient would be 1.0. A location quotient of 1.25, as is the case for health care employment in New England, means that an industry is 25 percent more concentration than for the nation.
MountainPacific
S.AtlanticE. S. Central
W. S. CentralE. N. Central
W. N. CentralM. Atlantic
New England
1.3
1.2
1.1
1.0
0.9
0.8
Location Quotient
Sources: Milken Institute, Economy.com.
Health Care Industry Concentration by RegionRanked by Location Quotient for Employment, 2001
Massachusetts is the leading health care employer in New England with over 390,000 jobs in 2001. On the basis of employment concentration, Rhode Island ties Massachusetts for second place among all states as it is 29 percent more dependent than the nation as a whole on health care activities. Only Pennsylvania has a greater concentration of health care employment at 31 percent above the national average. All six New England states have an above average concentration in health care employment and more impressively,
The Economic Contributions of Health Care to New England
3
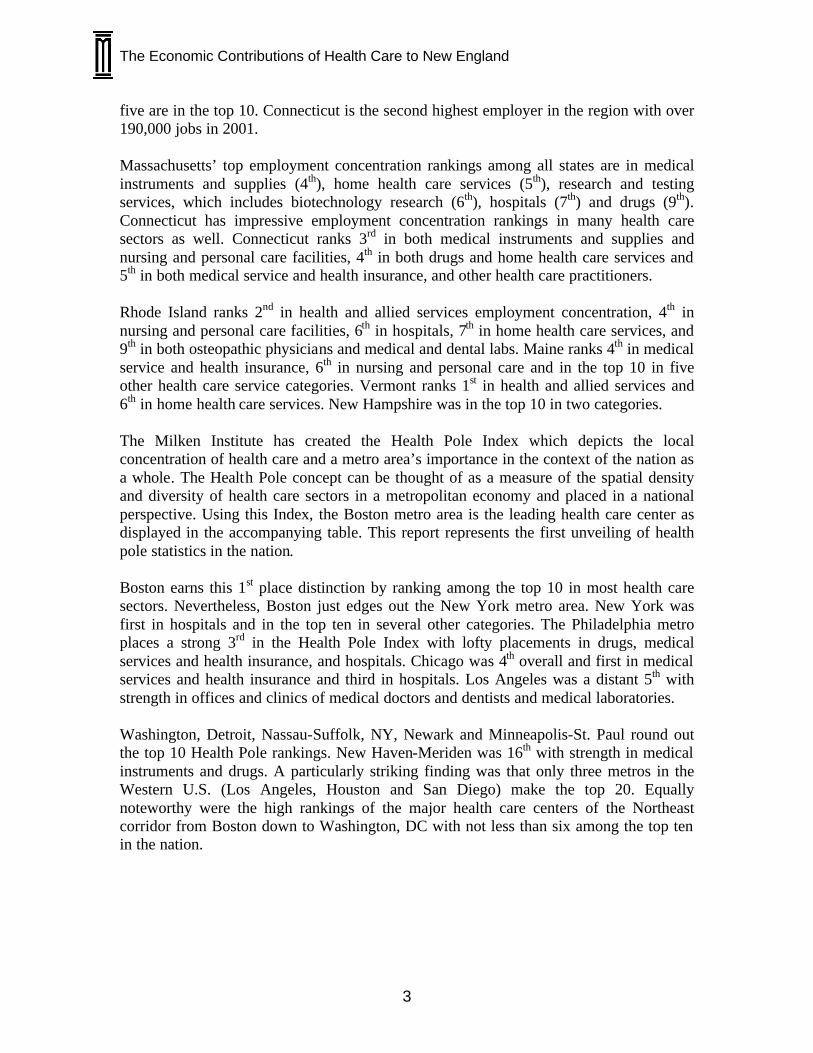
five are in the top 10. Connecticut is the second highest employer in the region with over 190,000 jobs in 2001. Massachusetts’ top employment concentration rankings among all states are in medical instruments and supplies (4th), home health care services (5th), research and testing services, which includes biotechnology research (6th), hospitals (7th) and drugs (9th). Connecticut has impressive employment concentration rankings in many health care sectors as well. Connecticut ranks 3rd in both medical instruments and supplies and nursing and personal care facilities, 4th in both drugs and home health care services and 5th in both medical service and health insurance, and other health care practitioners. Rhode Island ranks 2nd in health and allied services employment concentration, 4th in nursing and personal care facilities, 6th in hospitals, 7th in home health care services, and 9th in both osteopathic physicians and medical and dental labs. Maine ranks 4th in medical service and health insurance, 6th in nursing and personal care and in the top 10 in five other health care service categories. Vermont ranks 1st in health and allied services and 6th in home health care services. New Hampshire was in the top 10 in two categories. The Milken Institute has created the Health Pole Index which depicts the local concentration of health care and a metro area’s importance in the context of the nation as a whole. The Health Pole concept can be thought of as a measure of the spatial density and diversity of health care sectors in a metropolitan economy and placed in a national perspective. Using this Index, the Boston metro area is the leading health care center as displayed in the accompanying table. This report represents the first unveiling of health pole statistics in the nation. Boston earns this 1st place distinction by ranking among the top 10 in most health care sectors. Nevertheless, Boston just edges out the New York metro area. New York was first in hospitals and in the top ten in several other categories. The Philadelphia metro places a strong 3rd in the Health Pole Index with lofty placements in drugs, medical services and health insurance, and hospitals. Chicago was 4th overall and first in medical services and health insurance and third in hospitals. Los Angeles was a distant 5th with strength in offices and clinics of medical doctors and dentists and medical laboratories. Washington, Detroit, Nassau-Suffolk, NY, Newark and Minneapolis-St. Paul round out the top 10 Health Pole rankings. New Haven-Meriden was 16th with strength in medical instruments and drugs. A particularly striking finding was that only three metros in the Western U.S. (Los Angeles, Houston and San Diego) make the top 20. Equally noteworthy were the high rankings of the major health care centers of the Northeast corridor from Boston down to Washington, DC with not less than six among the top ten in the nation.
The Economic Contributions of Health Care to New England
4
Rank Metroplitan Area Health Pole Rank Metroplitan Area Health Pole1 Boston MA-NH 100.00 11 Pittsburgh PA 36.262 New York NY 99.85 12 Baltimore MD 33.553 Philadelphia PA-NJ 97.53 13 St. Louis MO-IL 32.124 Chicago IL 92.20 14 Cleveland-Lorain-Elyria OH 31.235 Los Angeles-Long Beach CA 55.15 15 Houston TX 31.036 Washington DC-MD-VA-WV 48.18 16 New Haven-Meriden CT 31.007 Detroit MI 44.09 17 San Diego CA 24.858 Nassau-Suffolk NY 40.66 18 Rochester MN 23.469 Newark NJ 39.49 19 Tampa-St. Petersburg-Clearwater FL 23.46
10 Minneapolis-St.Paul MN-WI 36.29 20 Miami FL 22.74
Total Health Care Employment, 2001Top Twenty Metropolitan Areas by Health Pole
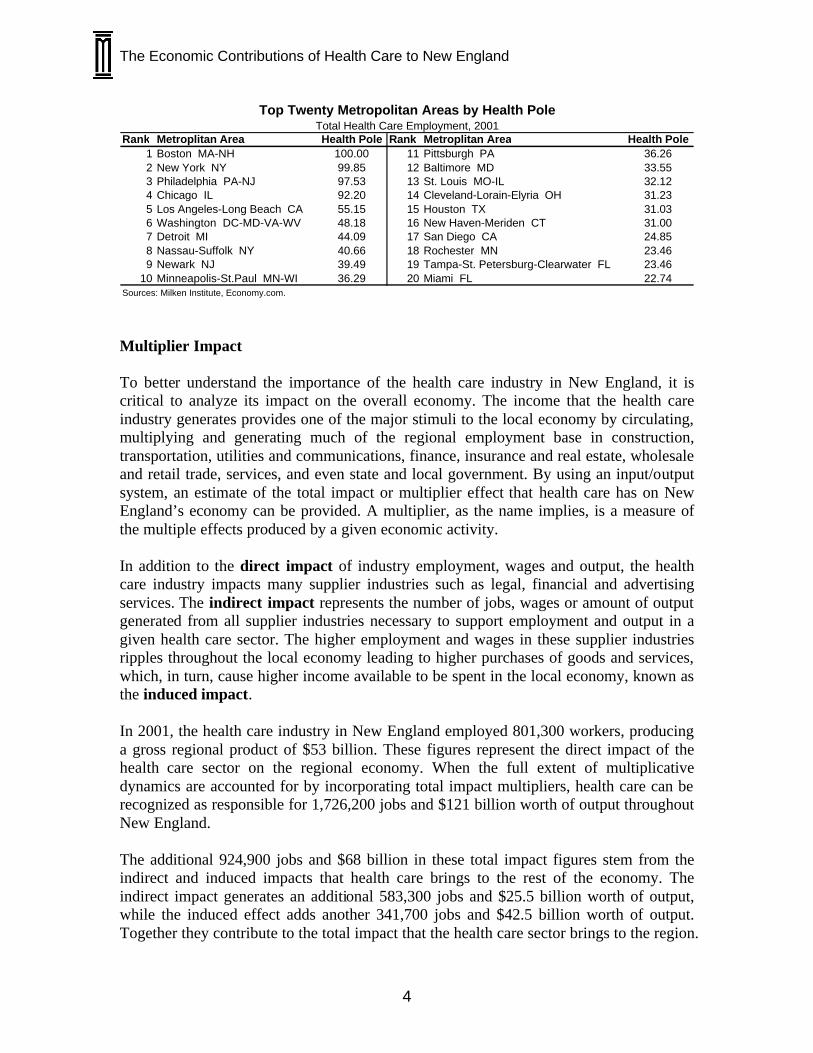
Sources: Milken Institute, Economy.com. Multiplier Impact To better understand the importance of the health care industry in New England, it is critical to analyze its impact on the overall economy. The income that the health care industry generates provides one of the major stimuli to the local economy by circulating, multiplying and generating much of the regional employment base in construction, transportation, utilities and communications, finance, insurance and real estate, wholesale and retail trade, services, and even state and local government. By using an input/output system, an estimate of the total impact or multiplier effect that health care has on New England’s economy can be provided. A multiplier, as the name implies, is a measure of the multiple effects produced by a given economic activity. In addition to the direct impact of industry employment, wages and output, the health care industry impacts many supplier industries such as legal, financial and advertising services. The indirect impact represents the number of jobs, wages or amount of output generated from all supplier industries necessary to support employment and output in a given health care sector. The higher employment and wages in these supplier industries ripples throughout the local economy leading to higher purchases of goods and services, which, in turn, cause higher income available to be spent in the local economy, known as the induced impact. In 2001, the health care industry in New England employed 801,300 workers, producing a gross regional product of $53 billion. These figures represent the direct impact of the health care sector on the regional economy. When the full extent of multiplicative dynamics are accounted for by incorporating total impact multipliers, health care can be recognized as responsible for 1,726,200 jobs and $121 billion worth of output throughout New England. The additional 924,900 jobs and $68 billion in these total impact figures stem from the indirect and induced impacts that health care brings to the rest of the economy. The indirect impact generates an additional 583,300 jobs and $25.5 billion worth of output, while the induced effect adds another 341,700 jobs and $42.5 billion worth of output. Together they contribute to the total impact that the health care sector brings to the region.
The Economic Contributions of Health Care to New England
5
Total Impact
2000
1500
1000
500
0
Employment (Ths.)
Sources: Milken Insittute, BEA.
Total Impact of New England Health CareDirect, Indirect, and Induced Impacts - Employment, 2001
801.
358
3.3
341.
7
Tota
l = 1
726.
2
DirectIndirectInduced
Total Impact
140
120
100
80
60
40
20
0
Output (Billions of $U.S.)
Sources: Milken Insittute, BEA.
Total Impact of New England Health CareDirect, Indirect, and Induced Impacts - Ouput, 2001
53.0
25.5
42.5
Total = 121.0DirectIndirectInduced
In the aggregate, the total health care employment multiplier in New England is 2.15. In other words, each job in New England’s health care sector produces an additional 1.15 jobs in other sectors. By the same token, since 11.4 percent of total employment in New England is health care employment, the industry ultimately accounts for nearly 25 percent of total employment in New England when including the multiplier effect (11.4 percent multiplied by 2.15). Innovation Pipeline New England has a rich innovation pipeline in health care sectors that is essential to sustaining long-term growth. Indeed, the research, development and innovation capacities will play an increasingly important role in determining which regions dominate the health care landscape in the future. Knowledge and discovery derived from basic medical and health research can lead to new innovations and be converted into economic value more effectively at the location of its development. Leading states in the region are incredibly well positioned to capitalize on the promise of health care sector innovations. In areas such as funding, investment, concentration of bioscience specialists, knowledge resource pools, and rates of health-related commercialization, New England is asset rich in terms of its capacity to innovate and add value throughout the regional economy. Averaged out on a per capita basis, no fewer than four states—Massachusetts, Connecticut, Vermont, and Rhode Island—score in the top ten of the nation for the monetary value of National Institutes of Health (NIH) awards received. First-ranked Massachusetts received almost 50 percent more in award value per capita than the next most highly ranked state, Maryland. Internationally renowned medical schools and research hospitals— among them the preeminent Harvard and Yale University medical schools and Massachusetts General Hospital—keep such funds, and human talent, flowing in and vitalizing the health science innovation capacity of New England. Combined, the region received $2.3 billion in NIH awards in 2001.
The Economic Contributions of Health Care to New England
6
Such dominance is exhibited in other types of funding support categories. For example, Massachusetts, the leading state in the region for most types of these investments, is also first in the nation for total funds in industrial scientific R&D and other areas more specific to the health care industry: venture capital dedicated to biotechnology and the medical device industry. New England performs well in terms of funding to support academic-based research and development. Massachusetts, Connecticut and Vermont all rank in the top five states in terms of per capita spending on university-based R&D for the life sciences. Equally impressive, total health R&D funding for Massachusetts rose 77.4 percent between 1993 and 2000, second only to New Jersey. Investment in the region’s innovation pipeline refers to money that is funneled to organizations, typically for-profit enterprises, that supply health care products and services. Boston, one of the nation’s premier centers for venture capital investment, witnessed a nearly three-fold growth in its levels of annual biopharmaceutical VC investment for the years 1995-2000. Even Rhode Island attracts more VC funding than such established biopharma states such as New Jersey and Maryland on a per capita basis. Massachusetts’ VC investment in medical devices on a per capita basis is also the highest in the nation, and Rhode Island, Connecticut and New Hampshire score high as well. These funding and investment flows into New England’s health care industries, however, will be only useful if it effectively supports the work of people who create the innovations that take these industries forward. The figures for the region’s position in terms of human capital for its health care industries are encouraging. As a percentage of a state’s workforce, the New England states of Massachusetts, Connecticut, New Hampshire and Maine tend to rank well in various health care-related scientific fields. Massachusetts has the nation’s most intense concentration of medical scientists and biomedical engineers. Maine does proportionally well in terms of its intensity of biochemists and biophysicists—it is in fact the only New England state to place in the top ten. A measure of the commercialization potential of new products is the pre- and final FDA approvals. On a per capita basis, Massachusetts scores first in the nation (when ranked against other leading technology states) for the number of new biotech drugs granted FDA approval. Massachusetts and Connecticut both rank among the nation’s leading technology states in regards to investigational device exemptions (IDEs) and premarket approvals (PMAs) for medical devices. Health Care Growth These comparisons all depict New England as a major force in the U.S. health care industry; however, there are less than stellar signals based on recent growth performance comparisons with other key regions. New England is not fully leveraging the vast innovation capacities and diversity of its health care sectors for maximum economic
The Economic Contributions of Health Care to New England
7
benefit for the region. Warning signs on the health care industry’s future should not be ignored.
New EnglandE. N. Central
E. S. CentralM. Atlantic
W. S. CentralW. N. Central
PacificS. Atlantic
Mountain
16.0
14.0
12.0
10.0
8.0
6.0
4.0
Percent Growth
Sources: Milken Institute, Economy.com.
Health Care Industry Growth by RegionRanked by Employment Growth, 1996-2001
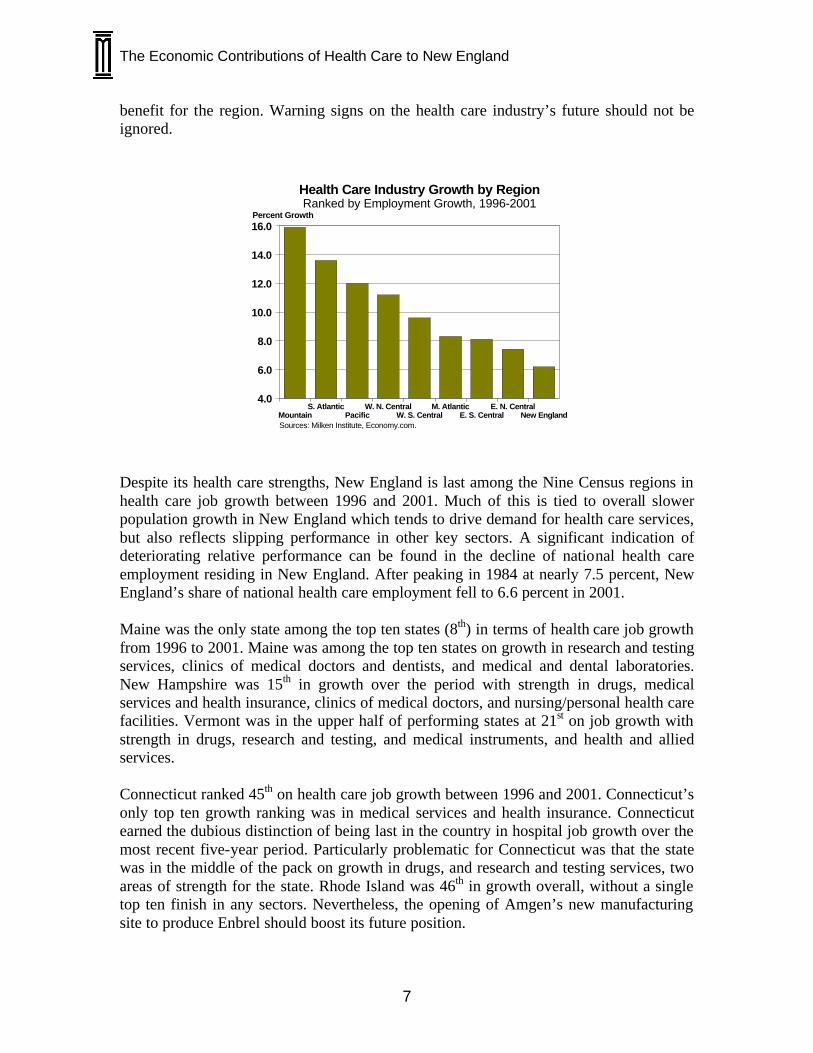
Despite its health care strengths, New England is last among the Nine Census regions in health care job growth between 1996 and 2001. Much of this is tied to overall slower population growth in New England which tends to drive demand for health care services, but also reflects slipping performance in other key sectors. A significant indication of deteriorating relative performance can be found in the decline of national health care employment residing in New England. After peaking in 1984 at nearly 7.5 percent, New England’s share of national health care employment fell to 6.6 percent in 2001. Maine was the only state among the top ten states (8th) in terms of health care job growth from 1996 to 2001. Maine was among the top ten states on growth in research and testing services, clinics of medical doctors and dentists, and medical and dental laboratories. New Hampshire was 15th in growth over the period with strength in drugs, medical services and health insurance, clinics of medical doctors, and nursing/personal health care facilities. Vermont was in the upper half of performing states at 21st on job growth with strength in drugs, research and testing, and medical instruments, and health and allied services. Connecticut ranked 45th on health care job growth between 1996 and 2001. Connecticut’s only top ten growth ranking was in medical services and health insurance. Connecticut earned the dubious distinction of being last in the country in hospital job growth over the most recent five-year period. Particularly problematic for Connecticut was that the state was in the middle of the pack on growth in drugs, and research and testing services, two areas of strength for the state. Rhode Island was 46th in growth overall, without a single top ten finish in any sectors. Nevertheless, the opening of Amgen’s new manufacturing site to produce Enbrel should boost its future position.
The Economic Contributions of Health Care to New England
8
Massachusetts ranked 47th among states in health care employment growth over the most recent five years. In drugs, research and testing services, and medical instruments and supplies, sectors where Massachusetts ranks in the top ten on concentration, the state places 13th, 17th, and 22nd on job growth from 1996 to 2001, respectively. The 1990s marked a period of heavy cutbacks and consolidation for New England’s hospital industry, with contraction especially felt in Massachusetts which ranked 36th on job growth. Because hospitals are such a dominant employment category in Massachusetts, it pulled down the state’s overall health care job-growth performance. Particularly troubling is the pronounced slowdown in pharmaceuticals job growth in Massachusetts and Connecticut. It is disconcerting that pharmaceutical jobs throughout the region, although more than doubling since 1980, have grown anemically compared to the expansion experienced by the 10 states logging the fastest growth (where they have averaged more than a nine-fold increase). Especially distressing for Massachusetts is that another high-cost state—California—experienced stronger job growth in the drugs category from 1996 to 2001. Additionally, Boston has seen its high perch at the top of the Health Pole rankings slip in recent years. Among the top ten Health Pole metros, only Detroit has witnessed a greater loss in employment concentration than Boston over the past five years. Chicago, Washington, D.C., Minneapolis-St Paul and Philadelphia have all recorded health care employment concentration gains. Massachusetts’ higher business costs and tax structure place it at a competitive disadvantage versus other locations where pharmaceutical firms establish large-scale production operations after developing a market for their applications. Better retention efforts aimed at building manufacturing operations would more fully capture the economic value of Massachusetts’ strong biopharmaceutical research capabilities. Similar issues are present when evaluating medical device manufacturing. The state-by-state positions of the medical instruments and supplies industry especially, brings home the message that resources could be better leveraged to realize the New England region’s potential as a dynamic and diverse center for health care industries. Among New England’s leadership and key stakeholders, an increased awareness of the factors limiting health care’s growth in the region among its leadership and other key stakeholders is necessary to create a vision for the future. A regional collaborative focus and perspective could greatly aid New England’s potential growth prospects.
The Economic Contributions of Health Care to New England
9
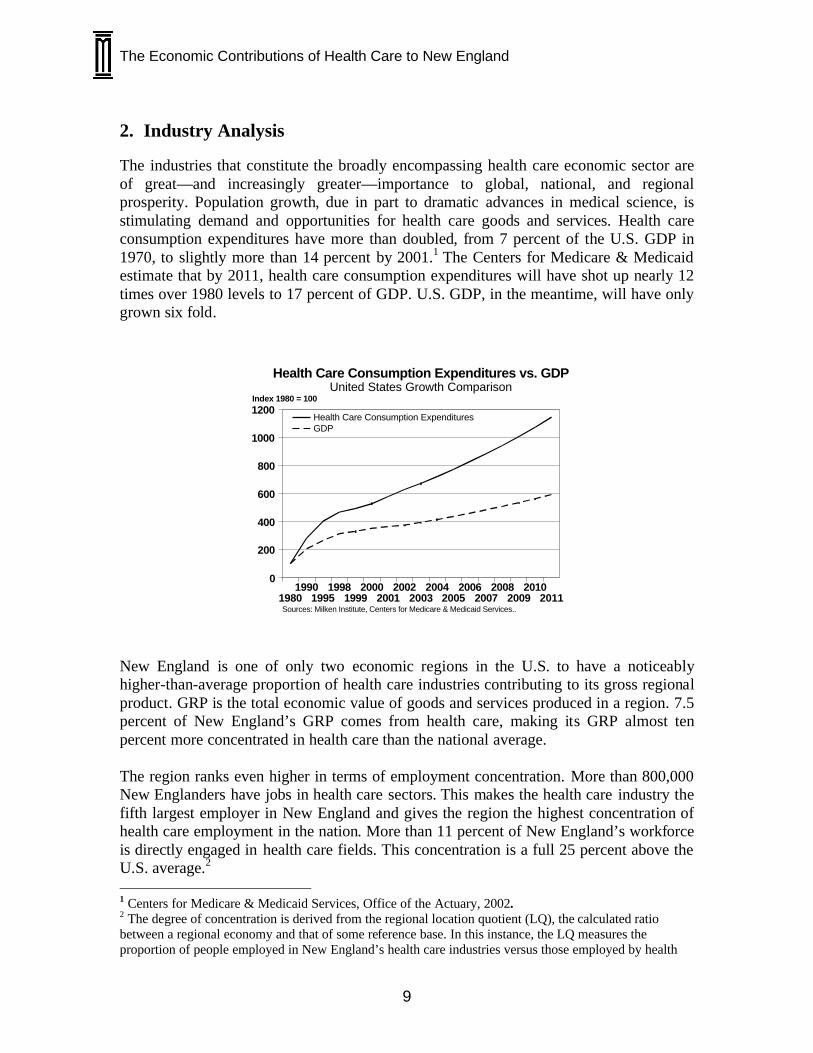
2. Industry Analysis The industries that constitute the broadly encompassing health care economic sector are of great—and increasingly greater—importance to global, national, and regional prosperity. Population growth, due in part to dramatic advances in medical science, is stimulating demand and opportunities for health care goods and services. Health care consumption expenditures have more than doubled, from 7 percent of the U.S. GDP in 1970, to slightly more than 14 percent by 2001.1 The Centers for Medicare & Medicaid estimate that by 2011, health care consumption expenditures will have shot up nearly 12 times over 1980 levels to 17 percent of GDP. U.S. GDP, in the meantime, will have only grown six fold.
20112010
20092008
20072006
20052004
20032002
20012000
19991998
19951990
1980
1200
1000
800
600
400
200
0
Index 1980 = 100
Sources: Milken Institute, Centers for Medicare & Medicaid Services..
Health Care Consumption Expenditures vs. GDPUnited States Growth Comparison
Health Care Consumption ExpendituresGDP
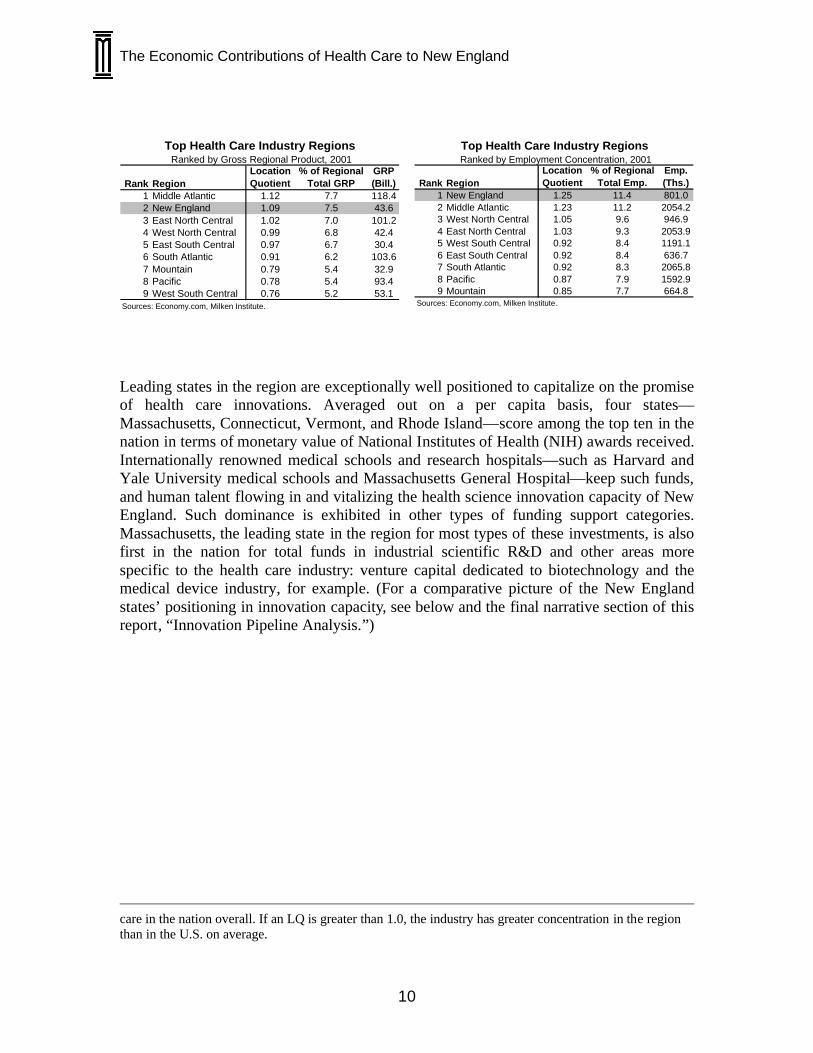
New England is one of only two economic regions in the U.S. to have a noticeably higher-than-average proportion of health care industries contributing to its gross regional product. GRP is the total economic value of goods and services produced in a region. 7.5 percent of New England’s GRP comes from health care, making its GRP almost ten percent more concentrated in health care than the national average. The region ranks even higher in terms of employment concentration. More than 800,000 New Englanders have jobs in health care sectors. This makes the health care industry the fifth largest employer in New England and gives the region the highest concentration of health care employment in the nation. More than 11 percent of New England’s workforce is directly engaged in health care fields. This concentration is a full 25 percent above the U.S. average.2 1 Centers for Medicare & Medicaid Services, Office of the Actuary, 2002. 2 The degree of concentration is derived from the regional location quotient (LQ), the calculated ratio between a regional economy and that of some reference base. In this instance, the LQ measures the proportion of people employed in New England’s health care industries versus those employed by health
The Economic Contributions of Health Care to New England
10
Rank RegionLocationQuotient
% of RegionalTotal GRP
GRP(Bill.)
1 Middle Atlantic 1.12 7.7 118.42 New England 1.09 7.5 43.63 East North Central 1.02 7.0 101.24 West North Central 0.99 6.8 42.45 East South Central 0.97 6.7 30.46 South Atlantic 0.91 6.2 103.67 Mountain 0.79 5.4 32.98 Pacific 0.78 5.4 93.49 West South Central 0.76 5.2 53.1
Sources: Economy.com, Milken Institute.
Top Health Care Industry Regions Ranked by Gross Regional Product, 2001
Rank RegionLocationQuotient
% of RegionalTotal Emp.
Emp.(Ths.)
1 New England 1.25 11.4 801.02 Middle Atlantic 1.23 11.2 2054.23 West North Central 1.05 9.6 946.94 East North Central 1.03 9.3 2053.95 West South Central 0.92 8.4 1191.16 East South Central 0.92 8.4 636.77 South Atlantic 0.92 8.3 2065.88 Pacific 0.87 7.9 1592.99 Mountain 0.85 7.7 664.8
Sources: Economy.com, Milken Institute.
Top Health Care Industry Regions Ranked by Employment Concentration, 2001
Leading states in the region are exceptionally well positioned to capitalize on the promise of health care innovations. Averaged out on a per capita basis, four states—Massachusetts, Connecticut, Vermont, and Rhode Island—score among the top ten in the nation in terms of monetary value of National Institutes of Health (NIH) awards received. Internationally renowned medical schools and research hospitals—such as Harvard and Yale University medical schools and Massachusetts General Hospital—keep such funds, and human talent flowing in and vitalizing the health science innovation capacity of New England. Such dominance is exhibited in other types of funding support categories. Massachusetts, the leading state in the region for most types of these investments, is also first in the nation for total funds in industrial scientific R&D and other areas more specific to the health care industry: venture capital dedicated to biotechnology and the medical device industry, for example. (For a comparative picture of the New England states’ positioning in innovation capacity, see below and the final narrative section of this report, “Innovation Pipeline Analysis.”)
care in the nation overall. If an LQ is greater than 1.0, the industry has greater concentration in the region than in the U.S. on average.
The Economic Contributions of Health Care to New England
11
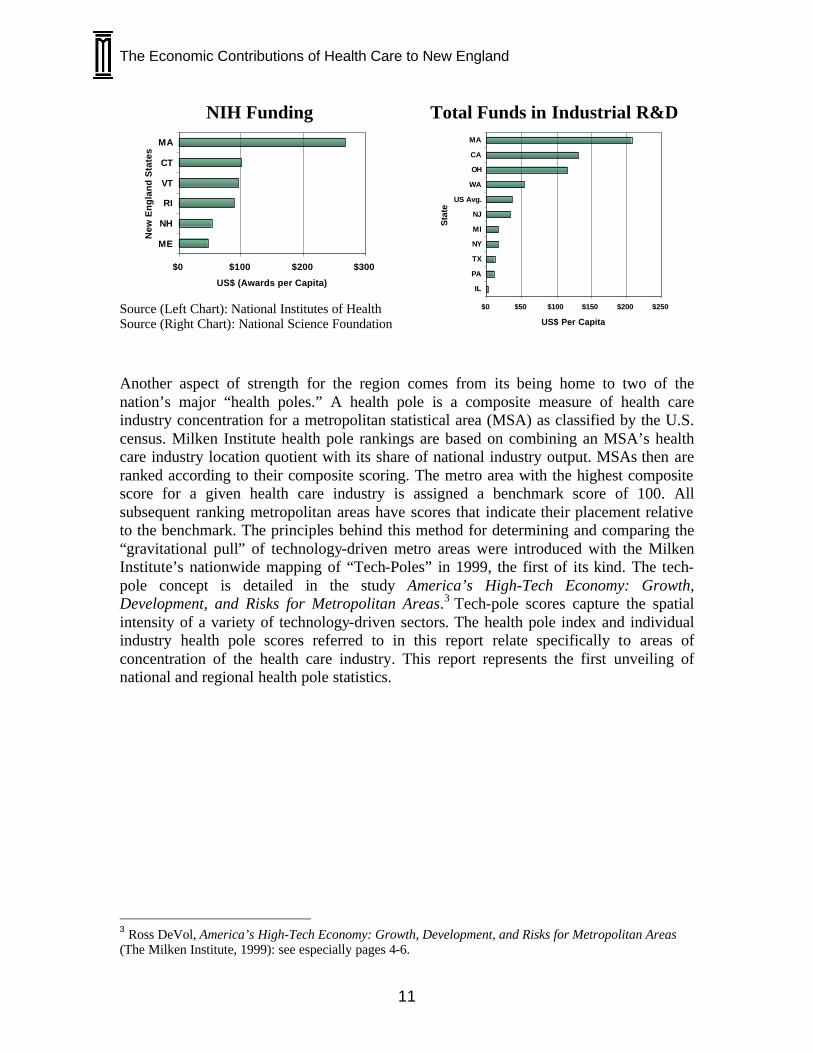
NIH Funding
$0 $100 $200 $300
ME
NH
RI
VT
CT
MAN
ew E
ng
lan
d S
tate
s
US$ (Awards per Capita)
Source (Left Chart): National Institutes of Health Source (Right Chart): National Science Foundation
Total Funds in Industrial R&D
$0 $50 $100 $150 $200 $250
IL
PA
TX
NY
MI
NJ
US Avg.
WA
OH
CA
MA
Sta
te
US$ Per Capita
Another aspect of strength for the region comes from its being home to two of the nation’s major “health poles.” A health pole is a composite measure of health care industry concentration for a metropolitan statistical area (MSA) as classified by the U.S. census. Milken Institute health pole rankings are based on combining an MSA’s health care industry location quotient with its share of national industry output. MSAs then are ranked according to their composite scoring. The metro area with the highest composite score for a given health care industry is assigned a benchmark score of 100. All subsequent ranking metropolitan areas have scores that indicate their placement relative to the benchmark. The principles behind this method for determining and comparing the “gravitational pull” of technology-driven metro areas were introduced with the Milken Institute’s nationwide mapping of “Tech-Poles” in 1999, the first of its kind. The tech-pole concept is detailed in the study America’s High-Tech Economy: Growth, Development, and Risks for Metropolitan Areas.3 Tech-pole scores capture the spatial intensity of a variety of technology-driven sectors. The health pole index and individual industry health pole scores referred to in this report relate specifically to areas of concentration of the health care industry. This report represents the first unveiling of national and regional health pole statistics.
3 Ross DeVol, America’s High-Tech Economy: Growth, Development, and Risks for Metropolitan Areas (The Milken Institute, 1999): see especially pages 4-6.
The Economic Contributions of Health Care to New England
12
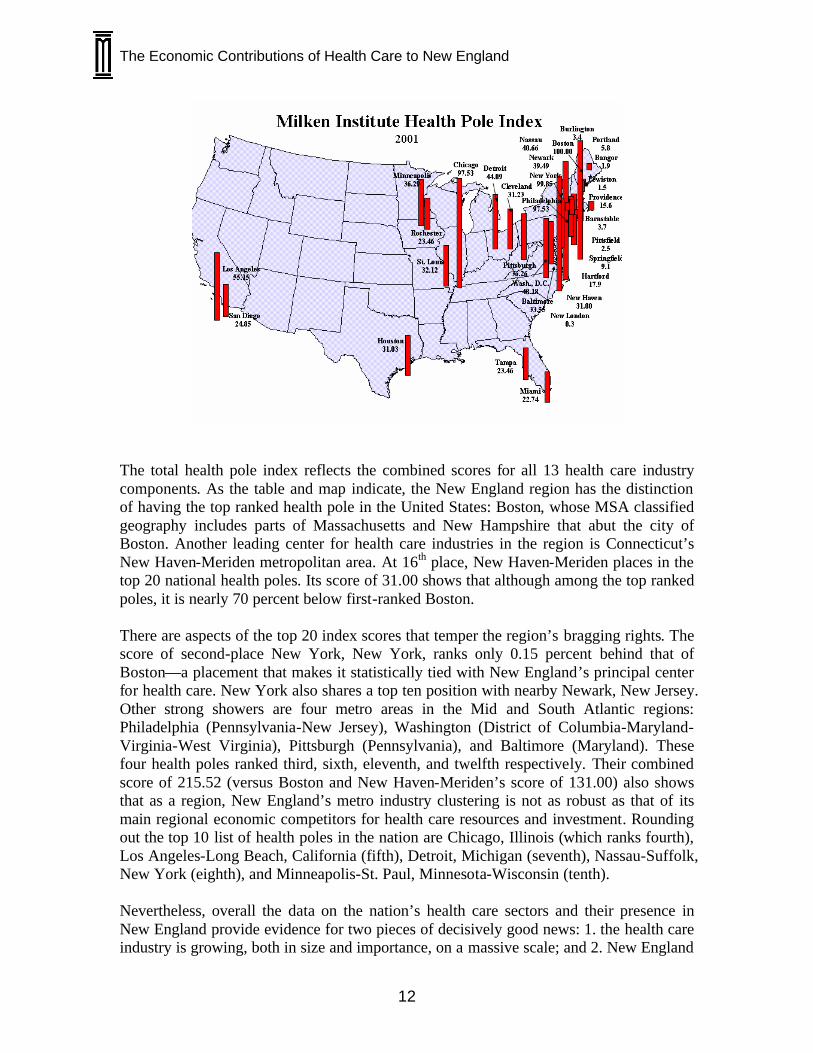
The total health pole index reflects the combined scores for all 13 health care industry components. As the table and map indicate, the New England region has the distinction of having the top ranked health pole in the United States: Boston, whose MSA classified geography includes parts of Massachusetts and New Hampshire that abut the city of Boston. Another leading center for health care industries in the region is Connecticut’s New Haven-Meriden metropolitan area. At 16th place, New Haven-Meriden places in the top 20 national health poles. Its score of 31.00 shows that although among the top ranked poles, it is nearly 70 percent below first-ranked Boston. There are aspects of the top 20 index scores that temper the region’s bragging rights. The score of second-place New York, New York, ranks only 0.15 percent behind that of Boston—a placement that makes it statistically tied with New England’s principal center for health care. New York also shares a top ten position with nearby Newark, New Jersey. Other strong showers are four metro areas in the Mid and South Atlantic regions: Philadelphia (Pennsylvania-New Jersey), Washington (District of Columbia-Maryland-Virginia-West Virginia), Pittsburgh (Pennsylvania), and Baltimore (Maryland). These four health poles ranked third, sixth, eleventh, and twelfth respectively. Their combined score of 215.52 (versus Boston and New Haven-Meriden’s score of 131.00) also shows that as a region, New England’s metro industry clustering is not as robust as that of its main regional economic competitors for health care resources and investment. Rounding out the top 10 list of health poles in the nation are Chicago, Illinois (which ranks fourth), Los Angeles-Long Beach, California (fifth), Detroit, Michigan (seventh), Nassau-Suffolk, New York (eighth), and Minneapolis-St. Paul, Minnesota-Wisconsin (tenth). Nevertheless, overall the data on the nation’s health care sectors and their presence in New England provide evidence for two pieces of decisively good news: 1. the health care industry is growing, both in size and importance, on a massive scale; and 2. New England
The Economic Contributions of Health Care to New England
13
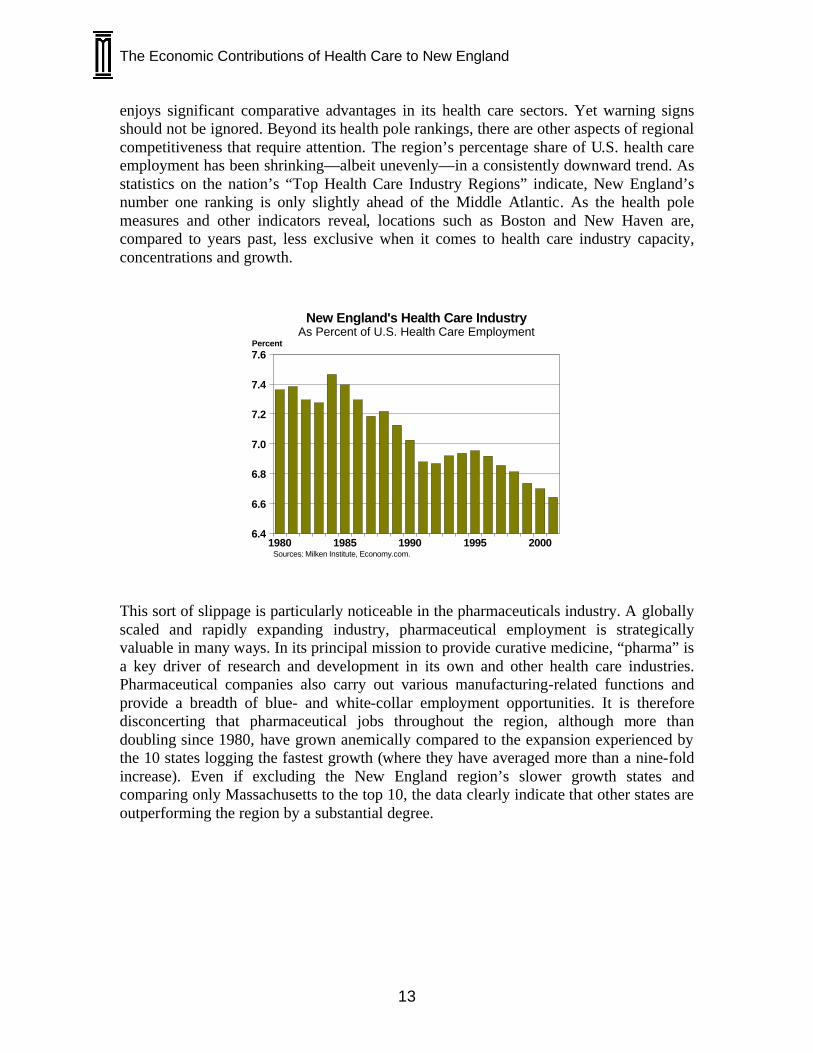
enjoys significant comparative advantages in its health care sectors. Yet warning signs should not be ignored. Beyond its health pole rankings, there are other aspects of regional competitiveness that require attention. The region’s percentage share of U.S. health care employment has been shrinking—albeit unevenly—in a consistently downward trend. As statistics on the nation’s “Top Health Care Industry Regions” indicate, New England’s number one ranking is only slightly ahead of the Middle Atlantic. As the health pole measures and other indicators reveal, locations such as Boston and New Haven are, compared to years past, less exclusive when it comes to health care industry capacity, concentrations and growth.
20001995199019851980
7.6
7.4
7.2
7.0
6.8
6.6
6.4
Percent
Sources: Milken Institute, Economy.com.
New England's Health Care IndustryAs Percent of U.S. Health Care Employment
This sort of slippage is particularly noticeable in the pharmaceuticals industry. A globally scaled and rapidly expanding industry, pharmaceutical employment is strategically valuable in many ways. In its principal mission to provide curative medicine, “pharma” is a key driver of research and development in its own and other health care industries. Pharmaceutical companies also carry out various manufacturing-related functions and provide a breadth of blue- and white-collar employment opportunities. It is therefore disconcerting that pharmaceutical jobs throughout the region, although more than doubling since 1980, have grown anemically compared to the expansion experienced by the 10 states logging the fastest growth (where they have averaged more than a nine-fold increase). Even if excluding the New England region’s slower growth states and comparing only Massachusetts to the top 10, the data clearly indicate that other states are outperforming the region by a substantial degree.

The Economic Contributions of Health Care to New England
14
20001995199019851980
1000
800
600
400
200
0
Index 1980 = 100
Sources: Milken Institute, Economy.com.
Pharmaceutical Employment Growth ComparisonMassachusetts vs. Top 10 Fastest Growing States
Top 10 StatesMassachusetts
20001995199019851980
1000
800
600
400
200
0
Index 1980 = 100
Sources: Milken Institute, Economy.com.
Pharmaceutical Employment Growth ComparisonNew England vs. Top 10 Fastest Growing States
Top 10 StatesNew England
The remainder of this section explores New England’s key health care industries with an encompassing and balanced perspective of their comparative strengths and weaknesses. Specifically, six industry groupings were examined:
a. Pharmaceuticals b. Research and Testing Services (Includes Biotechnology Research) c. Medical Devices d. Hospitals e. Medical Services & Health Insurance f. Other Health Care Services
The groupings encompass 13 industries (listed below) that are delineated by the U.S. government’s Standard Industrial Classification system.
SIC Industry283 Drugs384 Medical Instruments & Supplies632 Medical Service & Health Insurance801 Offices & Clinics of Medical Doctors802 Offices & Clinics of Dentists803 Offices of Osteopathic Physicians804 Offices of Other Health Care Practitioners805 Nursing & Personal Care Facilities806 Hospitals807 Medical & Dental Labs808 Home Health Care Services809 Health & Allied Services873 Research & Testing Services
Health Care - Industry ComponentsIncludes the Following SIC Categories:
This industry analysis begins with manufacturing and technology related sectors and moves to those that are predominantly service-oriented. The content of this section of the
The Economic Contributions of Health Care to New England
15
report is augmented by supporting graphs and tables. Additional graphic and tabular data can be found in the Appendix. Pharmaceuticals (Drugs)
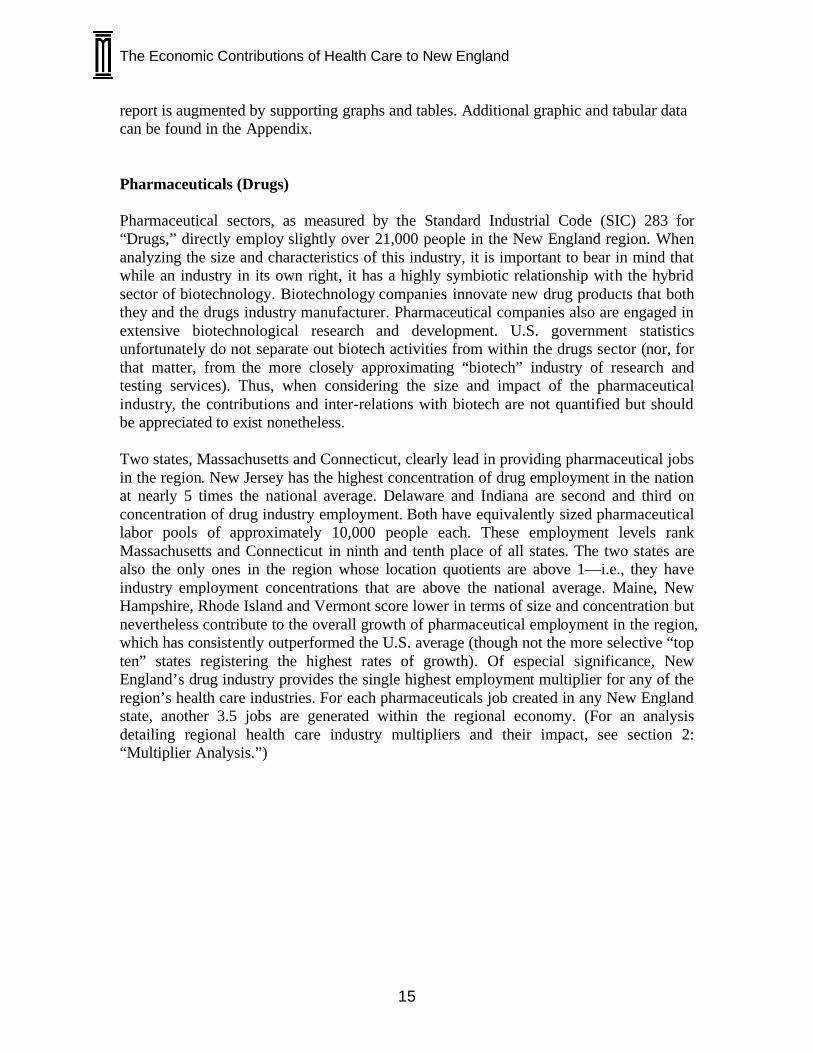
Pharmaceutical sectors, as measured by the Standard Industrial Code (SIC) 283 for “Drugs,” directly employ slightly over 21,000 people in the New England region. When analyzing the size and characteristics of this industry, it is important to bear in mind that while an industry in its own right, it has a highly symbiotic relationship with the hybrid sector of biotechnology. Biotechnology companies innovate new drug products that both they and the drugs industry manufacturer. Pharmaceutical companies also are engaged in extensive biotechnological research and development. U.S. government statistics unfortunately do not separate out biotech activities from within the drugs sector (nor, for that matter, from the more closely approximating “biotech” industry of research and testing services). Thus, when considering the size and impact of the pharmaceutical industry, the contributions and inter-relations with biotech are not quantified but should be appreciated to exist nonetheless. Two states, Massachusetts and Connecticut, clearly lead in providing pharmaceutical jobs in the region. New Jersey has the highest concentration of drug employment in the nation at nearly 5 times the national average. Delaware and Indiana are second and third on concentration of drug industry employment. Both have equivalently sized pharmaceutical labor pools of approximately 10,000 people each. These employment levels rank Massachusetts and Connecticut in ninth and tenth place of all states. The two states are also the only ones in the region whose location quotients are above 1—i.e., they have industry employment concentrations that are above the national average. Maine, New Hampshire, Rhode Island and Vermont score lower in terms of size and concentration but nevertheless contribute to the overall growth of pharmaceutical employment in the region, which has consistently outperformed the U.S. average (though not the more selective “top ten” states registering the highest rates of growth). Of especial significance, New England’s drug industry provides the single highest employment multiplier for any of the region’s health care industries. For each pharmaceuticals job created in any New England state, another 3.5 jobs are generated within the regional economy. (For an analysis detailing regional health care industry multipliers and their impact, see section 2: “Multiplier Analysis.”)
The Economic Contributions of Health Care to New England
16
Rank StateLocationQuotient
Emp.(Ths.)
1 New Jersey 4.96 48.32 Delaware 4.63 4.73 Indiana 2.58 18.34 Connecticut 2.39 9.75 Pennsylvania 2.03 28.06 North Carolina 1.61 15.37 Utah 1.50 3.98 Illinois 1.49 21.69 Massachusetts 1.24 10.0
10 Michigan 1.23 13.722 Maine 0.44 0.625 New Hampshire 0.41 0.640 Vermont 0.10 0.141 Rhode Island 0.10 0.1
Drugs
Sources: Economy.com, Milken Institute.
States Ranked by Employment Concentration, 2001
Rank State '80-'00 '80-'90 '90-'00 '96-'01 '00-'011 Vermont 2650.0 0.0 2650.0 316.7 36.42 Kentucky 1199.3 -2.8 1236.2 157.4 18.73 New Hampshire 1561.8 76.5 841.7 104.2 11.04 Washington 926.2 166.4 285.2 78.2 8.65 Utah 246.2 -28.3 382.6 75.4 7.06 Alabama 175.8 -8.1 200.0 58.3 6.47 Oregon 244.1 -14.1 300.7 57.4 14.78 West Virginia 334.7 63.8 165.4 54.5 7.69 Delaware 498.9 91.2 213.2 51.6 9.4
10 California 120.0 26.8 73.4 50.9 4.513 Massachusetts 201.7 5.8 185.2 38.6 5.220 Connecticut 81.2 41.4 28.2 20.7 0.240 Maine 116.6 -4.1 125.8 -15.8 -6.547 Rhode Island -57.5 -17.0 -48.8 -42.3 2.7
New England 126.1 26.1 79.4 27.9 2.7United States 59.0 20.9 31.5 22.9 2.6
Employment Growth, Ranked by 1996-2001 GrowthDrugs
Sources: Economy.com, Milken Institute.
Percent (%) Growth by Time Period
On a positive note, industry leaders Massachusetts and Connecticut have enjoyed relatively solid growth rates. Massachusetts’ overall level of expansion has been the highest, with the state experiencing explosive, triple-digit increases in pharmaceutical employment since 1980. Growth in the 1980s started out at a modest, but still robust, 5.8 percent. It then rocketed to the level of some 185 percent for the 1990s. For the past five years (1996-2001) employment has expanded nearly 40 percent. For the most recent time period on record, 2000-2001, growth has tapered down to a rate of 5.2 percent. Such a slowdown is not surprising given recent recessionary macroeconomic conditions and heavy curtailment of investment activity in high-technology sectors. Regardless of such cyclically based fluctuations, the overall picture of employment in Massachusetts pharmaceutical sectors is unquestionably one of growth and increasing importance to the population. For every one Massachusetts resident employed by the drug industry in 1980, there are more than three employed today. In a less positive light, however, given Massachusetts’ strong research and innovation infrastructure, its relative performance should be stronger. As already mentioned, it lags the top 10 states in growth. Massachusetts’ higher business cost and tax structure place it at a competitive disadvantage versus other locations where pharmaceutical firms establish large-scale production operations after developing a market for their drug applications. Better retention efforts aimed at building manufacturing operations would more fully capture the economic value of the strong research capabilities in Massachusetts. It would also enhance the job and income generated by research in the region. Especially disconcerting for Massachusetts is that another high-cost state—California—experienced stronger job growth from 1996 to 2001. Connecticut’s pharmaceutical sectors also have experienced high growth though not as explosively strong as that for Massachusetts. Connecticut’s biggest growth phase was in the 1980s (41.4 percent). Its growth rate was about half that from 1996 to 2001 and registered a negligible 0.2 percent between 2000 and 2001. Unlike Massachusetts, Connecticut entered the 1980s with a higher employment base which has grown even though the industry has a relatively mature presence.
The Economic Contributions of Health Care to New England
17
The maturing of the employment growth cycle in the state’s drug industry also ought to be considered in the context of Connecticut’s increasing gains in R&D investment for its overall “bioscience” cluster. Between 1995 and 2000, the state’s collection of pharmaceutical and biotech-related enterprises and institutes more than doubled to a level slightly above $3 billion. 4 This type of forward investment bodes well for the state increasing its opportunities to capitalize on new drug developments and thus boost job growth. The next largest pharmaceutical employers are Maine and New Hampshire, each employing some 600 workers directly. Both have been net gainers of jobs. Since the 1980s, employment figures have more than doubled in Maine and leapt by a factor of nearly 17 in New Hampshire. New Hampshire’s ability to maintain high growth—with jobs still expanding by a healthy 11 percent during the generally tamer 2000-2001 time period—is also encouraging. Vermont and Rhode Island have relatively small-sized drug industry workforces of around 100 employees. Thus Vermont’s exceptional (2,650 percent) growth, though a positive sign, needs to be interpreted as coming from a less established base. Rhode Island, though enjoying slight (2.7 percent) growth 2000-2001, has a labor pool that is nearly half of what it was in 1980. Given that pharmaceutical employment in the Ocean State has consistently declined throughout the 1980s and the first and second halves of the 1990s, data supports the notion that the drug industry has endured enormous pressures in the state. Rhode Island ranks almost last in the U.S. at 47th place. A potential bright spot comes from recent developments such as Rhode Island-based investments in drug manufacturing by the biotech giant Amgen—a sign that the state’s decline as a drug manufacturing force has the potential to be reversed.
4 Connecticut United for Research Excellence, Bioscience: Leading the Way to a Stronger Economy (2001): 2.
The Economic Contributions of Health Care to New England
18
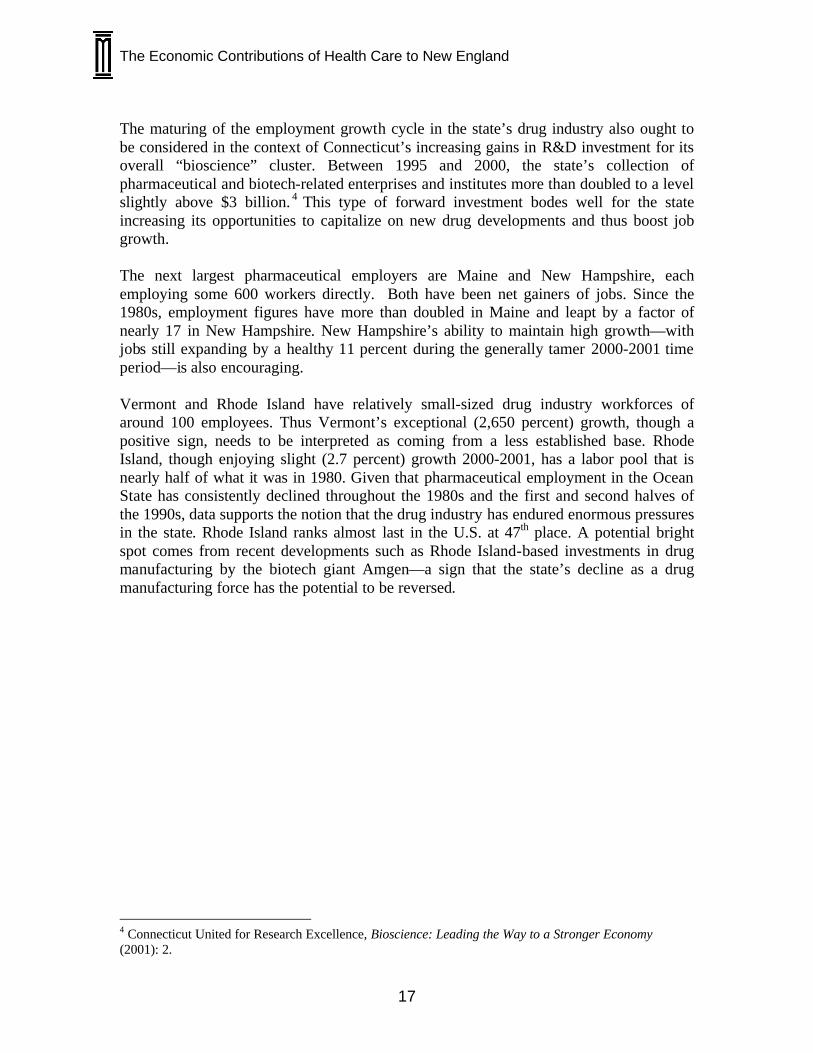
Another encouraging sign for Rhode Island comes from its shared top-ten ranking as a pharmaceuticals industry health pole. The New London, Connecticut-Norwich, Rhode Island concentration of pharmaceutical-related biotechnology firms underpins this strong showing. It should be noted that the state’s ability to place so well in the rankings, however, is due in large part to its bordering on Connecticut, which shares not only the top ten health pole spot with Rhode Island but also occupies the 13th position with its New Haven-Meriden cluster. The New London-Norwich and New Haven-Meriden health
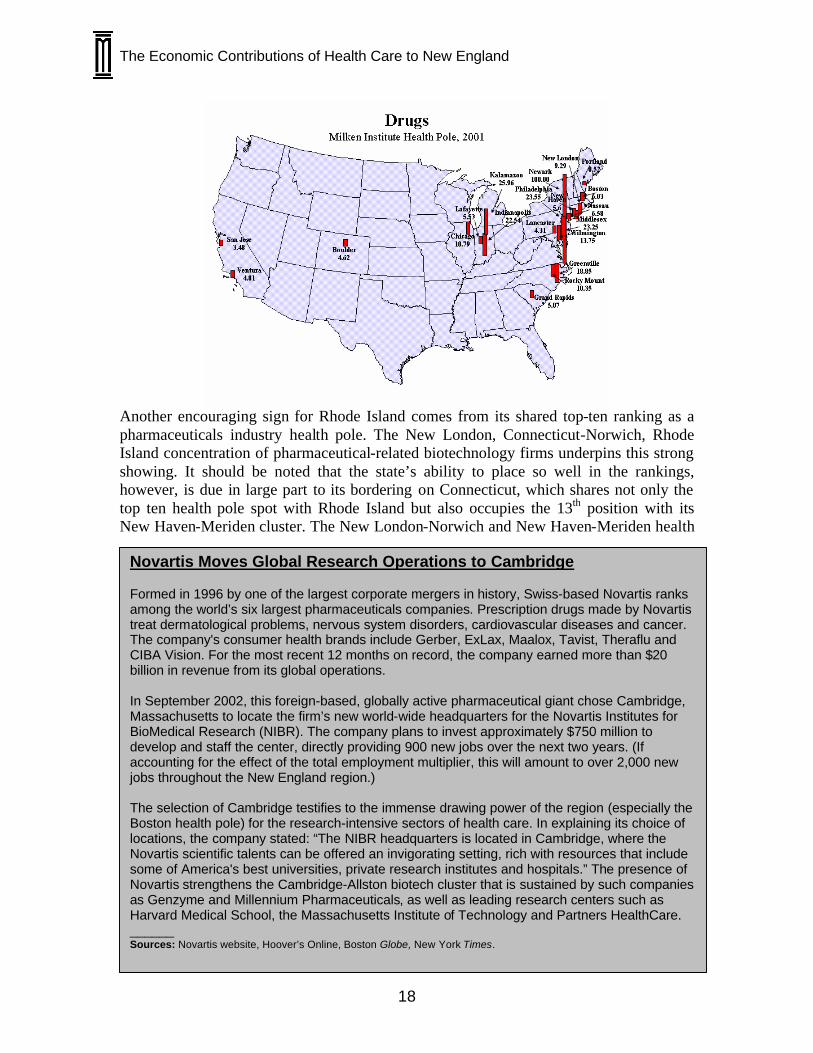
Novartis Moves Global Research Operations to Cambridge Formed in 1996 by one of the largest corporate mergers in history, Swiss-based Novartis ranks among the world’s six largest pharmaceuticals companies. Prescription drugs made by Novartis treat dermatological problems, nervous system disorders, cardiovascular diseases and cancer. The company's consumer health brands include Gerber, ExLax, Maalox, Tavist, Theraflu and CIBA Vision. For the most recent 12 months on record, the company earned more than $20 billion in revenue from its global operations. In September 2002, this foreign-based, globally active pharmaceutical giant chose Cambridge, Massachusetts to locate the firm’s new world-wide headquarters for the Novartis Institutes for BioMedical Research (NIBR). The company plans to invest approximately $750 million to develop and staff the center, directly providing 900 new jobs over the next two years. (If accounting for the effect of the total employment multiplier, this will amount to over 2,000 new jobs throughout the New England region.) The selection of Cambridge testifies to the immense drawing power of the region (especially the Boston health pole) for the research-intensive sectors of health care. In explaining its choice of locations, the company stated: “The NIBR headquarters is located in Cambridge, where the Novartis scientific talents can be offered an invigorating setting, rich with resources that include some of America's best universities, private research institutes and hospitals.” The presence of Novartis strengthens the Cambridge-Allston biotech cluster that is sustained by such companies as Genzyme and Millennium Pharmaceuticals, as well as leading research centers such as Harvard Medical School, the Massachusetts Institute of Technology and Partners HealthCare. ______ Sources: Novartis website, Hoover’s Online, Boston Globe, New York Times.
The Economic Contributions of Health Care to New England
19
poles are adjacent concentrations and rely heavily on the intellectual assets of Connecticut’s bioscience complex. This is yet another example of regional interdependencies and exemplifies how success in one state can provide spillover benefits into another. Boston, which ranks as the nation’s 12th largest health pole for drugs, represents New England’s other top twenty entrant in this measure. (A complete listing of top 20 U.S. health pole rankings for the drug industry can be found in the Appendix.) With regard to other regional health poles, the Newark, New Jersey metro is the national pharmaceutical leader, with many leading firms’ headquarters based in that MSA. Kalamazoo-Battle Creek, Michigan is second as a drug center. Philadelphia is third, followed by Middlesex-Somerset-Hunterdon, New Jersey and Indianapolis, Indiana.
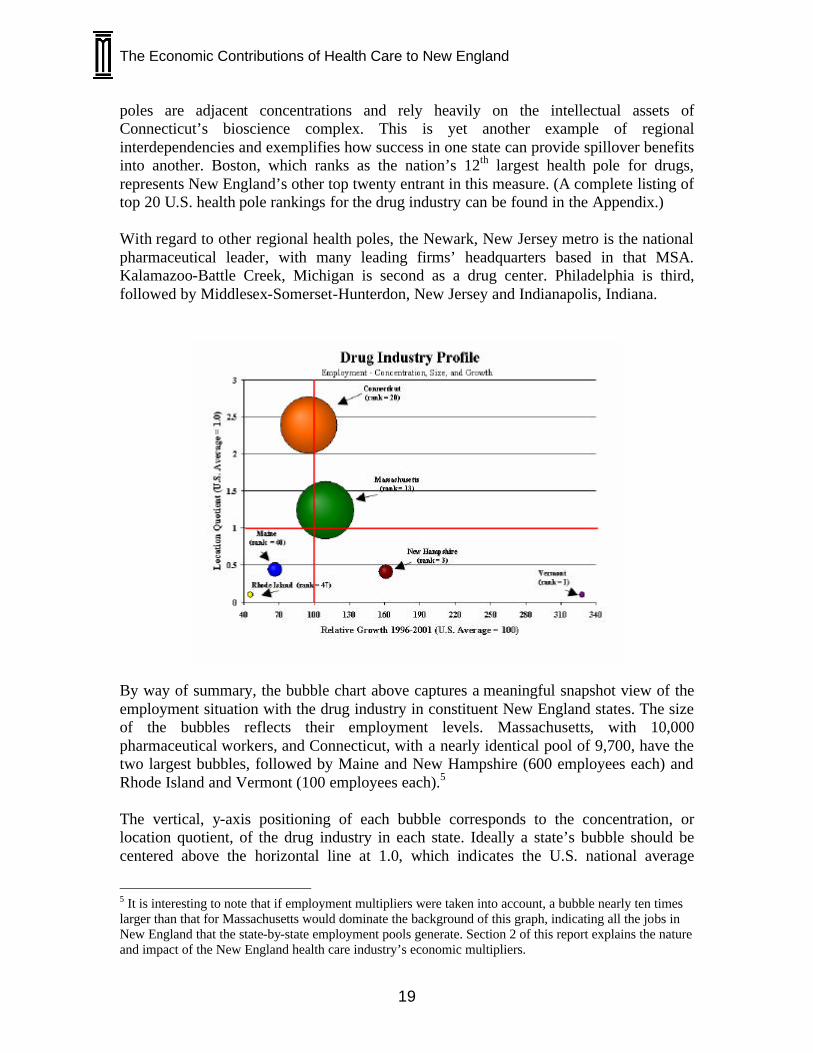
By way of summary, the bubble chart above captures a meaningful snapshot view of the employment situation with the drug industry in constituent New England states. The size of the bubbles reflects their employment levels. Massachusetts, with 10,000 pharmaceutical workers, and Connecticut, with a nearly identical pool of 9,700, have the two largest bubbles, followed by Maine and New Hampshire (600 employees each) and Rhode Island and Vermont (100 employees each).5 The vertical, y-axis positioning of each bubble corresponds to the concentration, or location quotient, of the drug industry in each state. Ideally a state’s bubble should be centered above the horizontal line at 1.0, which indicates the U.S. national average
5 It is interesting to note that if employment multipliers were taken into account, a bubble nearly ten times larger than that for Massachusetts would dominate the background of this graph, indicating all the jobs in New England that the state-by-state employment pools generate. Section 2 of this report explains the nature and impact of the New England health care industry’s economic multipliers.
The Economic Contributions of Health Care to New England
20
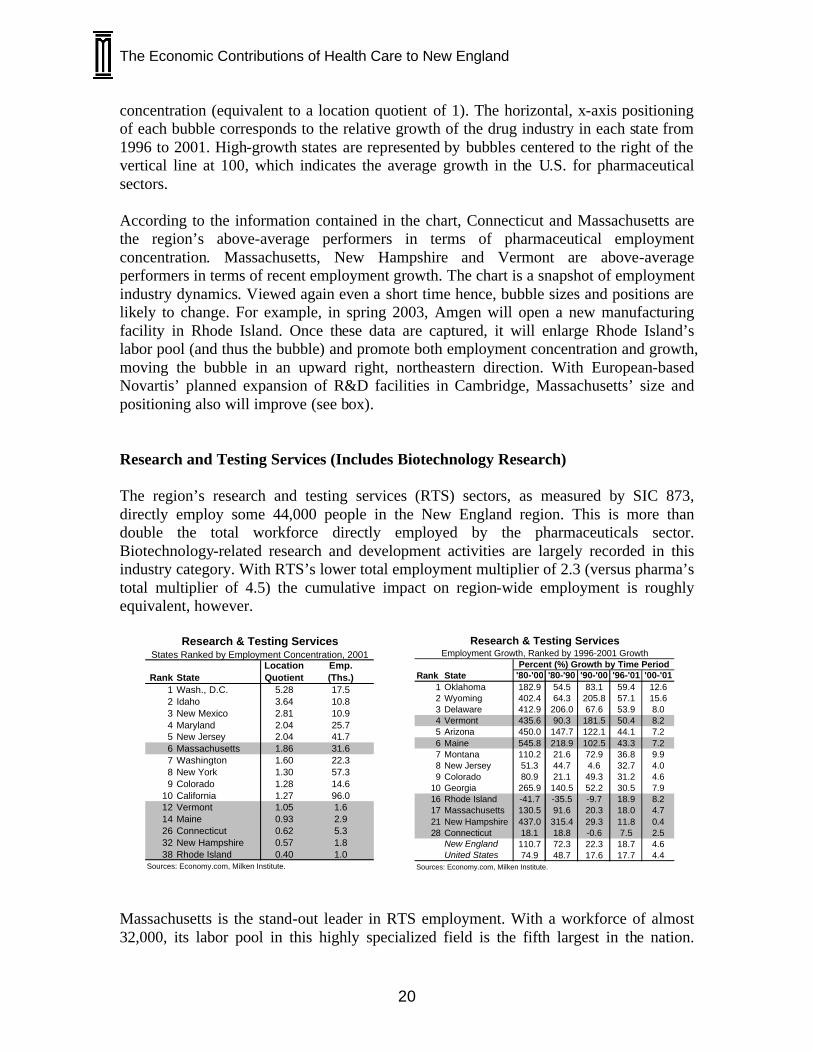
concentration (equivalent to a location quotient of 1). The horizontal, x-axis positioning of each bubble corresponds to the relative growth of the drug industry in each state from 1996 to 2001. High-growth states are represented by bubbles centered to the right of the vertical line at 100, which indicates the average growth in the U.S. for pharmaceutical sectors. According to the information contained in the chart, Connecticut and Massachusetts are the region’s above-average performers in terms of pharmaceutical employment concentration. Massachusetts, New Hampshire and Vermont are above-average performers in terms of recent employment growth. The chart is a snapshot of employment industry dynamics. Viewed again even a short time hence, bubble sizes and positions are likely to change. For example, in spring 2003, Amgen will open a new manufacturing facility in Rhode Island. Once these data are captured, it will enlarge Rhode Island’s labor pool (and thus the bubble) and promote both employment concentration and growth, moving the bubble in an upward right, northeastern direction. With European-based Novartis’ planned expansion of R&D facilities in Cambridge, Massachusetts’ size and positioning also will improve (see box). Research and Testing Services (Includes Biotechnology Research) The region’s research and testing services (RTS) sectors, as measured by SIC 873, directly employ some 44,000 people in the New England region. This is more than double the total workforce directly employed by the pharmaceuticals sector. Biotechnology-related research and development activities are largely recorded in this industry category. With RTS’s lower total employment multiplier of 2.3 (versus pharma’s total multiplier of 4.5) the cumulative impact on region-wide employment is roughly equivalent, however.
Rank StateLocationQuotient
Emp.(Ths.)
1 Wash., D.C. 5.28 17.52 Idaho 3.64 10.83 New Mexico 2.81 10.94 Maryland 2.04 25.75 New Jersey 2.04 41.76 Massachusetts 1.86 31.67 Washington 1.60 22.38 New York 1.30 57.39 Colorado 1.28 14.6
10 California 1.27 96.012 Vermont 1.05 1.614 Maine 0.93 2.926 Connecticut 0.62 5.332 New Hampshire 0.57 1.838 Rhode Island 0.40 1.0
Sources: Economy.com, Milken Institute.
Research & Testing ServicesStates Ranked by Employment Concentration, 2001
Rank State '80-'00 '80-'90 '90-'00 '96-'01 '00-'011 Oklahoma 182.9 54.5 83.1 59.4 12.62 Wyoming 402.4 64.3 205.8 57.1 15.63 Delaware 412.9 206.0 67.6 53.9 8.04 Vermont 435.6 90.3 181.5 50.4 8.25 Arizona 450.0 147.7 122.1 44.1 7.26 Maine 545.8 218.9 102.5 43.3 7.27 Montana 110.2 21.6 72.9 36.8 9.98 New Jersey 51.3 44.7 4.6 32.7 4.09 Colorado 80.9 21.1 49.3 31.2 4.6
10 Georgia 265.9 140.5 52.2 30.5 7.916 Rhode Island -41.7 -35.5 -9.7 18.9 8.217 Massachusetts 130.5 91.6 20.3 18.0 4.721 New Hampshire 437.0 315.4 29.3 11.8 0.428 Connecticut 18.1 18.8 -0.6 7.5 2.5
New England 110.7 72.3 22.3 18.7 4.6United States 74.9 48.7 17.6 17.7 4.4
Sources: Economy.com, Milken Institute.
Research & Testing ServicesEmployment Growth, Ranked by 1996-2001 Growth
Percent (%) Growth by Time Period
Massachusetts is the stand-out leader in RTS employment. With a workforce of almost 32,000, its labor pool in this highly specialized field is the fifth largest in the nation.
The Economic Contributions of Health Care to New England
21
Although this number dwarfs that of the RTS employment levels in other New England states—from the next largest employer, Connecticut at 5,300 workers, to the smallest employer, Rhode Island at 1,000—it is significant that no state employs fewer than 1,000 RTS workers. Given the high-end, knowledge-intensive nature of the industry and, moreover, its strategic importance to other health care sectors, the inherent value of state-based RTS labor pools to regional economic vitality goes beyond what the numbers indicate on their own. With the exception of Rhode Island, long-term growth in research and testing services employment throughout New England has generally been robust. The largest RTS state, Massachusetts, has expanded jobs by slightly more than 130 percent since 1980. Although the rate of growth slowed in the 1990s, it has nevertheless continued at a healthy pace, registering 4.7 percent in the most recent yearly interval measured (2000-2001). Even higher recent growth is evident in smaller states: the labor force in Vermont has been expanding by 8.2 percent, in Maine by 7.2 percent, and in Rhode Island, breaking its overall negative trend, by 8.2 percent. Employment region-wide has more than doubled since 1980, 35 percent higher than the national average. Recent growth rates also compare favorably to the rate of increase in pharmaceutical industry-based R&D expenditures, which for 1995-2000 are estimated at slightly over 11.3 percent.6
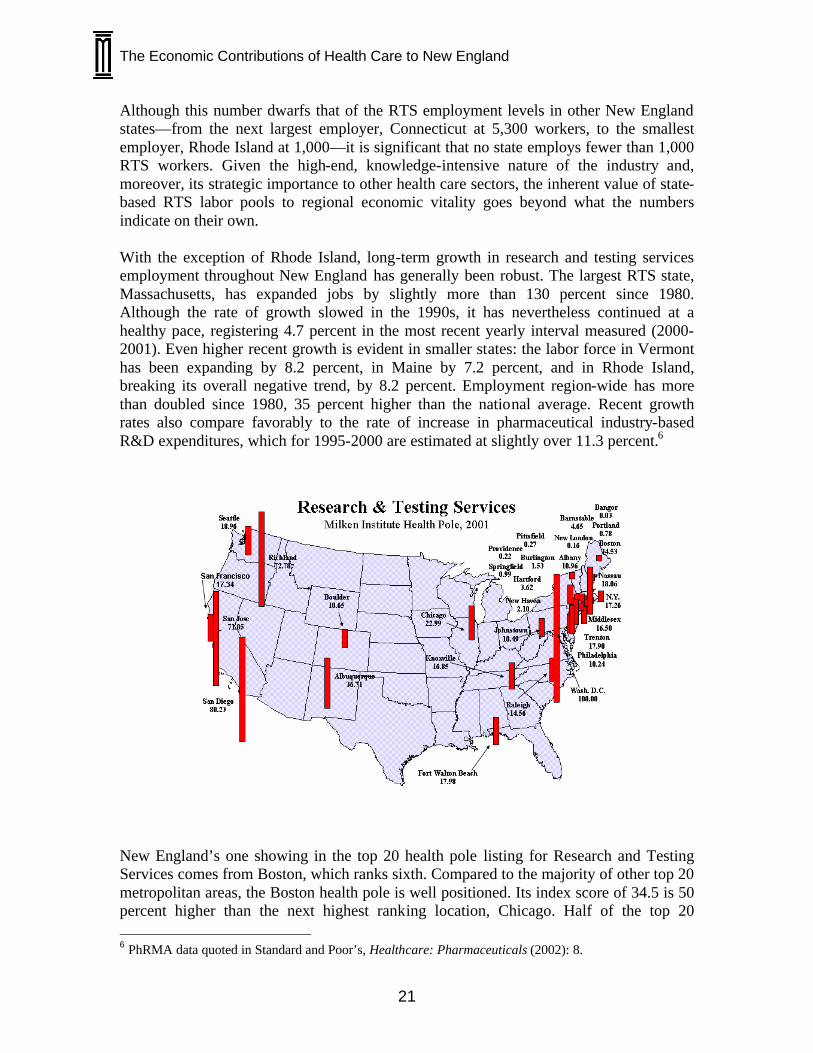
New England’s one showing in the top 20 health pole listing for Research and Testing Services comes from Boston, which ranks sixth. Compared to the majority of other top 20 metropolitan areas, the Boston health pole is well positioned. Its index score of 34.5 is 50 percent higher than the next highest ranking location, Chicago. Half of the top 20 6 PhRMA data quoted in Standard and Poor’s, Healthcare: Pharmaceuticals (2002): 8.

The Economic Contributions of Health Care to New England
22
locations in fact only score about half as high as Boston. Boston’s position vis-à-vis the top five, however, illustrates more will have to be done if the health pole is to improve itself amongst its leading resource competitors. The benchmark, greater Washington D.C. RTS health pole (extending through the District of Columbia, Maryland, Virginia, and West Virginia) scores almost three times higher than Boston (which encompasses territory in both Massachusetts and New Hampshire). The California health poles of San Diego and San Jose score twice as high as Boston. Finding ways to increase employment share and concentration of New England’s top ranking research health pole will be critical to improving performance in this measure.
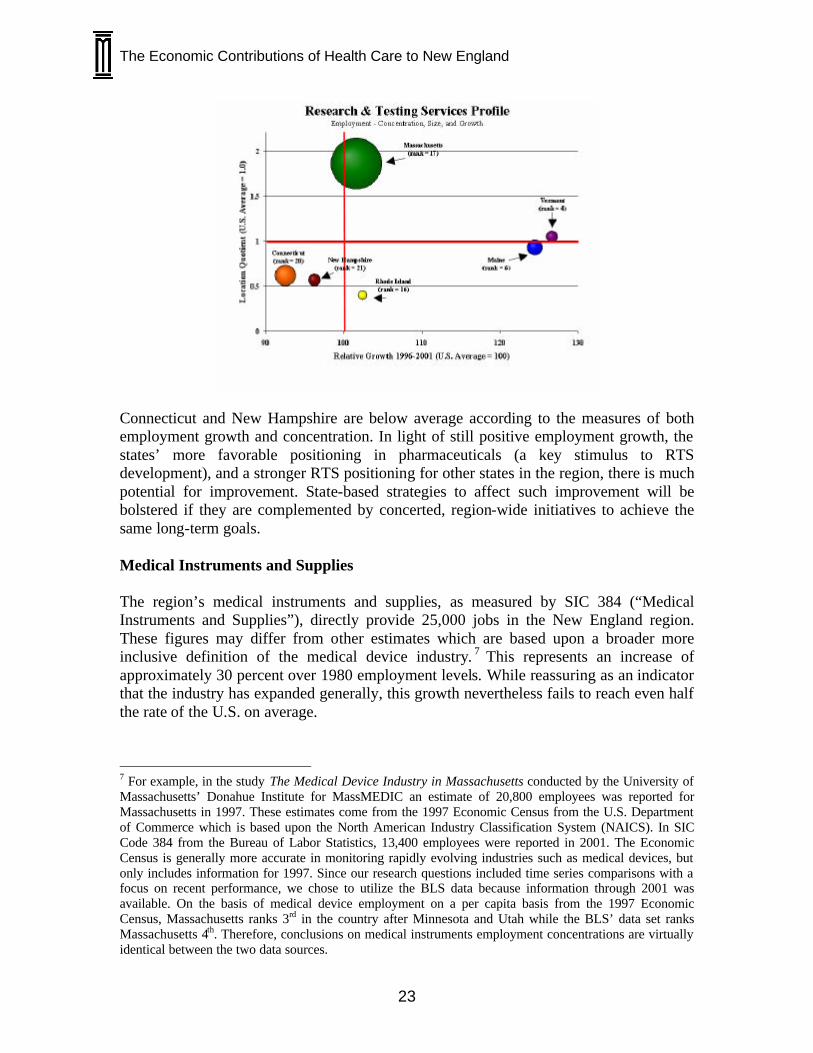
The bubble chart snapshot of the region’s RTS sectors reveals the state-by-state dynamics at play. The orb for Massachusetts looms large and in the positive territories of the grid: high employment concentration and above average growth. Vermont and Maine occupy roughly equal positions in terms of growth, which—at almost 30 percent above the national average—respectively ranks them as the fourth and sixth fastest growing biotech employers in the US. Both states have employment concentrations at about the national average; if their growth in biotechnology continues, their location quotients should likewise increase. Rhode Island has above-average growth but below-average (by more than 50 percent, in fact) employment concentration.
Amgen Manufactures in Rhode Island The global biotechnology leader, Amgen, is based in Thousand Oaks, near Los Angeles, but the company operates what is one of the world’s most advanced cell manufacturing centers in West Greenwich, Rhode Island. The Rhode Island manufacturing site is comprised of a state-of-the-art 250,000 square foot structure housing eight 8,000-liter bioreactors that produce Enbrel, a blockbuster drug that treats rheumatoid arthritis. In human terms, Enbrel has been used to help some 130,000 arthritis sufferers worldwide. Amgen’s Enbrel facilities, which represent the company’s largest manufacturing operation, also employ over 550 people. These employees were instrumental to Amgen after it took over the manufacturing site from Immunex in 2002. Worker efforts not only ensured a successful transition of management structures but also enabled the company to retrofit the facility to its present configuration and receive FDA approval in record time. Amgen is building a second facility that is expected to employ several hundred additional workers. As one observer notes about the impact of Amgen’s expanding operations: “The location of the complex on Route 95—visible to East Coast traffic—makes it a perfect calling card for Rhode Island.” State economic development officials have made attracting such biopharmaceutical manufacturing operations a priority and Amgen’s growing presence provides an indication of the sort of results that are possible. In a broader sense, Rhode Island’s success with Amgen further testifies to how smaller, less populous states lacking jurisdiction over the tremendous resources of states like Massachusetts and Connecticut nevertheless can leverage their position as part of the greater New England region’s asset base in health care industries. ______ Sources: Amgen website, Drug Week, Providence Journal.
The Economic Contributions of Health Care to New England
23
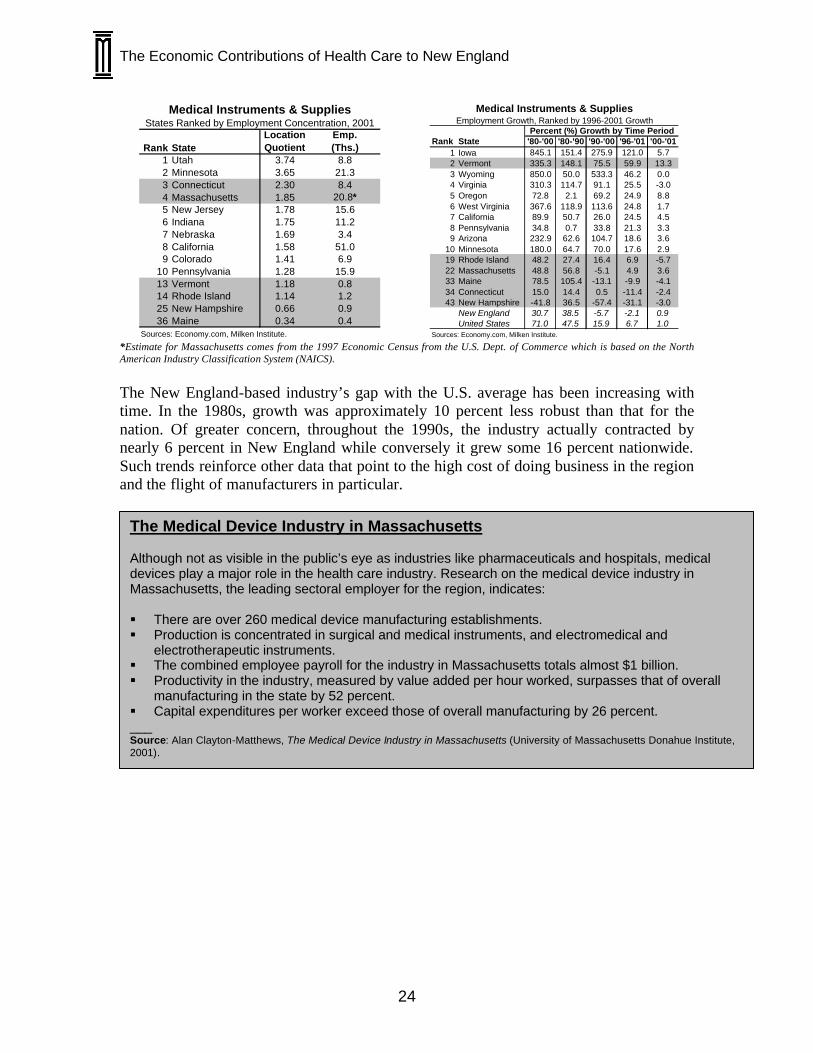
Connecticut and New Hampshire are below average according to the measures of both employment growth and concentration. In light of still positive employment growth, the states’ more favorable positioning in pharmaceuticals (a key stimulus to RTS development), and a stronger RTS positioning for other states in the region, there is much potential for improvement. State-based strategies to affect such improvement will be bolstered if they are complemented by concerted, region-wide initiatives to achieve the same long-term goals. Medical Instruments and Supplies The region’s medical instruments and supplies, as measured by SIC 384 (“Medical Instruments and Supplies”), directly provide 25,000 jobs in the New England region. These figures may differ from other estimates which are based upon a broader more inclusive definition of the medical device industry. 7 This represents an increase of approximately 30 percent over 1980 employment levels. While reassuring as an indicator that the industry has expanded generally, this growth nevertheless fails to reach even half the rate of the U.S. on average.
7 For example, in the study The Medical Device Industry in Massachusetts conducted by the University of Massachusetts’ Donahue Institute for MassMEDIC an estimate of 20,800 employees was reported for Massachusetts in 1997. These estimates come from the 1997 Economic Census from the U.S. Department of Commerce which is based upon the North American Industry Classification System (NAICS). In SIC Code 384 from the Bureau of Labor Statistics, 13,400 employees were reported in 2001. The Economic Census is generally more accurate in monitoring rapidly evolving industries such as medical devices, but only includes information for 1997. Since our research questions included time series comparisons with a focus on recent performance, we chose to utilize the BLS data because information through 2001 was available. On the basis of medical device employment on a per capita basis from the 1997 Economic Census, Massachusetts ranks 3rd in the country after Minnesota and Utah while the BLS’ data set ranks Massachusetts 4th. Therefore, conclusions on medical instruments employment concentrations are virtually identical between the two data sources.
The Economic Contributions of Health Care to New England
24
Rank StateLocationQuotient
Emp.(Ths.)
1 Utah 3.74 8.82 Minnesota 3.65 21.33 Connecticut 2.30 8.44 Massachusetts 1.85 20.8*5 New Jersey 1.78 15.66 Indiana 1.75 11.27 Nebraska 1.69 3.48 California 1.58 51.09 Colorado 1.41 6.9
10 Pennsylvania 1.28 15.913 Vermont 1.18 0.814 Rhode Island 1.14 1.225 New Hampshire 0.66 0.936 Maine 0.34 0.4
Sources: Economy.com, Milken Institute.
States Ranked by Employment Concentration, 2001Medical Instruments & Supplies
Rank State '80-'00 '80-'90 '90-'00 '96-'01 '00-'011 Iowa 845.1 151.4 275.9 121.0 5.72 Vermont 335.3 148.1 75.5 59.9 13.33 Wyoming 850.0 50.0 533.3 46.2 0.04 Virginia 310.3 114.7 91.1 25.5 -3.05 Oregon 72.8 2.1 69.2 24.9 8.86 West Virginia 367.6 118.9 113.6 24.8 1.77 California 89.9 50.7 26.0 24.5 4.58 Pennsylvania 34.8 0.7 33.8 21.3 3.39 Arizona 232.9 62.6 104.7 18.6 3.6
10 Minnesota 180.0 64.7 70.0 17.6 2.919 Rhode Island 48.2 27.4 16.4 6.9 -5.722 Massachusetts 48.8 56.8 -5.1 4.9 3.633 Maine 78.5 105.4 -13.1 -9.9 -4.134 Connecticut 15.0 14.4 0.5 -11.4 -2.443 New Hampshire -41.8 36.5 -57.4 -31.1 -3.0
New England 30.7 38.5 -5.7 -2.1 0.9United States 71.0 47.5 15.9 6.7 1.0
Sources: Economy.com, Milken Institute.
Medical Instruments & SuppliesEmployment Growth, Ranked by 1996-2001 Growth
Percent (%) Growth by Time Period
*Estimate for Massachusetts comes from the 1997 Economic Census from the U.S. Dept. of Commerce which is based on the North American Industry Classification System (NAICS).
The New England-based industry’s gap with the U.S. average has been increasing with time. In the 1980s, growth was approximately 10 percent less robust than that for the nation. Of greater concern, throughout the 1990s, the industry actually contracted by nearly 6 percent in New England while conversely it grew some 16 percent nationwide. Such trends reinforce other data that point to the high cost of doing business in the region and the flight of manufacturers in particular.
The Medical Device Industry in Massachusetts Although not as visible in the public’s eye as industries like pharmaceuticals and hospitals, medical devices play a major role in the health care industry. Research on the medical device industry in Massachusetts, the leading sectoral employer for the region, indicates: § There are over 260 medical device manufacturing establishments. § Production is concentrated in surgical and medical instruments, and electromedical and
electrotherapeutic instruments. § The combined employee payroll for the industry in Massachusetts totals almost $1 billion. § Productivity in the industry, measured by value added per hour worked, surpasses that of overall
manufacturing in the state by 52 percent. § Capital expenditures per worker exceed those of overall manufacturing by 26 percent. ___ Source: Alan Clayton-Matthews, The Medical Device Industry in Massachusetts (University of Massachusetts Donahue Institute, 2001).
The Economic Contributions of Health Care to New England
25
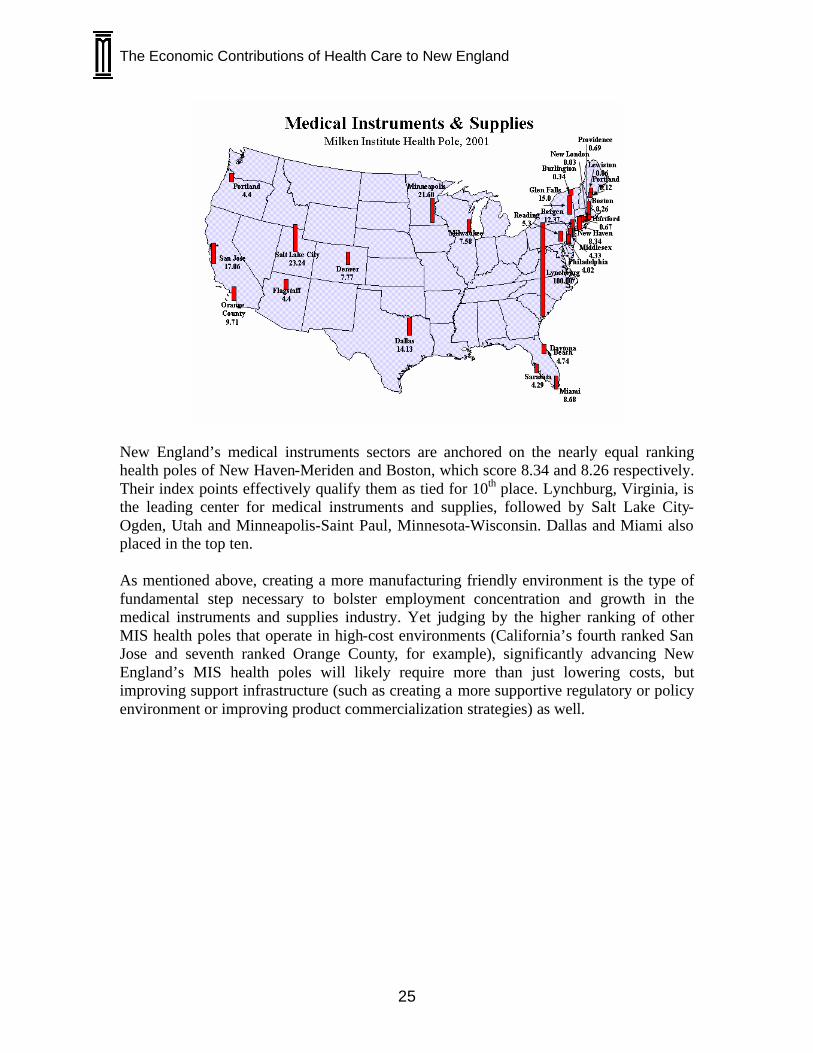
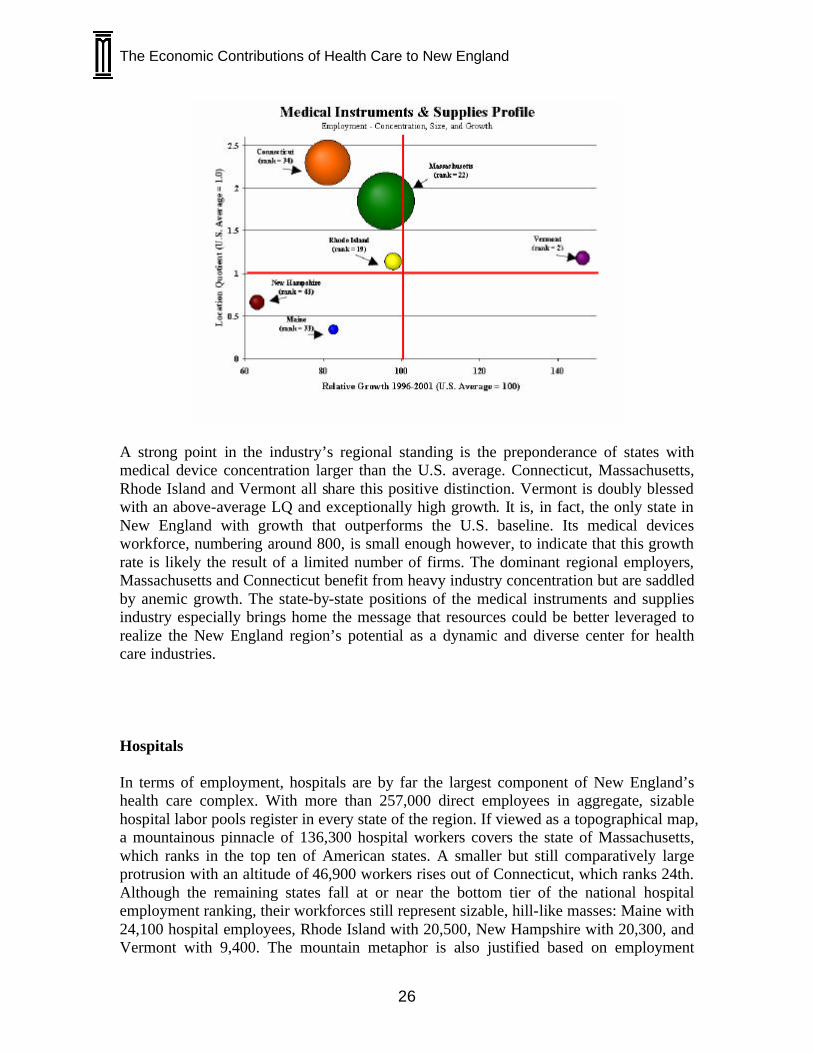
New England’s medical instruments sectors are anchored on the nearly equal ranking health poles of New Haven-Meriden and Boston, which score 8.34 and 8.26 respectively. Their index points effectively qualify them as tied for 10th place. Lynchburg, Virginia, is the leading center for medical instruments and supplies, followed by Salt Lake City-Ogden, Utah and Minneapolis-Saint Paul, Minnesota-Wisconsin. Dallas and Miami also placed in the top ten. As mentioned above, creating a more manufacturing friendly environment is the type of fundamental step necessary to bolster employment concentration and growth in the medical instruments and supplies industry. Yet judging by the higher ranking of other MIS health poles that operate in high-cost environments (California’s fourth ranked San Jose and seventh ranked Orange County, for example), significantly advancing New England’s MIS health poles will likely require more than just lowering costs, but improving support infrastructure (such as creating a more supportive regulatory or policy environment or improving product commercialization strategies) as well.
The Economic Contributions of Health Care to New England
26
A strong point in the industry’s regional standing is the preponderance of states with medical device concentration larger than the U.S. average. Connecticut, Massachusetts, Rhode Island and Vermont all share this positive distinction. Vermont is doubly blessed with an above-average LQ and exceptionally high growth. It is, in fact, the only state in New England with growth that outperforms the U.S. baseline. Its medical devices workforce, numbering around 800, is small enough however, to indicate that this growth rate is likely the result of a limited number of firms. The dominant regional employers, Massachusetts and Connecticut benefit from heavy industry concentration but are saddled by anemic growth. The state-by-state positions of the medical instruments and supplies industry especially brings home the message that resources could be better leveraged to realize the New England region’s potential as a dynamic and diverse center for health care industries. Hospitals In terms of employment, hospitals are by far the largest component of New England’s health care complex. With more than 257,000 direct employees in aggregate, sizable hospital labor pools register in every state of the region. If viewed as a topographical map, a mountainous pinnacle of 136,300 hospital workers covers the state of Massachusetts, which ranks in the top ten of American states. A smaller but still comparatively large protrusion with an altitude of 46,900 workers rises out of Connecticut, which ranks 24th. Although the remaining states fall at or near the bottom tier of the national hospital employment ranking, their workforces still represent sizable, hill-like masses: Maine with 24,100 hospital employees, Rhode Island with 20,500, New Hampshire with 20,300, and Vermont with 9,400. The mountain metaphor is also justified based on employment

The Economic Contributions of Health Care to New England
27
concentrations, which for nearly every state is at or above the national average. The most stand-out states are Rhode Island, which is 38 percent above the national average, Massachusetts, 32 percent above, and Maine, 28 percent. Only Connecticut’s LQ, at 0.9 falls below 1, and then just slightly.
Rank StateLocationQuotient
Emp.(Ths.)
1 North Dakota 1.64 16.92 West Virginia 1.57 35.73 Montana 1.47 18.04 Pennsylvania 1.46 257.85 South Dakota 1.45 17.16 Rhode Island 1.38 20.57 Massachusetts 1.32 136.38 Maine 1.28 24.19 Michigan 1.25 178.5
10 New Jersey 1.24 154.122 New Hampshire 1.05 20.327 Vermont 1.01 9.431 Connecticut 0.90 46.9
Sources: Economy.com, Milken Institute.
Hospital IndustryStates Ranked by Employment Concentration, 2001
Rank State '80-'00 '80-'90 '90-'00 '96-'01 '00-'011 Minnesota 47.4 7.8 36.7 38.0 5.02 North Carolina 111.3 54.1 37.1 30.7 4.93 Nevada 178.8 80.3 54.7 26.8 5.64 South Carolina 123.0 58.4 40.8 26.7 6.65 Georgia 309.1 126.5 80.6 26.0 6.56 Idaho 87.3 27.6 46.8 21.9 6.47 Alaska 124.1 83.2 22.4 19.5 4.38 Indiana 57.4 28.3 22.7 16.1 4.39 Nebraska 33.8 13.5 17.9 15.7 3.5
10 South Dakota 76.7 34.7 31.2 15.3 2.917 Maine 36.4 18.8 14.8 11.8 2.029 New Hampshire 81.3 65.9 9.3 6.3 2.736 Massachusetts 16.8 12.2 4.1 3.5 1.744 Vermont 31.8 28.8 2.3 0.5 0.545 Rhode Island 30.7 27.3 2.7 -0.8 1.251 Connecticut 7.3 31.1 -18.2 -12.7 -2.0
New England 21.3 21.2 0.0 0.5 1.0United States 45.1 29.0 12.4 7.5 2.7
Sources: Economy.com, Milken Institute.
HospitalsEmployment Growth, Ranked by 1996-2001 Growth
Percent (%) Growth by Time Period
The Economic Contributions of Health Care to New England
28
For the most part, hospital employment throughout the region has been growing, though with the exception of Maine and New Hampshire, no state (nor the region overall) has exceeded national average rates of growth. With this category in particular, more moderate growth is not necessarily a bad sign when coupled with such factors as demographic trends and improved efficiencies in health care delivery (be that in the form of increased hospital-based productivity or innovative forms of nonhospital-based health care provision). A unique feature of the hospital industry is that it is more service and less technology oriented, per se. The industries examined so far—drugs, research and testing services and medical devices—primarily focus on technology as both an input and output of operations. Hospitals, on the other hand, may be technologically intensive, but human beings constitute their chief input and better human health constitutes their chief output. Hospitals succeed based on how well they “treat” people (in the full meaning of the word), not on how well they process technology.
Massachusetts Hospitals Among the various health care clusters that dot the New England landscape, one of the most outstanding concentrations of resources and expertise comes from hospitals and affiliated institutions in Massachusetts. Boston boasts three top-rated medical schools: those at Boston University, Tufts, and Harvard. Worcester’s UMass Medical School and an additional 18 teaching hospitals reinforce the agglomeration of inter-related hospital and academic institutions. Highlights of some of Boston’s major hospitals: § Founded in Boston in 1811, Massachusetts
General is the oldest and largest hospital in New England (and third oldest in the U.S.). It conducts the largest hospital-based research program in the nation, with an annual research budget of more than $300 million.
§ With over 16,000 employees, Massachusetts General is also the largest nongovernment employer in Boston. Almost all of the hospital's staff physicians have appointments at Harvard Medical School.
§ Founded in 1832, Boston’s Brigham and Women's Hospital is New England’s first obstetrical hospital and one of the oldest in the nation. Like Mass General, the hospital is affiliated with the Harvard Medical School.
§ Brigham and Women's Hospital houses one of the best regarded biomedical research institutes in the world. More than 500 scientists and $240 million in research grants sustain the hospital’s research activities.
§ With roots stretching back to 1896, Beth Israel Deaconess Medical Center (another Harvard affiliate) is located in the heart of Boston's medical community. Serving more than half a million patients annually, the center is also the third-largest recipient of NIH biomedical research funding among independent teaching hospitals.
§ Beth Israel Deaconess performs important clinical and research programs with such partner institutions as the Harvard-Thorndike Laboratory, Dana-Farber Cancer Institute, and the Joslin Diabetes Center.
___ Source: The Howell Group of Boston, MA, Why Care?
The Economic Contributions of Health Care to New England
29
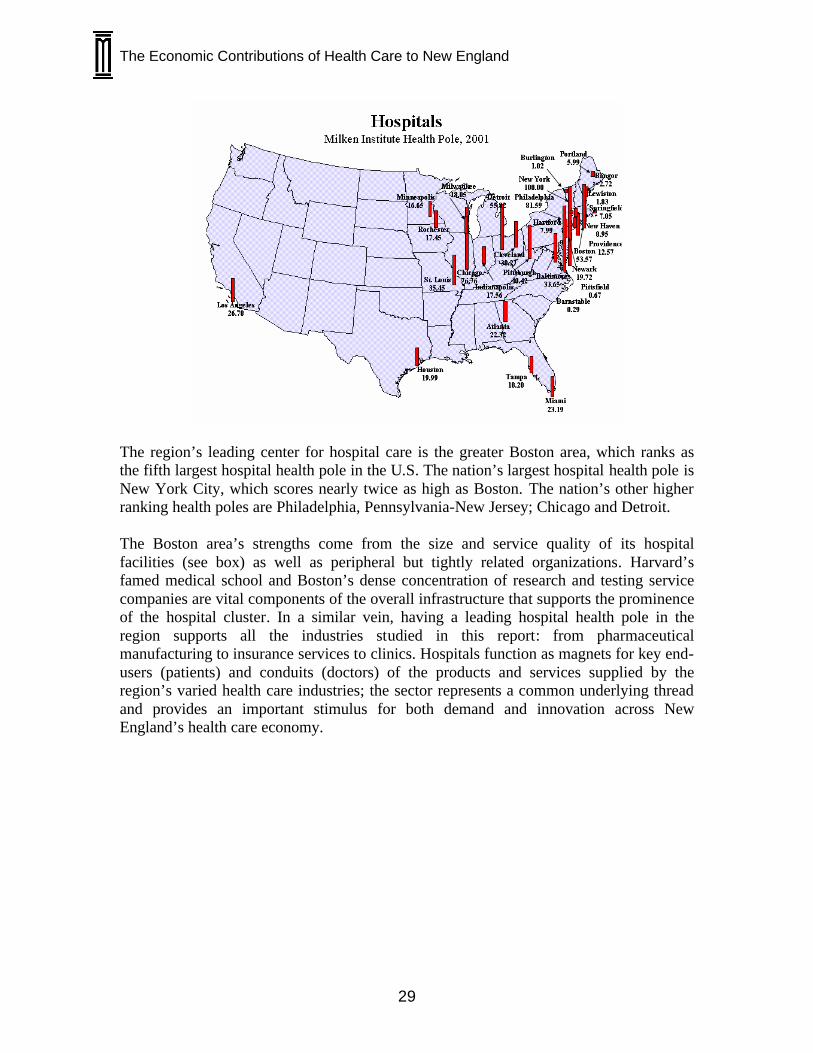
The region’s leading center for hospital care is the greater Boston area, which ranks as the fifth largest hospital health pole in the U.S. The nation’s largest hospital health pole is New York City, which scores nearly twice as high as Boston. The nation’s other higher ranking health poles are Philadelphia, Pennsylvania-New Jersey; Chicago and Detroit. The Boston area’s strengths come from the size and service quality of its hospital facilities (see box) as well as peripheral but tightly related organizations. Harvard’s famed medical school and Boston’s dense concentration of research and testing service companies are vital components of the overall infrastructure that supports the prominence of the hospital cluster. In a similar vein, having a leading hospital health pole in the region supports all the industries studied in this report: from pharmaceutical manufacturing to insurance services to clinics. Hospitals function as magnets for key end-users (patients) and conduits (doctors) of the products and services supplied by the region’s varied health care industries; the sector represents a common underlying thread and provides an important stimulus for both demand and innovation across New England’s health care economy.
The Economic Contributions of Health Care to New England
30
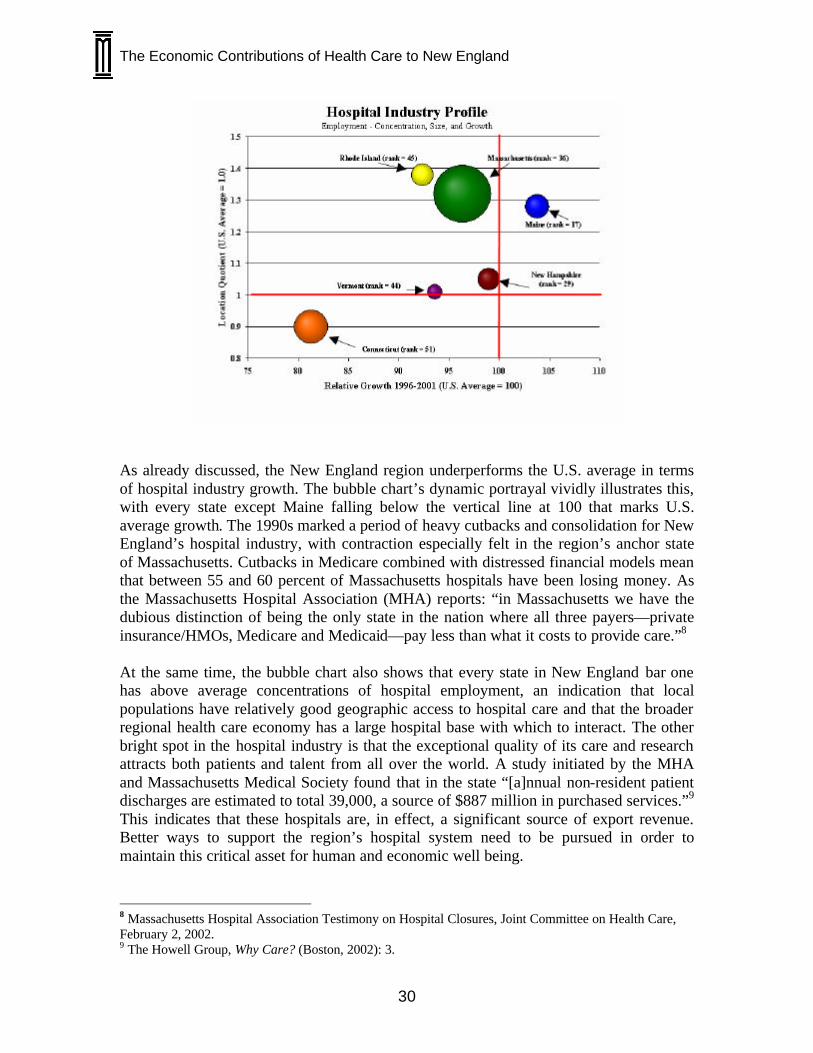
As already discussed, the New England region underperforms the U.S. average in terms of hospital industry growth. The bubble chart’s dynamic portrayal vividly illustrates this, with every state except Maine falling below the vertical line at 100 that marks U.S. average growth. The 1990s marked a period of heavy cutbacks and consolidation for New England’s hospital industry, with contraction especially felt in the region’s anchor state of Massachusetts. Cutbacks in Medicare combined with distressed financial models mean that between 55 and 60 percent of Massachusetts hospitals have been losing money. As the Massachusetts Hospital Association (MHA) reports: “in Massachusetts we have the dubious distinction of being the only state in the nation where all three payers—private insurance/HMOs, Medicare and Medicaid—pay less than what it costs to provide care.”8 At the same time, the bubble chart also shows that every state in New England bar one has above average concentrations of hospital employment, an indication that local populations have relatively good geographic access to hospital care and that the broader regional health care economy has a large hospital base with which to interact. The other bright spot in the hospital industry is that the exceptional quality of its care and research attracts both patients and talent from all over the world. A study initiated by the MHA and Massachusetts Medical Society found that in the state “[a]nnual non-resident patient discharges are estimated to total 39,000, a source of $887 million in purchased services.”9 This indicates that these hospitals are, in effect, a significant source of export revenue. Better ways to support the region’s hospital system need to be pursued in order to maintain this critical asset for human and economic well being.
8 Massachusetts Hospital Association Testimony on Hospital Closures, Joint Committee on Health Care, February 2, 2002. 9 The Howell Group, Why Care? (Boston, 2002): 3.
The Economic Contributions of Health Care to New England
31
Medical Services & Health Insurance New England’s Medical Service & Health Insurance (MSHI) industry directly employs almost 29,000 people. Massachusetts and Connecticut, which employ roughly equal numbers of 9,700 and 9,600 respectively, are the leading states in this category. Connecticut’s growth has been unusually strong. MSHI in the Constitution State expanded by over 440 percent between 1980 and 2000; this momentum has been holding, with growth between 1996 and 2001 at 50.7 percent and for the year 2000 to 2001 at 8.5 percent. Despite their smaller labor pools, for the period 1996-2001, the states of Vermont, New Hampshire, and Maine have achieved the next highest levels of growth—all in the 40 percent range.
Rank StateLocationQuotient
Emp.(Ths.)
1 Nebraska 3.38 9.22 North Dakota 2.95 2.93 Minnesota 2.63 21.04 Maine 2.01 3.75 Connecticut 1.91 9.66 Delaware 1.88 2.37 South Carolina 1.81 9.98 Pennsylvania 1.76 29.99 New Hampshire 1.72 3.2
10 Wisconsin 1.65 14.014 Rhode Island 1.22 1.721 Massachusetts 0.98 9.741 Vermont 0.70 0.6
Sources: Economy.com, Milken Institute.
Medical Service & Health InsuranceStates Ranked by Employment Concentration, 2001
Rank State '80-'00 '80-'90 '90-'00 '96-'01 '00-'011 Georgia 461.8 51.3 271.4 60.8 9.02 North Dakota 347.6 53.2 192.3 58.8 5.63 Minnesota 673.1 127.8 239.3 51.4 9.64 Connecticut 441.7 112.1 155.4 50.7 8.55 Nevada 846.5 136.4 300.3 48.2 8.06 North Carolina 273.3 20.9 208.7 45.7 5.87 Arizona 877.5 275.7 160.2 45.2 5.98 Florida 620.9 178.4 159.0 44.5 3.09 Vermont 693.3 334.7 82.5 43.0 4.5
10 New Hampshire 229.6 27.3 159.0 42.7 7.811 Maine 428.8 101.9 162.0 41.6 7.827 Massachusetts 54.1 -0.3 54.6 16.4 6.342 Rhode Island 52.6 54.7 -1.4 -1.9 0.9
New England 158.6 34.7 92.0 31.2 7.0United States 170.0 70.2 58.6 21.5 2.9
Medical Services & Health InsuranceEmployment Growth, Ranked by 1996-2001 Growth
Sources: Economy.com, Milken Institute.
Percent (%) Growth by Time Period
The region’s industry growth spots have subsequently acquired strong employment concentrations. Maine, Connecticut and New Hampshire all score among the top ten states based on MSHI location quotients; Maine with twice the national average, and Connecticut and New Hampshire 91 percent and 72 percent more heavily concentrated than the national average, respectively. Massachusetts, which has the largest employment pool in the region, has an LQ of 0.98, which means its employment concentration is essentially at par with the nation as a whole.
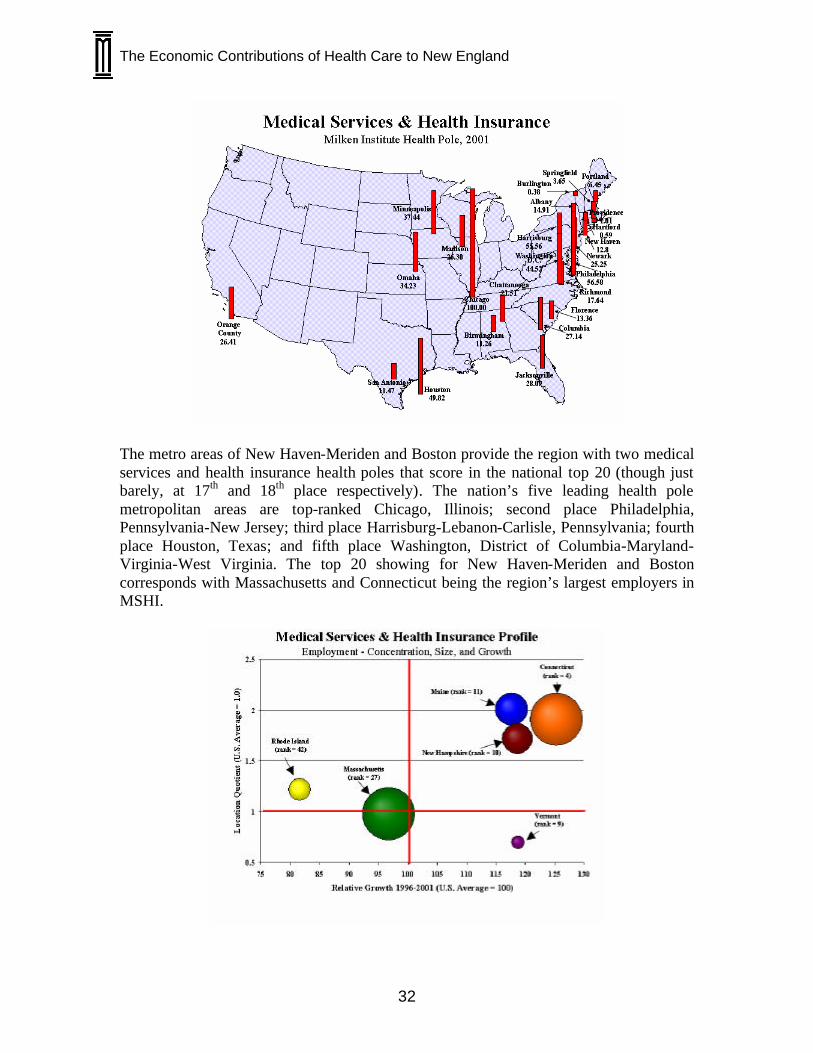
The Economic Contributions of Health Care to New England
32
The metro areas of New Haven-Meriden and Boston provide the region with two medical services and health insurance health poles that score in the national top 20 (though just barely, at 17th and 18th place respectively). The nation’s five leading health pole metropolitan areas are top-ranked Chicago, Illinois; second place Philadelphia, Pennsylvania-New Jersey; third place Harrisburg-Lebanon-Carlisle, Pennsylvania; fourth place Houston, Texas; and fifth place Washington, District of Columbia-Maryland-Virginia-West Virginia. The top 20 showing for New Haven-Meriden and Boston corresponds with Massachusetts and Connecticut being the region’s largest employers in MSHI.
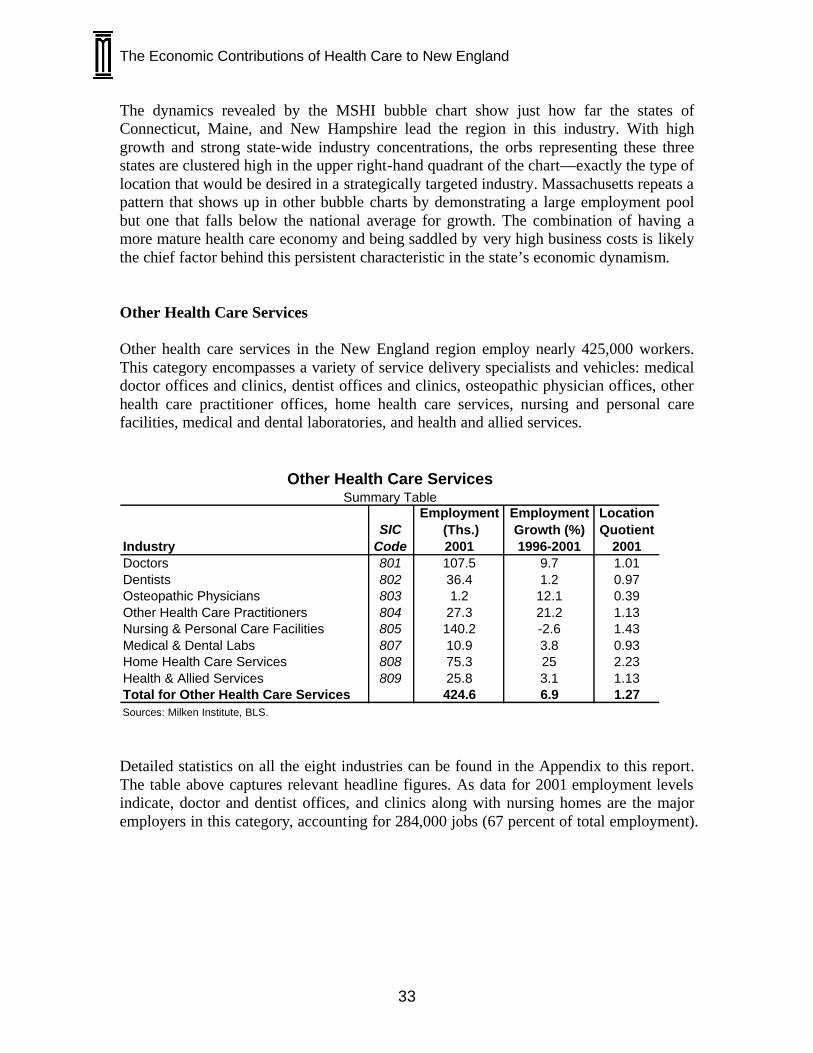
The Economic Contributions of Health Care to New England
33
The dynamics revealed by the MSHI bubble chart show just how far the states of Connecticut, Maine, and New Hampshire lead the region in this industry. With high growth and strong state-wide industry concentrations, the orbs representing these three states are clustered high in the upper right-hand quadrant of the chart—exactly the type of location that would be desired in a strategically targeted industry. Massachusetts repeats a pattern that shows up in other bubble charts by demonstrating a large employment pool but one that falls below the national average for growth. The combination of having a more mature health care economy and being saddled by very high business costs is likely the chief factor behind this persistent characteristic in the state’s economic dynamism. Other Health Care Services Other health care services in the New England region employ nearly 425,000 workers. This category encompasses a variety of service delivery specialists and vehicles: medical doctor offices and clinics, dentist offices and clinics, osteopathic physician offices, other health care practitioner offices, home health care services, nursing and personal care facilities, medical and dental laboratories, and health and allied services.
Employment (Ths.)
EmploymentGrowth (%)
LocationQuotient
Industry 2001 1996-2001 2001Doctors 801 107.5 9.7 1.01Dentists 802 36.4 1.2 0.97Osteopathic Physicians 803 1.2 12.1 0.39Other Health Care Practitioners 804 27.3 21.2 1.13Nursing & Personal Care Facilities 805 140.2 -2.6 1.43Medical & Dental Labs 807 10.9 3.8 0.93Home Health Care Services 808 75.3 25 2.23Health & Allied Services 809 25.8 3.1 1.13Total for Other Health Care Services 424.6 6.9 1.27Sources: Milken Institute, BLS.
SICCode
Other Health Care ServicesSummary Table
Detailed statistics on all the eight industries can be found in the Appendix to this report. The table above captures relevant headline figures. As data for 2001 employment levels indicate, doctor and dentist offices, and clinics along with nursing homes are the major employers in this category, accounting for 284,000 jobs (67 percent of total employment).
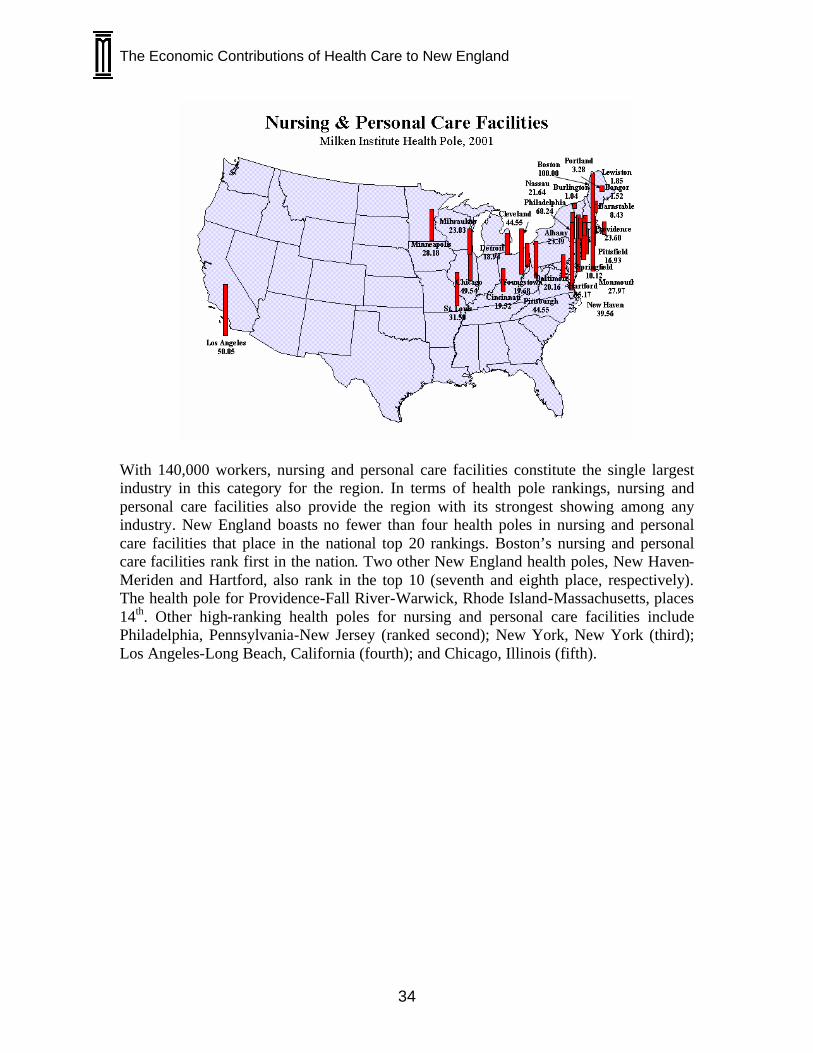
The Economic Contributions of Health Care to New England
34
With 140,000 workers, nursing and personal care facilities constitute the single largest industry in this category for the region. In terms of health pole rankings, nursing and personal care facilities also provide the region with its strongest showing among any industry. New England boasts no fewer than four health poles in nursing and personal care facilities that place in the national top 20 rankings. Boston’s nursing and personal care facilities rank first in the nation. Two other New England health poles, New Haven-Meriden and Hartford, also rank in the top 10 (seventh and eighth place, respectively). The health pole for Providence-Fall River-Warwick, Rhode Island-Massachusetts, places 14th. Other high-ranking health poles for nursing and personal care facilities include Philadelphia, Pennsylvania-New Jersey (ranked second); New York, New York (third); Los Angeles-Long Beach, California (fourth); and Chicago, Illinois (fifth).
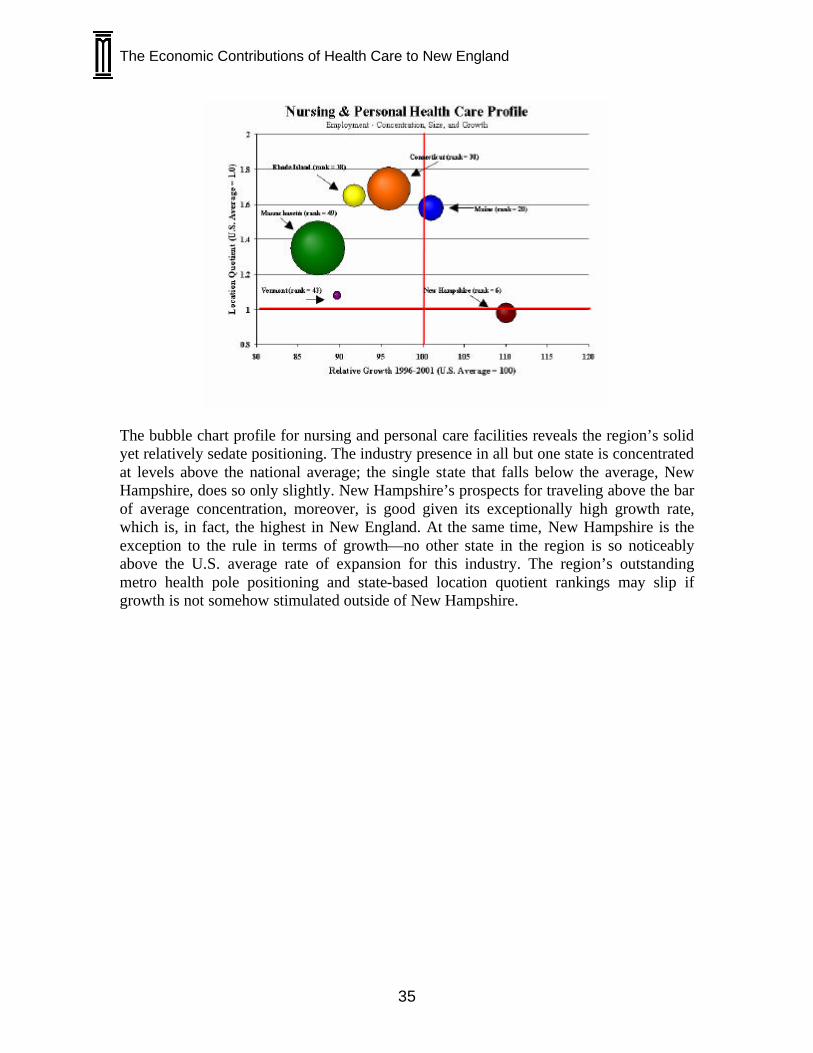
The Economic Contributions of Health Care to New England
35
The bubble chart profile for nursing and personal care facilities reveals the region’s solid yet relatively sedate positioning. The industry presence in all but one state is concentrated at levels above the national average; the single state that falls below the average, New Hampshire, does so only slightly. New Hampshire’s prospects for traveling above the bar of average concentration, moreover, is good given its exceptionally high growth rate, which is, in fact, the highest in New England. At the same time, New Hampshire is the exception to the rule in terms of growth—no other state in the region is so noticeably above the U.S. average rate of expansion for this industry. The region’s outstanding metro health pole positioning and state-based location quotient rankings may slip if growth is not somehow stimulated outside of New Hampshire.
The Economic Contributions of Health Care to New England
36
3. Multiplier Analysis Methodology To better understand the importance of the health care industry in New England we must analyze its impact on the overall economy. Multiplicative values known as “multipliers” allow us to do this by quantifying how employment and output in the health care industry ripple through other regional economic sectors. In addition to providing numerical data on an industry’s regional impact, economic multipliers also bring to light region-wide interdependencies and inter-industry relationships. It is important to appreciate these relationships because they directly influence how regional economies respond to business cycles and changes in long-term industry structure. To conduct its systematic economic multiplier impact analysis, the Milken Institute has utilized the Regional Input-Output Modeling System (RIMS II) developed by the Bureau of Economic Analysis. This methodology makes use of the input-output structure of U.S. industries to estimate the total impact one industry has on the wider economy. When speaking of “total impact,” three types of economic multipliers are implied: those responsible for direct, indirect and induced effects. It is through the aggregation of these impacts that a given industry contributes to its local economy. In terms of health care sectors, the roles of the three types of impact can be described as follows: Direct Impact - The number of jobs, wages or amount of output directly generated by a given health care sector. Indirect Impact - The number of jobs, wages or amount of output generated from all supplier industries necessary to support employment/output in a given health care sector. Induced Impact - The number of jobs, wages or amount of output generated by employees’ incomes in all direct and indirect industries. The data used to capture these types of impact come from the Bureau of Labor Statistics. It consists of 3-digit industry employment and output data as defined by the Standard Industrial Classification System (SIC). Of course, economic effects go beyond the industry where the activity originates. For example, there are related supplier and end-user industries that benefit as well. Spillover economic activity associated within related industries is captured by the indirect impacts. Supplier industries that cater to the health care sector, for instance, generate a vast number of jobs within the wholesale and retail trade industries. Even these suppliers must themselves in turn utilize a network of their own suppliers to obtain goods and services, thereby producing a further chain reaction of indirect impacts to the economy. The induced impact measure captures the economic activity generated to meet household demand for all good and services that have been created by the increased activity in all the direct and indirect industries. In the area of employment, for example, new jobs are

The Economic Contributions of Health Care to New England
37
induced by the consumer spending of all the workers whose jobs are directly and indirectly dependent on health care industries. Thus, in addition to the consumer spending made by medical doctors, health insurance agents, biotech researchers, and hospital orderlies, the spending made by the restaurant workers, retail clerks, real estate agents, contractors, and many others indirectly dependent on the industry is also accounted for in this measure. Multiplier Impact In 2001, the health care industry in New England employed over 801,300 workers, producing a gross regional product of $53 billion. These figures represent the direct impact of the health care sector on the regional economy. When the full extent of multiplicative dynamics are accounted for by applying total impact measures, health care can be recognized as responsible for 1,726,200 jobs and $121 billion worth of output throughout New England. The additional 924,900 jobs and $68 billion in these total impact figures stem from the indirect and induced impacts that health care brings to the rest of the economy. The indirect impact generates an additional 583,300 jobs and $25.5 billion worth of output, while the induced effect adds another 341,700 jobs and $42.5 billion worth of output. Together they contribute to the total impact that the health care sector brings to the region. (See charts below.)
Total Impact
2000
1500
1000
500
0
Employment (Ths.)
Sources: Milken Insittute, BEA.
Total Impact of New England Health CareDirect, Indirect, and Induced Impacts - Employment, 2001
801.
358
3.3
341.
7
Tota
l = 1
726.
2
DirectIndirectInduced
Total Impact
140
120
100
80
60
40
20
0
Output (Billions of $U.S.)
Sources: Milken Insittute, BEA.
Total Impact of New England Health CareDirect, Indirect, and Induced Impacts - Ouput, 2001
53.0
25.5
42.5
Total = 121.0DirectIndirectInduced
Consequently, the total health care employment multiplier in New England is 2.15 (1,726,200/801,300). In other words, each job in New England’s health care sector produces an additional 1.15 jobs in other sectors. By the same token, since 11.4 percent of total employment in New England is in health care, the industry ultimately accounts for nearly 25 percent of total employment in New England when including the multiplier effect (11.4 percent multiplied by 2.15).
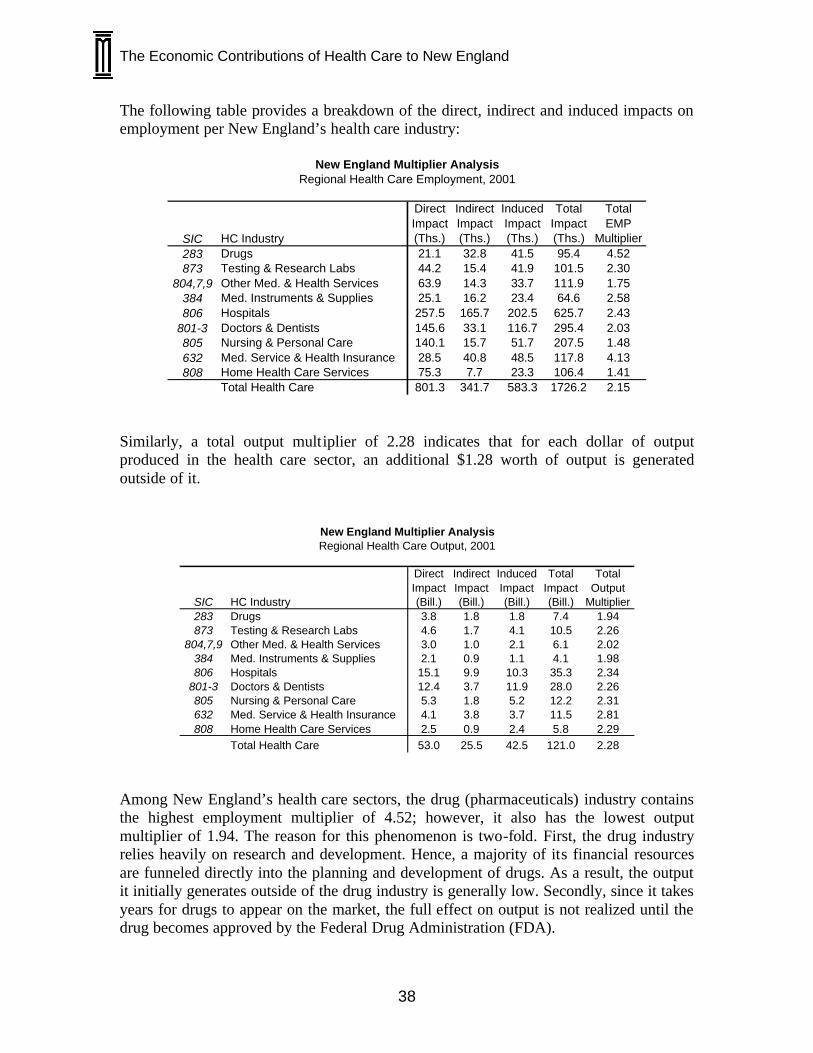
The Economic Contributions of Health Care to New England
38
The following table provides a breakdown of the direct, indirect and induced impacts on employment per New England’s health care industry:
SIC HC Industry
Direct Impact(Ths.)
Indirect Impact(Ths.)
Induced Impact(Ths.)
Total Impact(Ths.)
Total EMP
Multiplier283 Drugs 21.1 32.8 41.5 95.4 4.52873 Testing & Research Labs 44.2 15.4 41.9 101.5 2.30
804,7,9 Other Med. & Health Services 63.9 14.3 33.7 111.9 1.75384 Med. Instruments & Supplies 25.1 16.2 23.4 64.6 2.58806 Hospitals 257.5 165.7 202.5 625.7 2.43
801-3 Doctors & Dentists 145.6 33.1 116.7 295.4 2.03805 Nursing & Personal Care 140.1 15.7 51.7 207.5 1.48632 Med. Service & Health Insurance 28.5 40.8 48.5 117.8 4.13808 Home Health Care Services 75.3 7.7 23.3 106.4 1.41
Total Health Care 801.3 341.7 583.3 1726.2 2.15
New England Multiplier AnalysisRegional Health Care Employment, 2001
Similarly, a total output multiplier of 2.28 indicates that for each dollar of output produced in the health care sector, an additional $1.28 worth of output is generated outside of it.
SIC HC Industry
Direct Impact(Bill.)
Indirect Impact(Bill.)
Induced Impact(Bill.)
Total Impact(Bill.)
Total Output
Multiplier283 Drugs 3.8 1.8 1.8 7.4 1.94873 Testing & Research Labs 4.6 1.7 4.1 10.5 2.26
804,7,9 Other Med. & Health Services 3.0 1.0 2.1 6.1 2.02384 Med. Instruments & Supplies 2.1 0.9 1.1 4.1 1.98806 Hospitals 15.1 9.9 10.3 35.3 2.34
801-3 Doctors & Dentists 12.4 3.7 11.9 28.0 2.26805 Nursing & Personal Care 5.3 1.8 5.2 12.2 2.31632 Med. Service & Health Insurance 4.1 3.8 3.7 11.5 2.81808 Home Health Care Services 2.5 0.9 2.4 5.8 2.29
Total Health Care 53.0 25.5 42.5 121.0 2.28
New England Multiplier AnalysisRegional Health Care Output, 2001
Among New England’s health care sectors, the drug (pharmaceuticals) industry contains the highest employment multiplier of 4.52; however, it also has the lowest output multiplier of 1.94. The reason for this phenomenon is two-fold. First, the drug industry relies heavily on research and development. Hence, a majority of its financial resources are funneled directly into the planning and development of drugs. As a result, the output it initially generates outside of the drug industry is generally low. Secondly, since it takes years for drugs to appear on the market, the full effect on output is not realized until the drug becomes approved by the Federal Drug Administration (FDA).
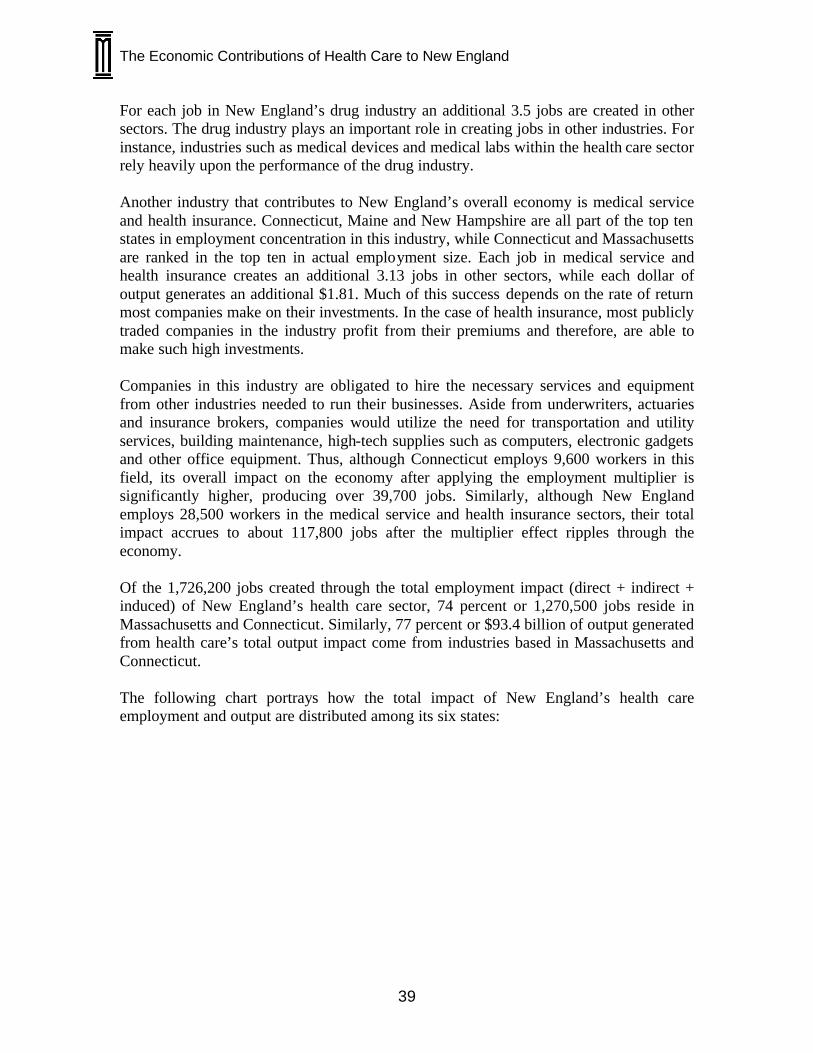
The Economic Contributions of Health Care to New England
39
For each job in New England’s drug industry an additional 3.5 jobs are created in other sectors. The drug industry plays an important role in creating jobs in other industries. For instance, industries such as medical devices and medical labs within the health care sector rely heavily upon the performance of the drug industry. Another industry that contributes to New England’s overall economy is medical service and health insurance. Connecticut, Maine and New Hampshire are all part of the top ten states in employment concentration in this industry, while Connecticut and Massachusetts are ranked in the top ten in actual employment size. Each job in medical service and health insurance creates an additional 3.13 jobs in other sectors, while each dollar of output generates an additional $1.81. Much of this success depends on the rate of return most companies make on their investments. In the case of health insurance, most publicly traded companies in the industry profit from their premiums and therefore, are able to make such high investments. Companies in this industry are obligated to hire the necessary services and equipment from other industries needed to run their businesses. Aside from underwriters, actuaries and insurance brokers, companies would utilize the need for transportation and utility services, building maintenance, high-tech supplies such as computers, electronic gadgets and other office equipment. Thus, although Connecticut employs 9,600 workers in this field, its overall impact on the economy after applying the employment multiplier is significantly higher, producing over 39,700 jobs. Similarly, although New England employs 28,500 workers in the medical service and health insurance sectors, their total impact accrues to about 117,800 jobs after the multiplier effect ripples through the economy. Of the 1,726,200 jobs created through the total employment impact (direct + indirect + induced) of New England’s health care sector, 74 percent or 1,270,500 jobs reside in Massachusetts and Connecticut. Similarly, 77 percent or $93.4 billion of output generated from health care’s total output impact come from industries based in Massachusetts and Connecticut. The following chart portrays how the total impact of New England’s health care employment and output are distributed among its six states:
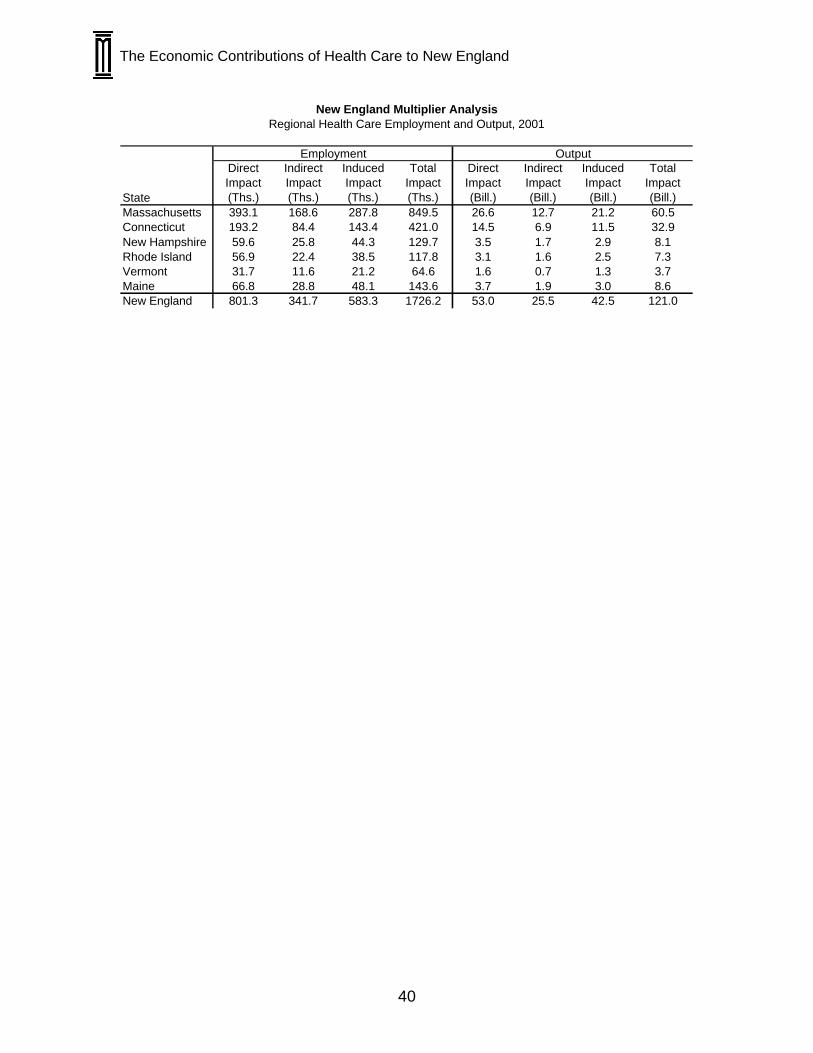
The Economic Contributions of Health Care to New England
40
State
Direct Impact(Ths.)
Indirect Impact(Ths.)
Induced Impact(Ths.)
Total Impact(Ths.)
Direct Impact(Bill.)
Indirect Impact(Bill.)
Induced Impact(Bill.)
Total Impact(Bill.)
Massachusetts 393.1 168.6 287.8 849.5 26.6 12.7 21.2 60.5Connecticut 193.2 84.4 143.4 421.0 14.5 6.9 11.5 32.9New Hampshire 59.6 25.8 44.3 129.7 3.5 1.7 2.9 8.1Rhode Island 56.9 22.4 38.5 117.8 3.1 1.6 2.5 7.3Vermont 31.7 11.6 21.2 64.6 1.6 0.7 1.3 3.7Maine 66.8 28.8 48.1 143.6 3.7 1.9 3.0 8.6New England 801.3 341.7 583.3 1726.2 53.0 25.5 42.5 121.0
New England Multiplier AnalysisRegional Health Care Employment and Output, 2001
Employment Output

The Economic Contributions of Health Care to New England
41
4. Innovation Pipeline Analysis As stated in the introduction to the Industry Analysis section of this report, leading states in New England are exceptionally well positioned to capitalize on the promise of health care innovations. In areas such as funding, investment, concentrations of bioscience specialists, knowledge resource pools and rates of technology commercialization, the region is asset rich in terms of its capacity to innovate and is a high performer in terms of its ability to prepare health care science innovations for the commercial marketplace. This final narrative section of the report analyzes the comparative strengths and weaknesses of the region’s “innovation pipeline”—the support infrastructure and outcome measures that reflect the ability of the region to capitalize on its strengths in life science knowledge and inventiveness. Funding Funding in the context of our analysis relates to money spent on health care industry activities that are not necessarily tied to a specific commercial outcome (though these activities may be of tremendous commercial and economic importance). For example, the Bethesda, Maryland-based National Institutes of Health (NIH) disperses monetary awards to support “basic, applied and clinical and health services research” in line with the organization’s mission “to understand the processes underlying human health and to acquire new knowledge to help prevent, diagnose and treat human diseases and disabilities.” 10 The spending goals are thus to cure disease, not necessarily produce marketable innovations. In the process of searching for disease cures, however, commercially viable innovations often emerge.
10 US Department of Health and Human Services, National Institutes of Health: http://www.nih.gov/ (accessed February 2003).
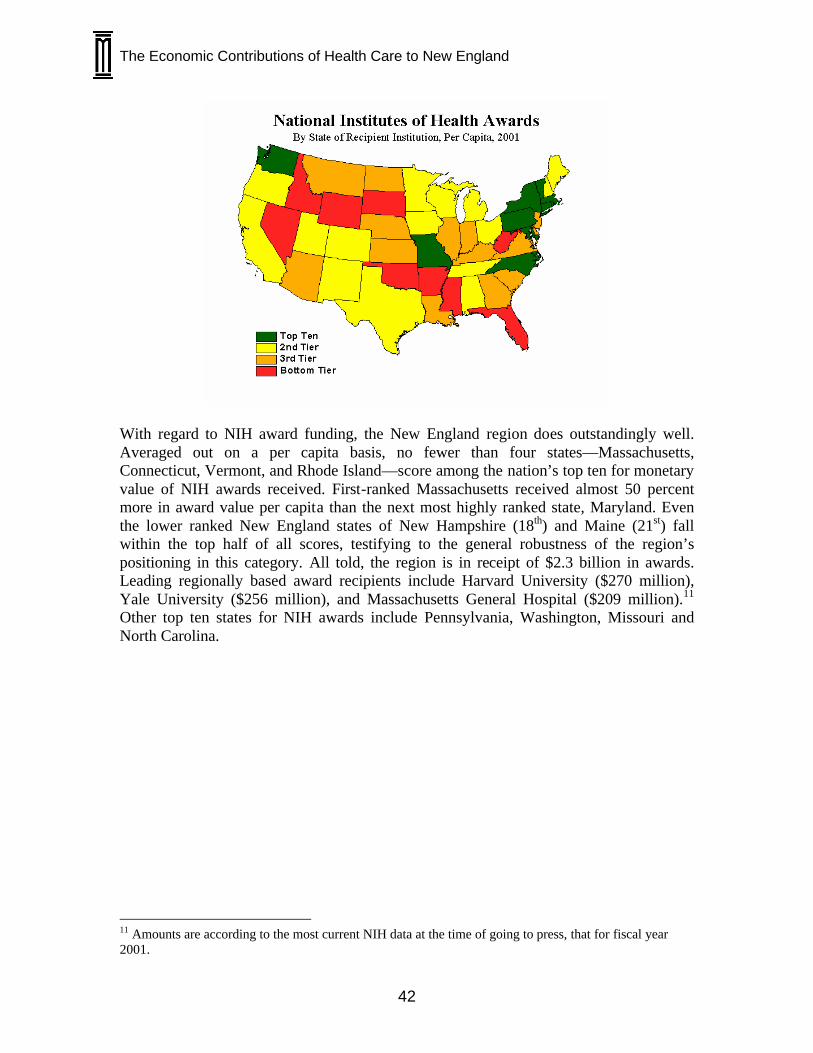
The Economic Contributions of Health Care to New England
42
With regard to NIH award funding, the New England region does outstandingly well. Averaged out on a per capita basis, no fewer than four states—Massachusetts, Connecticut, Vermont, and Rhode Island—score among the nation’s top ten for monetary value of NIH awards received. First-ranked Massachusetts received almost 50 percent more in award value per capita than the next most highly ranked state, Maryland. Even the lower ranked New England states of New Hampshire (18th) and Maine (21st) fall within the top half of all scores, testifying to the general robustness of the region’s positioning in this category. All told, the region is in receipt of $2.3 billion in awards. Leading regionally based award recipients include Harvard University ($270 million), Yale University ($256 million), and Massachusetts General Hospital ($209 million).11 Other top ten states for NIH awards include Pennsylvania, Washington, Missouri and North Carolina.
11 Amounts are according to the most current NIH data at the time of going to press, that for fiscal year 2001.

The Economic Contributions of Health Care to New England
43
The region does similarly well in terms of federal funding that is dedicated to support research and development (R&D). Massachusetts, Connecticut and Vermont all rank among the top five states in terms of per capita spending on university-based R&D for the life sciences (see above and relevant maps in the Appendix section). As the Milken Institute’s State Science and Technology Index recently reported on federally funded R&D in the U.S.:
Nearly $15.5 billion of all R&D at doctorate-granting universities was spent on research relating to the life sciences, or an average per capita figure of $55.85. In excess of 57 percent of all institutional R&D at doctorate-granting universities was spent on life sciences projects. Life science programs throughout the country are by far the largest recipients of R&D funds.12
New England is exceptionally well positioned to capture the disproportionate funding flow for R&D in the life sciences. Its block of second, third and fourth ranked state recipients for R&D expenditures in life science (Massachusetts, Connecticut, Vermont) all individually earn more than $90 per capita in funding. Rounding out the top five of R&D states are first-ranked Maryland and fifth-ranked North Carolina.
12 Ross DeVol, State Science and Technology Index (Milken Institute, 2002): 63.
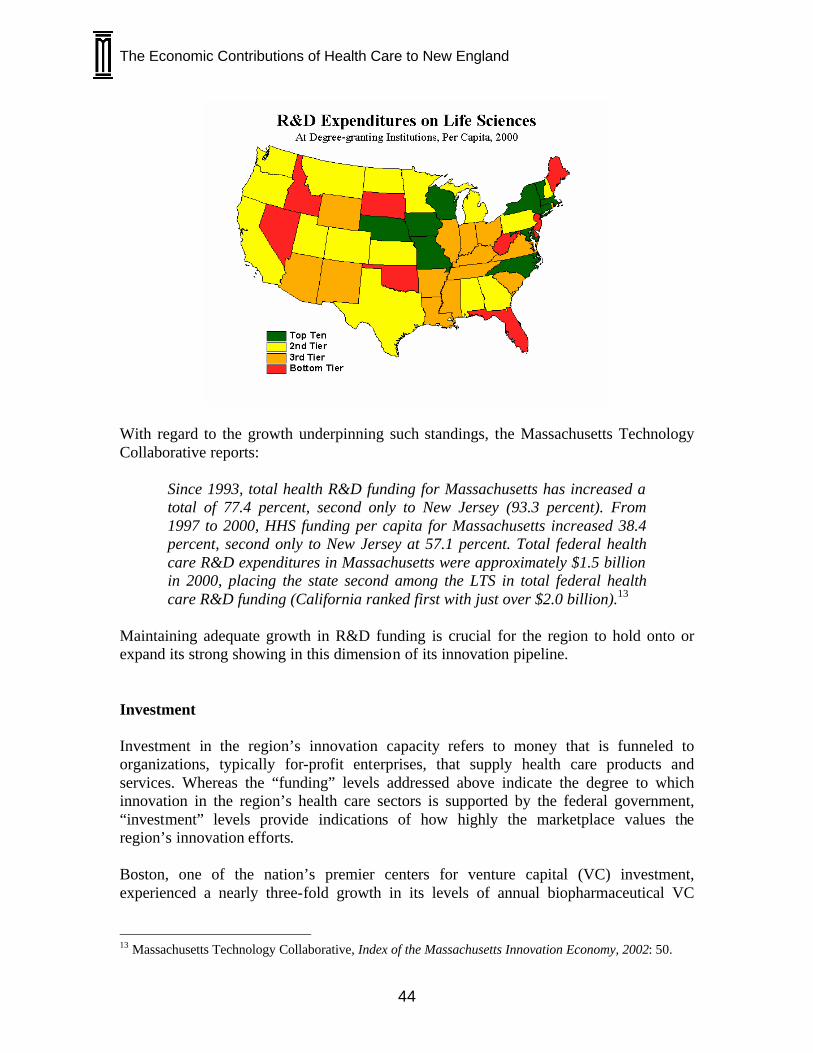
The Economic Contributions of Health Care to New England
44
With regard to the growth underpinning such standings, the Massachusetts Technology Collaborative reports:
Since 1993, total health R&D funding for Massachusetts has increased a total of 77.4 percent, second only to New Jersey (93.3 percent). From 1997 to 2000, HHS funding per capita for Massachusetts increased 38.4 percent, second only to New Jersey at 57.1 percent. Total federal health care R&D expenditures in Massachusetts were approximately $1.5 billion in 2000, placing the state second among the LTS in total federal health care R&D funding (California ranked first with just over $2.0 billion).13
Maintaining adequate growth in R&D funding is crucial for the region to hold onto or expand its strong showing in this dimension of its innovation pipeline. Investment Investment in the region’s innovation capacity refers to money that is funneled to organizations, typically for-profit enterprises, that supply health care products and services. Whereas the “funding” levels addressed above indicate the degree to which innovation in the region’s health care sectors is supported by the federal government, “investment” levels provide indications of how highly the marketplace values the region’s innovation efforts. Boston, one of the nation’s premier centers for venture capital (VC) investment, experienced a nearly three-fold growth in its levels of annual biopharmaceutical VC
13 Massachusetts Technology Collaborative, Index of the Massachusetts Innovation Economy, 2002: 50.
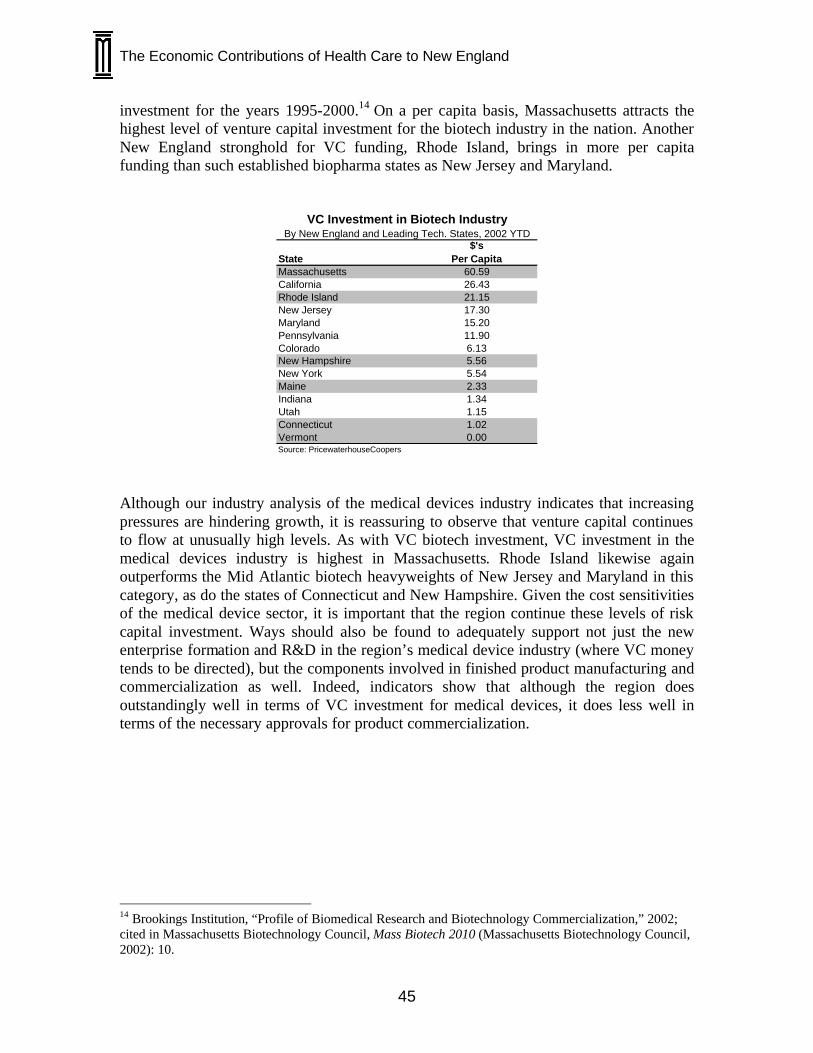
The Economic Contributions of Health Care to New England
45
investment for the years 1995-2000.14 On a per capita basis, Massachusetts attracts the highest level of venture capital investment for the biotech industry in the nation. Another New England stronghold for VC funding, Rhode Island, brings in more per capita funding than such established biopharma states as New Jersey and Maryland.
State$'s
Per CapitaMassachusetts 60.59California 26.43Rhode Island 21.15New Jersey 17.30Maryland 15.20Pennsylvania 11.90Colorado 6.13New Hampshire 5.56New York 5.54Maine 2.33Indiana 1.34Utah 1.15Connecticut 1.02Vermont 0.00Source: PricewaterhouseCoopers
VC Investment in Biotech IndustryBy New England and Leading Tech. States, 2002 YTD
Although our industry analysis of the medical devices industry indicates that increasing pressures are hindering growth, it is reassuring to observe that venture capital continues to flow at unusually high levels. As with VC biotech investment, VC investment in the medical devices industry is highest in Massachusetts. Rhode Island likewise again outperforms the Mid Atlantic biotech heavyweights of New Jersey and Maryland in this category, as do the states of Connecticut and New Hampshire. Given the cost sensitivities of the medical device sector, it is important that the region continue these levels of risk capital investment. Ways should also be found to adequately support not just the new enterprise formation and R&D in the region’s medical device industry (where VC money tends to be directed), but the components involved in finished product manufacturing and commercialization as well. Indeed, indicators show that although the region does outstandingly well in terms of VC investment for medical devices, it does less well in terms of the necessary approvals for product commercialization.
14 Brookings Institution, “Profile of Biomedical Research and Biotechnology Commercialization,” 2002; cited in Massachusetts Biotechnology Council, Mass Biotech 2010 (Massachusetts Biotechnology Council, 2002): 10.
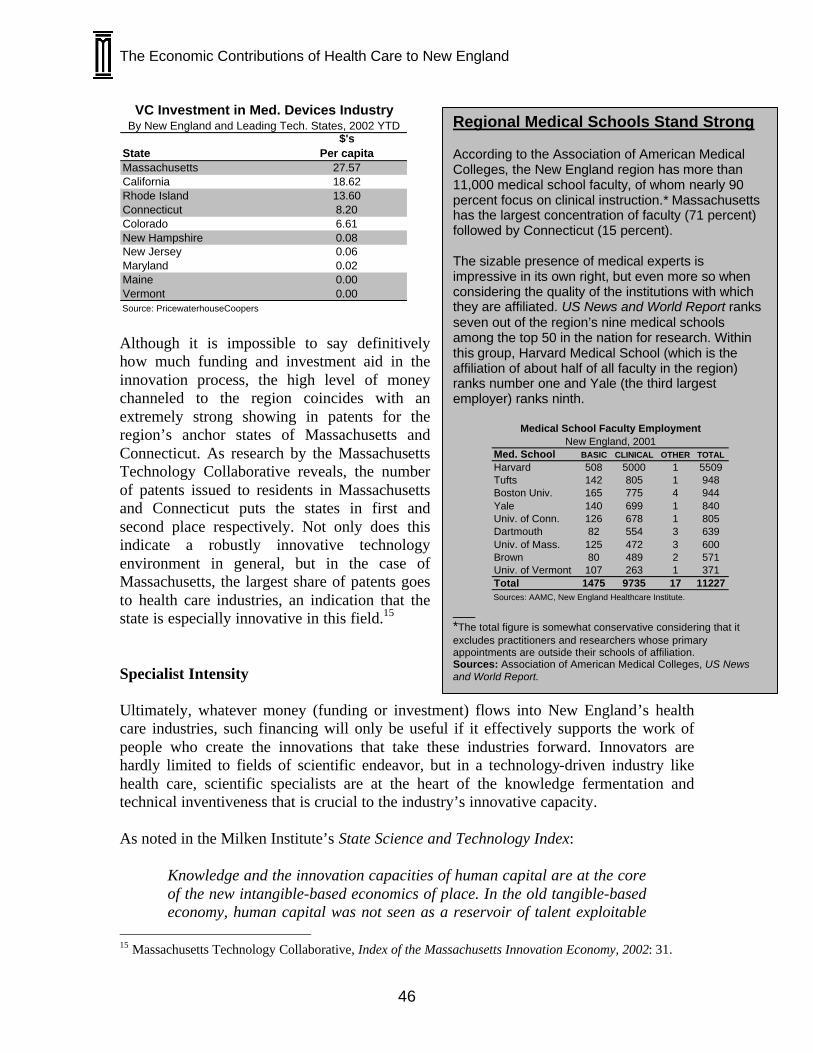
The Economic Contributions of Health Care to New England
46
State$'s
Per capitaMassachusetts 27.57California 18.62Rhode Island 13.60Connecticut 8.20Colorado 6.61New Hampshire 0.08New Jersey 0.06Maryland 0.02Maine 0.00Vermont 0.00Source: PricewaterhouseCoopers
VC Investment in Med. Devices IndustryBy New England and Leading Tech. States, 2002 YTD
Although it is impossible to say definitively how much funding and investment aid in the innovation process, the high level of money channeled to the region coincides with an extremely strong showing in patents for the region’s anchor states of Massachusetts and Connecticut. As research by the Massachusetts Technology Collaborative reveals, the number of patents issued to residents in Massachusetts and Connecticut puts the states in first and second place respectively. Not only does this indicate a robustly innovative technology environment in general, but in the case of Massachusetts, the largest share of patents goes to health care industries, an indication that the state is especially innovative in this field.15 Specialist Intensity Ultimately, whatever money (funding or investment) flows into New England’s health care industries, such financing will only be useful if it effectively supports the work of people who create the innovations that take these industries forward. Innovators are hardly limited to fields of scientific endeavor, but in a technology-driven industry like health care, scientific specialists are at the heart of the knowledge fermentation and technical inventiveness that is crucial to the industry’s innovative capacity. As noted in the Milken Institute’s State Science and Technology Index:
Knowledge and the innovation capacities of human capital are at the core of the new intangible-based economics of place. In the old tangible-based economy, human capital was not seen as a reservoir of talent exploitable
15 Massachusetts Technology Collaborative, Index of the Massachusetts Innovation Economy, 2002: 31.
Regional Medical Schools Stand Strong According to the Association of American Medical Colleges, the New England region has more than 11,000 medical school faculty, of whom nearly 90 percent focus on clinical instruction.* Massachusetts has the largest concentration of faculty (71 percent) followed by Connecticut (15 percent). The sizable presence of medical experts is impressive in its own right, but even more so when considering the quality of the institutions with which they are affiliated. US News and World Report ranks seven out of the region’s nine medical schools among the top 50 in the nation for research. Within this group, Harvard Medical School (which is the affiliation of about half of all faculty in the region) ranks number one and Yale (the third largest employer) ranks ninth.
Med. School BASIC CLINICAL OTHER TOTAL
Harvard 508 5000 1 5509Tufts 142 805 1 948Boston Univ. 165 775 4 944Yale 140 699 1 840Univ. of Conn. 126 678 1 805Dartmouth 82 554 3 639Univ. of Mass. 125 472 3 600Brown 80 489 2 571Univ. of Vermont 107 263 1 371Total 1475 9735 17 11227
Medical School Faculty EmploymentNew England, 2001
Sources: AAMC, New England Healthcare Institute. ___ *The total figure is somewhat conservative considering that it excludes practitioners and researchers whose primary appointments are outside their schools of affiliation. Sources: Association of American Medical Colleges, US News and World Report.
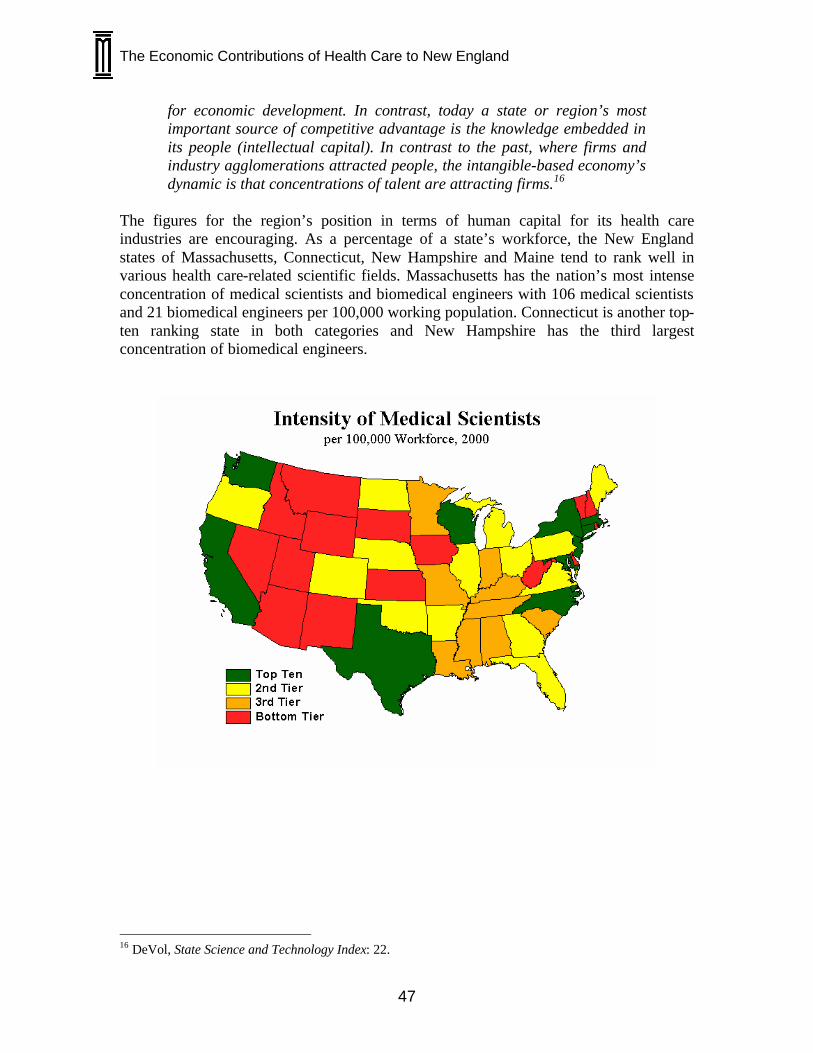
The Economic Contributions of Health Care to New England
47
for economic development. In contrast, today a state or region’s most important source of competitive advantage is the knowledge embedded in its people (intellectual capital). In contrast to the past, where firms and industry agglomerations attracted people, the intangible-based economy’s dynamic is that concentrations of talent are attracting firms.16
The figures for the region’s position in terms of human capital for its health care industries are encouraging. As a percentage of a state’s workforce, the New England states of Massachusetts, Connecticut, New Hampshire and Maine tend to rank well in various health care-related scientific fields. Massachusetts has the nation’s most intense concentration of medical scientists and biomedical engineers with 106 medical scientists and 21 biomedical engineers per 100,000 working population. Connecticut is another top-ten ranking state in both categories and New Hampshire has the third largest concentration of biomedical engineers.
16 DeVol, State Science and Technology Index: 22.
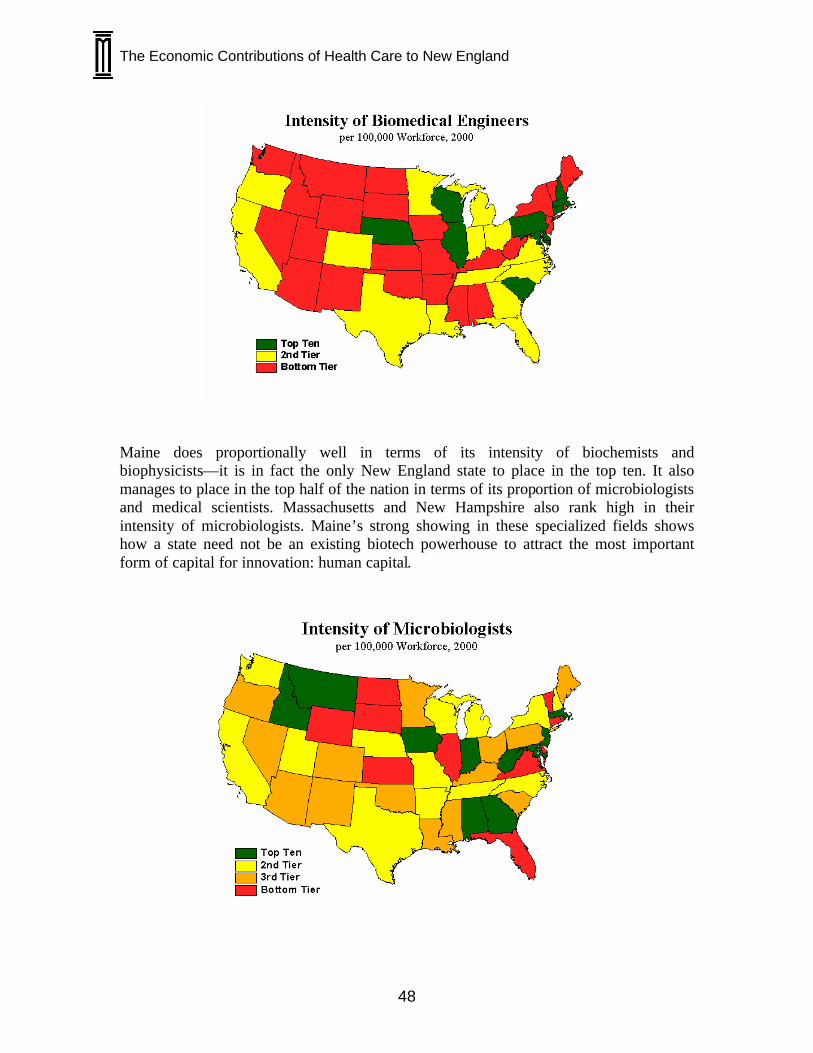
The Economic Contributions of Health Care to New England
48
Maine does proportionally well in terms of its intensity of biochemists and biophysicists—it is in fact the only New England state to place in the top ten. It also manages to place in the top half of the nation in terms of its proportion of microbiologists and medical scientists. Massachusetts and New Hampshire also rank high in their intensity of microbiologists. Maine’s strong showing in these specialized fields shows how a state need not be an existing biotech powerhouse to attract the most important form of capital for innovation: human capital.
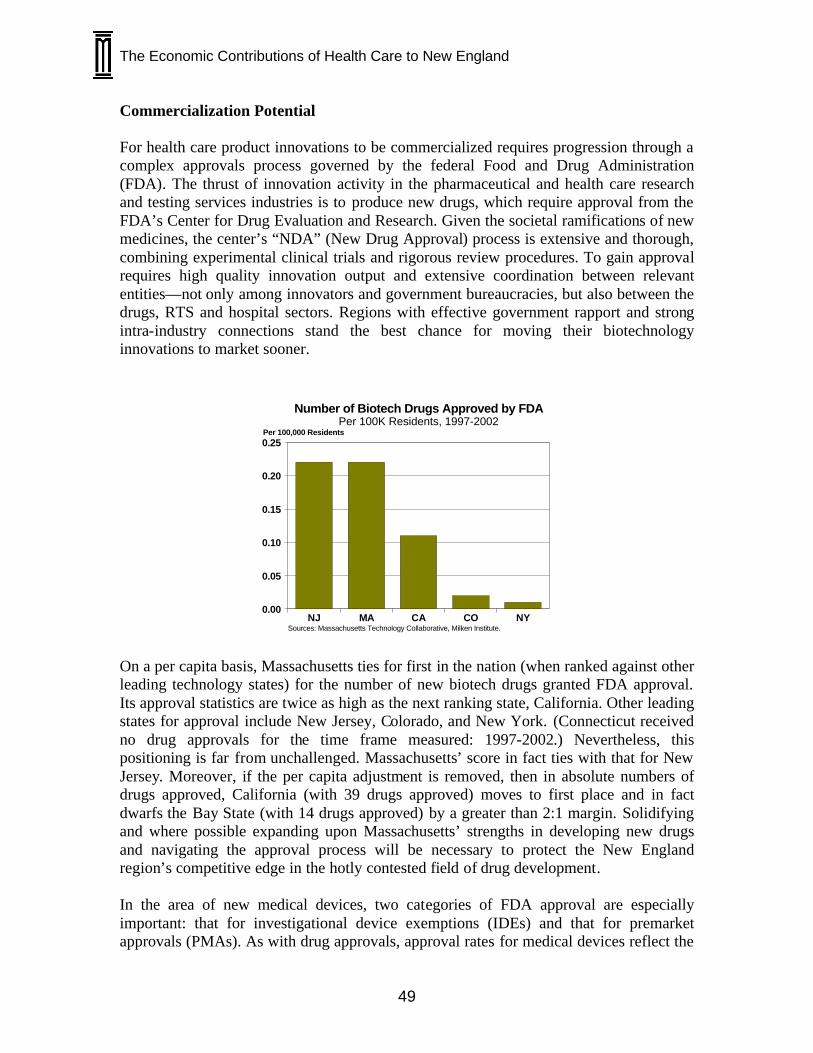
The Economic Contributions of Health Care to New England
49
Commercialization Potential For health care product innovations to be commercialized requires progression through a complex approvals process governed by the federal Food and Drug Administration (FDA). The thrust of innovation activity in the pharmaceutical and health care research and testing services industries is to produce new drugs, which require approval from the FDA’s Center for Drug Evaluation and Research. Given the societal ramifications of new medicines, the center’s “NDA” (New Drug Approval) process is extensive and thorough, combining experimental clinical trials and rigorous review procedures. To gain approval requires high quality innovation output and extensive coordination between relevant entities—not only among innovators and government bureaucracies, but also between the drugs, RTS and hospital sectors. Regions with effective government rapport and strong intra-industry connections stand the best chance for moving their biotechnology innovations to market sooner.
NYCOCAMANJ
0.25
0.20
0.15
0.10
0.05
0.00
Per 100,000 Residents
Sources: Massachusetts Technology Collaborative, Milken Institute.
Number of Biotech Drugs Approved by FDAPer 100K Residents, 1997-2002
On a per capita basis, Massachusetts ties for first in the nation (when ranked against other leading technology states) for the number of new biotech drugs granted FDA approval. Its approval statistics are twice as high as the next ranking state, California. Other leading states for approval include New Jersey, Colorado, and New York. (Connecticut received no drug approvals for the time frame measured: 1997-2002.) Nevertheless, this positioning is far from unchallenged. Massachusetts’ score in fact ties with that for New Jersey. Moreover, if the per capita adjustment is removed, then in absolute numbers of drugs approved, California (with 39 drugs approved) moves to first place and in fact dwarfs the Bay State (with 14 drugs approved) by a greater than 2:1 margin. Solidifying and where possible expanding upon Massachusetts’ strengths in developing new drugs and navigating the approval process will be necessary to protect the New England region’s competitive edge in the hotly contested field of drug development. In the area of new medical devices, two categories of FDA approval are especially important: that for investigational device exemptions (IDEs) and that for premarket approvals (PMAs). As with drug approvals, approval rates for medical devices reflect the
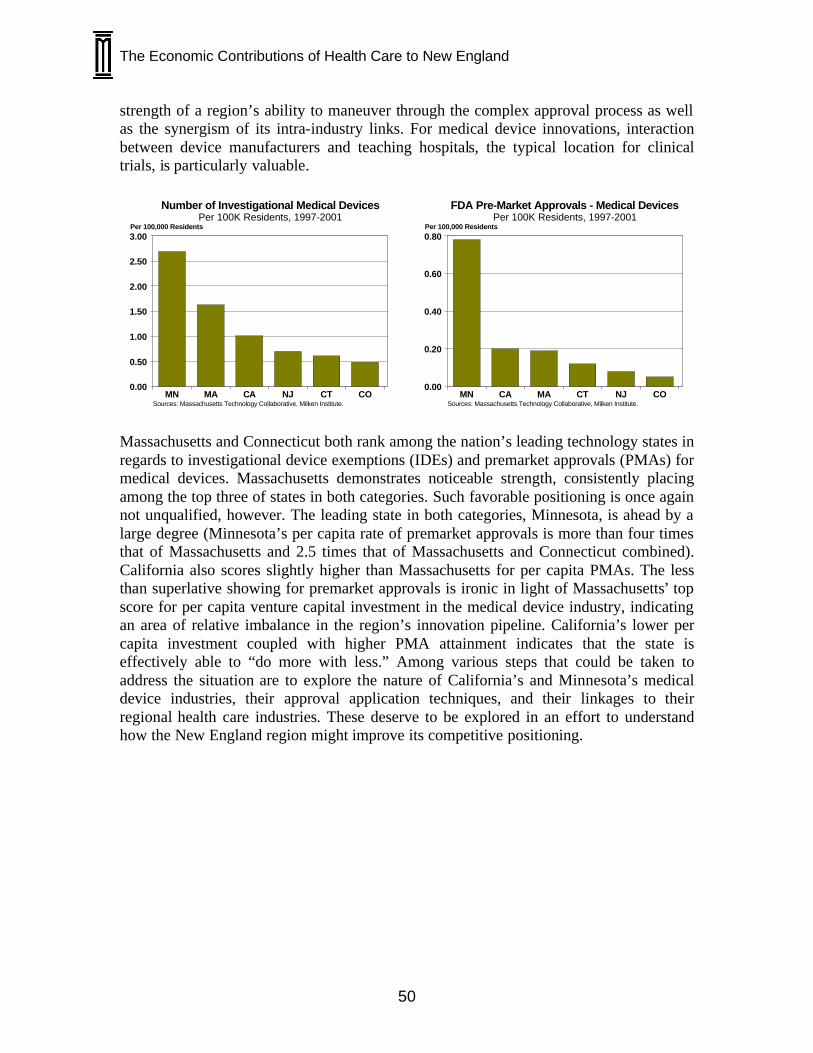
The Economic Contributions of Health Care to New England
50
strength of a region’s ability to maneuver through the complex approval process as well as the synergism of its intra-industry links. For medical device innovations, interaction between device manufacturers and teaching hospitals, the typical location for clinical trials, is particularly valuable.
COCTNJCAMAMN
3.00
2.50
2.00
1.50
1.00
0.50
0.00
Per 100,000 Residents
Sources: Massachusetts Technology Collaborative, Milken Institute.
Number of Investigational Medical DevicesPer 100K Residents, 1997-2001
CONJCTMACAMN
0.80
0.60
0.40
0.20
0.00
Per 100,000 Residents
Sources: Massachusetts Technology Collaborative, Milken Institute.
FDA Pre-Market Approvals - Medical DevicesPer 100K Residents, 1997-2001
Massachusetts and Connecticut both rank among the nation’s leading technology states in regards to investigational device exemptions (IDEs) and premarket approvals (PMAs) for medical devices. Massachusetts demonstrates noticeable strength, consistently placing among the top three of states in both categories. Such favorable positioning is once again not unqualified, however. The leading state in both categories, Minnesota, is ahead by a large degree (Minnesota’s per capita rate of premarket approvals is more than four times that of Massachusetts and 2.5 times that of Massachusetts and Connecticut combined). California also scores slightly higher than Massachusetts for per capita PMAs. The less than superlative showing for premarket approvals is ironic in light of Massachusetts’ top score for per capita venture capital investment in the medical device industry, indicating an area of relative imbalance in the region’s innovation pipeline. California’s lower per capita investment coupled with higher PMA attainment indicates that the state is effectively able to “do more with less.” Among various steps that could be taken to address the situation are to explore the nature of California’s and Minnesota’s medical device industries, their approval application techniques, and their linkages to their regional health care industries. These deserve to be explored in an effort to understand how the New England region might improve its competitive positioning.

The Economic Contributions of Health Care to New England
51
5. Conclusion The health care industry is clearly of major importance to New England’s economy and society. As the number one health care center in the nation—and in many respects, the world—New England faces tremendous opportunities and challenges in preserving its leadership in health care goods, services, and innovation. Ensuring that the health care industry continues to contribute to the New England region should be a top priority for citizens and business and community leaders. In moving forward, key points to bear in mind about the industry’s value and competitiveness include the following: § Health care is a growing industry that disproportionately benefits the region. § The region enjoys superlative positioning. New England ranks first among nine
U.S. regions for the percentage of people directly employed by health care sectors. The region’s principal city for the industry, Boston, is the nation’s top-ranked health pole.
§ Although industrial activity in the region often gravitates around the two major
health pole clusters of Boston and New Haven-Meriden, the industry’s impact spreads throughout the region.
§ More than 800,000 jobs throughout the region are in health care fields,
representing over 11 percent of all regional employment. No less than five New England states—Rhode Island, Massachusetts, Connecticut, Maine, and Vermont—place in the top 10 states in the nation for percentage of workers directly employed by health care sectors. Even New Hampshire’s 18th place showing puts it firmly in the top half of the nation regarding health care employment.
§ When accounting for the cumulative effects of health care employment, the
impact on the region is even greater. 1.7 million people, 25 percent of the overall workforce, have jobs that are dependent upon the health care industry. The cumulative effects that apply to output value also means that the industry’s annual $53 billion in revenues is responsible for more than $121 billion in gross regional product.
§ The health care industry in the region is highly interdependent—both across
sectors and across the states where these sectors reside. How a given health care sector performs in one state, will have a profound impact on other sectors and other state economies.
§ The region not only leads in the health care industry overall, it has especial
strengths as a center for innovation. For example, three New England states—Massachusetts, Connecticut and Vermont—all rank among the top five states in
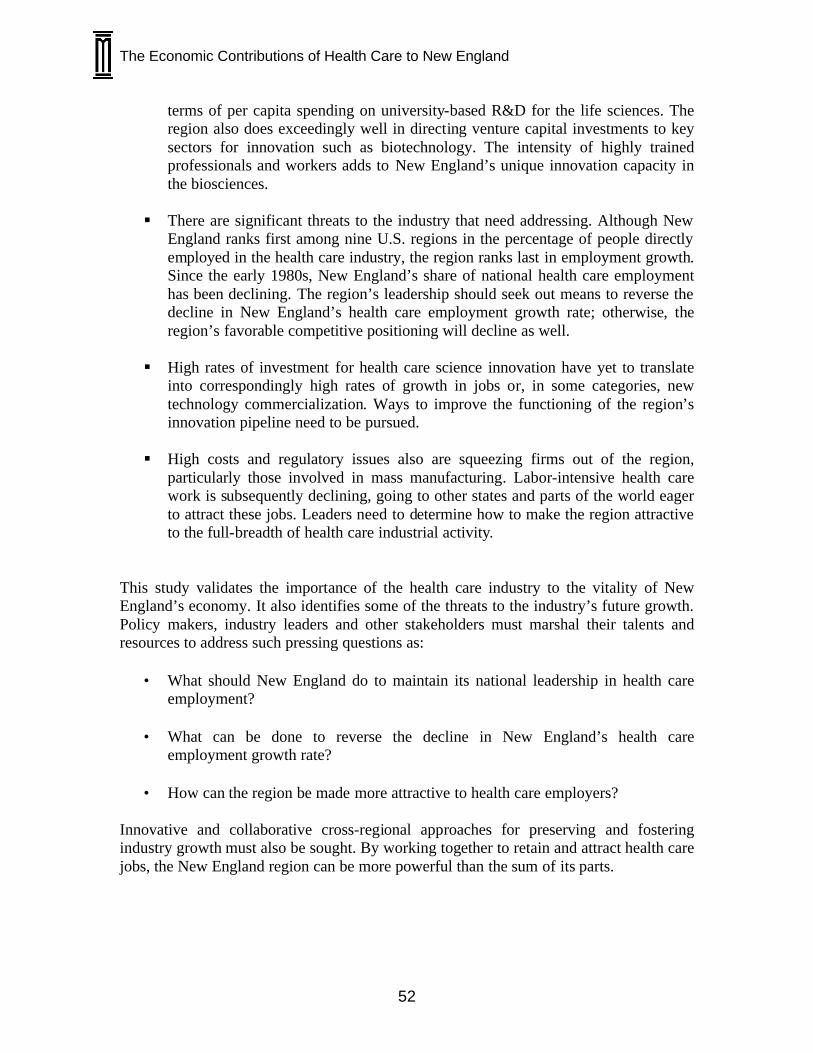
The Economic Contributions of Health Care to New England
52
terms of per capita spending on university-based R&D for the life sciences. The region also does exceedingly well in directing venture capital investments to key sectors for innovation such as biotechnology. The intensity of highly trained professionals and workers adds to New England’s unique innovation capacity in the biosciences.
§ There are significant threats to the industry that need addressing. Although New
England ranks first among nine U.S. regions in the percentage of people directly employed in the health care industry, the region ranks last in employment growth. Since the early 1980s, New England’s share of national health care employment has been declining. The region’s leadership should seek out means to reverse the decline in New England’s health care employment growth rate; otherwise, the region’s favorable competitive positioning will decline as well.
§ High rates of investment for health care science innovation have yet to translate
into correspondingly high rates of growth in jobs or, in some categories, new technology commercialization. Ways to improve the functioning of the region’s innovation pipeline need to be pursued.
§ High costs and regulatory issues also are squeezing firms out of the region,
particularly those involved in mass manufacturing. Labor-intensive health care work is subsequently declining, going to other states and parts of the world eager to attract these jobs. Leaders need to determine how to make the region attractive to the full-breadth of health care industrial activity.
This study validates the importance of the health care industry to the vitality of New England’s economy. It also identifies some of the threats to the industry’s future growth. Policy makers, industry leaders and other stakeholders must marshal their talents and resources to address such pressing questions as:
• What should New England do to maintain its national leadership in health care
employment?
• What can be done to reverse the decline in New England’s health care employment growth rate?
• How can the region be made more attractive to health care employers?
Innovative and collaborative cross-regional approaches for preserving and fostering industry growth must also be sought. By working together to retain and attract health care jobs, the New England region can be more powerful than the sum of its parts.

The Economic Contributions of Health Care to New England
53
6. Appendix

The Economic Contributions of Health Care to New England
54
Appendix - Drugs Profile
Rank StateLocationQuotient
% of StateTotal Emp.
Emp.(Ths.)
1 New Jersey 4.96 1.2 48.32 Delaware 4.63 1.1 4.73 Indiana 2.58 0.6 18.34 Connecticut 2.39 0.6 9.75 Pennsylvania 2.03 0.5 28.06 North Carolina 1.61 0.4 15.37 Utah 1.50 0.4 3.98 Illinois 1.49 0.4 21.69 Massachusetts 1.24 0.3 10.0
10 Michigan 1.23 0.3 13.722 Maine 0.44 0.1 0.625 New Hampshire 0.41 0.1 0.640 Vermont 0.10 0.03 0.141 Rhode Island 0.10 0.02 0.1
Top States Ranked by Employment Concentration, 2001Drugs
Sources: Economy.com, Milken Institute.
• Massachusetts and Connecticut are among
the nation’s leading pharmaceutical states. The two states together employ 19,700 in the pharma industry.
• Vermont and New Hampshire are among the top five in the nation in pharmaceutical employment growth from 1996-2001.
• Boston, New London and New Haven have
successfully contributed to their state’s performance. They are ranked among the top twenty metropolitan areas in the health pole index for drugs.
Rank State '80-'00 '80-'90 '90-'00 '96-'01 '00-'011 Vermont 2650.0 0.0 2650.0 316.7 36.42 Kentucky 1199.3 -2.8 1236.2 157.4 18.73 New Hampshire 1561.8 76.5 841.7 104.2 11.04 Washington 926.2 166.4 285.2 78.2 8.65 Utah 246.2 -28.3 382.6 75.4 7.06 Alabama 175.8 -8.1 200.0 58.3 6.47 Oregon 244.1 -14.1 300.7 57.4 14.78 West Virginia 334.7 63.8 165.4 54.5 7.69 Delaware 498.9 91.2 213.2 51.6 9.4
10 California 120.0 26.8 73.4 50.9 4.513 Massachusetts 201.7 5.8 185.2 38.6 5.220 Connecticut 81.2 41.4 28.2 20.7 0.240 Maine 116.6 -4.1 125.8 -15.8 -6.547 Rhode Island -57.5 -17.0 -48.8 -42.3 2.7
New England 126.1 26.1 79.4 27.9 2.7United States 59.0 20.9 31.5 22.9 2.6
Employment Growth, Ranked by 1996-2001 GrowthDrugs
Sources: Economy.com, Milken Institute.
Percent (%) Growth by Time Period
Rank Metroplitan Area Health Pole1 Newark NJ 100.002 Kalamazoo-Battle Creek MI 25.963 Philadelphia PA-NJ 23.554 Middlesex-Somerset-Hunterdon NJ 23.255 Indianapolis IN 22.546 Greenville NC 18.857 Wilmington-Newark DE-MD 13.758 Chicago IL 10.799 Rocky Mount NC 10.32
10 New London-Norwich CT-RI 9.2911 Nassau-Suffolk NY 6.5812 Boston MA-NH 6.0313 New Haven-Meridan CT 5.6014 Lafayette IN 5.5315 Grand Rapids-Spatanburg-Anderson SC 5.0716 Ventura CA 4.8117 Boulder-Longmon CO 4.6218 Lancaster PA 4.3119 San Jose CA 3.4820 New York NY 3.02
DrugsTop Twenty Metropolitan Areas by Health Pole, 2001
Sources: Milken Institute, Economy.com.
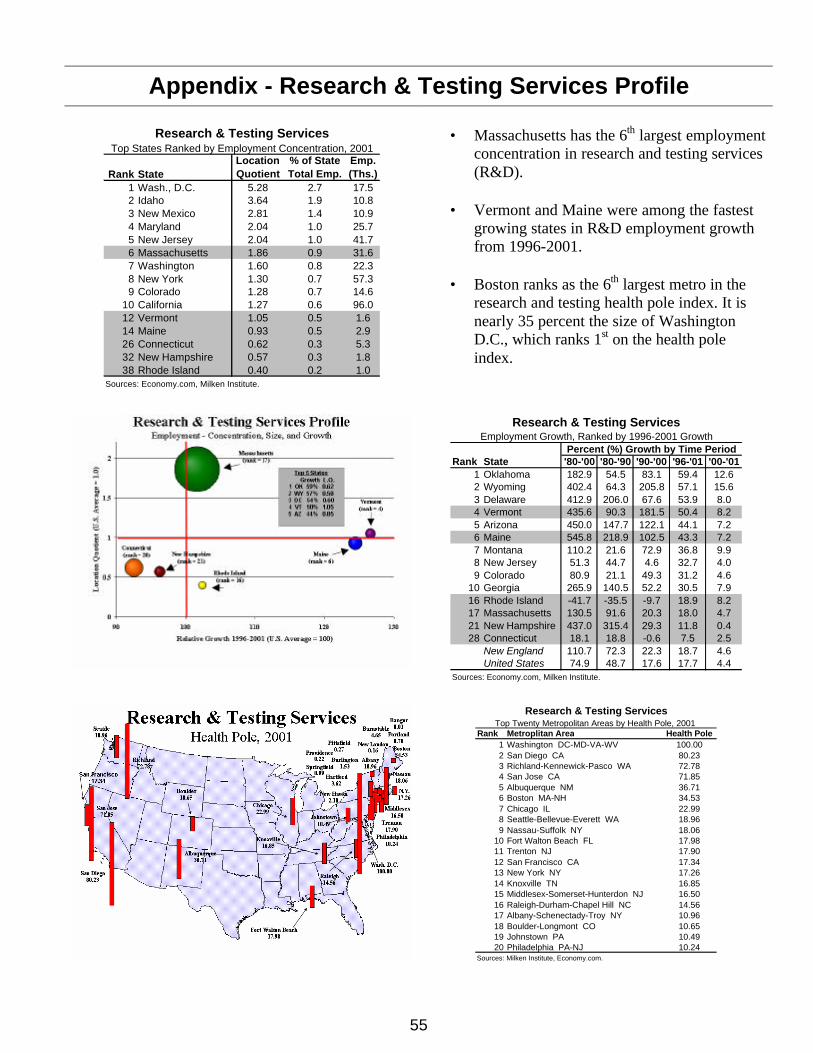
55
Appendix - Research & Testing Services Profile
Rank StateLocationQuotient
% of StateTotal Emp.
Emp.(Ths.)
1 Wash., D.C. 5.28 2.7 17.52 Idaho 3.64 1.9 10.83 New Mexico 2.81 1.4 10.94 Maryland 2.04 1.0 25.75 New Jersey 2.04 1.0 41.76 Massachusetts 1.86 0.9 31.67 Washington 1.60 0.8 22.38 New York 1.30 0.7 57.39 Colorado 1.28 0.7 14.6
10 California 1.27 0.6 96.012 Vermont 1.05 0.5 1.614 Maine 0.93 0.5 2.926 Connecticut 0.62 0.3 5.332 New Hampshire 0.57 0.3 1.838 Rhode Island 0.40 0.2 1.0
Sources: Economy.com, Milken Institute.
Research & Testing ServicesTop States Ranked by Employment Concentration, 2001
• Massachusetts has the 6th largest employment
concentration in research and testing services (R&D).
• Vermont and Maine were among the fastest
growing states in R&D employment growth from 1996-2001.
• Boston ranks as the 6th largest metro in the
research and testing health pole index. It is nearly 35 percent the size of Washington D.C., which ranks 1st on the health pole index.
Rank State '80-'00 '80-'90 '90-'00 '96-'01 '00-'011 Oklahoma 182.9 54.5 83.1 59.4 12.62 Wyoming 402.4 64.3 205.8 57.1 15.63 Delaware 412.9 206.0 67.6 53.9 8.04 Vermont 435.6 90.3 181.5 50.4 8.25 Arizona 450.0 147.7 122.1 44.1 7.26 Maine 545.8 218.9 102.5 43.3 7.27 Montana 110.2 21.6 72.9 36.8 9.98 New Jersey 51.3 44.7 4.6 32.7 4.09 Colorado 80.9 21.1 49.3 31.2 4.6
10 Georgia 265.9 140.5 52.2 30.5 7.916 Rhode Island -41.7 -35.5 -9.7 18.9 8.217 Massachusetts 130.5 91.6 20.3 18.0 4.721 New Hampshire 437.0 315.4 29.3 11.8 0.428 Connecticut 18.1 18.8 -0.6 7.5 2.5
New England 110.7 72.3 22.3 18.7 4.6United States 74.9 48.7 17.6 17.7 4.4
Sources: Economy.com, Milken Institute.
Research & Testing ServicesEmployment Growth, Ranked by 1996-2001 Growth
Percent (%) Growth by Time Period
Rank Metroplitan Area Health Pole1 Washington DC-MD-VA-WV 100.002 San Diego CA 80.233 Richland-Kennewick-Pasco WA 72.784 San Jose CA 71.855 Albuquerque NM 36.716 Boston MA-NH 34.537 Chicago IL 22.998 Seattle-Bellevue-Everett WA 18.969 Nassau-Suffolk NY 18.06
10 Fort Walton Beach FL 17.9811 Trenton NJ 17.9012 San Francisco CA 17.3413 New York NY 17.2614 Knoxville TN 16.8515 Middlesex-Somerset-Hunterdon NJ 16.5016 Raleigh-Durham-Chapel Hill NC 14.5617 Albany-Schenectady-Troy NY 10.9618 Boulder-Longmont CO 10.6519 Johnstown PA 10.4920 Philadelphia PA-NJ 10.24
Research & Testing ServicesTop Twenty Metropolitan Areas by Health Pole, 2001
Sources: Milken Institute, Economy.com.
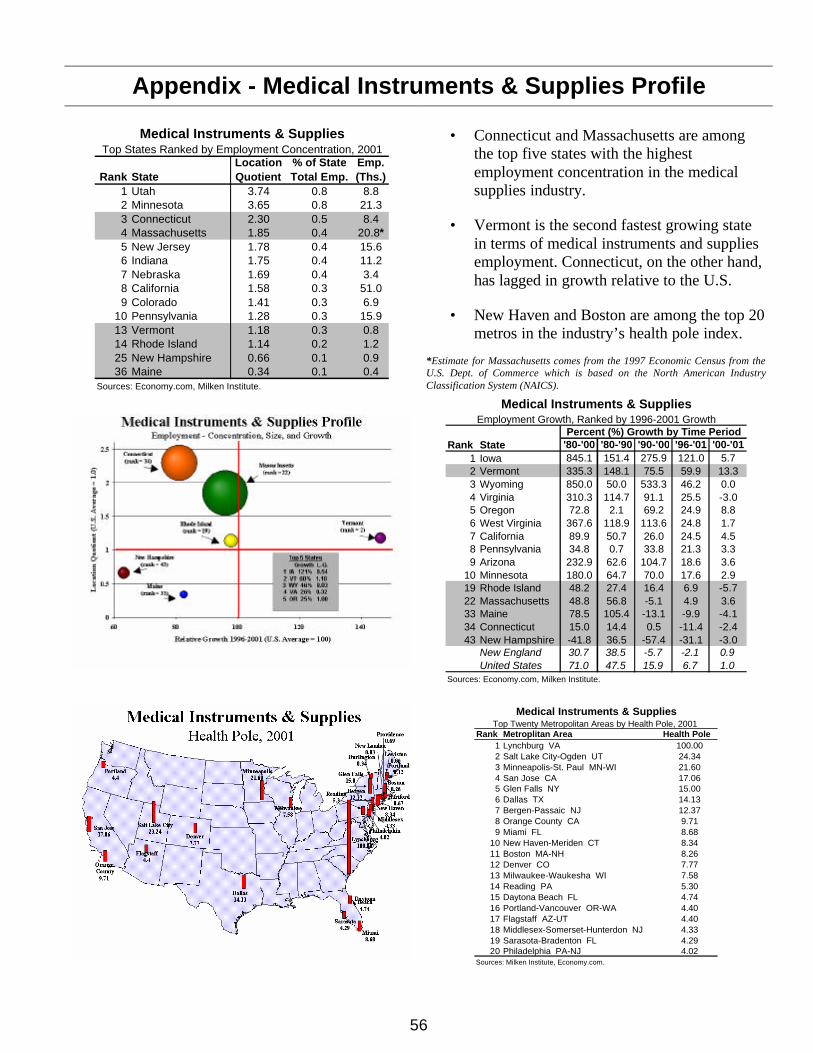
56
Appendix - Medical Instruments & Supplies Profile
Rank StateLocationQuotient
% of StateTotal Emp.
Emp.(Ths.)
1 Utah 3.74 0.8 8.82 Minnesota 3.65 0.8 21.33 Connecticut 2.30 0.5 8.44 Massachusetts 1.85 0.4 20.8*5 New Jersey 1.78 0.4 15.66 Indiana 1.75 0.4 11.27 Nebraska 1.69 0.4 3.48 California 1.58 0.3 51.09 Colorado 1.41 0.3 6.9
10 Pennsylvania 1.28 0.3 15.913 Vermont 1.18 0.3 0.814 Rhode Island 1.14 0.2 1.225 New Hampshire 0.66 0.1 0.936 Maine 0.34 0.1 0.4
Medical Instruments & SuppliesTop States Ranked by Employment Concentration, 2001
Sources: Economy.com, Milken Institute.
• Connecticut and Massachusetts are among
the top five states with the highest employment concentration in the medical supplies industry.
• Vermont is the second fastest growing state
in terms of medical instruments and supplies employment. Connecticut, on the other hand, has lagged in growth relative to the U.S.
• New Haven and Boston are among the top 20
metros in the industry’s health pole index. *Estimate for Massachusetts comes from the 1997 Economic Census from the U.S. Dept. of Commerce which is based on the North American Industry Classification System (NAICS).
Rank State '80-'00 '80-'90 '90-'00 '96-'01 '00-'011 Iowa 845.1 151.4 275.9 121.0 5.72 Vermont 335.3 148.1 75.5 59.9 13.33 Wyoming 850.0 50.0 533.3 46.2 0.04 Virginia 310.3 114.7 91.1 25.5 -3.05 Oregon 72.8 2.1 69.2 24.9 8.86 West Virginia 367.6 118.9 113.6 24.8 1.77 California 89.9 50.7 26.0 24.5 4.58 Pennsylvania 34.8 0.7 33.8 21.3 3.39 Arizona 232.9 62.6 104.7 18.6 3.6
10 Minnesota 180.0 64.7 70.0 17.6 2.919 Rhode Island 48.2 27.4 16.4 6.9 -5.722 Massachusetts 48.8 56.8 -5.1 4.9 3.633 Maine 78.5 105.4 -13.1 -9.9 -4.134 Connecticut 15.0 14.4 0.5 -11.4 -2.443 New Hampshire -41.8 36.5 -57.4 -31.1 -3.0
New England 30.7 38.5 -5.7 -2.1 0.9United States 71.0 47.5 15.9 6.7 1.0
Sources: Economy.com, Milken Institute.
Medical Instruments & SuppliesEmployment Growth, Ranked by 1996-2001 Growth
Percent (%) Growth by Time Period
Rank Metroplitan Area Health Pole1 Lynchburg VA 100.002 Salt Lake City-Ogden UT 24.343 Minneapolis-St. Paul MN-WI 21.604 San Jose CA 17.065 Glen Falls NY 15.006 Dallas TX 14.137 Bergen-Passaic NJ 12.378 Orange County CA 9.719 Miami FL 8.68
10 New Haven-Meriden CT 8.3411 Boston MA-NH 8.2612 Denver CO 7.7713 Milwaukee-Waukesha WI 7.5814 Reading PA 5.3015 Daytona Beach FL 4.7416 Portland-Vancouver OR-WA 4.4017 Flagstaff AZ-UT 4.4018 Middlesex-Somerset-Hunterdon NJ 4.3319 Sarasota-Bradenton FL 4.2920 Philadelphia PA-NJ 4.02
Medical Instruments & SuppliesTop Twenty Metropolitan Areas by Health Pole, 2001
Sources: Milken Institute, Economy.com.
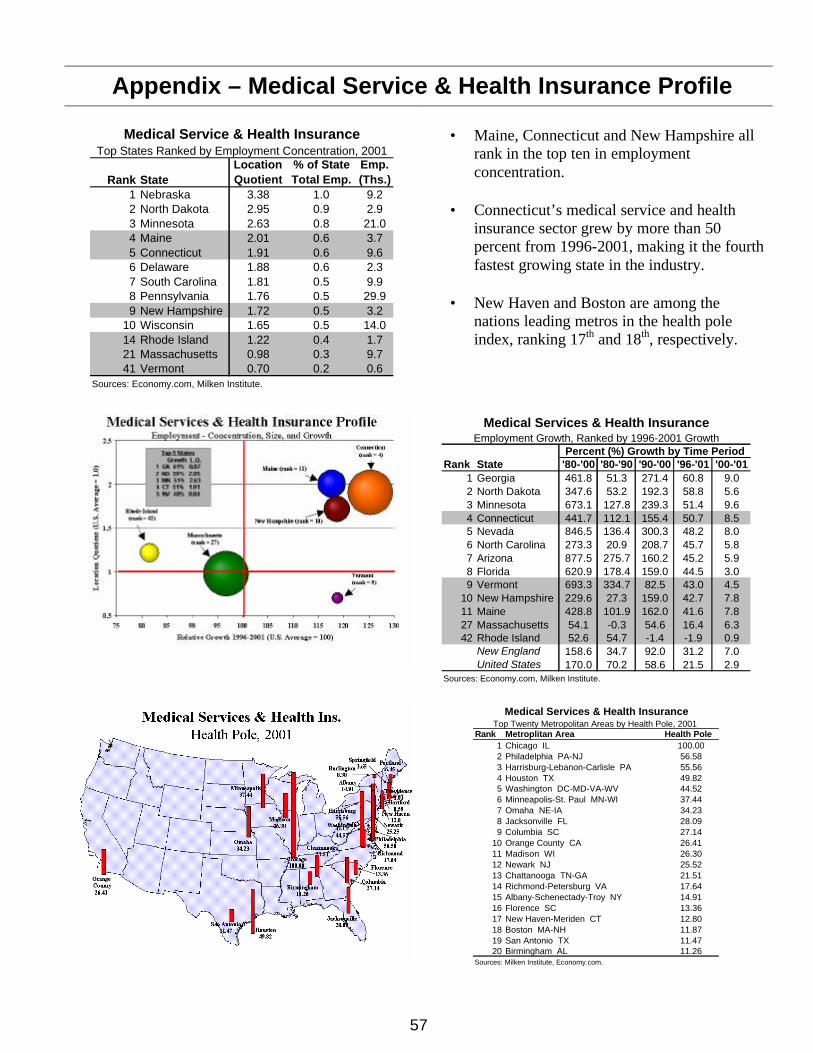
57
Appendix – Medical Service & Health Insurance Profile
Rank StateLocationQuotient
% of StateTotal Emp.
Emp.(Ths.)
1 Nebraska 3.38 1.0 9.22 North Dakota 2.95 0.9 2.93 Minnesota 2.63 0.8 21.04 Maine 2.01 0.6 3.75 Connecticut 1.91 0.6 9.66 Delaware 1.88 0.6 2.37 South Carolina 1.81 0.5 9.98 Pennsylvania 1.76 0.5 29.99 New Hampshire 1.72 0.5 3.2
10 Wisconsin 1.65 0.5 14.014 Rhode Island 1.22 0.4 1.721 Massachusetts 0.98 0.3 9.741 Vermont 0.70 0.2 0.6
Sources: Economy.com, Milken Institute.
Medical Service & Health InsuranceTop States Ranked by Employment Concentration, 2001
• Maine, Connecticut and New Hampshire all
rank in the top ten in employment concentration.
• Connecticut’s medical service and health
insurance sector grew by more than 50 percent from 1996-2001, making it the fourth fastest growing state in the industry.
• New Haven and Boston are among the
nations leading metros in the health pole index, ranking 17th and 18th, respectively.
Rank State '80-'00 '80-'90 '90-'00 '96-'01 '00-'011 Georgia 461.8 51.3 271.4 60.8 9.02 North Dakota 347.6 53.2 192.3 58.8 5.63 Minnesota 673.1 127.8 239.3 51.4 9.64 Connecticut 441.7 112.1 155.4 50.7 8.55 Nevada 846.5 136.4 300.3 48.2 8.06 North Carolina 273.3 20.9 208.7 45.7 5.87 Arizona 877.5 275.7 160.2 45.2 5.98 Florida 620.9 178.4 159.0 44.5 3.09 Vermont 693.3 334.7 82.5 43.0 4.5
10 New Hampshire 229.6 27.3 159.0 42.7 7.811 Maine 428.8 101.9 162.0 41.6 7.827 Massachusetts 54.1 -0.3 54.6 16.4 6.342 Rhode Island 52.6 54.7 -1.4 -1.9 0.9
New England 158.6 34.7 92.0 31.2 7.0United States 170.0 70.2 58.6 21.5 2.9
Medical Services & Health InsuranceEmployment Growth, Ranked by 1996-2001 Growth
Sources: Economy.com, Milken Institute.
Percent (%) Growth by Time Period
Rank Metroplitan Area Health Pole1 Chicago IL 100.002 Philadelphia PA-NJ 56.583 Harrisburg-Lebanon-Carlisle PA 55.564 Houston TX 49.825 Washington DC-MD-VA-WV 44.526 Minneapolis-St. Paul MN-WI 37.447 Omaha NE-IA 34.238 Jacksonville FL 28.099 Columbia SC 27.14
10 Orange County CA 26.4111 Madison WI 26.3012 Newark NJ 25.5213 Chattanooga TN-GA 21.5114 Richmond-Petersburg VA 17.6415 Albany-Schenectady-Troy NY 14.9116 Florence SC 13.3617 New Haven-Meriden CT 12.8018 Boston MA-NH 11.8719 San Antonio TX 11.4720 Birmingham AL 11.26
Medical Services & Health InsuranceTop Twenty Metropolitan Areas by Health Pole, 2001
Sources: Milken Institute, Economy.com.
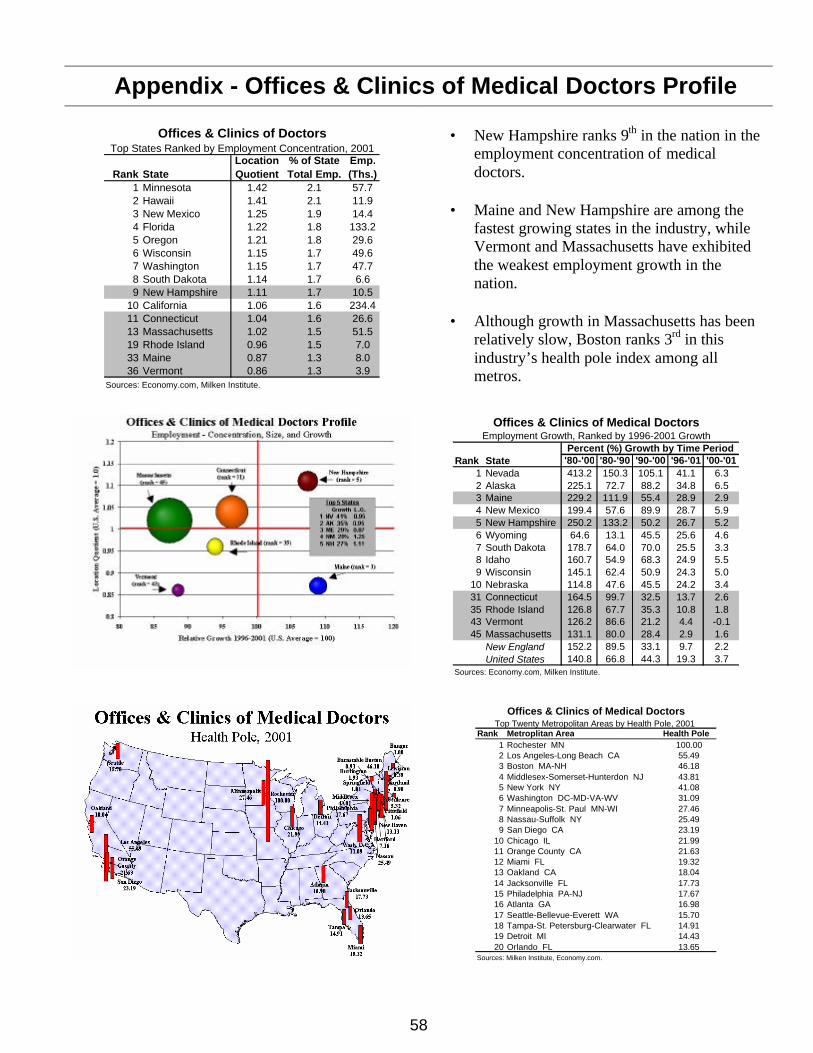
58
Appendix - Offices & Clinics of Medical Doctors Profile
Rank StateLocationQuotient
% of StateTotal Emp.
Emp.(Ths.)
1 Minnesota 1.42 2.1 57.72 Hawaii 1.41 2.1 11.93 New Mexico 1.25 1.9 14.44 Florida 1.22 1.8 133.25 Oregon 1.21 1.8 29.66 Wisconsin 1.15 1.7 49.67 Washington 1.15 1.7 47.78 South Dakota 1.14 1.7 6.69 New Hampshire 1.11 1.7 10.5
10 California 1.06 1.6 234.411 Connecticut 1.04 1.6 26.613 Massachusetts 1.02 1.5 51.519 Rhode Island 0.96 1.5 7.033 Maine 0.87 1.3 8.036 Vermont 0.86 1.3 3.9
Sources: Economy.com, Milken Institute.
Offices & Clinics of DoctorsTop States Ranked by Employment Concentration, 2001
• New Hampshire ranks 9th in the nation in the
employment concentration of medical doctors.
• Maine and New Hampshire are among the
fastest growing states in the industry, while Vermont and Massachusetts have exhibited the weakest employment growth in the nation.
• Although growth in Massachusetts has been
relatively slow, Boston ranks 3rd in this industry’s health pole index among all metros.
Rank State '80-'00 '80-'90 '90-'00 '96-'01 '00-'011 Nevada 413.2 150.3 105.1 41.1 6.32 Alaska 225.1 72.7 88.2 34.8 6.53 Maine 229.2 111.9 55.4 28.9 2.94 New Mexico 199.4 57.6 89.9 28.7 5.95 New Hampshire 250.2 133.2 50.2 26.7 5.26 Wyoming 64.6 13.1 45.5 25.6 4.67 South Dakota 178.7 64.0 70.0 25.5 3.38 Idaho 160.7 54.9 68.3 24.9 5.59 Wisconsin 145.1 62.4 50.9 24.3 5.0
10 Nebraska 114.8 47.6 45.5 24.2 3.431 Connecticut 164.5 99.7 32.5 13.7 2.635 Rhode Island 126.8 67.7 35.3 10.8 1.843 Vermont 126.2 86.6 21.2 4.4 -0.145 Massachusetts 131.1 80.0 28.4 2.9 1.6
New England 152.2 89.5 33.1 9.7 2.2United States 140.8 66.8 44.3 19.3 3.7
Offices & Clinics of Medical DoctorsEmployment Growth, Ranked by 1996-2001 Growth
Sources: Economy.com, Milken Institute.
Percent (%) Growth by Time Period
Rank Metroplitan Area Health Pole1 Rochester MN 100.002 Los Angeles-Long Beach CA 55.493 Boston MA-NH 46.184 Middlesex-Somerset-Hunterdon NJ 43.815 New York NY 41.086 Washington DC-MD-VA-WV 31.097 Minneapolis-St. Paul MN-WI 27.468 Nassau-Suffolk NY 25.499 San Diego CA 23.19
10 Chicago IL 21.9911 Orange County CA 21.6312 Miami FL 19.3213 Oakland CA 18.0414 Jacksonville FL 17.7315 Philadelphia PA-NJ 17.6716 Atlanta GA 16.9817 Seattle-Bellevue-Everett WA 15.7018 Tampa-St. Petersburg-Clearwater FL 14.9119 Detroit MI 14.4320 Orlando FL 13.65
Offices & Clinics of Medical DoctorsTop Twenty Metropolitan Areas by Health Pole, 2001
Sources: Milken Institute, Economy.com.
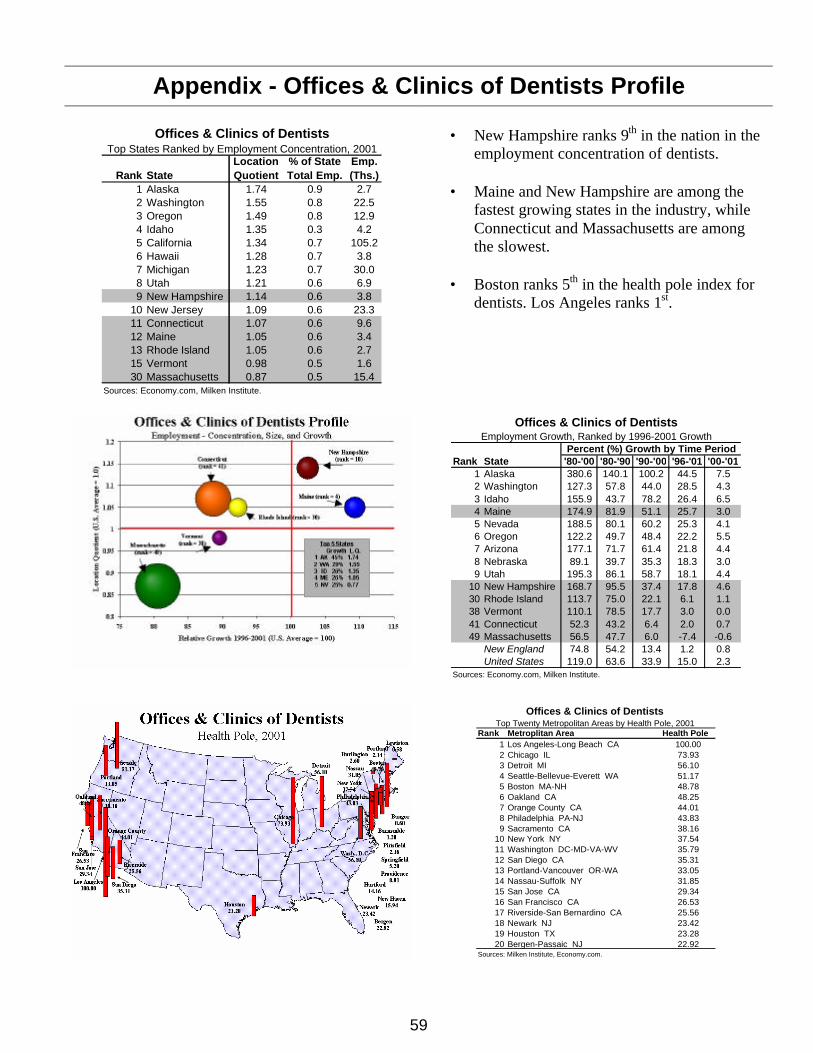
59
Appendix - Offices & Clinics of Dentists Profile
Rank StateLocationQuotient
% of StateTotal Emp.
Emp.(Ths.)
1 Alaska 1.74 0.9 2.72 Washington 1.55 0.8 22.53 Oregon 1.49 0.8 12.94 Idaho 1.35 0.3 4.25 California 1.34 0.7 105.26 Hawaii 1.28 0.7 3.87 Michigan 1.23 0.7 30.08 Utah 1.21 0.6 6.99 New Hampshire 1.14 0.6 3.8
10 New Jersey 1.09 0.6 23.311 Connecticut 1.07 0.6 9.612 Maine 1.05 0.6 3.413 Rhode Island 1.05 0.6 2.715 Vermont 0.98 0.5 1.630 Massachusetts 0.87 0.5 15.4
Sources: Economy.com, Milken Institute.
Offices & Clinics of DentistsTop States Ranked by Employment Concentration, 2001
• New Hampshire ranks 9th in the nation in the
employment concentration of dentists. • Maine and New Hampshire are among the
fastest growing states in the industry, while Connecticut and Massachusetts are among the slowest.
• Boston ranks 5th in the health pole index for
dentists. Los Angeles ranks 1st.
Rank State '80-'00 '80-'90 '90-'00 '96-'01 '00-'011 Alaska 380.6 140.1 100.2 44.5 7.52 Washington 127.3 57.8 44.0 28.5 4.33 Idaho 155.9 43.7 78.2 26.4 6.54 Maine 174.9 81.9 51.1 25.7 3.05 Nevada 188.5 80.1 60.2 25.3 4.16 Oregon 122.2 49.7 48.4 22.2 5.57 Arizona 177.1 71.7 61.4 21.8 4.48 Nebraska 89.1 39.7 35.3 18.3 3.09 Utah 195.3 86.1 58.7 18.1 4.4
10 New Hampshire 168.7 95.5 37.4 17.8 4.630 Rhode Island 113.7 75.0 22.1 6.1 1.138 Vermont 110.1 78.5 17.7 3.0 0.041 Connecticut 52.3 43.2 6.4 2.0 0.749 Massachusetts 56.5 47.7 6.0 -7.4 -0.6
New England 74.8 54.2 13.4 1.2 0.8United States 119.0 63.6 33.9 15.0 2.3
Sources: Economy.com, Milken Institute.
Offices & Clinics of DentistsEmployment Growth, Ranked by 1996-2001 Growth
Percent (%) Growth by Time Period
Rank Metroplitan Area Health Pole1 Los Angeles-Long Beach CA 100.002 Chicago IL 73.933 Detroit MI 56.104 Seattle-Bellevue-Everett WA 51.175 Boston MA-NH 48.786 Oakland CA 48.257 Orange County CA 44.018 Philadelphia PA-NJ 43.839 Sacramento CA 38.16
10 New York NY 37.5411 Washington DC-MD-VA-WV 35.7912 San Diego CA 35.3113 Portland-Vancouver OR-WA 33.0514 Nassau-Suffolk NY 31.8515 San Jose CA 29.3416 San Francisco CA 26.5317 Riverside-San Bernardino CA 25.5618 Newark NJ 23.4219 Houston TX 23.2820 Bergen-Passaic NJ 22.92
Offices & Clinics of Dentists Top Twenty Metropolitan Areas by Health Pole, 2001
Sources: Milken Institute, Economy.com.
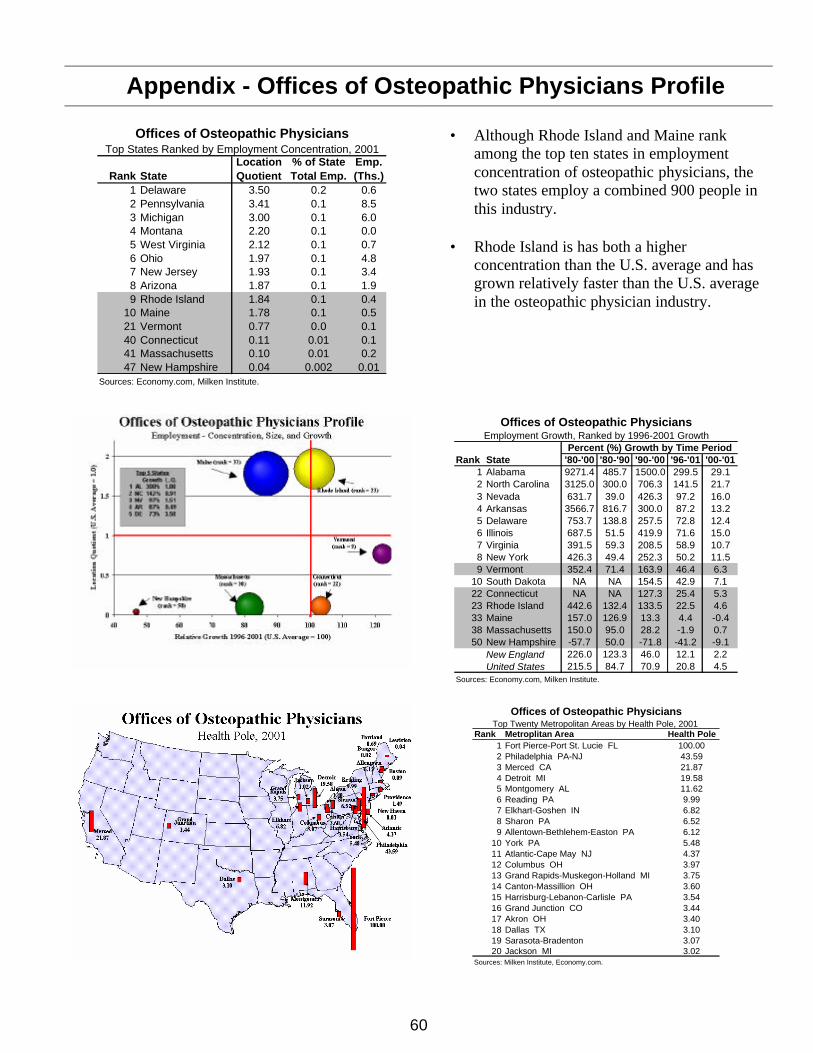
60
Appendix - Offices of Osteopathic Physicians Profile
Rank StateLocationQuotient
% of StateTotal Emp.
Emp.(Ths.)
1 Delaware 3.50 0.2 0.62 Pennsylvania 3.41 0.1 8.53 Michigan 3.00 0.1 6.04 Montana 2.20 0.1 0.05 West Virginia 2.12 0.1 0.76 Ohio 1.97 0.1 4.87 New Jersey 1.93 0.1 3.48 Arizona 1.87 0.1 1.99 Rhode Island 1.84 0.1 0.4
10 Maine 1.78 0.1 0.521 Vermont 0.77 0.0 0.140 Connecticut 0.11 0.01 0.141 Massachusetts 0.10 0.01 0.247 New Hampshire 0.04 0.002 0.01
Sources: Economy.com, Milken Institute.
Offices of Osteopathic PhysiciansTop States Ranked by Employment Concentration, 2001
• Although Rhode Island and Maine rank
among the top ten states in employment concentration of osteopathic physicians, the two states employ a combined 900 people in this industry.
• Rhode Island is has both a higher
concentration than the U.S. average and has grown relatively faster than the U.S. average in the osteopathic physician industry.
Rank State '80-'00 '80-'90 '90-'00 '96-'01 '00-'011 Alabama 9271.4 485.7 1500.0 299.5 29.12 North Carolina 3125.0 300.0 706.3 141.5 21.73 Nevada 631.7 39.0 426.3 97.2 16.04 Arkansas 3566.7 816.7 300.0 87.2 13.25 Delaware 753.7 138.8 257.5 72.8 12.46 Illinois 687.5 51.5 419.9 71.6 15.07 Virginia 391.5 59.3 208.5 58.9 10.78 New York 426.3 49.4 252.3 50.2 11.59 Vermont 352.4 71.4 163.9 46.4 6.3
10 South Dakota NA NA 154.5 42.9 7.122 Connecticut NA NA 127.3 25.4 5.323 Rhode Island 442.6 132.4 133.5 22.5 4.633 Maine 157.0 126.9 13.3 4.4 -0.438 Massachusetts 150.0 95.0 28.2 -1.9 0.750 New Hampshire -57.7 50.0 -71.8 -41.2 -9.1
New England 226.0 123.3 46.0 12.1 2.2United States 215.5 84.7 70.9 20.8 4.5
Sources: Economy.com, Milken Institute.
Offices of Osteopathic PhysiciansEmployment Growth, Ranked by 1996-2001 Growth
Percent (%) Growth by Time Period
Rank Metroplitan Area Health Pole1 Fort Pierce-Port St. Lucie FL 100.002 Philadelphia PA-NJ 43.593 Merced CA 21.874 Detroit MI 19.585 Montgomery AL 11.626 Reading PA 9.997 Elkhart-Goshen IN 6.828 Sharon PA 6.529 Allentown-Bethlehem-Easton PA 6.12
10 York PA 5.4811 Atlantic-Cape May NJ 4.3712 Columbus OH 3.9713 Grand Rapids-Muskegon-Holland MI 3.7514 Canton-Massillion OH 3.6015 Harrisburg-Lebanon-Carlisle PA 3.5416 Grand Junction CO 3.4417 Akron OH 3.4018 Dallas TX 3.1019 Sarasota-Bradenton 3.0720 Jackson MI 3.02
Offices of Osteopathic PhysiciansTop Twenty Metropolitan Areas by Health Pole, 2001
Sources: Milken Institute, Economy.com.
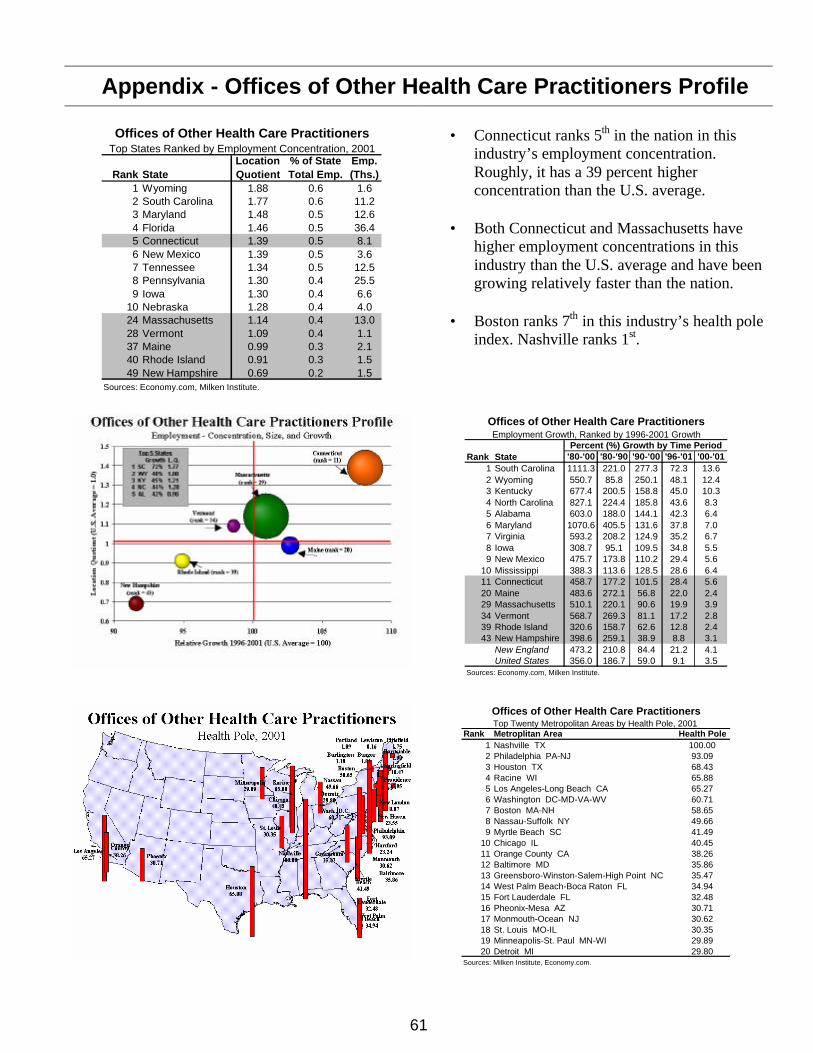
61
Appendix - Offices of Other Health Care Practitioners Profile
Rank StateLocationQuotient
% of StateTotal Emp.
Emp.(Ths.)
1 Wyoming 1.88 0.6 1.62 South Carolina 1.77 0.6 11.23 Maryland 1.48 0.5 12.64 Florida 1.46 0.5 36.45 Connecticut 1.39 0.5 8.16 New Mexico 1.39 0.5 3.67 Tennessee 1.34 0.5 12.58 Pennsylvania 1.30 0.4 25.59 Iowa 1.30 0.4 6.6
10 Nebraska 1.28 0.4 4.024 Massachusetts 1.14 0.4 13.028 Vermont 1.09 0.4 1.137 Maine 0.99 0.3 2.140 Rhode Island 0.91 0.3 1.549 New Hampshire 0.69 0.2 1.5
Sources: Economy.com, Milken Institute.
Offices of Other Health Care PractitionersTop States Ranked by Employment Concentration, 2001
• Connecticut ranks 5th in the nation in this
industry’s employment concentration. Roughly, it has a 39 percent higher concentration than the U.S. average.
• Both Connecticut and Massachusetts have
higher employment concentrations in this industry than the U.S. average and have been growing relatively faster than the nation.
• Boston ranks 7th in this industry’s health pole
index. Nashville ranks 1st.
Rank State '80-'00 '80-'90 '90-'00 '96-'01 '00-'011 South Carolina 1111.3 221.0 277.3 72.3 13.62 Wyoming 550.7 85.8 250.1 48.1 12.43 Kentucky 677.4 200.5 158.8 45.0 10.34 North Carolina 827.1 224.4 185.8 43.6 8.35 Alabama 603.0 188.0 144.1 42.3 6.46 Maryland 1070.6 405.5 131.6 37.8 7.07 Virginia 593.2 208.2 124.9 35.2 6.78 Iowa 308.7 95.1 109.5 34.8 5.59 New Mexico 475.7 173.8 110.2 29.4 5.6
10 Mississippi 388.3 113.6 128.5 28.6 6.411 Connecticut 458.7 177.2 101.5 28.4 5.620 Maine 483.6 272.1 56.8 22.0 2.429 Massachusetts 510.1 220.1 90.6 19.9 3.934 Vermont 568.7 269.3 81.1 17.2 2.839 Rhode Island 320.6 158.7 62.6 12.8 2.443 New Hampshire 398.6 259.1 38.9 8.8 3.1
New England 473.2 210.8 84.4 21.2 4.1United States 356.0 186.7 59.0 9.1 3.5
Sources: Economy.com, Milken Institute.
Offices of Other Health Care PractitionersEmployment Growth, Ranked by 1996-2001 Growth
Percent (%) Growth by Time Period
Rank Metroplitan Area Health Pole1 Nashville TX 100.002 Philadelphia PA-NJ 93.093 Houston TX 68.434 Racine WI 65.885 Los Angeles-Long Beach CA 65.276 Washington DC-MD-VA-WV 60.717 Boston MA-NH 58.658 Nassau-Suffolk NY 49.669 Myrtle Beach SC 41.49
10 Chicago IL 40.4511 Orange County CA 38.2612 Baltimore MD 35.8613 Greensboro-Winston-Salem-High Point NC 35.4714 West Palm Beach-Boca Raton FL 34.9415 Fort Lauderdale FL 32.4816 Pheonix-Mesa AZ 30.7117 Monmouth-Ocean NJ 30.6218 St. Louis MO-IL 30.3519 Minneapolis-St. Paul MN-WI 29.8920 Detroit MI 29.80
Offices of Other Health Care PractitionersTop Twenty Metropolitan Areas by Health Pole, 2001
Sources: Milken Institute, Economy.com.
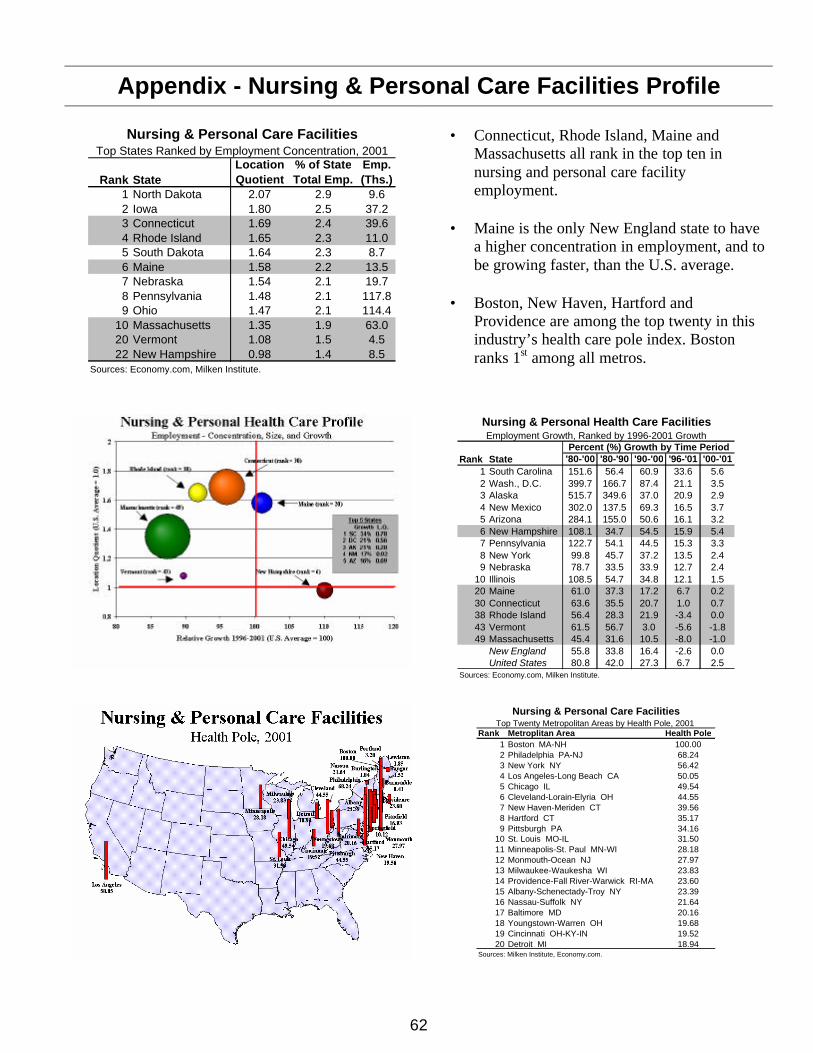
62
Appendix - Nursing & Personal Care Facilities Profile
Rank StateLocationQuotient
% of StateTotal Emp.
Emp.(Ths.)
1 North Dakota 2.07 2.9 9.62 Iowa 1.80 2.5 37.23 Connecticut 1.69 2.4 39.64 Rhode Island 1.65 2.3 11.05 South Dakota 1.64 2.3 8.76 Maine 1.58 2.2 13.57 Nebraska 1.54 2.1 19.78 Pennsylvania 1.48 2.1 117.89 Ohio 1.47 2.1 114.4
10 Massachusetts 1.35 1.9 63.020 Vermont 1.08 1.5 4.522 New Hampshire 0.98 1.4 8.5
Sources: Economy.com, Milken Institute.
Nursing & Personal Care FacilitiesTop States Ranked by Employment Concentration, 2001
• Connecticut, Rhode Island, Maine and
Massachusetts all rank in the top ten in nursing and personal care facility employment.
• Maine is the only New England state to have
a higher concentration in employment, and to be growing faster, than the U.S. average.
• Boston, New Haven, Hartford and
Providence are among the top twenty in this industry’s health care pole index. Boston ranks 1st among all metros.
Rank State '80-'00 '80-'90 '90-'00 '96-'01 '00-'011 South Carolina 151.6 56.4 60.9 33.6 5.62 Wash., D.C. 399.7 166.7 87.4 21.1 3.53 Alaska 515.7 349.6 37.0 20.9 2.94 New Mexico 302.0 137.5 69.3 16.5 3.75 Arizona 284.1 155.0 50.6 16.1 3.26 New Hampshire 108.1 34.7 54.5 15.9 5.47 Pennsylvania 122.7 54.1 44.5 15.3 3.38 New York 99.8 45.7 37.2 13.5 2.49 Nebraska 78.7 33.5 33.9 12.7 2.4
10 Illinois 108.5 54.7 34.8 12.1 1.520 Maine 61.0 37.3 17.2 6.7 0.230 Connecticut 63.6 35.5 20.7 1.0 0.738 Rhode Island 56.4 28.3 21.9 -3.4 0.043 Vermont 61.5 56.7 3.0 -5.6 -1.849 Massachusetts 45.4 31.6 10.5 -8.0 -1.0
New England 55.8 33.8 16.4 -2.6 0.0United States 80.8 42.0 27.3 6.7 2.5
Sources: Economy.com, Milken Institute.
Nursing & Personal Health Care FacilitiesEmployment Growth, Ranked by 1996-2001 Growth
Percent (%) Growth by Time Period
Rank Metroplitan Area Health Pole1 Boston MA-NH 100.002 Philadelphia PA-NJ 68.243 New York NY 56.424 Los Angeles-Long Beach CA 50.055 Chicago IL 49.546 Cleveland-Lorain-Elyria OH 44.557 New Haven-Meriden CT 39.568 Hartford CT 35.179 Pittsburgh PA 34.16
10 St. Louis MO-IL 31.5011 Minneapolis-St. Paul MN-WI 28.1812 Monmouth-Ocean NJ 27.9713 Milwaukee-Waukesha WI 23.8314 Providence-Fall River-Warwick RI-MA 23.6015 Albany-Schenectady-Troy NY 23.3916 Nassau-Suffolk NY 21.6417 Baltimore MD 20.1618 Youngstown-Warren OH 19.6819 Cincinnati OH-KY-IN 19.5220 Detroit MI 18.94
Nursing & Personal Care FacilitiesTop Twenty Metropolitan Areas by Health Pole, 2001
Sources: Milken Institute, Economy.com.
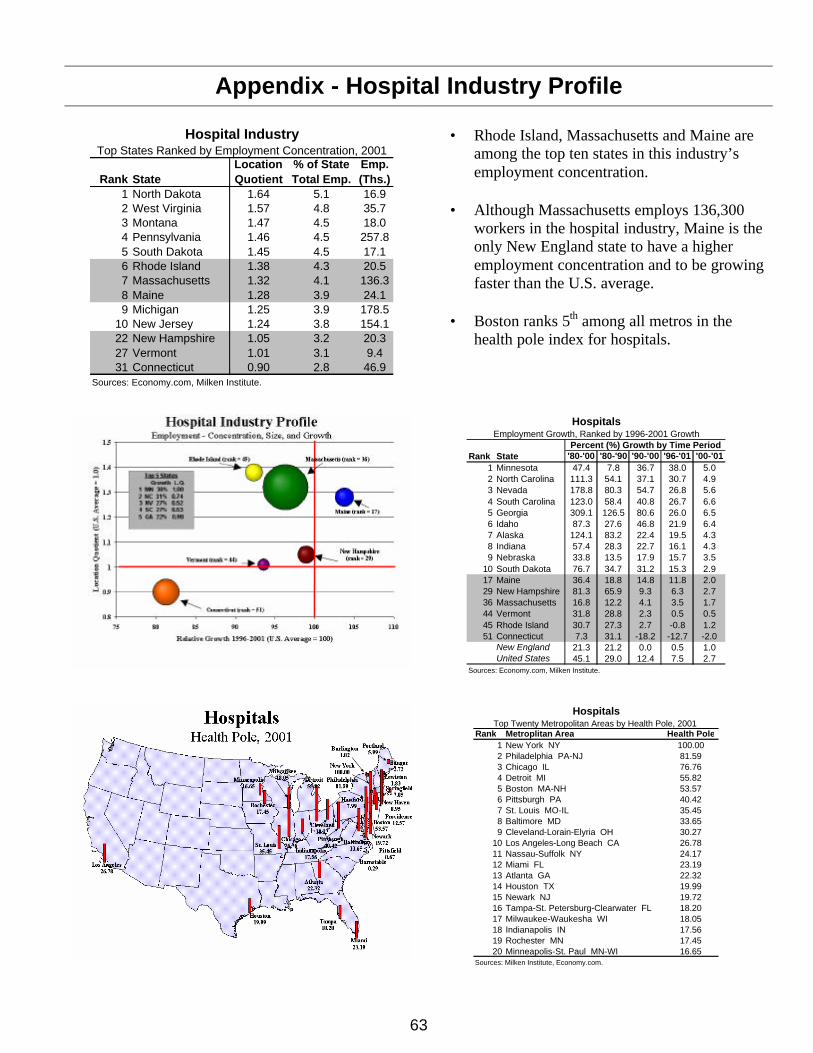
63
Appendix - Hospital Industry Profile
Rank StateLocationQuotient
% of StateTotal Emp.
Emp.(Ths.)
1 North Dakota 1.64 5.1 16.92 West Virginia 1.57 4.8 35.73 Montana 1.47 4.5 18.04 Pennsylvania 1.46 4.5 257.85 South Dakota 1.45 4.5 17.16 Rhode Island 1.38 4.3 20.57 Massachusetts 1.32 4.1 136.38 Maine 1.28 3.9 24.19 Michigan 1.25 3.9 178.5
10 New Jersey 1.24 3.8 154.122 New Hampshire 1.05 3.2 20.327 Vermont 1.01 3.1 9.431 Connecticut 0.90 2.8 46.9
Sources: Economy.com, Milken Institute.
Hospital IndustryTop States Ranked by Employment Concentration, 2001
• Rhode Island, Massachusetts and Maine are
among the top ten states in this industry’s employment concentration.
• Although Massachusetts employs 136,300
workers in the hospital industry, Maine is the only New England state to have a higher employment concentration and to be growing faster than the U.S. average.
• Boston ranks 5th among all metros in the
health pole index for hospitals.
Rank State '80-'00 '80-'90 '90-'00 '96-'01 '00-'011 Minnesota 47.4 7.8 36.7 38.0 5.02 North Carolina 111.3 54.1 37.1 30.7 4.93 Nevada 178.8 80.3 54.7 26.8 5.64 South Carolina 123.0 58.4 40.8 26.7 6.65 Georgia 309.1 126.5 80.6 26.0 6.56 Idaho 87.3 27.6 46.8 21.9 6.47 Alaska 124.1 83.2 22.4 19.5 4.38 Indiana 57.4 28.3 22.7 16.1 4.39 Nebraska 33.8 13.5 17.9 15.7 3.5
10 South Dakota 76.7 34.7 31.2 15.3 2.917 Maine 36.4 18.8 14.8 11.8 2.029 New Hampshire 81.3 65.9 9.3 6.3 2.736 Massachusetts 16.8 12.2 4.1 3.5 1.744 Vermont 31.8 28.8 2.3 0.5 0.545 Rhode Island 30.7 27.3 2.7 -0.8 1.251 Connecticut 7.3 31.1 -18.2 -12.7 -2.0
New England 21.3 21.2 0.0 0.5 1.0United States 45.1 29.0 12.4 7.5 2.7
Sources: Economy.com, Milken Institute.
HospitalsEmployment Growth, Ranked by 1996-2001 Growth
Percent (%) Growth by Time Period
Rank Metroplitan Area Health Pole1 New York NY 100.002 Philadelphia PA-NJ 81.593 Chicago IL 76.764 Detroit MI 55.825 Boston MA-NH 53.576 Pittsburgh PA 40.427 St. Louis MO-IL 35.458 Baltimore MD 33.659 Cleveland-Lorain-Elyria OH 30.27
10 Los Angeles-Long Beach CA 26.7811 Nassau-Suffolk NY 24.1712 Miami FL 23.1913 Atlanta GA 22.3214 Houston TX 19.9915 Newark NJ 19.7216 Tampa-St. Petersburg-Clearwater FL 18.2017 Milwaukee-Waukesha WI 18.0518 Indianapolis IN 17.5619 Rochester MN 17.4520 Minneapolis-St. Paul MN-WI 16.65
HospitalsTop Twenty Metropolitan Areas by Health Pole, 2001
Sources: Milken Institute, Economy.com.
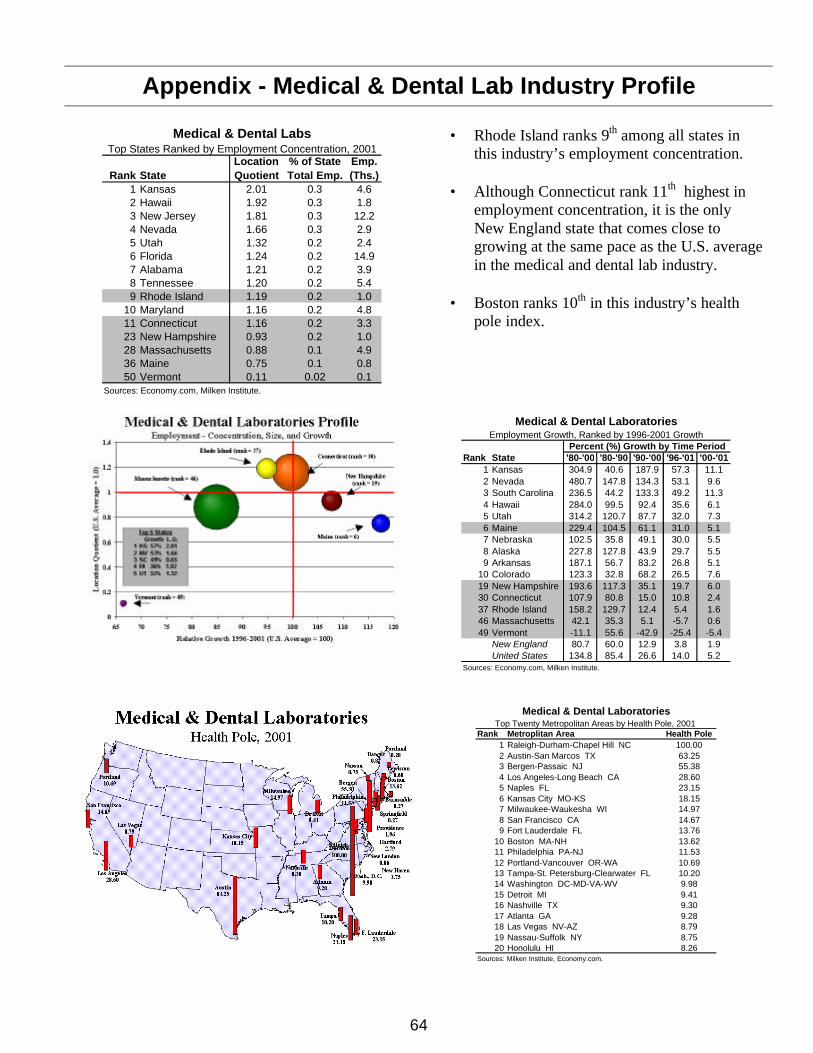
64
Appendix - Medical & Dental Lab Industry Profile
Rank StateLocationQuotient
% of StateTotal Emp.
Emp.(Ths.)
1 Kansas 2.01 0.3 4.62 Hawaii 1.92 0.3 1.83 New Jersey 1.81 0.3 12.24 Nevada 1.66 0.3 2.95 Utah 1.32 0.2 2.46 Florida 1.24 0.2 14.97 Alabama 1.21 0.2 3.98 Tennessee 1.20 0.2 5.49 Rhode Island 1.19 0.2 1.0
10 Maryland 1.16 0.2 4.811 Connecticut 1.16 0.2 3.323 New Hampshire 0.93 0.2 1.028 Massachusetts 0.88 0.1 4.936 Maine 0.75 0.1 0.850 Vermont 0.11 0.02 0.1
Sources: Economy.com, Milken Institute.
Medical & Dental LabsTop States Ranked by Employment Concentration, 2001
• Rhode Island ranks 9th among all states in
this industry’s employment concentration.
• Although Connecticut rank 11th highest in employment concentration, it is the only New England state that comes close to growing at the same pace as the U.S. average in the medical and dental lab industry.
• Boston ranks 10th in this industry’s health
pole index.
Rank State '80-'00 '80-'90 '90-'00 '96-'01 '00-'011 Kansas 304.9 40.6 187.9 57.3 11.12 Nevada 480.7 147.8 134.3 53.1 9.63 South Carolina 236.5 44.2 133.3 49.2 11.34 Hawaii 284.0 99.5 92.4 35.6 6.15 Utah 314.2 120.7 87.7 32.0 7.36 Maine 229.4 104.5 61.1 31.0 5.17 Nebraska 102.5 35.8 49.1 30.0 5.58 Alaska 227.8 127.8 43.9 29.7 5.59 Arkansas 187.1 56.7 83.2 26.8 5.1
10 Colorado 123.3 32.8 68.2 26.5 7.619 New Hampshire 193.6 117.3 35.1 19.7 6.030 Connecticut 107.9 80.8 15.0 10.8 2.437 Rhode Island 158.2 129.7 12.4 5.4 1.646 Massachusetts 42.1 35.3 5.1 -5.7 0.649 Vermont -11.1 55.6 -42.9 -25.4 -5.4
New England 80.7 60.0 12.9 3.8 1.9United States 134.8 85.4 26.6 14.0 5.2
Sources: Economy.com, Milken Institute.
Medical & Dental LaboratoriesEmployment Growth, Ranked by 1996-2001 Growth
Percent (%) Growth by Time Period
Rank Metroplitan Area Health Pole1 Raleigh-Durham-Chapel Hill NC 100.002 Austin-San Marcos TX 63.253 Bergen-Passaic NJ 55.384 Los Angeles-Long Beach CA 28.605 Naples FL 23.156 Kansas City MO-KS 18.157 Milwaukee-Waukesha WI 14.978 San Francisco CA 14.679 Fort Lauderdale FL 13.76
10 Boston MA-NH 13.6211 Philadelphia PA-NJ 11.5312 Portland-Vancouver OR-WA 10.6913 Tampa-St. Petersburg-Clearwater FL 10.2014 Washington DC-MD-VA-WV 9.9815 Detroit MI 9.4116 Nashville TX 9.3017 Atlanta GA 9.2818 Las Vegas NV-AZ 8.7919 Nassau-Suffolk NY 8.7520 Honolulu HI 8.26
Medical & Dental LaboratoriesTop Twenty Metropolitan Areas by Health Pole, 2001
Sources: Milken Institute, Economy.com.
65
Appendix - Home Health Care Services Profile
Rank StateLocationQuotient
% of StateTotal Emp.
Emp.(Ths.)
1 Oklahoma 4.98 2.4 36.22 Louisiana 3.47 1.7 32.33 Texas 3.43 1.6 157.24 Connecticut 2.94 1.4 23.85 Massachusetts 2.23 1.1 35.86 Vermont 1.90 0.9 2.77 Rhode Island 1.90 0.9 4.48 West Virginia 1.79 0.9 6.39 Maine 1.78 0.9 5.2
10 New York 1.78 0.9 74.023 New Hampshire 1.11 0.5 3.4
Sources: Economy.com, Milken Institute.
Home Health Care ServicesTop States Ranked by Employment Concentration, 2001
• Five out of six New England states rank
among the top ten in terms of employment concentration for this industry.
• Connecticut, Rhode Island and Maine all
have higher concentrations of employment and are growing relatively faster than the U.S. average.
• Boston and New Haven show up on the top
twenty health pole index. They rank 7th and 10th, respectively.
Rank State '80-'00 '80-'90 '90-'00 '96-'01 '00-'011 Oklahoma 5445.5 123.0 2386.5 144.8 20.42 Alaska 3600.0 44.4 2461.5 94.3 23.13 Idaho 874.9 26.6 670.1 67.4 15.54 Louisiana 2466.5 135.5 989.8 62.7 13.75 California 553.0 97.0 231.5 61.8 9.16 Delaware 1240.8 358.4 192.5 61.7 9.17 South Carolina 1583.9 200.3 460.7 61.1 12.78 West Virginia 38066.7 5720.0 555.8 60.2 10.59 Kansas 1245.4 187.1 368.7 58.7 9.4
10 North Carolina 2457.3 360.6 455.2 55.9 11.117 Maine 646.7 129.9 224.8 45.1 5.819 Connecticut 771.5 135.7 269.8 40.7 7.020 Rhode Island 857.4 112.3 351.0 38.1 7.733 Massachusetts 1200.5 324.1 206.7 15.3 3.834 Vermont 1451.4 460.1 177.0 14.8 2.238 New Hampshire 554.4 251.6 86.1 7.9 1.8
New England 929.4 221.9 219.8 25.0 5.0United States 686.5 169.2 192.1 28.1 5.6
Sources: Economy.com, Milken Institute.
Home Health Care ServicesEmployment Growth, Ranked by 1996-2001 Growth
Percent (%) Growth by Time Period
Rank Metroplitan Area Health Pole1 McAllen-Edinburg-Mission TX 100.002 New York NY 42.393 San Antonio TX 31.584 Brownsville-Harlingen-San Benito TX 31.055 Dayton-Springfield OH 30.826 Sherman-Denison TX 25.807 Boston MA-NH 25.538 Dallas TX 17.919 New Orleans LA 17.67
10 New Haven-Meriden CT 17.6411 Forth Worth-Arlington TX 16.9412 Amarillo TX 16.7113 Beaumont-Port Arthur TX 16.5314 Houston TX 16.2315 Baton Rouge LA 14.1816 Cleveland-Lorain-Elyria OH 14.1417 Cincinnati OH-KY-IN 13.2618 Kansas City MO-KS 12.6719 Oklahoma City OK 12.4520 Corpus Christi TX 11.70
Home Health Care ServicesTop Twenty Metropolitan Areas by Health Pole, 2001
Sources: Milken Institute, Economy.com.
66
Appendix - Health & Allied Services Profile
Rank StateLocationQuotient
% of StateTotal Emp.
Emp.(Ths.)
1 Vermont 6.35 1.7 5.22 Rhode Island 3.11 0.9 4.13 New Hampshire 2.54 0.7 4.44 Alaska 2.02 0.6 1.65 Missouri 1.88 0.5 14.16 Kentucky 1.82 0.5 9.27 West Virginia 1.82 0.5 3.78 Arizona 1.60 0.4 10.09 Pennsylvania 1.57 0.4 24.6
10 Arkansas 1.55 0.4 4.925 Maine 0.94 0.3 1.627 Massachusetts 0.91 0.2 8.346 Connecticut 0.47 0.1 2.2
Sources: Economy.com, Milken Institute.
Health & Allied ServicesTop States Ranked by Employment Concentration, 2001
• Vermont, Rhode Island and New Hampshire
are the top three states, respectively, in terms of employment concentration in the health and allied services industry.
• Not only is Vermont’s employment
concentration six times higher than the U.S. average in the health and allied sector, but it is also the only New England state to grow faster than the U.S.
• Boston and Providence rank among the top
twenty metros in this industry’s health pole index.
Rank State '80-'00 '80-'90 '90-'00 '96-'01 '00-'011 Arkansas 1078.9 255.5 231.7 68.0 11.82 Nebraska 726.6 212.0 164.9 62.1 9.73 Missouri 602.0 128.8 206.8 57.6 12.14 Vermont 284.1 1.9 277.0 57.5 11.95 North Carolina 1344.4 424.3 175.5 52.1 9.66 South Dakota 1100.0 379.4 150.3 48.3 7.37 Nevada 989.8 338.8 148.4 46.1 8.38 Alaska 157.9 11.0 132.4 39.7 8.79 Arizona 431.9 119.0 142.9 38.4 7.9
10 Montana 375.2 143.2 95.4 35.1 4.927 New Hampshire 137.6 57.8 50.5 15.4 5.228 Maine 288.8 209.8 25.5 13.9 1.530 Rhode Island 60.5 6.5 50.6 12.2 2.949 Massachusetts 89.7 79.6 5.7 -16.3 -2.950 Connecticut -34.1 -7.6 -28.7 -25.3 -5.2
New England 82.1 38.7 31.3 3.1 2.1United States 160.9 73.9 50.0 16.1 3.9
Sources: Economy.com, Milken Institute.
Health & Allied ServicesEmployment Growth, Ranked by 1996-2001 Growth
Percent (%) Growth by Time Period
Rank Metroplitan Area Health Pole1 Fort Lauderdale FL 100.002 Riverside-San Bernardino CA 69.453 Philadelphia PA-NJ 59.364 New York NY 54.005 Nashville TX 50.056 St. Louis MO-IL 33.607 Boston MA-NH 29.518 Providence-Fall River-Warwick RI-MA 29.139 Anniston AL 27.62
10 Bergen-Passaic NJ 25.9511 Birmingham AL 22.9012 Phoenix-Mesa AZ 22.1513 Corvallis OR 21.2414 Cumberland MD-WV 20.1215 Springfield MO 20.0516 Louisville KY-IN 18.7317 Washington DC-MD-VA-WV 18.4718 Baltimore MD 17.6019 Denver CO 17.1320 Nassau-Suffolk NY 15.45
Health & Allied ServicesTop Twenty Metropolitan Areas by Health Pole, 2001
Sources: Milken Institute, Economy.com.
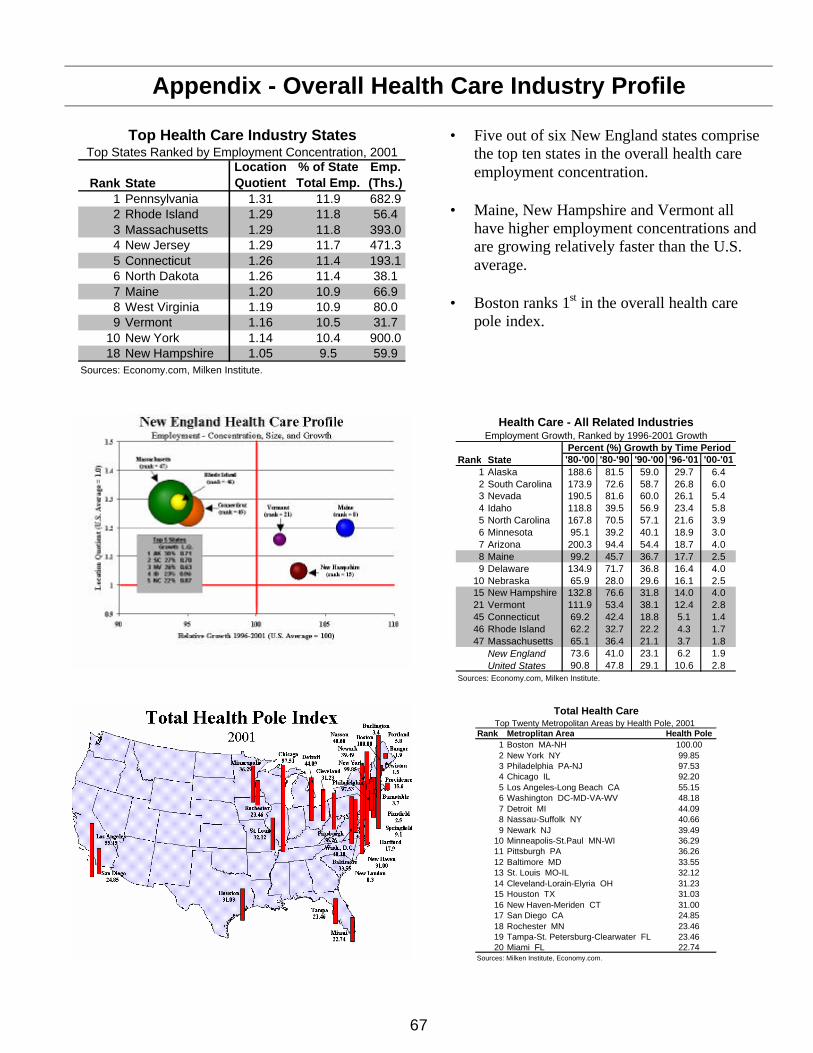
67
Appendix - Overall Health Care Industry Profile
Rank StateLocationQuotient
% of StateTotal Emp.
Emp.(Ths.)
1 Pennsylvania 1.31 11.9 682.92 Rhode Island 1.29 11.8 56.43 Massachusetts 1.29 11.8 393.04 New Jersey 1.29 11.7 471.35 Connecticut 1.26 11.4 193.16 North Dakota 1.26 11.4 38.17 Maine 1.20 10.9 66.98 West Virginia 1.19 10.9 80.09 Vermont 1.16 10.5 31.7
10 New York 1.14 10.4 900.018 New Hampshire 1.05 9.5 59.9
Sources: Economy.com, Milken Institute.
Top Health Care Industry StatesTop States Ranked by Employment Concentration, 2001
• Five out of six New England states comprise
the top ten states in the overall health care employment concentration.
• Maine, New Hampshire and Vermont all
have higher employment concentrations and are growing relatively faster than the U.S. average.
• Boston ranks 1st in the overall health care
pole index.
Rank State '80-'00 '80-'90 '90-'00 '96-'01 '00-'011 Alaska 188.6 81.5 59.0 29.7 6.42 South Carolina 173.9 72.6 58.7 26.8 6.03 Nevada 190.5 81.6 60.0 26.1 5.44 Idaho 118.8 39.5 56.9 23.4 5.85 North Carolina 167.8 70.5 57.1 21.6 3.96 Minnesota 95.1 39.2 40.1 18.9 3.07 Arizona 200.3 94.4 54.4 18.7 4.08 Maine 99.2 45.7 36.7 17.7 2.59 Delaware 134.9 71.7 36.8 16.4 4.0
10 Nebraska 65.9 28.0 29.6 16.1 2.515 New Hampshire 132.8 76.6 31.8 14.0 4.021 Vermont 111.9 53.4 38.1 12.4 2.845 Connecticut 69.2 42.4 18.8 5.1 1.446 Rhode Island 62.2 32.7 22.2 4.3 1.747 Massachusetts 65.1 36.4 21.1 3.7 1.8
New England 73.6 41.0 23.1 6.2 1.9United States 90.8 47.8 29.1 10.6 2.8
Sources: Economy.com, Milken Institute.
Health Care - All Related IndustriesEmployment Growth, Ranked by 1996-2001 Growth
Percent (%) Growth by Time Period
Rank Metroplitan Area Health Pole1 Boston MA-NH 100.002 New York NY 99.853 Philadelphia PA-NJ 97.534 Chicago IL 92.205 Los Angeles-Long Beach CA 55.156 Washington DC-MD-VA-WV 48.187 Detroit MI 44.098 Nassau-Suffolk NY 40.669 Newark NJ 39.49
10 Minneapolis-St.Paul MN-WI 36.2911 Pittsburgh PA 36.2612 Baltimore MD 33.5513 St. Louis MO-IL 32.1214 Cleveland-Lorain-Elyria OH 31.2315 Houston TX 31.0316 New Haven-Meriden CT 31.0017 San Diego CA 24.8518 Rochester MN 23.4619 Tampa-St. Petersburg-Clearwater FL 23.4620 Miami FL 22.74
Total Health CareTop Twenty Metropolitan Areas by Health Pole, 2001
Sources: Milken Institute, Economy.com.

68
About the Authors Ross DeVol is Director of Regional and Demographic Studies at the Milken Institute where he oversees the Institute’s research efforts examining the dynamics of comparative regional growth performance. His interest lies in the quantification of those factors that determine the relative economic success of regions, particularly in the United States. He is examining the effects of information technology, international trade, education and labor-force skills training, cost of doing business, early-stage financing and quality-of-life issues on the geographic distribution of economic activity. He is the author of numerous studies on the impact of technology on regional and metropolitan economies, among them, America’s High-Tech Economy: Growth, Development, and Risks for Metropolitan Areas. He also authored The Impact of September 11 on U.S. Metropolitan Economies and is the creator the annual Forbes/Milken Institute “Best Places for Business and Careers” rankings. Prior to joining the Institute, DeVol was senior vice president of WEFA, Inc. (formerly Wharton Econometric Forecasting), where he supervised their Regional Economic Services group. DeVol appears on national television and radio programs to discuss a variety of economic topics. He is frequently quoted in print media such as The Wall Street Journal, Investor’s Business Daily, Los Angeles Times, Forbes and others. DeVol earned his M.A. in economics from Ohio University. Rob Koepp is a Research Fellow in Regional and Demographic Studies. His research interests center on the topics of innovation, entrepreneurship and regional economic development, especially in the context of global technology businesses. His recent work at the Institute includes contributions to Manufacturing Matters: California's Performance and Prospects and the State Technology and Science Index: Comparing and Contrasting California. Koepp is also author of the book Clusters of Creativity: Enduring Lessons on Innovation and Entrepreneurship from Silicon Valley and Europe's Silicon Fen (John Wiley & Sons, 2002). Fluent in Japanese and Chinese, Koepp served in various senior positions with Western and Japanese technology firms before joining the Institute. Koepp earned his BA in Asian Studies at Pomona College and his MBA with an emphasis in venture capital financing at Cambridge University. Perry Wong is a research economist in the Regional Studies group at the Milken Institute where he focuses primarily on Pacific Basin regional economies. Wong specializes in analyzing the structure, industry mix, development and public policies of a regional economy with particular emphasis on the impact of high technology and international trade. Prior to joining the Milken Institute, Wong was a senior economist and director of regional forecasting and modeling at WEFA, Inc. (Wharton Econometric Forecasting Associates) where he managed WEFA’s regional quarterly state and metropolitan area forecasts. He is the co-author of America’s High Tech Economy, a study examining technology impacts on U.S. regional economic growth. Wong earned his master’s in economics at Temple University. Armen Bedroussian is a Research Analyst with the Regional & Demographic Studies Unit at the Milken Institute. He is responsible for conducting econometric modeling and providing regional data to the Unit. Before joining the Institute, Bedroussian was a Teaching Assistant at the University of California, Riverside, where he taught intermediate micro and macro economics to undergraduate students. Bedroussian has extensive graduate training in econometrics, statistical methods and various modeling techniques. Since coming to the Institute, Bedroussian has contributed to several projects, including Knowledge Value Cities in the Digital Age, Butler County’s Economic Impact Assessment, The Impact of an Entertainment Strike on the Los Angeles Economy, and The Los Angeles Mayor’s Task Force Study on the Assessment of Post-September 11 Economic Conditions. Bedroussian graduated from the University of California, Riverside, with a Bachelor of Science in Applied Mathematics, and a Master of Arts in Economics.

1250 Fourth Street • Santa Monica, California 90401Phone (310) 570-4600 • Fax (310) 570-4601 • E-mail [email protected]
www.milkeninstitute.org