needs assessment of the elderly in malta · needs assessment of the elderly in malta national needs...
TRANSCRIPT
National Elderly Needs Assessment Survey Malta 2012
2
Needs Assessment of the Elderly in Malta
National needs assessment amongst the Maltese population aged 75 years and
over
2012
Directorate for Health Information and Research
Department of Health
Ministry for Health
www.healthsurveys.gov.mt
National Elderly Needs Assessment Survey Malta 2012
3
Preface
This analysis reports the findings of the first phase of the 2012 National Elderly Needs Assessment
Survey. This national survey amongst the elderly aged 75+ is the first of its kind to be conducted in
Malta. The survey is part of a planned three phase study aimed to assess the needs of older adults
within the community and institutions, as well as the experience and needs of informal carers taking
care of the elderly within the community.
Phase one of the survey aimed to collect baseline data on quality of life issues amongst those 75+
living in the community. The questionnaire addressed topics such as morbidity, degree of
impairment, social isolation, available assistance and demand for long term care and community
based services. In total 6007 individuals responded to the survey out of 7824 eligible participants.
This gives a response rate of 76.8%.
Gender seems to play an important role in the degree of impairment and isolation experienced by
the older adult population. A greater proportion of women are widowed, live in single households
and report a higher degree of impairment when compared to their male counterparts. Women also
report feeling more socially isolated when compared to men. This can be understood in light of the
fact that women have a longer life expectancy, meaning they are more likely to outlive their
spouses, partners or friends, live alone and live more years with some degree of impairment.
Overall 6.8% of the respondents reported having a severe impairment. Of these, 15% report that
they live alone. The uptake of community based services is generally low, with the home help
service offered by the government being the service most sought after by the respondents (14.4%).
Approximately 5% of the respondents report that they are on a waiting list for a nursing home, with
this percentage being higher amongst those with a higher degree of impairment, increased age,
living on their own and females.
The results from the survey indicate that social isolation amongst older adults is approximately
40.3% with only a quarter of the respondents saying they have some form of family ties. Social
isolation increases with age and is higher amongst individuals in single person households.
The majority of older adults living within the community (86.5%) report they have no or very little
impairment suggesting that while this population may have some form of limitation, with adequate
support and services they are able to live independently within the community. However uptake of
community services is low and may be promoted more especially amongst those who have a greater
degree of impairment.
One of the most surprising findings among this cohort of the population is the degree of social
isolation, even in a close knit community such as Malta. The needs of this population are not only
physical but also social. Moreover, there appears to be a gap between need and service provision,
not so much because of inavailability of services but more due to a number of needy individuals
being unaware or unable to access them.
Dr. Neville Calleja
Director
Directorate for Health Information and Research
National Elderly Needs Assessment Survey Malta 2012
4
Acknowledgements
The Directorate for Health Information and Research (DHIR) would like to thank all the survey
respondents who participated in the survey as well as the project team consisting of Dr Neville
Calleja, Ms Deborah Stoner and Ms Dorothy Gauci.
We would like to acknowledge the National Institute on Ageing and Duke’s University. The National
Long Term Care Survey (NLTCS) conducted in the United States by the National Institute on Ageing
(NIA) in collaboration with Duke’s University was used as the survey tool after being adapted
accordingly to address the differences in the cultural and social aspects and healthcare system in
Malta when compared to the United States.
We also would like to thank the National Statistics Office (NSO) for carrying out the sampling, the
Chief Medical Officer Dr Natasha Azzopardi Muscat and the Ministry for Health (MFH) for funding
this project and for their support.
Finally we would like to thank all the staff at DHIR who owned this survey over and above their
normal routine duties, all university students who carried out the telephone interviews and Ms
Regina Desantis for her invaluable support.
This report has been compiled by Dr Dorianne Farrugia and Ms Deborah Stoner
National Elderly Needs Assessment Survey Malta 2012
5
Table of Contents
Acknowledgements ................................................................................................................................. 4
1 Introduction ..................................................................................................................................... 8
1.1 Background to the study ......................................................................................................... 8
1.2 Aims and Objectives ................................................................................................................ 8
1.2.1 Phase 1 ............................................................................................................................ 9
1.2.2 Proposed Phase 2 ............................................................................................................ 9
1.2.3 Proposed Phase 3 ............................................................................................................ 9
2 Methodology ................................................................................................................................. 11
2.1 Study design .......................................................................................................................... 11
2.2 Sampling ............................................................................................................................... 11
2.3 Questionnaire ........................................................................................................................ 11
2.4 Fieldwork ............................................................................................................................... 11
3 Data Analysis ................................................................................................................................. 12
4 Marital status of the aged population .......................................................................................... 15
5 Older people and their living arrangements ................................................................................. 17
6 Degree of Impairment ................................................................................................................... 20
6.1 Activities of daily living .......................................................................................................... 20
6.2 Instrumental activities of daily living .................................................................................... 21
7 Utilization of healthcare services .................................................................................................. 23
8 Social isolation .............................................................................................................................. 25
9 Conclusion ..................................................................................................................................... 27
10 Tables and Figures .................................................................................................................... 28
10.1 Figures ................................................................................................................................... 28
10.2 Tables .................................................................................................................................... 39
National Elderly Needs Assessment Survey Malta 2012
6
List of Figures
Figure 1: Study design of the planned 3-phase Elderly Needs Assessment Survey .............................. 10
Figure 2: Responses from the sample .................................................................................................. 13
Figure 3: Marital status of elderly participants total and by gender .................................................... 28
Figure 4: Marital status of elderly participants total and by age group ............................................... 28
Figure 5: Size of household ................................................................................................................... 29
Figure 6: Size of household with degree of impairment ....................................................................... 29
Figure 7: Percentage of participants who see or hear from their relatives at least once a month by
gender ................................................................................................................................................... 30
Figure 8: Percentage of participants who see or hear from their friends at least once a month by
gender ................................................................................................................................................... 30
Figure 9: Percentage of participants who see or hear from their relatives at least once a month by
age group .............................................................................................................................................. 31
Figure 10: Percentage of participants who see or hear from their friends at least once a month by
age group .............................................................................................................................................. 31
Figure 11: Degree of impairment for total and by gender ................................................................... 32
Figure 12: Degree of impairment for total and by age group ............................................................... 32
Figure 13: Percentage of elderly participants needing help with ADLs ................................................ 33
Figure 14: Percentage of elderly participants needing help with ADLs by gender ............................... 33
Figure 15: Percentage of elderly participants needing help with ADLs by age group .......................... 34
Figure 16: Percentage of elderly participants needing help with IADLs .............................................. 34
Figure 17: Percentage of elderly participants needing help with IADLs by gender .............................. 35
Figure 18: Percentage of elderly participants needing help with IADLs because of a disability by
gender ................................................................................................................................................... 35
Figure 19: Percentage of elderly participants needing help with IADLs by age group ......................... 36
Figure 20: Percentage of elderly participants on a waiting list total, by gender and age group .......... 36
Figure 21: Percentage of elderly participants on a waiting list for a nursing home by degree of
impairment ........................................................................................................................................... 37
Figure 22: Percentage of elderly participants on a waiting list for a nursing home by number of
persons in a household ......................................................................................................................... 37
National Elderly Needs Assessment Survey Malta 2012
7
Figure 23: Percentage of elderly participants needing a medical service at home by gender and age
group ..................................................................................................................................................... 38
Figure 24: Percentage of elderly participants needing a medical service at home by impairment ..... 38
List of Tables
Table 1: Size of household by gender ................................................................................................... 39
Table 2: Size of household by age ......................................................................................................... 39
Table 3: Percentage of elderly participants using community services................................................ 39
Table 4: Percentage of elderly participants needing community services by gender and age group .. 40
Table 5: Community services by degree of impairment ....................................................................... 40
Table 6: Elderly living alone and using community services by degree of impairment ........................ 41
Table 7: Percentage of elderly participants who are socially isolated ................................................. 41
National Elderly Needs Assessment Survey Malta 2012
8
1 Introduction
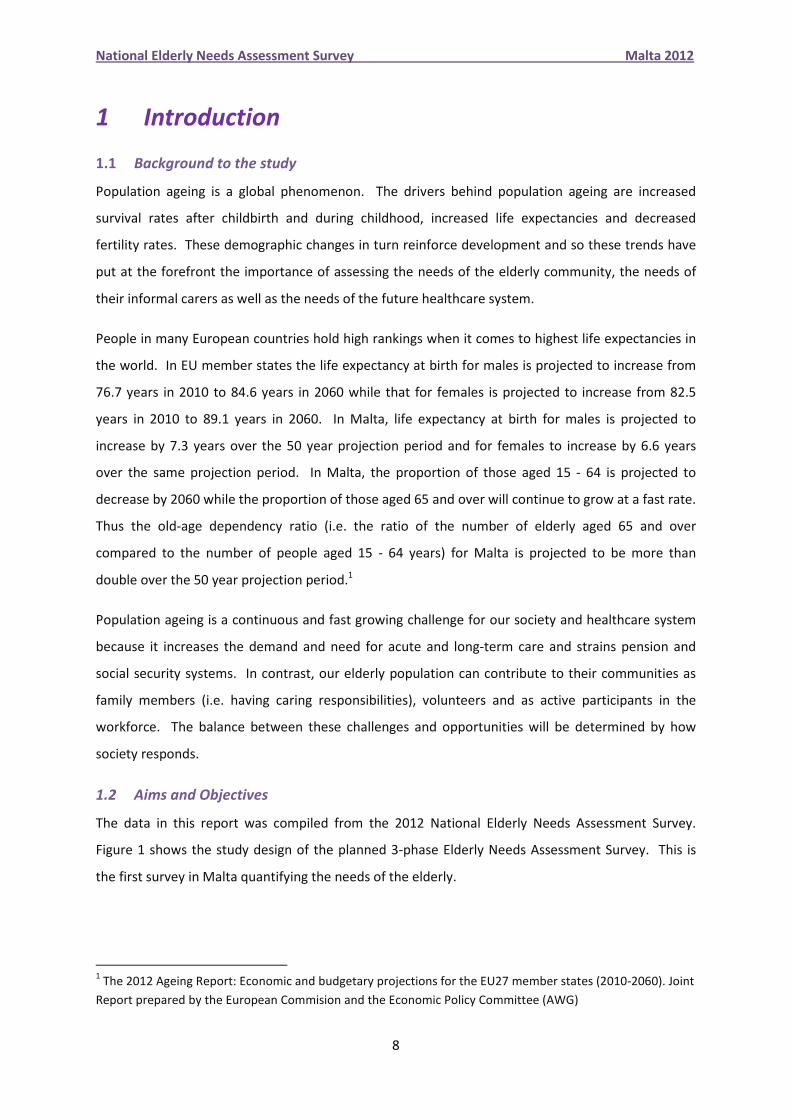
1.1 Background to the study
Population ageing is a global phenomenon. The drivers behind population ageing are increased
survival rates after childbirth and during childhood, increased life expectancies and decreased
fertility rates. These demographic changes in turn reinforce development and so these trends have
put at the forefront the importance of assessing the needs of the elderly community, the needs of
their informal carers as well as the needs of the future healthcare system.
People in many European countries hold high rankings when it comes to highest life expectancies in
the world. In EU member states the life expectancy at birth for males is projected to increase from
76.7 years in 2010 to 84.6 years in 2060 while that for females is projected to increase from 82.5
years in 2010 to 89.1 years in 2060. In Malta, life expectancy at birth for males is projected to
increase by 7.3 years over the 50 year projection period and for females to increase by 6.6 years
over the same projection period. In Malta, the proportion of those aged 15 - 64 is projected to
decrease by 2060 while the proportion of those aged 65 and over will continue to grow at a fast rate.
Thus the old-age dependency ratio (i.e. the ratio of the number of elderly aged 65 and over
compared to the number of people aged 15 - 64 years) for Malta is projected to be more than
double over the 50 year projection period.1
Population ageing is a continuous and fast growing challenge for our society and healthcare system
because it increases the demand and need for acute and long-term care and strains pension and
social security systems. In contrast, our elderly population can contribute to their communities as
family members (i.e. having caring responsibilities), volunteers and as active participants in the
workforce. The balance between these challenges and opportunities will be determined by how
society responds.
1.2 Aims and Objectives
The data in this report was compiled from the 2012 National Elderly Needs Assessment Survey.
Figure 1 shows the study design of the planned 3-phase Elderly Needs Assessment Survey. This is
the first survey in Malta quantifying the needs of the elderly.
1 The 2012 Ageing Report: Economic and budgetary projections for the EU27 member states (2010-2060). Joint
Report prepared by the European Commision and the Economic Policy Committee (AWG)
National Elderly Needs Assessment Survey Malta 2012
9
1.2.1 Phase 1
The aim of the first phase of this survey is to establish baseline data on quality of life issues, namely;
• morbidity and degree of impairment,
• availability of personal, familial and community resources for care giving,
• social isolation and
• demand for long term services and community care.
This information will provide a lucid picture of the growing needs of the Maltese 75+ elderly
population. This will guide public health policy and other service stakeholders to take concrete
actions to support the population for better health and social services.
1.2.2 Proposed Phase 2
The proposed phase 2 involves identifying the phase 1 participants who
• find difficulty in at least one activity of daily living (ADL) or
• are living in an institution.
to obtain in-depth knowledge on the elderly persons ability to carry out daily activities, their life-
style and support they may be receiving from carers.
1.2.3 Proposed Phase 3
Apart from demand on the formal care and social systems, an ageing population creates added
strain on the informal care system – family and friends. The informal care system remains an
important and integral part of elderly care in our community. The aim of the proposed phase 3 is to
assess the experience and needs of the informal care givers who are assisting home-based elderly
persons.
National Elderly Needs Assessment Survey Malta 2012
10
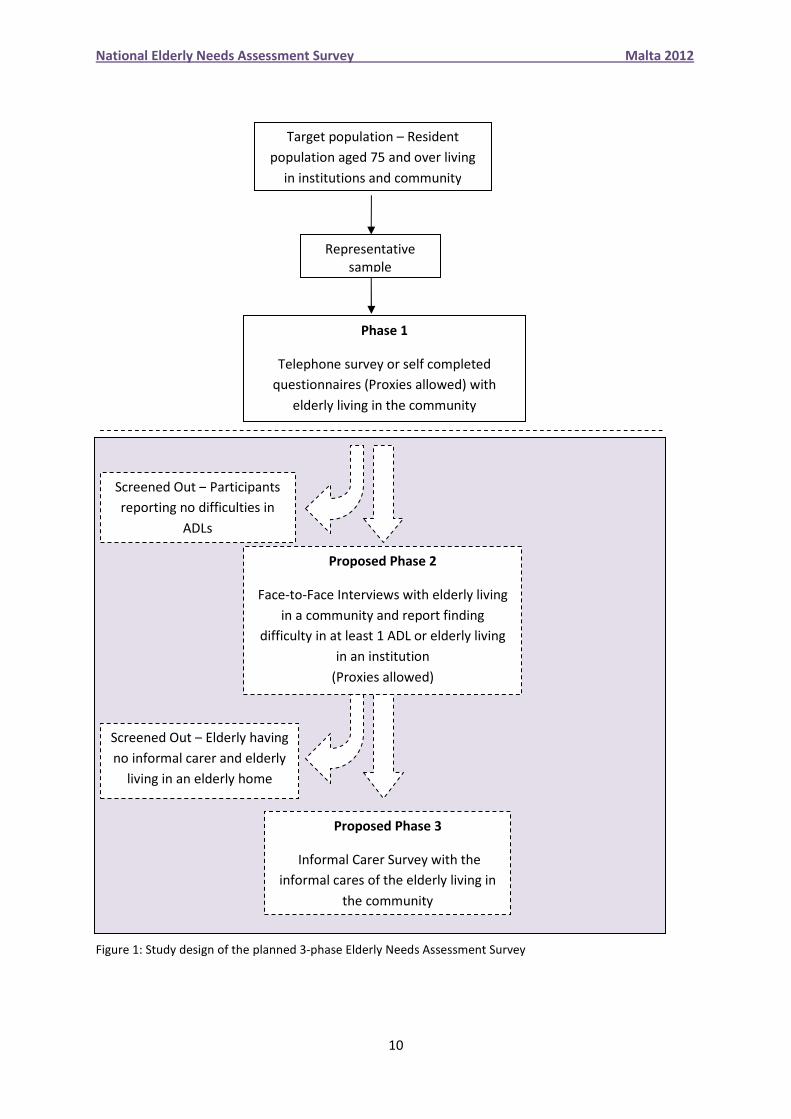
Figure 1: Study design of the planned 3-phase Elderly Needs Assessment Survey
Target population – Resident
population aged 75 and over living
in institutions and community
Representative
sample
Phase 1
Telephone survey or self completed
questionnaires (Proxies allowed) with
elderly living in the community
Screened Out – Participants
reporting no difficulties in
ADLs
Proposed Phase 2
Face-to-Face Interviews with elderly living
in a community and report finding
difficulty in at least 1 ADL or elderly living
in an institution
(Proxies allowed)
Screened Out – Elderly having
no informal carer and elderly
living in an elderly home
Proposed Phase 3
Informal Carer Survey with the
informal cares of the elderly living in
the community
National Elderly Needs Assessment Survey Malta 2012
11
2 Methodology
2.1 Study design
Phase one involves a cross-sectional survey incorporating telephone interviews with home-based
individuals aged 75 years and over.
2.2 Sampling
The sample was drawn from a population register maintained by the NSO. The study population
consisted of 9400 Maltese residents. A weighted stratified random sample was drawn, stratifying by
region, age and gender. Thus, this sample is representative of the 75+ population. In this report, the
elderly are divided into two groups, 75 to 84 years and 85 years and over.
2.3 Questionnaire
Following consultations with internal stakeholders in the elderly sector, the National Long-Term Care
Survey (NLTCS) tool was used. The NLTCS was conducted in the United States by the NIA in
collaboration with Duke’s University. In addition, the questionnaire was designed for the use of
proxies. The survey tool was adapted to address the differences in the cultural aspects and
healthcare system in Malta when compared to the United States. The questionnaire addressed
topics such as morbidity, degree of impairment, available assistance and demand for long term care
and community based services. An additional module, the Lubben Social Network Scale was added
to measure social isolation.
2.4 Fieldwork
The questionnaire underwent cognitive testing. It was tested on a small number of typical
respondents and underwent the process of peer review. A group of 20 trained university students
conducted telephone interviews by filling in a prepared access form. The fieldwork was carried out
over the latter half of 2012. Most telephone calls were held in the morning and late afternoon with
a maximum of 3 attempts per person to ensure maximum participation.
4626 were completed via telephone interview by the specifically trained interviewers. Where
contact with the elderly could not be established a self completed questionnaire was sent by post.
1381 questionnaires were self completed. Given the age cohort of the participants of this survey, a
number of interviews needed to be carried out with proxies. There were 1140 questionnaires
answered by a proxy. The vast majority of the proxies were either a spouse or a daughter.
National Elderly Needs Assessment Survey Malta 2012
12
3 Data Analysis
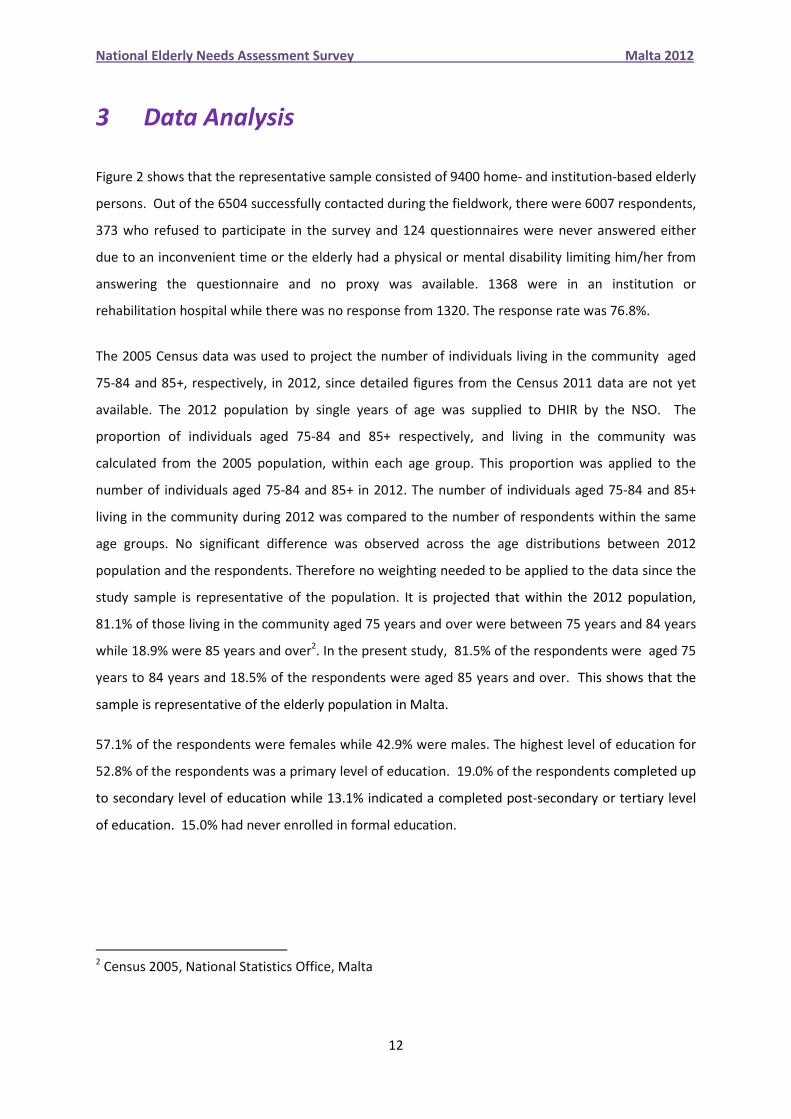
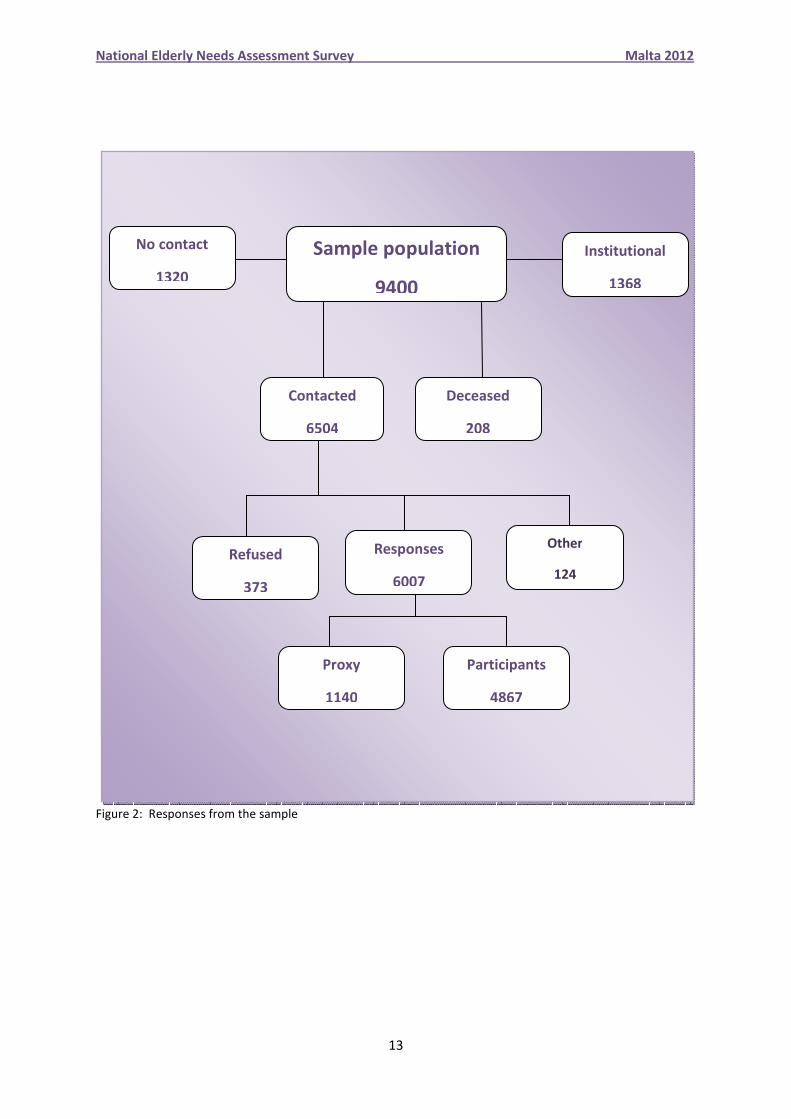
Figure 2 shows that the representative sample consisted of 9400 home- and institution-based elderly
persons. Out of the 6504 successfully contacted during the fieldwork, there were 6007 respondents,
373 who refused to participate in the survey and 124 questionnaires were never answered either
due to an inconvenient time or the elderly had a physical or mental disability limiting him/her from
answering the questionnaire and no proxy was available. 1368 were in an institution or
rehabilitation hospital while there was no response from 1320. The response rate was 76.8%.
The 2005 Census data was used to project the number of individuals living in the community aged
75-84 and 85+, respectively, in 2012, since detailed figures from the Census 2011 data are not yet
available. The 2012 population by single years of age was supplied to DHIR by the NSO. The
proportion of individuals aged 75-84 and 85+ respectively, and living in the community was
calculated from the 2005 population, within each age group. This proportion was applied to the
number of individuals aged 75-84 and 85+ in 2012. The number of individuals aged 75-84 and 85+
living in the community during 2012 was compared to the number of respondents within the same
age groups. No significant difference was observed across the age distributions between 2012
population and the respondents. Therefore no weighting needed to be applied to the data since the
study sample is representative of the population. It is projected that within the 2012 population,
81.1% of those living in the community aged 75 years and over were between 75 years and 84 years
while 18.9% were 85 years and over2. In the present study, 81.5% of the respondents were aged 75
years to 84 years and 18.5% of the respondents were aged 85 years and over. This shows that the
sample is representative of the elderly population in Malta.
57.1% of the respondents were females while 42.9% were males. The highest level of education for
52.8% of the respondents was a primary level of education. 19.0% of the respondents completed up
to secondary level of education while 13.1% indicated a completed post-secondary or tertiary level
of education. 15.0% had never enrolled in formal education.
2 Census 2005, National Statistics Office, Malta
National Elderly Needs Assessment Survey Malta 2012
13
Figure 2: Responses from the sample
Sample population
9400
No contact
1320
Contacted
6504
Institutional
1368
Refused
373
Responses
6007
Proxy
1140
Participants
4867
Deceased
208
Other
124

Results

15
4 Marital status of the aged population
There are important differences between men and women in the roles and experiences during old
age. Half of the respondents were married, about one third were widowed and about one tenth
were single. The proportion of participants that is divorced was only 1.0% (Figure 3). These
proportions remained relatively the same when compared to 2008 except for those who were single.
In 2008, 17.8% of the respondents aged 75 years and over were single (EHIS 2008). The percentage
of married respondents (49.6%) relates well with the number of people living as a couple (49.7%).
Results indicate that 70.3% of men live as a couple while 34.2% of women live as a couple. The
percentage of elderly participants living as a couple remained relatively the same when compared to
2008 (EHIS 2008).3
The majority of the male respondents (72.1%) were married while about one third of the female
respondents were married (32.8%)(Figure 3). A similar trend was noted in 2008 (EHIS 2008). This
reflects similar trends exhibited world wide, were 80% of men aged 60 years and over are married
while less than half of the women in the same age group are married. The reasons behind these
differences may be because women have a longer life expectancy than men, men tend to marry
again after being divorced or widowed and also because women are more likely to marry men older
than themselves.4
The proportion of married participants and the proportion of widowed participants display an
inverse relationship with age (Figure 4). The relatively static percentage of individuals classified as
single suggests that there is an age limit beyond which single persons tend not to marry (Figure 4).
3 EHIS 2008: European Health Interview Survey 2008
4 Current status of the social situation, well-being, participation in development and rights of older persons
worldwide. United Nations New York 2011
16
� Half of the respondents were married, about one third
were widowed and about one tenth were single. 1.0%
of the participants were divorced.
� 70.3% of men live as a couple while 34.2% of women
live as a couple.
� The vast majority of older men are married (72.1%)
while the majority of older women are widowed
(50.8%).
� The proportion of married participants and the
proportion of widowed participants display an inverse
relationship with age.
17
5 Older people and their living arrangements
Marital and socio-economic status, availability of relatives and friends, physical and mental health,
individual preferences and cultural norms are key determinants in deciding whether an older person
lives alone or co-resides with a family member. Isolation and loneliness will affect health especially
mental health, life satisfaction and chances of institutionalisation. Unfortunately, there are major
differences between developing countries and developed countries with respect to
institutionalisation. In developing countries the norm is still for an elderly person to co-reside with a
relative. This can be due to cultural norms that place the responsibility for taking care of older
people on their relatives or due to lack of alternate living arrangements such as nursing homes. In
developed countries, older people, especially women, are increasingly living alone or in institutions.
This may be due to well-developed social transfer systems in the developed countries or because
most children eventually leave the parental home5.
Projections from the 2005 Census data shows that in 2012, 14.6 % of those aged 75 years and over
are estimated to be living within institutions. According to the results from this survey, 14.6 % of
those aged 75 years and over are living within an institution or rehabilitation hospital. 27.5% of the
participants are living in a single person household while 51.9% are living in a two person household.
The percentage of elderly participants living alone or in a two person household remained relatively
the same when compared to 2008 (EHIS 2008). About 20.6% of the respondents reported that the
total number of persons living in their household was more than 3 (Figure 5). 36.5% of all female
respondents aged 75 years and over live alone while 15.5% of all male respondents in the same age
group live alone (Table 1). This trend remained similar to that in 2008 (EHIS 2008). Most
participants share their household with another individual. 26.3% of those aged between 75 and 84
years reported living in a single person household with an increase to 32.6% in the 85+ age group
(Table 2). 19.0% of those having moderate impairment and 14.7% of those having severe
impairment are living alone (Figure 6).
Social relationships with family members are associated with well-being. Social exchanges with non-
family members are less associated with well-being although close partners contribute more to the
well-being of the individual than other nonfamily members. Participants were asked about the
number of relatives or friends that they see and hear from at least once a month and the number of
5 An Ageing World 2008.International Populations Report. U. S. Department of Health and Human Services
and National Institutes of Health and National Institute on Ageing 2009

18
relatives or friends that they felt close to such that they could call on them for help. The vast
majority of the respondents have 2 or 3 children that are still alive, followed by those having 4 or 5
children. Only 0.3% reported having no children alive.
80.6% of the respondents get in touch with 3 or more relatives at least once a month, whilst 3.9% of
the respondents never see or hear from their relatives in a given month (Figures 7 and 9). 36.3% of
the respondents reported no encounters with friends in a given month (Figure 8 and 10). Men get in
touch with more friends within a month than women. Moreover, with an increase in age,
participants were less likely to get in touch with friends within a month. 7.3% of those aged 75 to 84
years stated that they had no next of kin on whom they can rely should they need help. This
increases to 8.1% in those aged 85 years and over. The majority (33.4%) of the participants reported
having 3 to 4 relatives on whom they could rely on should they need help. In contrast, the majority
(50.9 %) of the participants reported that they had no friends to call on them for help.
19
� According to data from the Elderly Needs Assessment
Survey 14.6% of those aged 75 years and over are
living within an institution or rehabilitation hospital.
� 27.5% of the participants reported living in a single
person household while 51.9% reported living in a
two person household.
� 26.3% of those aged 75 to 84 years reported living in
a single person household. This increases to 32.6% in
the 85+ age groups.
� 14.7% of those having severe impairment and 19.0%
of those having moderate impairment are living
alone.
� 3.9% of the respondents never see or hear from their
relatives at least once a month whilst 36.3% of the
respondents reported no encounters with friends.
20
6 Degree of Impairment
6.1 Activities of daily living
Activities of daily living (ADLs) refers to a set of everyday routines generally involving self-care tasks,
such as eating, dressing, bathing, toileting, incontinence, transferring (i.e. getting in and out of a bed
and/or chair) and walking. An inability to perform these basic tasks results in a self-care deficit and
can make a person severely dependent on others. Inability to carry out ADLs has been found to be a
good predictor of admission to a nursing home, use of community and hospital services, living
arrangements and mortality. The degree of impairment is much higher within the elderly population
and rise steeply with advancing age, especially for persons aged 85 and over. The participants were
divided into three groups according to the KATZ scoring system6, based on their degree of
impairment in eating, dressing, bathing, toileting, incontinence and transferring:
• No or very little impairment – no difficulty with ADLs or difficulty with 1 ADL
• Moderate impairment – difficulty with 2-3 ADLs
• Severe functional impairment – difficulty with 4 - 6 ADLs
Most respondents reported that they have no or very little impairment (Figures 11 and 12). Only
6.8% of the respondents reported severe functional impairment. Overall, elderly women reported a
higher level of impairment than elderly men (Figures 11 and 14). In 2010, the life expectancy at birth
for females was 83.6 years (79.2 years for males) while the healthy life expectancy at birth was 71.6
years (70.2 years for males)7. Thus women are at higher risk of developing severe functional
impairment than men in old age due to longer survival with slight impairment earlier in adult life.
The degree of impairment was reported to increase with age (Figures 12 and 15). Participants find
greatest difficulty with walking followed by bathing, dressing, incontinence and transferring (Figure
13).
A chronic condition is a human health condition or disease lasting 3 months or more, by the definition of
the U.S. National Centre for Health Statistics. Around 93% of the respondents having a problem with
one or more ADLs reported they had the impairment for more than 3 months and they are expecting
the impairment to last for at least the next three months. A supportive environment especially at
6 Katz index of independence in activities of daily living (ADL) (2000). Geriatric Nursing 21(2), 109.
7 EUROSTAT Statistical Database,
http://epp.eurostat.ec.europa.eu/portal/page/portal/statistics/search_database
21
community level makes important contributions to the quality of life of these individuals and thus
should be given great importance in the area of health policy for ageing populations.
6.2 Instrumental activities of daily living
Instrumental activities of daily living (IADLs) such as cooking, grocery shopping, house cleaning,
managing medication or money and using the phone are considered more complex than the basic
ADLs. IADLs are not necessary for fundamental functioning but are still necessary for an individual to
be able to live independently in the community and maintain an adequate standard of living.
Participants reported greatest difficulty with doing laundry, grocery shopping, managing finances
and preparing meals, followed by doing light household, taking medicine and using the phone
(Figure 16). In 2008, participants reported greatest difficulty with housework, grocery shopping and
preparing meals. There seems to be certain limitations, particular to men and others to women.
Women reported greatest difficulties in tasks such as grocery shopping and managing finances. On
the other hand, men tend to report greatest difficulty in domestic tasks such as doing laundry,
preparing meals and carrying out light household work (Figure 17). As age increases, reported
difficulty with IADLs increases (Figure 19). The majority of those reporting that they need help with
IADLs, explained that they need help because of a disability or health problem, that is, a mental or
physical condition limiting them in performing these activities. Women were more likely than men to
report needing help because of a disability or health problem (Figure 18). About 96% of those
reporting to have disabilities restricting them in carrying out one or more IADLs, reported that they
had the disability for more than 3 months and they are expecting the disability to last for at least the
next three months.
22
� 6.8% reported that they have severe impairment.
� Overall elderly women reported a higher degree
of impairment than elderly men.
� About 93% of those having difficulty with one or
more ADLs reported they had the impairment for
more than 3 months and they are expecting the
impairment to last for the next three months.
� Women reported greatest difficulties in tasks such
as grocery shopping and managing finances. On
the other hand men tend to report greatest
difficulty in domestic tasks such as doing laundry,
preparing meals and carrying out light household
work.
� A disability or a health problem keeps most
women from performing IADLs but only a
minority of men have a disability that is keeping
them from performing these tasks.
� About 96% of those reporting to have disabilities
restricting them in carrying out one or more IADLs
reported they had the disability for more than 3
months and they are expecting it to last for the
next three months.
23
7 Utilization of healthcare services
The Ministry for the Elderly and Social Solidarity (MFSS) provides a number of community care
services to help and support frail aged people and people with a disability to live independently in
the community. Such community-based programs include meals delivery, transport services, nursing
services and home help such as the handyman service or help for housework. Overall reported
community care service use is low within the 75+ population.
The number of people currently residing in a residential home together with the growth of such
capacity and the number of elderly people on a waiting list for a nursing home provide indicators on
the potential demand of long-term care. 4.8% of the participants are currently on a waiting list for a
nursing home. This could be due to the fact that the majority of older persons either live with their
relatives or are well supported by their families. More female participants are on a waiting list for a
nursing home (Figure 20). This can be explained by the fact that females live longer, have a higher
degree of impairment and tend to be more isolated when compared to males. Data shows that the
demand for a nursing home increases with age and degree of impairment (Figure 20 and Figure 21)
but decreases with the number of persons living under one roof (Figure 22).
12.9% of the participants reported receiving some sort of medical care from a healthcare
professional at home. A significant gender difference was reported with 13.9% of the female
respondents and 11.7% of the male respondents reporting the use of a healthcare professional
service at home (Figure 23). Demand increases with age and degree of impairment (Figures 23 and
24). Of those requiring medical care at home, 55.1% receive it as needed, 13.9% receive it daily,
17.2% receive it weekly and another 13.9% receive it monthly. The daily and weekly use of medical
care from a healthcare professional at home increases with severity of impairment. Their higher
degree of impairment may limit them in receiving medical care outside their living quarters.
Therefore, they may opt to receive care within their living quarters more often than those with a
lesser degree of impairment.
14.4% of the participants make use of home help for housework or the handyman service, 2.0% use
meals on wheels, 6.5% use the transport services and 25.8% use other services8 (Table 3). Reported
care service use increases with age. There was a significant gender difference with females using
more community services than males except for meals on wheels (Table 4). Use of community
8 Other services include telecare, day centre, night shelter and incontinence service

24
services also increases amongst individuals with a moderate or severe impairment (Table 5). From
those living alone, individuals having moderate or severe functional impairment were more likely to
use transport services and be on a waiting list for a nursing home than individuals having no or very
little impairment (Table 6).
� 12.9% of the participants reported receiving some
sort of medical care from a healthcare professional
at home.
� 4.8% of the participants are currently on a waiting
list for a nursing home. The percentage of
participants on the waiting list increases with the
severity of impairment, age, females and small
households.
� The majority of those requiring a professional
healthcare service at home receive it as needed.
� 14.4% of the participants make use of home help
for housework or the handyman service, 2.0% use
meals on wheels, 6.5% use the transport services
and 25.8% use other community services.

25
8 Social isolation
Loneliness is subjective and one of the possible emotional outcomes of social isolation. Social
isolation is objective and refers to the absence of relationships with relatives or friends. Social
isolation is typically used as the best proxy to assess loneliness. The elderly are particularly
vulnerable to social isolation because they generally have fewer friends and more disabilities. A
literature review by O’Luanaigh, C and Lawlor, B.A. indicates that loneliness is common in elderly
people and it ‘may in fact be an independent risk factor for depression’.9 A recent meta-analysis
review conducted in 2010, shows that individuals who are socially isolated have an increased
likelihood of dying when compared to those having good social networks. Having sufficient social
relationship has the same effects on mortality comparable to stopping smoking but with more
benefits than well-known risk factors like obesity and physical inactivity10
The Lubben Social Network Scale (LSNS) is one of several instruments that can be used to assess for
social isolation in older adults. There are several versions of the LSNS including an abbreviated 6-
item version (LSNS-6). The LSNS-6 has been extensively used and is an extremely quick measure to
identify older adults that warrant further social isolation assessment. This was chosen in order to
limit the length of the interview and maximise the response rate. The LSNS-6 measures emotional,
tangible and actual network size relating to relatives and friends. Those individuals scoring less than
12 on the six-item LSNS-6 would be identified as socially isolated. Those scoring less than 6 on the
three-item LSNS-6 Family subscale or Friends subscale would be identified as having marginal family
ties and marginal friendship ties respectively11
.
Results show that the proportion of socially isolated, community-dwelling, older adults is at 40.3%.
16.7% of the respondents had marginal family ties while 62.7% had marginal friendship ties. These
percentages indicate that, relatives are still an important source of socialisation and probably
compensate for the lack of an extensive friendship network.
9 O’Luanaigh C and Lawlor BA. Loneliness and the Health of Older People. International Journal of Geriatric
Psychiatry. 2008;23(12):1213-21
10 Holt-Lunstad J, Smith TB and Layton JB. Social Relationships and Mortality Risk: A Meta-analytic Review.
2010; 7(7):
11 Lubben J, Blozik E, Gillmann G, Iliffe S, Von Renteln Kruse W, Beck JC and Stuck AE. Performance of an
Abbreviated Version of the Lubben Social Network Scale Among three European Community-dwelling Older
Adult Populations. The Gerontologist. 2006; 46(4): 503-513

26
With regard to social isolation there was a significant gender difference, with 42.2% of females and
37.7% of males being socially isolated. However, there was no significant difference with age.
Females are more likely to have marginal friendship ties. However, there was no significant gender
and age difference with marginal family ties (Table 7).
� The survey indicates that social isolation in
community-dwelling older adults is reported at
40.3%. 16.7% of the respondents have marginal
family ties while 62.7% have marginal friendship
ties.
� With regard to social isolation there was a
significant gender difference, with 42.2% of females
and 37.7% of males feeling socially isolated.
� Females are more likely to have marginal friendship
ties.

27
9 Conclusion
This report gives a snapshot of the current health status of the elderly population focusing on
morbidity and degree of impairment, availability of personal, familial, and community resources for
care giving, social isolation and demand for long term services and community care. Population
ageing is a global phenomenon putting increased demands on the national healthcare system and
social services and so putting at the forefront the importance of assessing the needs of the elderly
community, the needs of their informal carers as well as the needs of the future healthcare system.
The findings of this report show that
• Half of the respondents were married, about one third were widowed and about one tenth
were single. 1.0% of the participants were divorced. 70.3% of men live as a couple while
34.2% of women live as a couple.
• 27.5% of the participants live in a single person household. 14.7% of those having severe
impairment live alone.
• 3.9% of the respondents never see or hear from their relatives in a given month. 36.3% of
the respondents reported no encounters with friends within a month.
• 6.8% reported that they had severe impairment.
• 12.9% of the participants reported receiving some sort of medical care from a healthcare
professional at home. Overall, reported community care service use is low within the 75+
population. 14.6% of those aged 75 years and over live within an institution or rehabilitation
hospital while 4.8% of the participants are currently on a waiting list for a nursing home.
• The survey indicates that social isolation in community-dwelling older adults is at 40.3%.
16.7% of the respondents had marginal family ties while 62.7% had marginal friendship ties.

28
10 Tables and Figures
10.1 Figures
Figure 3: Marital status of elderly participants total and by gender
Figure 4: Marital status of elderly participants total and by age group
1.0
49.6
12.7
36.6
0.8
32.8
15.7
50.8
1.4
72.1
8.8
17.7
0 10 20 30 40 50 60 70 80
Divorced/Separated
Married
Single
Widowed
Percentage
men women total
1.0
49.6
12.7
36.6
0.8
32.4
12.5
54.3
1.1
53.5
12.8
32.6
0 10 20 30 40 50 60
Divorced/Separated
Married
Single
Widowed
Percentage
75-84 85+ total

29
Figure 5: Size of household
Figure 6: Size of household with degree of impairment
27.5
51.9
20.6
0
10
20
30
40
50
60
1 Person 2 Persons 3+ Persons
Pe
rce
nta
ge
Size of household
20.8
19.2
30.4
31.4
51.8
51.8
50.6
53.9
27.4
29.0
19.0
14.7
0 10 20 30 40 50 60
Total
No or very little impairment
Moderate impairment
Severe functional impairment
Percentage
1 person 2 persons 3+ persons

30
Figure 7: Percentage of participants who see or hear from their relatives at least once a month by gender
Figure 8: Percentage of participants who see or hear from their friends at least once a month by gender
0
5
10
15
20
25
30
1 2 3 or 4 5 to 8 9+ None
Pe
rce
nta
ge
Number of relatives
men women total
0
5
10
15
20
25
30
35
40
1 2 3 or 4 5 to 8 9+ None
Pe
rce
nta
ge
Number of friends
men women total

31
Figure 9: Percentage of participants who see or hear from their relatives at least once a month by age group
Figure 10: Percentage of participants who see or hear from their friends at least once a month by age group
0
5
10
15
20
25
30
35
1 2 3 or 4 5 to 8 9+ None
Pe
rce
nta
ge
Number of relatives
75-84 85+ total
0
5
10
15
20
25
30
35
40
45
50
1 2 3 or 4 5 to 8 9+ None
Pe
rce
na
tge
Number of friends
75-84 85+ total

32
Figure 11: Degree of impairment for total and by gender
Figure 12: Degree of impairment for total and by age group
86.5
6.7
6.8
84.7
7.4
7.9
88.9
5.7
5.4
0 10 20 30 40 50 60 70 80 90 100
No or very little impairment
Moderate impairment
Severe functional impairment
Percentage
men women total
86.5
6.7
6.8
71.5
13.1
15.4
89.9
5.3
4.9
0 10 20 30 40 50 60 70 80 90 100
No or very little impairment
Moderate impairment
Severe functional impairment
Percentage
75-84 85+ total

Figure 13: Percentage of elderly participants
(Respondents could select more than one
Figure 14: Percentage of elderly participants needing help with ADLs
(Respondents could select more than one
0 5
Eating
Transfer
Walking inside
Walking outside
Dressing
Bathing
Toileting
Incontinence
5.03.9
0 5
Eating
Transfer
Walking inside
Walking outside
Dressing
Bathing
Toileting
Incontinence
33
of elderly participants needing help with ADLs
Respondents could select more than one ADL)
Percentage of elderly participants needing help with ADLs by gender
Respondents could select more than one ADL)
4.5
10.6
18.0
11.1
14.3
8.3
11.1
5 10 15 20 25
Percentage
5.0
12.6
21.5
12.5
16.5
9.9
11.7
7.9
13.3
20.6
9.3
11.4
6.2
10.3
10 15 20 25 30
Percentage
men women
28.2
25 30
33.9
35 40

34
Figure 15: Percentage of elderly participants needing help with ADLs by age group
(Respondents could select more than one ADL)
Figure 16: Percentage of elderly participants needing help with IADLs
(Respondents could select more than one IADL)
9.3
21.0
34.8
52.7
24.3
30.1
18.6
17.4
3.5
8.2
14.1
22.7
8.1
10.8
5.9
9.7
0 10 20 30 40 50 60
Eating
Transfer
Walking inside
Walking outside
Dressing
Bathing
Toileting
Incontinence
Percentage
75-84 85+
25.1
34.3
20.5
33.8
29.7
14.4
11.6
0 5 10 15 20 25 30 35 40
Meal Preparation
Laundry
Light household
Grocery Shopping
Managing money
Medication
Using phone
Percentage

35
Figure 17: Percentage of elderly participants needing help with IADLs by gender
(Respondents could select more than one IADL)
Figure 18: Percentage of elderly participants needing help with IADLs because of a disability by gender
(Respondents could select more than one IADL)
17.2
26.2
16.8
38.7
35.2
15.6
12.3
35.6
45.3
25.5
27.2
22.3
12.7
10.7
0 5 10 15 20 25 30 35 40 45 50
Meal Preparation
Laundry
Light household
Grocery Shopping
Managing money
Medication
Using phone
Percentage
men women
78.2
77.8
81.5
79.4
50.7
67.6
75.2
26.7
26.4
38.7
51.3
41.7
56.3
64.0
0 10 20 30 40 50 60 70 80 90
Meal Preparation
Laundry
Light household
Grocery Shopping
Managing money
Medication
Using phone
Percentage
men women

36
Figure 19: Percentage of elderly participants needing help with IADLs by age group
(Respondents could select more than one IADL)
Figure 20: Percentage of elderly participants on a waiting list total, by gender and age group
40.7
54.1
38.4
60.6
46.8
29.2
25.8
21.6
29.8
16.5
27.7
25.8
11.0
8.4
0 10 20 30 40 50 60 70
Meal Preparation
Laundry
Light household
Grocery Shopping
Managing money
Medication
Using phone
Percentage
75-84 85+
3.2
5.9
4.1
7.9
4.8
0
1
2
3
4
5
6
7
8
9
men women 75-84 85+ total
Gender Age(years)
Pe
rce
nta
ge

37
Figure 21: Percentage of elderly participants on a waiting list for a nursing home by degree of impairment
Figure 22: Percentage of elderly participants on a waiting list for a nursing home by number of persons in a
household
4.8
3.7
11.1
13.2
0 2 4 6 8 10 12 14
Total
No or very little impairment
Moderate impairment
Severe functional impairment
Percentage on a waiting list
7.6
4.1
2.6
0
1
2
3
4
5
6
7
8
1 2 3+
Pe
rce
nta
ge
Size of household (persons)

38
Figure 23: Percentage of elderly participants needing a medical service at home by gender and age group
Figure 24: Percentage of elderly participants needing a medical service at home by impairment
11.7
13.9
11.3
20.1
12.9
0
5
10
15
20
25
men women 75-84 85+ total
Gender Age (years)
Pe
rce
nta
ge
13.0
10.0
29.8
33.9
0 5 10 15 20 25 30 35 40
Total
No or very little impairment
Moderate impairment
Severe functional impairment
Percentage

39
10.2 Tables
Table 1: Size of household by gender
Size of household (persons) Male (%) Female (%)
1 15.5 36.5
2 62.0 44.3
3+ 22.5 19.2
Table 2: Size of household by age
Size of household (persons) 75-84 years (%) 85 years and over (%)
1 26.3 32.6
2 53.7 43.8
3+ 20.0 23.6
Table 3: Percentage of elderly participants using community services
(Respondents could select more than one service)
Service Percentage
Meals on wheels 2.0
Home help and handyman service 14.4
Transport 6.5
Others 25.8

40
Table 4: Percentage of elderly participants needing community services by gender and age group
(Respondents could select more than one service)
Service Males (%) Females (%) 75-84 years
(%)
85 years and
over (%)
Meals on wheels 2.3 1.8 1.6 3.8
Home help and handyman
service 11.2 16.8 13.5 18.2
Transport 5.8 7.1 6.0 8.8
Others 18.1 31.6 23.2 37.0
Table 5: Community services by degree of impairment
(Respondents could select more than one service)
Service
Degree of Impairment (%)
No or very little
impairment
Moderate
impairment
Severe functional
impairment
Meals on wheels 1.7 3.6 5.1
Home help and handyman
service 13.9 19.0 14.8
Transport 5.4 11.9 16.4
Others 24.5 36.9 33.1
Waiting list for nursing
home 3.7 11.1 13.2

41
Table 6: Elderly living alone and using community services by degree of impairment
(Respondents could select more than one service)
Table 7: Percentage of elderly participants who are socially isolated
Service
Degree of Impairment (%)
No or very little
impairment
Moderate
impairment
Severe functional
impairment
Meals on wheels 2.9 7.0 5.4
Home help and handyman
service 21.3 28.2 16.1
Transport 6.6 14.1 19.6
Others 43.3 64.8 41.1
Waiting list for nursing
home 6.7 20.0 16.7
Socially isolated
(%)
Marginal family
ties (%)
Marginal
friendship ties (%)
Males 37.7 16.1 58.0
Females 42.2 17.2 66.1
75-84 years 39.8 16.4 61.9
85 years and over 43.3 18.7 67.1
