nber working paper series currency ...currency mismatches, default risk, and exchange rate...
TRANSCRIPT
NBER WORKING PAPER SERIES
CURRENCY MISMATCHES, DEFAULT RISK, ANDEXCHANGE RATE DEPRECIATION: EVIDENCE
FROM THE END OF BIMETALLISM
Michael D. BordoChristopher M. Meissner
Marc D. Weidenmier
Working Paper 12299http://www.nber.org/papers/w12299
NATIONAL BUREAU OF ECONOMIC RESEARCH1050 Massachusetts Avenue
Cambridge, MA 02138June 2006
We thank Marc Flandreau, Ricardo Hausmann, Angela Redish, Pierre Sic Sic and Alan M. Taylor andparticipants in talks at the ASSA/Clio Meetings, Birmingham, Dartmouth, Harvard, London School ofEconomics, Manchester, the Economic History Society and the Economic History Association Conferencefor comments on an early draft. Antonio David and Rafael de Hoyos provided able research assistance.Michael Clemens, Klas Fregert, Lars Jonung, Masato Shizume, and Jeff Williamson helped with the data.Funding from the University of Cambridge’s Department of Applied Economics and the UK’s ESRC grantRES 156-25-0014 is gratefully acknowledged. Part of this work was carried out while Meissner was visitingthe Bank of England as a Houblon Norman George Fellow. The Bank’s hospitality is greatly appreciated.Any errors are solely the responsibility of the authors. The views expressed herein are those of the author(s)and do not necessarily reflect the views of the National Bureau of Economic Research.
©2006 by Michael D. Bordo, Christopher M. Meissner and Marc D. Weidenmier. All rights reserved. Shortsections of text, not to exceed two paragraphs, may be quoted without explicit permission provided that fullcredit, including © notice, is given to the source.
Currency Mismatches, Default Risk, and Exchange Rate Depreciation: Evidence from the End ofBimetallismMichael D. Bordo, Christopher M. Meissner and Marc D. WeidenmierNBER Working Paper No. 12299June 2006, Revised September 2006JEL No. N1, N2, F3
ABSTRACT
It is generally very difficult to measure the effects of a currency depreciation on a country’s balancesheet and financing costs given the endogenous properties of the exchange rate. History provides atleast one natural experiment to test whether an exogenous exchange rate depreciation can becontractionary (via an increased real debt burden) or expansionary (via an improved current account).France’s decision to suspend the free coinage of silver in 1876 played a paramount role in causinga large exogenous depreciation of the nominal exchange rates of all silver standard countries versusgold-backed currencies such as the British pound—the currency in which much of their debt waspayable. Our identifying assumption is that France’s decision to end bimetallism was exogenousfrom the viewpoint of countries on the silver standard. To deal with heterogeneity we implement adifference in differences estimator. Sovereign yield spreads for countries on the silver standardincreased in proportion to the potential currency mismatch. Yield spreads for silver countriesincreased ten to fifteen percent in the wake of the depreciation. Basic growth models suggest thatthe accompanying reduction in investment could have decreased output per capita by between oneand four percent relative to the pre-shock trajectory. This also illustrates that a substantial proportionof the decrease in spreads gold standard countries identified in the “Good Housekeeping” literaturecould be attributable to the increase in exchange rate stability. Finally, if emerging markets are goingto embrace international capital flows, the most export oriented countries will manage to mitigatethe negative effects of a currency mismatch.
Michael D. BordoDepartment of EconomicsHarvard UniversityLittauer Center - Room M27Cambridge, MA 02138and [email protected]
Christopher M. MeissnerFaculty of EconomicsUniversity of CambridgeAustin Robinson BuildingSidgwick AvenueCambridge CB3 9DDUNITED KINGDOMand [email protected]
Marc D. WeidenmierDepartment of EconomicsClaremont McKenna CollegeClaremont, CA 91711and [email protected]
2
I. Introduction
A currency mismatch occurs when a country’s debt is denominated in a foreign
currency while its revenue streams are largely in local currency. Currency mismatches make a
country vulnerable. A sudden real exchange rate depreciation can abruptly reduce the ability
to repay foreign currency debt. On the other hand, exchange rate depreciation could also
stimulate exports and reduce default risk by improving a country’s ability to pay. If debt
valuation effects dominate, this deterioration of a country’s “balance sheet” could increase
default risk.1
Currency mismatches are in fact ubiquitous, and they are deemed by many to create
financial fragility by accelerating the onset of a financial crisis or exacerbating the severity of
financial crises. Balance sheet problems are at the heart of many explanations for the severity
of the 1997 Asian financial crisis and have been analyzed in new micro-founded open-
economy models such as that found in Céspedes, Chang and Velasco (2004). However, few,
if any, papers have been able to empirically assess the precise links among currency
depreciation, a country’s balance sheet, and financing costs given the endogeneity of the
exchange rate.2
Fortunately, history provides a natural experiment to test whether the effects of an
exogenous exchange rate depreciation via an interest rate channel can be contractionary or
expansionary.3 We focus on the accelerated depreciation of silver in early 1876 which was
1 The literature on balance sheets in international finance builds off Bernanke and Gertler (1989) who analyzed collateral constraints, net worth and balance sheets in imperfect domestic capital markets and their role in accentuating economic fluctuations. 2 There are quite a number of theoretical and empirical studies on the origins of original sin or the reason why countries seem to issue most international debt in hard currency. Flandreau and Sussman (2004) and Eichengreen, Hausmann and Panizza (2003), for example, argue that liquidity is an important factor in explaining the existence of original sin. Bordo, Meissner, and Redish (2004) find that sound financial institutions, monetary regimes, and financial development are not sufficient conditions for a country to borrow in its own currency. They argue that large shocks such as the Great Depression, wars, and the emergence of a liquid global capital market in the second half of the nineteenth century were important factors in explaining how the United States and former British colonies overcame original sin. Eichengreen and Hausmann (2002) have also offered some solutions to the currency mismatch problem. 3 In Céspedes, Chang and Velasco (2004) the effect can go either way.
3
connected to the anticipation of France’s August 1876 decision to suspend the coinage of
silver which itself guaranteed silver would continue to depreciate against gold.
France’s move in August 1876 accelerated the trend depreciation of silver already
underway since 1873. As shown in Figure 1, this decreased demand for silver (and increased
demand for gold) led to an historically abrupt depreciation of silver. We argue that France’s
decision and the depreciation of silver was exogenous for the countries with silver-based
monetary systems. The French debate was watched closely by markets throughout early 1876,
and French suspension of silver coinage became an increasingly sure thing up to August
1876. Between January 1876 and mid-1876 markets incorporated this information into their
expectations perceiving the likelihood of an accelerated and sustained silver depreciation to
be greater and greater with each passing week. These factors, combined with the fact that a
large portion of countries’ liabilities were denominated and payable in gold currency, suggest
that the rapid decline of silver in early 1876 provides a unique historical experiment to study
one of the key predictions of the theoretical literature on currency mismatches.
We use a new weekly database of sovereign debt prices collected from The
Economist, and undertake a before and after comparison or event study using a difference in
differences (DID) regression strategy. This approach eliminates pre-existing differences in
risk between silver and non-silver countries and controls for market forces affecting all
countries. We measure the impact of the suspension of silver coinage on sovereign yield
spreads for countries on a silver standard compared to non-silver countries. We find that
sovereign spreads for the silver group increased following the expectation of suspension of
silver coinage by France because their hard currency liabilities increased relative to their
ability to pay for such liabilities. Our results are consistent with the idea that balance sheet
management is key to avoiding fragility in a world of currency mismatches. Moreover, the
implied impact on the real economy of currency instability might also have been substantial.
The channel would run from increased financing costs to lower equilibrium investment and
finally to lower output per capita. If a currency risk premium were built in to the cost of
4
issuing new liabilities used to fund additions to the capital stock, output per capita could have
been one to four percent lower than if borrowing costs were free of such a penalty.
The rest of the paper proceeds as follows. Section II discusses the theoretical
background and extant empirical evidence. Section III reviews different explanations for the
French-cum-global demonetization of silver. This is followed by an historical discussion of
important events in the market for gold and silver in the 1870s to motivate the event study.
We then introduce the new database on sovereign spreads and analyze the effects of the
suspension of silver coinage by France on sovereign default risk. Section VI concludes the
paper with a discussion and the implications of our results for investment and growth.
Section II. Hard Currency Debt, Hard Theory, and a Hard Empirical Problem
Hard currency debt and its attendant problems for emerging market economies have
generated substantial interest among economists and policymakers since the mid-1990s.4 The
severity of the Asian financial crisis and the Tequila crisis in Mexico was partially attributed
to the damaging effect of large depreciations in the face of preponderant dollarized liabilities.
Eichengreen and Hausmann (1999) related the problem of original sin to exchange rate
regime choices and financial stability. Recently, Bordo and Meissner (forthcoming) have
found evidence that currency mismatches are associated with a higher probability of a debt or
banking crisis both before 1913 and since 1973. Bleakley and Cowan (2002), on the other
hand, find that hard currency debt risk may have been hedged away in a sample of Latin
American firms.
Céspedes, Chang and Velasco (2004) analyze the impact of an unexpected
devaluation in a micro-founded open-economy model with nominal rigidities and balance
sheet effects. Their theoretical analysis suggests that the impact depends on several crucial
country-characteristics: the total level of indebtedness (relative to net worth), the degree of
4 Eichengreen, Hausmann, and Panizza (2005) discuss the impact of ‘original sin’ on various macroeconomic indicators.
5
financial friction in an economy, the responsiveness of exports to devaluations and the
importance of exports in total output. The authors argue that depreciations are expansionary
in financially developed economies that carry low-debt burdens and can easily sell goods on
international markets. For financially vulnerable economies (they use Argentina as an
example) that do not possess these characteristics, depreciations can be contractionary. In
vulnerable countries, devaluation raises the cost of capital and increases the debt burden while
there is little benefit on the export side. We are interested in testing empirically how much a
surprise depreciation could raise the cost of borrowing.
There is little systematic empirical research that can shed light on this question.5 One
explanation for the small number of convincing studies is that the exchange rate is one of the
most endogenous variables in an economy. Many studies have shown that the exchange rate
depends on a variety of macroeconomic fundamentals including the trade balance, relative
money supplies, and economic output. Other studies point to the importance of news and
expectations as driving forces in exchange rate movements (Frankel and Rose, 1995).
In the economic history literature, several recent studies have focused on the importance of
sound macroeconomic policy for sovereign yield spreads during the classical gold standard
period. Bordo and Rockoff (1996) argue that maintaining a gold standard was a “Good
Housekeeping Seal of Approval.” Adherence to the gold standard was a signal to financial
markets that a country would adopt time-consistent monetary and fiscal policies. For a sample
of 12 countries, they found that countries on the gold standard had significantly lower bond
spreads all else equal. Obstfeld and Taylor (2003) obtained a similar empirical result using a
panel data set that included more countries. Sussman and Yafeh (2000) showed that Japan
experienced a drop in its spread of about 200 basis points immediately after adopting the gold
standard.
5 Powell and Sturzenegger (2000) is an exception. Using a number of event studies, they find
that the link between announcements about currency stability and sovereign risk varies from country to country. They suggest further investigation of the possibility that country characteristics and policies could influence the level of the impact.
6
Mauro, Sussman and Yafeh (2006) contrast this with the experience of Russia which
adopted the gold standard in the same year but was given no such reduction. They argue is
that investors viewed Japan’s policy change as a commitment to “macroeconomic stability”
while in Russia any such news had already been incorporated following financial reforms in
the previous years. Overall, this literature chalks up such declines to enhanced policy stability
and views the gold standard as simply the crown jewel of such a policy program.
Flandreau and Zúmer (2004), on the other hand, argue that joining the gold standard
did not lead to a reduction in spreads. While they do assert that depreciation and floating
might have led markets to perceive incipient payment difficulties in theory, they claim to
show that sound fiscal discipline and export-orientation play a far greater role than exchange
rate movements in determining the level of country spreads between 1880 and 1913 in their
specifications.
Although these previous studies have provided important insights, historical studies
have also assumed that the exchange rate is an exogenous variable. We believe that the
endogeneity of the exchange rate regime or the level of the nominal exchange rate poses an
important and challenging identification problem that has not adequately been dealt with in
previous studies. Critics of the “Good Housekeeping” literature suggest that if omitted or
unobservable factors change around the time that the gold standard was adopted, the size and
statistical significance of the causal impact of the exchange rate regime itself could be
seriously biased. Identifying the importance of exchange rate stability and controlling for
possible feedback effects makes it difficult to discern the impact of exchange rate
depreciation on the cost of capital for sovereign entities.
We propose an event study methodology that circumvents almost all of these
problems. Rather than estimate the impact of a package of macroeconomic policies, we
provide a clean estimate of the impact of currency depreciation on sovereign risk via its
impact on the currency mismatch. Specifically, the research design is to observe the spreads
on a group of comparable long-term sovereign bonds, some of which were denominated in
silver and some in gold or paper, over the course of a short time span of roughly eleven
7
months. Restricting attention to a relatively short time span allows us to be certain that
unobservables did not change over the entire period of interest. We then break this period into
two periods. The timing of the break point is the point at which market participants begin to
anticipate and expect a substantial change in the value of silver. We then relate the change in
bond spreads to the subsequent increase in hard currency debt liabilities relative to exports or
revenue. By comparing the change in silver countries which faced a uniform and expected
depreciation in the second period to a control group of “untreated” non-silver countries with
no expected exchange rate change. We also purge the impact of any shocks that affected the
entire market.
Section III. The Global Context: France as the Linchpin of the International Monetary
System
At the end of the 1860s, the international monetary system was composed of roughly
four categories of countries. The first group consisted of countries that followed the gold
standard and included Great Britain, Portugal, Australasia, Canada, and many other members
of the British Empire. The second group was composed of countries that operated a bimetallic
system where the mint price of silver was fixed in terms of gold and either metal passed
current as a means of payment. France and other countries in the Latin Monetary Union were
the most important members of the bimetallic group. A third group consisted of countries on
the silver standard, and the final group were those with inconvertible paper money regimes.
Many silver standard countries were located in Latin America including Mexico, Colombia,
and Bolivia. India and China were two important members of the silver standard in the Far
East.
By 1880, the makeup of the international monetary system had changed dramatically
in a span of only ten years. Germany (1871), Holland (1875) and the United States (1879),
three economically important countries, joined Britain as members of the gold standard.
France and the rest of the Latin Monetary Union made the decision in 1878 but since France
8
was a large player it had a choice independent of this general movement. In the end France
opted for gold and the general move towards gold continued, albeit with some lapses, over the
next 30 years. On the eve of the First World War, almost every major country in the world
had adopted the gold standard.6 We begin with a brief recapitulation of the historical
literature on these changes. We then offer an explanation based on research by Flandreau as
to why France’s policies were crucial for silver’s depreciation. Finally we observe that the
French policy change can conveniently be considered an exogenous nominal exchange rate
shock for countries outside France.
There are a number of competing hypotheses that explain the rapid adoption of gold
in the 1870s.7 The fundamentalist theory focuses on the world supplies of gold and silver as
important factors in France’s decision to adopt the gold standard (Kindleberger, 1978).
Bimetallism was not able to endure the discovery of new silver mines in the American West
(Comstock Lode in 1859) and new technologies that lowered the cost of extraction. Gallarotti
(1994) discusses the role of political factors in the emergence of the classical gold standard.
The industrial revolution helped to enlarge and empower the bourgeoisie class. This group
supported the adoption of the gold standard because the precious metal was used in large
transactions and was perceived to be an instrument of stable-money.
Kenwood and Lougheed (1979) highlight the role of Germany and international trade
linkages in the worldwide spread of gold during the 1870s and early 1880s. 8 Finally, Redish
(1995) emphasizes the importance of technological advances in the minting of token coins --
money whose legal tender value exceeded its intrinsic value-- as a key force behind the
emergence of the gold standard and France’s late adoption of the monetary rule. The
6 China was an exception. The Asian country had a number of local currency systems but many parts of China used some form of a silver standard for the entire classical gold standard period. 7 Flandreau (1996) provides a prologue to the wave of adoption of gold based systems. Flandreau notes the role of strategic interaction between France and Germany in setting off the scramble for gold. He also suggests network externalities may have been a factor leading to the rise of a global gold standard and the demise of silver and bimetallism. Meissner (2005) provides an econometric analysis of the competing hypotheses about the diffusion of the gold standard. Network externalities, the level of development and the desire to attract low-cost capital appear to be the most important determinants of the timing and probability of adoption. 8 For a discussion of the trade benefits of coordination on the gold standard, see Estevadeordal, Frantz and Taylor (2003), Flandreau and Maurel (2001) and López-Córdova and Meissner (2003).
9
introduction of Boulton and Watt’s steam driven presses allowed countries to easily mint high
quality (gold) token coins in small denominations.
Flandreau (1996) disagrees with these views. He notes that the timing of the switch to
gold in the 1870s is inconsistent with the technological innovations and the discovery of
silver deposits that occurred years earlier. He also notes that many transactions were settled
with bills rather than coins. Flandreau argues that since France was a significant player in the
international market for silver, its policies could single-handedly influence the gold price of
silver in the open market. This made true bimetallism viable as there was no divergence
between the mint and market ratios. Nevertheless, France began to limit silver coinage in
1873 and in 1876 it announced that it would suspend the coinage of silver. By 1878, France
along with the other members of the Latin Monetary Union had moved to a gold-based
system.
Section IV. The 1876 French Suspension of Silver Coinage as a Natural Experiment
Flandreau (1996) argues that the worldwide movement towards gold was catalyzed by
animosities arising from the Franco-Prussian War.9 The five billion franc indemnity provided
Germany with the financial capacity to adopt the gold standard. But France, and the Latin
Monetary Union along with it, were unwilling to support Germany’s move and found a way
to stymie the transition by refusing to purchase the large amount of silver Germany needed to
trade for gold for its transition. France did this by limiting the free coinage of silver from
1873. Flandreau (1996) also presents a formal model and econometric evidence that France
was large enough to have “purchased” nearly all of Germany’s silver at the 15.5:1 ratio and
still had enough gold to maintain de facto bimetallism. Under free coinage of either gold or
silver, it could have eliminated a divergence between market and mint ratios and would not
have fallen victim to “Gresham’s law”. Hence Flandreau concludes that France itself was
9 Friedman (1990a, 1990b) argues that the United States’ decision to adopt the gold standard was also a historical accident.
10
responsible for initiating the long-run fall in the value of silver beginning in 1873. When
France limited silver coinage 1873, silver’s market value declined as supply outstripped
demand. This also led to increased expectations about the possible abolition of bimetallism
which in turn fed back onto the market due to speculative activity.
Evidence from 1873 is convincing on this point. On the day after the
announcement of limited silver coinage in 1873, silver depreciated against gold
dramatically and precipitously (see Flandreau, 1996, Figure 5).10 This “limping
bimetallism” and the non-committal “wait and see” policy of France continued for
several years. It became increasingly untenable as the limits on silver coinage
failed to halt German sales, new silver discoveries came on line, silver’s
depreciation began to accelerate and political fragmentation increased within
France on the monetary question. In early 1876, as these pressures mounted and fed
back on each other, the expectation of a change in French policy helped accelerate
silver’s depreciation.
The announcement of plans to discuss a change in policy in France and the
heightened expectation of a permanent suspension of silver coinage, which we
demonstrate happened between January 1875 and mid-1876, must have been
responsible for silver’s accelerated depreciation which began in late January. Since
1873, The Economist had expected that most European countries would eventually
abandon silver and bimetallic standards. Our reading of the financial press of the
time shows that it was obvious to market participants by early 1876 that if France
abandoned bimetallism, thereby massively decreasing demand for silver, then
silver’s relative value against gold would keep falling.
To assess the market’s view of the French silver question, we collected every major
news article in The Economist (based in London) and the Economiste Français (based in
Paris) from July 1, 1875 to August 12, 1876. We chose these outlets as London was the place 10 Even so the official French policy was a “wait and see” policy. There was still a chance that the Bank of France would resume free silver purchases at the old mint parity. Informational problems aside, this could have also acted to mitigate the expectation that silver’s value in terms of gold was doomed.
11
of the principal silver market of the time and because the French newspaper could provide an
insider’s view on political events in France. The Appendix of news articles lists the date and
provides a summary of each article.
We first observe that there are few important articles on silver’s depreciation or
factors affecting silver’s value in 1875 in either magazine. Hence we rule out the idea that
there was a significant expectation of a large drop in silver’s value in those months. This
makes it plausible to use most of 1875 as a base period for our before-and-after analysis.
However, this changes dramatically in January 1876. On January 29, 1876 The Economist
reported that France might soon suspend free-silver coinage. This represented the first time in
more than seven months that The Economist printed a significant news story about French
silver policy. Similarly in the Paris-based magazine, few articles about silver’s fall are evident
until mid-December, 1875.12 On January 29, 1876, The Economist reported that the Paris
Chamber of Commerce asked the French Minister of Commerce and Agriculture to abandon
silver and adopt the gold standard:
.… from the 31st of January, when the present [Latin] monetary convention expires, no more silver five-franc pieces should be coined, that those in circulation should be demonetized as soon as circumstances permitted…
This article was followed up by several news stories over the next several months
that discussed various political and economic aspects of the silver question. The Economist
reported March 4, 1876 that the Latin Monetary Union had agreed to further limit the issue of
silver coinage. A week later, the Paris Political Economy Society noted that increased silver
production from silver mines discovered in the United States several years before, German
monetary policy, and French silver policy explained the recent drop in the gold value of
silver. The article also mentioned that the Bank of France refused to grant loans on the
security of silver deposits, but The Economist dismissed this last claim as an unfounded
rumor.
12 Willis (1901) presents a similar timeline of France’s decision to abandon bimetallism.
12
The Economiste Français ran a series of articles up to March emphasizing that
silver’s fall was unprecedented and analyzed various causes of silver’s fall. On February 5,
1876, two articles illustrate the expectation of further depreciation. An editorial, one of a
series of similarly worded formulations, claimed that by the end of 1876 silver would have
depreciated by fifteen percent. A report from the “principal market for silver” in London
suggests that short-term expectations are for depreciation.
On March 18, 1876, The Economist reported that the Bank of France would continue
to grant loans collateralized by silver bars and foreign coins, but with a 20 percent reduction
in the amount per kilogram advanced. The weekly London financial paper also noted that
silver would continue to depreciate against gold if France decided to abandon bimetallism
and adopt a gold standard. On March 25, 1876, both The Economist and the Economiste
Français noted that the French Senate had begun debate on whether the country should
abandon silver and adopt gold. Leading debaters also discussed a couple of different methods
by which silver could be demonetized. Leon Say, French Minister of Finance, presented a bill
that would suspend all silver coinage.
The Economist continued to report discussions of the French silver question into
early April 1876. News articles summarized political debates on whether France should adopt
gold or retain a bimetallic system. This was followed by a six week hiatus of new articles on
the monetary question. In fact this could coincide with a brief triumph for the forces of the
status quo. An article on April 1, 1876 from the Paris-based weekly suggests that the French
daily press had been talking of the defeat of the project to abandon bimetallism. The editor’s
reaction is that the battle may have been lost but the war was not yet over. He goes on to note
the French government itself seems to see few merits in the old bimetallic system.
Discussion of the total suspension of silver coinage resurfaced in mid-June with a
report that the French Senate would continue its debate over the issue. It was reported in the
Economiste Français that the commission in charge of the bill in the French senate had
approved the proposal to suspend silver coinage despite stiff resistance from the ever-
13
important player The Bank of France. On July 1, 1876, the British financial weekly noted that
the French Senate discussed a bill that would empower the French government to restrict
coinage of the silver five-franc piece. Two weeks later, the British government issued a report
on the depreciation of silver and argued that German demonetization and actions by the Latin
Monetary Union (led by France) played a key role in the fall in the price of the precious
metal. By mid-July, confidence in the French newspaper that silver coinage would be
suspended seems to have become much stronger. The notion that French suspension of
coinage would lead to further falls in silver is also boldly asserted.
The Economist reported on August 5, 1876 that France passed a bill authorizing the
suspension of free-silver coinage. A week later, the French Minister of Finance issued an
order that silver bars would not be received at the mints of Paris or Bordeaux for coinage. The
Economist also noted that the Vice-President of the Liverpool Chamber of Commerce
attributed the recent fall in the price of silver to actions by France and the Latin Monetary
Union. Articles on silver and the monetary question largely die out in the autumn of 1876 in
Economiste Français. This is further evidence that new information about the fate of silver,
which was then incorporated into asset prices, was abundant in early 1876 and that little new
information about silver’s trajectory entered into markets between August and December
1876.
Overall, the evidence from the popular press both in London and Paris, which we
believe reflects the expectations of silver market participants, strongly suggests that financial
markets believed there was a high probability France would move to suspend the coinage of
silver in the months preceding the actual passage of the legislation. Moreover, this translated
into expectations of depreciation, which via the asset market, turned into actual depreciation.
Indeed, the sterling price of silver also suggests this interpretation as the gold-backed pound
appreciated against silver more than ten percent in the first six months of 1876. For this
reason, this historical episode provides an excellent natural experiment to test the proposition
that depreciation could lead to an increase in default risk.
14
To motivate the exogeneity of the event, we need to examine the reasons behind
France’s abandonment of bimetallism. Flandreau’s argument is that France’s action depended
upon a strategic interaction between itself and Germany and not on any other considerations.13
For this very reason, the suspension of free-silver coinage becomes a key exogenous shock to
the exchange rate for all silver based countries. For silver countries, there is evidence of
transmission from the gold-silver market to their currencies’ nominal value. In Figures 2
through 4, we plot several silver-currency exchange rates along with the silver-gold exchange
rate (units of silver per unit of gold) between the 1870s and 1880s. The figures show that
there is almost a one-to-one relationship between the exchange rates of silver countries and
the silver-gold exchange rate. The question then is would there be any differential impact on
silver countries? Could this exogenously imposed depreciation simply increase the debt
burden faster than the revenue stream could expand for the silver group? Interest and
amortization costs of debt payable in gold-backed sterling should have increased one-for-one
with this depreciation. But a depreciation might have been beneficial by eventually
stimulating an export boom or increasing the revenue capacity of a country.14
13 The argument is that France was a large player in bullion markets due to its large reserves. It alone could stabilize the gold silver price. Its regime choice as of 1876 was not a function of expectations about the regime choice of the small peripheral silver countries we use in our sample. If it were, this could pollute the exogeneity of the test. Many in France, including the Bank of France itself, advocated the status quo maintaining that bimetallism was viable even in the face others’ adoption of gold. The political economy of France’s decision was quite controversial, and should best be seen as a distributional fight where those interested in boosting trade with Britain won out. This, however, was not an inevitable outcome. 14 Silver briefly appreciated against gold for a period after France suspended the coinage of silver. The Economist (see 1876 and 1877) attributed this short-lived appreciation to a lower than expected supply of silver that Germany planned to sell on the world market.
15
For completeness consider gold countries. If the suspension of silver coinage in
France was interpreted as a shock to silver’s value, then this could have meant an appreciation
vis-à-vis periphery countries. It could also have generated information that inflation and
nominal interest rates would eventually come down in gold countries. For paper countries this
would not necessarily have brought new information about currency values. In any case, the
effect of the suspension of silver coinage on the yield spreads of gold and paper countries is
an empirical question.
Section V. Empirical Analysis
V.A. Difference-in-Differences: Non-Silver-Using Countries as a Control Group
We are interested in testing whether there was a significantly different change in
sovereign bond spreads for silver countries as compared to similar non-silver countries due to
the increase in the currency mismatch from the French suspension of silver coinage.15 Assume
that a country’s risk premium is a function of a debt sustainability measure and other controls.
An event study model for any country i in a given week t can be written as:
ittGitiitit hIgIcZbDar ε+++++= , (1)
where r is the difference between the long-term bond yield of a domestic asset payable in
foreign currency at a fixed exchange rate and the risk-free rate of return, D is a debt
sustainability measure proxied by the ratio of hard currency debt to exports or debt to
revenue.16 We use exports and public revenues as our proxies for a country’s “asset”
15 We use the British consol yield as the reference yield. 16 Most core and emerging market countries quoted commodity prices in local currency during the gold standard period. The London market would then adjust its sterling price based on the interaction of supply and demand in the world market. Nugent (1973) provides some empirical evidence on this question by examining the economic effects of silver depreciation during the gold standard. He shows

16
position. These were indicators widely used by investors at the time to assess the solvency of
sovereign borrowers (Flandreau and Zúmer, 2004). Z is a vector of other factors specific to a
country, GtI is a control for if the country is in group G at time t which allows for factors
affecting all countries in the same group, tI is a period indicator which controls for market
forces affecting all countries in the post-event window, and ε is a country-week specific
error term that us assumed to be uncorrelated with other included variables.
Next, assume the hard currency debt to export ratio does not change over the period
of observation due to new issues on capital markets but that changes in the ratio do occur
because of week to week changes in the nominal exchange rate. This makes the ratio depend
on the exchange rate realization of week t as follows:
ttt eExports
DebteD
0
*0)( = (2)
where the superscript * denotes a variable measured in terms of the foreign numeraire, et is
the realization of the nominal exchange rate (foreign currency units per unit of domestic
currency) for a given week t, exports are measured in local currency and both debt and
exports receive a 0 subscript to denote they are fixed during the sample.17 An alternative
model we use includes a debt to revenue ratio instead of the debt to export ratio which write
as
that the depreciation of silver in the late nineteenth century initiated a large export boom in countries with a silver monetary standard. 17 Two remarks are necessary. We assume exports are fixed in local currency units several months in advance so that the bulk of the value of exports is constant around any given date. If exports were not fixed, the ultimate impact on the spread would depend on two things: directly on the rise in the debt burden and negatively on the responsiveness of exports. The latter depends on pass through and the demand elasticity. Technically, the marginal impact on spreads would be the difference between the depreciation and the product of the elasticity of exports with respect to the exchange rate and the level of debt. If the expected boost to exports factors into expectations then the regression coefficient ∆b would identify the impact on spreads for a medium/long term adjustment in the sustainability ratio. If exports were a function of the exchange rate, this factor would enter multiplicatively in equation (4) in the first product.
17
.)(t0
*0
evenueRe
DebteDR tt = (3)
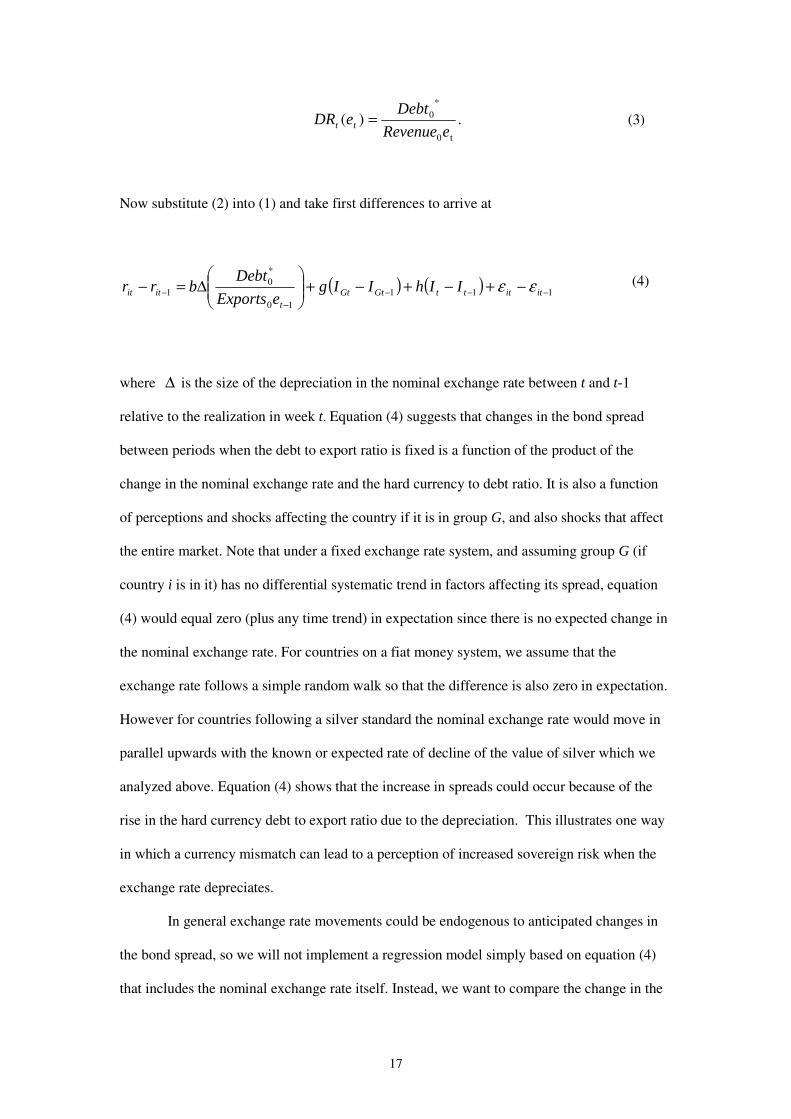
Now substitute (2) into (1) and take first differences to arrive at
( ) ( )
11110
*0
1 −−−−
− −+−+−+
∆=− ititttGtGt
titit IIhIIg
eExports
Debtbrr εε
where ∆ is the size of the depreciation in the nominal exchange rate between t and t-1
relative to the realization in week t. Equation (4) suggests that changes in the bond spread
between periods when the debt to export ratio is fixed is a function of the product of the
change in the nominal exchange rate and the hard currency to debt ratio. It is also a function
of perceptions and shocks affecting the country if it is in group G, and also shocks that affect
the entire market. Note that under a fixed exchange rate system, and assuming group G (if
country i is in it) has no differential systematic trend in factors affecting its spread, equation
(4) would equal zero (plus any time trend) in expectation since there is no expected change in
the nominal exchange rate. For countries on a fiat money system, we assume that the
exchange rate follows a simple random walk so that the difference is also zero in expectation.
However for countries following a silver standard the nominal exchange rate would move in
parallel upwards with the known or expected rate of decline of the value of silver which we
analyzed above. Equation (4) shows that the increase in spreads could occur because of the
rise in the hard currency debt to export ratio due to the depreciation. This illustrates one way
in which a currency mismatch can lead to a perception of increased sovereign risk when the
exchange rate depreciates.
In general exchange rate movements could be endogenous to anticipated changes in
the bond spread, so we will not implement a regression model simply based on equation (4)
that includes the nominal exchange rate itself. Instead, we want to compare the change in the
(4)
18
average spread of silver countries (which we have argued undergo an exogenous depreciation
in early 1876) to the change in our “control” group of non-silver countries at similar levels of
indebtedness. Moreover we want to do this over a short time period so that we are sure that
non-silver countries exchange rates will be unlikely to move for systematic reasons.
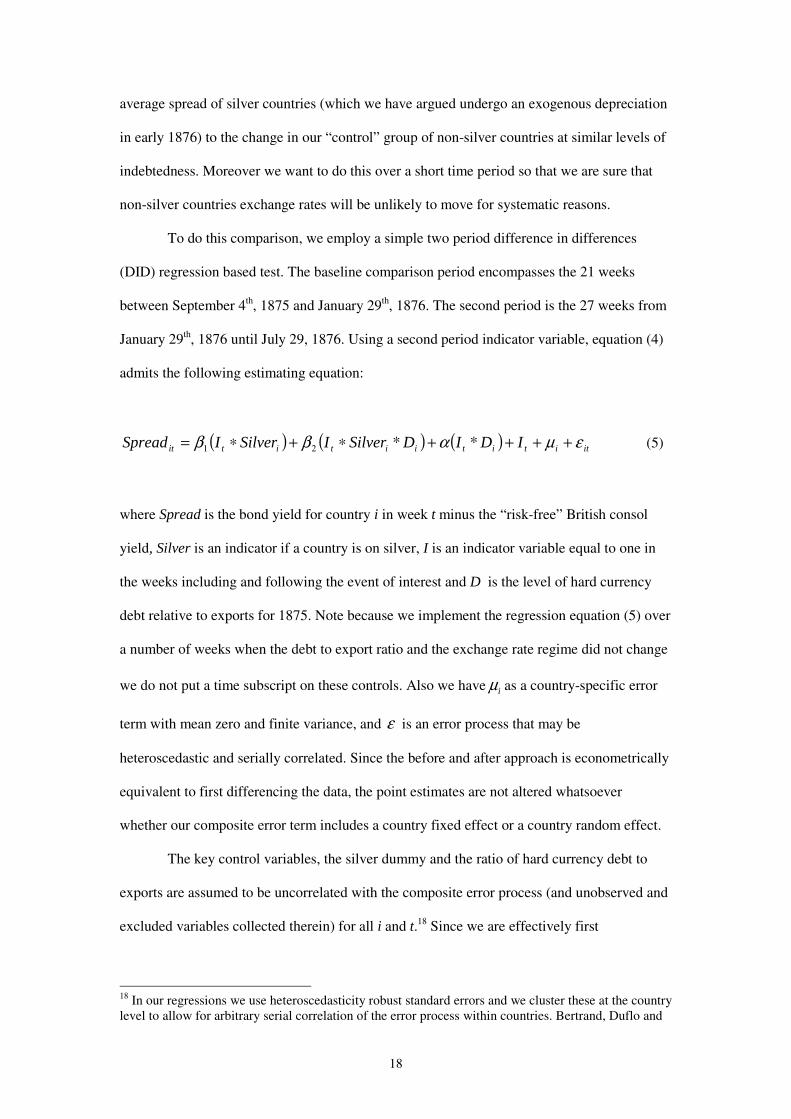
To do this comparison, we employ a simple two period difference in differences
(DID) regression based test. The baseline comparison period encompasses the 21 weeks
between September 4th, 1875 and January 29th, 1876. The second period is the 27 weeks from
January 29th, 1876 until July 29, 1876. Using a second period indicator variable, equation (4)
admits the following estimating equation:
( ) ( ) ( ) itititiititit IDIDSilverISilverISpread εµαββ ++++∗+∗= **21 (5)
where Spread is the bond yield for country i in week t minus the “risk-free” British consol
yield, Silver is an indicator if a country is on silver, I is an indicator variable equal to one in
the weeks including and following the event of interest and D is the level of hard currency
debt relative to exports for 1875. Note because we implement the regression equation (5) over
a number of weeks when the debt to export ratio and the exchange rate regime did not change
we do not put a time subscript on these controls. Also we have iµ as a country-specific error
term with mean zero and finite variance, and ε is an error process that may be
heteroscedastic and serially correlated. Since the before and after approach is econometrically
equivalent to first differencing the data, the point estimates are not altered whatsoever
whether our composite error term includes a country fixed effect or a country random effect.
The key control variables, the silver dummy and the ratio of hard currency debt to
exports are assumed to be uncorrelated with the composite error process (and unobserved and
excluded variables collected therein) for all i and t.18 Since we are effectively first
18 In our regressions we use heteroscedasticity robust standard errors and we cluster these at the country level to allow for arbitrary serial correlation of the error process within countries. Bertrand, Duflo and
19
differencing the data, correlation between these variables and other fixed but excluded
characteristics is not a concern for consistent estimation of the key parameters. Moreover,
since we are looking at the average change in yield spreads over a short period of time, we
omit other macro-aggregate controls since they will be fairly constant (as should expectations
about their evolution except for idiosyncratic shocks) during the pre-event and post-event
window. In sum, the regression in equation (5) allows us to abstract from “fixed” effects that
could be driving the levels of spread.
Using equation (5) there are several quantities of interest. The partial derivative of
equation (5) with respect to the post-event period and the silver control will give the impact
for various values of the hard currency debt to export ratio. This is the value 1β + iD2β . We
can also measure the marginal effect of an increase in the ratio of hard currency debt to
exports for silver countries on the yield spread. This value is given by αβ +2 . Finally we
can identify b, the sensitivity of the spread to an increase in the hard currency debt to export
ratio. Since we know that the percentage depreciation affecting all silver countries is the same
and equal to roughly 15 percent, we have b = 2β /0.15.
V. B. The Data
For the sample employed in the empirical analysis, the average spread is 465 basis
points (standard deviation = 613) and the median spread is 253 basis points.19 The mean
spread is 328 basis points for countries not on the silver standard in our sample prior to
January 29, 1876 (median = 208). For this same period, the mean spread is 802 basis points
for countries on the silver standard (median = 269). After January 29, 1876, the mean spread
for non-silver countries drops to 304 basis points (median = 208) while in silver countries the
Mullainathan (2004) suggest clustering to decrease bias in the standard errors arising from such correlation in the error terms. 19 There are 26 countries or territories in our baseline regression samples: Argentina, Austria, Australia (South Australia), Belgium, Brazil, Canada, Ceylon, Chile, Denmark, Egypt, France, India, Italy, Japan, Mauritius, Netherlands, New Zealand, Peru, Portugal, Russia, South Africa, Spain, Sweden, Turkey, Uruguay, United States. Prussia is included in specifications that use revenues but not included when we use exports because we have been unable to locate such data. We exclude defaulters from the time of default since calculating the yield is problematic when the bond’s duration is unknown.
20
average spread rises to 825 basis points (median = 272).20 Although the summary statistics do
not control for the influence of other factors, silver countries appear to have had an increase
compared to non-silver countries in their average spread after the heightened anticipation of
the suspension of silver coinage by France. It might seem alarming that there is a gap in the
mean spreads between groups. There is little reason to believe this will be a problem for
identification of our key parameter. First, the medians are almost identical. Also, in the
econometrics we first difference the data so as to remove any time-invariant heterogeneity in
levels.
Figures 5 through 8 present time series plots of the natural logarithm of the bond
spread and the natural logarithm of the silver-gold exchange rate (a rise is a depreciation of
silver against gold) for several silver-based countries including Ceylon, India, Mexico, and
Russia.21 The vertical line is the start date for the post-event window---January 29, 1876. Two
things appear evident: (1) the bond spreads move very closely with the gold-silver exchange
rate implying that depreciation raises the bond spreads and (2) the anticipated depreciation
and suspension of silver coinage in France is associated with a sharp increase in bond spreads
and also with a depreciation of close to ten percent between late January and July 1876.
Figures 9a and 9b present the bond spreads for the group of countries which enter our
regression samples. We include a vertical line at January 29, 1876 in the tradition of a typical
“event study.” It is evident that for many silver countries, spreads rise significantly after
January 1876. For non-silver countries, it appears much harder to make a similar case.
V. C. Econometric Evidence
We now attempt to formally test the hypothesis that currency mismatch mattered for
silver countries. Our key control is a dummy variable when a country is on silver and an
20 Mauro, Sussman, and Yafeh (2006) also find structural breaks in the yield spreads for several silver countries in 1876. However, they do not offer an explanation for their empirical finding despite offering explanations for almost all other breaks they located. This is likely because they largely focused on country specific events. 21 We discontinue the Russian spread in 1877 as it became a fiat currency country in that year.
21
interaction variable between silver and the ratio of hard currency government debt
outstanding relative to exports measured in 1876. As noted above, this ratio should be directly
related to the capacity to service debts, which over this short interval of time should be
affected by changes and expected changes in the exchange rate. We discuss the construction
and source of these variables in more depth in the Data Appendix. Since our estimation
sample covers only several months around the event of interest, it should not be a problem
that we assume the key control variables are fixed over this period.
Column 1 of Table 1 presents the baseline specification of the difference in
differences model. The specification includes a dummy equal to one for the 21 weeks
beginning January 29, 1876. High levels of hard currency debt relative to exports are
associated with higher increases in silver countries’ spreads relative to the change in the non-
silver control group. Evaluated at the mean, the increase (in basis points) in the spread for
silver countries after late January 1876 versus other non-silver countries would have been 30
basis points (100*{-0.58 + 0.66*1.34}).22 This accounts for 30 out of the 47 basis point rise
(or 64 percent) in the spread for silver countries versus non-silver countries in the post-event
period. Also, if we take the partial derivative of the yield spread with respect to the ratio of
hard currency debt to exports and the post-event indicator, we see that yield spreads for silver
countries are higher on average by 61 (0.66 - 0.06) basis points. The effect is statistically
significant at the five percent level. As predicted by the theoretical literature, a currency
mismatch makes spreads sensitive to exchange rate depreciation.
We can also recover the structural parameter b, the sensitivity of spreads to the hard
currency debt to exports ratio. Our results in column 1 imply b is equal to roughly 4.4
(0.66/.15) assuming the depreciation between autumn 1875 and July 1876 was on the order of
15 percent. This coefficient also means that a country could expect spreads to increase by
over 200 basis points with a doubling of its debt/export ratio from 0.5 to 1.
22 The silver countries in the regression of column 1 are Austria, Ceylon, Chile, India, Mauritius, Peru, Russia, and Spain. Spain was de jure bimetallic, but by maintaining a mint ratio lower than the market ratio, it exposed itself to a silver influx, a subsequent de facto silver regime and depreciation. Chile shares a similar story.
22
Figure 10 illustrates the marginal impact on spreads for silver countries as a function
of the hard currency debt to export ratio.23 For very small ratios, where the stock of
outstanding debt is less than annual exports, there does not appear to be a statistically
significant impact. Figures 11a and 11b illustrate our finding in the form of scatter plots. The
dependent variable here is the change in the average spread between the two periods and the
explanatory variable is the hard currency debt to exports ratio. Robust standard errors are
used. We leave out outliers like Spain and Argentina as well as Egypt, Turkey and Uruguay
which default in the post-event window. The silver countries have a large positive slope of
0.48 with a standard error of 0.25, t-statistic of 1.91 and a p-value of 0.13. The slope for non-
silver countries is positive (0.01) but small and very imprecisely estimated (standard error =
0.02, t-statistic = 0.5, and p-value = 0.62).
Outliers may be affecting our results since Spain (silver) and Argentina (non-silver)
have large rises in their spreads. This turns out not to be the case. The regressions dropping
the outliers provide the same qualitative finding as the baselines result. Also a median
quantile regression reports a (statistically significant) coefficient and a standard error in
parentheses on the interaction of mismatch, silver and the post-event dummy of 2.17 (0.7) and
the post-event indicator and silver indicator of 0.48 (0.16). The empirical results are also
robust for the marginal effect of the ratio of hard currency debt to exports on yield spreads.
The interaction of the post-event dummy and the hard currency debt export ratio is 0.31
(0.03). Moreover, in column 7 of Table 1, we leave out the obvious outliers in terms of
changes in spreads (Argentina and Spain) from the baseline regression of column 1 Table 1.
This leads to a coefficient on the interaction of mismatch, silver, and the post-event dummy of
0.53 (0.22) and the post-event indicator and silver indicator of -0.5 (0.43). The impact
becomes positive and statistically different from zero at levels of hard currency debt to
exports of 0.95.
23 The marginal coefficient is the partial derivative of the spread with respect first to the post-event window and then with respect to silver. Figure 10 shows the partial derivative of the spread evaluated at the average values of the ratio of hard currency debt to exports for the countries in our sample. The 95 percent confidence bands are estimated with a bootstrap simulation in Stata made available by William Clark at http://homepages.nyu.edu/%7emrg217/interaction.html.
23
Table 2 presents two other specifications. In both columns we separate the
components of the debt sustainability ratios and use them as separate regressors (in millions
of current pounds). Column 1 reveals that the net effect of the depreciation for silver countries
was to raise spreads. Interestingly, the level of hard currency debt has a positive coefficient
while the coefficient on the interaction of exports, post-event dummy and the silver indicator
is negative. Both coefficients are highly statistically significant. This result is consistent with
the possibility that in the short-run the currency mismatch increased debt burdens as the value
of debt relative to exports grew more quickly. In column 2 we see that revenues (interacted
with the post-event dummy and silver) have a negative coefficient but this is not statistically
significant at conventional levels (p-value = 0.28).
Overall, we infer that the depreciation made debt payable in foreign currency more
onerous. This was associated with a jump in the average silver country’s spread relative to the
average non-silver country. On the other hand, a higher export capacity for a given stock of
outstanding debt in that same silver country could have helped offset the relative jump. It
appears that markets perceived that currency mismatches would enhance the risk of an asset
in the midst of a depreciation. We also emphasize that this is evidence that currency mismatch
matters: a significant increase in the ratio of hard currency debt to exports, in conjunction
with a depreciation, could increase perceived default risk, lower investment, and possibly
trigger a financial crisis for an emerging market economy.
V.D. Sensitivity Analysis and Supplementary Findings
Columns 2 through 8 of Table 1 test the robustness of the baseline specification. The
second column increases the length of the pre- and post-event windows, and slightly changes
the event date. The pre-event window now covers the period from January 30, 1875 up to
December 4, 1875. We end the pre-event window in early December when the Economiste
Français first announced that government officials and politicians had renewed the debate
about adopting the gold standard. The post-event window covers the subsequent nine month
24
period up to August 12, 1876. In this specification, the results are almost identical to those in
column 1 although the statistical significance of the key variables is somewhat higher. The
point estimate on the interaction of the post-event dummy, hard currency debt to exports and
the silver dummy comes in at 0.75 in this sample.
In column 3, we also employ longer event windows and include the “world”
unweighted average bond spread (excluding defaulters) pre-multiplied by country-specific
coefficients –in the spirit of the CAPM-- to capture general market movements. Since the
results are almost the same as those from column 2, we cannot seem to attribute the rise in
spreads for hard currency debtors on the silver standard to the interaction of their future
prospects and changing market conditions.
Column 4 uses the average spread in the shorter pre-event window and the average
spread in the post-event window as the dependent variable. Duflo et. al (2002) show that this
is one way to deal with spurious inference arising from serial correlation. This method creates
two observations per country (but only one for Egypt, Peru, Uruguay and Turkey because
these countries defaulted in the post-event window). The point estimates and the marginal
effects are only slightly changed. Columns 5 and 6 replace the hard currency debt to export
ratio with the hard currency debt to revenue ratio. Since revenues probably depend indirectly
on exports, we are not surprised to see that the qualitative inference that a high ratio of hard
currency debt to revenue for silver countries is associated with higher increases in the spread.
Table 3 reports some other robustness checks. In column 1 we take on the idea that
the total debt (i.e., debt payable in domestic currency or with no fixed exchange rate plus gold
clause/hard currency debt) to export ratio matters. This addresses the concern that the results
from Table 1 are found simply because the hard currency to export ratio is highly correlated
(ρ = 0.88) with this more conventional sustainability measure. We do indeed find evidence
that silver countries with higher total debt to export ratios faced higher spreads in early 1876.
However, several reasons suggest that the depreciation itself and its impact on the real
repayment value of outstanding hard currency debt drives this result. First note that the debt
to export ratio includes both hard and local currency debt in the numerator. Moreover, to the
25
extent that the burden of local currency debt should be unaffected in the short run by
exchange rate changes, we would expect the coefficient to be smaller in this case as some
countries with higher proportions of local currency debt are included in the treatment group.
Theoretically they should see much smaller impacts on their spreads, and they do.
In column 2, we test the hypothesis that all countries with high hard currency debt to
export ratios saw an increased spread after January 1876. This is one test of the imposed
assumption that silver countries were differentially impacted by news of silver suspension.
The coefficient on the interaction term (post event dummy x [hard currency debt/exports])
here is very small (0.06) and is not statistically significant at the five or ten percent level of
significance. When all countries are considered in one treatment group, there is no discernible
effect of the French policy change. Column 3 performs a similar exercise but uses the total
debt to revenue ratio as the key control. We observe a similar result; there is no impact on the
spread in the wake of silver coinage suspension by France.
We also address the possibility that our treatment group might be different on a
number of crucial dimensions besides the exchange rate regime from the control group. This
could lead to spurious inference in Table 1. One possible explanation for our results is that the
silver countries in our sample were less developed and had weak institutions that gave rise to
poor fiscal outcomes. However, this is unlikely since there are several countries in the control
group that possessed these characteristics. There are also several countries on the silver
standard that were advanced relative to some of the emerging market countries in the control
group. (e.g., Spain, Chile and India). In column 4 of Table 3, we substitute a “periphery”
dummy for the silver dummy.24 Here we find that there is no additional impact of the hard
currency debt to export ratio on spreads in the periphery in the post-event window. We ran
simulations to produce confidence bands (as above) for the joint coefficient (the post event
24 The periphery includes Argentina, Austria (silver), Brazil, Ceylon (silver), Chile (silver), Colombia, Egypt, India (silver), Italy, Japan, Mauritius (silver), Portugal, Russia (silver), South Africa (Cape of Good Hope), Spain (silver), Turkey, and Uruguay. Norway and Switzerland did not have bonds that actively traded on the London market during this period. This leaves Australia, Belgium, Canada, Denmark, France, Netherlands, New Zealand, Prussia, Sweden and the US as core countries in the control group. The countries in our “core” grouping could also be described as high-income countries.
26
dummy and the periphery coefficient and that same combination interacted with the debt
ratio). We found this is not statistically significant at the 95 percent level over the relevant
range of the data. The currency mismatch problem is absent in the periphery, and it does not
seem convincing to argue silver is simply a proxy for the periphery.
Finally we assessed the validity of our event date by implementing a series of placebo
experiments. The idea here was to see if at other break points spreads would display similar
behavior perhaps because of pre-existing trends. We changed the breakpoint date sequentially
throughout 1875 and then arrived at an empirical distribution of the marginal effect. We used
this to conduct a two-tailed test of the null hypothesis that the effect found using the “true”
break point is zero at the 95 percent level of confidence.25 If our estimate of the marginal
impact of the hard currency debt ratio for silver countries post-event from column 1 Table 1 is
greater than the value in the 97.5th percentile or smaller than the 2.5th percentile we can reject
the null hypothesis.
We conducted these 48 placebo experiments corresponding to a “false” break point in
each of the weeks prior to December 12, 1875. We then interacted these pseudo-event dates
with the given hard currency debt ratios and the regimes from 1875 and re-ran the
specification from column 1 of Table 1. We then found the relevant percentiles in the
empirical distribution of the marginal effect to test to see if we find a similar pattern.
Evaluated at the means, the placebo impact in the 97.5th percentile was only 7 basis points
while in the actual sample the point estimate of the marginal effect was 30 basis points. This
is even more evidence that the moment in time we isolate as giving rise to expectations of
silver depreciation had a substantive impact because of its effects on the expected evolution
of the gold price of silver.26
VI. Discussion and the Growth Impact of Currency Risk
25 The assumption is that there will be no systematic impact on spreads in a series of draws on dates when there is little information entering into asset markets about silver’s value. 26 To test the sensitivity to the assumed break point, we also eliminated the last month of the pre-event window and the first month of the post-event window. Results are nearly identical to those in column 1 of Table 1.
27
Our results seem to have shown that silver countries experienced a differential rise in
spreads from the moment that continued sizeable depreciation became more likely. There is a
question of whether the impact we have found is a long-term impact or short-run impact. It is
almost surely a short to medium term impact at most. Risk premia are partially determined by
predictions about the future course of policies and events. All else equal, markets must have
expected a medium term improvement in the balance sheet of silver countries. As exports
expanded, the ability to service debt and revenue bases would have surely expanded. This
could occur either with the expansion of national income or as revenue tariffs increased in
step with imports. A stronger export position also could have increased the availability of
hard currency that could help pay for previous debts incurred. Many silver countries also
managed to adopt the gold standard around the first decade of the twentieth century.
Nevertheless many countries persistently ran loose monetary policies or clung to silver for a
number of years. This could have led to a persistent increase in the risk premium such as that
we have identified.
The natural question is whether the impact we have found is economically
substantive. We have seen that a one time unexpected nominal depreciation led to a roughly
30 basis points increase in borrowing spreads. Such an increase, if translated into the cost of
capital, could have generated a substantial gap in income per capita because of slower capital
accumulation. Assume that a default premium of 30 basis points was equivalent to a 10
percent increase from a baseline yield of three percent (slightly lower than the median silver
yield so as to bias our results down to a lower bound) and that it persisted. A simple
neoclassical growth model suggests it could have led to a long-run gap in output per capita
between the average silver country and the average non-silver country of between two to four
percent. To see this, assume the equation governing the rate of growth of the capital stock in a
standard Solow growth model depends inversely on the rental price of capital relative to the
price of output so that

28
δ−=∆rK
sYK
Y and K are the levels of output and the accumulated capital stock, δ is the rate of depreciation
(assumed to be four percent), s is the savings rate (assumed to be 17.5 percent) and r is the
rental price of capital relative to the price of output. Assume also a standard Cobb-Douglas
production function for output αα −= 1LAKY where L is the labor force and α is 0.3. Also
assume that A, the effectiveness of labor or multi-factor productivity grows at one percent per
year.
The assumed impact of the change in the borrowing costs is to raise r by ten percent
relative to its pre-event value and thus to slow the accumulation of capital.27 Hence we
assume an initial rental price of one and increase it by ten percent so as to lower the effective
saving rate to 15.9 percent. This shock leads to a gap in income per worker relative to what it
would have been of two percent after 15 years and four percent in the long run. There is of
course no long-run impact on growth rates of output per worker. But in the first year, the
model suggests the growth rate of output per worker would be 20 percent lower than
otherwise and ten percent lower ten years after the shock. Simple averages taken from
aggregate data suggest that income per capita in all gold standard countries grew at 1.5
percent per year while non-gold countries grew at one percent per year between 1880 and
1913. While these comparison groups only roughly overlap with our silver and non-silver
groups this impact could explain roughly one-half to one-third of the observed growth gap in
the period.28
VII. Conclusions
27 30 basis points is more than 10 percent at the median and much less than that for the mean. We are interested in a broader extrapolation/policy lesson and so are thinking in terms of the effect of a surprise depreciation for any country regardless of its regime. For most countries at the time spreads on average are in the range of 200 to 300 basis points. 28 Over 70 percent of the observations in the control group are gold-based. Also, a micro-founded Ramsey growth model based on the specification found in Jeanne and Gourinchas (forthcoming) provides a slightly different result. We assume a persistent risk premium after the shock equivalent to an increase in the baseline rate of depreciation (0.06) of 0.003. This leads to a permanently lower capital stock per effective worker which would lower output per effective worker in the steady state by a little over one percent.
29
This paper examines the impact of currency mismatch. The question is: does a real
exchange rate depreciation increase default risk by reducing the perceived ability of a country
to repay foreign currency debts denominated in a foreign currency? Or does a real exchange
rate depreciation reduce default risk by stimulating an export boom that improves a country’s
asset position? Under normal circumstances, this is a very difficult question to address given
the endogenous properties of the exchange rate. However, history offers some insight into this
question. France’s decision to permanently abandon a bimetallic standard and adopt the gold
standard in the 1870s led to a large decrease in the demand for silver as the country fully
suspended its substantial purchases of the precious metal. In anticipation of the demise of
bimetallism, the world gold price of silver fell by an historically unprecedented ten to fifteen
percent in the first half of 1876. While the decision to abandon a bimetallic standard and
adopt gold may have been endogenous for France, it was an exogenous decision from the
viewpoint of countries and policymakers on the periphery.
The exogenous nature of the French suspension of silver coinage allows us to identify
the impact of an exchange rate depreciation on default risk using a standard before and after
analysis. We introduce a new methodology, a difference-in-differences approach, to identify
the effect of the exogenous exchange rate depreciation on sovereign country risk. The
empirical methodology could also be applied to other events in international finance where
there is an identifiable exogenous shock that differentially affects countries in the global
economy. Our particular episode has the added advantage that many macroeconomic
variables were probably quite stable during the event study given that the estimation period
only covers a few months.
We find that the impact of France’s policy change worked by increasing hard
currency debt exposure. In our sample, the anticipation of the suspension of free silver
coinage by France seems to have increased the debt burden of the average silver country
through exchange rate depreciation. Nevertheless, in the medium to long-run, the depreciation
of silver in world markets helped spur an export boom for silver standard countries in the

30
periphery, improving somewhat their ability to repay the foreign debts denominated in foreign
currency. The impact of the boom also depended on a country’s export capacity relative to
debt repayments. The increase in real debt repayments and default risk would have been
greatest for the most isolated and inwardly oriented silver economies.
We have examined an important public policy question by looking at the relationship
between default risk and exchange rate depreciation from one of the most important
disruptions to the international monetary system in the last 150 years. We find that openness
to international trade is one possible way to limit the negative impact of depreciation in a
world of currency mismatch. Our results suggest that if LDCs are going to embrace
international capital flows tainted by hard currency contractual terms, then they should also
do so in proportion to their export potential.
31
Data Appendix
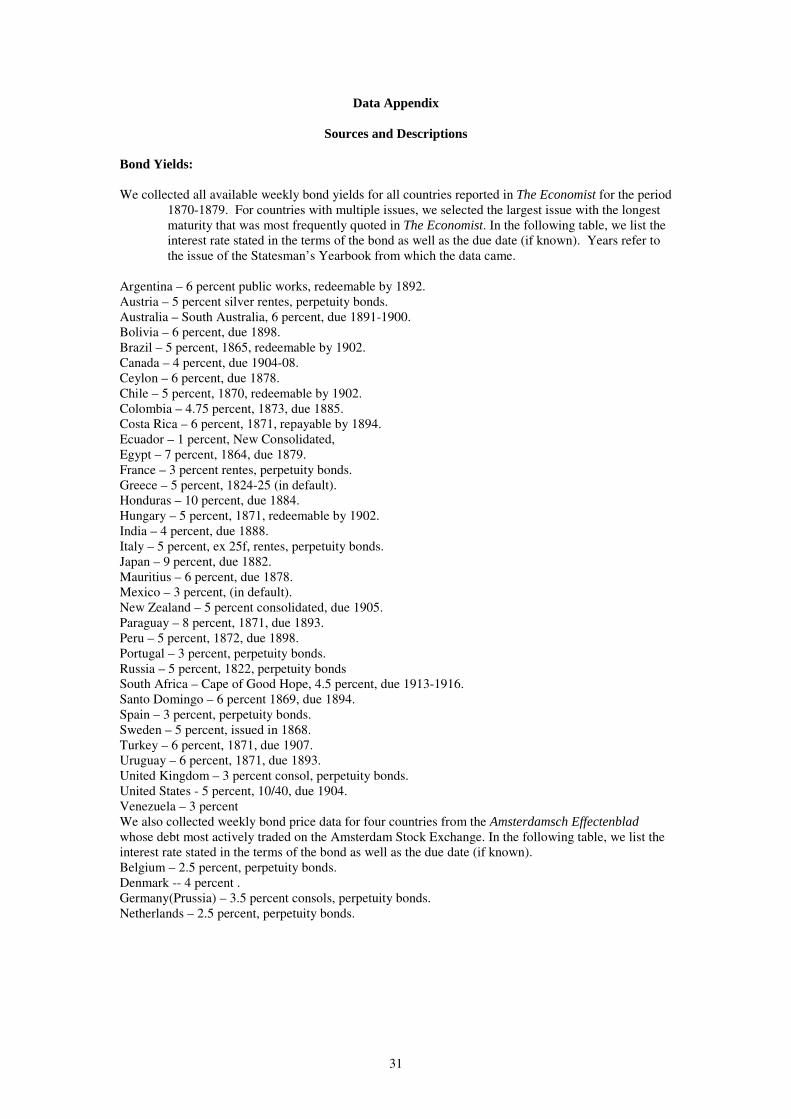
Sources and Descriptions Bond Yields: We collected all available weekly bond yields for all countries reported in The Economist for the period
1870-1879. For countries with multiple issues, we selected the largest issue with the longest maturity that was most frequently quoted in The Economist. In the following table, we list the interest rate stated in the terms of the bond as well as the due date (if known). Years refer to the issue of the Statesman’s Yearbook from which the data came.
Argentina – 6 percent public works, redeemable by 1892. Austria – 5 percent silver rentes, perpetuity bonds. Australia – South Australia, 6 percent, due 1891-1900. Bolivia – 6 percent, due 1898. Brazil – 5 percent, 1865, redeemable by 1902. Canada – 4 percent, due 1904-08. Ceylon – 6 percent, due 1878. Chile – 5 percent, 1870, redeemable by 1902. Colombia – 4.75 percent, 1873, due 1885. Costa Rica – 6 percent, 1871, repayable by 1894. Ecuador – 1 percent, New Consolidated, Egypt – 7 percent, 1864, due 1879. France – 3 percent rentes, perpetuity bonds. Greece – 5 percent, 1824-25 (in default). Honduras – 10 percent, due 1884. Hungary – 5 percent, 1871, redeemable by 1902. India – 4 percent, due 1888. Italy – 5 percent, ex 25f, rentes, perpetuity bonds. Japan – 9 percent, due 1882. Mauritius – 6 percent, due 1878. Mexico – 3 percent, (in default). New Zealand – 5 percent consolidated, due 1905. Paraguay – 8 percent, 1871, due 1893. Peru – 5 percent, 1872, due 1898. Portugal – 3 percent, perpetuity bonds. Russia – 5 percent, 1822, perpetuity bonds South Africa – Cape of Good Hope, 4.5 percent, due 1913-1916. Santo Domingo – 6 percent 1869, due 1894. Spain – 3 percent, perpetuity bonds. Sweden – 5 percent, issued in 1868. Turkey – 6 percent, 1871, due 1907. Uruguay – 6 percent, 1871, due 1893. United Kingdom – 3 percent consol, perpetuity bonds. United States - 5 percent, 10/40, due 1904. Venezuela – 3 percent We also collected weekly bond price data for four countries from the Amsterdamsch Effectenblad whose debt most actively traded on the Amsterdam Stock Exchange. In the following table, we list the interest rate stated in the terms of the bond as well as the due date (if known). Belgium – 2.5 percent, perpetuity bonds. Denmark -- 4 percent . Germany(Prussia) – 3.5 percent consols, perpetuity bonds. Netherlands – 2.5 percent, perpetuity bonds.
32
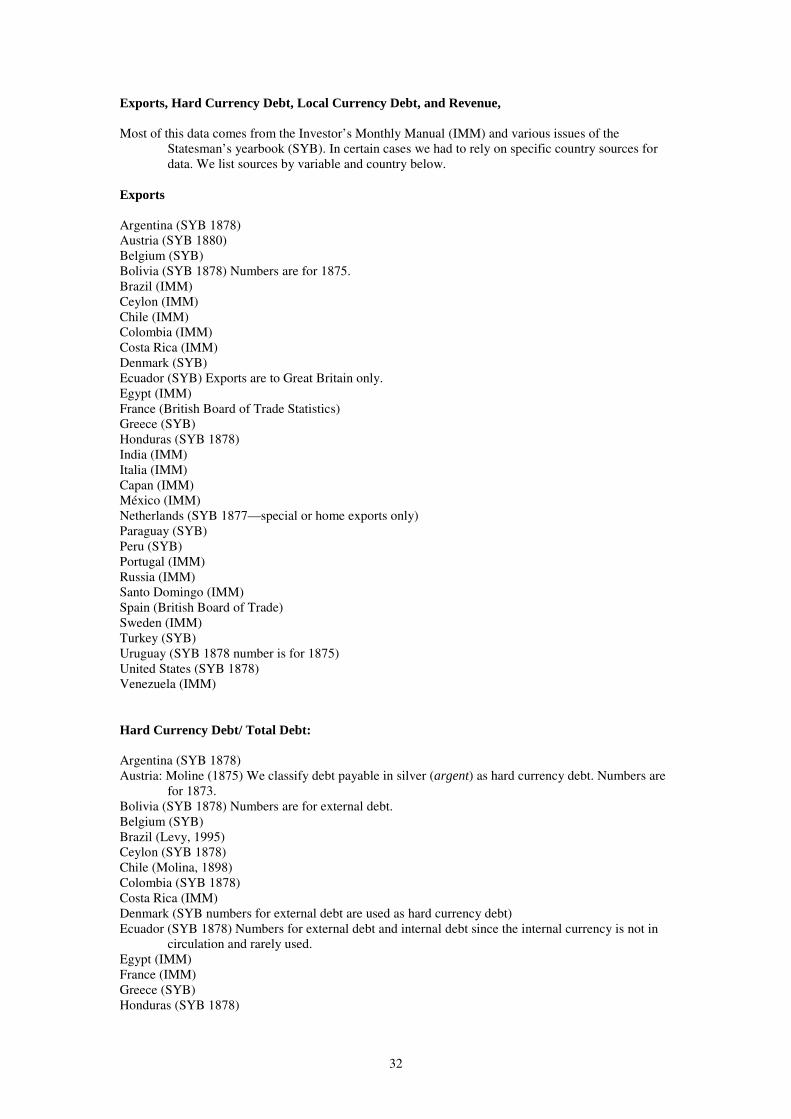
Exports, Hard Currency Debt, Local Currency Debt, and Revenue, Most of this data comes from the Investor’s Monthly Manual (IMM) and various issues of the
Statesman’s yearbook (SYB). In certain cases we had to rely on specific country sources for data. We list sources by variable and country below.
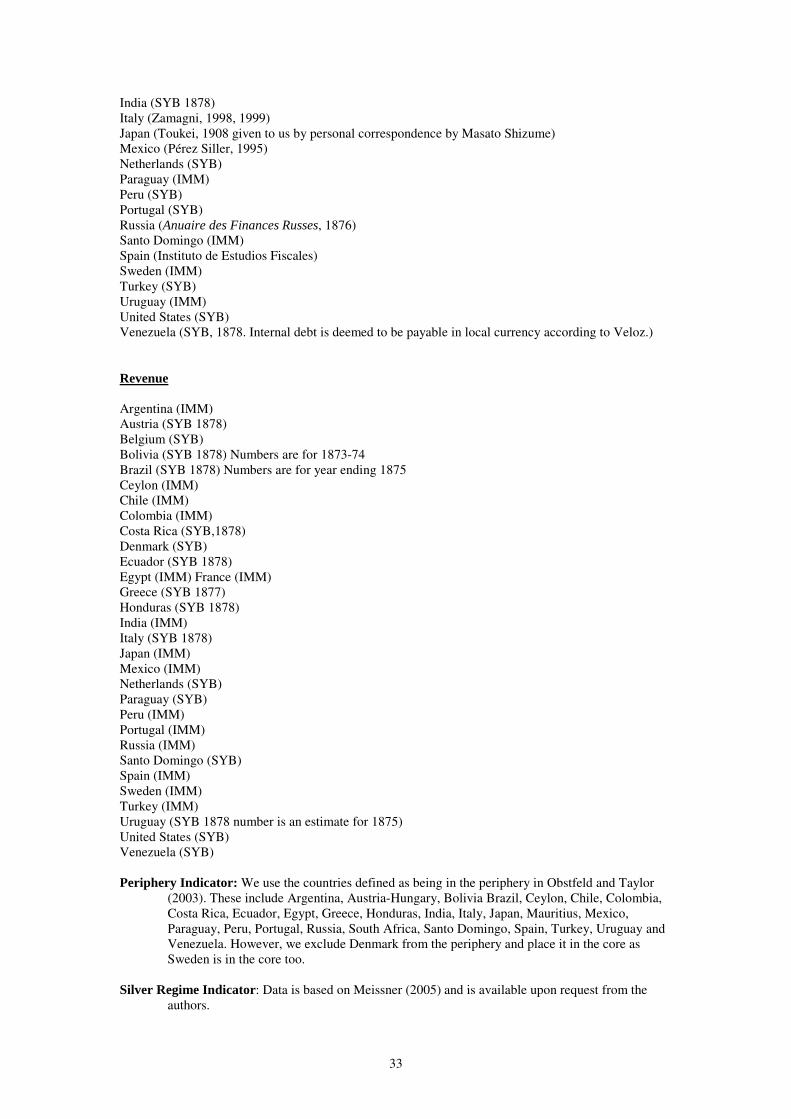
Exports Argentina (SYB 1878) Austria (SYB 1880) Belgium (SYB) Bolivia (SYB 1878) Numbers are for 1875. Brazil (IMM) Ceylon (IMM) Chile (IMM) Colombia (IMM) Costa Rica (IMM) Denmark (SYB) Ecuador (SYB) Exports are to Great Britain only. Egypt (IMM) France (British Board of Trade Statistics) Greece (SYB) Honduras (SYB 1878) India (IMM) Italia (IMM) Capan (IMM) México (IMM) Netherlands (SYB 1877—special or home exports only) Paraguay (SYB) Peru (SYB) Portugal (IMM) Russia (IMM) Santo Domingo (IMM) Spain (British Board of Trade) Sweden (IMM) Turkey (SYB) Uruguay (SYB 1878 number is for 1875) United States (SYB 1878) Venezuela (IMM) Hard Currency Debt/ Total Debt: Argentina (SYB 1878) Austria: Moline (1875) We classify debt payable in silver (argent) as hard currency debt. Numbers are
for 1873. Bolivia (SYB 1878) Numbers are for external debt. Belgium (SYB) Brazil (Levy, 1995) Ceylon (SYB 1878) Chile (Molina, 1898) Colombia (SYB 1878) Costa Rica (IMM) Denmark (SYB numbers for external debt are used as hard currency debt) Ecuador (SYB 1878) Numbers for external debt and internal debt since the internal currency is not in
circulation and rarely used. Egypt (IMM) France (IMM) Greece (SYB) Honduras (SYB 1878)
33
India (SYB 1878) Italy (Zamagni, 1998, 1999) Japan (Toukei, 1908 given to us by personal correspondence by Masato Shizume) Mexico (Pérez Siller, 1995) Netherlands (SYB) Paraguay (IMM) Peru (SYB) Portugal (SYB) Russia (Anuaire des Finances Russes, 1876) Santo Domingo (IMM) Spain (Instituto de Estudios Fiscales) Sweden (IMM) Turkey (SYB) Uruguay (IMM) United States (SYB) Venezuela (SYB, 1878. Internal debt is deemed to be payable in local currency according to Veloz.) Revenue Argentina (IMM) Austria (SYB 1878) Belgium (SYB) Bolivia (SYB 1878) Numbers are for 1873-74 Brazil (SYB 1878) Numbers are for year ending 1875 Ceylon (IMM) Chile (IMM) Colombia (IMM) Costa Rica (SYB,1878) Denmark (SYB) Ecuador (SYB 1878) Egypt (IMM) France (IMM) Greece (SYB 1877) Honduras (SYB 1878) India (IMM) Italy (SYB 1878) Japan (IMM) Mexico (IMM) Netherlands (SYB) Paraguay (SYB) Peru (IMM) Portugal (IMM) Russia (IMM) Santo Domingo (SYB) Spain (IMM) Sweden (IMM) Turkey (IMM) Uruguay (SYB 1878 number is an estimate for 1875) United States (SYB) Venezuela (SYB) Periphery Indicator: We use the countries defined as being in the periphery in Obstfeld and Taylor
(2003). These include Argentina, Austria-Hungary, Bolivia Brazil, Ceylon, Chile, Colombia, Costa Rica, Ecuador, Egypt, Greece, Honduras, India, Italy, Japan, Mauritius, Mexico, Paraguay, Peru, Portugal, Russia, South Africa, Santo Domingo, Spain, Turkey, Uruguay and Venezuela. However, we exclude Denmark from the periphery and place it in the core as Sweden is in the core too.
Silver Regime Indicator: Data is based on Meissner (2005) and is available upon request from the
authors.
34
References Anuaire des Finances Russes: budget, crédit, commerce, chemins de fer. 1876. Trenké et
Fusnot: St. Petersbourg. Bernanke, Ben and Mark Gertler (1989) “Agency Costs, Net Worth and Business
Fluctuations.” American Economic Review March 1989, 79 (1), pp. 14-31. Bertrand, Marianne, Esther Duflo, and Sendhil Mullainathan. (2004). “How Much Should We
Trust Differences-in-Differences Estimates?” Quarterly Journal of Economics vol. 119 (1) pp. 249-275.
Bleakley, Hoyt and Kevin Cowan (2002), “Corporate Dollar Debt and Devaluations: Much
Ado About Nothing? Mimeo, UCSD. Bordo, Michael, Christopher M. Meissner, and Angela Redish (2005), “ How ‘Original Sin’
was Overcome: The Evolution of External Debt Denominated in Domestic Currencies in the United States and British Dominions 1800-2000,” in Barry Eichengreen and Ricardo Hausman (eds.) Other People’s Money: Debt Denomination and Financial Instability in Emerging Market Economies. Chicago: University of Chicago Press.
Bordo, Michael and Christopher M. Meissner (forthcoming), “The Role of Hard Currency in
Financial Crises: 1880-1913 vs. 1972-1997”Journal of Banking and Finance. Bordo, Michael and Hugh Rockoff (1996) “The Gold Standard as a Good Housekeeping Seal
of Approval” Journal of Economic History vol. 56 pp. 389-428. Céspedes, Luis Felipe, Roberto Chang, and Andres Velasco (2004). “Balance Sheets and
Exchange Rate Policy.”American Economic Review 94 (4) pp. 1183-1193. DeLong, J. Bradford, (1998) "Trade Policy and America's Standard of Living: An Historical
Perspective," in Susan Collins, ed., Trade and the American Worker. Washington, DC, Brookings Institution.
Eichengreen, Barry (1996) Globalizing Capital: A History of the International Monetary
System. Princeton, Princeton University Press. Eichengreen, Barry and Ricardo Hausmann (1999), “Exchange Rates and Financial Fragility”
Federal Reserve Bank of Kansas City. New Challenges for Monetary Policy. pp. 329-368.
Eichengreen, Barry and Ricardo Hausmann (2002), “How to Eliminate Original Financial Sin,” Financial Times Editorial, November 22.
Eichengreen, Barry, Ricardo Hausmann and Ugo Panizza (2003) “Currency Mismatches, Debt Intolerance, and Original Sin: Why they are not the Same and Why it Matters.” NBER Working Paper #10036.
Eichengreen, Barry, Ricardo Hausmann and Ugo Panizza (2005), “The Pain of Original Sin,”
in Barry Eichengreen and Ricardo Hausmann (eds.), Other People’s Money. Chicago: University of Chicago Press

35
Estevadeordal, A, B. Frantz and A.M. Taylor (2003) “The Rise and |Fall of World Trade,
1870-1939” Quarterly Journal of Economics. Vol. 2 (1) pp. 359-407. Flandreau, Marc (1996). “The French Crime of 1873: An Essay in the Emergence of the
International Gold Standard.” Journal of Economic History vol. 56 (4) pp. 862-97. Flandreau, Marc and Mathilde Maurel (2001). “Monetary Union, Trade Integration, and
Business Cycles in 19th Century Europe: Just Do It.” CEPR Discussion Paper #3087. Flandreau, Marc and John Komlos (2002) “Core of Periphery? The Credibility of the Austro-
Hungarian Currency, 1867-1913,” mimeo. University of Munich.
Flandreau, Marc and Nathan Sussman (2004) “Old Sins: Exchange Clauses and European
Foreign Lending in the 19th Century” in Barry Eichengreen and Ricardo Hausman (eds.), Other People’s Money: Debt Denomination and Financial Instability in Emerging Market Economies. Chicago: Chicago University Press.
Flandreau, Marc and F. Zúmer (2004). The Making of Global Finance. Paris: OECD. Data
from http://www.eh.net/databases/finance/ Frankel, Jeffrey and Andrew K. Rose (1995). “An Empirical Characterization of Nominal
Exchange Rates.” in Gene Grossman and Kenneth Rogoff (eds.), Handbook of International Economics vol. III. Amsterdam: North-Holland.
Frieden, Jeffrey A. (1993) "The Dynamics of International Monetary Systems: International
and Domestic Factors in the Rise, Reign, and Demise of the Classical Gold Standard." in Coping with Complexity in the International System, edited by Jack Snyder and Robert Jervis. Westview: Westview Press.
Friedman, Milton (1990a). “Bimetallism Revisited.” Journal of Economic Perspectives vol. 4
(4) pp. 85-104. Friedman, Milton (1990b). “The Crime of 1873.” Journal of Political Economy vol. 98 (6) pp.
1159-94. Gallarotti, Giulio M. (1994). “The Scramble for Gold: Monetary Regime Transformation in
the 1870s.” in Michael Bordo and Forrest Capie eds. Monetary Regimes in Transition. Cambridge: Cambridge University Press.
Gallarotti, Giulio M. (1995) The Anatomy of an International Monetary Regime New York:
Oxford University Press. Goldstein, Morris and Philip Turner (2004), “Controlling Currency Mismatches in
Emerging Market Economies.” Washington: Institute of International Economics. Instituto de Estudios Fiscales (Spain) Datos básicos para la historia financiera de Espana
(1850- 1975) Volúmen 2: La deuda pública / Valentín Fernández Acha Madrid: Instituto de estudios fiscales.
Jeanne, Olivier and Pierre-Olivier Gourinchas (forthcoming) “The Elusive Gains from
International Financial Integration” Review of Economic Studies.
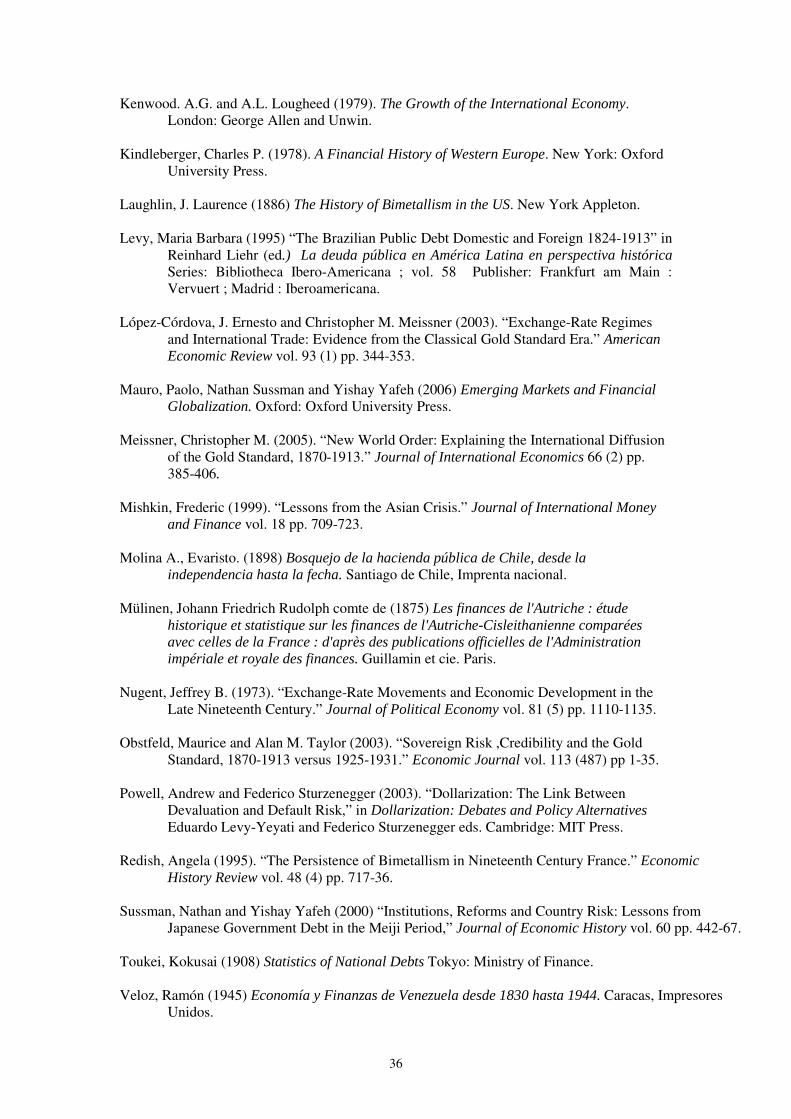
36
Kenwood. A.G. and A.L. Lougheed (1979). The Growth of the International Economy. London: George Allen and Unwin.
Kindleberger, Charles P. (1978). A Financial History of Western Europe. New York: Oxford
University Press. Laughlin, J. Laurence (1886) The History of Bimetallism in the US. New York Appleton. Levy, Maria Barbara (1995) “The Brazilian Public Debt Domestic and Foreign 1824-1913” in
Reinhard Liehr (ed.) La deuda pública en América Latina en perspectiva histórica Series: Bibliotheca Ibero-Americana ; vol. 58 Publisher: Frankfurt am Main : Vervuert ; Madrid : Iberoamericana.
López-Córdova, J. Ernesto and Christopher M. Meissner (2003). “Exchange-Rate Regimes
and International Trade: Evidence from the Classical Gold Standard Era.” American Economic Review vol. 93 (1) pp. 344-353.
Mauro, Paolo, Nathan Sussman and Yishay Yafeh (2006) Emerging Markets and Financial
Globalization. Oxford: Oxford University Press. Meissner, Christopher M. (2005). “New World Order: Explaining the International Diffusion
of the Gold Standard, 1870-1913.” Journal of International Economics 66 (2) pp. 385-406.
Mishkin, Frederic (1999). “Lessons from the Asian Crisis.” Journal of International Money
and Finance vol. 18 pp. 709-723. Molina A., Evaristo. (1898) Bosquejo de la hacienda pública de Chile, desde la
independencia hasta la fecha. Santiago de Chile, Imprenta nacional. Mülinen, Johann Friedrich Rudolph comte de (1875) Les finances de l'Autriche : étude
historique et statistique sur les finances de l'Autriche-Cisleithanienne comparées avec celles de la France : d'après des publications officielles de l'Administration impériale et royale des finances. Guillamin et cie. Paris.
Nugent, Jeffrey B. (1973). “Exchange-Rate Movements and Economic Development in the
Late Nineteenth Century.” Journal of Political Economy vol. 81 (5) pp. 1110-1135. Obstfeld, Maurice and Alan M. Taylor (2003). “Sovereign Risk ,Credibility and the Gold
Standard, 1870-1913 versus 1925-1931.” Economic Journal vol. 113 (487) pp 1-35. Powell, Andrew and Federico Sturzenegger (2003). “Dollarization: The Link Between
Devaluation and Default Risk,” in Dollarization: Debates and Policy Alternatives Eduardo Levy-Yeyati and Federico Sturzenegger eds. Cambridge: MIT Press.
Redish, Angela (1995). “The Persistence of Bimetallism in Nineteenth Century France.” Economic
History Review vol. 48 (4) pp. 717-36. Sussman, Nathan and Yishay Yafeh (2000) “Institutions, Reforms and Country Risk: Lessons from
Japanese Government Debt in the Meiji Period,” Journal of Economic History vol. 60 pp. 442-67. Toukei, Kokusai (1908) Statistics of National Debts Tokyo: Ministry of Finance. Veloz, Ramón (1945) Economía y Finanzas de Venezuela desde 1830 hasta 1944. Caracas, Impresores
Unidos.
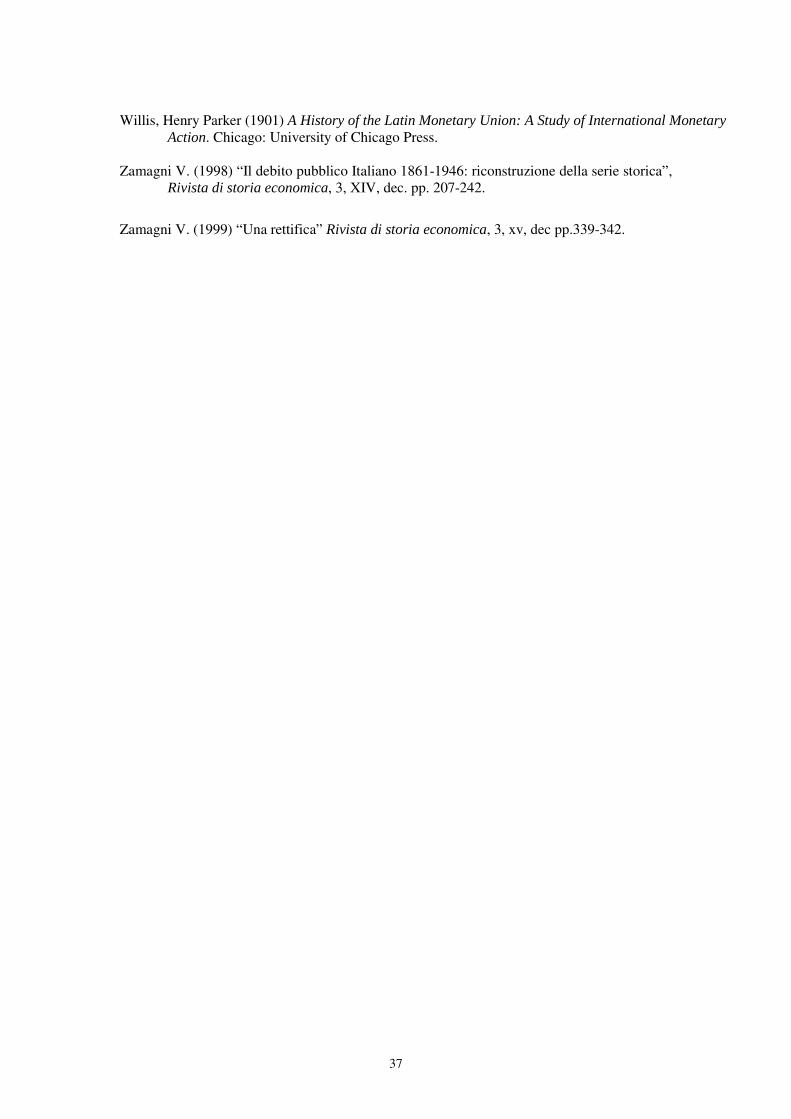
37
Willis, Henry Parker (1901) A History of the Latin Monetary Union: A Study of International Monetary
Action. Chicago: University of Chicago Press. Zamagni V. (1998) “Il debito pubblico Italiano 1861-1946: riconstruzione della serie storica”,
Rivista di storia economica, 3, XIV, dec. pp. 207-242.
Zamagni V. (1999) “Una rettifica” Rivista di storia economica, 3, xv, dec pp.339-342.
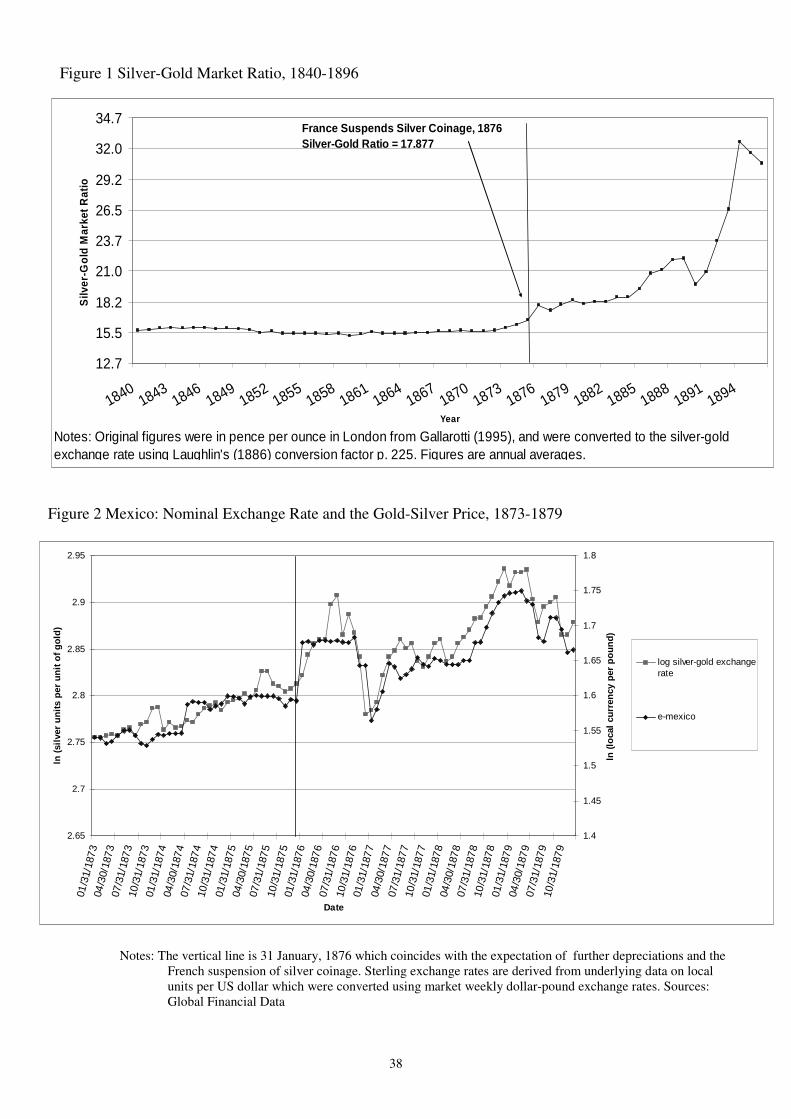
38
Figure 1 Silver-Gold Market Ratio, 1840-1896
Figure 2 Mexico: Nominal Exchange Rate and the Gold-Silver Price, 1873-1879 Notes: The vertical line is 31 January, 1876 which coincides with the expectation of further depreciations and the
French suspension of silver coinage. Sterling exchange rates are derived from underlying data on local units per US dollar which were converted using market weekly dollar-pound exchange rates. Sources: Global Financial Data
12.7
15.5
18.2
21.0
23.7
26.5
29.2
32.0
34.7
18401843
18461849
18521855
18581861
18641867
18701873
18761879
18821885
18881891
1894
Year
Silv
er-G
old
Mar
ket
Rat
io
Notes: Original figures were in pence per ounce in London from Gallarotti (1995), and were converted to the silver-gold exchange rate using Laughlin's (1886) conversion factor p. 225. Figures are annual averages.
France Suspends Silver Coinage, 1876 Silver-Gold Ratio = 17.877
2.65
2.7
2.75
2.8
2.85
2.9
2.95
01/3
1/18
73
04/3
0/18
73
07/3
1/18
73
10/3
1/18
73
01/3
1/18
74
04/3
0/18
74
07/3
1/18
74
10/3
1/18
74
01/3
1/18
75
04/3
0/18
75
07/3
1/18
75
10/3
1/18
75
01/3
1/18
76
04/3
0/18
76
07/3
1/18
76
10/3
1/18
76
01/3
1/18
77
04/3
0/18
77
07/3
1/18
77
10/3
1/18
77
01/3
1/18
78
04/3
0/18
78
07/3
1/18
78
10/3
1/18
78
01/3
1/18
79
04/3
0/18
79
07/3
1/18
79
10/3
1/18
79
Date
ln (
silv
er u
nit
s p
er u
nit
of
go
ld)
1.4
1.45
1.5
1.55
1.6
1.65
1.7
1.75
1.8
ln (
loca
l cu
rren
cy p
er p
ou
nd
)
log silver-gold exchangerate
e-mexico

39
Figure 3 India: Exchange Rate and the Gold-Silver Price, 1873-1879 Notes: See notes to previous figure
Figure 4 Spain: Nominal Exchange Rate and the Gold-Silver Price, 1873-1879 Notes: See notes to previous figure
2.65
2.7
2.75
2.8
2.85
2.9
2.95
01/3
1/18
7304
/30/
1873
07/3
1/18
7310
/31/
1873
01/3
1/18
7404
/30/
1874
07/3
1/18
7410
/31/
1874
01/3
1/18
7504
/30/
1875
07/3
1/18
7510
/31/
1875
01/3
1/18
7604
/30/
1876
07/3
1/18
7610
/31/
1876
01/3
1/18
7704
/30/
1877
07/3
1/18
7710
/31/
1877
01/3
1/18
7804
/30/
1878
07/3
1/18
7810
/31/
1878
01/3
1/18
7904
/30/
1879
07/3
1/18
7910
/31/
1879
Date
ln (
silv
er u
nit
s p
er u
nit
of
go
ld)
2.2
2.25
2.3
2.35
2.4
2.45
2.5
2.55
2.6
ln (
loca
l cu
rren
cy p
er p
ou
nd
)
log silver-gold exchangerate
e-India
2.65
2.7
2.75
2.8
2.85
2.9
2.95
01/3
1/18
7304
/30/
1873
07/3
1/18
7310
/31/
1873
01/3
1/18
7404
/30/
1874
07/3
1/18
7410
/31/
1874
01/3
1/18
7504
/30/
1875
07/3
1/18
7510
/31/
1875
01/3
1/18
7604
/30/
1876
07/3
1/18
7610
/31/
1876
01/3
1/18
7704
/30/
1877
07/3
1/18
7710
/31/
1877
01/3
1/18
7804
/30/
1878
07/3
1/18
7810
/31/
1878
01/3
1/18
7904
/30/
1879
07/3
1/18
7910
/31/
1879
Date
ln (
silv
er u
nit
s p
er u
nit
of
go
ld)
1.45
1.5
1.55
1.6
1.65
1.7
1.75
1.8
1.85
1.9
ln (
loca
l cu
rren
cy p
er p
ou
nd
)
log silver gold exchangerate
e-Spain
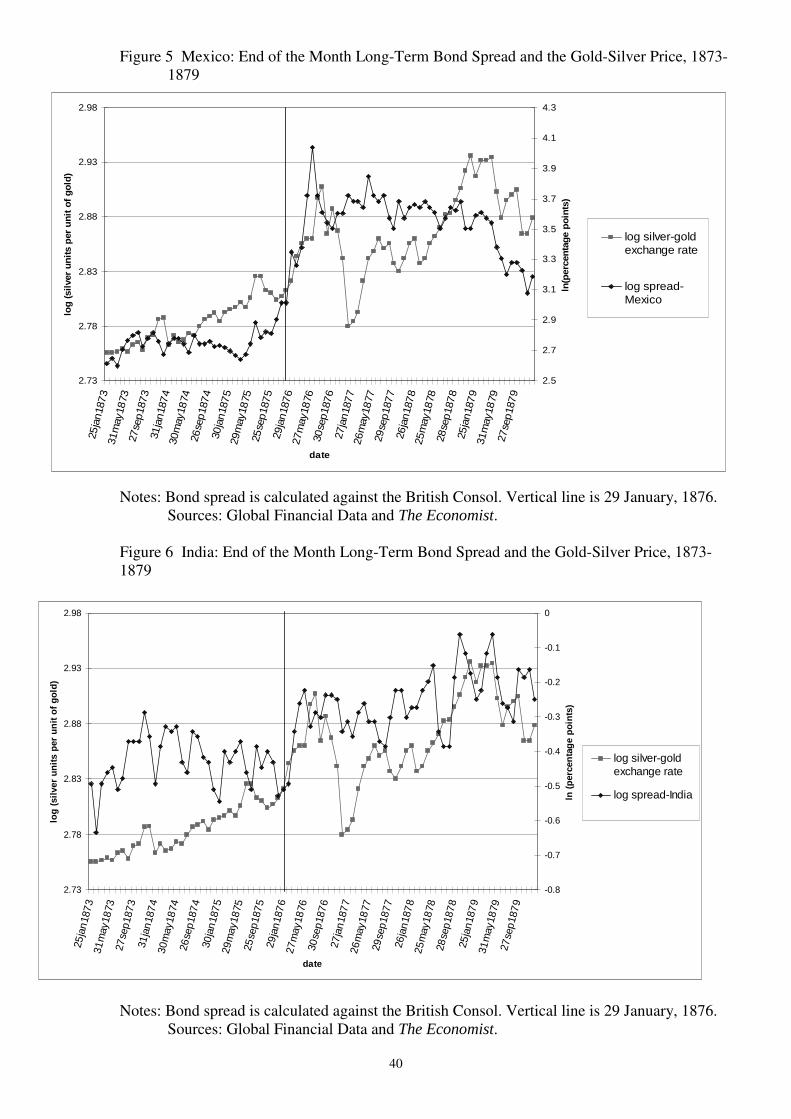
40
Figure 5 Mexico: End of the Month Long-Term Bond Spread and the Gold-Silver Price, 1873-1879
Notes: Bond spread is calculated against the British Consol. Vertical line is 29 January, 1876.
Sources: Global Financial Data and The Economist. Figure 6 India: End of the Month Long-Term Bond Spread and the Gold-Silver Price, 1873-1879 Notes: Bond spread is calculated against the British Consol. Vertical line is 29 January, 1876.
Sources: Global Financial Data and The Economist.
2.73
2.78
2.83
2.88
2.93
2.98
25ja
n18
73
31m
ay18
7327
sep
187
331
jan
187
430
may
1874
26se
p18
74
30ja
n18
75
29m
ay18
7525
sep
187
529
jan
187
627
may
1876
30se
p18
76
27ja
n18
77
26m
ay18
7729
sep
187
726
jan
187
825
may
1878
28se
p18
78
25ja
n18
79
31m
ay18
7927
sep
187
9
date
log
(si
lver
un
its
per
un
it o
f g
old
)
2.5
2.7
2.9
3.1
3.3
3.5
3.7
3.9
4.1
4.3
ln(p
erce
nta
ge
po
ints
)
log silver-goldexchange rate
log spread-Mexico
2.73
2.78
2.83
2.88
2.93
2.98
25ja
n18
73
31m
ay18
7327
sep1
873
31ja
n18
74
30m
ay18
7426
sep1
874
30ja
n18
75
29m
ay18
7525
sep1
875
29ja
n18
76
27m
ay18
7630
sep1
876
27ja
n18
77
26m
ay18
7729
sep1
877
26ja
n18
78
25m
ay18
7828
sep1
878
25ja
n18
79
31m
ay18
7927
sep1
879
date
log
(si
lver
un
its
per
un
it o
f g
old
)
-0.8
-0.7
-0.6
-0.5
-0.4
-0.3
-0.2
-0.1
0
ln (
per
cen
tag
e p
oin
ts)
log silver-goldexchange rate
log spread-India
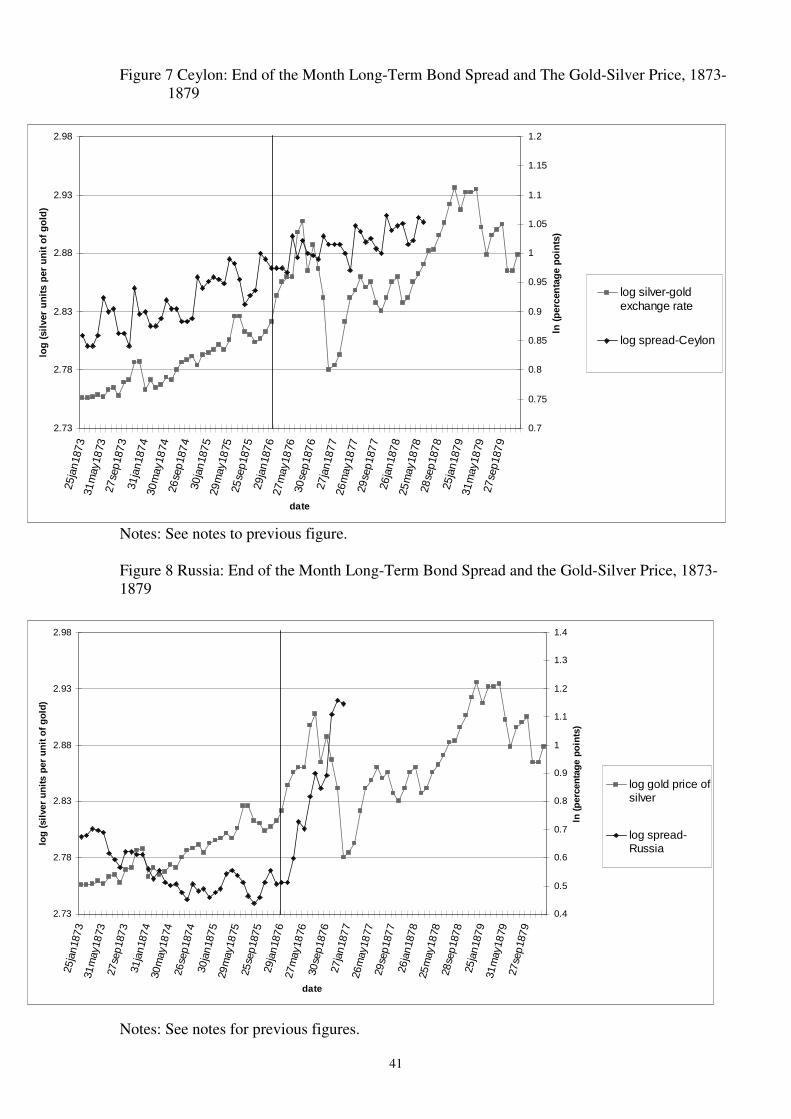
41
Figure 7 Ceylon: End of the Month Long-Term Bond Spread and The Gold-Silver Price, 1873-
1879 Notes: See notes to previous figure. Figure 8 Russia: End of the Month Long-Term Bond Spread and the Gold-Silver Price, 1873-1879 Notes: See notes for previous figures.
2.73
2.78
2.83
2.88
2.93
2.98
25ja
n187
331
may
1873
27se
p187
331
jan1
874
30m
ay18
7426
sep1
874
30ja
n187
529
may
1875
25se
p187
529
jan1
876
27m
ay18
7630
sep1
876
27ja
n187
726
may
1877
29se
p187
726
jan1
878
25m
ay18
7828
sep1
878
25ja
n187
931
may
1879
27se
p187
9date
log
(si
lver
un
its
per
un
it o
f g
old
)
0.7
0.75
0.8
0.85
0.9
0.95
1
1.05
1.1
1.15
1.2
ln (
per
cen
tag
e p
oin
ts)
log silver-goldexchange rate
log spread-Ceylon
2.73
2.78
2.83
2.88
2.93
2.98
25ja
n18
73
31m
ay18
7327
sep
187
331
jan
187
430
may
1874
26se
p18
74
30ja
n18
75
29m
ay18
7525
sep
187
529
jan
187
627
may
1876
30se
p18
76
27ja
n18
77
26m
ay18
7729
sep
187
726
jan
187
825
may
1878
28se
p18
78
25ja
n18
79
31m
ay18
7927
sep
187
9
date
log
(si
lver
un
its
per
un
it o
f g
old
)
0.4
0.5
0.6
0.7
0.8
0.9
1
1.1
1.2
1.3
1.4
ln (
per
cen
tag
e p
oin
ts)
log gold price ofsilver
log spread-Russia

42
Figure 9a Weekly Spreads by Country 2 October, 1875 to 29 July, 1876: Silver Standard Countries. Notes: Vertical lines represent break point for the regressions.
Figure 9b Weekly Spreads by Country 2 October, 1875 to 29 July, 1876: Non-Silver Standard Countries
4
6
2.52.62.72.8
2.53
3.54
.6
.7
.8
2.52.62.72.8
810121416
1.52
2.53
1214161820
2 Oct.
1875
29 Ja
n. 18
76
15 A
pr. 1
876
29 Ju
l. 187
6
2 Oct.
1875
29 Ja
n. 18
76
15 A
pr. 1
876
29 Ju
l. 187
6
2 Oct.
1875
29 Ja
n. 18
76
15 A
pr. 1
876
29 Ju
l. 187
6
Austria Ceylon Chile
India Mauritius Peru
Russia Spain
Sp
rea
d
5
10
15
22.05
2.1
2.15
2.2
1
1.051.1
1.15
1.2
2
2.5
3
1.5
1.6
1.7
1.8
1.05
1.1
1.15
1.2
4
5
6
7
1.2
1.3
1.4
3.6
3.8
4
4.2
5
5.2
5.4
5.6
.75
.8
.85
.9
2.5
2.6
2.7
2.8
2.2
2.4
2.6
2.8
1.2
1.25
1.3
1.35
1.5
1.6
1.7
1.81.9
6
8
1012
14
1.45
1.5
1.551.6
1.65
10
12
14
16
2 Oct
. 187
5
29 Ja
n. 18
76
15 A
pr. 1
876
29 Ju
l. 187
6
2 Oct.
187
5
29 Ja
n. 18
76
15 A
pr. 1
876
29 Ju
l. 187
6
2 Oct.
187
5
29 Ja
n. 18
76
15 A
pr. 1
876
29 Ju
l. 187
6
2 Oct.
1875
29 J
an. 1
876
15 A
pr. 1
876
29 Ju
l. 187
6
2 Oct.
1875
29 J
an. 1
876
15 A
pr. 1
876
29 Ju
l. 187
6
Argentina Austral ia Belgium Brazil Canada
Denmark Egypt France Italy Japan
Netherlands New Zealand Portugal S. Africa Sweden
Turkey United States Uruguay
Sp
read
DateGraphs by Country
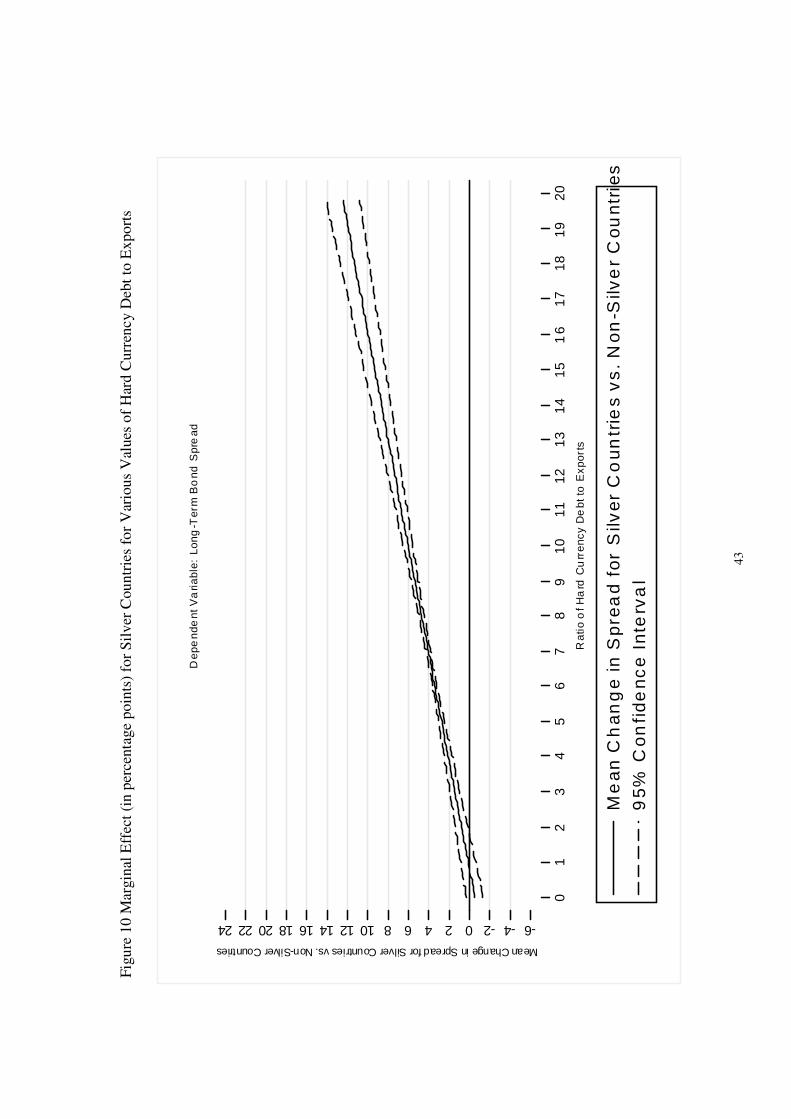
43
Figu
re 1
0 M
argi
nal E
ffec
t (in
per
cent
age
poin
ts)
for
Sil
ver
Cou
ntri
es f
or V
ario
us V
alue
s of
Har
d C
urre
ncy
Deb
t to
Exp
orts
-6-4-2024681012141618202224
Mean Change in Spread for Silver Countries vs. Non-Silver Countries
01
23
45
67
89
1011
1213
1415
16
1718
1920
Ra
tio o
f Ha
rd C
urr
enc
y D
ebt
to E
xpor
ts
Me
an
Ch
an
ge
in
Sp
rea
d f
or
Silv
er
Co
un
trie
s v
s.
No
n-S
ilve
r C
ou
ntr
ies
95
% C
on
fid
en
ce
In
terv
al
D
epe
nde
nt V
aria
ble:
Lon
g-T
erm
Bo
nd S
pre
ad

44
Figu
re 1
1a S
catte
r Pl
ot f
or R
egre
ssio
n of
the
Firs
t Dif
fere
nce
in A
vera
ge S
prea
ds o
n th
e H
ard
Cur
renc
y to
Exp
orts
Rat
io, S
ilve
r C
ount
ries
0.2.4.6.8First Difference in Avg Spread
.2.4
.6.8
1H
ard
Cu
rren
y D
ebt
/Exp
ort
s

45
Figu
re 1
1b S
catte
r Pl
ot f
or R
egre
ssio
n of
the
Firs
t Dif
fere
nce
in A
vera
ge S
prea
ds o
n th
e H
ard
Cur
renc
y to
Exp
orts
Rat
io, N
on-S
ilve
r C
ount
ries
-.20.2.4.6First Difference in Avg Spread
02
46
8H
ard
Cu
rren
y D
ebt
/Exp
ort
s
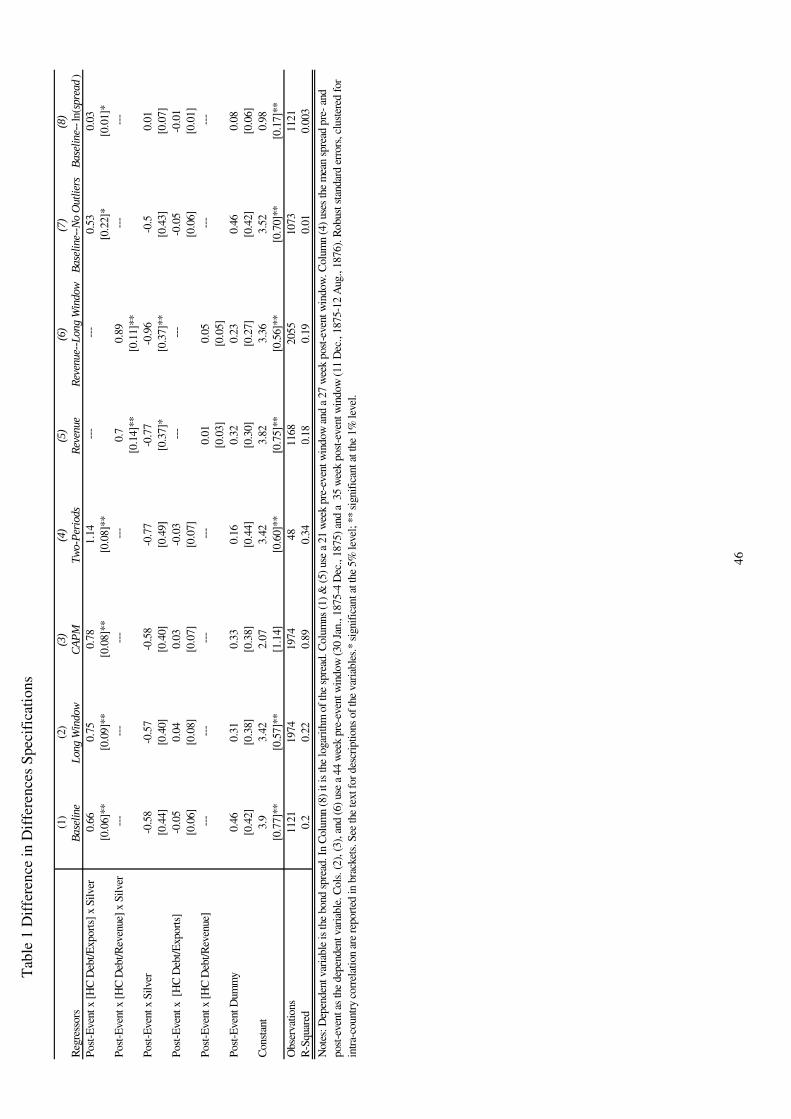
46
Tab
le 1
Dif
fere
nce
in D
iffe
renc
es S
peci
fica
tion
s
(1)
(2)
(3)
(4)
(5)
(6)
(7)
(8)
Reg
ress
ors
Bas
elin
eLo
ng W
indo
wC
AP
MTw
o-P
erio
dsR
even
ueR
even
ue--
Long
Win
dow
Bas
elin
e--N
o O
utlie
rsB
asel
ine-
-ln(
spre
ad)
Post
-Eve
nt x
[HC
Deb
t/Exp
orts
] x S
ilver
0.66
0.75
0.78
1.14
---
---
0.53
0.03
[0.0
6]**
[0.0
9]**
[0.0
8]**
[0.0
8]**
[0.2
2]*
[0.0
1]*
Post
-Eve
nt x
[HC
Deb
t/Rev
enue
] x S
ilver
---
---
---
---
0.7
0.89
---
---
[0.1
4]**
[0.1
1]**
Post
-Eve
nt x
Silv
er-0
.58
-0.5
7-0
.58
-0.7
7-0
.77
-0.9
6-0
.50.
01[0
.44]
[0.4
0][0
.40]
[0.4
9][0
.37]
*[0
.37]
**[0
.43]
[0.0
7]Po
st-E
vent
x [
HC
Deb
t/Exp
orts
]-0
.05
0.04
0.03
-0.0
3 --
- --
--0
.05
-0.0
1[0
.06]
[0.0
8][0
.07]
[0.0
7][0
.06]
[0.0
1]Po
st-E
vent
x [H
C D
ebt/R
even
ue]
---
---
---
---
0.01
0.05
---
---
[0.0
3][0
.05]
Post
-Eve
nt D
umm
y0.
460.
310.
330.
160.
320.
230.
460.
08[0
.42]
[0.3
8][0
.38]
[0.4
4][0
.30]
[0.2
7][0
.42]
[0.0
6]C
onst
ant
3.9
3.42
2.07
3.42
3.82
3.36
3.52
0.98
[0.7
7]**
[0.5
7]**
[1.1
4][0
.60]
**[0
.75]
**[0
.56]
**[0
.70]
**[0
.17]
**O
bser
vatio
ns11
2119
7419
7448
1168
2055
1073
1121
R-S
quar
ed0.
20.
220.
890.
340.
180.
190.
010.
003
Not
es: D
epen
dent
var
iabl
e is
the
bond
spr
ead.
In C
olum
n (8
) it i
s th
e lo
gari
thm
of t
he s
prea
d. C
olum
ns (1
) & (5
) use
a 2
1 w
eek
pre-
even
t win
dow
and
a 2
7 w
eek
post
-eve
nt w
indo
w. C
olum
n (4
) use
s th
e m
ean
spre
ad p
re- a
nd
post
-eve
nt a
s th
e de
pend
ent v
aria
ble.
Col
s. (2
), (3
), an
d (6
) use
a 4
4 w
eek
pre-
even
t win
dow
(30
Jan.
, 187
5-4
Dec
., 18
75) a
nd a
35
wee
k po
st-e
vent
win
dow
(11
Dec
., 18
75-1
2 A
ug.,
1876
). R
obus
t sta
ndar
d er
rors
, clu
ster
ed fo
r in
tra-
coun
try
corr
elat
ion
are
repo
rted
in b
rack
ets.
See
the
text
for d
escr
iptio
ns o
f the
var
iabl
es.*
sig
nifi
cant
at t
he 5
% le
vel;
** s
igni
fica
nt a
t the
1%
leve
l.

47
Tab
le 2
Alt
erna
tive
Bas
elin
e Sp
ecif
icat
ions
(1)
(2)
Reg
ress
ors
Bas
elin
e--D
ebt &
Exp
orts
HC
Deb
t & R
even
ueP
ost-
Eve
nt x
[H
C D
ebt]
x S
ilver
0.04
0.03
[0.0
0]**
[0.0
0]**
Pos
t-E
vent
x [
Exp
orts
] x
Silv
er-0
.02
---
[0.0
1]**
Pos
t-E
vent
x [
Rev
enue
] x
Silv
er -
---0
.01
[0.0
1]P
ost-
Eve
nt x
[H
C D
ebt]
-0.0
003
-0.0
0005
[0.0
005]
[0.0
003]
Pos
t-E
vent
x [
Exp
orts
]-0
.005
---
[0.0
03]
Pos
t-E
vent
x [
Rev
enue
] -
---0
.01
[0.0
1]P
ost-
Eve
nt x
Silv
er-0
.34
-0.4
7[0
.44]
[0.4
2]P
ost-
Eve
nt D
umm
y0.
530.
5[0
.44]
[0.4
2]C
onst
ant
3.9
3.82
[0.7
8]**
[0.7
5]**
Obs
erva
tion
s11
2111
68R
-Squ
ared
0.22
0.19
See
not
es to
Tab
le 1
.
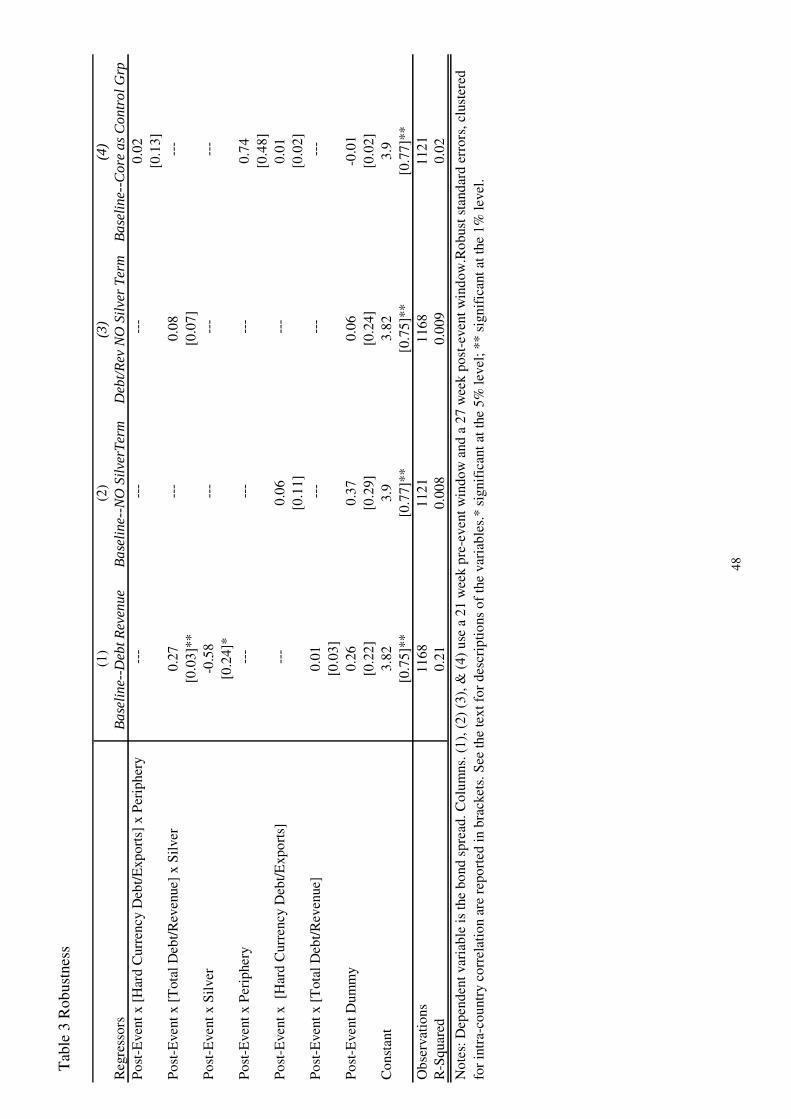
48
T
able
3 R
obus
tnes
s
(1)
(2)
(3)
(4)
Reg
ress
ors
Bas
elin
e--D
ebt R
even
ueB
asel
ine-
-NO
Silv
erT
erm
Deb
t/R
ev N
O S
ilve
r T
erm
Bas
elin
e--C
ore
as C
ontr
ol G
rpPo
st-E
vent
x [
Har
d C
urre
ncy
Deb
t/Exp
orts
] x
Per
iphe
ry -
-- -
-- -
--0.
02[0
.13]
Post
-Eve
nt x
[T
otal
Deb
t/Rev
enue
] x
Silv
er0.
27 -
--0.
08 -
--[0
.03]
**[0
.07]
Post
-Eve
nt x
Silv
er-0
.58
---
---
---
[0.2
4]*
Post
-Eve
nt x
Per
iphe
ry -
-- -
-- -
--0.
74[0
.48]
Post
-Eve
nt x
[H
ard
Cur
renc
y D
ebt/E
xpor
ts]
---
0.06
---
0.01
[0.1
1][0
.02]
Post
-Eve
nt x
[T
otal
Deb
t/Rev
enue
]0.
01 -
-- -
-- -
--[0
.03]
Post
-Eve
nt D
umm
y0.
260.
370.
06-0
.01
[0.2
2][0
.29]
[0.2
4][0
.02]
Con
stan
t3.
823.
93.
823.
9[0
.75]
**[0
.77]
**[0
.75]
**[0
.77]
**O
bser
vatio
ns11
6811
2111
6811
21R
-Squ
ared
0.21
0.00
80.
009
0.02
Not
es: D
epen
dent
var
iabl
e is
the
bond
spr
ead.
Col
umns
. (1)
, (2)
(3)
, & (
4) u
se a
21
wee
k pr
e-ev
ent w
indo
w a
nd a
27
wee
k po
st-e
vent
win
dow
.Rob
ust s
tand
ard
erro
rs, c
lust
ered
fo
r in
tra-
coun
try
corr
elat
ion
are
repo
rted
in b
rack
ets.
See
the
text
for
des
crip
tions
of
the
vari
able
s.*
sign
ific
ant a
t the
5%
leve
l; **
sig
nifi
cant
at t
he 1
% le
vel.
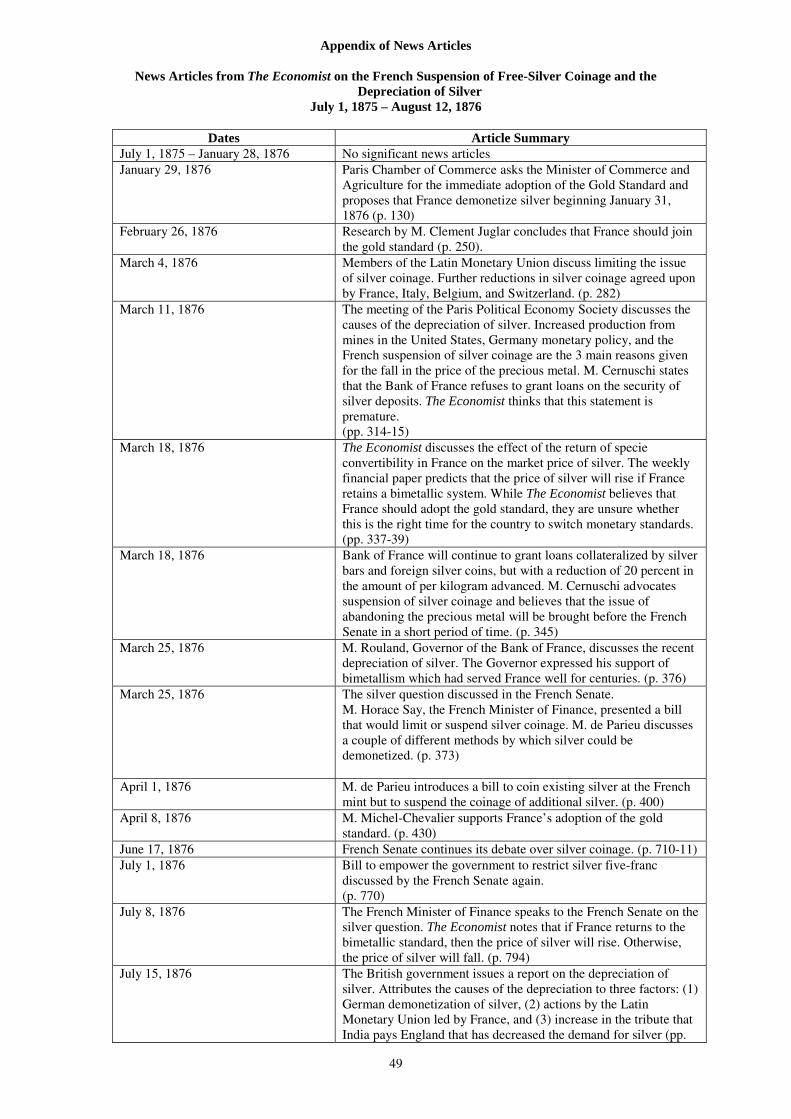
49
Appendix of News Articles
News Articles from The Economist on the French Suspension of Free-Silver Coinage and the Depreciation of Silver
July 1, 1875 – August 12, 1876
Dates Article Summary July 1, 1875 – January 28, 1876 No significant news articles January 29, 1876 Paris Chamber of Commerce asks the Minister of Commerce and
Agriculture for the immediate adoption of the Gold Standard and proposes that France demonetize silver beginning January 31, 1876 (p. 130)
February 26, 1876 Research by M. Clement Juglar concludes that France should join the gold standard (p. 250).
March 4, 1876 Members of the Latin Monetary Union discuss limiting the issue of silver coinage. Further reductions in silver coinage agreed upon by France, Italy, Belgium, and Switzerland. (p. 282)
March 11, 1876 The meeting of the Paris Political Economy Society discusses the causes of the depreciation of silver. Increased production from mines in the United States, Germany monetary policy, and the French suspension of silver coinage are the 3 main reasons given for the fall in the price of the precious metal. M. Cernuschi states that the Bank of France refuses to grant loans on the security of silver deposits. The Economist thinks that this statement is premature. (pp. 314-15)
March 18, 1876 The Economist discusses the effect of the return of specie convertibility in France on the market price of silver. The weekly financial paper predicts that the price of silver will rise if France retains a bimetallic system. While The Economist believes that France should adopt the gold standard, they are unsure whether this is the right time for the country to switch monetary standards. (pp. 337-39)
March 18, 1876 Bank of France will continue to grant loans collateralized by silver bars and foreign silver coins, but with a reduction of 20 percent in the amount of per kilogram advanced. M. Cernuschi advocates suspension of silver coinage and believes that the issue of abandoning the precious metal will be brought before the French Senate in a short period of time. (p. 345)
March 25, 1876 M. Rouland, Governor of the Bank of France, discusses the recent depreciation of silver. The Governor expressed his support of bimetallism which had served France well for centuries. (p. 376)
March 25, 1876 The silver question discussed in the French Senate. M. Horace Say, the French Minister of Finance, presented a bill that would limit or suspend silver coinage. M. de Parieu discusses a couple of different methods by which silver could be demonetized. (p. 373)
April 1, 1876 M. de Parieu introduces a bill to coin existing silver at the French mint but to suspend the coinage of additional silver. (p. 400)
April 8, 1876 M. Michel-Chevalier supports France’s adoption of the gold standard. (p. 430)
June 17, 1876 French Senate continues its debate over silver coinage. (p. 710-11) July 1, 1876 Bill to empower the government to restrict silver five-franc
discussed by the French Senate again. (p. 770)
July 8, 1876 The French Minister of Finance speaks to the French Senate on the silver question. The Economist notes that if France returns to the bimetallic standard, then the price of silver will rise. Otherwise, the price of silver will fall. (p. 794)
July 15, 1876 The British government issues a report on the depreciation of silver. Attributes the causes of the depreciation to three factors: (1) German demonetization of silver, (2) actions by the Latin Monetary Union led by France, and (3) increase in the tribute that India pays England that has decreased the demand for silver (pp.
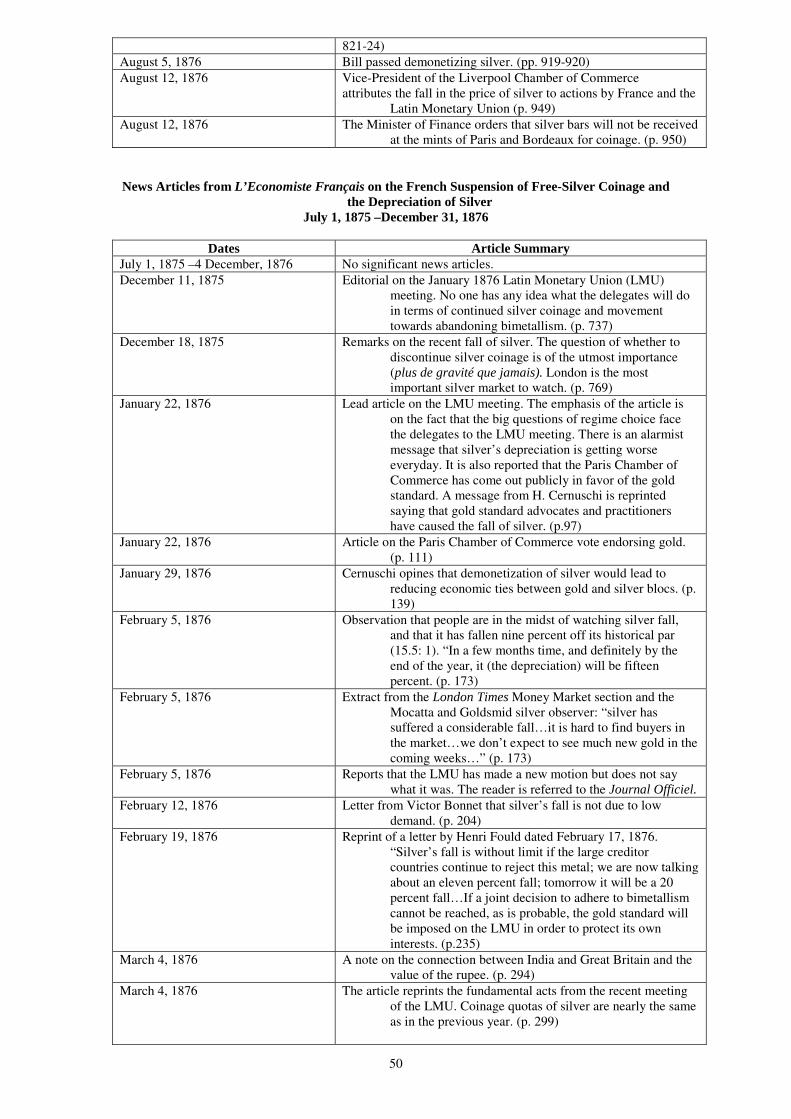
50
821-24) August 5, 1876 Bill passed demonetizing silver. (pp. 919-920) August 12, 1876 Vice-President of the Liverpool Chamber of Commerce
attributes the fall in the price of silver to actions by France and the Latin Monetary Union (p. 949)
August 12, 1876 The Minister of Finance orders that silver bars will not be received at the mints of Paris and Bordeaux for coinage. (p. 950)
News Articles from L’Economiste Français on the French Suspension of Free-Silver Coinage and
the Depreciation of Silver July 1, 1875 –December 31, 1876
Dates Article Summary
July 1, 1875 –4 December, 1876 No significant news articles. December 11, 1875 Editorial on the January 1876 Latin Monetary Union (LMU)
meeting. No one has any idea what the delegates will do in terms of continued silver coinage and movement towards abandoning bimetallism. (p. 737)
December 18, 1875 Remarks on the recent fall of silver. The question of whether to discontinue silver coinage is of the utmost importance (plus de gravité que jamais). London is the most important silver market to watch. (p. 769)
January 22, 1876 Lead article on the LMU meeting. The emphasis of the article is on the fact that the big questions of regime choice face the delegates to the LMU meeting. There is an alarmist message that silver’s depreciation is getting worse everyday. It is also reported that the Paris Chamber of Commerce has come out publicly in favor of the gold standard. A message from H. Cernuschi is reprinted saying that gold standard advocates and practitioners have caused the fall of silver. (p.97)
January 22, 1876 Article on the Paris Chamber of Commerce vote endorsing gold. (p. 111)
January 29, 1876 Cernuschi opines that demonetization of silver would lead to reducing economic ties between gold and silver blocs. (p. 139)
February 5, 1876 Observation that people are in the midst of watching silver fall, and that it has fallen nine percent off its historical par (15.5: 1). “In a few months time, and definitely by the end of the year, it (the depreciation) will be fifteen percent. (p. 173)
February 5, 1876 Extract from the London Times Money Market section and the Mocatta and Goldsmid silver observer: “silver has suffered a considerable fall…it is hard to find buyers in the market…we don’t expect to see much new gold in the coming weeks…” (p. 173)
February 5, 1876 Reports that the LMU has made a new motion but does not say what it was. The reader is referred to the Journal Officiel.
February 12, 1876 Letter from Victor Bonnet that silver’s fall is not due to low demand. (p. 204)
February 19, 1876 Reprint of a letter by Henri Fould dated February 17, 1876. “Silver’s fall is without limit if the large creditor countries continue to reject this metal; we are now talking about an eleven percent fall; tomorrow it will be a 20 percent fall…If a joint decision to adhere to bimetallism cannot be reached, as is probable, the gold standard will be imposed on the LMU in order to protect its own interests. (p.235)
March 4, 1876 A note on the connection between India and Great Britain and the value of the rupee. (p. 294)
March 4, 1876 The article reprints the fundamental acts from the recent meeting of the LMU. Coinage quotas of silver are nearly the same as in the previous year. (p. 299)
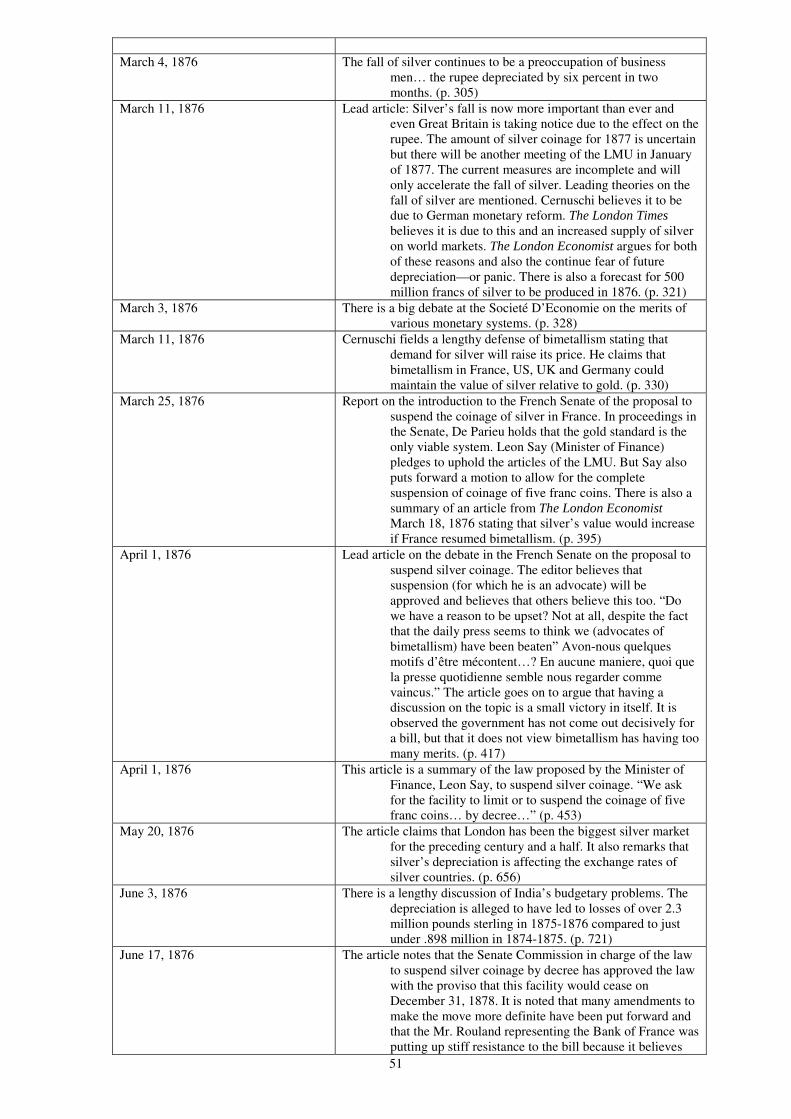
51
March 4, 1876 The fall of silver continues to be a preoccupation of business
men… the rupee depreciated by six percent in two months. (p. 305)
March 11, 1876 Lead article: Silver’s fall is now more important than ever and even Great Britain is taking notice due to the effect on the rupee. The amount of silver coinage for 1877 is uncertain but there will be another meeting of the LMU in January of 1877. The current measures are incomplete and will only accelerate the fall of silver. Leading theories on the fall of silver are mentioned. Cernuschi believes it to be due to German monetary reform. The London Times believes it is due to this and an increased supply of silver on world markets. The London Economist argues for both of these reasons and also the continue fear of future depreciation—or panic. There is also a forecast for 500 million francs of silver to be produced in 1876. (p. 321)
March 3, 1876 There is a big debate at the Societé D’Economie on the merits of various monetary systems. (p. 328)
March 11, 1876 Cernuschi fields a lengthy defense of bimetallism stating that demand for silver will raise its price. He claims that bimetallism in France, US, UK and Germany could maintain the value of silver relative to gold. (p. 330)
March 25, 1876 Report on the introduction to the French Senate of the proposal to suspend the coinage of silver in France. In proceedings in the Senate, De Parieu holds that the gold standard is the only viable system. Leon Say (Minister of Finance) pledges to uphold the articles of the LMU. But Say also puts forward a motion to allow for the complete suspension of coinage of five franc coins. There is also a summary of an article from The London Economist March 18, 1876 stating that silver’s value would increase if France resumed bimetallism. (p. 395)
April 1, 1876 Lead article on the debate in the French Senate on the proposal to suspend silver coinage. The editor believes that suspension (for which he is an advocate) will be approved and believes that others believe this too. “Do we have a reason to be upset? Not at all, despite the fact that the daily press seems to think we (advocates of bimetallism) have been beaten” Avon-nous quelques motifs d’être mécontent…? En aucune maniere, quoi que la presse quotidienne semble nous regarder comme vaincus.” The article goes on to argue that having a discussion on the topic is a small victory in itself. It is observed the government has not come out decisively for a bill, but that it does not view bimetallism has having too many merits. (p. 417)
April 1, 1876 This article is a summary of the law proposed by the Minister of Finance, Leon Say, to suspend silver coinage. “We ask for the facility to limit or to suspend the coinage of five franc coins… by decree…” (p. 453)
May 20, 1876 The article claims that London has been the biggest silver market for the preceding century and a half. It also remarks that silver’s depreciation is affecting the exchange rates of silver countries. (p. 656)
June 3, 1876 There is a lengthy discussion of India’s budgetary problems. The depreciation is alleged to have led to losses of over 2.3 million pounds sterling in 1875-1876 compared to just under .898 million in 1874-1875. (p. 721)
June 17, 1876 The article notes that the Senate Commission in charge of the law to suspend silver coinage by decree has approved the law with the proviso that this facility would cease on December 31, 1878. It is noted that many amendments to make the move more definite have been put forward and that the Mr. Rouland representing the Bank of France was putting up stiff resistance to the bill because it believes
52
silver’s price is going to rise. The article continues to discuss the fall of silver which to that date stood at 14 percent below the old 15.5 par value. (p. 775)
June 24, 1876 Some statistics that refute Mr. Rouland’s arguments are presented including summaries of historical total production of silver and silver coinage in France since 1850. (p. 820)
July 15, 1876 The article claims that silver has now depreciated about 20 percent from par. There is a discussion of coinage of silver in Great Britain. The message is that this is important for those following the debate in the Senate on reform and that if France makes silver into a token coin, silver coinage will fall dramatically. (p. 71)
July 15, 1876 The author notes that before discussion on the silver question began in earnest in the French Senate depreciation of silver was about ten percent. During the debates, silver had fallen fifteen percent and that this last month it has gone to about 20 percent even touching 24 or 25 percent. It is reported that the conseil superieur voted last month 17 to 6 in favor of moving towards a gold standard (i.e., suspending silver coinage). A report by George Goschen on the causes of silver’s fall is also summarized. The principal cause now seems to be simply that supply is larger than demand. (p. 77)
July 22, 1876 There is more discussion about the costs of the fall of silver. The report by Goschen on the fall of silver is analyzed. Number two on the list of reasons for why silver’s value has fallen recently is the LMU’s limitation on silver coinage. (p. 105)
August 8, 1876 There is an analysis of the recent depreciation of silver and its effects on exchange rates in China. (p. 189)
August 26, 1876 This is another long article on the depreciation of silver. It is devoted to the problems arising for India. The key variables that determine the effects of depreciation are the level of annual debt payments to Europe and the amount of exports. (p. 269)
September 1876-December 1876 There are no important articles on silver’s depreciation. There is one article on December 12, 1876 discussing the possibility that silver’s appreciation since August could be due to a lower than expected output of silver from Nevada. (p.751)