navigating the asian textile and garment supply chain - screen - april 2015
TRANSCRIPT
POSITIONING FOR PROFIT
APRIL 2015
NAVIGATING THE ASIAN TEXTILE & GARMENT SUPPLY CHAIN

CONTENTS
EXECUTIVE SUMMARY 3
KEY INSIGHTS 4
THE TEXTILE AND GARMENT MARKET IS NOT LOCAL ANYMORE 6
UNDERSTANDING THE ASIAN SUPPLY CHAIN 12
WHAT HAVE CHINESE COMPANIES BEEN DOING TO COMPETE? 18
DIRECT SOURCING IN A LOWER AUD ENVIRONMENT 38
KEY CONTRIBUTORS 48
ABOUT CLIENT INSIGHTS & SOLUTIONS 48
IMPORTANT NOTICE 50
ANZ ASIA RETAIL
Effective supply chain execution has had a major impact on profits for the Australian textile and garment industry (manufacturers through to retailers) over the last five years, as retailers have used a shift in product sourcing to reduce costs in a low growth environment, at the expense of manufacturers and wholesalers.
Supply chain efficiency covers two key themes, (1) getting the right product at a lower price at a comparable level of quality and (2) getting it to market as quickly as possible. Having a better understanding of the supply chain provides management with the information to make informed sourcing decisions. Direct sourcing has had a structural and positive impact on the cost base, and therefore profitability, of Australian clothing and footwear retailers. But this may not last.
EXECUTIVE SUMMARY
Two major themes have emerged that will heavily influence the future profitability of Australian retailers:
1. The focus on China as a major source of product has been extremely successful, but there has been and continues to be significant change in the upstream legs of the supply chain. We examine the four key strategies that Chinese textile and garment manufacturers are adopting to recapture falling profits, and we assess the impact for Australian retailers in the context of the entire value chain.
2. The continued move to direct sourcing for Australian retailers has made foreign exchange risk management more important than ever. Following on from our November 2013 report: The Migration to Direct Source Retailing: Opportunities from a lower exchange rate, in a volatile AUD environment we examine the profit implications and potential winners and losers from a further fall in the currency.
3

ANZ OPPORTUNITY CHINA
KEY INSIGHTS
China accounts for more than 40% of global textile and garment exports. Australia accounts for around 2% of global consumption. Chinese manufacturers are typically global and larger, while Australian businesses are largely domestic and smaller. The power in the supply chain is skewed towards Chinese manufacturers and this directly and negatively impacts the cost of capital for Australian retailers.
Due to increasing costs, low value textile and garment manufacturing has been progressively moving away from China to other markets such as Bangladesh, Vietnam and Cambodia since 2007.
There are four key components in the upstream Chinese supply chain for textiles and garments: (1) sourcing raw materials, (2) fibre processing, (3) fabric production, and (4) garment manufacturing. On average, operators in all four parts of this supply chain are generating returns at or below their cost of capital, as there has been a downward trend in profitability.
The three key reasons for declining profitability in China’s upstream supply chain are: (1) average wages have increased by 14% per annum since 2006, (2) being categorised as a low cost source of production, many manufacturers have limited capacity to pass on price increases to larger customers in the US and Europe specifically, and (3) the move to “just in time” and “fast fashion” has increased the working capital burden for manufacturers. This has strained the operators’ capital base without the associated increase in earnings, thereby diluting return on equity (ROE).
Chinese manufacturers are implementing four key strategies to improve profitability, which will have varying effects on Australian retailers.
1. Relocation of facilities to lower cost countries: The aggregate cost benefits to manufacturers can be significant, however, risks can be higher. Many Chinese manufacturers are adopting a “China +1” strategy and this can lead to both positive and negative implications for Australian retailers. While lower prices may be passed through, there may be brand and quality risk. Furthermore, there may be lengthened sourcing times due to employee unrest.
2. Increasing focus on fast fashion: Characterised by the likes of Zara and H&M, fast fashion is influencing the Chinese garment making sector due to the associated expedited product cycles. Chinese manufacturers are following these key clients into new markets but this focus can come at the expense of smaller Australian retailers that may be considered non-core.
3. Manufacturers shifting to higher margin products: Low value add manufacturing is leaving China as manufacturers shift their focus to higher margin products to arrest falling margins. Australian retailers may need to find new suppliers or choose suppliers from other countries for low value garments, which can increase business complexity and risk.
4. Manufacturers are becoming more vertically integrated: Vertically integrated manufacturers can achieve profit margins more than 10% higher than specific parts of the upstream supply chain. Furthermore, there have been cases of manufacturers moving downstream into retail markets such as Hong Kong listed Win Hanverky and locally Pacific Brands has also adopted this strategy. Becoming more vertically integrated can improve profitability for Chinese manufacturers, however, this is unlikely to have a material impact on Australian retailers in the medium term.
ANZ ASIA RETAIL
FY07 FY08 FY09 FY10 FY11 FY12 FY13 FY14 YTD
Retailers WholesalersAUD/USD (Avg)
47.5%
38.4% 39.8% 37.1% 39.7% 39.2% 39.4% 39.9% 37.3%
48.1% 48.3%49.3% 50.5% 52.1% 50.5% 49.2%
0.896
0.747
0.8820.990
1.033 1.027
0.9180.870
FY09Limited retailers direct sourcingAverage exchange rates drop signi�cantlyWholesaler gross pro�t margins more af fected
FY1465% - 70% retailers direct sourcingAverage exchange rates drop by 10%Both retailer and wholesaler gross prof it margins af fected
FIGURE 1. THE CHANGING IMPACT ON GROSS MARGINS FROM DIRECT SOURCING
Source: CIQ, ANZ
In FY2013, around 60% of discretionary retailers in Australia were direct sourcing products from overseas. By FY2014, ANZ estimates that this share had increased to 65-70%. The primary focus for Australian retailers direct sourcing has been Asia, and China in particular.
The move to direct sourcing has been the main driver of gross profit margin gains for Australian retailers over the last five years, but it has also increased their exposure to foreign exchange volatility (see Fig 1). With more retailers direct sourcing, the industry will now do much better in an appreciating AUD environment and much worse in a lower AUD environment.
Risk management is now more important than ever. Interestingly, analysis of ANZ retail clients reveals that the average hedging tenor declined from 6.5 months in FY2013 to 5 months by early 2015. In a falling exchange rate environment this is a negative trend.
Modelling a base case AUD/USD average exchange rate of 0.75c during FY2016, more than 70% of direct sourcing retailers are expected to exhibit a negative EBIT prior to price increases or other cost saving initiatives. This share will represent an increase from the 17% that are presently EBIT loss making.
It is not all bad news as there are two identified tailwinds for retailers that can help offset pain in a lower exchange rate environment: (1) tariffs on textiles and garments fell from 10% to 5% on 1 January 2015, which will make imports cheaper and can help to partially offset higher FX induced costs, and (2) The China-Australia Free Trade Agreement will lead to nil tariffs from China from late December 2015, when the agreement is expected to come into force. China is Australia’s largest source for textiles and garments.
RISK MANAGEMENT IS NOW A SOURCE OF COMPETITIVE ADVANTAGE
5
ANZ ASIA RETAIL
THE TEXTILE AND GARMENT MARKET IS NOT LOCAL ANYMORE
The rise of online shopping is just one example of the increasing globalisation of Australian retail. Online shopping has led to increased competition, as foreign companies have competed for the local dollar, while local retailers have incorporated online as an omni-channel business strategy to capture more of the customer wallet.
Another example of increased globalisation within the industry, and specifically within the textile and garment industry, is on the supply side. More and more Australian clothing and footwear retailers are sourcing products directly from the overseas manufacturer or overseas agents. As highlighted in ANZ’s November 2013 report, The migration to direct source retailing: Opportunities from a lower exchange rate, the move to direct sourcing has been the primary driver of retailer gross margin expansion, as opposed to the widely held belief that retailers simply “got lucky” due to a higher Australian dollar (AUD).
The move to direct sourcing has also provided retailers with the option of sourcing products from a greater range of manufacturers and wholesalers from more geographies. Anecdotal customer feedback suggests that retailers may not be fully aware of the dynamics, opportunities or issues that may exist upstream in the supply chain.
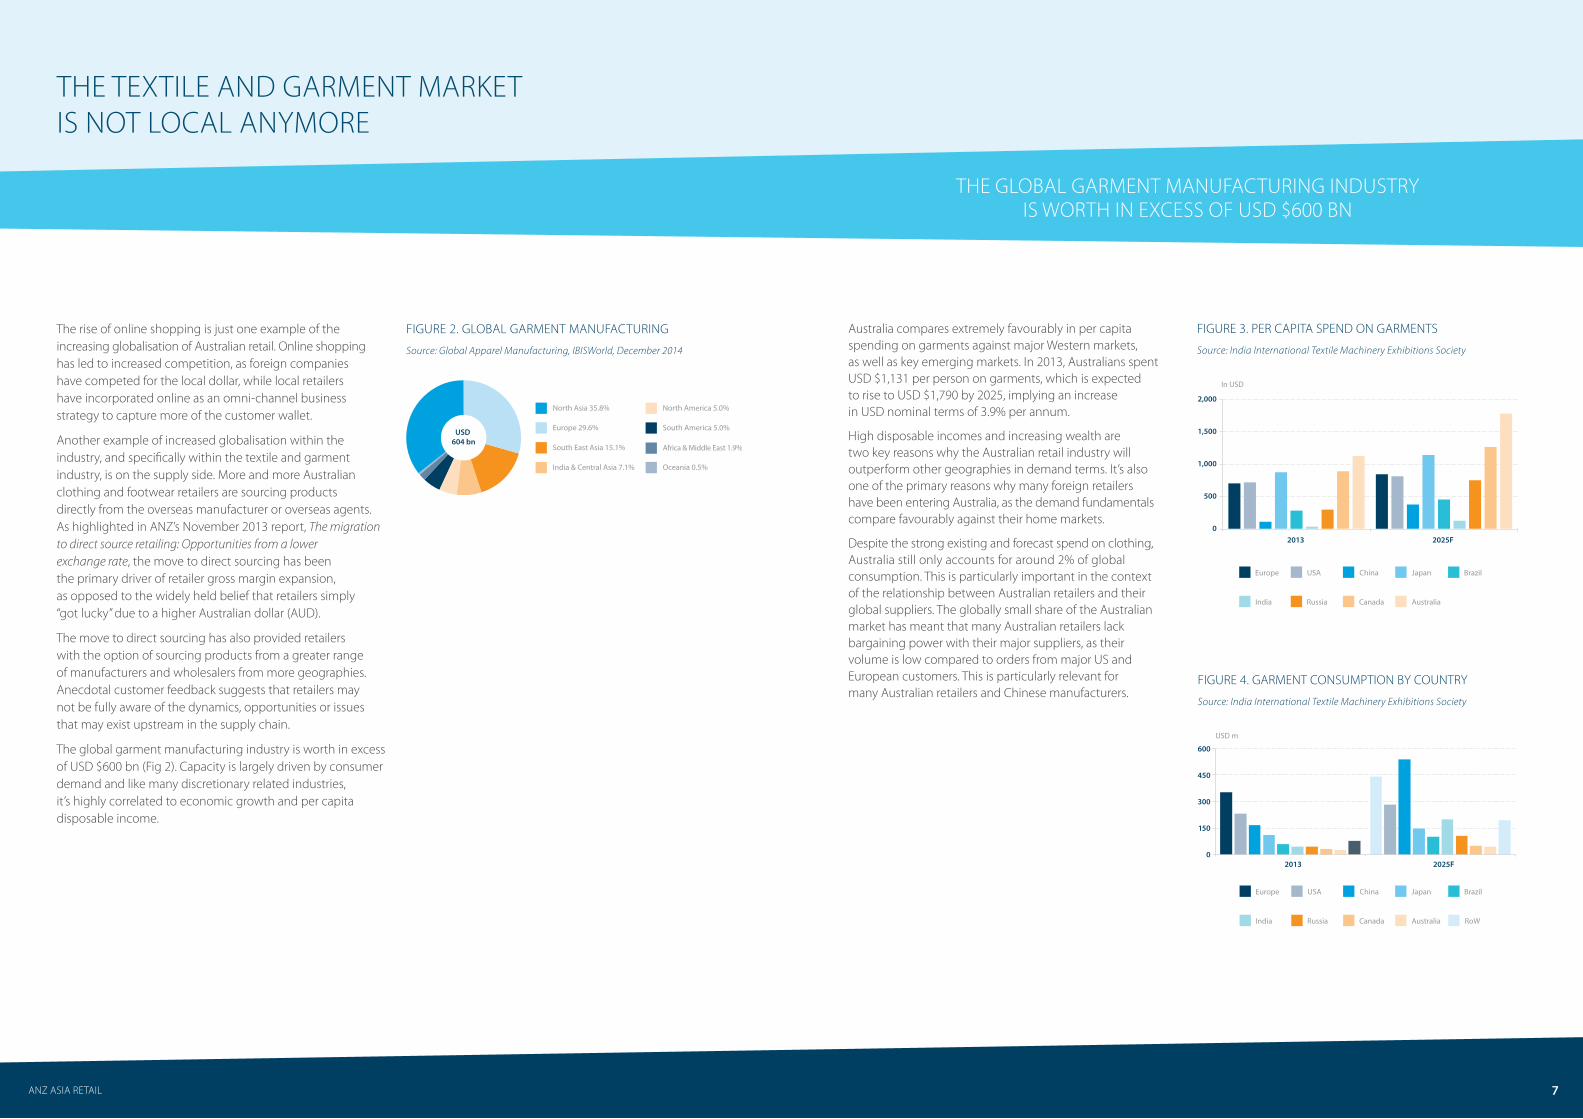
The global garment manufacturing industry is worth in excess of USD $600 bn (Fig 2). Capacity is largely driven by consumer demand and like many discretionary related industries, it’s highly correlated to economic growth and per capita disposable income.
FIGURE 2. GLOBAL GARMENT MANUFACTURING
Source: Global Apparel Manufacturing, IBISWorld, December 2014
Oceania 0.5%
Africa & Middle East 1.9%
South America 5.0%
North America 5.0%
India & Central Asia 7.1%
South East Asia 15.1%
Europe 29.6%
North Asia 35.8%
USD 604 bn
FIGURE 3. PER CAPITA SPEND ON GARMENTS
Source: India International Textile Machinery Exhibitions Society
Australia compares extremely favourably in per capita spending on garments against major Western markets, as well as key emerging markets. In 2013, Australians spent USD $1,131 per person on garments, which is expected to rise to USD $1,790 by 2025, implying an increase in USD nominal terms of 3.9% per annum.
High disposable incomes and increasing wealth are two key reasons why the Australian retail industry will outperform other geographies in demand terms. It’s also one of the primary reasons why many foreign retailers have been entering Australia, as the demand fundamentals compare favourably against their home markets.
Despite the strong existing and forecast spend on clothing, Australia still only accounts for around 2% of global consumption. This is particularly important in the context of the relationship between Australian retailers and their global suppliers. The globally small share of the Australian market has meant that many Australian retailers lack bargaining power with their major suppliers, as their volume is low compared to orders from major US and European customers. This is particularly relevant for many Australian retailers and Chinese manufacturers.
THE GLOBAL GARMENT MANUFACTURING INDUSTRY IS WORTH IN EXCESS OF USD $600 BN
In USD
0
500
1,000
1,500
2,000
2013 2025F
USA China JapanEurope Brazil
India Canada AustraliaRussia
FIGURE 4. GARMENT CONSUMPTION BY COUNTRY
Source: India International Textile Machinery Exhibitions Society
0
150
300
450
600
2013 2025F
USA China Japan BrazilEurope
USD m
India Canada AustraliaRussia RoW
7
ANZ ASIA RETAIL
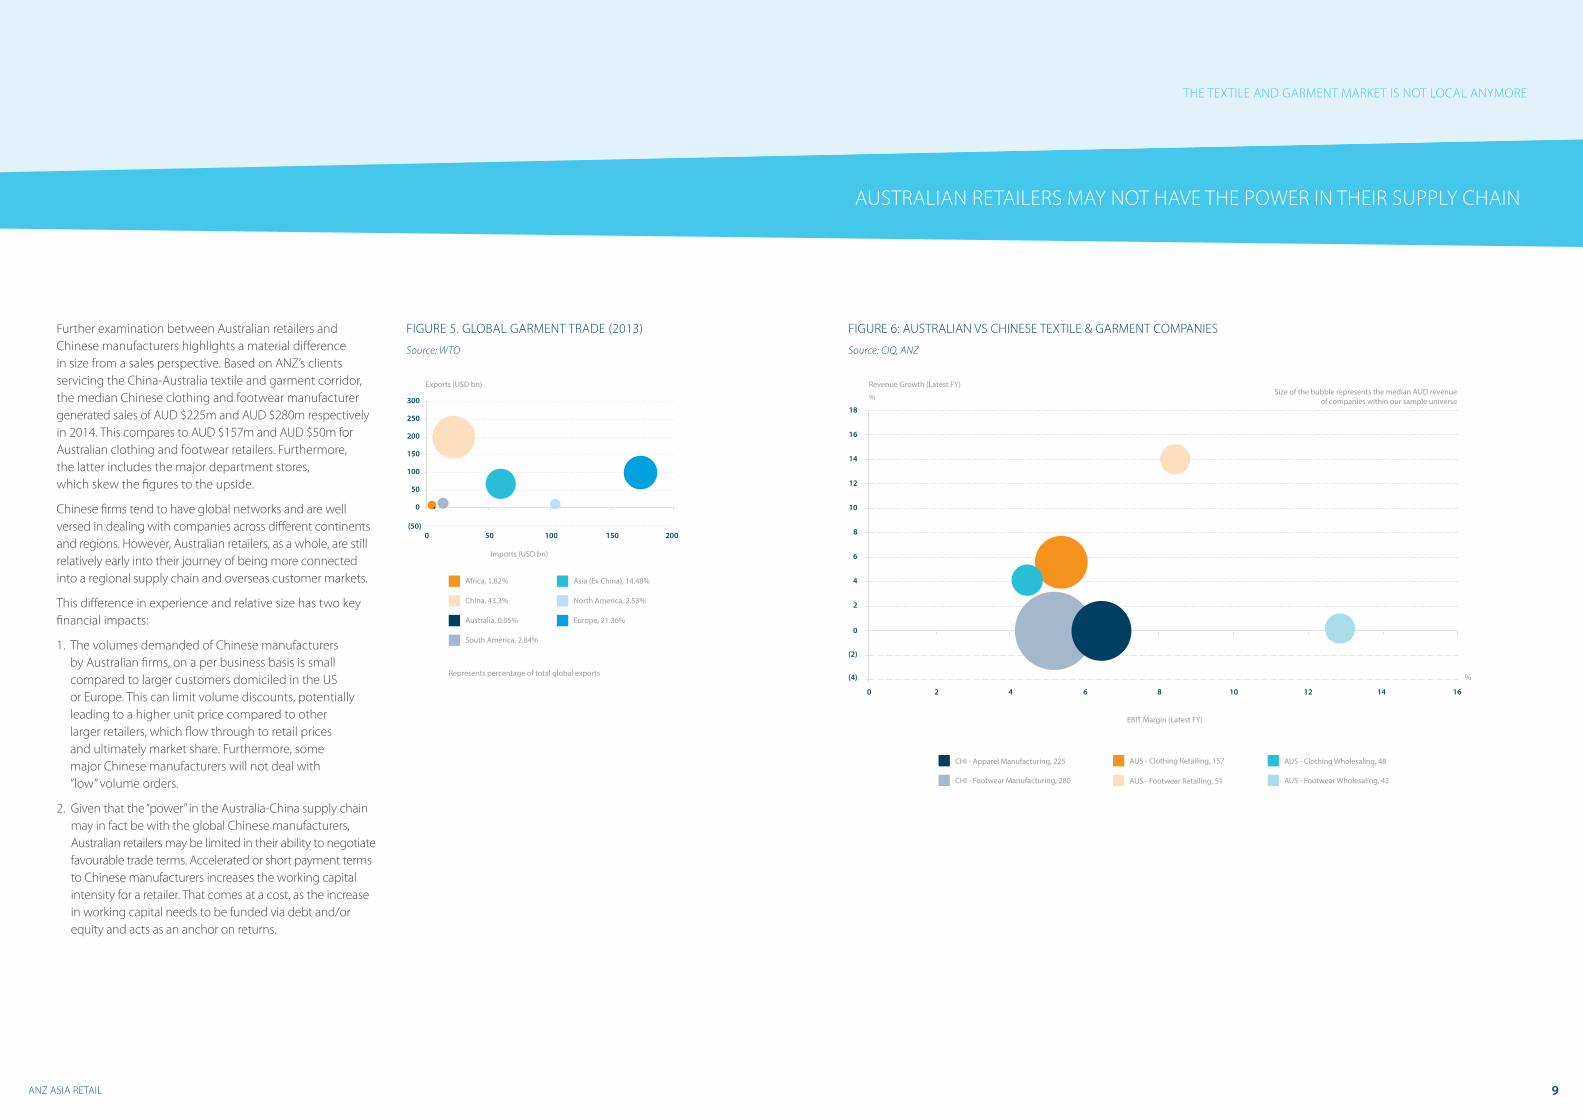
FIGURE 5. GLOBAL GARMENT TRADE (2013)
Source: WTO
Further examination between Australian retailers and Chinese manufacturers highlights a material difference in size from a sales perspective. Based on ANZ’s clients servicing the China-Australia textile and garment corridor, the median Chinese clothing and footwear manufacturer generated sales of AUD $225m and AUD $280m respectively in 2014. This compares to AUD $157m and AUD $50m for Australian clothing and footwear retailers. Furthermore, the latter includes the major department stores, which skew the figures to the upside.
Chinese firms tend to have global networks and are well versed in dealing with companies across different continents and regions. However, Australian retailers, as a whole, are still relatively early into their journey of being more connected into a regional supply chain and overseas customer markets.
This difference in experience and relative size has two key financial impacts:
1. The volumes demanded of Chinese manufacturers by Australian firms, on a per business basis is small compared to larger customers domiciled in the US or Europe. This can limit volume discounts, potentially leading to a higher unit price compared to other larger retailers, which flow through to retail prices and ultimately market share. Furthermore, some major Chinese manufacturers will not deal with “low” volume orders.
2. Given that the “power” in the Australia-China supply chain may in fact be with the global Chinese manufacturers, Australian retailers may be limited in their ability to negotiate favourable trade terms. Accelerated or short payment terms to Chinese manufacturers increases the working capital intensity for a retailer. That comes at a cost, as the increase in working capital needs to be funded via debt and/or equity and acts as an anchor on returns.
(50)
0
50
100
150
200
250
300
0 50 100 150 200
Exports (USD bn)
Imports (USD bn)
Europe, 21.36%
Asia (Ex China), 14.48%
North America, 2.53%
South America, 2.84%
Africa, 1.82%
Australia, 0.05%
China, 43.3%
Represents percentage of total global exports
9
AUSTRALIAN RETAILERS MAY NOT HAVE THE POWER IN THEIR SUPPLY CHAIN
THE TEXTILE AND GARMENT MARKET IS NOT LOCAL ANYMORE
FIGURE 6: AUSTRALIAN VS CHINESE TEXTILE & GARMENT COMPANIES
Source: CIQ, ANZ
Revenue Growth (Latest FY)
%
%
Size of the bubble represents the median AUD revenueof companies within our sample universe
EBIT Margin (Latest FY)
18
16
14
12
10
8
6
4
2
0
(2)
(4)
0 2 4 6 8 10 12 14 16
AUS - Footwear Wholesaling, 42CHI - Footwear Manufacturing, 280
CHI - Apparel Manufacturing, 225 AUS - Clothing Wholesaling, 48
AUS - Footwear Retailing, 51
AUS - Clothing Retailing, 157
ANZ ASIA RETAIL
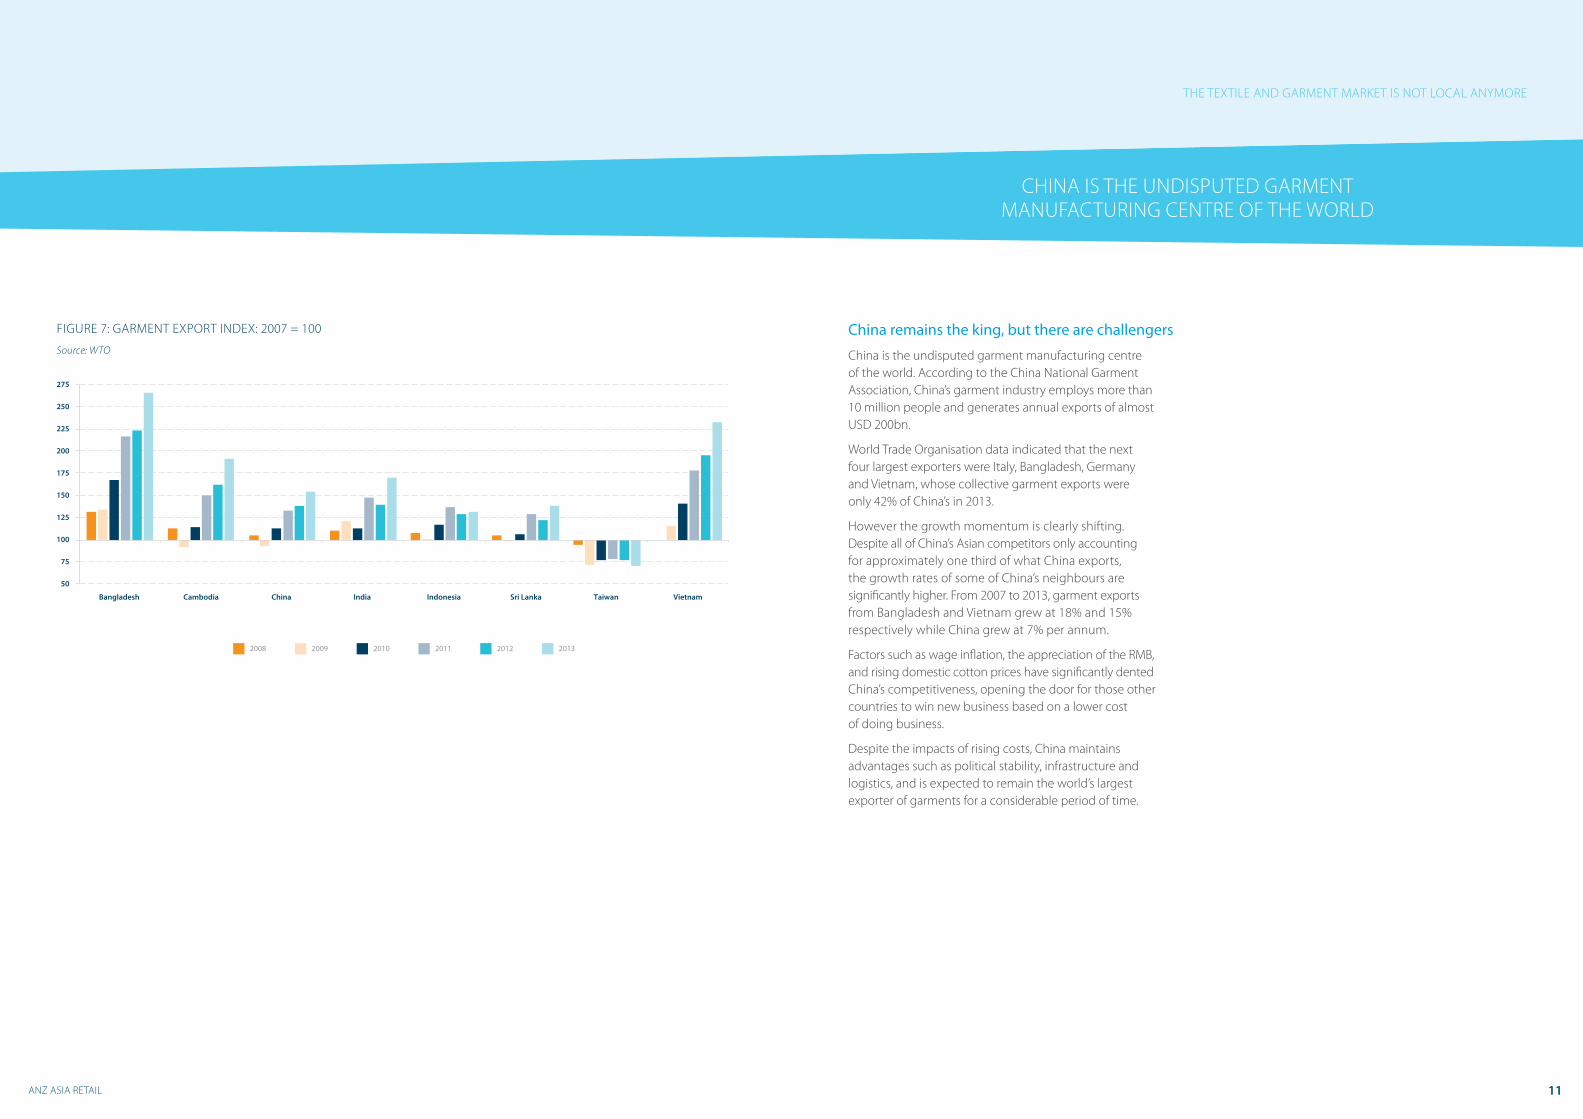
FIGURE 7: GARMENT EXPORT INDEX: 2007 = 100
Source: WTO
2008 2009 2010 2011 2012 2013
50
75
100
125
150
175
200
225
250
275
Bangladesh Cambodia China India Indonesia Sri Lanka Taiwan Vietnam
11
CHINA IS THE UNDISPUTED GARMENT MANUFACTURING CENTRE OF THE WORLD
China remains the king, but there are challengers
China is the undisputed garment manufacturing centre of the world. According to the China National Garment Association, China’s garment industry employs more than 10 million people and generates annual exports of almost USD 200bn.
World Trade Organisation data indicated that the next four largest exporters were Italy, Bangladesh, Germany and Vietnam, whose collective garment exports were only 42% of China’s in 2013.
However the growth momentum is clearly shifting. Despite all of China’s Asian competitors only accounting for approximately one third of what China exports, the growth rates of some of China’s neighbours are significantly higher. From 2007 to 2013, garment exports from Bangladesh and Vietnam grew at 18% and 15% respectively while China grew at 7% per annum.
Factors such as wage inflation, the appreciation of the RMB, and rising domestic cotton prices have significantly dented China’s competitiveness, opening the door for those other countries to win new business based on a lower cost of doing business.
Despite the impacts of rising costs, China maintains advantages such as political stability, infrastructure and logistics, and is expected to remain the world’s largest exporter of garments for a considerable period of time.
THE TEXTILE AND GARMENT MARKET IS NOT LOCAL ANYMORE
UNDERSTANDING THE ASIAN SUPPLY CHAIN
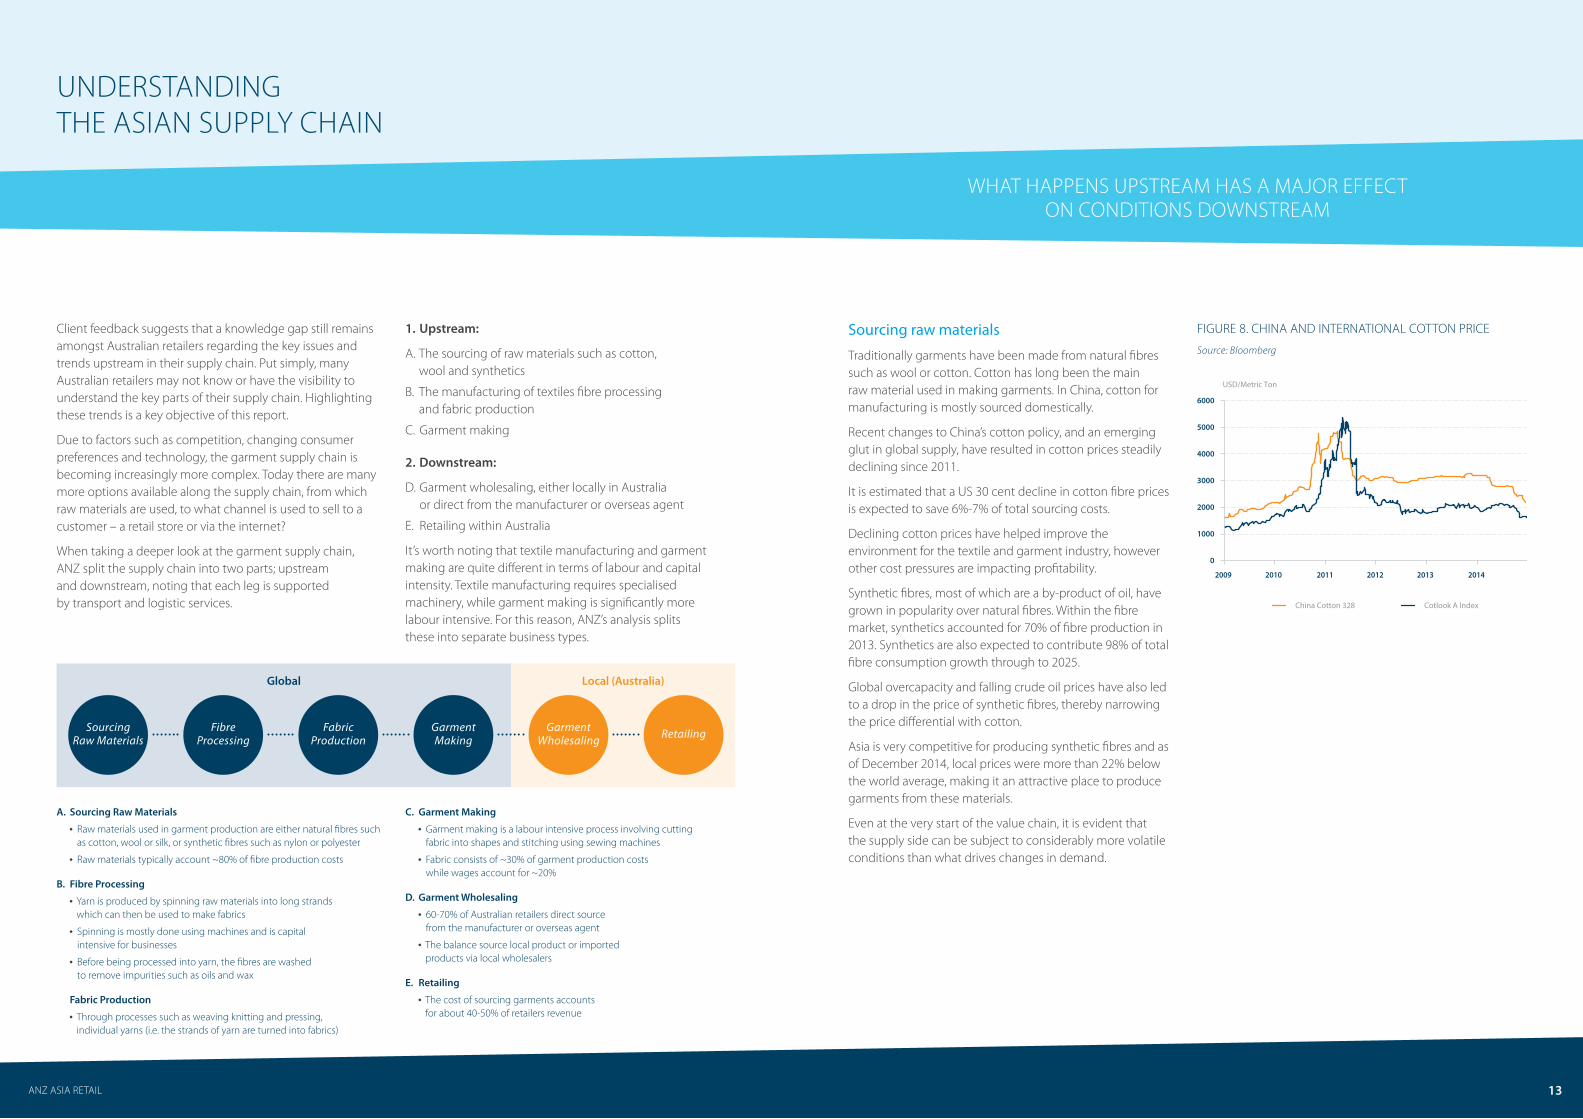
Client feedback suggests that a knowledge gap still remains amongst Australian retailers regarding the key issues and trends upstream in their supply chain. Put simply, many Australian retailers may not know or have the visibility to understand the key parts of their supply chain. Highlighting these trends is a key objective of this report.
Due to factors such as competition, changing consumer preferences and technology, the garment supply chain is becoming increasingly more complex. Today there are many more options available along the supply chain, from which raw materials are used, to what channel is used to sell to a customer – a retail store or via the internet?
When taking a deeper look at the garment supply chain, ANZ split the supply chain into two parts; upstream and downstream, noting that each leg is supported by transport and logistic services.
1. Upstream:
A. The sourcing of raw materials such as cotton, wool and synthetics
B. The manufacturing of textiles fibre processing and fabric production
C. Garment making
2. Downstream:
D. Garment wholesaling, either locally in Australia or direct from the manufacturer or overseas agent
E. Retailing within Australia
It’s worth noting that textile manufacturing and garment making are quite different in terms of labour and capital intensity. Textile manufacturing requires specialised machinery, while garment making is significantly more labour intensive. For this reason, ANZ’s analysis splits these into separate business types.
ANZ ASIA RETAIL
A. Sourcing Raw Materials Raw materials used in garment production are either natural fibres such
as cotton, wool or silk, or synthetic fibres such as nylon or polyester
Raw materials typically account ~80% of fibre production costs
B. Fibre Processing Yarn is produced by spinning raw materials into long strands
which can then be used to make fabrics
Spinning is mostly done using machines and is capital intensive for businesses
Before being processed into yarn, the fibres are washed to remove impurities such as oils and wax
Fabric Production Through processes such as weaving knitting and pressing,
individual yarns (i.e. the strands of yarn are turned into fabrics)
C. Garment Making Garment making is a labour intensive process involving cutting
fabric into shapes and stitching using sewing machines
Fabric consists of ~30% of garment production costs while wages account for ~20%
D. Garment Wholesaling 60-70% of Australian retailers direct source
from the manufacturer or overseas agent
The balance source local product or imported products via local wholesalers
E. Retailing The cost of sourcing garments accounts
for about 40-50% of retailers revenue
Sourcing Raw Materials
Fibre Processing
Fabric Production
Garment Making
Garment Wholesaling Retailing
WHAT HAPPENS UPSTREAM HAS A MAJOR EFFECT ON CONDITIONS DOWNSTREAM
Sourcing raw materials
Traditionally garments have been made from natural fibres such as wool or cotton. Cotton has long been the main raw material used in making garments. In China, cotton for manufacturing is mostly sourced domestically.
Recent changes to China’s cotton policy, and an emerging glut in global supply, have resulted in cotton prices steadily declining since 2011.
It is estimated that a US 30 cent decline in cotton fibre prices is expected to save 6%-7% of total sourcing costs.
Declining cotton prices have helped improve the environment for the textile and garment industry, however other cost pressures are impacting profitability.
Synthetic fibres, most of which are a by-product of oil, have grown in popularity over natural fibres. Within the fibre market, synthetics accounted for 70% of fibre production in 2013. Synthetics are also expected to contribute 98% of total fibre consumption growth through to 2025.
Global overcapacity and falling crude oil prices have also led to a drop in the price of synthetic fibres, thereby narrowing the price differential with cotton.
Asia is very competitive for producing synthetic fibres and as of December 2014, local prices were more than 22% below the world average, making it an attractive place to produce garments from these materials.
Even at the very start of the value chain, it is evident that the supply side can be subject to considerably more volatile conditions than what drives changes in demand.
FIGURE 8. CHINA AND INTERNATIONAL COTTON PRICE
Source: Bloomberg
0
1000
2000
3000
4000
5000
6000
2009 2010 2011 2012 2013 2014
USD/Metric Ton
China Cotton 328 Cotlook A Index
13
Global Local (Australia)
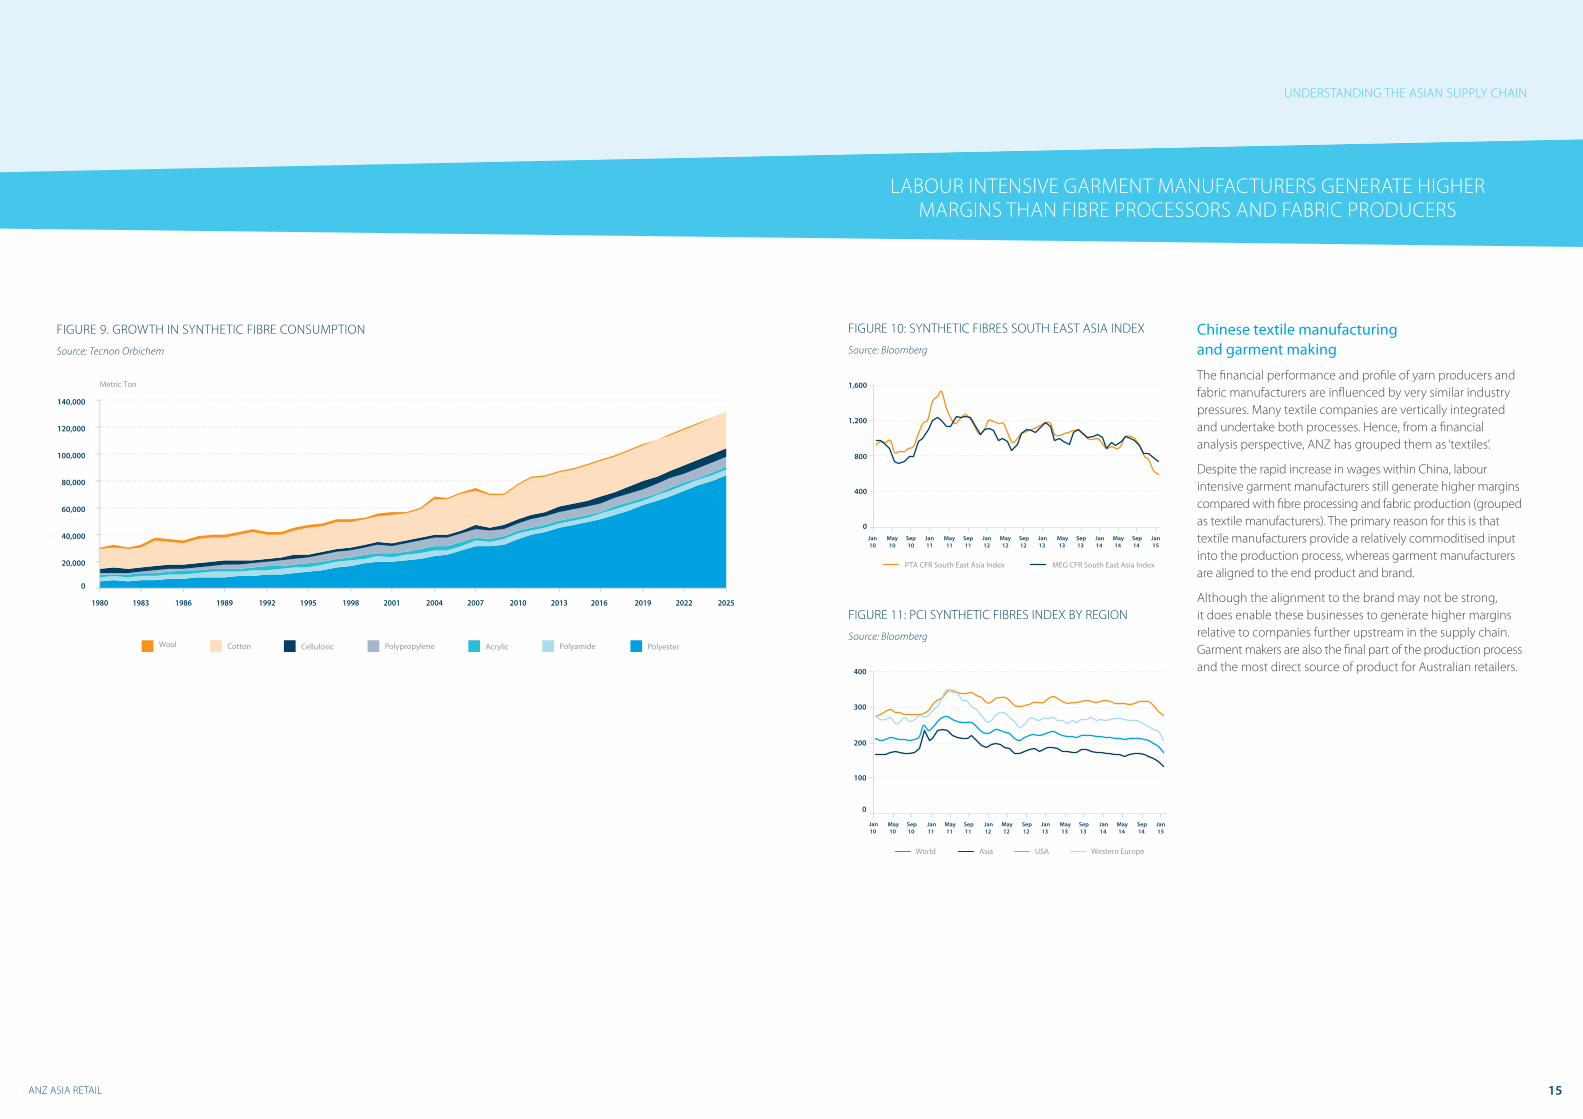
FIGURE 9. GROWTH IN SYNTHETIC FIBRE CONSUMPTION
Source: Tecnon Orbichem
20,000
0
40,000
60,000
80,000
100,000
120,000
140,000
Wool Cotton
Cellulosic Polypropylene
Acrylic Polyamide
Polyester
1980 1983 1986 1989 1992 1995 1998 2001 2004 2007 2010 2013 2016 2019 2022 2025
Wool Cotton Cellulosic Polypropylene Acrylic PolyesterPolyamide
Metric Ton
ANZ ASIA RETAIL 15
UNDERSTANDING THE ASIAN SUPPLY CHAIN
FIGURE 11: PCI SYNTHETIC FIBRES INDEX BY REGION
Source: Bloomberg
FIGURE 10: SYNTHETIC FIBRES SOUTH EAST ASIA INDEX
Source: Bloomberg
0
400
800
1,200
1,600
Jan10
Jan15
May10
Sep10
Jan12
May12
Sep12
Jan13
May13
Sep13
Jan14
May14
Sep14
Jan11
May11
Sep11
PTA CFR South East Asia Index MEG CFR South East Asia Index
Chinese textile manufacturing and garment making
The financial performance and profile of yarn producers and fabric manufacturers are influenced by very similar industry pressures. Many textile companies are vertically integrated and undertake both processes. Hence, from a financial analysis perspective, ANZ has grouped them as ‘textiles’.
Despite the rapid increase in wages within China, labour intensive garment manufacturers still generate higher margins compared with fibre processing and fabric production (grouped as textile manufacturers). The primary reason for this is that textile manufacturers provide a relatively commoditised input into the production process, whereas garment manufacturers are aligned to the end product and brand.
Although the alignment to the brand may not be strong, it does enable these businesses to generate higher margins relative to companies further upstream in the supply chain. Garment makers are also the final part of the production process and the most direct source of product for Australian retailers.
LABOUR INTENSIVE GARMENT MANUFACTURERS GENERATE HIGHER MARGINS THAN FIBRE PROCESSORS AND FABRIC PRODUCERS
Jan10
Jan15
May10
Sep10
Jan12
May12
Sep12
Jan13
May13
Sep13
Jan14
May14
Sep14
Jan11
May11
Sep11
0
World Asia USA Western Europe
100
200
300
400
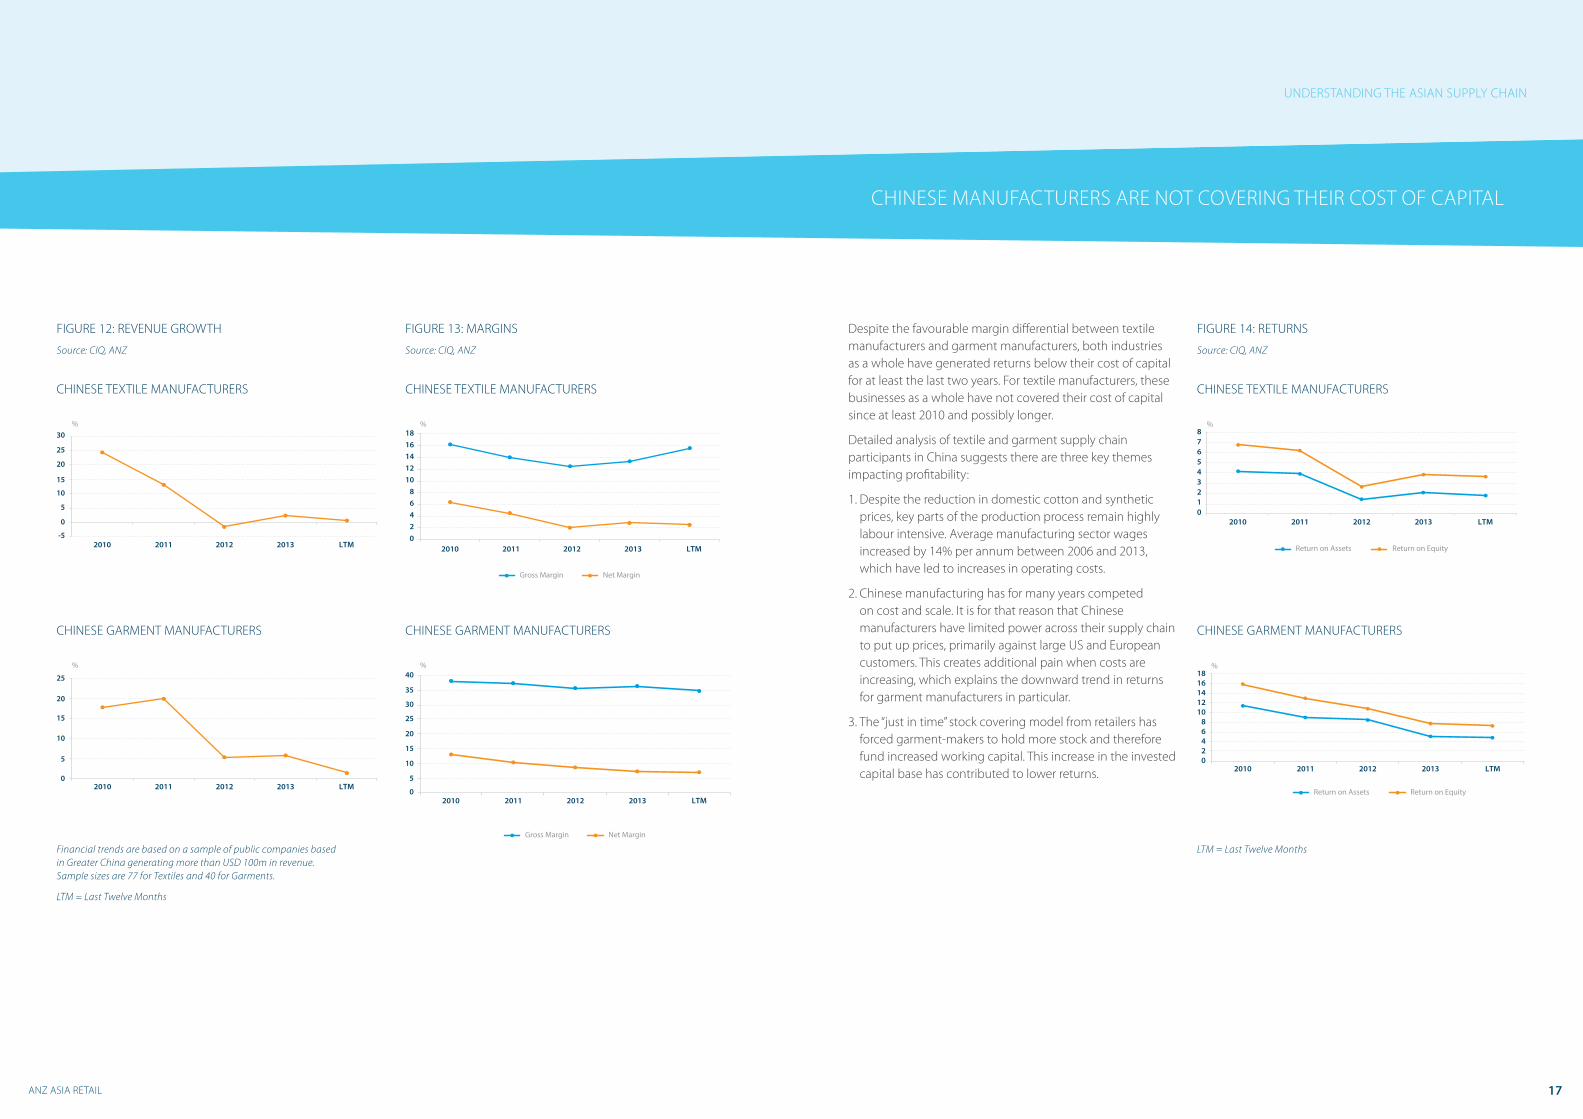
FIGURE 12: REVENUE GROWTH
Source: CIQ, ANZ
ANZ ASIA RETAIL
FIGURE 13: MARGINS
Source: CIQ, ANZ
CHINESE TEXTILE MANUFACTURERS
CHINESE GARMENT MANUFACTURERS
2010
30
25
20
15
10
5
0
-5
%
2011 2012 2013 LTM
2010
25
20
15
10
5
0
%
2011 2012 2013 LTM
CHINESE TEXTILE MANUFACTURERS
CHINESE GARMENT MANUFACTURERS
%
2010
1816141210
86420
2011 2012 2013 LTM
Gross Margin Net Margin
2010
40
35
30
25
20
15
10
5
0
%
2011 2012 2013 LTM
Gross Margin Net Margin
17
CHINESE MANUFACTURERS ARE NOT COVERING THEIR COST OF CAPITAL
UNDERSTANDING THE ASIAN SUPPLY CHAIN
Despite the favourable margin differential between textile manufacturers and garment manufacturers, both industries as a whole have generated returns below their cost of capital for at least the last two years. For textile manufacturers, these businesses as a whole have not covered their cost of capital since at least 2010 and possibly longer.
Detailed analysis of textile and garment supply chain participants in China suggests there are three key themes impacting profitability:
1. Despite the reduction in domestic cotton and synthetic prices, key parts of the production process remain highly labour intensive. Average manufacturing sector wages increased by 14% per annum between 2006 and 2013, which have led to increases in operating costs.
2. Chinese manufacturing has for many years competed on cost and scale. It is for that reason that Chinese manufacturers have limited power across their supply chain to put up prices, primarily against large US and European customers. This creates additional pain when costs are increasing, which explains the downward trend in returns for garment manufacturers in particular.
3. The “just in time” stock covering model from retailers has forced garment-makers to hold more stock and therefore fund increased working capital. This increase in the invested capital base has contributed to lower returns.
CHINESE TEXTILE MANUFACTURERS
FIGURE 14: RETURNS
Source: CIQ, ANZ
%
2010
876543210
2011 2012 2013 LTM
Return on Assets Return on Equity
CHINESE GARMENT MANUFACTURERS
%1816141210
86420
2010 2011 2012 2013 LTM
Return on Assets Return on Equity
Financial trends are based on a sample of public companies based in Greater China generating more than USD 100m in revenue. Sample sizes are 77 for Textiles and 40 for Garments.
LTM = Last Twelve Months
LTM = Last Twelve Months
ANZ OPPORTUNITY CHINA
WHAT HAVE CHINESE COMPANIES BEEN DOING TO COMPETE?
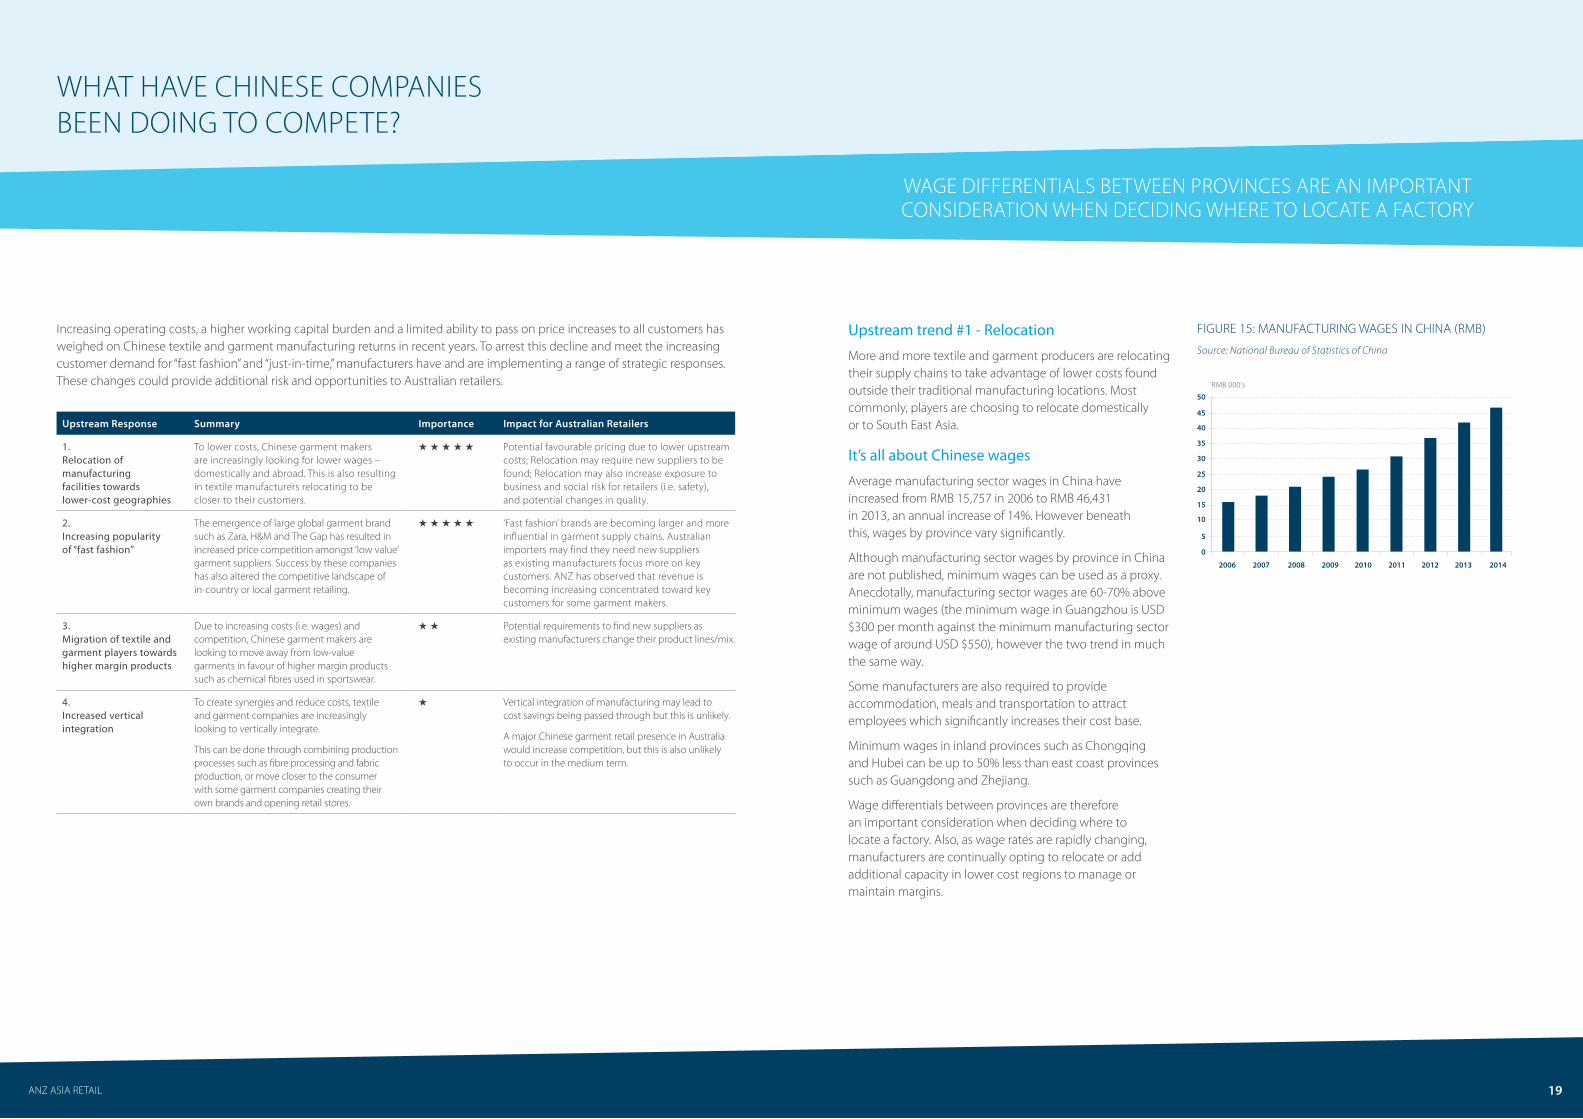
Increasing operating costs, a higher working capital burden and a limited ability to pass on price increases to all customers has weighed on Chinese textile and garment manufacturing returns in recent years. To arrest this decline and meet the increasing customer demand for “fast fashion” and “just-in-time,” manufacturers have and are implementing a range of strategic responses. These changes could provide additional risk and opportunities to Australian retailers.
ANZ ASIA RETAIL
Upstream Response Summary Importance Impact for Australian Retailers
1. Relocation of manufacturing facilities towards lower-cost geographies
To lower costs, Chinese garment makers are increasingly looking for lower wages – domestically and abroad. This is also resulting in textile manufacturers relocating to be closer to their customers.
★ ★ ★ ★ ★ Potential favourable pricing due to lower upstream costs; Relocation may require new suppliers to be found; Relocation may also increase exposure to business and social risk for retailers (i.e. safety), and potential changes in quality.
2. Increasing popularity of “fast fashion”
The emergence of large global garment brand such as Zara, H&M and The Gap has resulted in increased price competition amongst ‘low value’ garment suppliers. Success by these companies has also altered the competitive landscape of in-country or local garment retailing.
★ ★ ★ ★ ★ ‘Fast fashion’ brands are becoming larger and more influential in garment supply chains. Australian importers may find they need new suppliers as existing manufacturers focus more on key customers. ANZ has observed that revenue is becoming increasing concentrated toward key customers for some garment makers.
3. Migration of textile and garment players towards higher margin products
Due to increasing costs (i.e. wages) and competition, Chinese garment makers are looking to move away from low-value garments in favour of higher margin products such as chemical fibres used in sportswear.
★ ★ Potential requirements to find new suppliers as existing manufacturers change their product lines/mix.
4. Increased vertical integration
To create synergies and reduce costs, textile and garment companies are increasingly looking to vertically integrate.
This can be done through combining production processes such as fibre processing and fabric production, or move closer to the consumer with some garment companies creating their own brands and opening retail stores.
★ Vertical integration of manufacturing may lead to cost savings being passed through but this is unlikely.
A major Chinese garment retail presence in Australia would increase competition, but this is also unlikely to occur in the medium term.
Upstream trend #1 - Relocation
More and more textile and garment producers are relocating their supply chains to take advantage of lower costs found outside their traditional manufacturing locations. Most commonly, players are choosing to relocate domestically or to South East Asia.
It’s all about Chinese wages
Average manufacturing sector wages in China have increased from RMB 15,757 in 2006 to RMB 46,431 in 2013, an annual increase of 14%. However beneath this, wages by province vary significantly.
Although manufacturing sector wages by province in China are not published, minimum wages can be used as a proxy. Anecdotally, manufacturing sector wages are 60-70% above minimum wages (the minimum wage in Guangzhou is USD $300 per month against the minimum manufacturing sector wage of around USD $550), however the two trend in much the same way.
Some manufacturers are also required to provide accommodation, meals and transportation to attract employees which significantly increases their cost base.
Minimum wages in inland provinces such as Chongqing and Hubei can be up to 50% less than east coast provinces such as Guangdong and Zhejiang.
Wage differentials between provinces are therefore an important consideration when deciding where to locate a factory. Also, as wage rates are rapidly changing, manufacturers are continually opting to relocate or add additional capacity in lower cost regions to manage or maintain margins.
WAGE DIFFERENTIALS BETWEEN PROVINCES ARE AN IMPORTANT CONSIDERATION WHEN DECIDING WHERE TO LOCATE A FACTORY
FIGURE 15: MANUFACTURING WAGES IN CHINA (RMB)
Source: National Bureau of Statistics of China
0
2006 2007 2008 2009 2010 2011 2012 2013 2014
5
10
15
20
25
30
35
40
45
50RMB 000's
19
1,000 - 1,150 yuan
1,151 - 1,300 yuan
1,301 - 1,450 yuan
1,451 - 1,600 yuan
1,601 - 1,750 yuan
1,750 - 1,900 yuan
Chongqing
Tianjin
Beijing
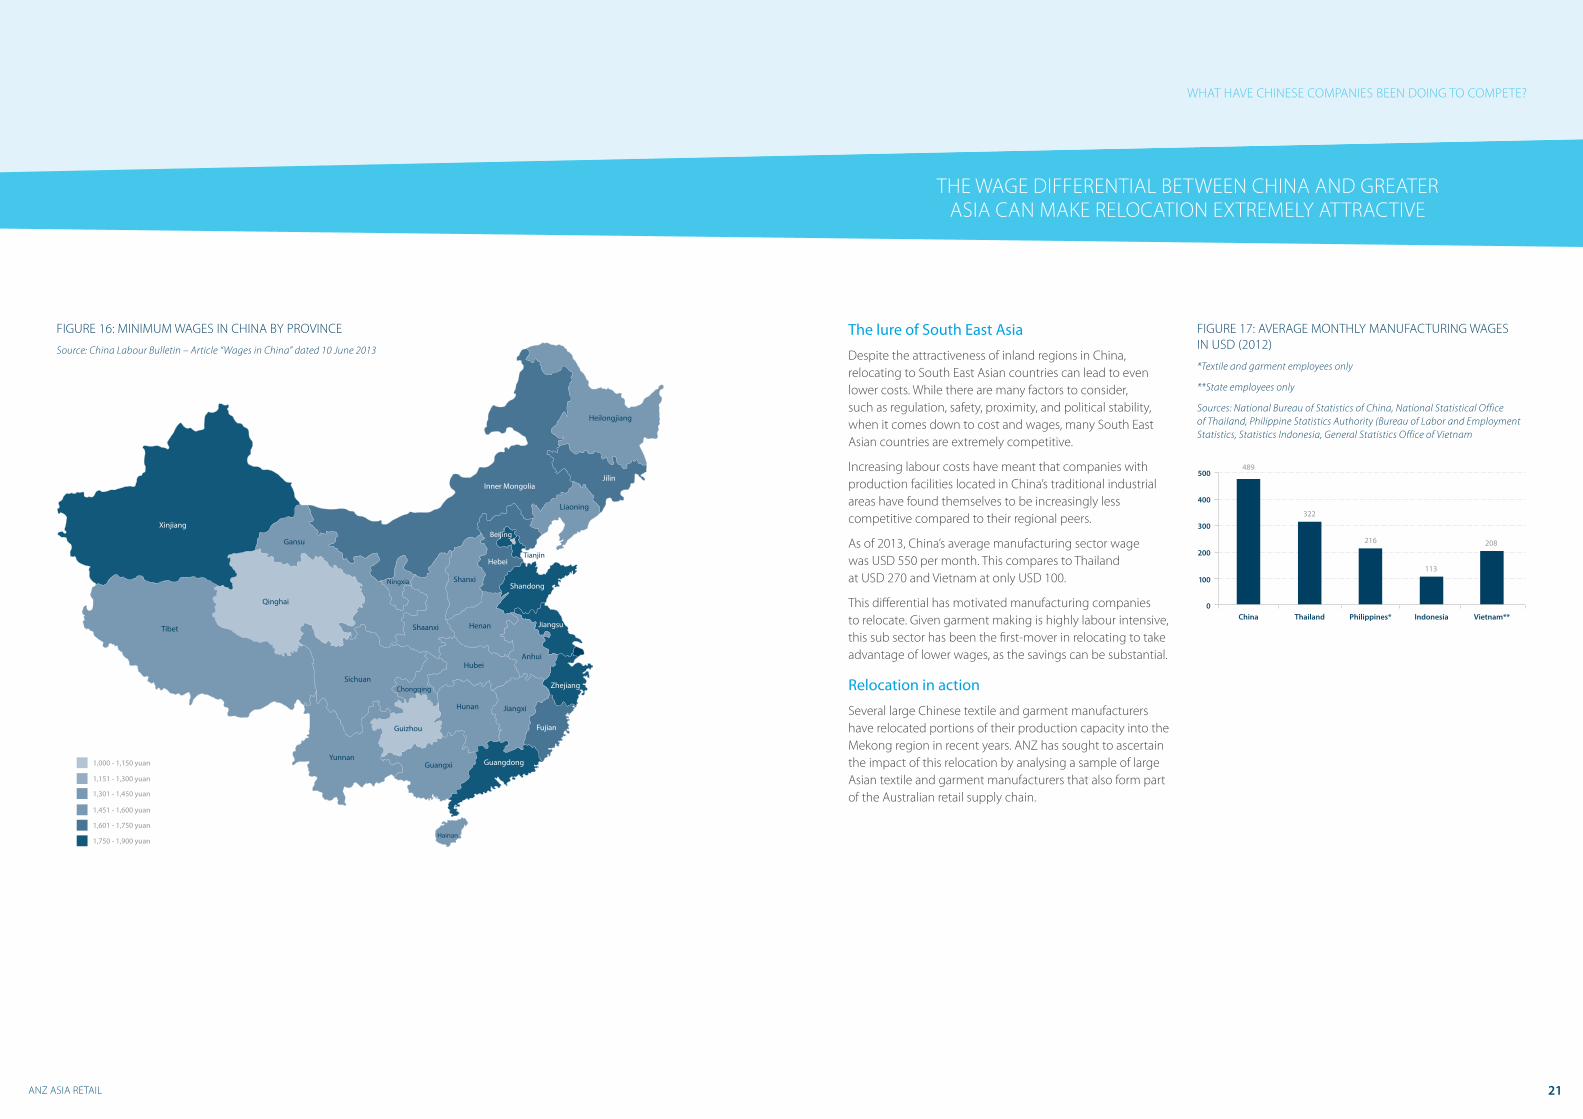
FIGURE 16: MINIMUM WAGES IN CHINA BY PROVINCE
Source: China Labour Bulletin – Article “Wages in China” dated 10 June 2013
ANZ ASIA RETAIL 21
THE WAGE DIFFERENTIAL BETWEEN CHINA AND GREATER ASIA CAN MAKE RELOCATION EXTREMELY ATTRACTIVE
WHAT HAVE CHINESE COMPANIES BEEN DOING TO COMPETE?
The lure of South East Asia
Despite the attractiveness of inland regions in China, relocating to South East Asian countries can lead to even lower costs. While there are many factors to consider, such as regulation, safety, proximity, and political stability, when it comes down to cost and wages, many South East Asian countries are extremely competitive.
Increasing labour costs have meant that companies with production facilities located in China’s traditional industrial areas have found themselves to be increasingly less competitive compared to their regional peers.
As of 2013, China’s average manufacturing sector wage was USD 550 per month. This compares to Thailand at USD 270 and Vietnam at only USD 100.
This differential has motivated manufacturing companies to relocate. Given garment making is highly labour intensive, this sub sector has been the first-mover in relocating to take advantage of lower wages, as the savings can be substantial.
Relocation in action
Several large Chinese textile and garment manufacturers have relocated portions of their production capacity into the Mekong region in recent years. ANZ has sought to ascertain the impact of this relocation by analysing a sample of large Asian textile and garment manufacturers that also form part of the Australian retail supply chain.
FIGURE 17: AVERAGE MONTHLY MANUFACTURING WAGES IN USD (2012)
*Textile and garment employees only
**State employees only
Sources: National Bureau of Statistics of China, National Statistical Office of Thailand, Philippine Statistics Authority (Bureau of Labor and Employment Statistics, Statistics Indonesia, General Statistics Office of Vietnam
China0
100
200
300
400
500
Thailand Philippines* Indonesia Vietnam**
489
322
216
113
208
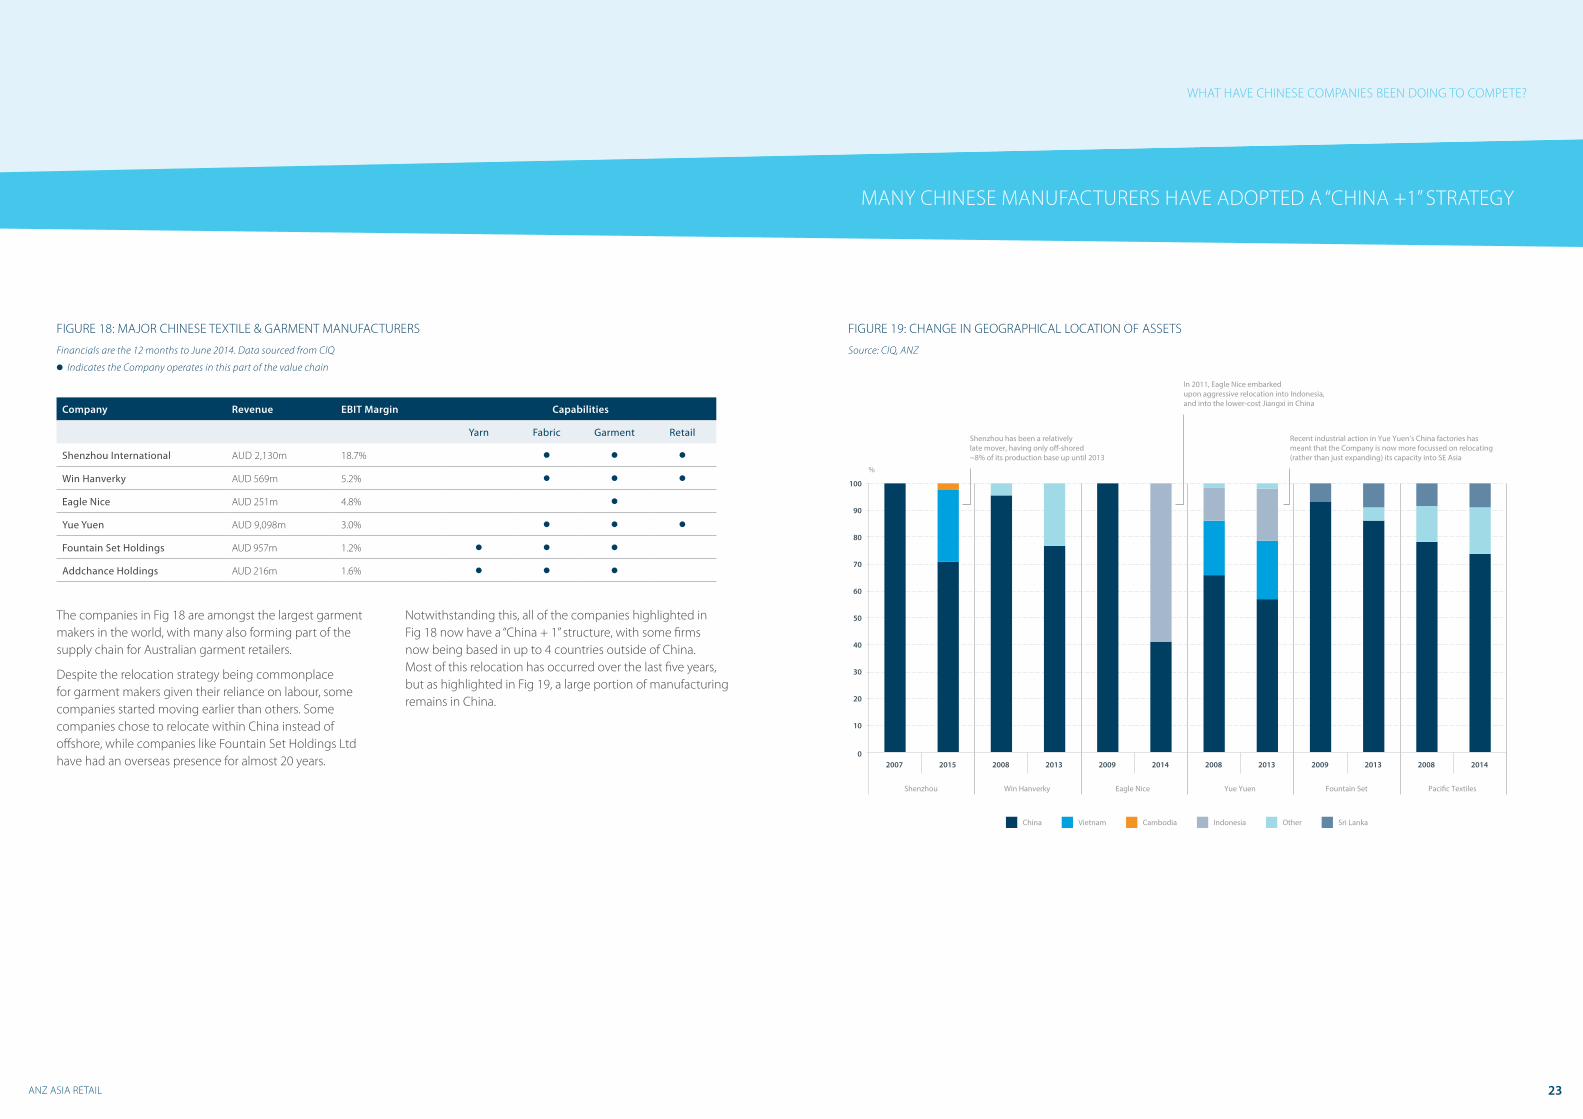
FIGURE 18: MAJOR CHINESE TEXTILE & GARMENT MANUFACTURERS
Financials are the 12 months to June 2014. Data sourced from CIQ
● Indicates the Company operates in this part of the value chain
ANZ ASIA RETAIL
Company Revenue EBIT Margin Capabilities
Yarn Fabric Garment Retail
Shenzhou International AUD 2,130m 18.7% ● ● ●
Win Hanverky AUD 569m 5.2% ● ● ●
Eagle Nice AUD 251m 4.8% ●
Yue Yuen AUD 9,098m 3.0% ● ● ●
Fountain Set Holdings AUD 957m 1.2% ● ● ●
Addchance Holdings AUD 216m 1.6% ● ● ●
The companies in Fig 18 are amongst the largest garment makers in the world, with many also forming part of the supply chain for Australian garment retailers.
Despite the relocation strategy being commonplace for garment makers given their reliance on labour, some companies started moving earlier than others. Some companies chose to relocate within China instead of offshore, while companies like Fountain Set Holdings Ltd have had an overseas presence for almost 20 years.
Notwithstanding this, all of the companies highlighted in Fig 18 now have a “China + 1” structure, with some firms now being based in up to 4 countries outside of China. Most of this relocation has occurred over the last five years, but as highlighted in Fig 19, a large portion of manufacturing remains in China.
23
FIGURE 19: CHANGE IN GEOGRAPHICAL LOCATION OF ASSETS
Source: CIQ, ANZ
WHAT HAVE CHINESE COMPANIES BEEN DOING TO COMPETE?
0
10
20
30
40
50
60
70
80
90
100
2007 2015 2008 2013 2009 2014 2008 2013 2009 2013 2008 2014
Shenzhou
%
Win Hanverky Eagle Nice Yue Yuen Fountain Set Paci�c Textiles
China Vietnam Cambodia Indonesia Other Sri Lanka
Shenzhou has been a relatively late mover, having only o�-shored ~8% of its production base up until 2013
In 2011, Eagle Nice embarked upon aggressive relocation into Indonesia, and into the lower-cost Jiangxi in China
Recent industrial action in Yue Yuen’s China factories has meant that the Company is now more focussed on relocating (rather than just expanding) its capacity into SE Asia
MANY CHINESE MANUFACTURERS HAVE ADOPTED A “CHINA +1” STRATEGY

ANZ ASIA RETAIL
Upstream trend #1 Relocation: Impact for Australian Retailers
The impacts of relocation on Australian Retailers are mixed. Essentially lower labour costs provide for lower garment costs, however sourcing garments from other locations also has additional risks.
Impact 1 – Lower purchase costs (positive)
Cost plus business models are common amongst players in the textiles and garments supply chain, thereby allowing retailers to benefit from upstream labour cost savings.
One example is that of Yue Yuen, the world’s largest original equipment manufacturer of athletic shoes. The Company’s gross margins typically experience short-term fluctuations based on changes in labour costs, but then revert back to medium-term averages.
FIGURE 20: YUE YUEN’S GROSS MARGINS
Source: CIQ
20
21
22
23
24
25
FY10 FY11 FY12 FY13 FY14
%Margin dropped then recovered, in part, due to higher raw material and China labour costs
Margin dropped then recovered on the back of Indonesia labour cost advantages
1. Source: Leonie Barrie, Aroq Ltd, “Sharp fall in Cambodia garment strikes in 2014, January 2015
2. Source: ACCC
3. Source: Cleanclothes.org
25
RELOCATION CAN LEAD TO COST REDUCTIONS FOR AUSTRALIAN RETAILERS, BUT IT CAN ALSO LEAD TO INCREASED RISK
Impact 2 – Lengthened sourcing times due to employee unrest (negative)
Socio-political volatility in South East Asian nations can increase supply chain risks. A prominent example is that of Cambodia, where the garment industry provides one third of the country’s GDP and employs ~600,000 people, who are mostly women.
For years garment industry employees have been striking in search of higher wages. According to the Garment Manufacturers Association in Cambodia, 888,527 days were lost in 2013 due to industrial action, resulting in complaints of disrupted production by H&M, The Gap, Puma and Inditex (Zara), and a cut back in orders from Levi Strauss and Target.
On January 5 2015, the minimum wage in Cambodia was raised to USD 128 per month1, however this fell well short of the USD 140 asked for by workers and unions, and remains a small portion of what employees are paid in China.
Impact 3 – Potential impact on quality (negative)
Australian retailers have been required to recall almost 208,000 items of clothing due to high levels of azo dye. Azo dyes are known to break down to carcinogenic compounds called aromatic amines, although this is only considered to be possible above certain concentration levels.
While the use of azo dye can also be found in China, its use is more prevalent in other developing countries.2 As manufacturers source from emerging ASEAN countries, exposure to risks such as product recalls can increase.
Impact 4 – Reputation damage (negative)
In 2013, a factory in Rana Plaza in Bangladesh collapsed resulting in the death of 1,138 people. The factory was used by many major companies including Zara, H&M, Tesco and The GAP.
Since the collapse more than 150 global brands have signed the Accord on Fire and Building Safety in Bangladesh which enables staff to stop working if their safety is being compromised. Some companies who have refused to sign the agreement have been publicly criticised for their inaction.
Going forward global brands are going to be increasingly held responsible for the behaviours undertaken by their suppliers. Sourcing garments from clothing makers in emerging countries is less transparent than local sourcing, thereby increasing reputational risk and time required in understanding end-to-end supply chains.3
Upstream trend #2 Large brands and the impact of fast fashion
The last decade has seen the emergence of some large global clothing retailers such as H&M, Inditex, The GAP, Topshop, Benetton, Espirit and Uniqlo. The success of these brands has had considerable influence along the textile and garment supply chains. They have positioned supply chains to react very quickly to emerging fashion trends at competitive prices, which have led significant gains in market share.
Many of the larger garment makers have forged stronger ties with these larger retailers. They have followed their customers into new markets, which has led to increased geographic diversification. As this relationship has strengthened it has also meant that these manufacturers do not need to partner with as many customers. While this can create some customer concentration risk for the manufacturer, it also impacts other customers or potential customers.
WHAT HAVE CHINESE COMPANIES BEEN DOING TO COMPETE?
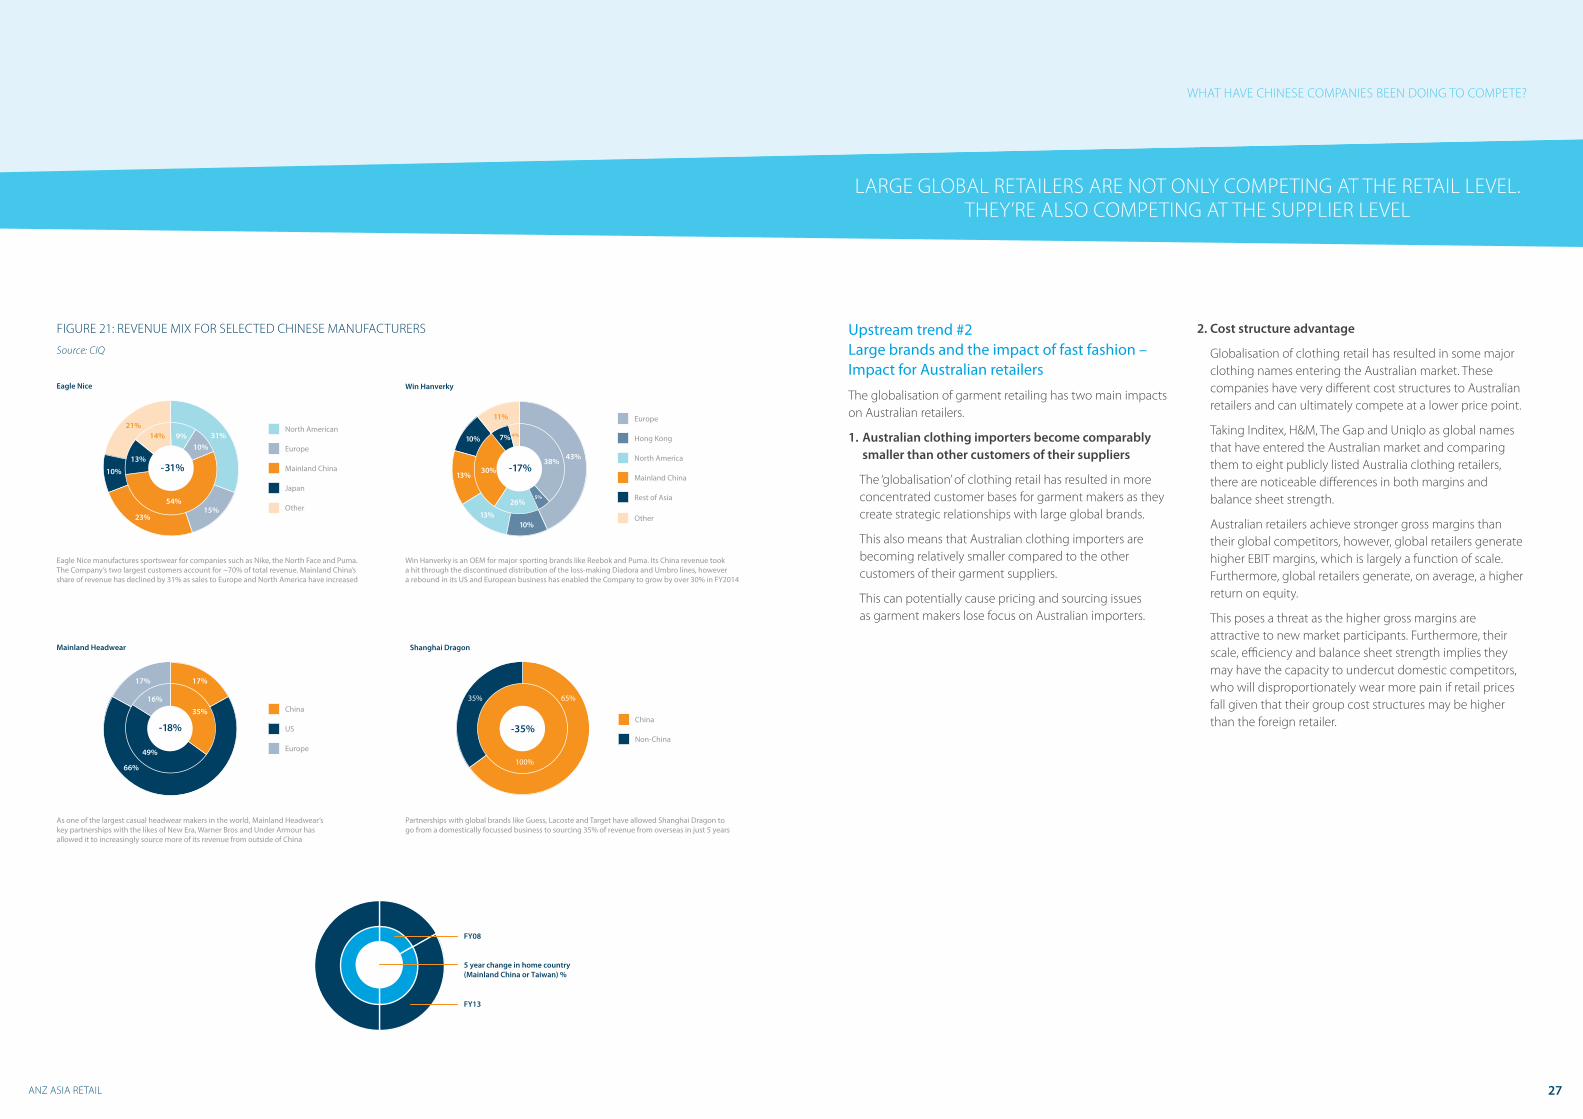
FIGURE 21: REVENUE MIX FOR SELECTED CHINESE MANUFACTURERS
Source: CIQ
ANZ ASIA RETAIL
Eagle Nice manufactures sportswear for companies such as Nike, the North Face and Puma. The Company’s two largest customers account for ~70% of total revenue. Mainland China’s share of revenue has declined by 31% as sales to Europe and North America have increased
North American
Europe
Mainland China
Japan
Other
-31%
21%14% 9%
10%
15%
31%
23%
54%
13%
10%
Eagle Nice
Win Hanverky is an OEM for major sporting brands like Reebok and Puma. Its China revenue took a hit through the discontinued distribution of the loss-making Diadora and Umbro lines, however a rebound in its US and European business has enabled the Company to grow by over 30% in FY2014
Europe
Hong Kong
North America
Mainland China
Rest of Asia
Other
-17%
11%
4%
5%
38%43%
10% 7%
10%
26%
13%30%
13%
Win Hanverky
As one of the largest casual headwear makers in the world, Mainland Headwear’s key partnerships with the likes of New Era, Warner Bros and Under Armour has allowed it to increasingly source more of its revenue from outside of China
China
US
Europe
-18%
66%
49%
35%
17%17%
16%
Mainland Headwear
Partnerships with global brands like Guess, Lacoste and Target have allowed Shanghai Dragon togo from a domestically focussed business to sourcing 35% of revenue from overseas in just 5 years
China
Non-China
65%35%
100%
-35%
Shanghai Dragon
FY08
FY13
5 year change in home country(Mainland China or Taiwan) %
27
Upstream trend #2 Large brands and the impact of fast fashion – Impact for Australian retailers
The globalisation of garment retailing has two main impacts on Australian retailers.
1. Australian clothing importers become comparably smaller than other customers of their suppliers
The ‘globalisation’ of clothing retail has resulted in more concentrated customer bases for garment makers as they create strategic relationships with large global brands.
This also means that Australian clothing importers are becoming relatively smaller compared to the other customers of their garment suppliers.
This can potentially cause pricing and sourcing issues as garment makers lose focus on Australian importers.
WHAT HAVE CHINESE COMPANIES BEEN DOING TO COMPETE?
2. Cost structure advantage
Globalisation of clothing retail has resulted in some major clothing names entering the Australian market. These companies have very different cost structures to Australian retailers and can ultimately compete at a lower price point.
Taking Inditex, H&M, The Gap and Uniqlo as global names that have entered the Australian market and comparing them to eight publicly listed Australia clothing retailers, there are noticeable differences in both margins and balance sheet strength.
Australian retailers achieve stronger gross margins than their global competitors, however, global retailers generate higher EBIT margins, which is largely a function of scale. Furthermore, global retailers generate, on average, a higher return on equity.
This poses a threat as the higher gross margins are attractive to new market participants. Furthermore, their scale, efficiency and balance sheet strength implies they may have the capacity to undercut domestic competitors, who will disproportionately wear more pain if retail prices fall given that their group cost structures may be higher than the foreign retailer.
LARGE GLOBAL RETAILERS ARE NOT ONLY COMPETING AT THE RETAIL LEVEL. THEY’RE ALSO COMPETING AT THE SUPPLIER LEVEL
ANZ ASIA RETAIL
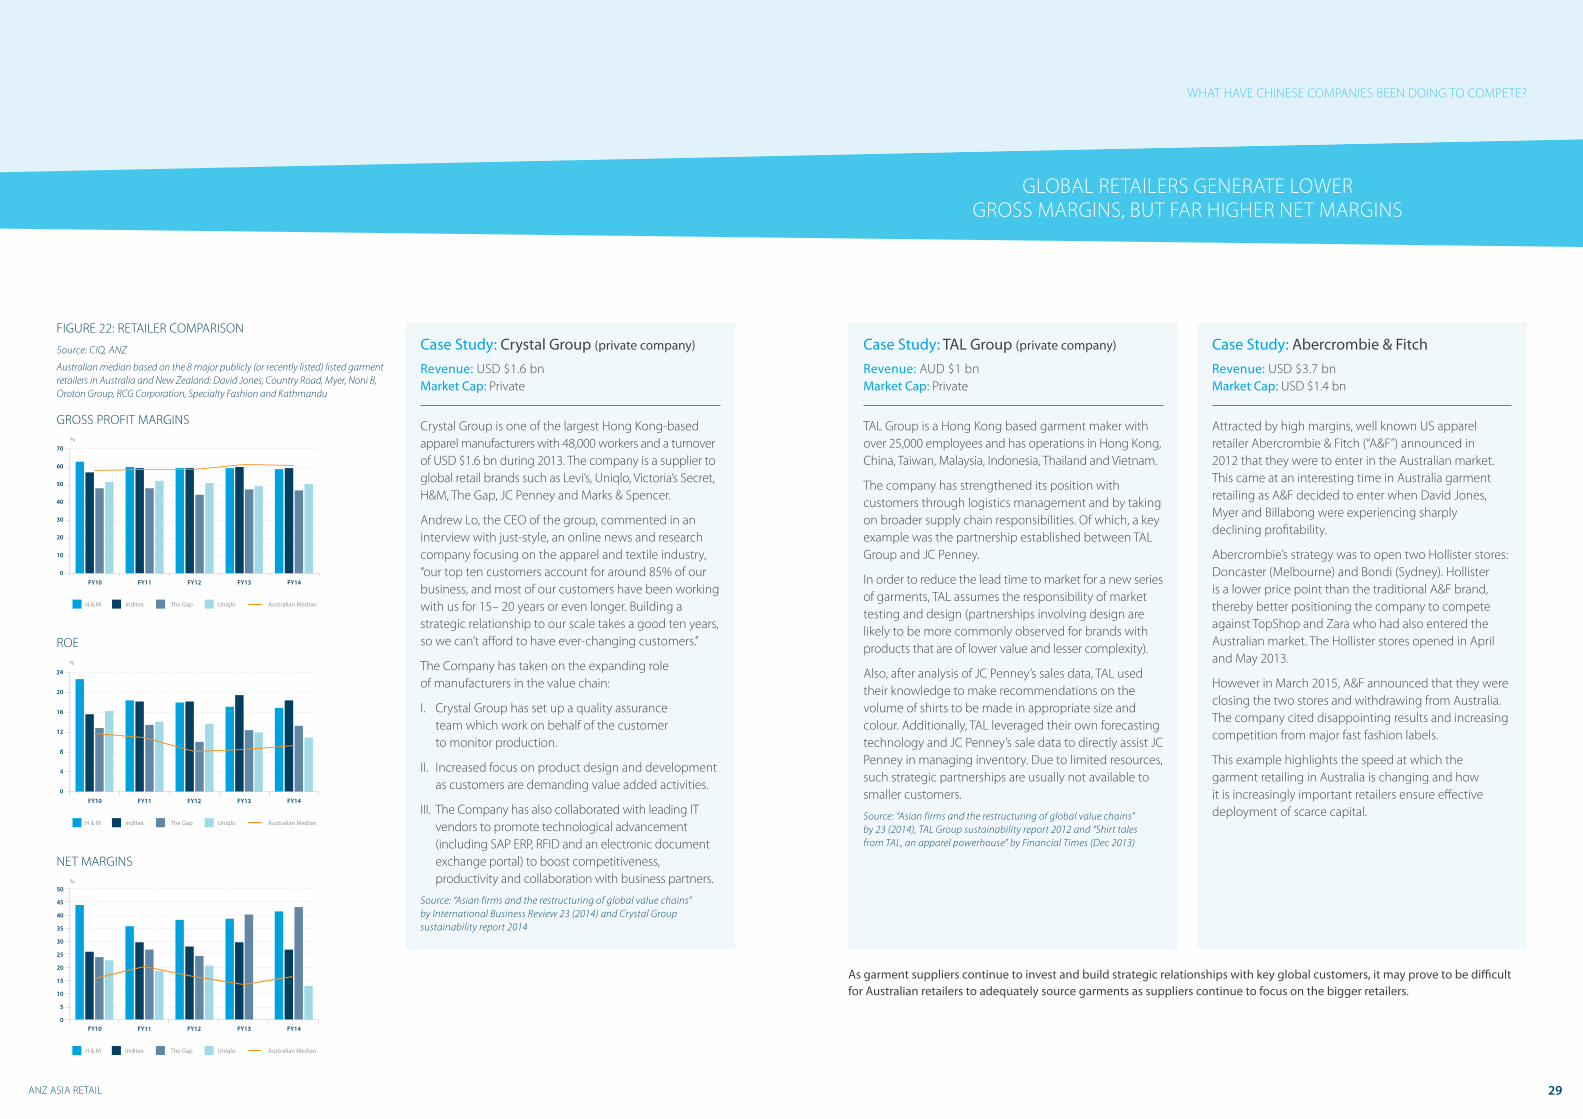
Case Study: Crystal Group (private company)
Revenue: USD $1.6 bnMarket Cap: Private
Crystal Group is one of the largest Hong Kong-based apparel manufacturers with 48,000 workers and a turnover of USD $1.6 bn during 2013. The company is a supplier to global retail brands such as Levi’s, Uniqlo, Victoria’s Secret, H&M, The Gap, JC Penney and Marks & Spencer.
Andrew Lo, the CEO of the group, commented in an interview with just-style, an online news and research company focusing on the apparel and textile industry, “our top ten customers account for around 85% of our business, and most of our customers have been working with us for 15– 20 years or even longer. Building a strategic relationship to our scale takes a good ten years, so we can’t afford to have ever-changing customers.”
The Company has taken on the expanding role of manufacturers in the value chain:
I. Crystal Group has set up a quality assurance team which work on behalf of the customer to monitor production.
II. Increased focus on product design and development as customers are demanding value added activities.
III. The Company has also collaborated with leading IT vendors to promote technological advancement (including SAP ERP, RFID and an electronic document exchange portal) to boost competitiveness, productivity and collaboration with business partners.
Source: “Asian firms and the restructuring of global value chains” by International Business Review 23 (2014) and Crystal Group sustainability report 2014
Case Study: TAL Group (private company)
Revenue: AUD $1 bnMarket Cap: Private
TAL Group is a Hong Kong based garment maker with over 25,000 employees and has operations in Hong Kong, China, Taiwan, Malaysia, Indonesia, Thailand and Vietnam.
The company has strengthened its position with customers through logistics management and by taking on broader supply chain responsibilities. Of which, a key example was the partnership established between TAL Group and JC Penney.
In order to reduce the lead time to market for a new series of garments, TAL assumes the responsibility of market testing and design (partnerships involving design are likely to be more commonly observed for brands with products that are of lower value and lesser complexity).
Also, after analysis of JC Penney’s sales data, TAL used their knowledge to make recommendations on the volume of shirts to be made in appropriate size and colour. Additionally, TAL leveraged their own forecasting technology and JC Penney’s sale data to directly assist JC Penney in managing inventory. Due to limited resources, such strategic partnerships are usually not available to smaller customers.
Source: “Asian firms and the restructuring of global value chains” by 23 (2014), TAL Group sustainability report 2012 and “Shirt tales from TAL, an apparel powerhouse” by Financial Times (Dec 2013)
WHAT HAVE CHINESE COMPANIES BEEN DOING TO COMPETE?
Case Study: Abercrombie & Fitch
Revenue: USD $3.7 bnMarket Cap: USD $1.4 bn
Attracted by high margins, well known US apparel retailer Abercrombie & Fitch (“A&F”) announced in 2012 that they were to enter in the Australian market. This came at an interesting time in Australia garment retailing as A&F decided to enter when David Jones, Myer and Billabong were experiencing sharply declining profitability.
Abercrombie’s strategy was to open two Hollister stores: Doncaster (Melbourne) and Bondi (Sydney). Hollister is a lower price point than the traditional A&F brand, thereby better positioning the company to compete against TopShop and Zara who had also entered the Australian market. The Hollister stores opened in April and May 2013.
However in March 2015, A&F announced that they were closing the two stores and withdrawing from Australia. The company cited disappointing results and increasing competition from major fast fashion labels.
This example highlights the speed at which the garment retailing in Australia is changing and how it is increasingly important retailers ensure effective deployment of scarce capital.
As garment suppliers continue to invest and build strategic relationships with key global customers, it may prove to be difficult for Australian retailers to adequately source garments as suppliers continue to focus on the bigger retailers.
29
0
4
8
12
16
20
24%
FY10 FY11 FY12 FY13 FY14
H & M Inditex The Gap Uniqlo Australian Median
FIGURE 22: RETAILER COMPARISON
Source: CIQ, ANZ
Australian median based on the 8 major publicly (or recently listed) listed garment retailers in Australia and New Zealand: David Jones, Country Road, Myer, Noni B, Oroton Group, RCG Corporation, Specialty Fashion and Kathmandu
GROSS PROFIT MARGINS
ROE
NET MARGINS
0
10
20
30
40
50
60
70
FY10 FY11 FY12 FY13 FY14
%
H & M Inditex The Gap Uniqlo Australian Median
0
5
10
15
20
25
30
35
40
45
50%
FY10 FY11 FY12 FY13 FY14
H & M Inditex The Gap Uniqlo Australian Median
GLOBAL RETAILERS GENERATE LOWER GROSS MARGINS, BUT FAR HIGHER NET MARGINS

ANZ ASIA RETAIL
Upstream trend #3 The migration of textile & garment players towards higher margin products
Due to margin compression in lower value garments, many textile and garments players are searching for higher margin products. This theme applies along the supply chain, from yarn spinners to garment makers.
Evidence of this change can be found in the types of machinery that’s imported into China. According to the China Textile Machinery and Accessories Association, between 2000 and 2012, the portion of imports of chemical fibre machinery increased from 6% to 22% of total imports. At the same time, imports of traditional equipment (i.e. weaving, dyeing and knitting) significantly declined.
Products made with chemical fibres include sports or active wear as well as lingerie and are typically of higher value than traditional garments.
MANY TEXTILE AND GARMENTS PLAYERS ARE SEARCHING FOR HIGHER MARGIN PRODUCTS
WHAT HAVE CHINESE COMPANIES BEEN DOING TO COMPETE?
Case Study: Texhong
Revenue: AUD $1.8 bnMarket Cap: AUD $960 m
Yarn manufacturing is a relatively low value-add segment within the textiles value chain.
Core-spun yarn, where fibres are twisted around an existing yarn to enhance its durability and stretch, commands higher gross margins which are on par with downstream fabric makers.
During 2013, the average selling price for cotton core-spun yarn was USD 4.45 per kilogram against USD 4.10 for 100% cotton yarn. This highlights the difference created by the differentiated value-add products and also the appeal of moving up the value chain.
Texhong has focused on core-spun yarn which has increased its’ share of total revenue from 79% to 94%. During FY2013, the Company has also managed to increase margins in core-spun yarn from 17.7% to 22.4%.
Production facilities in Mainland China are increasingly focusing on differentiated and higher value-add products.
0
25
50
75
100
FY08 FY09 FY10 FY11 FY12 FY13
%
Yarn Grey Fabrics Garment Fabrics
%
FY12 FY13
0
6
12
18
24
Core-Spun Yarn Other Yarns Fabrics
REVENUE BY SEGMENT FOR TEXHONG
GROSS PROFIT MARGIN FOR TEXHONG BY PRODUCT
31
Upstream trend #3 The migration of Textile & Garment players towards higher margin products: Impact on Australian retailers
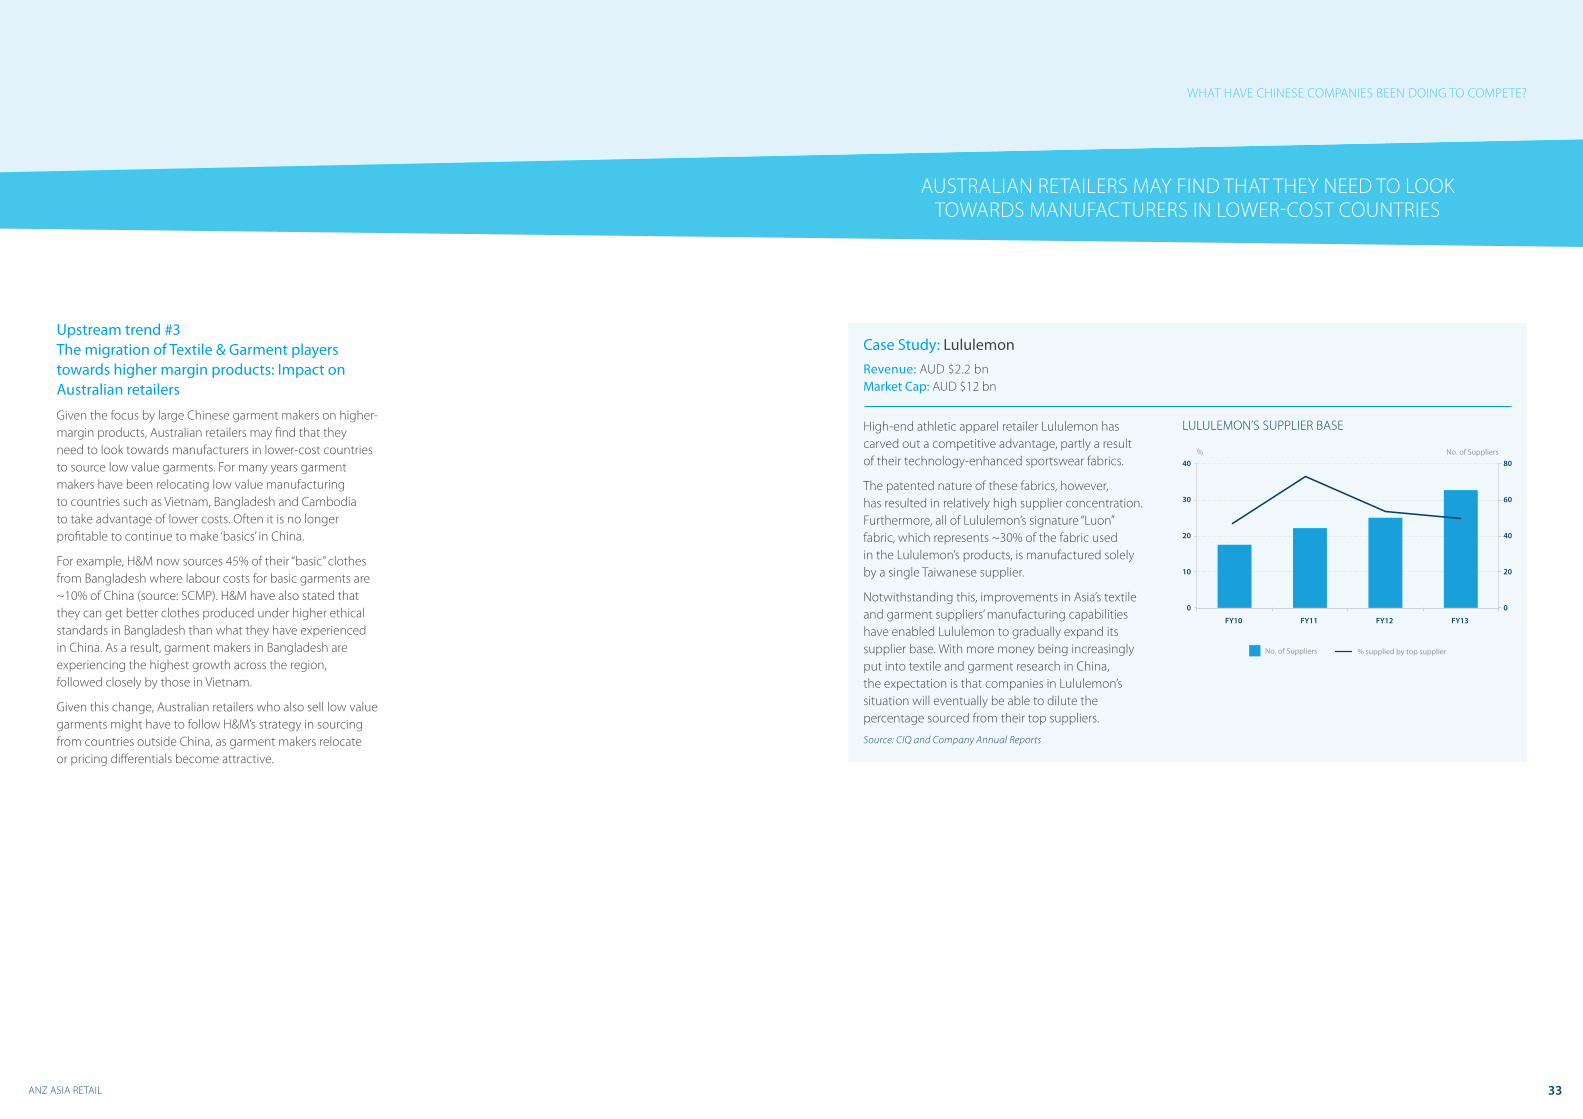
Given the focus by large Chinese garment makers on higher-margin products, Australian retailers may find that they need to look towards manufacturers in lower-cost countries to source low value garments. For many years garment makers have been relocating low value manufacturing to countries such as Vietnam, Bangladesh and Cambodia to take advantage of lower costs. Often it is no longer profitable to continue to make ‘basics’ in China.
For example, H&M now sources 45% of their “basic” clothes from Bangladesh where labour costs for basic garments are ~10% of China (source: SCMP). H&M have also stated that they can get better clothes produced under higher ethical standards in Bangladesh than what they have experienced in China. As a result, garment makers in Bangladesh are experiencing the highest growth across the region, followed closely by those in Vietnam.
Given this change, Australian retailers who also sell low value garments might have to follow H&M’s strategy in sourcing from countries outside China, as garment makers relocate or pricing differentials become attractive.
ANZ ASIA RETAIL
AUSTRALIAN RETAILERS MAY FIND THAT THEY NEED TO LOOK TOWARDS MANUFACTURERS IN LOWER-COST COUNTRIES
WHAT HAVE CHINESE COMPANIES BEEN DOING TO COMPETE?
Case Study: Lululemon
Revenue: AUD $2.2 bnMarket Cap: AUD $12 bn
High-end athletic apparel retailer Lululemon has carved out a competitive advantage, partly a result of their technology-enhanced sportswear fabrics.
The patented nature of these fabrics, however, has resulted in relatively high supplier concentration. Furthermore, all of Lululemon’s signature “Luon” fabric, which represents ~30% of the fabric used in the Lululemon’s products, is manufactured solely by a single Taiwanese supplier.
Notwithstanding this, improvements in Asia’s textile and garment suppliers’ manufacturing capabilities have enabled Lululemon to gradually expand its supplier base. With more money being increasingly put into textile and garment research in China, the expectation is that companies in Lululemon’s situation will eventually be able to dilute the percentage sourced from their top suppliers.
Source: CIQ and Company Annual Reports
LULULEMON’S SUPPLIER BASE
0
10
20
30
40
0
20
40
60
80
FY10 FY11 FY12 FY13
% No. of Suppliers
% supplied by top supplierNo. of Suppliers
33
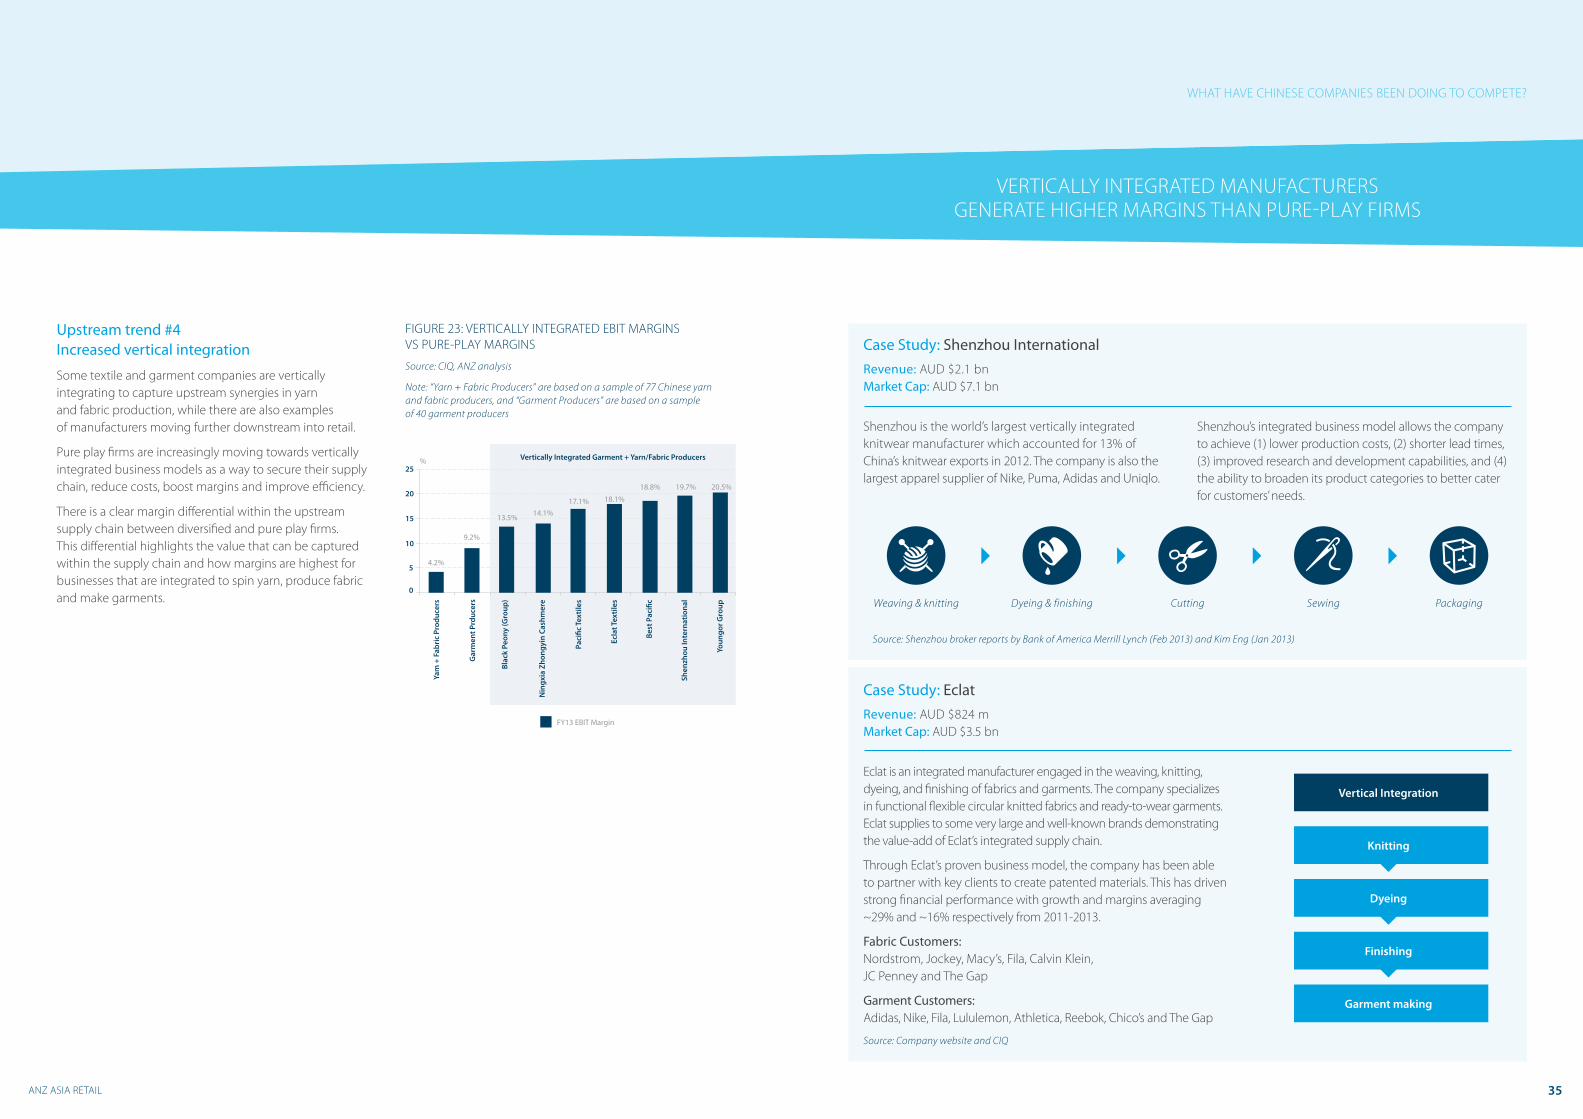
Upstream trend #4 Increased vertical integration
Some textile and garment companies are vertically integrating to capture upstream synergies in yarn and fabric production, while there are also examples of manufacturers moving further downstream into retail.
Pure play firms are increasingly moving towards vertically integrated business models as a way to secure their supply chain, reduce costs, boost margins and improve efficiency.
There is a clear margin differential within the upstream supply chain between diversified and pure play firms. This differential highlights the value that can be captured within the supply chain and how margins are highest for businesses that are integrated to spin yarn, produce fabric and make garments.
FIGURE 23: VERTICALLY INTEGRATED EBIT MARGINS VS PURE-PLAY MARGINS
Source: CIQ, ANZ analysis
Note: “Yarn + Fabric Producers” are based on a sample of 77 Chinese yarn and fabric producers, and “Garment Producers” are based on a sample of 40 garment producers
ANZ ASIA RETAIL
Vertically Integrated Garment + Yarn/Fabric Producers
Yam
+ F
abri
c Pr
oduc
ers
Gar
men
t Prd
ucer
s
Blac
k Pe
ony
(Gro
up)
Nin
gxia
Zho
ngyi
n Ca
shm
ere
Paci
�c T
extil
es
Ecla
t Tex
tiles
Best
Pac
i�c
Shen
zhou
Inte
rnat
iona
l
Youn
gor G
roup
FY13 EBIT Margin
%
4.2%
9.2%
13.5% 14.1%17.1% 18.1%
18.8% 19.7% 20.5%
5
10
15
20
25
0
WHAT HAVE CHINESE COMPANIES BEEN DOING TO COMPETE?
Case Study: Eclat
Revenue: AUD $824 mMarket Cap: AUD $3.5 bn
Eclat is an integrated manufacturer engaged in the weaving, knitting, dyeing, and finishing of fabrics and garments. The company specializes in functional flexible circular knitted fabrics and ready-to-wear garments. Eclat supplies to some very large and well-known brands demonstrating the value-add of Eclat’s integrated supply chain.
Through Eclat’s proven business model, the company has been able to partner with key clients to create patented materials. This has driven strong financial performance with growth and margins averaging ~29% and ~16% respectively from 2011-2013.
Fabric Customers: Nordstrom, Jockey, Macy’s, Fila, Calvin Klein, JC Penney and The Gap
Garment Customers: Adidas, Nike, Fila, Lululemon, Athletica, Reebok, Chico’s and The Gap
Case Study: Shenzhou International
Revenue: AUD $2.1 bnMarket Cap: AUD $7.1 bn
Shenzhou is the world’s largest vertically integrated knitwear manufacturer which accounted for 13% of China’s knitwear exports in 2012. The company is also the largest apparel supplier of Nike, Puma, Adidas and Uniqlo.
Weaving & knitting Dyeing & finishing Cutting Sewing Packaging
Knitting
Dyeing
Finishing
Garment making
Vertical Integration
Shenzhou’s integrated business model allows the company to achieve (1) lower production costs, (2) shorter lead times, (3) improved research and development capabilities, and (4) the ability to broaden its product categories to better cater for customers’ needs.
Source: Shenzhou broker reports by Bank of America Merrill Lynch (Feb 2013) and Kim Eng (Jan 2013)
Source: Company website and CIQ
35
VERTICALLY INTEGRATED MANUFACTURERS GENERATE HIGHER MARGINS THAN PURE-PLAY FIRMS
Upstream trend #4 Increased vertical integration – Impact on Australian retailers
To date, vertical integration amongst Chinese manufacturers has been further upstream, as upstream consolidation can lead to higher margins and cost efficiencies. This is mildly positive for Australian retailers, as these efficiencies could lead to lower prices, however, this will be partially offset by lower negotiating power, as the manufacturer is likely to be much larger in scale. This could impact trade terms and volume discounts.
There has been some evidence of Chinese textile and garment companies moving downstream into retail (See Win Hanverky case study). Clearly any new competitor into the Australian market would not be positive, however, in the context of the Australian market this poses little to no threat in the medium term. The basis for this view is:
1. Most Chinese manufacturers do not have a brand following in Australia or design capability.
2. Unlike other foreign retailers entering the Australian market, these businesses are first and foremost manufacturers, and not retailers. Few have demonstrated a capability to succeed downstream in retail markets.
3. The domestic retail market in China is large and is likely to be far more attractive compared to a developed and extremely competitive Australian market. There is little rationale to expand overseas when opportunities at home are stronger.
ANZ ASIA RETAIL
A NUMBER OF CHINESE MANUFACTURERS HAVE SOUGHT TO VERTICALLY INTEGRATE
WHAT HAVE CHINESE COMPANIES BEEN DOING TO COMPETE?
Case Study: Win Hanverky
Revenue: AUD $562 mMarket Cap: AUD $233 m
Win Hanverky is an integrated sportswear manufacturer and distributor for international sports and fashion brands. The company has diversified into the high-end fashion retail business to capitalise from increasing disposable incomes in China.
The company’s gross profit margin increased from ~26% in FY2013 to ~29% in June FY2014, which was primarily driven by the incorporation of their retail business
(Shine Gold Group) since 1 November 2013. Their EBIT margin, however, declined from 5.9% to 5.2% due to an increase in other operating costs.
While it might still be relatively early to determine whether the vertical integration will be a success, the company believes it can grow revenue and improve margins as they realise synergies from the new business model and improve the efficiency of existing shops.
37
ANZ OPPORTUNITY CHINA
DIRECT SOURCING IN A LOWER AUD ENVIRONMENT
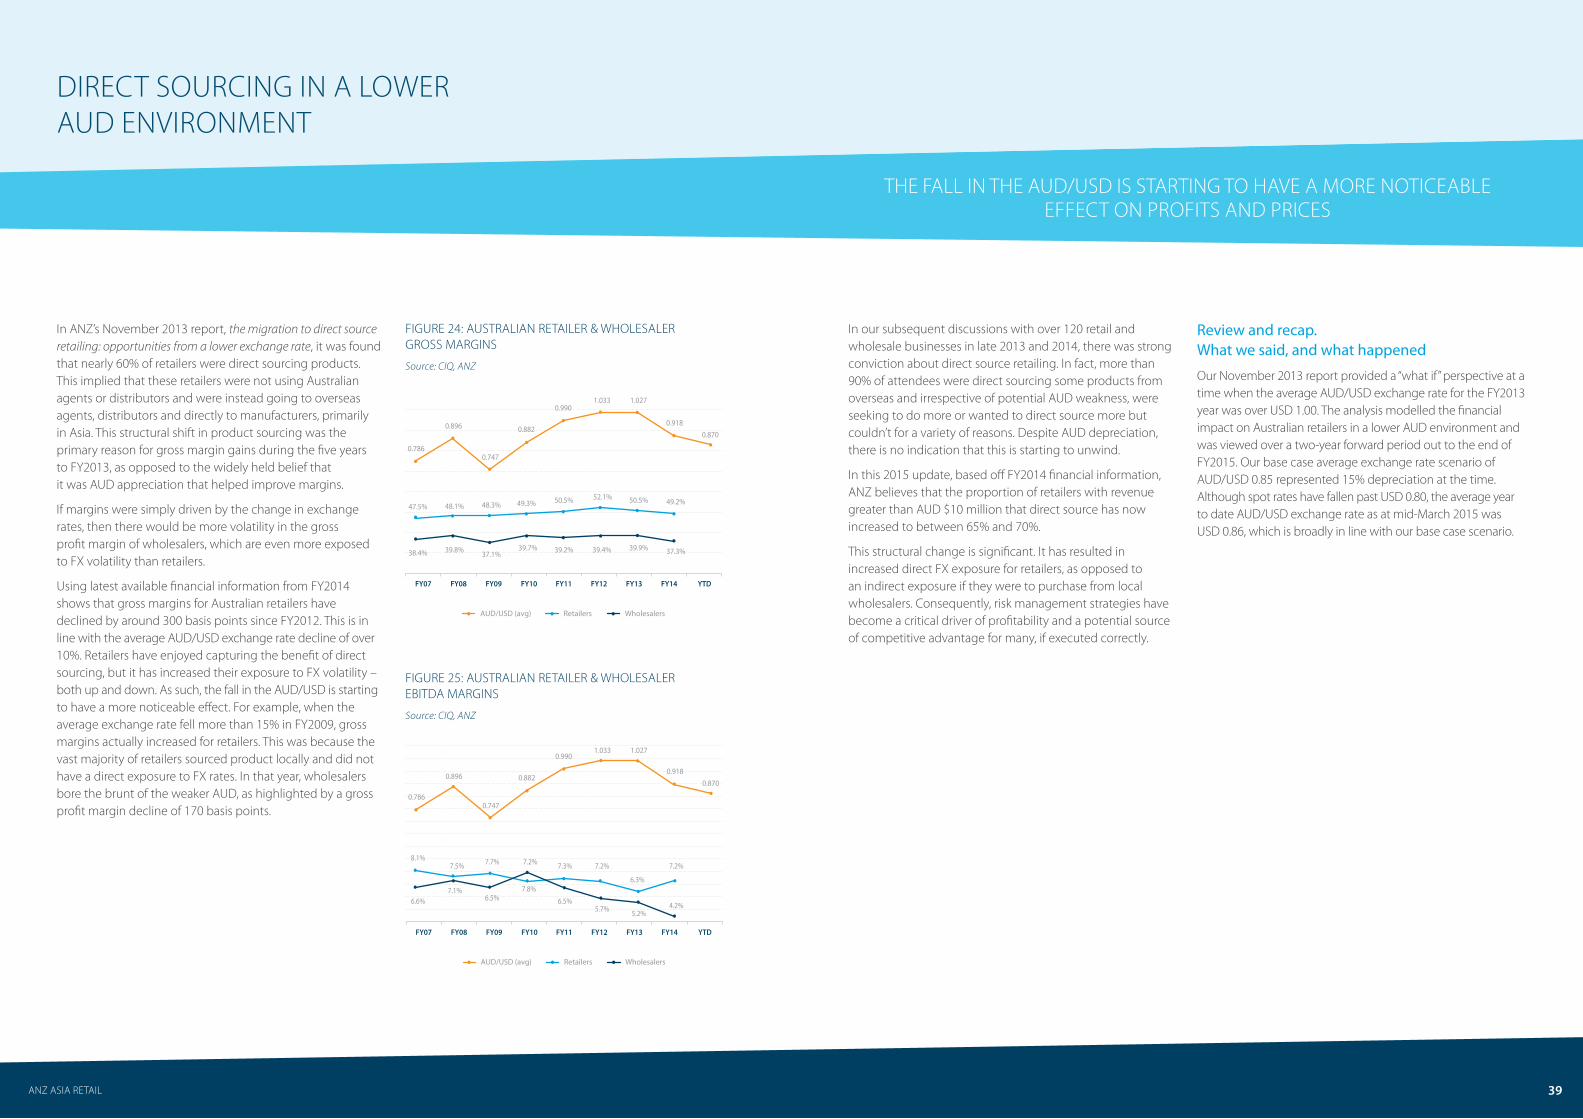
In ANZ’s November 2013 report, the migration to direct source retailing: opportunities from a lower exchange rate, it was found that nearly 60% of retailers were direct sourcing products. This implied that these retailers were not using Australian agents or distributors and were instead going to overseas agents, distributors and directly to manufacturers, primarily in Asia. This structural shift in product sourcing was the primary reason for gross margin gains during the five years to FY2013, as opposed to the widely held belief that it was AUD appreciation that helped improve margins.
If margins were simply driven by the change in exchange rates, then there would be more volatility in the gross profit margin of wholesalers, which are even more exposed to FX volatility than retailers.
Using latest available financial information from FY2014 shows that gross margins for Australian retailers have declined by around 300 basis points since FY2012. This is in line with the average AUD/USD exchange rate decline of over 10%. Retailers have enjoyed capturing the benefit of direct sourcing, but it has increased their exposure to FX volatility – both up and down. As such, the fall in the AUD/USD is starting to have a more noticeable effect. For example, when the average exchange rate fell more than 15% in FY2009, gross margins actually increased for retailers. This was because the vast majority of retailers sourced product locally and did not have a direct exposure to FX rates. In that year, wholesalers bore the brunt of the weaker AUD, as highlighted by a gross profit margin decline of 170 basis points.
ANZ ASIA RETAIL
FIGURE 24: AUSTRALIAN RETAILER & WHOLESALER GROSS MARGINS
Source: CIQ, ANZ
FIGURE 25: AUSTRALIAN RETAILER & WHOLESALER EBITDA MARGINS
Source: CIQ, ANZ
FY07 FY08 FY09 FY10 FY11 FY12 FY13 FY14 YTD
0.786
47.5%
38.4% 39.8% 37.1%39.7% 39.2% 39.4% 39.9% 37.3%
48.1% 48.3% 49.3% 50.5% 52.1% 50.5% 49.2%
0.896
0.747
0.882
0.9901.033 1.027
0.9180.870
Retailers WholesalersAUD/USD (avg)
0.786
0.896
0.747
0.882
0.9901.033 1.027
0.9180.870
8.1%
6.6%7.1%
6.5%7.8%
6.5%5.7% 5.2%
4.2%
7.5% 7.7% 7.2% 7.3% 7.2%
6.3%
7.2%
FY07 FY08 FY09 FY10 FY11 FY12 FY13 FY14 YTD
Retailers WholesalersAUD/USD (avg)
In our subsequent discussions with over 120 retail and wholesale businesses in late 2013 and 2014, there was strong conviction about direct source retailing. In fact, more than 90% of attendees were direct sourcing some products from overseas and irrespective of potential AUD weakness, were seeking to do more or wanted to direct source more but couldn’t for a variety of reasons. Despite AUD depreciation, there is no indication that this is starting to unwind.
In this 2015 update, based off FY2014 financial information, ANZ believes that the proportion of retailers with revenue greater than AUD $10 million that direct source has now increased to between 65% and 70%.
This structural change is significant. It has resulted in increased direct FX exposure for retailers, as opposed to an indirect exposure if they were to purchase from local wholesalers. Consequently, risk management strategies have become a critical driver of profitability and a potential source of competitive advantage for many, if executed correctly.
Review and recap. What we said, and what happened
Our November 2013 report provided a “what if” perspective at a time when the average AUD/USD exchange rate for the FY2013 year was over USD 1.00. The analysis modelled the financial impact on Australian retailers in a lower AUD environment and was viewed over a two-year forward period out to the end of FY2015. Our base case average exchange rate scenario of AUD/USD 0.85 represented 15% depreciation at the time. Although spot rates have fallen past USD 0.80, the average year to date AUD/USD exchange rate as at mid-March 2015 was USD 0.86, which is broadly in line with our base case scenario.
THE FALL IN THE AUD/USD IS STARTING TO HAVE A MORE NOTICEABLE EFFECT ON PROFITS AND PRICES
39
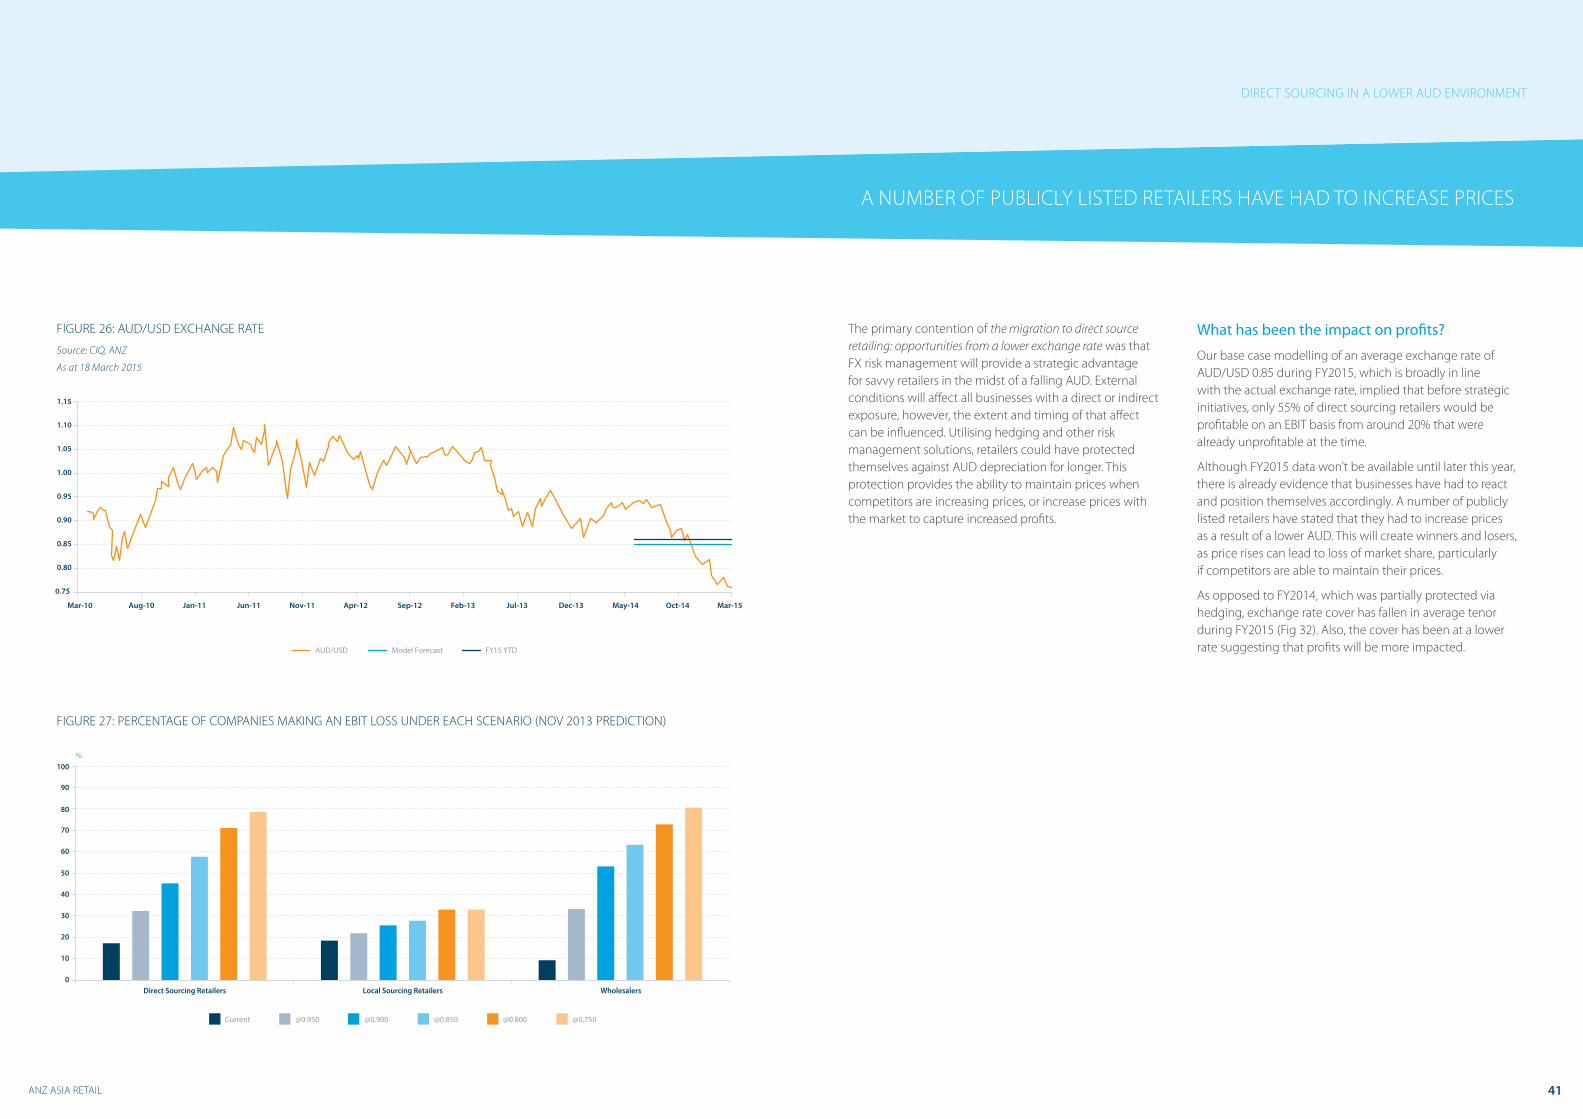
FIGURE 26: AUD/USD EXCHANGE RATE
Source: CIQ, ANZ
As at 18 March 2015
FIGURE 27: PERCENTAGE OF COMPANIES MAKING AN EBIT LOSS UNDER EACH SCENARIO (NOV 2013 PREDICTION)
ANZ ASIA RETAIL
100
90
80
70
60
50
40
30
20
10
0Direct Sourcing Retailers Local Sourcing Retailers Wholesalers
@0.950 @0.900 @0.850Current @[email protected]
%
0.75
0.80
0.85
0.90
0.95
1.00
1.05
1.10
1.15
AUD/USD Model Forecast FY15 YTD
Mar-10 Aug-10 Jan-11 Jun-11 Nov-11 Apr-12 Sep-12 Feb-13 Jul-13 Dec-13 May-14 Oct-14 Mar-15
A NUMBER OF PUBLICLY LISTED RETAILERS HAVE HAD TO INCREASE PRICES
DIRECT SOURCING IN A LOWER AUD ENVIRONMENT
The primary contention of the migration to direct source retailing: opportunities from a lower exchange rate was that FX risk management will provide a strategic advantage for savvy retailers in the midst of a falling AUD. External conditions will affect all businesses with a direct or indirect exposure, however, the extent and timing of that affect can be influenced. Utilising hedging and other risk management solutions, retailers could have protected themselves against AUD depreciation for longer. This protection provides the ability to maintain prices when competitors are increasing prices, or increase prices with the market to capture increased profits.
What has been the impact on profits?
Our base case modelling of an average exchange rate of AUD/USD 0.85 during FY2015, which is broadly in line with the actual exchange rate, implied that before strategic initiatives, only 55% of direct sourcing retailers would be profitable on an EBIT basis from around 20% that were already unprofitable at the time.
Although FY2015 data won’t be available until later this year, there is already evidence that businesses have had to react and position themselves accordingly. A number of publicly listed retailers have stated that they had to increase prices as a result of a lower AUD. This will create winners and losers, as price rises can lead to loss of market share, particularly if competitors are able to maintain their prices.
As opposed to FY2014, which was partially protected via hedging, exchange rate cover has fallen in average tenor during FY2015 (Fig 32). Also, the cover has been at a lower rate suggesting that profits will be more impacted.
41
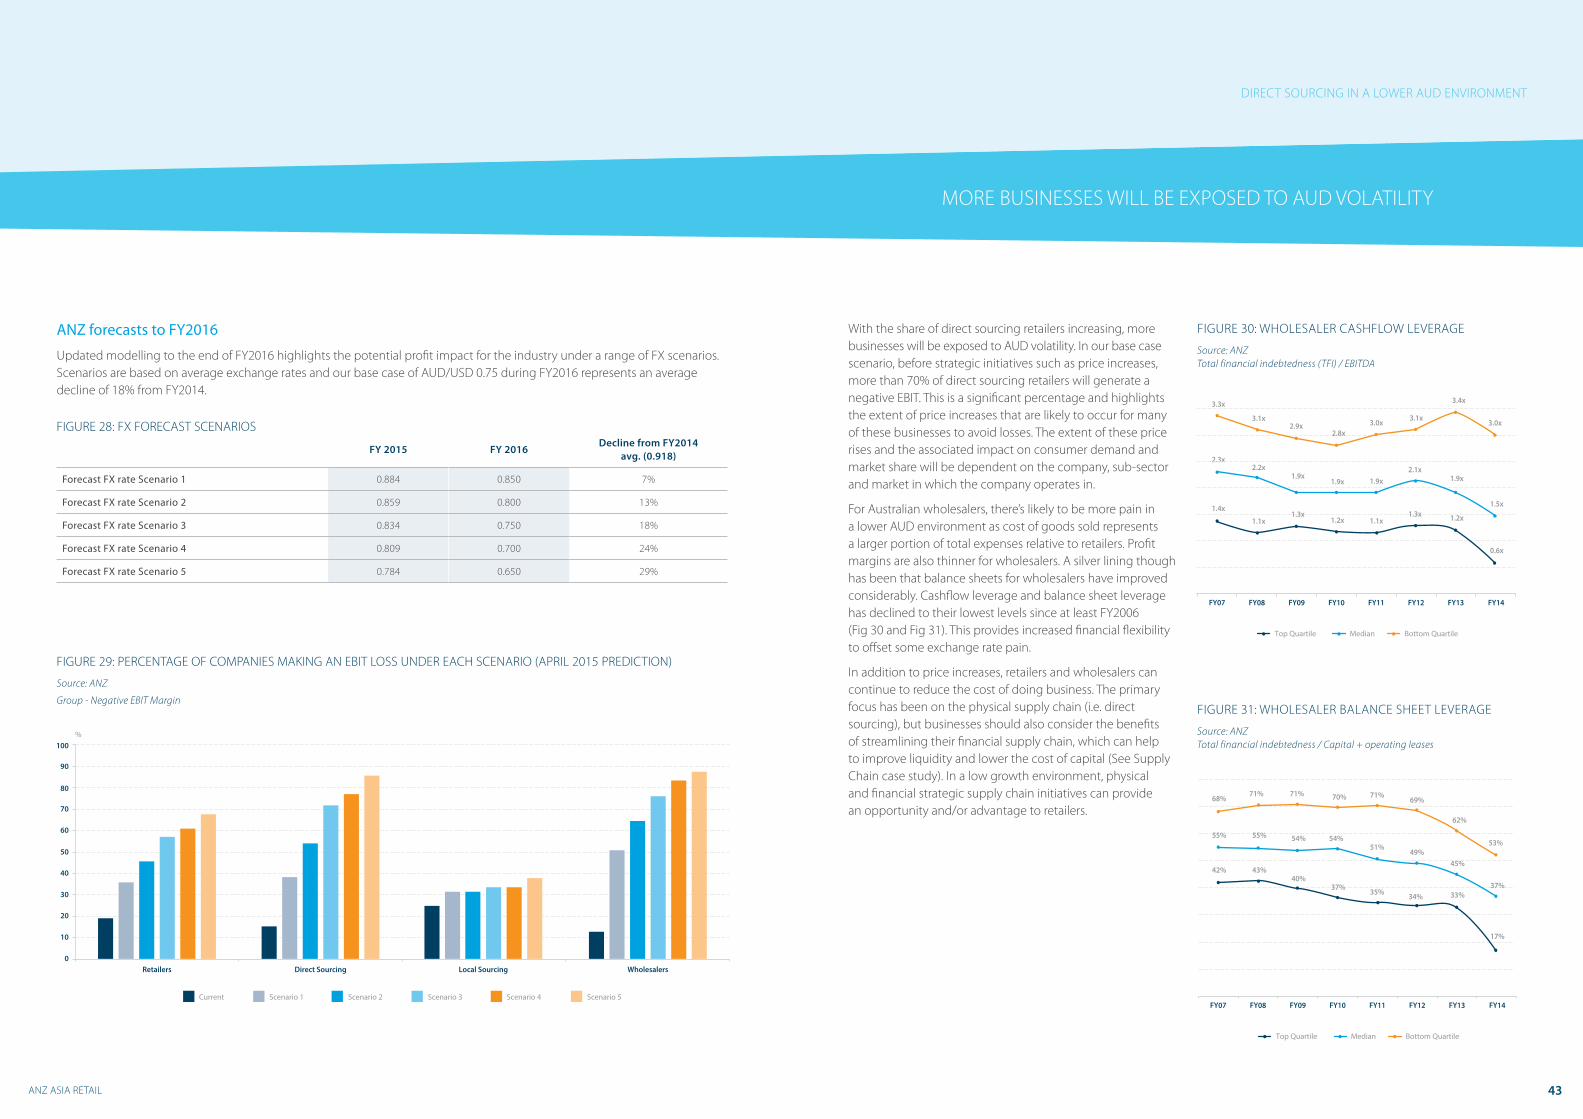
FIGURE 28: FX FORECAST SCENARIOS
FIGURE 29: PERCENTAGE OF COMPANIES MAKING AN EBIT LOSS UNDER EACH SCENARIO (APRIL 2015 PREDICTION)
Source: ANZ
Group - Negative EBIT Margin
ANZ ASIA RETAIL
FY 2015 FY 2016Decline from FY2014
avg. (0.918)
Forecast FX rate Scenario 1 0.884 0.850 7%
Forecast FX rate Scenario 2 0.859 0.800 13%
Forecast FX rate Scenario 3 0.834 0.750 18%
Forecast FX rate Scenario 4 0.809 0.700 24%
Forecast FX rate Scenario 5 0.784 0.650 29%
100
90
80
70
60
50
40
30
20
10
0Retailers Direct Sourcing Local Sourcing Wholesalers
Scenario 1 Scenario 2 Scenario 3Current Scenario 5Scenario 4
%
MORE BUSINESSES WILL BE EXPOSED TO AUD VOLATILITY
With the share of direct sourcing retailers increasing, more businesses will be exposed to AUD volatility. In our base case scenario, before strategic initiatives such as price increases, more than 70% of direct sourcing retailers will generate a negative EBIT. This is a significant percentage and highlights the extent of price increases that are likely to occur for many of these businesses to avoid losses. The extent of these price rises and the associated impact on consumer demand and market share will be dependent on the company, sub-sector and market in which the company operates in.
For Australian wholesalers, there’s likely to be more pain in a lower AUD environment as cost of goods sold represents a larger portion of total expenses relative to retailers. Profit margins are also thinner for wholesalers. A silver lining though has been that balance sheets for wholesalers have improved considerably. Cashflow leverage and balance sheet leverage has declined to their lowest levels since at least FY2006 (Fig 30 and Fig 31). This provides increased financial flexibility to offset some exchange rate pain.
In addition to price increases, retailers and wholesalers can continue to reduce the cost of doing business. The primary focus has been on the physical supply chain (i.e. direct sourcing), but businesses should also consider the benefits of streamlining their financial supply chain, which can help to improve liquidity and lower the cost of capital (See Supply Chain case study). In a low growth environment, physical and financial strategic supply chain initiatives can provide an opportunity and/or advantage to retailers.
FIGURE 30: WHOLESALER CASHFLOW LEVERAGE
Source: ANZ Total financial indebtedness (TFI) / EBITDA
FIGURE 31: WHOLESALER BALANCE SHEET LEVERAGE
Source: ANZ Total financial indebtedness / Capital + operating leases
DIRECT SOURCING IN A LOWER AUD ENVIRONMENT
17%
33%34%35%37%40%
43%42%
55%
68%71% 71% 70% 71%
69%
62%
53%55% 54% 54%
51%49%
45%
37%
Top Quartile Median Bottom Quartile
FY07 FY08 FY09 FY10 FY11 FY12 FY13 FY14
0.6x
1.9x
1.2x
2.1x
1.3x
1.9x
1.1x
1.9x
1.2x
1.9x
1.3x
2.2x
1.1x
2.3x
1.4x
3.3x
3.1x2.9x
2.8x3.0x 3.1x
3.4x
3.0x
1.5x
Top Quartile Median Bottom Quartile
FY07 FY08 FY09 FY10 FY11 FY12 FY13 FY14
43
ANZ forecasts to FY2016
Updated modelling to the end of FY2016 highlights the potential profit impact for the industry under a range of FX scenarios. Scenarios are based on average exchange rates and our base case of AUD/USD 0.75 during FY2016 represents an average decline of 18% from FY2014.
ANZ ASIA RETAIL
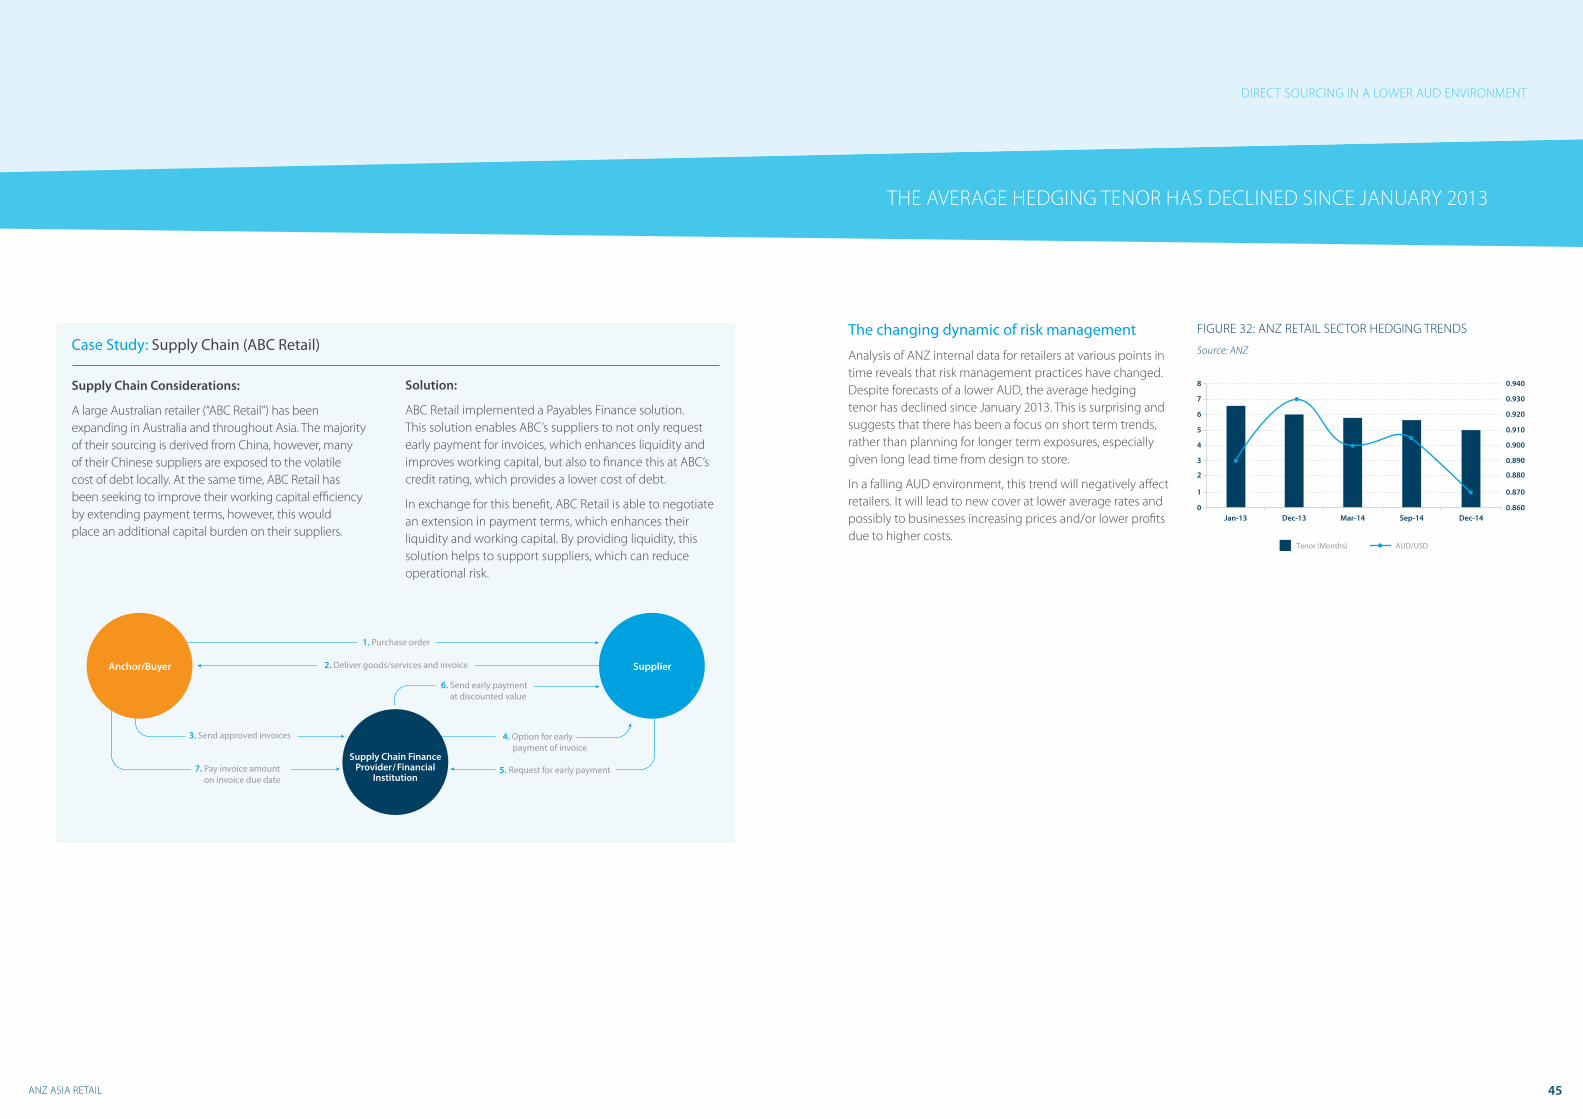
Case Study: Supply Chain (ABC Retail)
Supply Chain Considerations:
A large Australian retailer (“ABC Retail”) has been expanding in Australia and throughout Asia. The majority of their sourcing is derived from China, however, many of their Chinese suppliers are exposed to the volatile cost of debt locally. At the same time, ABC Retail has been seeking to improve their working capital efficiency by extending payment terms, however, this would place an additional capital burden on their suppliers.
Solution:
ABC Retail implemented a Payables Finance solution. This solution enables ABC’s suppliers to not only request early payment for invoices, which enhances liquidity and improves working capital, but also to finance this at ABC’s credit rating, which provides a lower cost of debt.
In exchange for this benefit, ABC Retail is able to negotiate an extension in payment terms, which enhances their liquidity and working capital. By providing liquidity, this solution helps to support suppliers, which can reduce operational risk.
Anchor/Buyer Supplier
Supply Chain Finance Provider/ Financial
Institution
1. Purchase order
5. Request for early payment
2. Deliver goods/services and invoice
3. Send approved invoices
7. Pay invoice amount on invoice due date
4. Option for early payment of invoice
6. Send early payment at discounted value
THE AVERAGE HEDGING TENOR HAS DECLINED SINCE JANUARY 2013
The changing dynamic of risk management
Analysis of ANZ internal data for retailers at various points in time reveals that risk management practices have changed. Despite forecasts of a lower AUD, the average hedging tenor has declined since January 2013. This is surprising and suggests that there has been a focus on short term trends, rather than planning for longer term exposures, especially given long lead time from design to store.
In a falling AUD environment, this trend will negatively affect retailers. It will lead to new cover at lower average rates and possibly to businesses increasing prices and/or lower profits due to higher costs.
FIGURE 32: ANZ RETAIL SECTOR HEDGING TRENDS
Source: ANZ
DIRECT SOURCING IN A LOWER AUD ENVIRONMENT
0Jan-13 Dec-13 Mar-14 Sep-14 Dec-14
1
2
3
4
5
6
7
8
0.860
0.870
0.880
0.890
0.900
0.910
0.920
0.930
0.940
Tenor (Months) AUD/USD
45
ANZ ASIA RETAIL
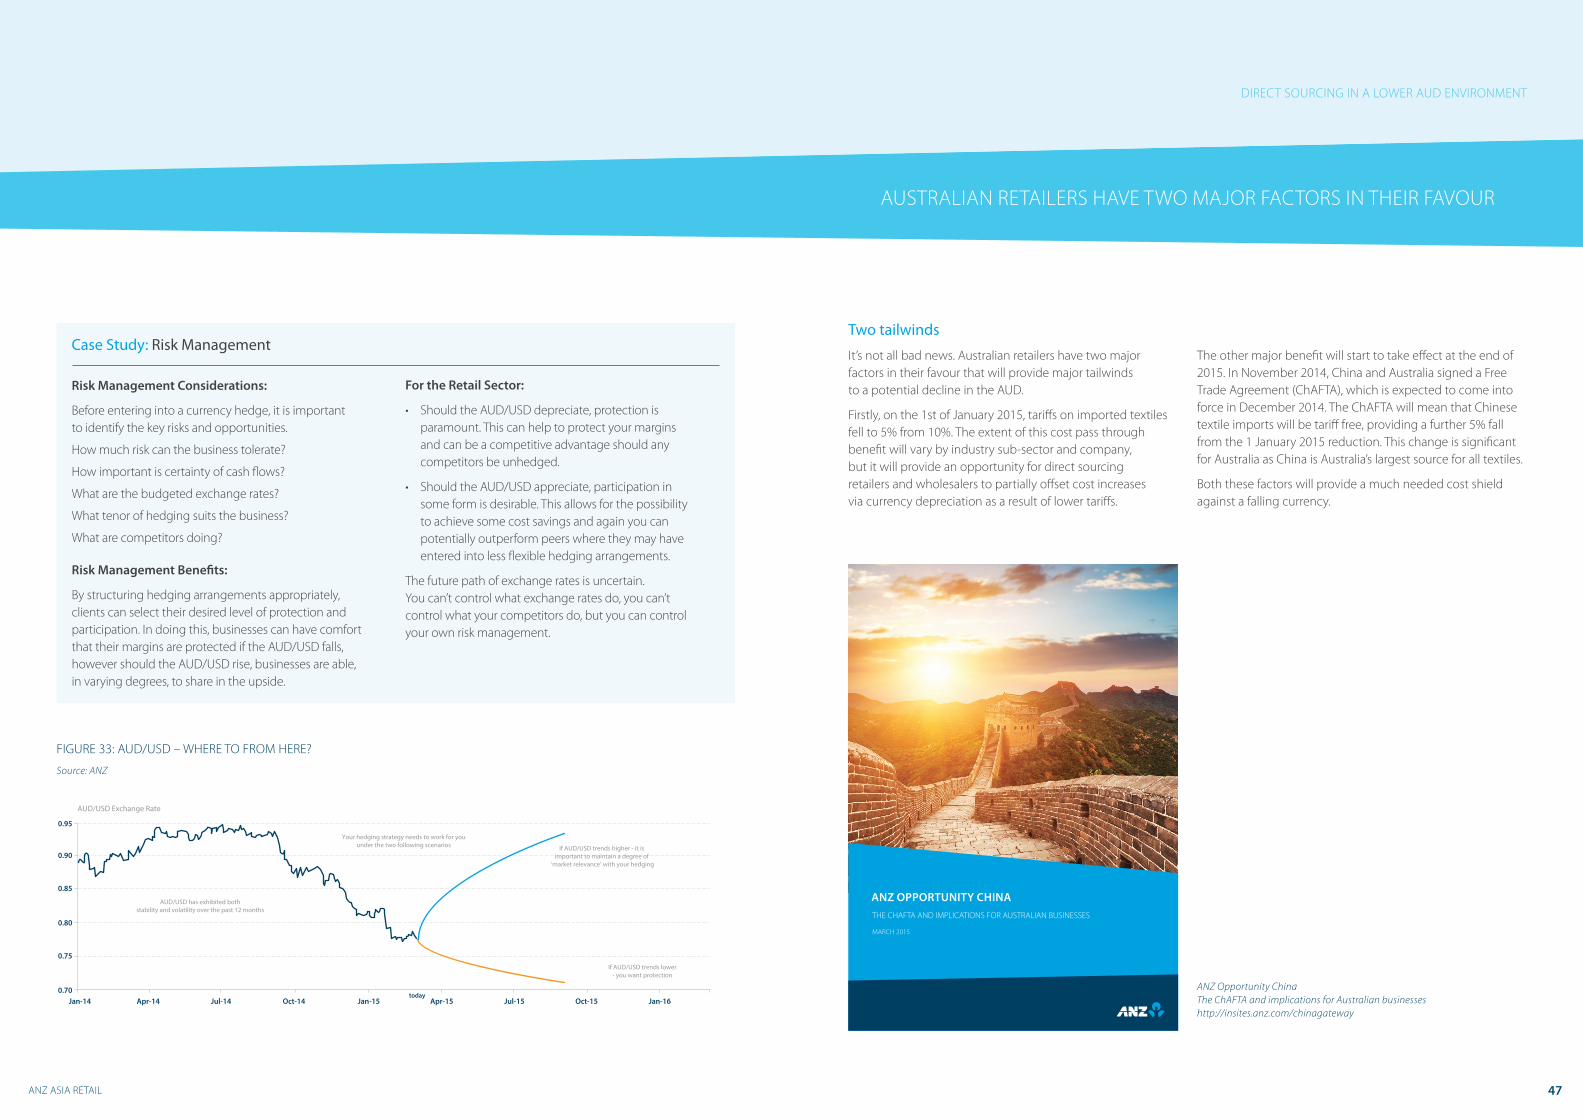
Case Study: Risk Management
Risk Management Considerations:
Before entering into a currency hedge, it is important to identify the key risks and opportunities.
How much risk can the business tolerate?
How important is certainty of cash flows?
What are the budgeted exchange rates?
What tenor of hedging suits the business?
What are competitors doing?
Risk Management Benefits:
By structuring hedging arrangements appropriately, clients can select their desired level of protection and participation. In doing this, businesses can have comfort that their margins are protected if the AUD/USD falls, however should the AUD/USD rise, businesses are able, in varying degrees, to share in the upside.
For the Retail Sector:
• Should the AUD/USD depreciate, protection is paramount. This can help to protect your margins and can be a competitive advantage should any competitors be unhedged.
• Should the AUD/USD appreciate, participation in some form is desirable. This allows for the possibility to achieve some cost savings and again you can potentially outperform peers where they may have entered into less flexible hedging arrangements.
The future path of exchange rates is uncertain. You can’t control what exchange rates do, you can’t control what your competitors do, but you can control your own risk management.
AUSTRALIAN RETAILERS HAVE TWO MAJOR FACTORS IN THEIR FAVOUR
Two tailwinds
It’s not all bad news. Australian retailers have two major factors in their favour that will provide major tailwinds to a potential decline in the AUD.
Firstly, on the 1st of January 2015, tariffs on imported textiles fell to 5% from 10%. The extent of this cost pass through benefit will vary by industry sub-sector and company, but it will provide an opportunity for direct sourcing retailers and wholesalers to partially offset cost increases via currency depreciation as a result of lower tariffs.
FIGURE 33: AUD/USD – WHERE TO FROM HERE?
Source: ANZ
The other major benefit will start to take effect at the end of 2015. In November 2014, China and Australia signed a Free Trade Agreement (ChAFTA), which is expected to come into force in December 2014. The ChAFTA will mean that Chinese textile imports will be tariff free, providing a further 5% fall from the 1 January 2015 reduction. This change is significant for Australia as China is Australia’s largest source for all textiles.
Both these factors will provide a much needed cost shield against a falling currency.
DIRECT SOURCING IN A LOWER AUD ENVIRONMENT
0.70Jan-14 Apr-14 Jul-14 Oct-14 Jan-15 Apr-15
todayJul-15 Oct-15 Jan-16
0.75
0.80
AUD/USD Exchange Rate
0.85
0.90
0.95
AUD/USD has exhibited bothstability and volatility over the past 12 months
Your hedging strategy needs to work for youunder the two following scenarios If AUD/USD trends higher - it is
important to maintain a degree of ‘market relevance’ with your hedging
If AUD/USD trends lower- you want protection
47
ANZ OPPORTUNITY CHINA
MARCH 2015
THE CHAFTA AND IMPLICATIONS FOR AUSTRALIAN BUSINESSES
K15179_ANZ_Business in Asia_Brochure_CCB_v2.indd 1 6/03/2015 10:02 am
ANZ Opportunity ChinaThe ChAFTA and implications for Australian businesses http://insites.anz.com/chinagateway
ANZ ASIA RETAIL 49
Key Contributors
Mark Ganz
Director, Client Insights & [email protected]
Andrew Howard
Associate Director, Client Insights & [email protected]
Lisa Zhong
Associate, Client Insights & [email protected]
About Client Insights & Solutions
Client Insights and Solutions (CIS) is at the forefront of developing and disseminating intellectual capital for the benefit of ANZ’s Institutional and Corporate Banking clients.
The team utilises corporate finance, industry analysis, and big data techniques to develop tailored capital structure, risk management, and working capital solutions. Additionally, our industry, market event and regulatory analysis provide predictive analysis and associated solutions across all industry sectors.
With an on the ground presence in Australia, New Zealand, Singapore, Hong Kong, London, New York and India, CIS is resourced to identify and meet our client’s needs.
IMPORTANT NOTICE
The document may be restricted by law in certain jurisdictions. Persons who receive this document must inform themselves about and observe all relevant restrictions.
1. Disclaimer for all jurisdictions
Except if otherwise specified in section 2 below, this document is issued and distributed in your country/region by Australia and New Zealand Banking Group Limited (ABN11 005 357 522) (“ANZ”), on the basis that it is only for the information of the specified recipient or permitted user of the relevant website (collectively, “recipient”). This document may not be reproduced, distributed or published by any recipient for any purpose. It is general information and has been prepared without taking into account the objectives, financial situation or needs of any person. Nothing in this document is intended to be an offer to sell, or a solicitation of an offer to buy, any product, security, instrument or investment, to effect any transaction or to conclude any legal act of any kind. If, despite the foregoing, any services or products referred to in this document are deemed to be offered in the jurisdiction in which this document is received or accessed, no such service or product is intended for nor available to persons resident in that jurisdiction if it would be contradictory to local law or regulation. Such local laws, regulations and other limitations always apply with non-exclusive jurisdiction of local courts. Before making an investment decision, recipients should seek independent financial, legal, tax and other relevant advice having regard to their particular circumstances.
The views and recommendations expressed in this document are the author’s. They are based on information known by the author and on sources which the author believes to be reliable, but may involve material elements of subjective judgement and analysis. Unless specifically stated otherwise: they are current on the date of this document and are subject to change without notice; and, all price information is indicative only. Any of the views and recommendations which comprise estimates, forecasts or other projections, are subject to significant uncertainties and contingencies that cannot reasonably be anticipated. On this basis, such views and recommendations may not always be achieved or prove to be correct. Indications of past performance in this document will not necessarily be repeated in the future. No representation is being made that any investment will or is likely to achieve profits or losses similar to those achieved in the past, or that significant losses will be avoided. Additionally, this document may contain ‘forward looking statements’. Actual events or results or actual performance may differ materially from those reflected or contemplated in such forward looking statements. All investments entail a risk and may result in both profits and losses. Foreign currency rates of exchange may adversely affect the value, price or income of any products or services described in this document. The products and services described in this document are not suitable for all investors, and transacting in these products or services may be considered risky. ANZ and its related bodies corporate and affiliates, and the officers, employees, contractors and agents of each of them (including the author) (“Affiliates”), do not make any representation as to the accuracy, completeness or currency of the views or recommendations expressed in this document. Neither ANZ nor its Affiliates accept any responsibility to inform you of any matter that subsequently comes to their notice, which may affect the accuracy, completeness or currency of the information in this document.
Except as required by law, and only to the extent so required: neither ANZ nor its Affiliates warrant or guarantee the performance of any of the products or services described in this document or any return on any associated investment; and, ANZ and its Affiliates expressly disclaim any responsibility and shall not be liable for any loss, damage, claim, liability, proceedings, cost or expense (“Liability”) arising directly or indirectly and whether in tort (including negligence), contract, equity or otherwise out of or in connection with this document.
If this document has been distributed by electronic transmission, such as e-mail, then such transmission cannot be guaranteed to be secure or error-free as information could be intercepted, corrupted, lost, destroyed, arrive late or incomplete, or contain viruses. ANZ and its Affiliates do not accept any Liability as a result of electronic transmission of this document.
ANZ and its Affiliates may have an interest in the subject matter of this document as follows:
• They may receive fees from customers for dealing in the products or services described in this document, and their staff and introducers of business may share in such fees or receive a bonus that may be influenced by total sales.
• They or their customers may have or have had interests or long or short positions in the products or services described in this document, and may at any time make purchases and/or sales in them as principal or agent.
• They may act or have acted as market-maker in products described in this document.
ANZ and its Affiliates may rely on information barriers and other arrangements to control the flow of information contained in one or more business areas within ANZ or within its Affiliates into other business areas of ANZ or of its Affiliates.
Please contact your ANZ point of contact with any questions about this document including for further information on these disclosures of interest.
2. Country/region specific information:
Australia. This document is distributed in Australia by ANZ. ANZ holds an Australian Financial Services licence no. 234527. A copy of ANZ’s Financial Services Guide is available at http://www.anz.com/documents/AU/aboutANZ/FinancialServicesGuide.pdf and is available upon request from your ANZ point of contact. If trading strategies or recommendations are included in this document, they are solely for the information of ‘wholesale clients’ (as defined in section 761G of the Corporations Act 2001 Cth). Persons who receive this document must inform themselves about and observe all relevant restrictions.
Brazil. This document is distributed in Brazil by ANZ on a cross border basis and only following request by the recipient. No securities are being offered or sold in Brazil under this document, and no securities have been and will not be registered with the Securities Commission - CVM.
Brunei. Japan. Kuwait. Malaysia. Switzerland. Taiwan. This document is distributed in each of Brunei, Japan, Kuwait, Malaysia, Switzerland and Taiwan by ANZ on a cross-border basis.
European Economic Area (“EEA”): United Kingdom. ANZ is authorised in the United Kingdom by the Prudential Regulation Authority (“PRA”) and is subject to regulation by the Financial Conduct Authority (“FCA”) and limited regulation by the PRA. Details about the extent of our regulation by the PRA are available from us on request. This document is distributed in the United Kingdom by ANZ solely for the information of persons who would come within the FCA definition of “eligible counterparty” or “professional client”. It is not intended for and must not be distributed to any person who would come within the FCA definition of “retail client”. Nothing here excludes or restricts any duty or liability to a customer which ANZ may have under the UK Financial Services and Markets Act 2000 or under the regulatory system as defined in the Rules of the PRA and the FCA. Germany. This document is distributed in Germany by the Frankfurt Branch of ANZ solely for the information of its clients. Other EEA countries. This document is distributed in the EEA by ANZ Bank (Europe) Limited (“ANZBEL”) which is authorised by the PRA and regulated by the FCA and the PRA in the United Kingdom, to persons who would come within the FCA definition of “eligible counterparty” or “professional client” in other countries in the EEA. This document is distributed in those countries solely for the information of such persons upon their request. It is not intended for, and must not be distributed to, any person in those countries who would come within the FCA definition of “retail client”.
Fiji. For Fiji regulatory purposes, this document and any views and recommendations are not to be deemed as investment advice. Fiji investors must seek licensed professional advice should they wish to make any investment in relation to this document.
Hong Kong. This publication is distributed in Hong Kong by the Hong Kong branch of ANZ, which is registered at the Hong Kong Monetary Authority to conduct Type 1 (dealing in securities), Type 4 (advising on securities) and Type 6 (advising on corporate finance) regulated activities. The contents of this publication have not been reviewed by any regulatory authority in Hong Kong. If in doubt about the contents of this publication, you should obtain independent professional advice,
India. This document is distributed in India by ANZ on a cross-border basis. If this document is received in India, only you (the specified recipient) may print it provided that before doing so, you specify on it your name and place of printing. Further copying or duplication of this document is strictly prohibited.
ANZ ASIA RETAIL 51
New Zealand. This document is intended to be of a general nature, does not take into account your financial situation or goals, and is not a personalised adviser service under the Financial Advisers Act 2008.
Oman. This document has been prepared by ANZ. ANZ neither has a registered business presence nor a representative office in Oman and does not undertake banking business or provide financial services in Oman. Consequently ANZ is not regulated by either the Central Bank of Oman or Oman’s Capital Market Authority. The information contained in this document is for discussion purposes only and neither constitutes an offer of securities in Oman as contemplated by the Commercial Companies Law of Oman (Royal Decree 4/74) or the Capital Market Law of Oman (Royal Decree 80/98), nor does it constitute an offer to sell, or the solicitation of any offer to buy non-Omani securities in Oman as contemplated by Article 139 of the Executive Regulations to the Capital Market Law (issued vide CMA Decision 1/2009). ANZ does not solicit business in Oman and the only circumstances in which ANZ sends information or material describing financial products or financial services to recipients in Oman, is where such information or material has been requested from ANZ and by receiving this document, the person or entity to whom it has been dispatched by ANZ understands, acknowledges and agrees that this document has not been approved by the CBO, the CMA or any other regulatory body or authority in Oman. ANZ does not market, offer, sell or distribute any financial or investment products or services in Oman and no subscription to any securities, products or financial services may or will be consummated within Oman. Nothing contained in this document is intended to constitute Omani investment, legal, tax, accounting or other professional advice.
People’s Republic of China. If and when the material accompanying this document does not only relate to the products and/or services of Australia and New Zealand Bank (China) Company Limited (“ANZ China”), it is noted that: This document is distributed by ANZ or an affiliate. No action has been taken by ANZ or any affiliate which would permit a public offering of any products or services of such an entity or distribution or re-distribution of this document in the People’s Republic of China (“PRC”). Accordingly, the products and services of such entities are not being offered or sold within the PRC by means of this document or any other method. This document may not be distributed, re-distributed or published in the PRC, except under circumstances that will result in compliance with any applicable laws and regulations. If and when the material accompanying this document relates to the products and/or services of ANZ China only, it is noted that: This document is distributed by ANZ China in the Mainland of the PRC.
Qatar. This document has not been, and will not be:
• lodged or registered with, or reviewed or approved by, the Qatar Central Bank (“QCB”), the Qatar Financial Centre (“QFC”) Authority, QFC Regulatory Authority or any other authority in the State of Qatar (“Qatar”); or
• authorised or licensed for distribution in Qatar,
• and the information contained in this document does not, and is not intended to, constitute a public offer or other invitation in respect of securities in Qatar or the QFC. The financial products or services described in this document have not been, and will not be:
• registered with the QCB, QFC Authority, QFC Regulatory Authority or any other governmental authority in Qatar; or
• authorised or licensed for offering, marketing, issue or sale, directly or indirectly, in Qatar.
Accordingly, the financial products or services described in this document are not being, and will not be, offered, issued or sold in Qatar, and this document is not being, and will not be, distributed in Qatar. The offering, marketing, issue and sale of the financial products or services described in this document and distribution of this document is being made in, and is subject to the laws, regulations and rules of, jurisdictions outside of Qatar and the QFC. Recipients of this document must abide by this restriction and not distribute this document in breach of this restriction. This document is being sent/issued to a limited number of institutional and/or sophisticated investors (i) upon their request and confirmation that they understand the statements above; and (ii) on the
condition that it will not be provided to any person other than the original recipient, and is not for general circulation and may not be reproduced or used for any other purpose.
Singapore. This document is distributed in Singapore by the Singapore branch of ANZ solely for the information of “accredited investors”, “expert investors” or (as the case may be) “institutional investors” (each term as defined in the Securities and Futures Act Cap. 289 of Singapore). ANZ is licensed in Singapore under the Banking Act Cap. 19 of Singapore and is exempted from holding a financial adviser’s licence under Section 23(1)(a) of the Financial Advisers Act Cap. 100 of Singapore. In respect of any matters arising from, or in connection with the distribution of this document in Singapore, contact your ANZ point of contact.
United Arab Emirates. This document is distributed in the United Arab Emirates (“UAE”) or the Dubai International Financial Centre (as applicable) by ANZ. This document: does not, and is not intended to constitute an offer of securities anywhere in the UAE; does not constitute, and is not intended to constitute the carrying on or engagement in banking, financial and/or investment consultation business in the UAE under the rules and regulations made by the Central Bank of the United Arab Emirates, the Emirates Securities and Commodities Authority or the United Arab Emirates Ministry of Economy; does not, and is not intended to constitute an offer of securities within the meaning of the Dubai International Financial Centre Markets Law No. 12 of 2004; and, does not constitute, and is not intended to constitute, a financial promotion, as defined under the Dubai International Financial Centre Regulatory Law No. 1 of 200. ANZ DIFC Branch is regulated by the Dubai Financial Services Authority (“DFSA”). The financial products or services described in this document are only available to persons who qualify as “Professional Clients” or “Market Counterparty” in accordance with the provisions of the DFSA rules. In addition, ANZ has a representative office (“ANZ Representative Office”) in Abu Dhabi regulated by the Central Bank of the United Arab Emirates. ANZ Representative Office is not permitted by the Central Bank of the United Arab Emirates to provide any banking services to clients in the UAE.
United States. If and when this document is received by any person in the United States or a “U.S. person” (as defined in Regulation S under the US Securities Act of 1933, as amended) (“US Person”) or any person acting for the account or benefit of a US Person, it is noted that ANZ Securities, Inc. (“ANZ S”) is a member of FINRA (www.finra.org) and registered with the SEC. ANZ S’ address is 277 Park Avenue, 31st Floor, New York, NY 10172, USA (Tel: +1 212 801 9160 Fax: +1 212 801 9163). Except where this is a FX- related or commodity-related document, this document is distributed in the United States by ANZ S (a wholly owned subsidiary of ANZ), which accepts responsibility for its content. Information on any securities referred to in this document may be obtained from ANZ S upon request. Any US Person receiving this document and wishing to effect transactions in any securities referred to in this document must contact ANZ S, not its affiliates. Where this is an FX- related or commodity-related document, it is distributed in the United States by ANZ’s New York Branch, which is also located at 277 Park Avenue, 31st Floor, New York, NY 10172, USA (Tel: +1 212 801 9160 Fax: +1 212 801 9163). Commodity-related products are not insured by any U.S. governmental agency, and are not guaranteed by ANZ or any of its affiliates. Transacting in these products may involve substantial risks and could result in a significant loss. You should carefully consider whether transacting in commodity-related products is suitable for you in light of your financial condition and investment objectives. ANZ S is authorised as a broker-dealer only for US Persons who are institutions, not for US Persons who are individuals. If you have registered to use this website or have otherwise received this document and are a US Person who is an individual: to avoid loss, you should cease to use this website by unsubscribing or should notify the sender and you should not act on the contents of this document in any way.
Vietnam. This document is distributed in Vietnam by ANZ or ANZ Bank (Vietnam) Limited, a subsidiary of ANZ. Please note that the contents of this document have not been reviewed by any regulatory authority in Vietnam. If you are in any doubt about any of the contents of this publication, you should obtain independent professional advice.

Australia and N
ew Zealand Banking G
roup Limited (A
NZ) A
BN 11 005 357 522. A
FSL 234527. AN
Z’s colour blue is a trade mark of A
NZ. K15270 04.15