navigating a new paradigm for international student
TRANSCRIPT
REPORT 10
NAVIGATING A NEW PARADIGM FOR INTERNATIONAL STUDENT RECRUITMENTPaul Schulmann Research ManagerCindy Le Research Associate
June 2018

Recommended Citation: Schulmann, P. and Le, C. (2018). Navigating a New Paradigm for International Student Recruitment. New York: World Education Services. Retrieved from wes.org/partners/research/
Navigating a New Paradigm for International Student Recruitment | © 2018 World Education Services. All rights reserved.
i
TABLE OF CONTENTSExecutive Summary iii..........................................................................................................................................................Introduction and Situational Overview 1.........................................................................................................................
About the Research 2.................................................................................................................................................Setting the Stage: A Changing International Higher Education Landscape 5................................................
Increased Global Competition 5.........................................................................................................................Concern About Future Work Opportunities 5..................................................................................................Changes in Visa Availability 6..............................................................................................................................Loss of Prominent Government-Sponsored Scholarship Programs in Key Sending Countries 7.........Isolationist Political Environment in the United States 7..............................................................................
International Admissions in Flux: What WES Researchers Saw 8...............................................................................Key Findings 8 .............................................................................................................................................................Changes to International Applications for the 2017–18 Academic Year: Discussion 8 ................................By the Numbers: Changes to International Enrollment for the 2017–18 Academic Year 11 .......................U.S. Institutions Remain (Cautiously) Optimistic 14 ...........................................................................................
Recommendation 15............................................................................................................................................Highlighted Findings by U.S. Region 16..................................................................................................................
Cause and Effect: The Role of U.S. Politics and an Evolving International Admissions Paradigm 19 ................Key Findings 19............................................................................................................................................................
Recruitment Strategies: International Higher Ed Reacts 21.........................................................................................Key Findings 21............................................................................................................................................................
Supporting International Students During Turbulent Times 24 ................................................................................Effects of the #YouAreWelcomeHere Campaign 24........................................................................................
Action Steps for Institutions 25................................................................................................................................Conclusion 29........................................................................................................................................................................Appendix: Responses to All Survey Questions 30..........................................................................................................
Appendix A. Emerging Student Enrollment Trends 30........................................................................................Appendix B. Factors Affecting International Students 34...................................................................................Appendix C. Recruitment Strategies 35..................................................................................................................Appendix D. Profile Questions 38............................................................................................................................
Endnotes 40...........................................................................................................................................................................References 41........................................................................................................................................................................About 44................................................................................................................................................................................
The Authors 44 ............................................................................................................................................................WES Research 44 ........................................................................................................................................................World Education Services 44....................................................................................................................................
WES Research Reports 45...................................................................................................................................................
Navigating a New Paradigm for International Student Recruitment | © 2018 World Education Services. All rights reserved.
ii
FIGURES AND TABLESFigure 1: New International Enrollment at U.S. Higher Education Institutions 1.....................................................Figure 2: International Enrollment at U.S. Higher Education Institutions by Academic Level 2...........................Figure 3: Respondent Profile 3............................................................................................................................................Figure 4: Institutional Profile 4...........................................................................................................................................Figure 5: Overall Change in International Applications for the 2017-18 Application Cycle 9.................................Figure 6: Change in International Applications by Region for the 2017-18 Application Cycle 10.........................Figure 7: Change in International Applications by Academic Level for the 2017-18 Application Cycle 11.........Figure 8: Intitutions that Experienced Change in International Enrollment for the 2017-18 Application Cycle 12................................................................................................................................Figure 9: Change in International Enrollment by Region for the 2017-18 Application Cycle 13...........................Figure 10: Change in International Enrollment by Academic Level for the 2017-18 Application Cycle 14.........Figure 11: Anticipated Change in International Enrollment for 2018-19 15..............................................................Figure 12: Outlook on International Enrollment for 2018-19 Academic Year by Region 16...................................Figure 13: Change in Applications and Enrollment by U.S. Region 17.......................................................................Figure 14: Change in Applications and Enrollment by Red and Blue States 18.......................................................Figure 15: Factors that Negatively Affected Institutions’ International Enrollment 20...........................................Figure 16: Plans to Change International Student Recruitment Strategy 22............................................................Figure 17: Countries and Regions to be Prioritized for International Student Recruitment 23............................Figure 18: Steps Taken to Allay Concerns of Prospective International Students 25.............................................
ACRONYMSCEC Canadian Experience ClassCPT Curricular Practical TrainingHEI Higher Education InstitutionIIE Institute of International EducationKASP King Abdullah Scholarship ProgramMENA Middle East and North AfricaOPT Optional Practical TrainingSEVIS Student and Exchange Visitor Information SystemSEVP Student and Exchange Visitor ProgramSWB Science without BordersUSCIS United States Citizenship and Immigration ServicesWENR World Education News & ReviewsWES World Education Services
Navigating a New Paradigm for International Student Recruitment | © 2018 World Education Services. All rights reserved.
iii
EXECUTIVE SUMMARY
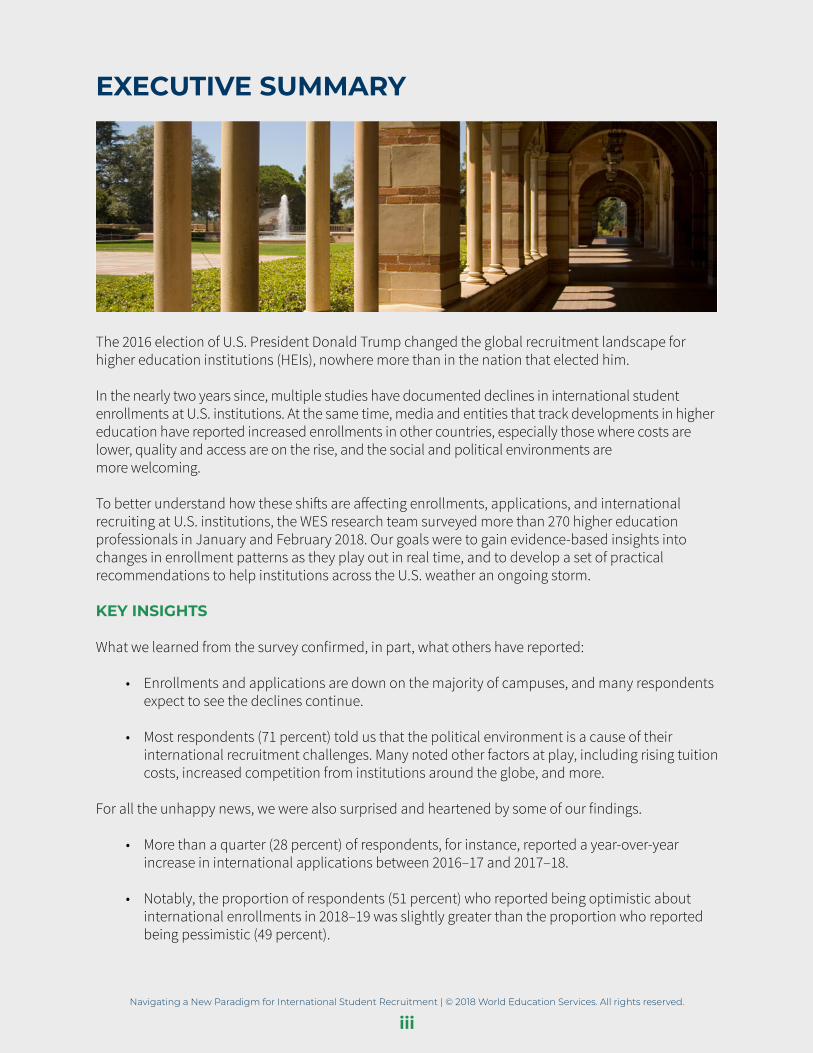
The 2016 election of U.S. President Donald Trump changed the global recruitment landscape for higher education institutions (HEIs), nowhere more than in the nation that elected him.
In the nearly two years since, multiple studies have documented declines in international student enrollments at U.S. institutions. At the same time, media and entities that track developments in higher education have reported increased enrollments in other countries, especially those where costs are lower, quality and access are on the rise, and the social and political environments are more welcoming.
To better understand how these shifts are affecting enrollments, applications, and international recruiting at U.S. institutions, the WES research team surveyed more than 270 higher education professionals in January and February 2018. Our goals were to gain evidence-based insights into changes in enrollment patterns as they play out in real time, and to develop a set of practical recommendations to help institutions across the U.S. weather an ongoing storm.
KEY INSIGHTS
What we learned from the survey confirmed, in part, what others have reported:
• Enrollments and applications are down on the majority of campuses, and many respondents expect to see the declines continue.
• Most respondents (71 percent) told us that the political environment is a cause of their international recruitment challenges. Many noted other factors at play, including rising tuition costs, increased competition from institutions around the globe, and more.
For all the unhappy news, we were also surprised and heartened by some of our findings.
• More than a quarter (28 percent) of respondents, for instance, reported a year-over-year increase in international applications between 2016–17 and 2017–18.
• Notably, the proportion of respondents (51 percent) who reported being optimistic about international enrollments in 2018–19 was slightly greater than the proportion who reported being pessimistic (49 percent).
Navigating a New Paradigm for International Student Recruitment | © 2018 World Education Services. All rights reserved.
iv
Our research also helped us understand what many institutions are doing to soften the impact of declines in international student enrollments and to plan for the future of international admissions and recruitment. Broadly speaking, U.S. HEIs are seeking to adapt their enrollment management strategies, as well as provide a welcoming environment for international students. They are also continuing to focus on the long-term and the positive, both in messaging directed at potential enrollees and applicants, and in planning future recruitment strategies.
RECOMMENDATIONS
1. Diversify recruitment targets.
International enrollments from any one country are prone to large fluctuations, and the last year has seen a softening of enrollment numbers among Chinese and Indian students. These drops are significant given that China and India have been reliable top senders by substantial margins for several years. Diversifying the international enrollment funnel is probably always wise; at this juncture it is imperative.
2. Emphasize a welcoming environment.
The national #YouAreWelcomeHere campaign (n.d.) is one way that multiple institutions have banded together to demonstrate solidarity and show support for international students. Eighty-six percent of survey respondents found the campaign effective in helping to reassure international students that the political climate on campus remains distinct from the nation’s as reflected in the media.
3. Provide support and resources.
Pre-arrival support can help international students navigate the visa process, help parents manage safety concerns, and highlight support services in the surrounding community as well as those on campus that are available to international students (see Skinner, 2018). Also critical is ensuring that international students on campus have easy access to up-to-date information about immigration and visa policies.
4. Engage in virtual and social media outreach.
Our research suggests that HEIs are forgoing more traditional recruitment methods such as overseas travel in favor of newer and less expensive approaches such as social media. Virtual and social media outreach can be used to develop relationships with students, to inform them of developments in immigration and visa policy that may affect their student status, and more.
5. Engage the alumni network for recruitment.
Alumni can be instrumental in attracting prospective international students. For their upcoming application cycle, 66 percent of our respondents said they planned to engage more with recent international alumni.
Navigating a New Paradigm for International Student Recruitment | © 2018 World Education Services. All rights reserved.
v
6. Address students’ financial concerns.
Nearly half of our respondents (45 percent) cited the rising cost of tuition as a challenge to recruiting international students. Although providing scholarships or lowering tuition may not always be possible, institutions can provide advice to help international students understand, manage, and mitigate some of the financial costs of their education.
7. Develop and maintain partnerships that can either provide alternative routes to recruitment or facilitate entry.
Community colleges can create a cost-effective pipeline of international students who, after graduating, seek a four-year degree (see Loo, 2016). Secondary schools, which host over 80,000 international students (Farrugia, 2017), can provide a venue for backyard recruiting. Relationships with staff at foreign embassies, ministries, and government education agencies can help ensure a high institutional profile among potential recruits. To ensure more ready access to help with I-20 forms and other visa issues, cultivating relationships with staff at the U.S. Department of Homeland Security’s Student and Exchange Visitor Program (SEVP) can be useful.
Navigating a New Paradigm for International Student Recruitment | © 2018 World Education Services. All rights reserved.
1
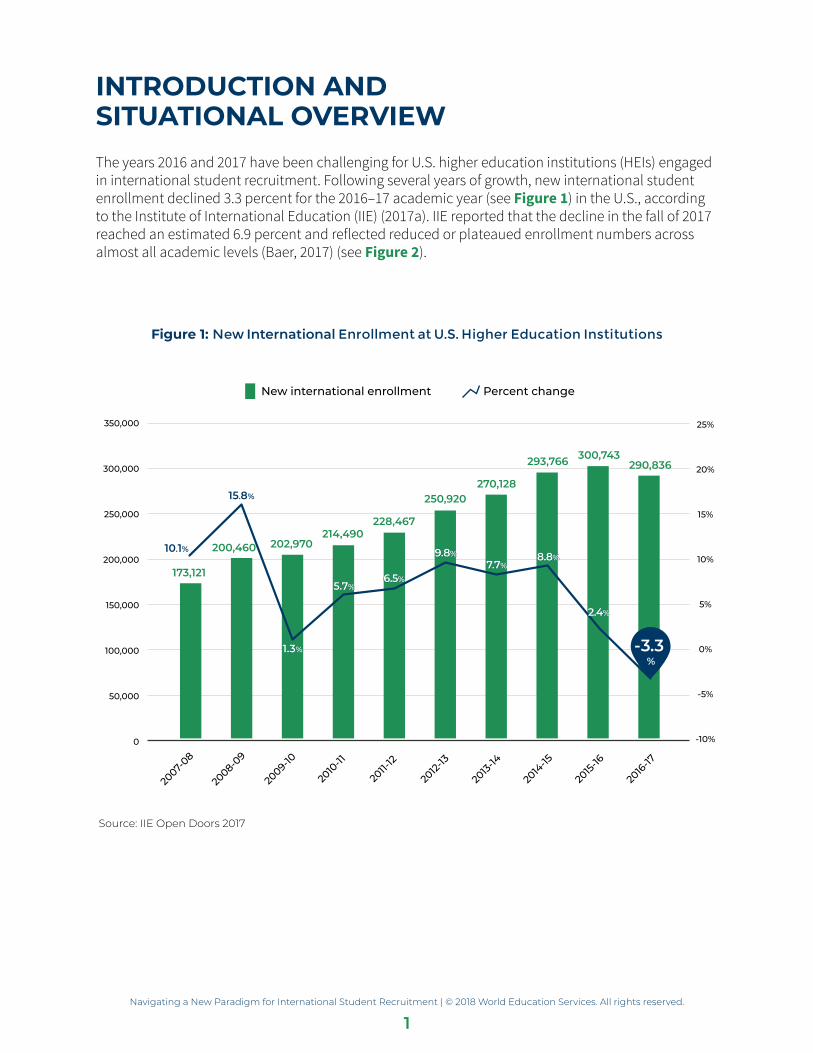
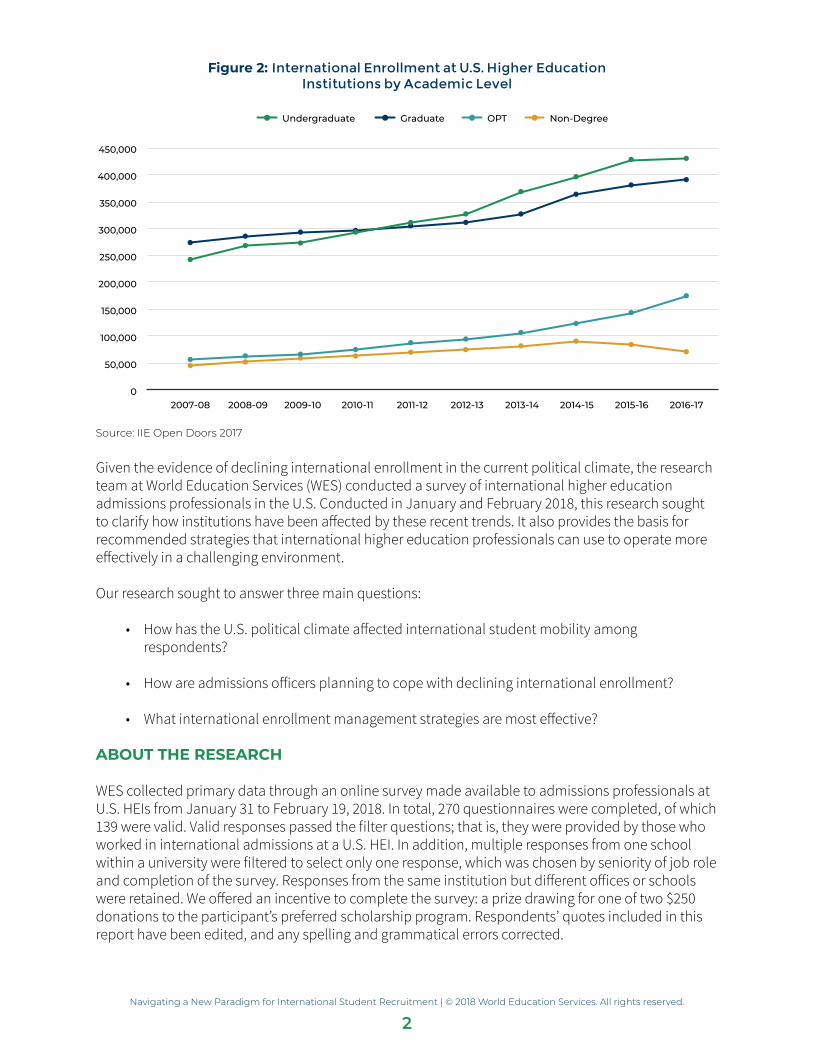
INTRODUCTION AND SITUATIONAL OVERVIEWThe years 2016 and 2017 have been challenging for U.S. higher education institutions (HEIs) engaged in international student recruitment. Following several years of growth, new international student enrollment declined 3.3 percent for the 2016–17 academic year (see Figure 1) in the U.S., according to the Institute of International Education (IIE) (2017a). IIE reported that the decline in the fall of 2017 reached an estimated 6.9 percent and reflected reduced or plateaued enrollment numbers across almost all academic levels (Baer, 2017) (see Figure 2).
Figure 1: New International Enrollment at U.S. Higher Education Institutions
New international enrollment Percent change
49+57+58+61+65+72+77+84+86+83+2007-0
8
173,121
10.1%
15.8%
2008-09
200,460
2009-10
202,970
2010-11
214,490
2011-12
228,467
2012-13
250,920
2013-14
270,128
2014-15
293,766
2015-16
300,743
2016-17
290,836
150,000
10%
0 -10%
-5%
200,000
15%
100,000
5%
50,000
0%
250,000
20%300,000
25%350,000
1.3%
5.7%
9.8%
6.5%
7.7%8.8%
2.4%
-3.3 %
Source: IIE Open Doors 2017
Navigating a New Paradigm for International Student Recruitment | © 2018 World Education Services. All rights reserved.
2
Figure 2: International Enrollment at U.S. Higher Education Institutions by Academic Level
Undergraduate Graduate OPT Non-Degree
02007-08
50,000
2008-09
100,000
2009-10
150,000
2010-11
200,000
2011-12
250,000
2012-13
300,000
2013-14
350,000
2014-15
400,000
2015-16
450,000
2016-17
Source: IIE Open Doors 2017
Given the evidence of declining international enrollment in the current political climate, the research team at World Education Services (WES) conducted a survey of international higher education admissions professionals in the U.S. Conducted in January and February 2018, this research sought to clarify how institutions have been affected by these recent trends. It also provides the basis for recommended strategies that international higher education professionals can use to operate more effectively in a challenging environment.
Our research sought to answer three main questions:
• How has the U.S. political climate affected international student mobility among respondents?
• How are admissions officers planning to cope with declining international enrollment?
• What international enrollment management strategies are most effective?
ABOUT THE RESEARCH
WES collected primary data through an online survey made available to admissions professionals at U.S. HEIs from January 31 to February 19, 2018. In total, 270 questionnaires were completed, of which 139 were valid. Valid responses passed the filter questions; that is, they were provided by those who worked in international admissions at a U.S. HEI. In addition, multiple responses from one school within a university were filtered to select only one response, which was chosen by seniority of job role and completion of the survey. Responses from the same institution but different offices or schools were retained. We offered an incentive to complete the survey: a prize drawing for one of two $250 donations to the participant’s preferred scholarship program. Respondents’ quotes included in this report have been edited, and any spelling and grammatical errors corrected.
Navigating a New Paradigm for International Student Recruitment | © 2018 World Education Services. All rights reserved.
3
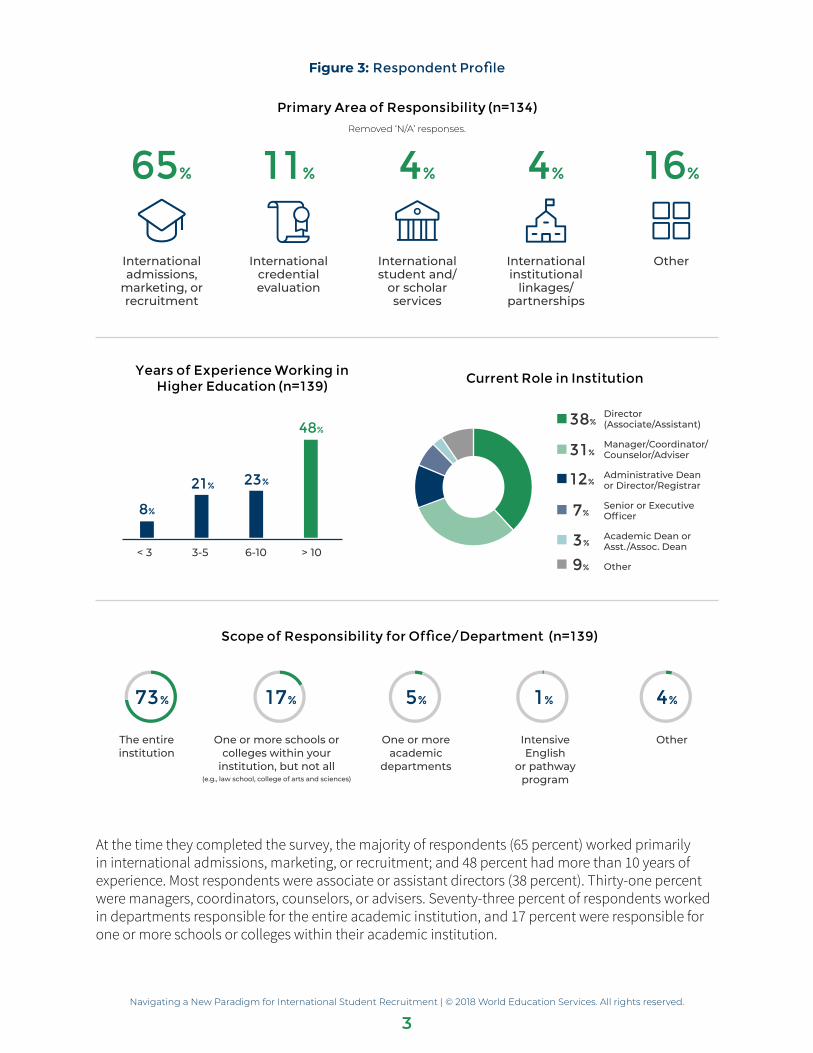
Figure 3: Respondent Profile
Primary Area of Responsibility (n=134) Removed ‘N/A’ responses.
International admissions,
marketing, or recruitment
65%
International credential evaluation
11%
International student and/
or scholar services
4%
International institutional
linkages/partnerships
4%
Other
16%
Years of Experience Working in Higher Education (n=139)
< 3
8%
3-5
21%
6-10
23%
> 10
48%
Current Role in Institution
38%Director (Associate/Assistant)
31%Manager/Coordinator/ Counselor/Adviser
12%Administrative Dean or Director/Registrar
7%Senior or Executive Officer
3%Academic Dean or Asst./Assoc. Dean
9% Other
Scope of Responsibility for Office/Department (n=139)
38+31+12+7+3+9+A8 + 21 + 23 + 48The entire institution
73+27+T73%
One or more schools or colleges within your
institution, but not all (e.g., law school, college of arts and sciences)
17+83+T17%
One or more academic
departments
5+95+T5%
Intensive English
or pathway program
1+99+T1%
Other
4+96+T4%
At the time they completed the survey, the majority of respondents (65 percent) worked primarily in international admissions, marketing, or recruitment; and 48 percent had more than 10 years of experience. Most respondents were associate or assistant directors (38 percent). Thirty-one percent were managers, coordinators, counselors, or advisers. Seventy-three percent of respondents worked in departments responsible for the entire academic institution, and 17 percent were responsible for one or more schools or colleges within their academic institution.
Navigating a New Paradigm for International Student Recruitment | © 2018 World Education Services. All rights reserved.
4
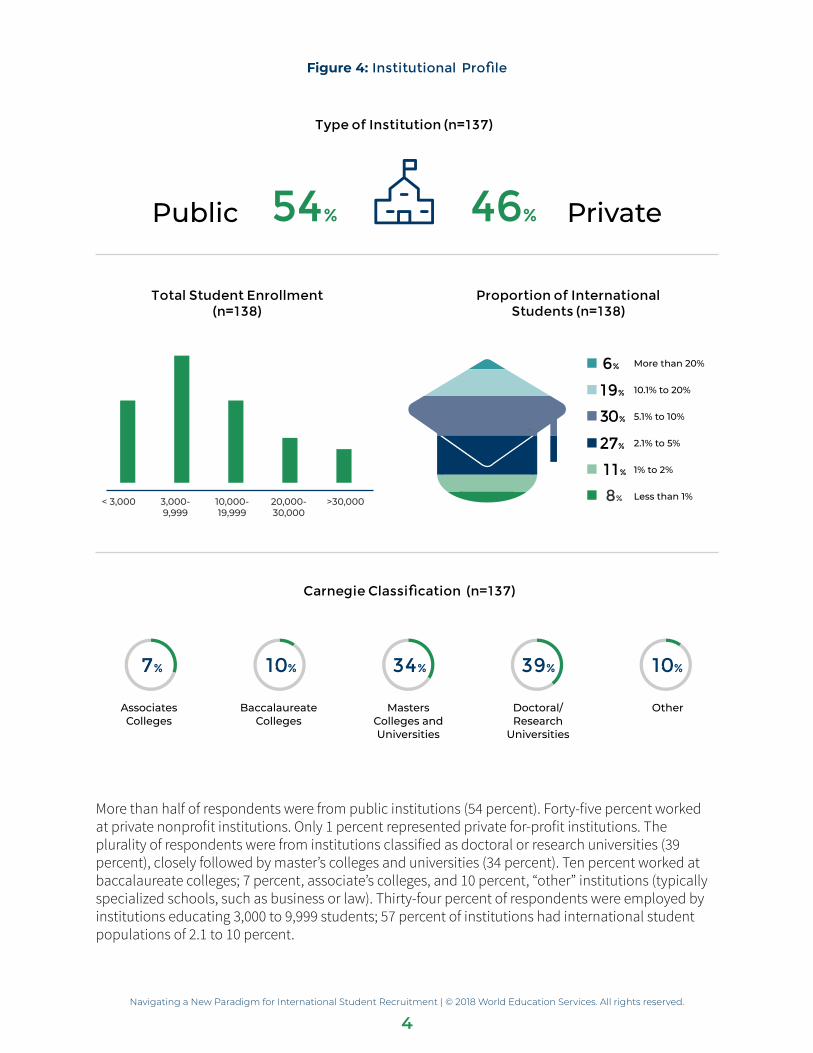
Figure 4: Institutional Profile
Type of Institution (n=137)
22 + 34 + 22 + 12 + 9Public 54% Private46%
Total Student Enrollment(n=138)
Proportion of International Students (n=138)
6% More than 20%
19% 10.1% to 20%
30% 5.1% to 10%
27% 2.1% to 5%
11% 1% to 2%
8% Less than 1%
Carnegie Classification (n=137)
Associates Colleges
30+70+T7%
Baccalaureate Colleges
10+90+T10%
Masters Colleges and Universities
34+66+T34%
Doctoral/Research
Universities
39+61+T39%
Other
10+90+T10%
< 3,000 3,000- 9,999
10,000-19,999
20,000-30,000
>30,000
More than half of respondents were from public institutions (54 percent). Forty-five percent worked at private nonprofit institutions. Only 1 percent represented private for-profit institutions. The plurality of respondents were from institutions classified as doctoral or research universities (39 percent), closely followed by master’s colleges and universities (34 percent). Ten percent worked at baccalaureate colleges; 7 percent, associate’s colleges, and 10 percent, “other” institutions (typically specialized schools, such as business or law). Thirty-four percent of respondents were employed by institutions educating 3,000 to 9,999 students; 57 percent of institutions had international student populations of 2.1 to 10 percent.
Navigating a New Paradigm for International Student Recruitment | © 2018 World Education Services. All rights reserved.
5
SETTING THE STAGE: A CHANGING INTERNATIONAL HIGHER EDUCATION LANDSCAPE
At a macro level, the recruitment environment in which we conducted this research is complex. Across the globe, international students are increasingly seen as providing value not just to the institutions they attend, but to their host communities as well. They increase diversity on campuses. They bring economic benefits to the communities they live in. They serve as a ready pipeline of well-integrated and -educated immigrants ready to fill skill gaps in the job market. The competition to recruit these students has thus gone global.
Long viewed as a prime destination for these students, the U.S. has, for a variety of reasons, begun to lose its edge.
Increased Global Competition
Institutions worldwide, often with government support, have implemented several measures to recruit and retain international students. China, for example, the top sender of international students, has started its own efforts to become an international higher education destination. In 2012, the Chinese government announced an initiative to meet its goal by hosting 500,000 international students by 2020 (Schulmann & Ye, 2017). By all accounts, the country has made significant inroads and has done so very quickly. Only a decade ago, China hosted relatively few international students; as of 2017, it had become the third largest host country for such students, according to IIE’s Project Atlas (IIE, 2017b). And it’s not just China.
The meteoric rise of educational options in countries that have comparatively affordable, and in some instances, free education systems (Bothwell, 2017) has also exacerbated the difficulty for U.S. institutions seeking to demonstrate the return on investment of a U.S. education.
Another challenge is the proliferation of high-quality, affordable education options in English, which has strained the ability of U.S. HEIs to attract international students. A 2017 ICEF Monitor article detailed the stunning growth of English-taught degree programs. According to the article, the number of European bachelor degree programs taught in English increased from nearly zero in 2009 to almost 3,000 in 2017.
Concern About Future Work Opportunities
Savvy prospective international students are also highly conscious of how their education translates into opportunities to work and immigrate. The U.S. has begun to assume an extremely defensive posture on immigration and to curtail international student work opportunities. These positions do not bode well for recruiters seeking to attract career-conscious international recruits to U.S. campuses.
[There is] competition from other countries who are more welcoming, provide fewer immigr ation hurdles, better value (tuition
incentives, including resident tuition, and other cost saving measures), and incentives to remain in country for OPT or permanent residence.”
- International admissions expert at a public doctoral university
Navigating a New Paradigm for International Student Recruitment | © 2018 World Education Services. All rights reserved.
6
Meanwhile, the governments of other countries have begun to implement policies that enable international students to gain work experience and parlay their education into a path to immigration. The Canadian government, for instance, has created the Canadian Experience Class (CEC), which provides a route to permanent residency for international students (Le, 2017a). It also recently passed a law that reduces the time required for immigrants to become Canadian citizens. The CEC, in conjunction with a national strategic plan to attract 450,000 international students by 2022, is indicative of the international challenges confronting U.S. institutions as they try to increase their appeal to prospective international students.
Canadian HEIs have capitalized on their government’s move to attract global students. The University of Toronto, a prominent Canadian university, eliminated international student fees for PhD students in January 2018 (Szklarski, 2018). The university will now charge international doctoral students the same tuition as domestic students—a huge draw for cost-sensitive students. Many universities have followed suit, such as the University of Ottawa, Western University, and Brock University (Study International (SI), 2018a).
Changes in Visa Availability
International students who are sensitive to changes in visa policy may be concerned about the increasing difficulty of obtaining a U.S. visa. Data from the U.S. State Department show that the number of visas issued to foreign students fell significantly last year: F-1 student visas dropped 17 percent from the previous fiscal year, and dropped 40 percent from 2015. The decline in issuances of F-1 student visas is a mixture of both fewer applications and higher refusal rates. In the 2015 fiscal year, over 850,000 applications were submitted (Department of State (DOS), 2015); the visa issuance rate was 75 percent. In 2017, around 600,000 applications were submitted (DOS, 2017); the visa issuance rate was 65 percent.
[There is a] lack of certainty regarding the immigration policy in the U.S., [and] that sends a message to the welcome students
[will receive] should they come to the U.S. They are hesitant to come to a country where the president ‘doesn’t like them’”
- Respondent from a private master’s university
The biggest declines in such visas represent the loss of students from Asian countries, particularly China (-24 percent) and India (-28 percent) (Meckler & Korn, 2018). Students from these two countries comprised 33 percent and 17 percent of all international students in the U.S. during the 2016–17 academic year (IIE, 2017a).1
H-1B visas, which are required for international students to work long-term in the U.S. after graduation, are also becoming increasingly difficult to obtain. One of our survey respondents noted the impact on campus:
“As corporations and organizations are reducing their H1-B visas, our ability to help our students seek out positions is significantly hindered. These are generally areas out of our control but have a multiplier effect on our future enrollments… Of course, our political environment is extremely negative, making a U.S. education and post-graduation job prospects far less attractive.”
Navigating a New Paradigm for International Student Recruitment | © 2018 World Education Services. All rights reserved.
7
United States Citizenship and Immigration Services (USCIS) has in the last year increased its scrutiny of H-1B visa applications (Economic Times, 2018) and added documentation requirements (Sheng, 2018). Meanwhile, the competition for an H-1B visa has become fierce, as the cap for the number of available visas has not changed since 1990. This year, the caps of 65,000 visas for bachelor degree holders and 20,000 visas for advanced degree holders were met within just five days—as it has for the past six years (SI, 2018b).
Loss of Prominent Government-Sponsored Scholarship Programs in Key Sending Countries
International students able to receive visas and undeterred by increasingly strict visa policies may still be hindered by developments in their home countries. Specifically, reductions in prominent governmental scholarships have reduced international student flows to the U.S. The King Abdullah Scholarship Program (KASP), founded in 2005, covered full tuition, medical insurance, some living expenses, and traveling fees for Saudi Arabian students pursuing an education abroad. In fact, during the 2014–15 school year, almost all Saudi Arabian students in the U.S. were supported by KASP, making the program a primary driver of the steady growth of enrollments at U.S. universities (Ortiz, 2016). However, as Saudi Arabia dealt with historically low oil prices, it tightened KASP requirements in 2016 and introduced a series of new conditions regarding what and where students could study (Paul, 2016). As a result, following years of growth bolstered by KASP, in 2016–17 the U.S. saw a 14.2 percent decrease in enrollment from Saudi Arabian students (IIE, 2017a).
Similarly, Brazil’s Science without Borders (SWB) program, which funded Brazilian STEM students studying abroad, was radically scaled back in 2015, leading to an 18 percent drop in enrollments during 2015–16 (Trines, 2017b). Later, the program was entirely eliminated. An economic collapse in Brazil that led to steep cuts in government programs has exacerbated the decrease in Brazilian students.
Isolationist Political Environment in the United States
In the U.S., nationalistic rhetoric and isolationist policies have compounded the challenges of international recruitment. Among potential international students and their families, there is new doubt that the U.S., and by extension, its higher education system, are safe and welcoming environments for them. According to Inside Higher Ed’s “2018 Survey of College and University Presidents,” 69 percent of respondents believe that the political rhetoric in the U.S. is making it more difficult to recruit international students (see Lederman, 2018).
Meanwhile, 32 HEI leaders signed an amicus brief filed with the U.S. Supreme Court to voice their opposition to President Trump’s travel ban against primarily Muslim countries (Sinclair, 2018). In their view, the ban has a negative effect on foreign students, scholars, and faculty.
IIE’s report Shifting Tides: Understanding International Student Yield for fall 2017 (Farrugia & Andrejko, 2017) found evidence of growing anxiety among international students. Eighty percent of institutions observed that Indians are concerned with “physical safety,” while 41 percent indicated that students from the Middle East feel unwelcome in the U.S. Institutions also reported that undergraduate applications from India and China have fallen: 26 percent of institutions reported declines from India, and 25 percent, from China.
Overall, the IIE survey found that 39 percent of responding institutions reported a decline in international applications, 35 percent reported an increase, and 26 percent reported no change—figures which are consistent with our own analysis.
Navigating a New Paradigm for International Student Recruitment | © 2018 World Education Services. All rights reserved.
8
INTERNATIONAL ADMISSIONS IN FLUX: WHAT WES RESEARCHERS SAW
KEY FINDINGS
• More than half of WES survey respondents saw a decrease in international student applications2 from the 2016–17 to 2017–18 application cycle at their institution (see Figure 5).
• Twenty-eight percent of respondents reported an increase in applications from the 2016–17 to 2017–18 application cycle at their institution (see Figure 5).
• Half of the respondents (50 percent) saw a decrease in the total number of enrolled international students from the 2016–17 to 2017–18 application cycle (see Figure 8).
• Twenty-nine percent saw an increase in the total number of enrolled international students from the 2016–17 to 2017–18 application cycle (see Figure 8).
• Forty-five percent of institutions anticipate a decrease in international enrollment for the upcoming 2018–19 academic year; 35 percent of institutions expect an increase (see Figure 11).
• All regions except the Northeast saw a greater decrease in international student applications and enrollment than an increase (see Figure 13).
Much of what the WES research team uncovered confirmed reports already in the field. For instance, over half (52 percent) of our survey respondents did not meet their international enrollment goals for the 2017–18 academic year.
However, despite the widespread, steep declines that many institutions have experienced, many respondents remained optimistic about the potential for international student recruitment: 35 percent of institutions predict an increase in international enrollment (see Figure 11).
CHANGES TO INTERNATIONAL APPLICATIONS FOR THE 2017–18 ACADEMIC YEAR: DISCUSSION
Sixteen percent of schools that experienced decreases in applications had decreases of 5.1 to 10 percent. Fifty-five percent of our respondents worked at institutions where international students make up more than 5 percent of the student body (see Figure 4); therefore, a decrease in international students of more than 10 percent, or even more than 5 percent, would have a large impact on the cohort size.
Navigating a New Paradigm for International Student Recruitment | © 2018 World Education Services. All rights reserved.
9
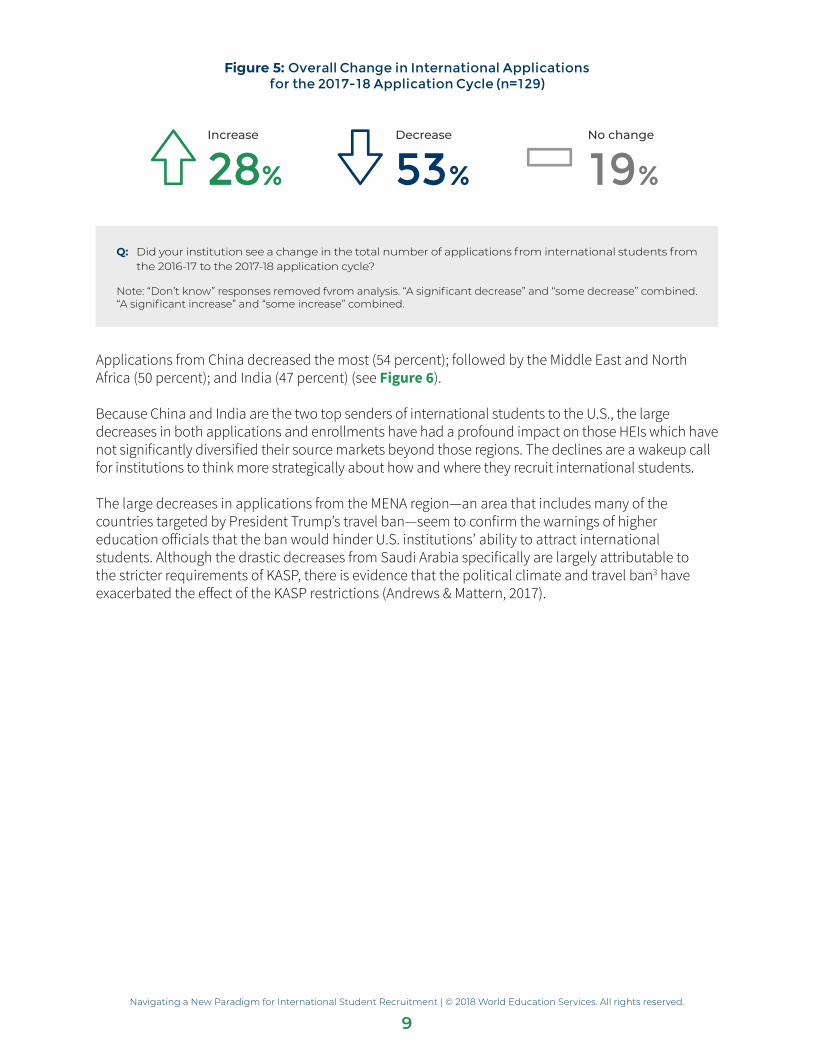
Figure 5: Overall Change in International Applications for the 2017-18 Application Cycle (n=129)
Increase
28%
Decrease
53%
No change
19%
Q: Did your institution see a change in the total number of applications from international students from the 2016-17 to the 2017-18 application cycle?
Note: “Don’t know” responses removed fvrom analysis. “A significant decrease” and “some decrease” combined. “A significant increase” and “some increase” combined.
Applications from China decreased the most (54 percent); followed by the Middle East and North Africa (50 percent); and India (47 percent) (see Figure 6).
Because China and India are the two top senders of international students to the U.S., the large decreases in both applications and enrollments have had a profound impact on those HEIs which have not significantly diversified their source markets beyond those regions. The declines are a wakeup call for institutions to think more strategically about how and where they recruit international students.
The large decreases in applications from the MENA region—an area that includes many of the countries targeted by President Trump’s travel ban—seem to confirm the warnings of higher education officials that the ban would hinder U.S. institutions’ ability to attract international students. Although the drastic decreases from Saudi Arabia specifically are largely attributable to the stricter requirements of KASP, there is evidence that the political climate and travel ban3 have exacerbated the effect of the KASP restrictions (Andrews & Mattern, 2017).
Navigating a New Paradigm for International Student Recruitment | © 2018 World Education Services. All rights reserved.
10
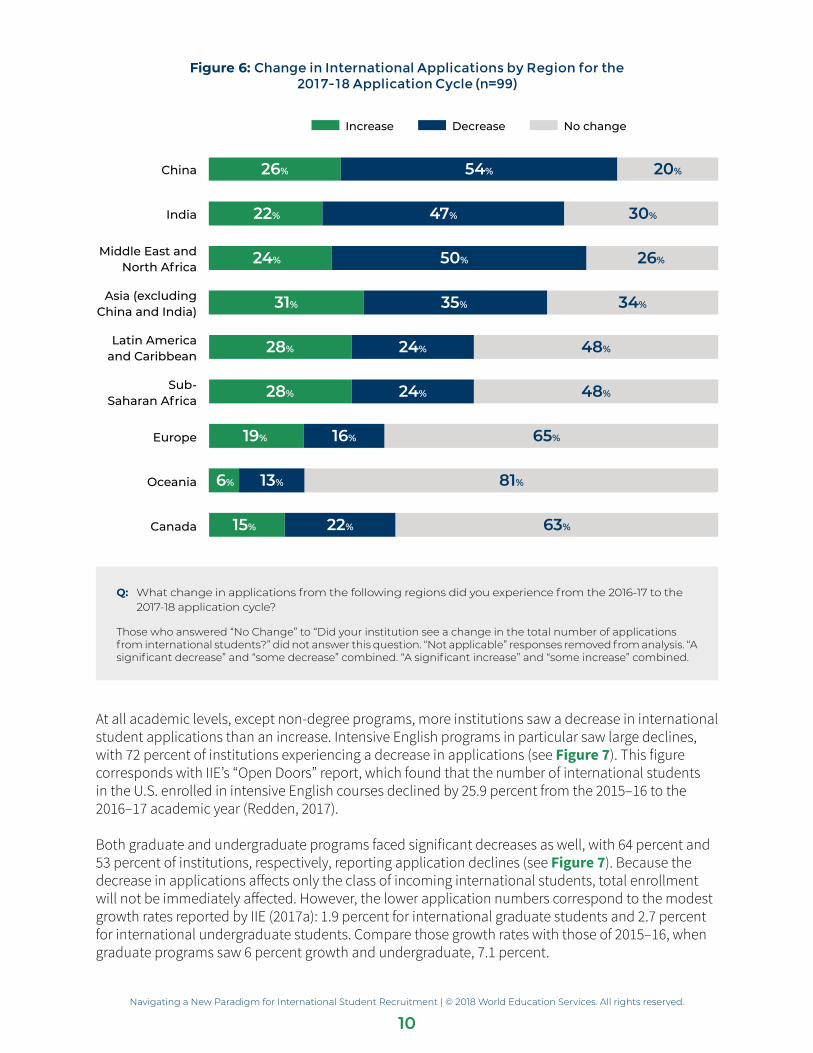
Figure 6: Change in International Applications by Region for the 2017-18 Application Cycle (n=99)
Increase Decrease No change
China 26% 54% 20%
India 22% 47% 30%
Middle East and North Africa
24% 50% 26%
Asia (excluding China and India)
31% 35% 34%
Latin America and Caribbean
28% 24% 48%
Sub-Saharan Africa
28% 24% 48%
Europe 19% 16% 65%
Oceania 6% 13% 81%
Canada 15% 22% 63%
Q: What change in applications from the following regions did you experience from the 2016-17 to the 2017-18 application cycle?
Those who answered “No Change” to “Did your institution see a change in the total number of applications from international students?” did not answer this question. “Not applicable” responses removed from analysis. “A significant decrease” and “some decrease” combined. “A significant increase” and “some increase” combined.
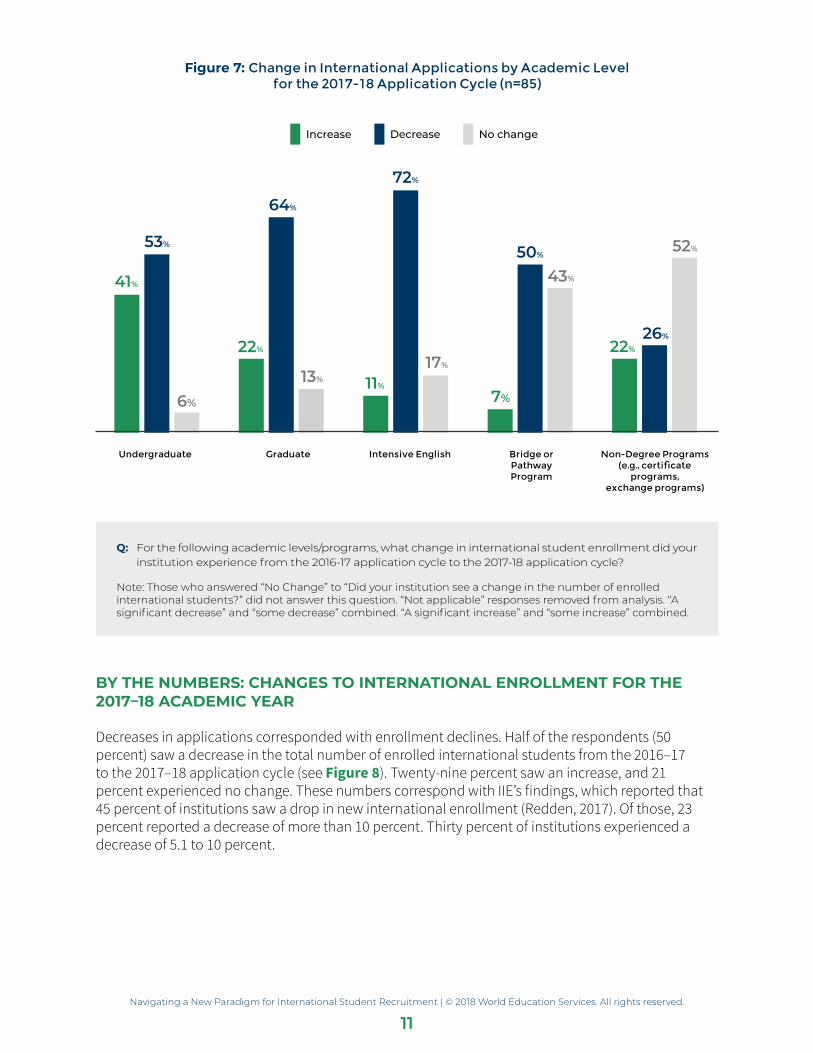
At all academic levels, except non-degree programs, more institutions saw a decrease in international student applications than an increase. Intensive English programs in particular saw large declines, with 72 percent of institutions experiencing a decrease in applications (see Figure 7). This figure corresponds with IIE’s “Open Doors” report, which found that the number of international students in the U.S. enrolled in intensive English courses declined by 25.9 percent from the 2015–16 to the 2016–17 academic year (Redden, 2017).
Both graduate and undergraduate programs faced significant decreases as well, with 64 percent and 53 percent of institutions, respectively, reporting application declines (see Figure 7). Because the decrease in applications affects only the class of incoming international students, total enrollment will not be immediately affected. However, the lower application numbers correspond to the modest growth rates reported by IIE (2017a): 1.9 percent for international graduate students and 2.7 percent for international undergraduate students. Compare those growth rates with those of 2015–16, when graduate programs saw 6 percent growth and undergraduate, 7.1 percent.
Navigating a New Paradigm for International Student Recruitment | © 2018 World Education Services. All rights reserved.
11
Figure 7: Change in International Applications by Academic Level for the 2017-18 Application Cycle (n=85)
41+53+6+ 22+64+13+ 11+72+17+ 7+50+43+ 22+26+52+ Increase Decrease No change
Undergraduate
41%
53%
6%
Graduate
22%
64%
13%
Intensive English
11%
72%
17%
Bridge or Pathway Program
7%
50%
43%
Non-Degree Programs (e.g., certificate
programs, exchange programs)
22%26%
52%
Q: For the following academic levels/programs, what change in international student enrollment did your institution experience from the 2016-17 application cycle to the 2017-18 application cycle?
Note: Those who answered “No Change” to “Did your institution see a change in the number of enrolled international students?” did not answer this question. “Not applicable” responses removed from analysis. “A significant decrease” and “some decrease” combined. “A significant increase” and “some increase” combined.
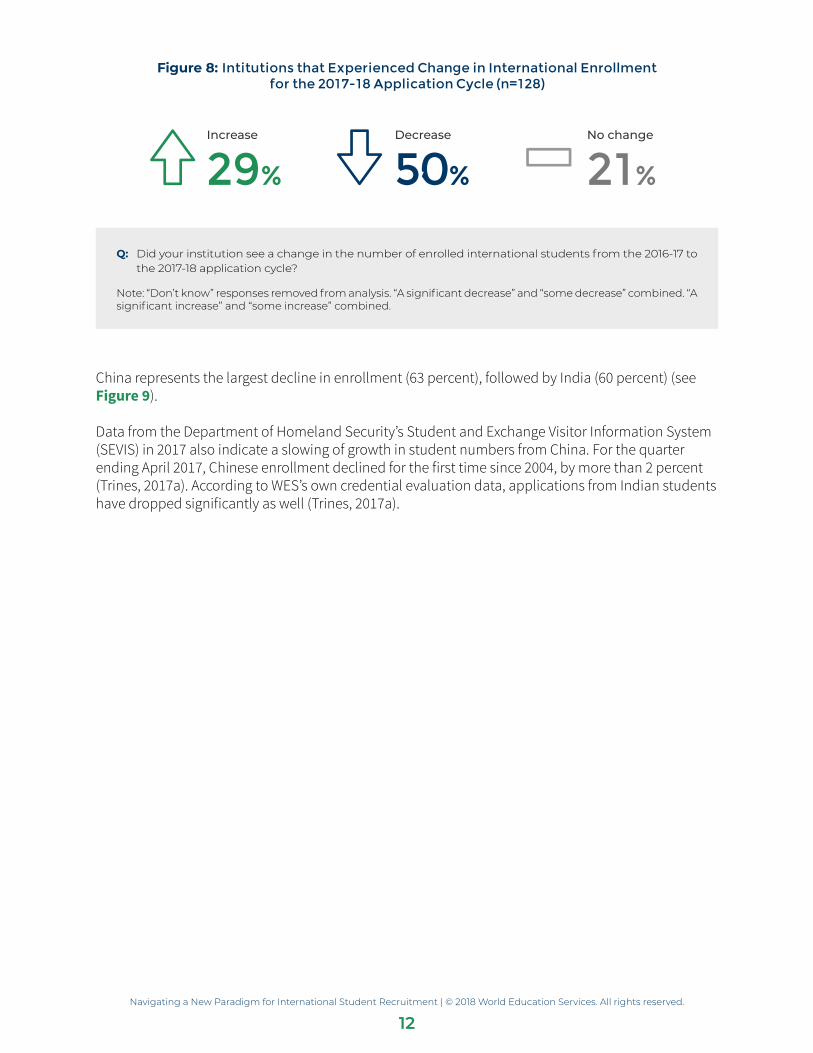
BY THE NUMBERS: CHANGES TO INTERNATIONAL ENROLLMENT FOR THE 2017–18 ACADEMIC YEAR
Decreases in applications corresponded with enrollment declines. Half of the respondents (50 percent) saw a decrease in the total number of enrolled international students from the 2016–17 to the 2017–18 application cycle (see Figure 8). Twenty-nine percent saw an increase, and 21 percent experienced no change. These numbers correspond with IIE’s findings, which reported that 45 percent of institutions saw a drop in new international enrollment (Redden, 2017). Of those, 23 percent reported a decrease of more than 10 percent. Thirty percent of institutions experienced a decrease of 5.1 to 10 percent.
Navigating a New Paradigm for International Student Recruitment | © 2018 World Education Services. All rights reserved.
12
Figure 8: Intitutions that Experienced Change in International Enrollment for the 2017-18 Application Cycle (n=128)
Increase
29%
Decrease
50%
No change
21%
Q: Did your institution see a change in the number of enrolled international students from the 2016-17 to the 2017-18 application cycle?
Note: “Don’t know” responses removed from analysis. “A significant decrease” and “some decrease” combined. “A significant increase” and “some increase” combined.
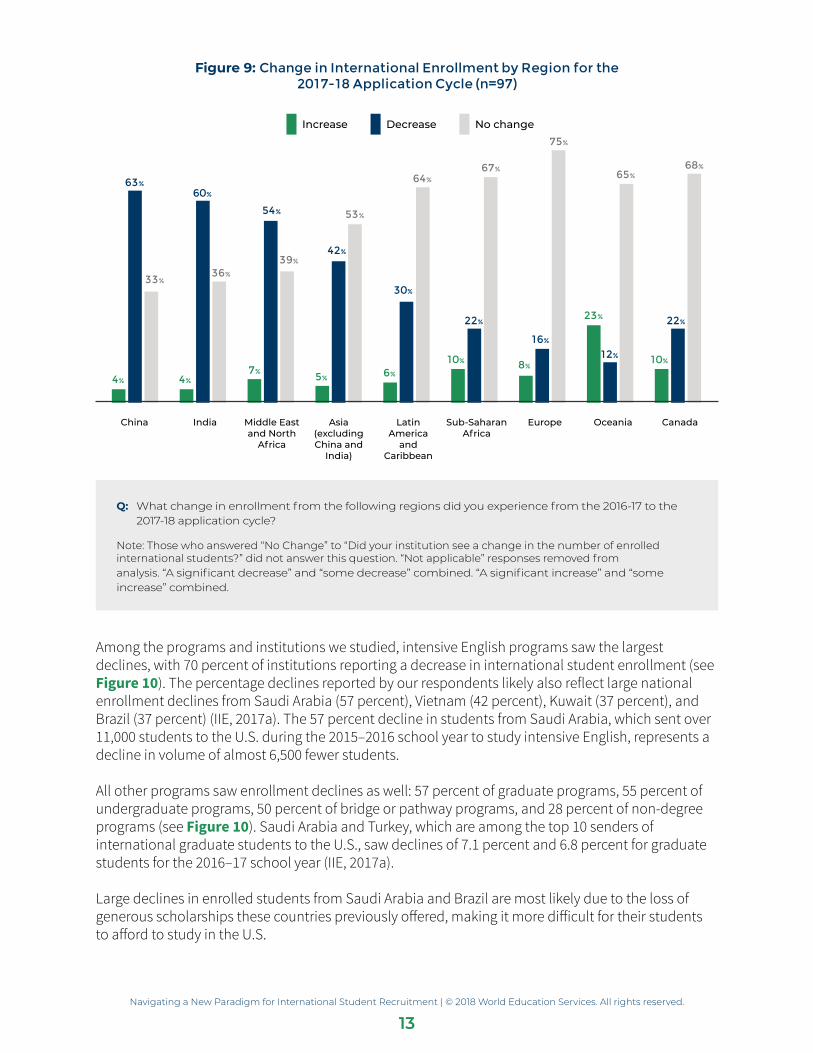
China represents the largest decline in enrollment (63 percent), followed by India (60 percent) (see Figure 9).
Data from the Department of Homeland Security’s Student and Exchange Visitor Information System (SEVIS) in 2017 also indicate a slowing of growth in student numbers from China. For the quarter ending April 2017, Chinese enrollment declined for the first time since 2004, by more than 2 percent (Trines, 2017a). According to WES’s own credential evaluation data, applications from Indian students have dropped significantly as well (Trines, 2017a).
Navigating a New Paradigm for International Student Recruitment | © 2018 World Education Services. All rights reserved.
13
Figure 9: Change in International Enrollment by Region for the 2017-18 Application Cycle (n=97)
Increase Decrease No change
4+63+33+ 4+60+36+ 7+54+39+ 5+42+53+ 6+30+64+ 10+22+67+ 8+16+75+ 23+12+65+ 10+22+68
China
4%
63%
33%
India
4%
60%
36%
Middle East and North
Africa
7%
54%
39%
Asia (excluding China and
India)
5%
42%
53%
Latin America
and Caribbean
6%
30%
64%
Sub-Saharan Africa
10%
22%
67%
Europe
8%
16%
75%
Oceania
23%
12%
65%
Canada
10%
22%
68%
Q: What change in enrollment from the following regions did you experience from the 2016-17 to the 2017-18 application cycle?
Note: Those who answered “No Change” to “Did your institution see a change in the number of enrolled international students?” did not answer this question. “Not applicable” responses removed from analysis. “A significant decrease” and “some decrease” combined. “A significant increase” and “some increase” combined.
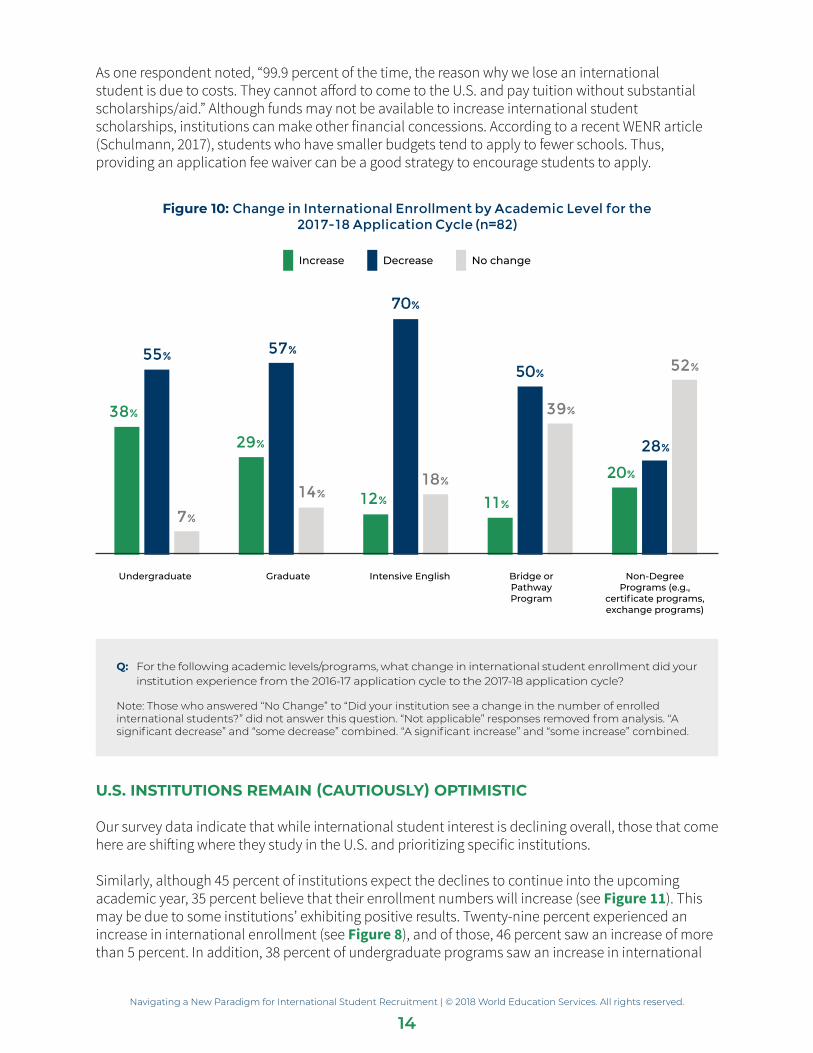
Among the programs and institutions we studied, intensive English programs saw the largest declines, with 70 percent of institutions reporting a decrease in international student enrollment (see Figure 10). The percentage declines reported by our respondents likely also reflect large national enrollment declines from Saudi Arabia (57 percent), Vietnam (42 percent), Kuwait (37 percent), and Brazil (37 percent) (IIE, 2017a). The 57 percent decline in students from Saudi Arabia, which sent over 11,000 students to the U.S. during the 2015–2016 school year to study intensive English, represents a decline in volume of almost 6,500 fewer students.
All other programs saw enrollment declines as well: 57 percent of graduate programs, 55 percent of undergraduate programs, 50 percent of bridge or pathway programs, and 28 percent of non-degree programs (see Figure 10). Saudi Arabia and Turkey, which are among the top 10 senders of international graduate students to the U.S., saw declines of 7.1 percent and 6.8 percent for graduate students for the 2016–17 school year (IIE, 2017a).
Large declines in enrolled students from Saudi Arabia and Brazil are most likely due to the loss of generous scholarships these countries previously offered, making it more difficult for their students to afford to study in the U.S.
Navigating a New Paradigm for International Student Recruitment | © 2018 World Education Services. All rights reserved.
14
As one respondent noted, “99.9 percent of the time, the reason why we lose an international student is due to costs. They cannot afford to come to the U.S. and pay tuition without substantial scholarships/aid.” Although funds may not be available to increase international student scholarships, institutions can make other financial concessions. According to a recent WENR article (Schulmann, 2017), students who have smaller budgets tend to apply to fewer schools. Thus, providing an application fee waiver can be a good strategy to encourage students to apply.
Figure 10: Change in International Enrollment by Academic Level for the 2017-18 Application Cycle (n=82)
Increase Decrease No change
38+55+7+ 29+57+14+ 12+70+18+ 11+50+39+ 20+28+52+
Undergraduate
38%
55%
7%
Graduate
29%
57%
14%
Intensive English
12%
70%
18%
Bridge or Pathway Program
11%
50%
39%
Non-Degree Programs (e.g.,
certificate programs, exchange programs)
20%
28%
52%
Q: For the following academic levels/programs, what change in international student enrollment did your institution experience from the 2016-17 application cycle to the 2017-18 application cycle?
Note: Those who answered “No Change” to “Did your institution see a change in the number of enrolled international students?” did not answer this question. “Not applicable” responses removed from analysis. “A significant decrease” and “some decrease” combined. “A significant increase” and “some increase” combined.
U.S. INSTITUTIONS REMAIN (CAUTIOUSLY) OPTIMISTIC
Our survey data indicate that while international student interest is declining overall, those that come here are shifting where they study in the U.S. and prioritizing specific institutions.
Similarly, although 45 percent of institutions expect the declines to continue into the upcoming academic year, 35 percent believe that their enrollment numbers will increase (see Figure 11). This may be due to some institutions’ exhibiting positive results. Twenty-nine percent experienced an increase in international enrollment (see Figure 8), and of those, 46 percent saw an increase of more than 5 percent. In addition, 38 percent of undergraduate programs saw an increase in international
Navigating a New Paradigm for International Student Recruitment | © 2018 World Education Services. All rights reserved.
15
enrollment (see Figure 10), with large increases from Oceania (23 percent), Canada (10 percent), and Sub-Saharan Africa (10 percent) (see Figure 9). In fact, HEIs seem to be relatively optimistic about their international enrollment prospects for the upcoming application cycle.
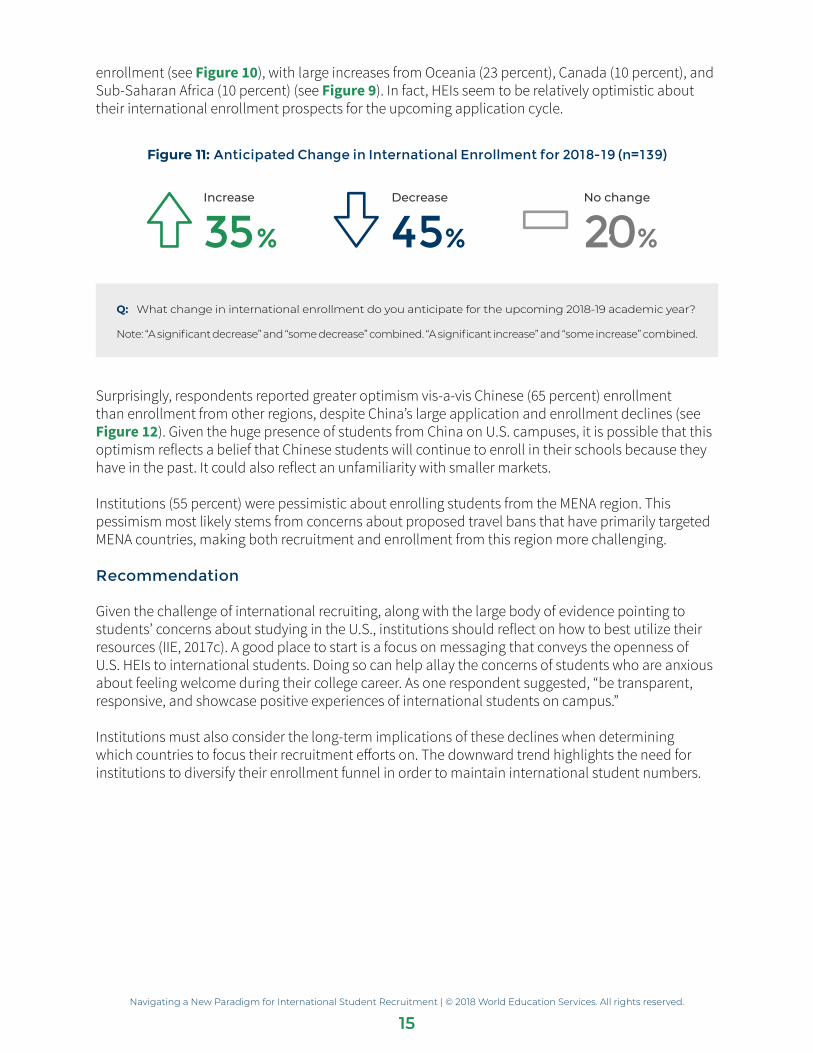
Figure 11: Anticipated Change in International Enrollment for 2018-19 (n=139)
Increase
35%
Decrease
45%
No change
20%
Q: What change in international enrollment do you anticipate for the upcoming 2018-19 academic year?
Note: “A significant decrease” and “some decrease” combined. “A significant increase” and “some increase” combined.
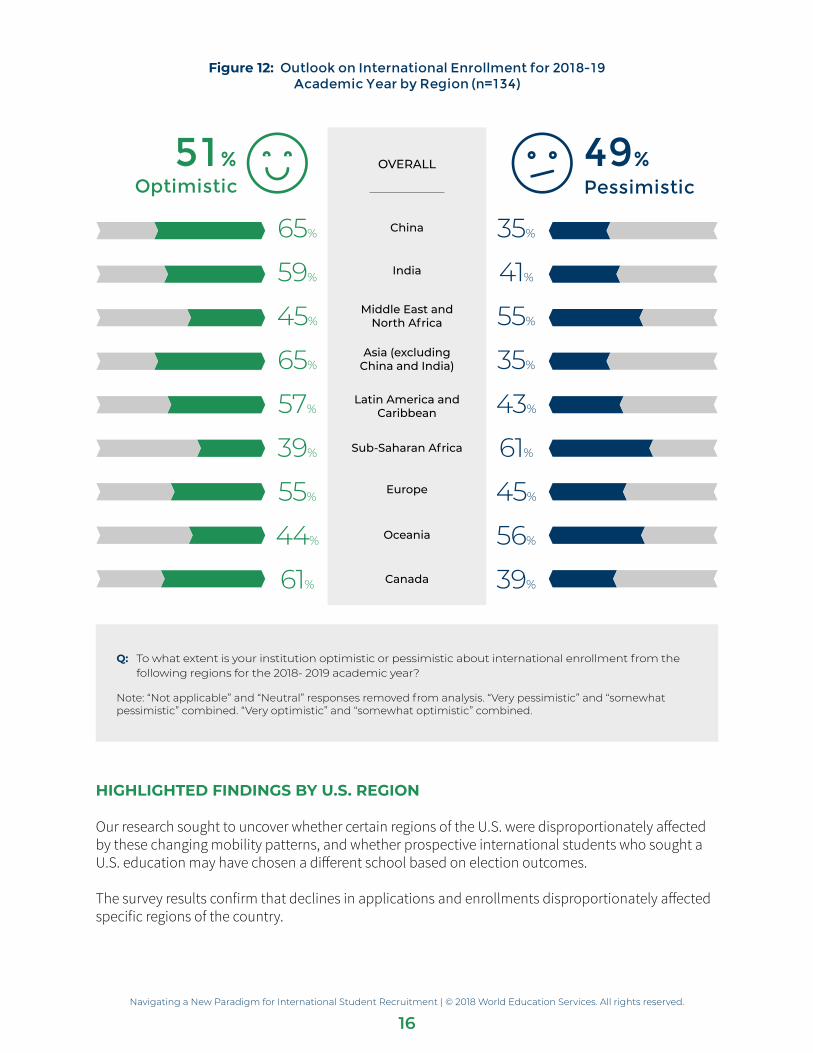
Surprisingly, respondents reported greater optimism vis-a-vis Chinese (65 percent) enrollment than enrollment from other regions, despite China’s large application and enrollment declines (see Figure 12). Given the huge presence of students from China on U.S. campuses, it is possible that this optimism reflects a belief that Chinese students will continue to enroll in their schools because they have in the past. It could also reflect an unfamiliarity with smaller markets.
Institutions (55 percent) were pessimistic about enrolling students from the MENA region. This pessimism most likely stems from concerns about proposed travel bans that have primarily targeted MENA countries, making both recruitment and enrollment from this region more challenging.
Recommendation
Given the challenge of international recruiting, along with the large body of evidence pointing to students’ concerns about studying in the U.S., institutions should reflect on how to best utilize their resources (IIE, 2017c). A good place to start is a focus on messaging that conveys the openness of U.S. HEIs to international students. Doing so can help allay the concerns of students who are anxious about feeling welcome during their college career. As one respondent suggested, “be transparent, responsive, and showcase positive experiences of international students on campus.”
Institutions must also consider the long-term implications of these declines when determining which countries to focus their recruitment efforts on. The downward trend highlights the need for institutions to diversify their enrollment funnel in order to maintain international student numbers.
Navigating a New Paradigm for International Student Recruitment | © 2018 World Education Services. All rights reserved.
16
Figure 12: Outlook on International Enrollment for 2018-19 Academic Year by Region (n=134)
OVERALL51%Optimistic
49%Pessimistic
China65% 35%
India59% 41%
Middle East and North Africa45% 55%
Asia (excluding China and India)65% 35%
Latin America and Caribbean57% 43%
Sub-Saharan Africa39% 61%
Europe55% 45%
Oceania44% 56%
Canada61% 39%
650+350 350+650
410+590
390+610
560+440
430+570
450+550
350+650
610+390
550+450
390+610
590+410
550+450
450+550
440+560
650+350
610+390
570+430Q: To what extent is your institution optimistic or pessimistic about international enrollment from the
following regions for the 2018- 2019 academic year?
Note: “Not applicable” and “Neutral” responses removed from analysis. “Very pessimistic” and “somewhat pessimistic” combined. “Very optimistic” and “somewhat optimistic” combined.
HIGHLIGHTED FINDINGS BY U.S. REGION
Our research sought to uncover whether certain regions of the U.S. were disproportionately affected by these changing mobility patterns, and whether prospective international students who sought a U.S. education may have chosen a different school based on election outcomes.
The survey results confirm that declines in applications and enrollments disproportionately affected specific regions of the country.
Navigating a New Paradigm for International Student Recruitment | © 2018 World Education Services. All rights reserved.
17
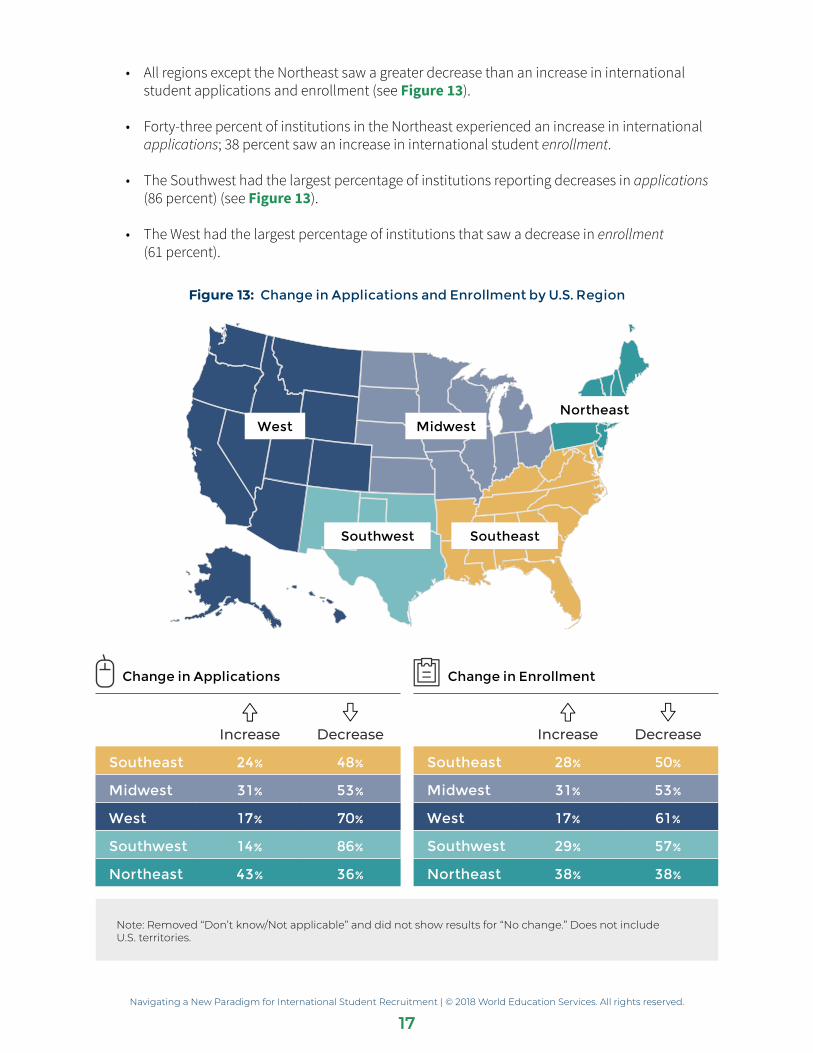
• All regions except the Northeast saw a greater decrease than an increase in international student applications and enrollment (see Figure 13).
• Forty-three percent of institutions in the Northeast experienced an increase in international applications; 38 percent saw an increase in international student enrollment.
• The Southwest had the largest percentage of institutions reporting decreases in applications (86 percent) (see Figure 13).
• The West had the largest percentage of institutions that saw a decrease in enrollment (61 percent).
Figure 13: Change in Applications and Enrollment by U.S. Region
Change in Applications
Increase
Decrease
Southeast 24% 48%
Midwest 31% 53%
West 17% 70%
Southwest 14% 86%
Northeast 43% 36%
West Midwest
Southwest Southeast
Northeast
Change in Enrollment
Increase
Decrease
Southeast 28% 50%
Midwest 31% 53%
West 17% 61%
Southwest 29% 57%
Northeast 38% 38%
Note: Removed “Don’t know/Not applicable” and did not show results for “No change.” Does not include U.S. territories.
Navigating a New Paradigm for International Student Recruitment | © 2018 World Education Services. All rights reserved.
18
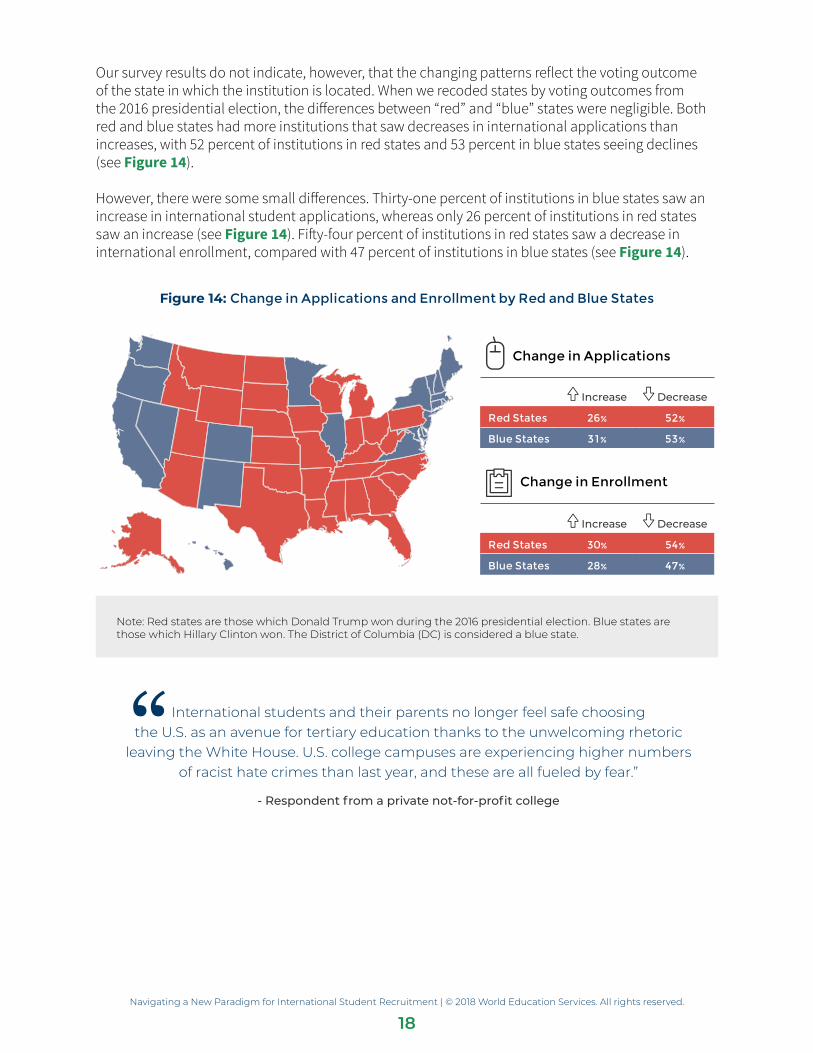
Our survey results do not indicate, however, that the changing patterns reflect the voting outcome of the state in which the institution is located. When we recoded states by voting outcomes from the 2016 presidential election, the differences between “red” and “blue” states were negligible. Both red and blue states had more institutions that saw decreases in international applications than increases, with 52 percent of institutions in red states and 53 percent in blue states seeing declines (see Figure 14).
However, there were some small differences. Thirty-one percent of institutions in blue states saw an increase in international student applications, whereas only 26 percent of institutions in red states saw an increase (see Figure 14). Fifty-four percent of institutions in red states saw a decrease in international enrollment, compared with 47 percent of institutions in blue states (see Figure 14).
Figure 14: Change in Applications and Enrollment by Red and Blue States
Change in Applications
Increase Decrease
Red States 26% 52%
Blue States 31% 53%
Change in Enrollment
Increase Decrease
Red States 30% 54%
Blue States 28% 47%
Note: Red states are those which Donald Trump won during the 2016 presidential election. Blue states are those which Hillary Clinton won. The District of Columbia (DC) is considered a blue state.
International students and their parents no longer feel safe choosing the U.S. as an avenue for tertiary education thanks to the unwelcoming rhetoric
leaving the White House. U.S. college campuses are experiencing higher numbers of racist hate crimes than last year, and these are all fueled by fear.”
- Respondent from a private not-for-profit college
Navigating a New Paradigm for International Student Recruitment | © 2018 World Education Services. All rights reserved.
19
CAUSE AND EFFECT: THE ROLE OF U.S. POLITICS AND AN EVOLVING INTERNATIONAL ADMISSIONS PARADIGM
The vast majority of respondents to our survey pointed to one cause of HEIs’ international recruitment challenges: the political environment in the U.S.
KEY FINDINGS
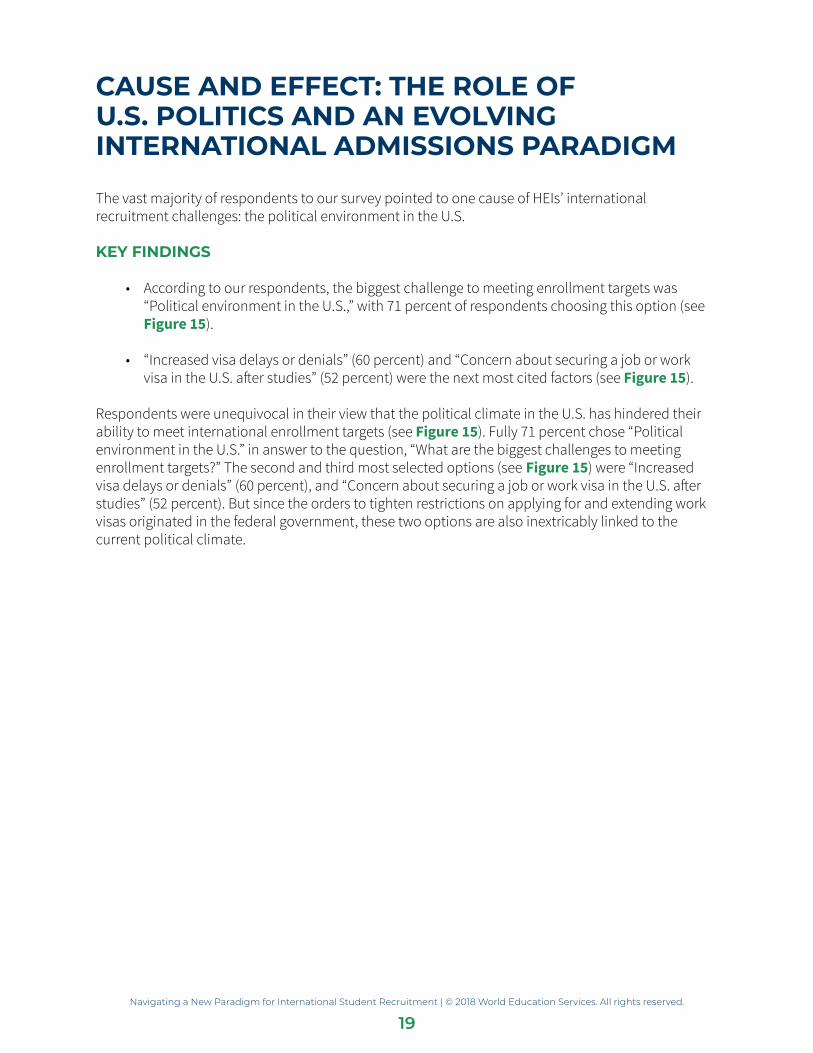
• According to our respondents, the biggest challenge to meeting enrollment targets was “Political environment in the U.S.,” with 71 percent of respondents choosing this option (see Figure 15).
• “Increased visa delays or denials” (60 percent) and “Concern about securing a job or work visa in the U.S. after studies” (52 percent) were the next most cited factors (see Figure 15).
Respondents were unequivocal in their view that the political climate in the U.S. has hindered their ability to meet international enrollment targets (see Figure 15). Fully 71 percent chose “Political environment in the U.S.” in answer to the question, “What are the biggest challenges to meeting enrollment targets?” The second and third most selected options (see Figure 15) were “Increased visa delays or denials” (60 percent), and “Concern about securing a job or work visa in the U.S. after studies” (52 percent). But since the orders to tighten restrictions on applying for and extending work visas originated in the federal government, these two options are also inextricably linked to the current political climate.
Navigating a New Paradigm for International Student Recruitment | © 2018 World Education Services. All rights reserved.
20
Figure 15: Factors that Negatively Affected Institutions’ International Enrollment (n=139)
71%
Political environment in the U.S.
60%
Increased visa delays or denials
52%
Concern about securing a job or work visa in the U.S. after studies
51%
Increased competition from institutions in other countries
45%
Rising cost of tuition
44%
Concern about securing an internship or the future of CPT/OPT
43%
Lack or loss of government-sponsored scholarship programs in students’ home countries
42%
Political or economic issues in students’ home countries
36%
Increased competition from other institutions within the U.S.
24%
Students opting for higher education in home country
4%
No challenges
9%
Other
290+710
=
480+520
=
400+600
=
490+510
=
550+450
=
570+430
=
560+440
=
580+420
=
640+360
=
960+40=
760+240
=
910+90=
Q: Which, if any, of the following had a negative impact on your institution in terms of meeting international enrollment targets?
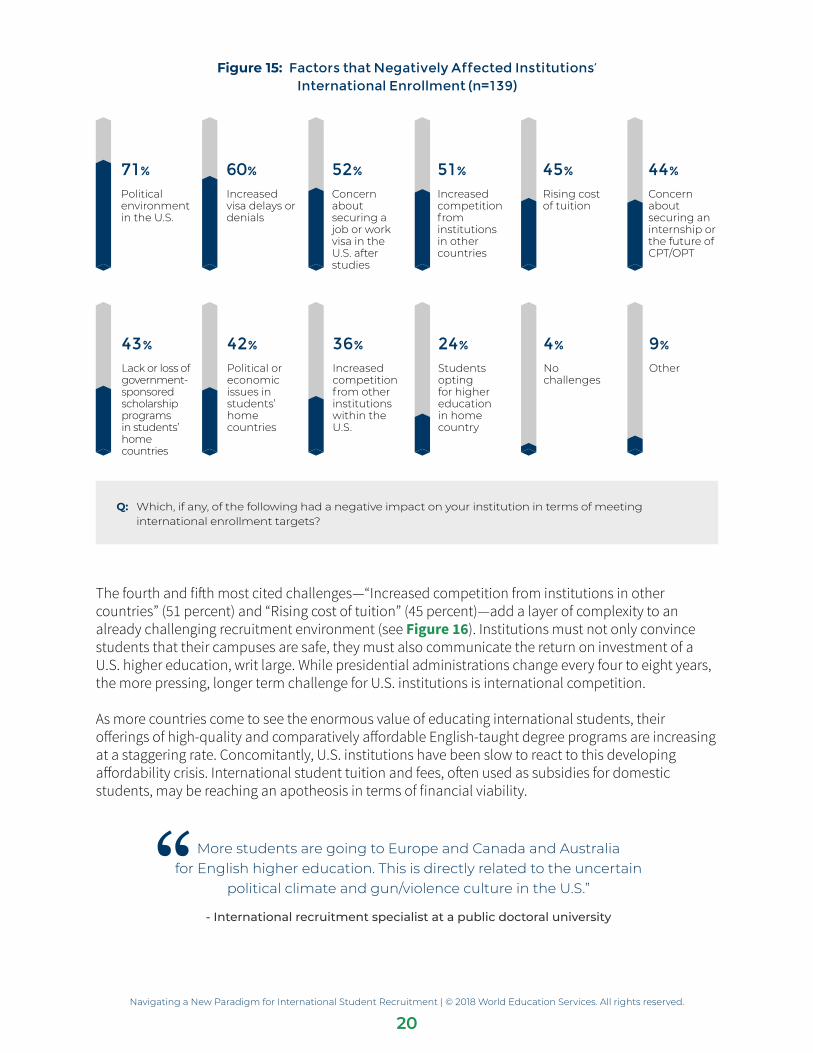
The fourth and fifth most cited challenges—“Increased competition from institutions in other countries” (51 percent) and “Rising cost of tuition” (45 percent)—add a layer of complexity to an already challenging recruitment environment (see Figure 16). Institutions must not only convince students that their campuses are safe, they must also communicate the return on investment of a U.S. higher education, writ large. While presidential administrations change every four to eight years, the more pressing, longer term challenge for U.S. institutions is international competition.
As more countries come to see the enormous value of educating international students, their offerings of high-quality and comparatively affordable English-taught degree programs are increasing at a staggering rate. Concomitantly, U.S. institutions have been slow to react to this developing affordability crisis. International student tuition and fees, often used as subsidies for domestic students, may be reaching an apotheosis in terms of financial viability.
More students are going to Europe and Canada and Australia
for English higher education. This is directly related to the uncertain political climate and gun/violence culture in the U.S.”
- International recruitment specialist at a public doctoral university
Navigating a New Paradigm for International Student Recruitment | © 2018 World Education Services. All rights reserved.
21
RECRUITMENT STRATEGIES: INTERNATIONAL HIGHER ED REACTSU.S. institutions are reacting to the pressure of a rapidly evolving global recruitment landscape. Seventy-three percent of respondents have already altered or are planning to alter their international recruitment strategy because of declining international student interest. Notably, however, most institutions surveyed (80 percent) have not increased their budget for the 2018–19 application cycle. Instead, they are by and large doubling down on many international recruitment strategies, and allocating more resources to lower cost tactics (see Figure 16).
KEY FINDINGS
• Seventy-three percent of institutions have already altered or are planning to alter their international student recruitment strategy for the upcoming cycle.
• Twenty percent of institutions have increased their budget for international student recruitment for the upcoming cycle, while 26 percent have decreased their budget.
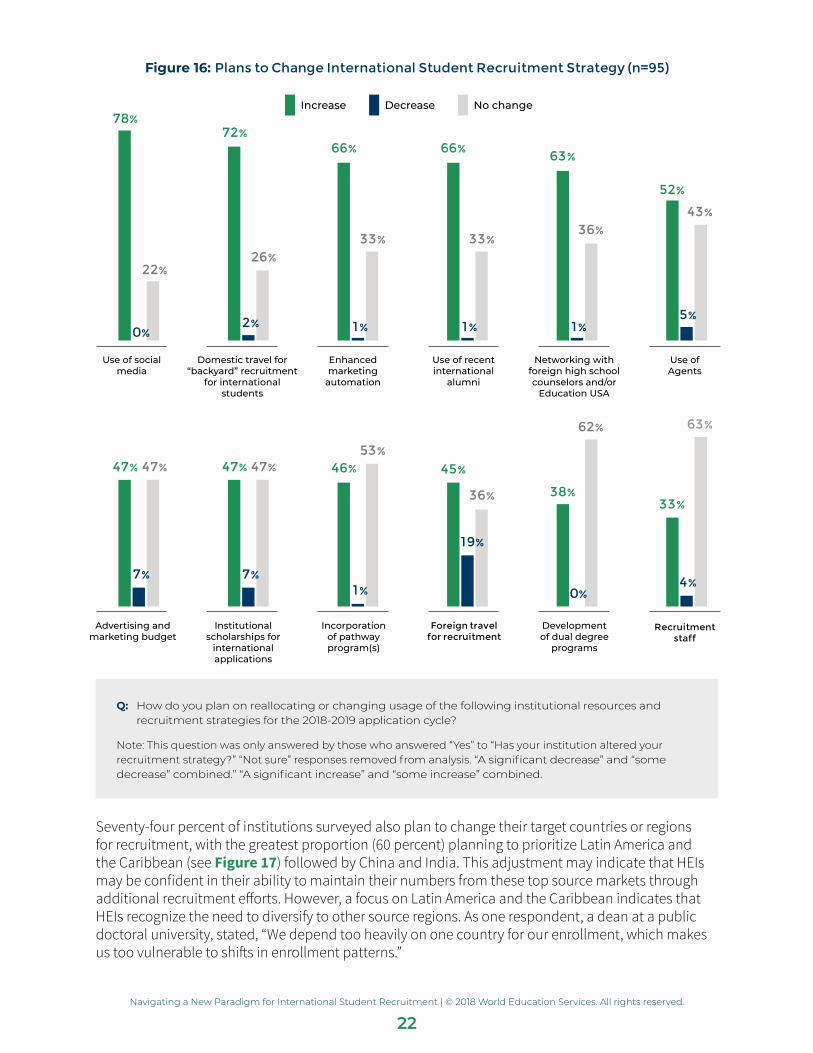
• The resources and strategies institutions intend to increase the most are “use of social media” (78 percent), and “domestic travel for ‘backyard’ recruitment for international students” (72 percent) (see Figure 16).
• Seventy-four percent of institutions plan to change their target countries or regions in response to declining interest; 26 percent do not (see Figure 16).
• Sixty percent of institutions plan to prioritize Latin America and the Caribbean; 51 percent plan to prioritize China; 44 percent, India; and 27 percent, the MENA region, where countries that showed some of the largest declines are located (see Figure 17).
Half of the survey respondents plan to increase their use of five different strategies, and one third plan to increase their use of all the strategies listed in the survey. The only strategy that a significant number of institutions plan to decrease is “Foreign travel for recruitment,” with 19 percent of institutions planning to decrease their travel, likely because of cost. (For all the strategies, see Figure 16.)
The resources and strategies that institutions intend to make the greatest use of are social media (78 percent) and “Domestic travel for ‘backyard’ recruitment for international students” (72 percent) (see Figure 16). Other popular strategies are “Enhanced marketing automation” (66 percent), increased “Use of recent international alumni” (66 percent), “Networking with foreign high school counselors and/or Education USA” (63 percent), and “Use of agents” (52 percent) (see Figure 16).
Navigating a New Paradigm for International Student Recruitment | © 2018 World Education Services. All rights reserved.
22
Figure 16: Plans to Change International Student Recruitment Strategy (n=95)
Increase Decrease No change
78+0+22+ 72+2+26+ 66+1+33+ 66+1+33+ 63+1+36+ 52+5+43+ 47+7+47+ 47+7+47+ 46+1+53+ 46+19+36+ 38+0+62+ 33+4+63+
Use of social media
78%
0%
22%
Domestic travel for “backyard” recruitment
for international students
72%
2%
26%
Enhanced marketing
automation
66%
1%
33%
Use of recent international
alumni
66%
1%
33%
Networking with foreign high school counselors and/or
Education USA
63%
1%
36%
Use of Agents
52%
5%
43%
Advertising and marketing budget
47%
7%
47%
Institutional scholarships for
international applications
47%
7%
47%
Incorporation of pathway program(s)
46%
1%
53%
Foreign travel for recruitment
45%
19%
36%
Development of dual degree
programs
38%
0%
62%
Recruitment staff
33%
4%
63%
Q: How do you plan on reallocating or changing usage of the following institutional resources and recruitment strategies for the 2018-2019 application cycle?
Note: This question was only answered by those who answered “Yes” to “Has your institution altered your recruitment strategy?” “Not sure” responses removed from analysis. “A significant decrease” and “some decrease” combined.” “A significant increase” and “some increase” combined.
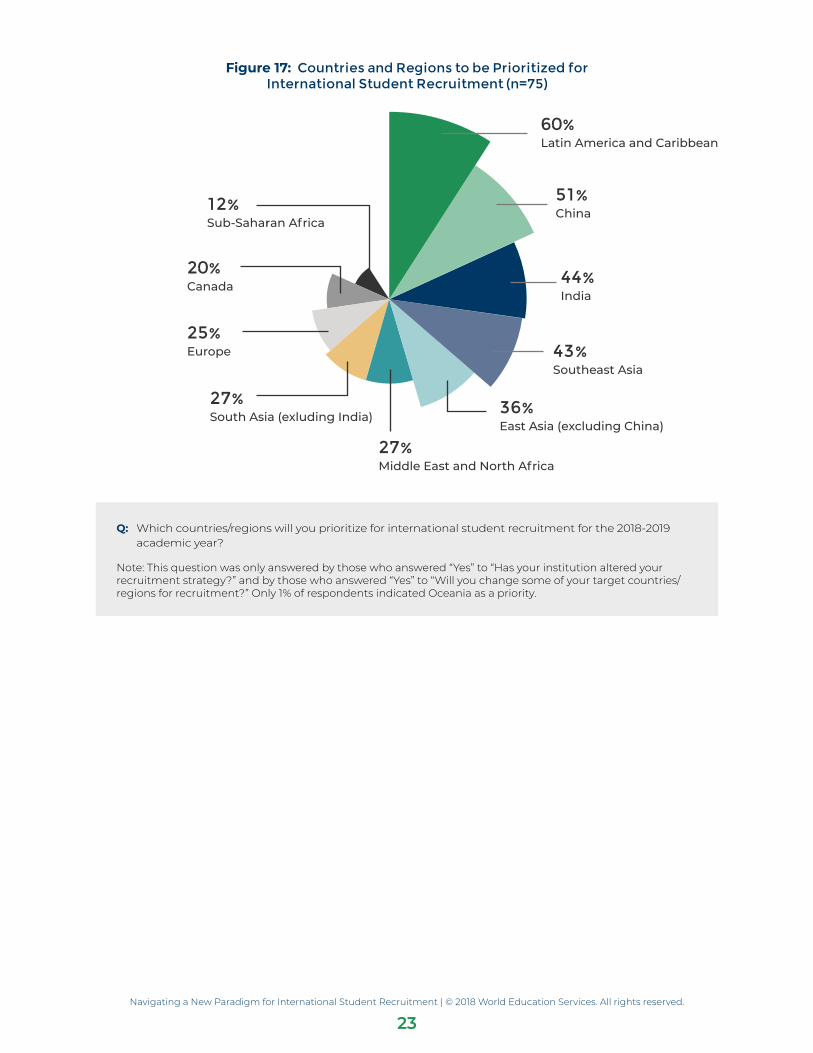
Seventy-four percent of institutions surveyed also plan to change their target countries or regions for recruitment, with the greatest proportion (60 percent) planning to prioritize Latin America and the Caribbean (see Figure 17) followed by China and India. This adjustment may indicate that HEIs may be confident in their ability to maintain their numbers from these top source markets through additional recruitment efforts. However, a focus on Latin America and the Caribbean indicates that HEIs recognize the need to diversify to other source regions. As one respondent, a dean at a public doctoral university, stated, “We depend too heavily on one country for our enrollment, which makes us too vulnerable to shifts in enrollment patterns.”
Navigating a New Paradigm for International Student Recruitment | © 2018 World Education Services. All rights reserved.
23
Figure 17: Countries and Regions to be Prioritized for International Student Recruitment (n=75)
60%Latin America and Caribbean
51%China
44%India
43%Southeast Asia
36%East Asia (excluding China)
27%Middle East and North Africa
27%South Asia (exluding India)
25%Europe
20%Canada
12%Sub-Saharan Africa
Q: Which countries/regions will you prioritize for international student recruitment for the 2018-2019 academic year?
Note: This question was only answered by those who answered “Yes” to “Has your institution altered your recruitment strategy?” and by those who answered “Yes” to “Will you change some of your target countries/regions for recruitment?” Only 1% of respondents indicated Oceania as a priority.
Navigating a New Paradigm for International Student Recruitment | © 2018 World Education Services. All rights reserved.
24
SUPPORTING INTERNATIONAL STUDENTS DURING TURBULENT TIMES While our research sought to understand the challenges of international recruitment in a difficult political landscape, effective recruitment does not occur in a vacuum. To recruit international students effectively in this climate, an institution must convey its ability to provide a supportive and high-quality educational experience. International students on campus and alumni can be essential to an HEI’s international recruitment strategy, as well as the development of a sustainable pipeline.
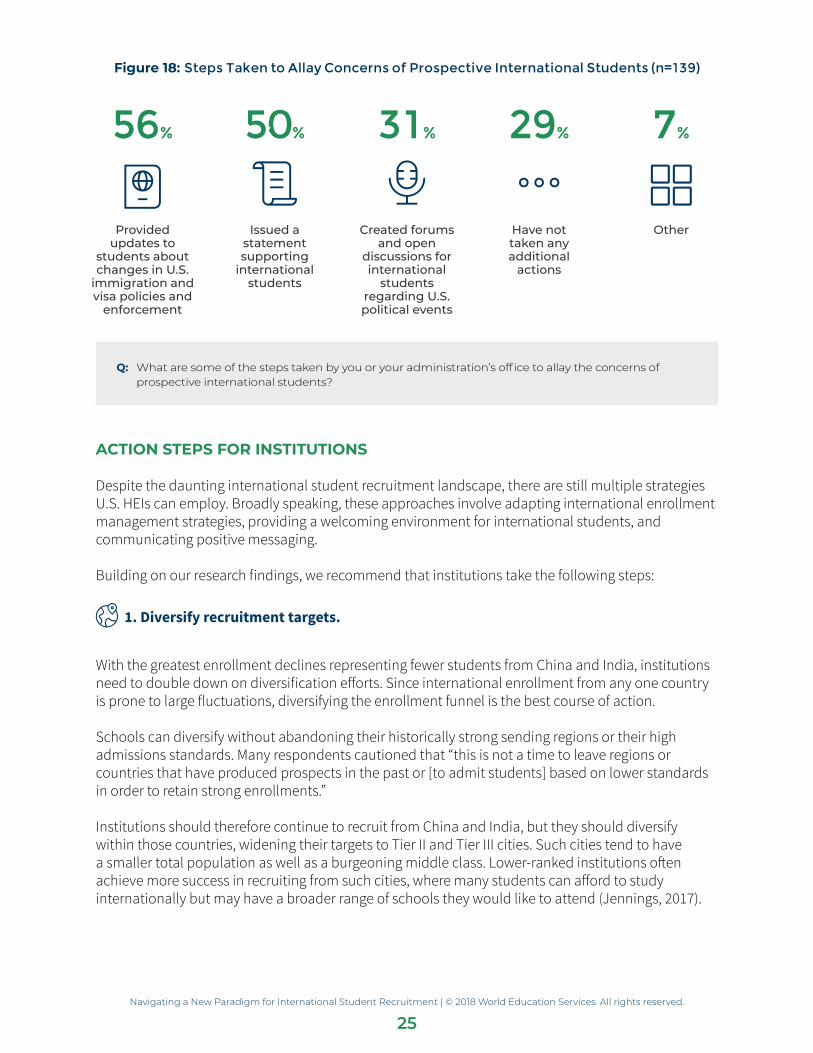
Furthermore, U.S. institutions have an ethical imperative to create a welcoming space for the international students they recruit, especially at a time when students may feel particularly vulnerable or alienated. When asked which steps institutions are taking to allay the concerns of prospective international students, 56 percent of institutions reported providing updates to students about changes in U.S. immigration and visa policies and enforcement. Half issued a statement supporting international students, 31 percent created forums and open discussions for international students regarding U.S. political events, but 29 percent have not taken any additional action (see Figure 18).
Effects of the #YouAreWelcomeHere Campaign
The #YouAreWelcomeHere campaign was designed to affirm to international students that U.S. HEIs are still friendly, welcoming, and safe, regardless of what is portrayed in the media. The 335+ participating HEIs engage in conveying this message through photos, videos, events, and more.
Forty-eight percent of institutions have participated in the #YouAreWelcomeHere campaign, whereas 52 percent have not. Of those that participated, the most common methods were using the #YouAreWelcomeHere hashtag across social media (63 percent) and creating a video emphasizing the #YouAreWelcomeHere message (63 percent). Other methods were adding information about #YouAreWelcomeHere to admissions brochures or to the university website (48 percent), hosting a #YouAreWelcomeHere campus event (23 percent), and creating and distributing #YouAreWelcomeHere branded products (19 percent). Six percent of respondents made other welcoming overtures, such as putting up posters and signs, and sending emails.
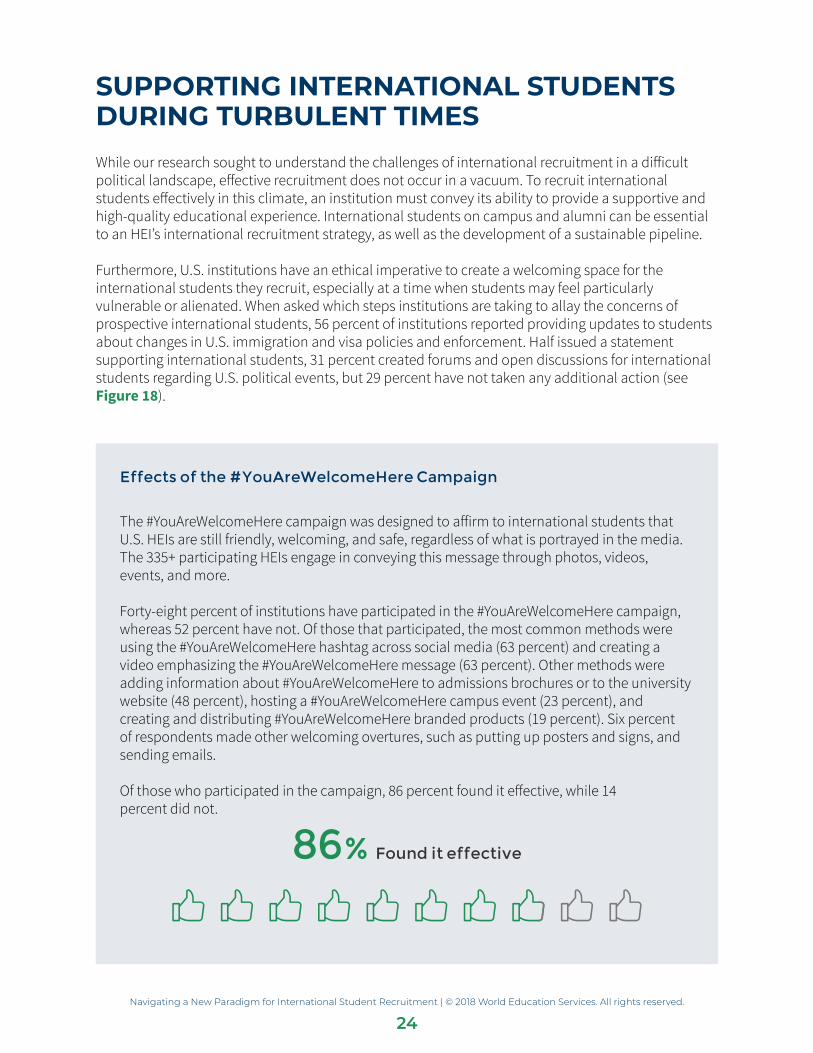
Of those who participated in the campaign, 86 percent found it effective, while 14 percent did not.
86% Found it effective
Navigating a New Paradigm for International Student Recruitment | © 2018 World Education Services. All rights reserved.
25
Figure 18: Steps Taken to Allay Concerns of Prospective International Students (n=139)
Provided updates to
students about changes in U.S.
immigration and visa policies and
enforcement
56%
Issued a statement supporting
international students
50%
Created forums and open
discussions for international
students regarding U.S. political events
31%
Have not taken any additional
actions
29%
Other
7%
Q: What are some of the steps taken by you or your administration’s office to allay the concerns of prospective international students?
ACTION STEPS FOR INSTITUTIONS
Despite the daunting international student recruitment landscape, there are still multiple strategies U.S. HEIs can employ. Broadly speaking, these approaches involve adapting international enrollment management strategies, providing a welcoming environment for international students, and communicating positive messaging.
Building on our research findings, we recommend that institutions take the following steps:
1. Diversify recruitment targets.
With the greatest enrollment declines representing fewer students from China and India, institutions need to double down on diversification efforts. Since international enrollment from any one country is prone to large fluctuations, diversifying the enrollment funnel is the best course of action.
Schools can diversify without abandoning their historically strong sending regions or their high admissions standards. Many respondents cautioned that “this is not a time to leave regions or countries that have produced prospects in the past or [to admit students] based on lower standards in order to retain strong enrollments.”
Institutions should therefore continue to recruit from China and India, but they should diversify within those countries, widening their targets to Tier II and Tier III cities. Such cities tend to have a smaller total population as well as a burgeoning middle class. Lower-ranked institutions often achieve more success in recruiting from such cities, where many students can afford to study internationally but may have a broader range of schools they would like to attend (Jennings, 2017).
Navigating a New Paradigm for International Student Recruitment | © 2018 World Education Services. All rights reserved.
26
2. Emphasize a welcoming environment.
Institutions need to cultivate a keen awareness of how prospective international students view the current political climate in the U.S., especially since this was the challenge survey respondents cited most. In fact, half of the institutions in our survey have issued a statement supporting international students. One respondent even said that “in communicating via email or text with students, we always start each email with, ‘you are welcome at our institution.’”
The #YouAreWelcomeHere campaign is one way multiple institutions have banded together to demonstrate solidarity and show support for international students; 86 percent of survey respondents found the campaign effective. For students already on campus, schools can hold forums to facilitate discussions about current politics in the U.S., which 31 percent of the institutions in our survey have done. Providing such discussion spaces or town hall meetings shows that institutions are aware of the needs of international students, and it allows students to connect with their peers (Skinner, 2018).
3. Provide support resources for international students.
HEIs need sufficient support resources for international students, who are in a particularly vulnerable state. Over a quarter of our respondents reported not taking any additional action to allay the concerns of prospective international students. At a time when these students are in need of support, some HEIs may just be at a loss for what resources they should provide and how they should provide them. Resources for international students can include up-to-date information about immigration and visa policies that may affect their education, a method used by 56 percent of institutions in our survey. Pre-arrival support can help international students navigate the visa process (see Skinner, 2018). Schools can also provide services to help international students through all the stages of the application process, Knowing that many families may be concerned about safety in the U.S., one respondent suggested “incorporating recruitment materials specifically for parents addressing the main safety concerns and highlighting all of the support services available for our international population, not just within our campus but the surrounding community as well.”
Institutions can also offer students meetings with both institutional and external professionals. One-on-one meetings with campus support offices can help gauge the specific challenges students are facing, allowing institutions to respond appropriately. Meanwhile, offering students the chance to consult with legal professionals can help them understand their specific visa situation. In addition, legal professionals can provide information on OPT (Optional Practical Training) and CPT (Curricular Practical Training), which could be a crucial support: Over half of our respondents cited international students’ concerns about securing a job or work visa in the U.S. as an enrollment challenge.
4. Engage in social media and virtual outreach.
Eighty percent of surveyed institutions have either not changed their budget for international student recruitment or decreased it. At the same time, alumni, current and prospective international students are increasingly using social media to engage in conversations about education abroad (Kono, 2012). As a result, social media and other virtual methods of interacting can be a cost-effective way of breaking into emerging markets, increasing outreach, and keeping students up-to-date. Social media can be used not only to build relationships with students, but also to inform them of developments in immigration and visa policy that may affect their student status. Seventy-eight
Navigating a New Paradigm for International Student Recruitment | © 2018 World Education Services. All rights reserved.
27
percent of survey respondents intend to increase their social media use and engage with prospective students through video chats, live Q&As, and mobile communication tools. One respondent’s institution has used social media “to reinforce the importance of diversity and the value added by [the] presence of international students and scholars,” a method many schools have used, as seen by the #YouAreWelcomeHere campaign.
Because social media feeds are readily available to all prospective students, HEIs must take care to actively engage with students, instead of only posting content. Responding thoughtfully to students’ comments—both positive and negative—demonstrates a concern for students’ needs (ICEF Monitor, 2018).
5. Involve the alumni network in recruitment.
Social media can be used for another purpose—to build a robust alumni network. Alumni can help attract prospective international students, and 66 percent of our respondents said they plan to engage more with recent international alumni for the upcoming application cycle. HEIs can establish an alumni ambassador program to represent their schools online through social media, allowing prospective students to ask questions, or even include their contact information in marketing collateral (ICEF Monitor, 2018). International alumni can act as spokespeople to spread information to potential students, in addition to reassuring students of the welcoming environment at their alma mater. Potential students also appreciate hearing the personal experiences of others from their home country. As one respondent noted, “we foresee that networking with alumni and creating stronger pathways will help us retain prospects from countries where enrollments are declining.”
6. Address financial concerns.
Because funding is one of the largest concerns of international students (Schulmann, 2017), HEIs should seek to address potential students’ financial concerns. Almost half of our respondents cited the rising cost of tuition as a challenge to recruiting international students. Although providing additional scholarships or lowering tuition most directly attracts financially sensitive international students, neither option is always possible. However, institutions can use other strategies to ease prospective students’ financial concerns.
Schools should provide funding advice that can help international students understand and manage the complete costs of their education. They should also demonstrate the return on investment for degrees at their school in order to help international students understand why the high financial cost may be worth it (Le, 2017b). Sharing data about OPT/CPT opportunities and typical job earnings and prospects for graduates could also be useful. To induce more lower-budget students to apply, a recent WENR article (Schulmann, 2017) found that simply waiving application fees may be an effective strategy.
Navigating a New Paradigm for International Student Recruitment | © 2018 World Education Services. All rights reserved.
28
7. Develop and maintain partnerships.
Institutions can form partnerships with a wide range of organizations, including community colleges, pathway programs, agents, or government offices.
Establishing partnerships and articulation agreements with community colleges, for example, can create a cost-effective pipeline of international students who seek a four-year degree after community college (Loo, 2016). Furthermore, with over 80,000 international students studying in the U.S. at the secondary level (Farrugia, 2017), most of whom seek to enroll in a U.S. HEI after graduation, partnerships with high schools can be an effective method of backyard recruiting. In addition, pathway programs can provide access to a large body of students, and also offer assistance with marketing and recruitment efforts.
One respondent suggested maintaining a good connection with institutions’ SEVP (Student and Exchange Visitor Program) representatives who can help with I-20 forms and other visa issues. Another institution plans to “establish new relationships and cultivate existing relationships with Washington-based embassies, ministries, and agencies to promote higher education in the U.S. with emphasis on study at our institution.”
Navigating a New Paradigm for International Student Recruitment | © 2018 World Education Services. All rights reserved.
29
CONCLUSION
With the vast majority of HEIs citing the current political environment in the U.S. as a key influence in international student enrollment declines, schools are feeling the acute and damaging effects: The majority of HEIs failed to meet their international enrollment goals, and applications have declined for the top-sending source countries. Over a third of institutions are pessimistic about their future international enrollment.
However, many more remain optimistic, and are prepared to alter their recruitment strategies to continue attracting international students. In light of the current political climate, schools should not only work to assure international students that they are welcome and provide them adequate resources, they should also diversify to a variety of source markets to avoid becoming overly reliant on any one country. If HEIs are able to provide a welcoming environment for international students and widen their recruitment efforts, they will be able to build a solid foundation and community for international students—regardless of future paradigm shifts.
NOTES ON METHODOLOGYLIMITATIONS
The survey sample is restricted to individuals that subscribe to WES newsletters, have accessed our resources, or have had previous communication with WES. This may result in self-selection and sample biases.
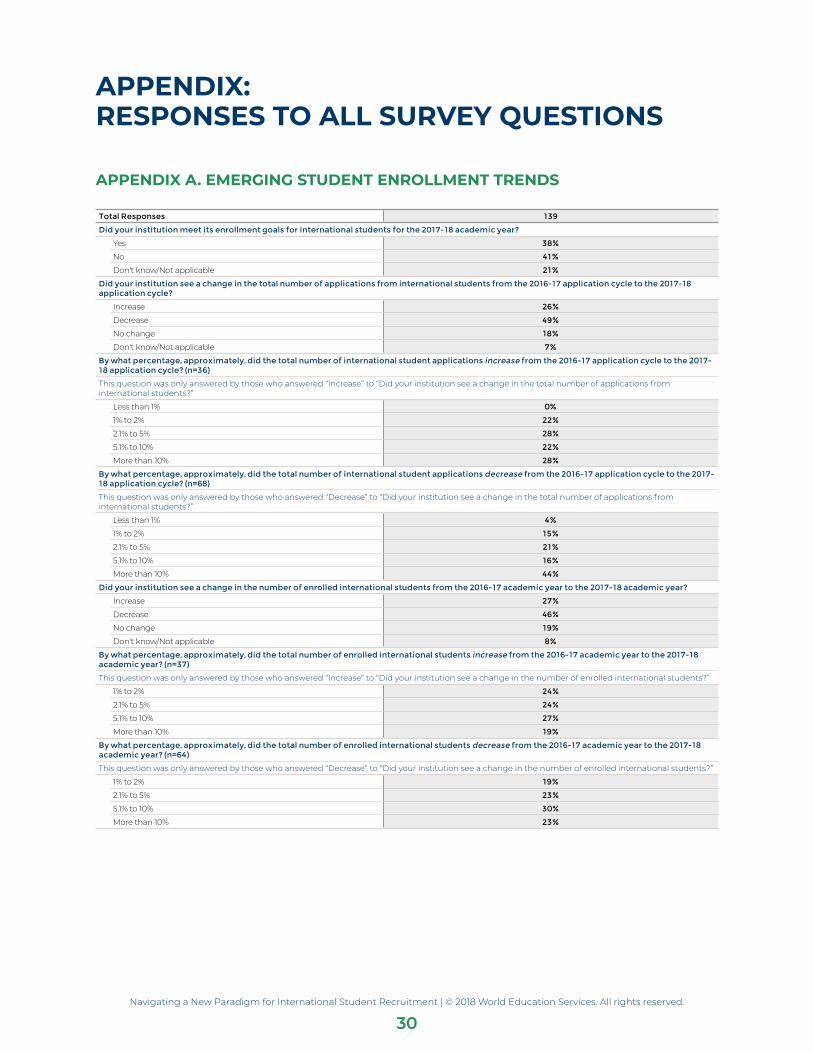
Navigating a New Paradigm for International Student Recruitment | © 2018 World Education Services. All rights reserved.
30
APPENDIX: RESPONSES TO ALL SURVEY QUESTIONS
APPENDIX A. EMERGING STUDENT ENROLLMENT TRENDS
Total Responses 139
Did your institution meet its enrollment goals for international students for the 2017-18 academic year?
Yes 38%
No 41%
Don't know/Not applicable 21%
Did your institution see a change in the total number of applications from international students from the 2016-17 application cycle to the 2017-18 application cycle?
Increase 26%
Decrease 49%
No change 18%
Don't know/Not applicable 7%
By what percentage, approximately, did the total number of international student applications increase from the 2016-17 application cycle to the 2017-18 application cycle? (n=36)
This question was only answered by those who answered “Increase” to “Did your institution see a change in the total number of applications from international students?”
Less than 1% 0%
1% to 2% 22%
2.1% to 5% 28%
5.1% to 10% 22%
More than 10% 28%
By what percentage, approximately, did the total number of international student applications decrease from the 2016-17 application cycle to the 2017-18 application cycle? (n=68)
This question was only answered by those who answered “Decrease” to “Did your institution see a change in the total number of applications from international students?”
Less than 1% 4%
1% to 2% 15%
2.1% to 5% 21%
5.1% to 10% 16%
More than 10% 44%
Did your institution see a change in the number of enrolled international students from the 2016-17 academic year to the 2017-18 academic year?
Increase 27%
Decrease 46%
No change 19%
Don't know/Not applicable 8%
By what percentage, approximately, did the total number of enrolled international students increase from the 2016-17 academic year to the 2017-18 academic year? (n=37)
This question was only answered by those who answered “Increase” to “Did your institution see a change in the number of enrolled international students?”
1% to 2% 24%
2.1% to 5% 24%
5.1% to 10% 27%
More than 10% 19%
By what percentage, approximately, did the total number of enrolled international students decrease from the 2016-17 academic year to the 2017-18 academic year? (n=64)
This question was only answered by those who answered “Decrease” to “Did your institution see a change in the number of enrolled international students?”
1% to 2% 19%
2.1% to 5% 23%
5.1% to 10% 30%
More than 10% 23%
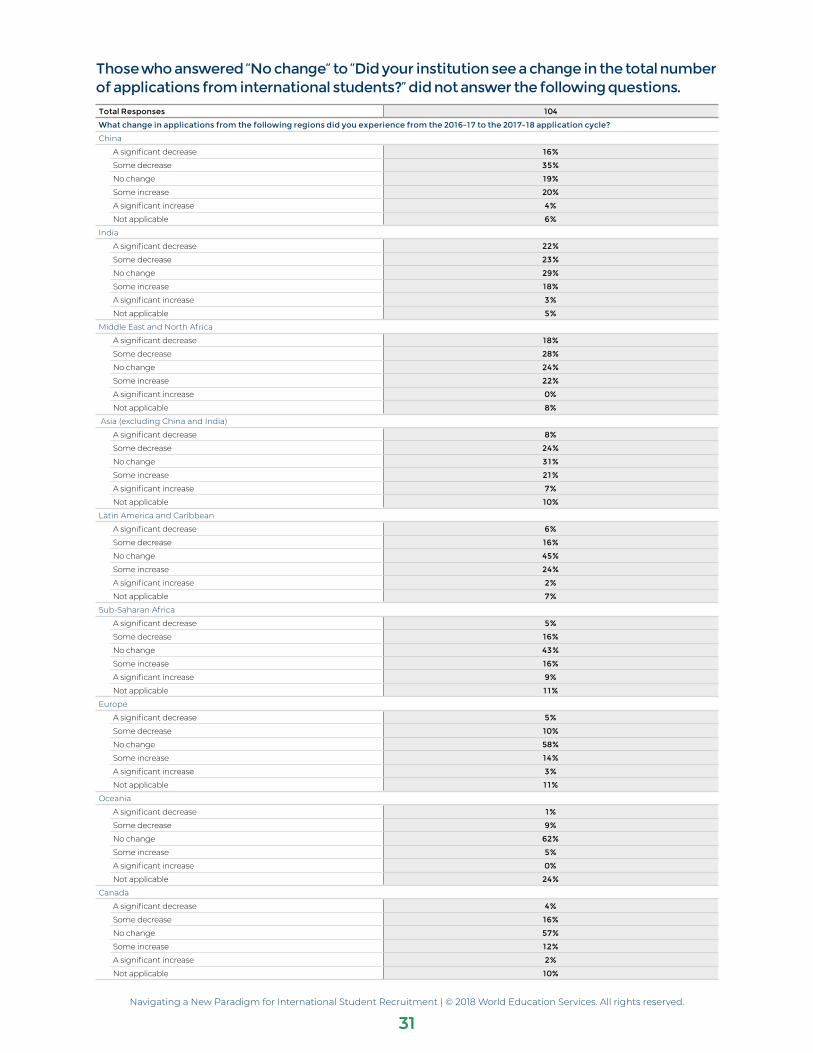
Navigating a New Paradigm for International Student Recruitment | © 2018 World Education Services. All rights reserved.
31
Those who answered “No change” to “Did your institution see a change in the total number of applications from international students?” did not answer the following questions.Total Responses 104
What change in applications from the following regions did you experience from the 2016-17 to the 2017-18 application cycle?
China
A significant decrease 16%
Some decrease 35%
No change 19%
Some increase 20%
A significant increase 4%
Not applicable 6%
India
A significant decrease 22%
Some decrease 23%
No change 29%
Some increase 18%
A significant increase 3%
Not applicable 5%
Middle East and North Africa
A significant decrease 18%
Some decrease 28%
No change 24%
Some increase 22%
A significant increase 0%
Not applicable 8%
Asia (excluding China and India)
A significant decrease 8%
Some decrease 24%
No change 31%
Some increase 21%
A significant increase 7%
Not applicable 10%
Latin America and Caribbean
A significant decrease 6%
Some decrease 16%
No change 45%
Some increase 24%
A significant increase 2%
Not applicable 7%
Sub-Saharan Africa
A significant decrease 5%
Some decrease 16%
No change 43%
Some increase 16%
A significant increase 9%
Not applicable 11%
Europe
A significant decrease 5%
Some decrease 10%
No change 58%
Some increase 14%
A significant increase 3%
Not applicable 11%
Oceania
A significant decrease 1%
Some decrease 9%
No change 62%
Some increase 5%
A significant increase 0%
Not applicable 24%
Canada
A significant decrease 4%
Some decrease 16%
No change 57%
Some increase 12%
A significant increase 2%
Not applicable 10%
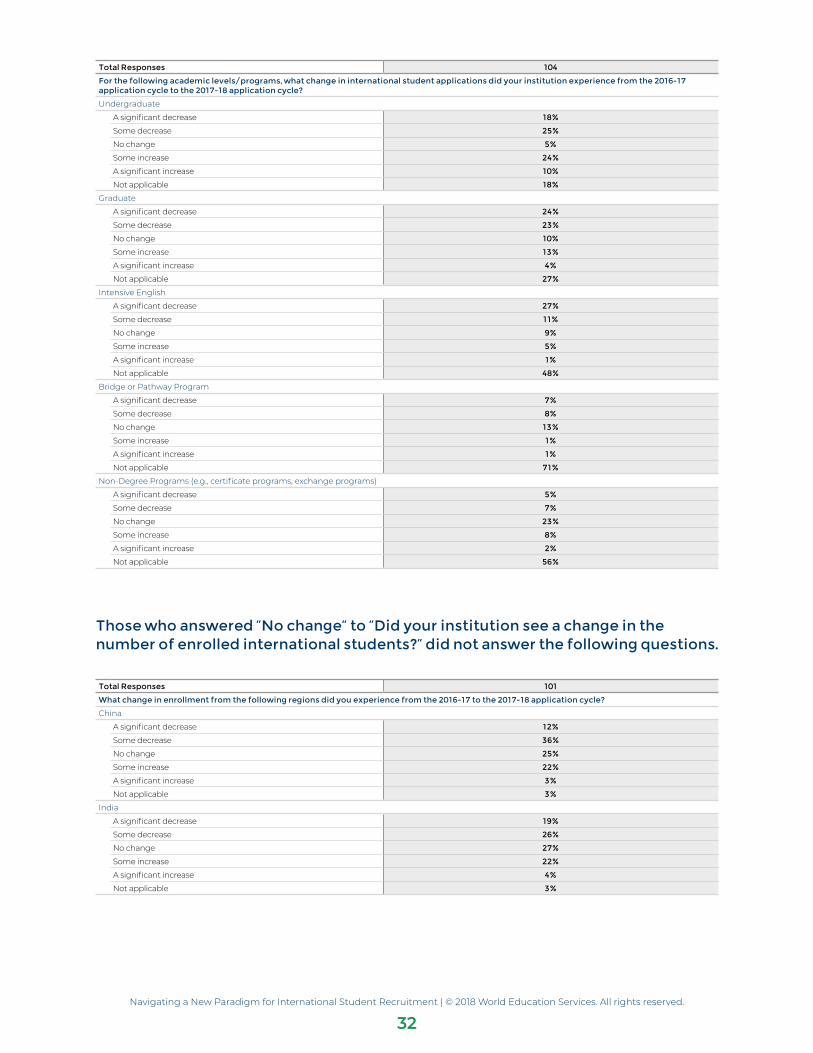
Navigating a New Paradigm for International Student Recruitment | © 2018 World Education Services. All rights reserved.
32
Total Responses 104
For the following academic levels/programs, what change in international student applications did your institution experience from the 2016-17 application cycle to the 2017-18 application cycle?
Undergraduate
A significant decrease 18%
Some decrease 25%
No change 5%
Some increase 24%
A significant increase 10%
Not applicable 18%
Graduate
A significant decrease 24%
Some decrease 23%
No change 10%
Some increase 13%
A significant increase 4%
Not applicable 27%
Intensive English
A significant decrease 27%
Some decrease 11%
No change 9%
Some increase 5%
A significant increase 1%
Not applicable 48%
Bridge or Pathway Program
A significant decrease 7%
Some decrease 8%
No change 13%
Some increase 1%
A significant increase 1%
Not applicable 71%
Non-Degree Programs (e.g., certificate programs, exchange programs)
A significant decrease 5%
Some decrease 7%
No change 23%
Some increase 8%
A significant increase 2%
Not applicable 56%
Those who answered “No change” to “Did your institution see a change in the number of enrolled international students?” did not answer the following questions.
Total Responses 101
What change in enrollment from the following regions did you experience from the 2016-17 to the 2017-18 application cycle?
China
A significant decrease 12%
Some decrease 36%
No change 25%
Some increase 22%
A significant increase 3%
Not applicable 3%
India
A significant decrease 19%
Some decrease 26%
No change 27%
Some increase 22%
A significant increase 4%
Not applicable 3%
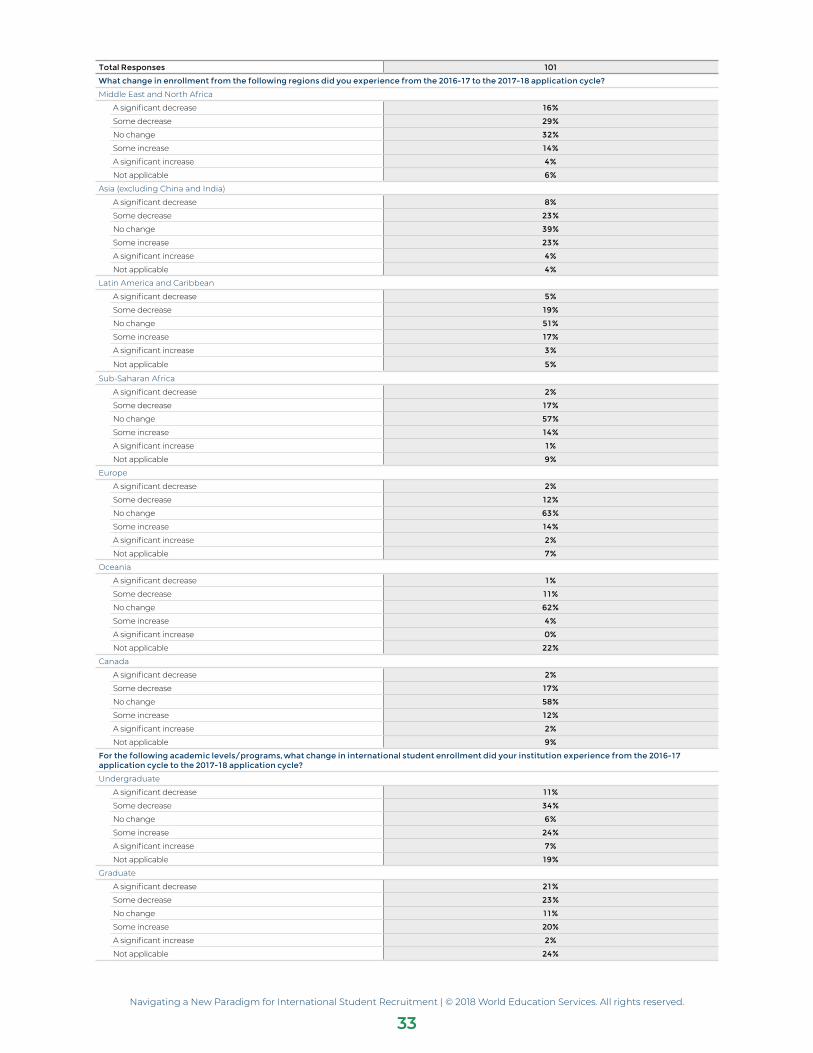
Navigating a New Paradigm for International Student Recruitment | © 2018 World Education Services. All rights reserved.
33
Total Responses 101
What change in enrollment from the following regions did you experience from the 2016-17 to the 2017-18 application cycle?
Middle East and North Africa
A significant decrease 16%
Some decrease 29%
No change 32%
Some increase 14%
A significant increase 4%
Not applicable 6%
Asia (excluding China and India)
A significant decrease 8%
Some decrease 23%
No change 39%
Some increase 23%
A significant increase 4%
Not applicable 4%
Latin America and Caribbean
A significant decrease 5%
Some decrease 19%
No change 51%
Some increase 17%
A significant increase 3%
Not applicable 5%
Sub-Saharan Africa
A significant decrease 2%
Some decrease 17%
No change 57%
Some increase 14%
A significant increase 1%
Not applicable 9%
Europe
A significant decrease 2%
Some decrease 12%
No change 63%
Some increase 14%
A significant increase 2%
Not applicable 7%
Oceania
A significant decrease 1%
Some decrease 11%
No change 62%
Some increase 4%
A significant increase 0%
Not applicable 22%
Canada
A significant decrease 2%
Some decrease 17%
No change 58%
Some increase 12%
A significant increase 2%
Not applicable 9%
For the following academic levels/programs, what change in international student enrollment did your institution experience from the 2016-17 application cycle to the 2017-18 application cycle?
Undergraduate
A significant decrease 11%
Some decrease 34%
No change 6%
Some increase 24%
A significant increase 7%
Not applicable 19%
Graduate
A significant decrease 21%
Some decrease 23%
No change 11%
Some increase 20%
A significant increase 2%
Not applicable 24%
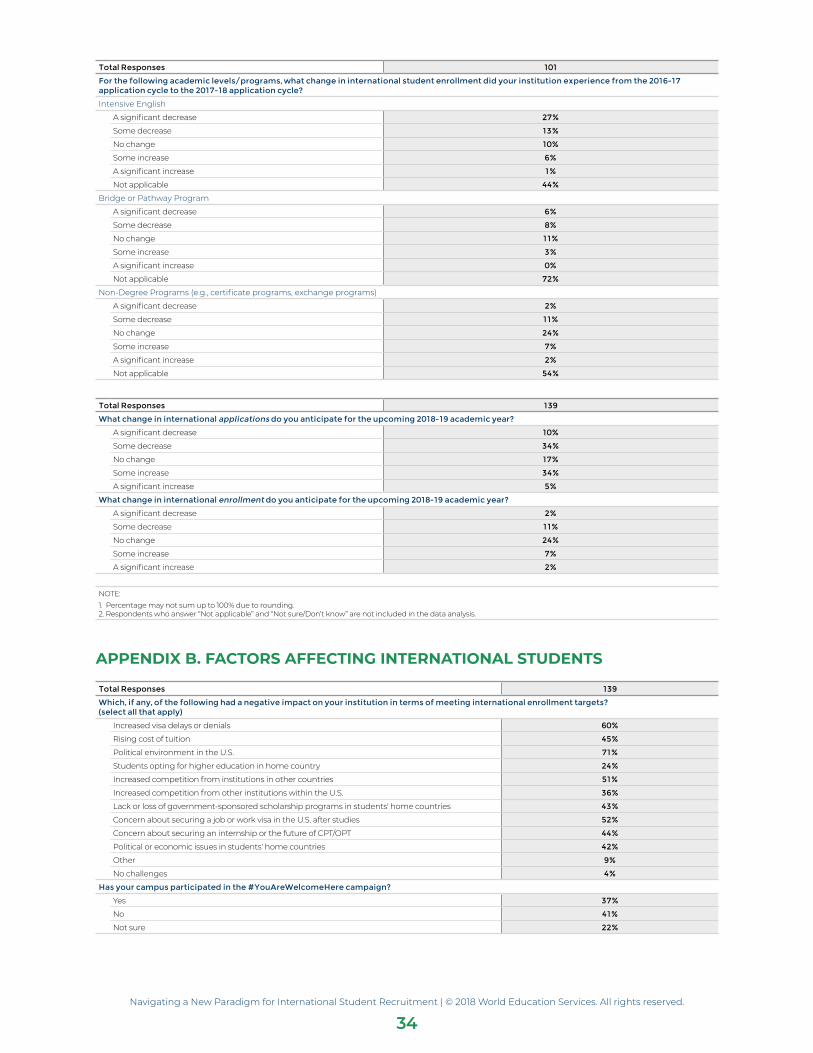
Navigating a New Paradigm for International Student Recruitment | © 2018 World Education Services. All rights reserved.
34
Total Responses 101
For the following academic levels/programs, what change in international student enrollment did your institution experience from the 2016-17 application cycle to the 2017-18 application cycle?
Intensive English
A significant decrease 27%
Some decrease 13%
No change 10%
Some increase 6%
A significant increase 1%
Not applicable 44%
Bridge or Pathway Program
A significant decrease 6%
Some decrease 8%
No change 11%
Some increase 3%
A significant increase 0%
Not applicable 72%
Non-Degree Programs (e.g., certificate programs, exchange programs)
A significant decrease 2%
Some decrease 11%
No change 24%
Some increase 7%
A significant increase 2%
Not applicable 54%
Total Responses 139
What change in international applications do you anticipate for the upcoming 2018-19 academic year?
A significant decrease 10%
Some decrease 34%
No change 17%
Some increase 34%
A significant increase 5%
What change in international enrollment do you anticipate for the upcoming 2018-19 academic year?
A significant decrease 2%
Some decrease 11%
No change 24%
Some increase 7%
A significant increase 2%
NOTE:1. Percentage may not sum up to 100% due to rounding.2. Respondents who answer “Not applicable” and “Not sure/Don’t know” are not included in the data analysis.
APPENDIX B. FACTORS AFFECTING INTERNATIONAL STUDENTS
Total Responses 139
Which, if any, of the following had a negative impact on your institution in terms of meeting international enrollment targets? (select all that apply)
Increased visa delays or denials 60%
Rising cost of tuition 45%
Political environment in the U.S. 71%
Students opting for higher education in home country 24%
Increased competition from institutions in other countries 51%
Increased competition from other institutions within the U.S. 36%
Lack or loss of government-sponsored scholarship programs in students' home countries 43%
Concern about securing a job or work visa in the U.S. after studies 52%
Concern about securing an internship or the future of CPT/OPT 44%
Political or economic issues in students' home countries 42%
Other 9%
No challenges 4%
Has your campus participated in the #YouAreWelcomeHere campaign?
Yes 37%
No 41%
Not sure 22%
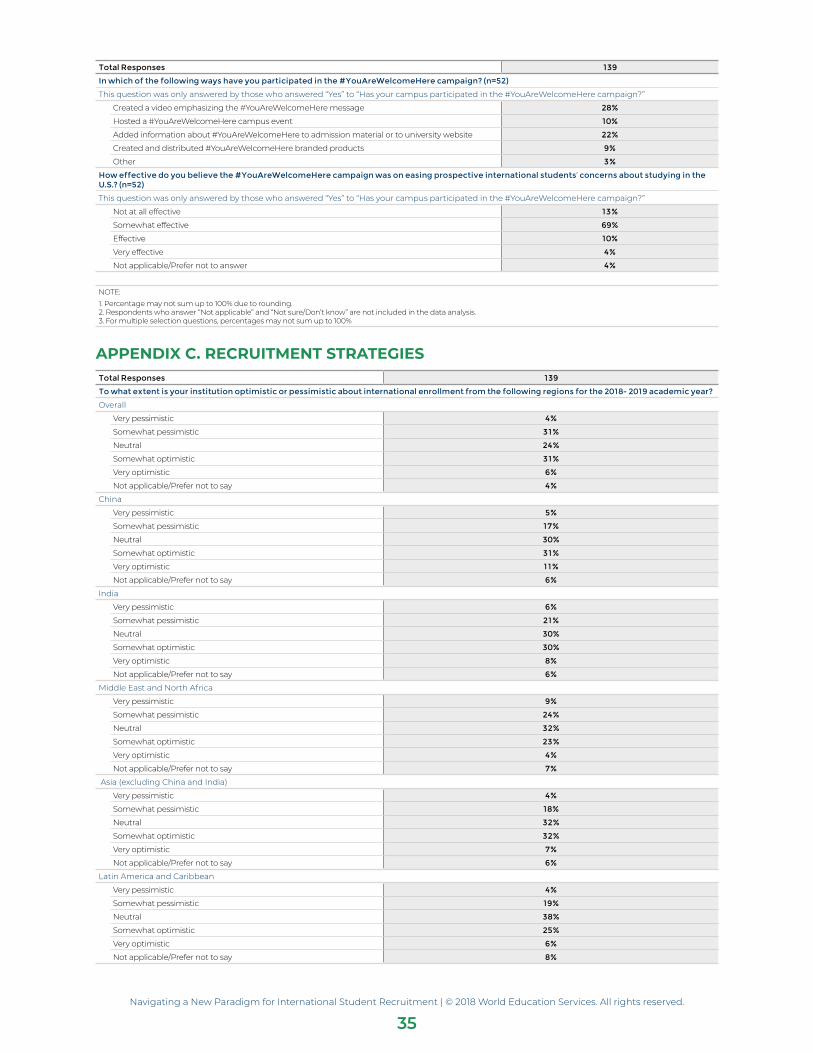
Navigating a New Paradigm for International Student Recruitment | © 2018 World Education Services. All rights reserved.
35
Total Responses 139
In which of the following ways have you participated in the #YouAreWelcomeHere campaign? (n=52)
This question was only answered by those who answered “Yes” to “Has your campus participated in the #YouAreWelcomeHere campaign?”
Created a video emphasizing the #YouAreWelcomeHere message 28%
Hosted a #YouAreWelcomeHere campus event 10%
Added information about #YouAreWelcomeHere to admission material or to university website 22%
Created and distributed #YouAreWelcomeHere branded products 9%
Other 3%
How effective do you believe the #YouAreWelcomeHere campaign was on easing prospective international students’ concerns about studying in the U.S.? (n=52)
This question was only answered by those who answered “Yes” to “Has your campus participated in the #YouAreWelcomeHere campaign?”
Not at all effective 13%
Somewhat effective 69%
Effective 10%
Very effective 4%
Not applicable/Prefer not to answer 4%
NOTE:1. Percentage may not sum up to 100% due to rounding.2. Respondents who answer “Not applicable” and “Not sure/Don’t know” are not included in the data analysis. 3. For multiple selection questions, percentages may not sum up to 100%
APPENDIX C. RECRUITMENT STRATEGIESTotal Responses 139
To what extent is your institution optimistic or pessimistic about international enrollment from the following regions for the 2018- 2019 academic year?
Overall
Very pessimistic 4%
Somewhat pessimistic 31%
Neutral 24%
Somewhat optimistic 31%
Very optimistic 6%
Not applicable/Prefer not to say 4%
China
Very pessimistic 5%
Somewhat pessimistic 17%
Neutral 30%
Somewhat optimistic 31%
Very optimistic 11%
Not applicable/Prefer not to say 6%
India
Very pessimistic 6%
Somewhat pessimistic 21%
Neutral 30%
Somewhat optimistic 30%
Very optimistic 8%
Not applicable/Prefer not to say 6%
Middle East and North Africa
Very pessimistic 9%
Somewhat pessimistic 24%
Neutral 32%
Somewhat optimistic 23%
Very optimistic 4%
Not applicable/Prefer not to say 7%
Asia (excluding China and India)
Very pessimistic 4%
Somewhat pessimistic 18%
Neutral 32%
Somewhat optimistic 32%
Very optimistic 7%
Not applicable/Prefer not to say 6%
Latin America and Caribbean
Very pessimistic 4%
Somewhat pessimistic 19%
Neutral 38%
Somewhat optimistic 25%
Very optimistic 6%
Not applicable/Prefer not to say 8%
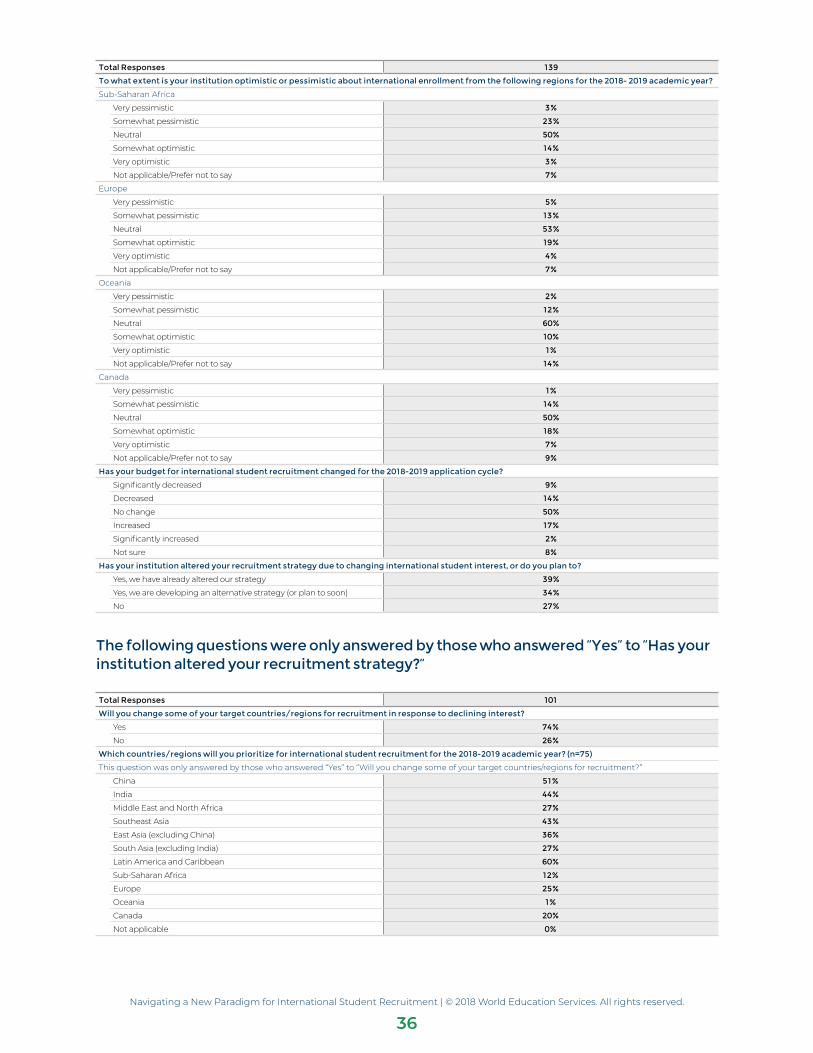
Navigating a New Paradigm for International Student Recruitment | © 2018 World Education Services. All rights reserved.
36
Total Responses 139
To what extent is your institution optimistic or pessimistic about international enrollment from the following regions for the 2018- 2019 academic year?
Sub-Saharan Africa
Very pessimistic 3%
Somewhat pessimistic 23%
Neutral 50%
Somewhat optimistic 14%
Very optimistic 3%
Not applicable/Prefer not to say 7%
Europe
Very pessimistic 5%
Somewhat pessimistic 13%
Neutral 53%
Somewhat optimistic 19%
Very optimistic 4%
Not applicable/Prefer not to say 7%
Oceania
Very pessimistic 2%
Somewhat pessimistic 12%
Neutral 60%
Somewhat optimistic 10%
Very optimistic 1%
Not applicable/Prefer not to say 14%
Canada
Very pessimistic 1%
Somewhat pessimistic 14%
Neutral 50%
Somewhat optimistic 18%
Very optimistic 7%
Not applicable/Prefer not to say 9%
Has your budget for international student recruitment changed for the 2018-2019 application cycle?
Significantly decreased 9%
Decreased 14%
No change 50%
Increased 17%
Significantly increased 2%
Not sure 8%
Has your institution altered your recruitment strategy due to changing international student interest, or do you plan to?
Yes, we have already altered our strategy 39%
Yes, we are developing an alternative strategy (or plan to soon) 34%
No 27%
The following questions were only answered by those who answered “Yes” to “Has your institution altered your recruitment strategy?”
Total Responses 101
Will you change some of your target countries/regions for recruitment in response to declining interest?
Yes 74%
No 26%
Which countries/regions will you prioritize for international student recruitment for the 2018-2019 academic year? (n=75)
This question was only answered by those who answered “Yes” to “Will you change some of your target countries/regions for recruitment?”
China 51%
India 44%
Middle East and North Africa 27%
Southeast Asia 43%
East Asia (excluding China) 36%
South Asia (excluding India) 27%
Latin America and Caribbean 60%
Sub-Saharan Africa 12%
Europe 25%
Oceania 1%
Canada 20%
Not applicable 0%
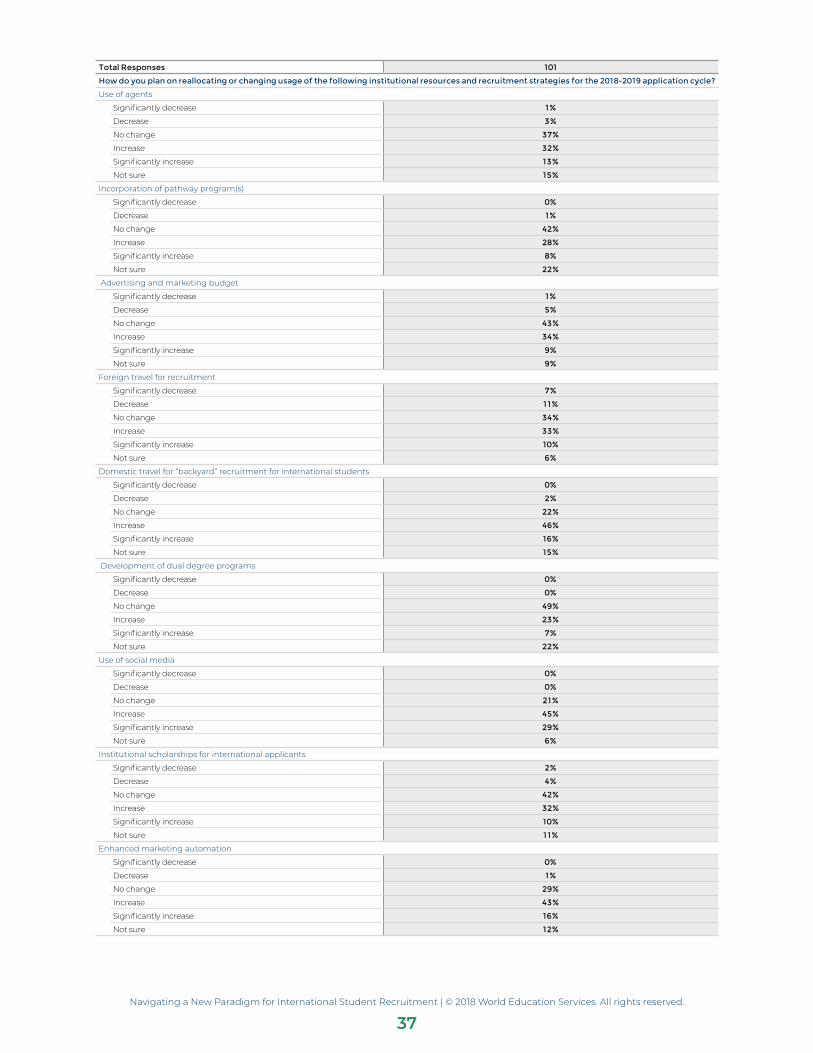
Navigating a New Paradigm for International Student Recruitment | © 2018 World Education Services. All rights reserved.
37
Total Responses 101
How do you plan on reallocating or changing usage of the following institutional resources and recruitment strategies for the 2018-2019 application cycle?
Use of agents
Significantly decrease 1%
Decrease 3%
No change 37%
Increase 32%
Significantly increase 13%
Not sure 15%
Incorporation of pathway program(s)
Significantly decrease 0%
Decrease 1%
No change 42%
Increase 28%
Significantly increase 8%
Not sure 22%
Advertising and marketing budget
Significantly decrease 1%
Decrease 5%
No change 43%
Increase 34%
Significantly increase 9%
Not sure 9%
Foreign travel for recruitment
Significantly decrease 7%
Decrease 11%
No change 34%
Increase 33%
Significantly increase 10%
Not sure 6%
Domestic travel for “backyard” recruitment for international students
Significantly decrease 0%
Decrease 2%
No change 22%
Increase 46%
Significantly increase 16%
Not sure 15%
Development of dual degree programs
Significantly decrease 0%
Decrease 0%
No change 49%
Increase 23%
Significantly increase 7%
Not sure 22%
Use of social media
Significantly decrease 0%
Decrease 0%
No change 21%
Increase 45%
Significantly increase 29%
Not sure 6%
Institutional scholarships for international applicants
Significantly decrease 2%
Decrease 4%
No change 42%
Increase 32%
Significantly increase 10%
Not sure 11%
Enhanced marketing automation
Significantly decrease 0%
Decrease 1%
No change 29%
Increase 43%
Significantly increase 16%
Not sure 12%
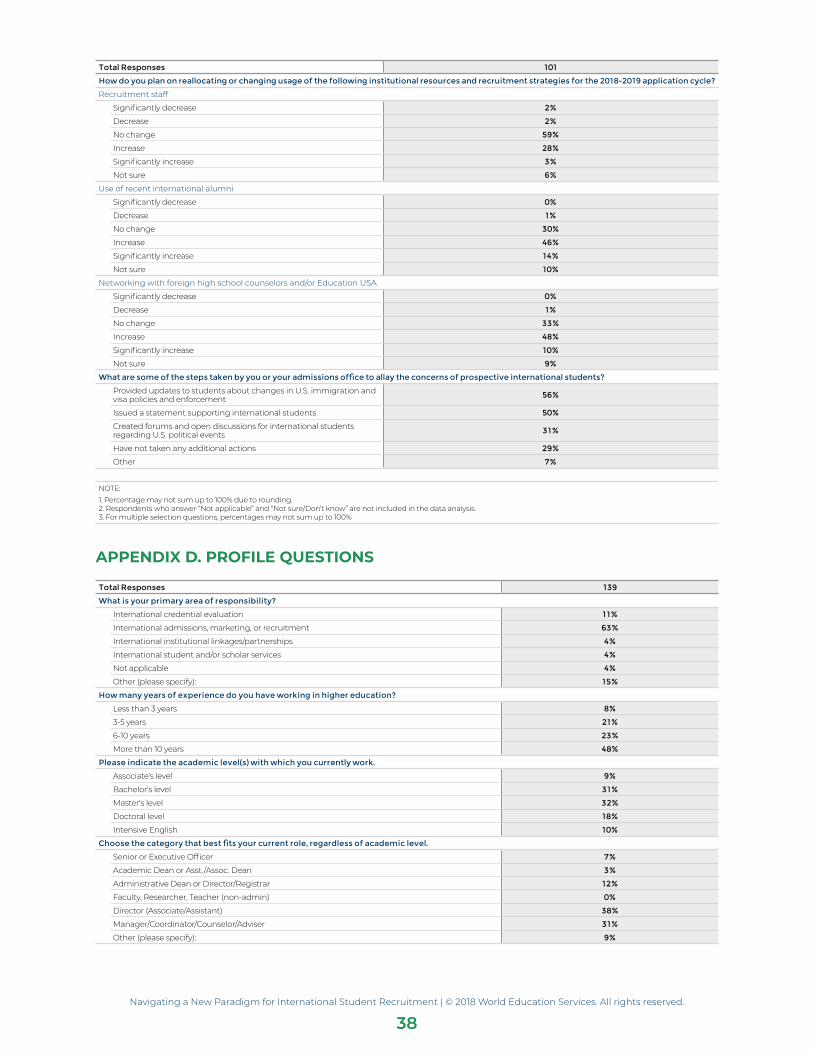
Navigating a New Paradigm for International Student Recruitment | © 2018 World Education Services. All rights reserved.
38
Total Responses 101
How do you plan on reallocating or changing usage of the following institutional resources and recruitment strategies for the 2018-2019 application cycle?
Recruitment staff
Significantly decrease 2%
Decrease 2%
No change 59%
Increase 28%
Significantly increase 3%
Not sure 6%
Use of recent international alumni
Significantly decrease 0%
Decrease 1%
No change 30%
Increase 46%
Significantly increase 14%
Not sure 10%
Networking with foreign high school counselors and/or Education USA
Significantly decrease 0%
Decrease 1%
No change 33%
Increase 48%
Significantly increase 10%
Not sure 9%
What are some of the steps taken by you or your admissions office to allay the concerns of prospective international students?
Provided updates to students about changes in U.S. immigration and visa policies and enforcement 56%
Issued a statement supporting international students 50%
Created forums and open discussions for international students regarding U.S. political events 31%
Have not taken any additional actions 29%
Other 7%
NOTE:1. Percentage may not sum up to 100% due to rounding.2. Respondents who answer “Not applicable” and “Not sure/Don’t know” are not included in the data analysis. 3. For multiple selection questions, percentages may not sum up to 100%
APPENDIX D. PROFILE QUESTIONS
Total Responses 139
What is your primary area of responsibility?
International credential evaluation 11%
International admissions, marketing, or recruitment 63%
International institutional linkages/partnerships 4%
International student and/or scholar services 4%
Not applicable 4%
Other (please specify): 15%
How many years of experience do you have working in higher education?
Less than 3 years 8%
3-5 years 21%
6-10 years 23%
More than 10 years 48%
Please indicate the academic level(s) with which you currently work.
Associate's level 9%
Bachelor's level 31%
Master's level 32%
Doctoral level 18%
Intensive English 10%
Choose the category that best fits your current role, regardless of academic level.
Senior or Executive Officer 7%
Academic Dean or Asst./Assoc. Dean 3%
Administrative Dean or Director/Registrar 12%
Faculty, Researcher, Teacher (non-admin) 0%
Director (Associate/Assistant) 38%
Manager/Coordinator/Counselor/Adviser 31%
Other (please specify): 9%
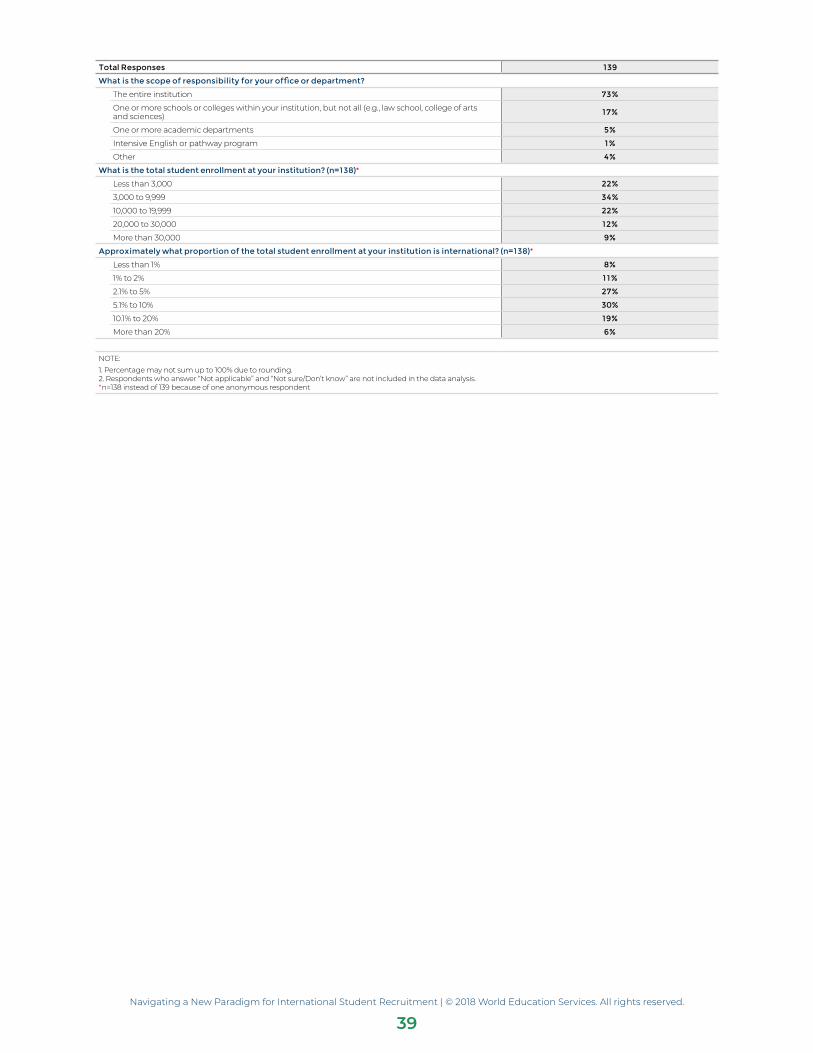
Navigating a New Paradigm for International Student Recruitment | © 2018 World Education Services. All rights reserved.
39
Total Responses 139
What is the scope of responsibility for your office or department?
The entire institution 73%
One or more schools or colleges within your institution, but not all (e.g., law school, college of arts and sciences) 17%
One or more academic departments 5%
Intensive English or pathway program 1%
Other 4%
What is the total student enrollment at your institution? (n=138)*
Less than 3,000 22%
3,000 to 9,999 34%
10,000 to 19,999 22%
20,000 to 30,000 12%
More than 30,000 9%
Approximately what proportion of the total student enrollment at your institution is international? (n=138)*
Less than 1% 8%
1% to 2% 11%
2.1% to 5% 27%
5.1% to 10% 30%
10.1% to 20% 19%
More than 20% 6%
NOTE:1. Percentage may not sum up to 100% due to rounding.2. Respondents who answer “Not applicable” and “Not sure/Don’t know” are not included in the data analysis. *n=138 instead of 139 because of one anonymous respondent
Navigating a New Paradigm for International Student Recruitment | © 2018 World Education Services. All rights reserved.
40
ENDNOTES
1. The drop in Chinese visas could be attributed to the change in the visa term. Because visas are now valid for five years instead of one, fewer Chinese students would need to renew their visas without there necessarily being fewer Chinese international students in the U.S.
2. To help readers keep the discussion of applications and enrollments distinct, we’re italicizing those words here.
3. For a good discussion of advising students regarding the various travel bans issued by the Trump Administration, see Skinner, 2018.
Navigating a New Paradigm for International Student Recruitment | © 2018 World Education Services. All rights reserved.
41
REFERENCES
Andrews, C., & Mattern, K. (2017, November 22). Recruiting Saudi students: navigating a challenging climate [weblog post]. Intead. Retrieved from https://services.intead.com/blog/recruiting-saudi-students-navigating-a-challenging-climate.
Baer, J. (2017, November). Fall 2017 international student enrollment hot topics survey. New York: Institute of International Education (IIE). Retrieved from https://www.iie.org/Research-and-Insights/Open-Doors/Data/Fall-International-Enrollments-Snapshot-Reports.
Bothwell, E. (2017, September 14). Fifty-fold growth in English-taught bachelor’s courses in Europe. Times Higher Education. Retrieved from https://www.timeshighereducation.com/news/fifty-fold-growth-english-taught-bachelors-courses-europe.
Department of State (DOS). (2015). Worldwide NIV workload by visa category FY 2015 [dataset]. Retrieved from https://travel.state.gov/content/dam/visas/Statistics/Non-Immigrant-Statistics/NIVWorkload/FY2015NIVWorkloadbyVisaCategory.pdf.
Department of State (DOS). (2017). Worldwide NIV workload by visa category FY 2017 [dataset]. Retrieved from https://travel.state.gov/content/dam/visas/Statistics/Non-Immigrant-Statistics/NIVWorkload/FY2017NIVWorkloadbyVisaCategory.pdf.
Economic Times. (2018, April 2). Toughest ever process for H-1B work visa begins. The Economic Times. Retrieved from https://economictimes.indiatimes.com/nri/visa-and-immigration/toughest-ever-process-for-h-1b-work-visa-begins/articleshow/63575581.cms.
Farrugia, C., & Andrejko, N. (2017, July). Shifting tides? Understanding international student yield for fall 2017. New York: Institute of International Education (IIE). Retrieved from https://www.iie.org/Research-and-Insights/Publications/Shifting-Tides-Understanding-International-Student-Yield-for-Fall-2017.
Farrugia, C. (2017, August). Globally mobile youth: trends in international secondary students in the United States, 2013-2016. New York: Institute of International Education (IIE). Retrieved from https://www.iie.org/Why-IIE/Announcements/2017-08-09-More-International-Students-Seeking-US-High-School-Diplomas.
ICEF Monitor. (2017, September 27). Fifty-fold increase in English-taught bachelor’s degrees in Europe. ICEF Monitor. Retrieved from http://monitor.icef.com/2017/09/fifty-fold-increase-english-taught-bachelors-degrees-europe/.
ICEF Monitor. (2018, April 11). 3 ways to give your recruitment marketing a boost. ICEF Monitor. Retrieved from http://monitor.icef.com/2018/04/three-smart-ways-give-recruitment-marketing-boost/.
Institute of International Education (IIE). (2017a). Open Doors report on international education exchange, 2017. New York: Institute of International Education (IIE). Retrieved from https://www.iie.org/en/Research-and-Insights/Open-Doors.
Navigating a New Paradigm for International Student Recruitment | © 2018 World Education Services. All rights reserved.
42
Institute of International Education (IIE). (2017b). Project Atlas infographics 2017. New York: Institute of International Education (IIE). Retrieved from https://www.iie.org/Research-and-Insights/Project-Atlas/Explore-Data/Current-Infographics.
Institute of International Education (IIE). (2017c). IIE survey of college admissions. Retrieved from https://www.iie.org/Why-IIE/Announcements/2017-07-06-IIE-Survey-of-College-Admissions-International-Students-Fall-2017.
Jennings, R. (2017, November 10). Student recruitment in China: one institution’s insights from Tier II and Tier III cities. WENR: World Education News and Reviews. Retrieved from https://wenr.wes.org/2017/11/student-recruitment-in-smaller-chinese-cities-lessons-from-the-field.
Kono, Y. (2012, November 1). Using social media to recruit in emerging markets. WENR: World Education News and Reviews. Retrieved from https://wenr.wes.org/2012/11/wenr-november-2012-using-social-media-to-recruit-in-emerging-markets.
Le, C. (2017a, September 18). International student mobility to Canada: a surge? Or something else? WENR: World Education News and Reviews. Retrieved from https://wenr.wes.org/2017/09/international-student-mobility-to-canada-a-surge-or-something-else.
Le, C. (2017b, October 17). How can U.S. MBA programs respond to declining demand from international students? WENR: World Education News and Reviews. Retrieved from https://wenr.wes.org/2017/10/how-can-u-s-mba-programs-respond-to-declining-demand-from-international-students.
Lederman, D. (2018, March 9). Leading in turbulent times: a survey of presidents. Inside Higher Ed. Retrieved from https://www.insidehighered.com/news/survey/survey-college-presidents-finds-worry-about-public-attitudes-confidence-finances.
Loo, B. (2016, November 8). Community colleges: an unexpected on-ramp for international students. WENR: World Education News and Reviews. Retrieved from https://wenr.wes.org/2016/11/international-students-u-s-community-colleges.
Meckler, L., & Korn, M. (2018, March 11). Visas issued to foreign students fall, partly due to Trump immigration policy. The Wall Street Journal. Retrieved from https://www.wsj.com/articles/visas-issued-to-foreign-students-fall-partly-due-to-trump-immigration-policy-1520766000.
Ortiz, A. (2016, August 15). Recruitment beyond China: lower-middle-income countries show promise. WENR: World Education News and Reviews. Retrieved from https://wenr.wes.org/2016/08/recruitment-beyond-china.
Paul, K. (2016, February 1). Saudi tightens rules for scholarships to study abroad. Reuters. Retrieved from https://www.reuters.com/article/us-saudi-education-idUSKCN0VA35R.
Redden, E. (2017, November 13). New international enrollments decline. Inside Higher Ed. Retrieved from https://www.insidehighered.com/news/2017/11/13/us-universities-report-declines-enrollments-new-international-students-study-abroad.
Navigating a New Paradigm for International Student Recruitment | © 2018 World Education Services. All rights reserved.
43
Schulmann, P., & Ye, Z. C. (2017, August 16). China: can the world’s top source for international students become its leading destination? WENR: World Education News and Reviews. Retrieved from https://wenr.wes.org/2017/08/china-can-the-worlds-top-source-for-international-students-become-its-leading-destination.
Schulmann, P. (2017, November 16). No matter the budget, international students aspire to study in the U.S. WENR: World Education News and Reviews. Retrieved from https://wenr.wes.org/2017/11/international-students-aspire-to-study-in-the-u-s.
Sheng, E. (2018, April 9). Silicon Valley is fighting a brain-drain war with Trump that it may lose. CBNC. Retrieved from https://www.cnbc.com/2018/04/09/trumps-war-on-immigration-causing-silicon-valley-brain-drain.html.
Sinclair, H. (2018, April 23). Trump is putting foreign students off coming to America, universities claim. Newsweek. Retrieved from http://www.newsweek.com/trump-putting-foreign-students-coming-america-universities-claim-897395.
Skinner, M. (2018, April 3). Nine actions to help students navigate the effects of uncertainty about the travel ban. WENR: World Education News and Reviews. Retrieved from https://wenr.wes.org/2018/04/nine-actions-to-help-students-navigate-the-effects-of-u-s-travel-ban.
Study International (SI). (2018a, April 3). Another Canadian university drops international PhD tuition to local rate. SI News. Retrieved from https://www.studyinternational.com/news/phd-university-ottawa-tuition/.
Study International (SI). (2018b, April 9). US govt fills annual cap of 85,000 H-1B visas in just five days. SI News. Retrieved from https://www.studyinternational.com/news/h1b-visa-cap-2018/.
Szklarski, C. (2018, January 18). University of Toronto drops international fees for most PhD scholars. Global News. Retrieved from https://globalnews.ca/news/3973635/university-toronto-international-fees/.
Trines, S. (2017a, June 6). SEVIS data points to declining enrollments from key countries. WENR: World Education News and Reviews. Retrieved from https://wenr.wes.org/2017/06/sevis-data-points-to-declining-enrollments-from-key-countries.
Trines, S. (2017b, September 18). Going north: the student mobility outlook from Brazil, Colombia, Mexico, and Venezuela. WENR: World Education News and Reviews. Retrieved from https://wenr.wes.org/2017/09/going-north-the-student-mobility-outlook-from-latin-america.
#YouAreWelcomeHere Campaign. (n.d.) Retrieved from https://www.youarewelcomehereusa.org/.
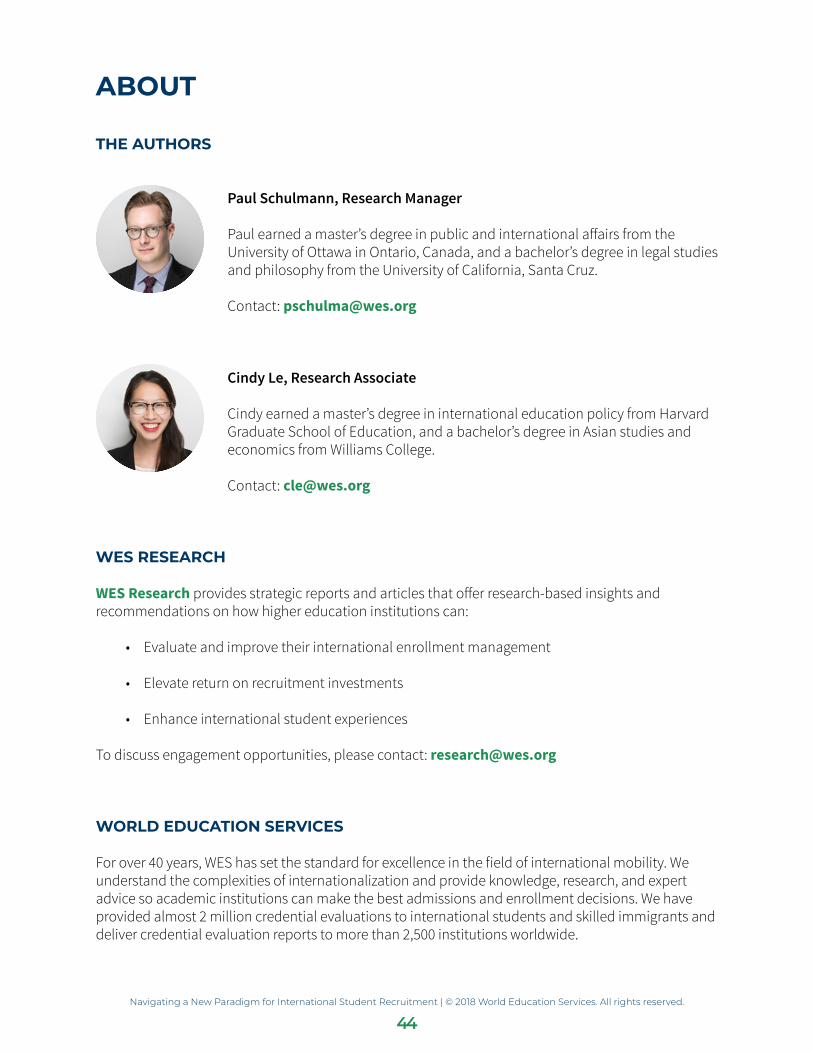
Navigating a New Paradigm for International Student Recruitment | © 2018 World Education Services. All rights reserved.
44
ABOUT
THE AUTHORS
Paul Schulmann, Research Manager
Paul earned a master’s degree in public and international affairs from the University of Ottawa in Ontario, Canada, and a bachelor’s degree in legal studies and philosophy from the University of California, Santa Cruz.
Contact: [email protected]
Cindy Le, Research Associate
Cindy earned a master’s degree in international education policy from Harvard Graduate School of Education, and a bachelor’s degree in Asian studies and economics from Williams College.
Contact: [email protected]
WES RESEARCH
WES Research provides strategic reports and articles that offer research-based insights and recommendations on how higher education institutions can:
• Evaluate and improve their international enrollment management
• Elevate return on recruitment investments
• Enhance international student experiences
To discuss engagement opportunities, please contact: [email protected]
WORLD EDUCATION SERVICES
For over 40 years, WES has set the standard for excellence in the field of international mobility. We understand the complexities of internationalization and provide knowledge, research, and expert advice so academic institutions can make the best admissions and enrollment decisions. We have provided almost 2 million credential evaluations to international students and skilled immigrants and deliver credential evaluation reports to more than 2,500 institutions worldwide.
Navigating a New Paradigm for International Student Recruitment | © 2018 World Education Services. All rights reserved.
45
WES RESEARCH REPORTS
Visit wes.org/partners/research to download our free reports. To stay on top of these trends, please subscribe to our newsletter.
Career Prospects and Outcomes of U.S.-Educated International Students: Improving Services, Bolstering Success
This report examines the career expectations and outcomes of international students and alumni educated at U.S. higher education institutions, including the experiences of alumni who stayed in the U.S. and those who returned home.
Improving the International Student Experience: Implications for Recruitment and Support
Provides insights into U.S.-educated international student motivations, expectations, experiences, satisfaction levels, and the likelihood of recommending their institutions to others. The report also discusses implications of the findings and offers recommendations for both recruitment and retention of international students.
How Master’s Students Choose Institutions: Research on International Student Segmentation
Examines the characteristics and attributes different segments of international master’s students value when applying to U.S. colleges and universities. The report provides recommendations for how institutions can build their value proposition and attract best-fit international students.
Recognizing Refugee Qualifications: Practical Tips For Credential Assessment
This report is an overview of WES’s research on worldwide practices in the assessment of credentials and qualifications of refugees. It provides institutions, licensing bodies, and employers with an understanding of practices for recognizing the qualifications and credentials of refugees.
Career Services for International Students: Fulfilling High Expectations
Research has shown that career prospects are a key consideration for international students as they decide where to apply. To provide institutions with recommendations on career services, WES conducted a survey and interviews with key personnel at higher education institutions in the U.S.
CAREER PROSPECTS AND OUTCOMES OF U.S.-EDUCATED INTERNATIONAL STUDENTS
09
IMPROVING THEINTERNATIONALSTUDENTEXPERIENCE
08
HOW MASTER’SSTUDENTSCHOOSEINSTITUTIONS
07
RECOGNIZING REFUGEE QUALIFICATIONS
CAREER SERVICES FOR INTERNATIONALSTUDENTS
Our Expertise. Your Success.
wes.org
World Education Services is a non-profit organization whose mission is to foster the integration of internationally educated persons into academic and professional settings.
Find us on Facebook, LinkedIn, and Twitter.
Tweet us with any questions and comments online by using #WESresearch.
Click here to subscribe to our newsletter.