navigated tms combined with eeg in mild cognitive impairment and alzheimer's disease: a pilot...
TRANSCRIPT
Journal of Neuroscience Methods 172 (2008) 270–276
Contents lists available at ScienceDirect
Journal of Neuroscience Methods
journa l homepage: www.e lsev ier .com/ locate / jneumeth
Navigated TMS combined with EEG in mild cognitive impairment andAlzheimer’s disease: A pilot study
Petro Julkunena,∗, Anne M. Jauhiainenb, Susanna Westeren-Punnonena, Eriikka Pirinena,Hilkka Soininenb,c, Mervi Kononena,d, Ari Paakkonena, Sara Maatta a, Jari Karhua,e
a Department of Clinical Neurophysiology, Kuopio University Hospital, POB 1777,
FI-70211 Kuopio, Finlandb Institute of Clinical Medicine, Unit of Neurology, University of Kuopio, POB 1627, FI-70211 Kuopio, Finlandc Department of Neurology, Kuopio University Hospital, POB 1777, FI-70211 Kuopio, Finlandd Department of Clinical Radiology, Kuopio University Hospital, POB 1777, FI-70211 Kuopio, Finlande Nexstim Ltd., Elimaenkatu 9 B, FI-00510 Helsinki, Finlandthe p(EEG)and inpatieminerain sible 6d TMeducteral frted wCI suprom
a r t i c l e i n f o
Article history:Received 4 February 2008Received in revised form 25 March 2008Accepted 18 April 2008
Keywords:Alzheimer’s diseaseBrainMild cognitive impairmentNavigated brain stimulationPrimary motor cortexEvoked responseEvent-related response
a b s t r a c t
Our aim was to assesselectroencephalographicAlzheimer’s disease (AD)five patients with AD, five110% of individually detertex (M1) with navigated bmonitored with a compatfound significantly reducein the AD subjects. This ras well as in the contralatanatomically interconnecN100 amplitude in the Mof NBS and EEG revealed
subjects. This pilot study suggeprogression of dementia.1. Introduction
Electroencephalography (EEG) is a common tool for measur-ing spontaneous and event-related electrical activity in the brain.Transcranial magnetic stimulation (TMS) combined with compati-ble EEG can be used individually and non-invasively to determinefunctional connectivity within the brain by following the spread-ing of electrical activity after locally applied stimuli (Ilmoniemi etal., 1997; Kahkonen et al., 2001). Modern navigated brain stimu-lation (NBS) systems also include navigation tools that locate thefocus of the TMS pulse in three-dimensional brain and allow preciserepeatability of location and stimulus intensity required averagingstimulus-related EEG changes. Finally, high-resolution magneticresonance (MR) images suitable for 3D renderings of an individ-
∗ Corresponding author. Tel.: +358 44 7174118; fax: +358 17 173187.E-mail address: [email protected] (P. Julkunen).
0165-0270/$ – see front matter © 2008 Elsevier B.V. All rights reserved.doi:10.1016/j.jneumeth.2008.04.021
otential of navigated transcranial magnetic stimulation (TMS)-evokedresponses in studying neuronal reactivity and cortical connectivity inmild cognitive impairment (MCI). We studied 14 right-handed subjects:
nts with MCI and four healthy controls. Fifty TMS-pulses at an intensity ofd motor threshold were delivered to the hand area of primary motor cor-timulation (NBS). Spreading of primary NBS-evoked neuronal activity was0-channel EEG, and analyzed in time, frequency and spatial-domains. WeS-evoked P30 (time-locked response 30 ms after the magnetic stimulation)ion was seen in the temporo-parietal area ipsilateral to stimulation sideonto-central cortex corresponding to the sensorimotor network, which isith the stimulated M1. In addition, there was a significant decrease in thebjects when compared with the control subjects. Thus, the combinationinent changes in functional cortical connectivity and reactivity in the ADsts that the method may provide a novel tool for examining the degree and
© 2008 Elsevier B.V. All rights reserved.
ual brain provide the frame for evaluation of spatial reproducibilityand inter-individual comparisons.
Several distinguishable TMS-evoked responses in EEG, like P30,N100 and P200, have been identified during last few years (Paus etal., 2001; Tiitinen et al., 1999; Van Der Werf and Paus, 2006; VanDer Werf et al., 2006). P30 has been suggested to involve pathwaysbetween subcortical structures such as thalamic nuclei or basalganglia and cortex (Bonato et al., 2006). N100 has been shown torelate partially to auditory-evoked response produced by the soundduring the discharge of the coil (Nikouline et al., 1999), and partiallyby “real” cortical TMS-induced potentials (Komssi et al., 2004).
Alzheimer’s disease (AD) is the most common cause of demen-tia in old age, but objective, early diagnostics has remained evasive.Neuropathologically AD is characterised by neurofibrillary tanglesthat first appear in the medial temporal lobe (MTL) structuresand progress in further stages through the limbic structures toneocortical association areas (Braak and Braak, 1991). AD-relatedpathology leads to degeneration of the large cortical pyramidal

oscience Methods 172 (2008) 270–276 271
Table 1Demographic and TMS-related characteristics (mean ± S.D.)
Group Control MCI AD
Subjects 4 5 5Age, years 77.8 ± 2.6 74.0 ± 8.1 73.2 ± 8.1
P. Julkunen et al. / Journal of Neur
neurons (Hardy et al., 1986), presumably at the level of cortico-cortical projections. Correspondingly, a “disconnection syndrome”has been proposed as a model of AD symptomatology (Morrison etal., 1986), and, indeed, neuroimaging studies have shown alteredfunctional connectivity in patients with AD (Grady et al., 2001).
Mild cognitive impairment (MCI) has recently been proposedas prodromal AD (Petersen et al., 1995). Subjects with MCI havean increased risk to develop AD with an annual conversion rate of6–25% (Petersen et al., 2001). Recent imaging studies have foundatrophy of the MTL structures (Laakso et al., 1998; Pennanen etal., 2004) and reduced metabolism (De Santi et al., 2001) resem-bling the findings of AD, whereas increased MTL activation hasbeen reported with functional magnetic resonance imaging (fMRI)in MCI subjects (Dickerson et al., 2004, 2005; Hamalainen et al.,2007).
As altered functional connectivity may precede structuralchanges, an objective method for the investigation of early func-tional changes would be useful in the diagnostics of MCI andAD. Early identification of MCI would help aiming the currentsymptomatic AD-treatment to the appropriate subjects and in theprospects of obtaining treatments that modify the course of AD,it is even more important to accurately identify subjects likely toconvert to AD.
In this pilot study we investigated the potential of NBS-evokedbrain responses in the assessment of connectivity and/or reactiv-ity changes related to AD and MCI. We hypothesized that impairedfunctional connectivity and altered cortical reactivity of those dis-eases could be revealed by focusing magnetic stimulation to afunctionally active and densely interconnected cortical area of thebrain (primary motor cortex M1). If the results of this pilot studyindicate that the EEG-responses to M1 stimulation show local orglobal differences in time- and/or frequency-domain in cognitivelyimpaired subjects, the method may provide a new tool for investi-gating early changes in MCI or AD.
2. Methods
2.1. Study subjects
We studied 14 voluntary right-handed subjects: five patientswith AD, five patients with MCI and four healthy controls (Table 1).Both the controls and the MCI subjects were recruited from a lon-gitudinal population-based study (Hanninen et al., 2002; Tervo etal., 2004). Diagnosis of MCI required the following characteristics
(Petersen et al., 1995): (1) subjective memory impairment cor-roborated by an informant, (2) objective memory impairment asevidenced by a score of 0.5 in the clinical dementia rating (CDR)scale (Hughes et al., 1982) with at least 0.5 on the memory sub-scale and a score of 1.5 S.D. below the average of a normativeage-matched sample group in at least one memory test, (3) nor-mal global cognitive function (MMSE ≥ 20) (Folstein et al., 1975),(4) normal activities of daily living and (5) no dementia accord-ing to the NINCDS-ADRDA criteria (McKhann et al., 1984). All theMCI subjects included in the study were classified as multidomainamnestic MCI (Gauthier et al., 2006). The five AD patients wererecruited from the local neurological outpatient clinic, and theyunderwent extensive diagnostic tests including neuropsychologi-cal testing, laboratory sampling, MR imaging of the head as well asa clinical and neurological examination. Diagnosis of AD was madeaccording to the NINCDS-ADRDA criteria for probable AD (McKhannet al., 1984). None of the subjects had a history of neurologicalor psychiatric disease other than AD or MCI. All the AD patientswere using cholinesterase inhibitors, while no other subjects hadmedication affecting cognition at the time of NBS measurement.Handedness was tested using the Edinburgh handedness inven-Female (%) 75.0 40.0 40.0Education (years) 6.5 ± 1.0b 7.6 ± 3.0 9.6 ± 2.1MMSE 27.0 ± 4.1b 25.4 ± 3.2b 22.0 ± 5.1a
CDR total 0.0 ± 0.0† ,‡ ,b 0.5 ± 0.0b 0.6 ± 0.2a
CDR sum of boxes 0.0 ± 0.0† ,‡ ,a ,b 1.9 ± 1.1 3.2 ± 2.5Stimuli (n) 52.5 ± 3.6 50.4 ± 0.5 49.3 ± 1.4MT intensity (%) 44.3 ± 15.7‡ 50.4 ± 12.4‡ ,b 41.2 ± 4.6† ,a
left hemisphere: 48.4 ± 10.8b 49.5 ± 13.3‡ ,b 41.6 ± 4.0† ,a
right hemisphere: 40.2 ± 10.9† 47.7 ± 13.2 40.7 ± 5.6Electric field strength (V/m) 82.6 ± 17.1‡ ,b 80.6 ± 17.9‡ ,b 61.3 ± 7.0† ,a
left hemisphere: 85.5 ± 14.3b 82.4 ± 17.4b 63.2 ± 8.7a
right hemisphere: 79.8 ± 21.3b 78.2 ± 20.5b 59.4 ± 5.1a
MEP amplitude (mV) 1.0 ± 0.6b 2.0 ± 2.6 2.9 ± 2.5left hemisphere: 1.1 ± 0.6a,b 3.3 ± 3.6 2.5 ± 2.3right hemisphere: 1.0 ± 0.7b 1.0 ± 0.4b 3.3 ± 3.0a
Motor-evoked potentials were measured from opponens pollicis muscle.Abbreviations: AD = Alzheimer’s disease, CDR = clinical dementia rating, MCI = mildcognitive impairment, MEP = motor-evoked potential induced by transcranial mag-netic stimulation, MMSE = mini mental-state examination, MT = motor threshold.
† Significant difference (p < 0.05) as compared to the MCI group.‡ Significant difference (p < 0.05) as compared to the AD group.a Cohen’s d > 0.8 as compared to MCI group.b Cohen’s d > 0.8 as compared to AD group.
tory (Ransil and Schachter, 1994). No significant differences existedbetween the study groups in age or education (Table 1). Each sub-ject gave written informed consent, and the study was approved bythe local ethics committee.
2.2. Measurement setup
MR imaging was performed on a Siemens Magnetom Avanto(Erlangen, Germany) 1.5T scanner. T1-weighted high-resolution 3DMR-images were used in the NBS. The stimulation setup consistedof an NBS system (Nexstim Ltd., Helsinki, Finland) combined witha Magstim 200 magnetic stimulator (Magstim Ltd., Whitland, UK)and a figure-of-eight monophasic TMS coil (Magstim Double 70 mm(PN6625)). During NBS, muscle activity was recorded and moni-tored on-line by continuous electromyography (EMG) (ME 6000,Mega Electronics Ltd., Kuopio, Finland), and EEG was recorded bya 60-channel TMS compatible EEG device (Nexstim Ltd., Helsinki,Finland). EMG was measured from pre-gelled disposable Ag/AgCl
electrodes attached to the skin overlying the thenar and hypothenarmuscles. The NBS system delivered trigger pulses that synchronizedthe TMS, EMG and EEG systems.2.3. TMS protocol
To locate the optimal stimulus site for the hypothenar mus-cle, the hand muscle area around the anatomically defined “motorknob” was mapped with high intensity stimulation. Stimulationwas started from the left or right hemisphere randomly for eachsubject. Stimulation intensities corresponding to MTs for bothhemispheres in each subject (hand area on the primary motor cor-tex, Fig. 1B) were determined at the optimal location with theorientation of the coil such that the induced electric field wasperpendicular to the central sulcus. MTs were determined as wasdescribed in Saisanen et al. (2008). With the navigation software,we computed the electric field strengths at the mapped optimallocation in the cortex at MT intensity (Ruohonen and Ilmoniemi,1999). This was done at the depth from the scalp where the grey andwhite matter threshold became visible. Then the stimulation wasperformed using a single-pulse mode with a stimulus intensity of

272 P. Julkunen et al. / Journal of Neuroscience Methods 172 (2008) 270–276
In addition, spectrograms were produced to show thetime–frequency characteristics of each group average. Analysis wasmade for the CZ electrode as it was considered to capture the globalfrequency characteristics in EEG. The spectrogram was made in awindow of 50 samples and with an overlap of 40 samples using Mat-lab 6.5 (Mathworks Inc., Natick, MA, USA). The spectrograms werealso statistically compared between the groups in time–frequencydomain within the resolution yielded by the spectrogram func-tion using Mann–Whitney U test. All these statistical analyses wereimplemented with Matlab, and CURRY 4 was utilised for visualiza-tion and current density computation (Compumedics, El Paso, TX,USA).
2.5. Statistical analyses of demographic details
The demographic data was statistically analyzed with SPSS soft-ware (version 11.5; SPSS Inc., Chicago, IL, USA). Due to non-normally
Fig. 1. (A) Electrode locations in the 60-channel EEG-measurement system and (B)typical stimulation points presented with green crosses for one subject. The visu-alized cortical depth was 28 mm from the scalp. Central sulcus (CS) and precentralsulcus (pCS) have been visualized indicating the area of the primary motor cortexin between.
110% × MT at the optimal site. Fifty stimuli were given repeatedly afew seconds (>3 s) apart. The stimulation was performed separatelyfor each hemisphere.
2.4. EEG recording and analysis
The EEG was recorded with a 60-channel TMS-compatiblesystem (Virtanen et al., 1999) continuously throughout the exper-iment. In the EEG system, a sample-and-hold circuit was appliedtogether with blocking of the amplifier input for 3 ms from thestimulus to avoid amplifier saturation. An electrode cap was tightlyattached to the subjects’ head. All electrodes were referred to anelectrode placed on the right mastoid (Fig. 1A). The data wererecorded with a 1450-Hz sampling frequency and 16-bit preci-sion. A trigger signal marking the exact stimulation moments wasrecorded with the EEG. Electro-oculogram (EOG) was recordedabove and below the left eye.
In off-line analysis, the raw EEG data were filtered to a 0.1–25.0-Hz frequency band. EEG data were divided to segments of 500 msincluding a 100 ms pre-stimulus baseline. Ocular correction wasapplied to each segment (∼50 trials per subject) with Grattonand Coles’ method utilising the EOG signal (Gratton et al., 1983).Automated and visual artefact rejection for individual channelswas done before averaging the segments. A commercial software
package, Brain Vision Analyzer (Brain Products GmbH, Munich, Ger-many) was used in the off-line analysis.Group-averaged global-field-power (GFP, Lehmann andSkrandies (1980)) curves were computed in order to revealthe global time-dependent differences between the groups. Theaverage GFP for the groups was computed as a grand averagefrom each individual’s GFP computed with the data from allmeasured (60 in maximum) EEG channels. To find the time periodsover which the differences between the groups were significant,Mann–Whitney U test was point-wise applied to the GFPs.
For visualization of the scalp locations of the statistically signif-icant differences between groups, a channel-wise Mann–WhitneyU test was applied to get a p-value for each electrode location.
Current density maps (based on minimum norm of eachgroup’s grand average data) were computed and visually comparedbetween the groups. Current densities were separately computedfor left- and right-side stimulation. A head model of three concen-tric circles was used as a volume conductor model for the currentdensity map calculations. The current density mapping was doneto aid visual comparison of the hypothesized cortical connectiv-ity/reactivity differences between the groups.
Fig. 2. Global-field-power (GFP) waveforms (bold line) and statistical comparisonfor control and MCI group (A), for control and AD group (B) and for MCI and AD group(C). The stimulation moment is presented with a dash line. The grey bars indicatethe time ranges over which the waveforms differ statistically at a probability levelof p < 0.05. The data from both hemispheres was pooled for the GFP analysis. TheGFPs were computed from as a grand average from each individual’s GFP.

P. Julkunen et al. / Journal of Neuroscience Methods 172 (2008) 270–276 273
Fig. 3. Butterfly plots of TMS-evoked-potential curves for control (upper panel), MCI (middFifty single-pulse TMS were applied for each patient and hemisphere. Each trace represen
distributed variables and small amount of subjects, non-parametricMann–Whitney test was used. To investigate the size of foundeffects, we used Cohen’s d (d > 0.5 meaning medium effect andd > 0.8 meaning large effect) (Rosnow and Rosenthal, 1996).
3. Results
The observed MTs were significantly (p < 0.05) lower in the ADgroup than in the MCI group, and interestingly, the MCI subjectsshowed the highest MTs of these three groups (Table 1). Instead, theinduced motor-evoked potential amplitudes were not significantlydifferent between the groups.
TMS evoked distinct P30, N100 and P200 potential peaks(Figs. 2 and 3). There were significant (p < 0.05, d > 0.8) magnitude
Table 2Comparison of baseline-to-peak amplitudes of P30, N100 and P200 (mean ± S.D.)
Group P30
CP1 (�V) left CP2 (�V) right GA (�V) combine
Control 19.0 ± 12.3 15.6 ± 10.7 7.5 ± 3.5MCI 17.0 ± 18.2 11.4 ± 14.2 7.6 ± 8.8AD 11.8 ± 8.8a 7.0 ± 5.3a 3.8 ± 3.2a,b
Potentials on the side of stimulation were measured from electrodes exhibiting highest awas most prominent at the vertex electrode (CZ) and P200 was seen globally.Differences between the groups were statistically insignificant.GA = grand average of all electrodes.
a Cohen’s d > 0.5 as compared to controls.b Cohen’s d > 0.5 as compared to MCI.
le panel) and AD (lower panel) group measured from both hemisphere stimulations.ts the group average measured from individual electrodes.
differences in the GFPs between the AD group and controls between30 and 90 ms as well as between 280 and 400 ms (Fig. 2). TheMCI group had a significantly (p < 0.05, d > 0.8) lower N100 GFP-magnitude compared to the control group, and lower GFPs between300 and 370 ms (d > 0.5). In addition, the GFP magnitude of P30was significantly (p < 0.05, d > 0.2) decreased in the AD group ascompared to the MCI group (Fig. 2). These differences were visu-ally apparent in the butterfly plots (Fig. 3). In particular, therewas focally reduced activity (not significant) in the 30 and 100 mslatency range (P30 and N100, respectively) in the AD group and theMCI group (Table 2). P30 was seen most clearly in the centroparietalelectrodes (CP1 and CP2) of the stimulation side. The N100 latencywas longer in the MCI group than in the other groups, but this dif-ference was not statistically significant (Table 3). In addition, we
N100 P200
d CZ (�V) left CZ (�V) right GA (�V) combined
−11.8 ± 5.3 −17.0 ± 9.4b 5.3 ± 4.4−9.0 ± 8.6 −11.3 ± 6.3a 4.9 ± 2.8−4.6 ± 8.5a,b −10.6 ± 7.2a 5.0 ± 2.1
mplitudes. P30 was most visible in electrodes close to stimulation, whereas N100

oscien
)
Right Left Right
0.2 91.5 ± 15.9a 177.3 ± 11.0 182.3 ± 13.7.0 102.0 ± 9.2b 176.5 ± 4.5 187.8 ± 16.2.1a 96.4 ± 10.1a 189.3 ± 10.4a,b 187.4 ± 8.7
ispheres (mean ± S.D.). Stimulated hemispheres are indicated below the EEG-component
ntrol and the MCI group.
4. Discussion
TMS-evoked response at around 30–50 ms decreased signifi-cantly over widespread brain areas in AD patients corresponding
274 P. Julkunen et al. / Journal of Neur
Table 3Latencies for each group
Group P30 (ms) N100 (ms
Left Right Left
Control 31.0 ± 2.6 32.5 ± 1.7 94.3 ± 2MCI 31.6 ± 1.8 32.3 ± 9.2 98.0 ± 9AD 33.5 ± 1.7a,b 35.6 ± 1.5† ,a ,b 96.5 ± 8
Latencies were determined from the central CZ-electrode for stimulation of both hemlabels.
† p < 0.05 according to paired samples Mann–Whitney test as compared to the coa Cohen’s d > 0.5 as compared to MCI group.b Cohen’s d > 0.8 as compared to control group.
observed higher ipsilateral reactivity on the dominant (left) hemi-sphere for the TMS pulse applied to the same side in all the groups(Table 2).
To evaluate the topographical differences in the evoked
potentials, a spatial significance map of TMS-evoked activation dif-ferences at 30 ms was computed between the control and AD group(Fig. 4). Significant differences were seen on the ipsilateral parietalcortex, and on the contralateral frontotemporal areas. There wereno significant activation differences between the control and theMCI group at any location. The P200 showed no significant differ-ences between any of the groups (Table 2, Fig. 2).Current densities were different between the groups. The dif-ference was dependent on the stimulation side (Fig. 5). The currentdensity maxima were spatially located on the side of the stimula-tion and temporally 30 ms after the stimulation. The difference inthe current densities was higher in the non-dominant than in thedominant hemisphere.
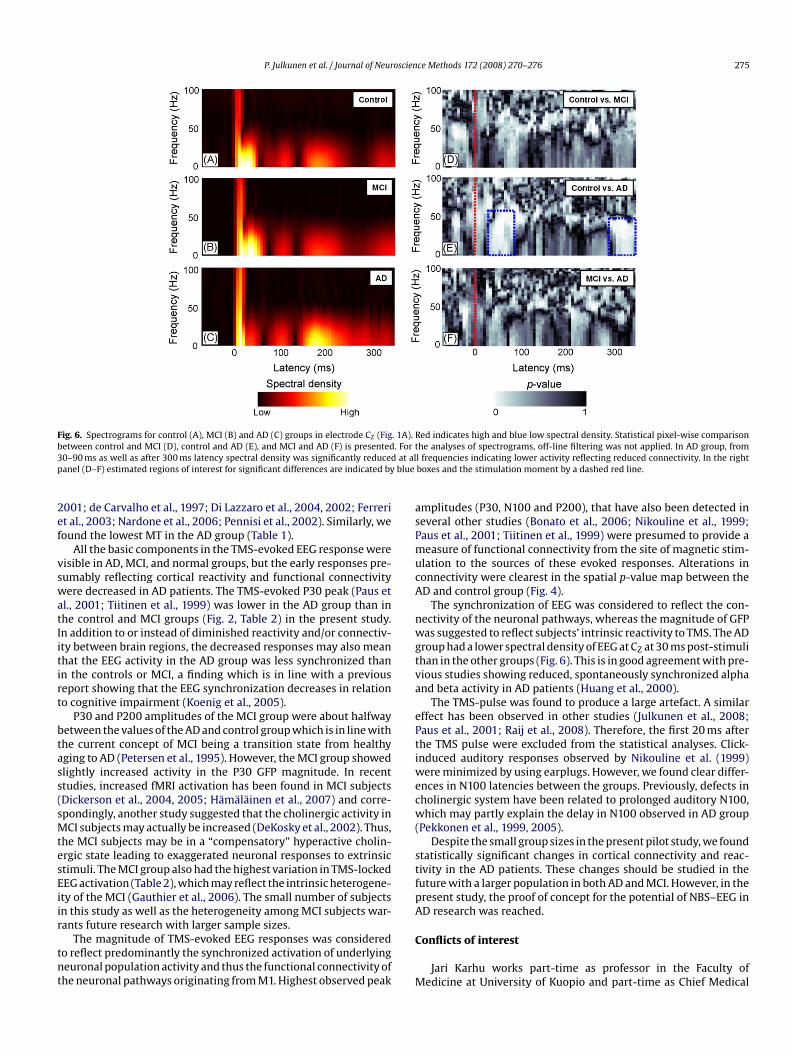
The spectrograms (presenting spectral density of TMS-evokedEEG in time and frequency domains in the vertex electrode) dif-fered significantly between the AD and control group in twotime–frequency regions (Fig. 6): the AD group had a lower spec-tral density at all major EEG-frequencies (<50 Hz) from 30 ms up to100 ms and from 300 ms onwards. The MCI and control groups hadsimilar spectral densities.
Fig. 4. Topographic statistical p-value maps from Mann–Whitney U test betweencontrol and AD groups at a latency of 30 ms. The green crosses represent the foci ofTMS-pulses. The lowest p-values for the left and right hemisphere stimulation were0.06 and 0.04, respectively. No significant spatial differences were found betweenthe MCI and AD group or the controls and the MCI group.
ce Methods 172 (2008) 270–276
P200 (ms)
to dysfunction of a large-scale sensorimotor network. This find-ing was consistent, whether measured globally using GFP, in thetime–frequency domain using spectrogram or when visualized byp-value mapping on the scalp or by cortical current density map-ping.
Several studies have reported increased cortical excitability inAD patients and in increasing cognitive impairment (Alagona et al.,
Fig. 5. Current density maps for AD and control groups at a latency of 30 ms (P30peak of the response). The scale range is normalized to the maximum current densityin the control group. The current maps were computed using CURRY4 with mini-mum norm estimate and a head model of three concentric shells. The maps werecomputed in the group level.
P. Julkunen et al. / Journal of Neuroscience Methods 172 (2008) 270–276 275
. 1A).. For tat alblue
Fig. 6. Spectrograms for control (A), MCI (B) and AD (C) groups in electrode CZ (Figbetween control and MCI (D), control and AD (E), and MCI and AD (F) is presented30–90 ms as well as after 300 ms latency spectral density was significantly reducedpanel (D–F) estimated regions of interest for significant differences are indicated by
2001; de Carvalho et al., 1997; Di Lazzaro et al., 2004, 2002; Ferreriet al., 2003; Nardone et al., 2006; Pennisi et al., 2002). Similarly, wefound the lowest MT in the AD group (Table 1).
All the basic components in the TMS-evoked EEG response werevisible in AD, MCI, and normal groups, but the early responses pre-sumably reflecting cortical reactivity and functional connectivitywere decreased in AD patients. The TMS-evoked P30 peak (Paus etal., 2001; Tiitinen et al., 1999) was lower in the AD group than inthe control and MCI groups (Fig. 2, Table 2) in the present study.In addition to or instead of diminished reactivity and/or connectiv-ity between brain regions, the decreased responses may also meanthat the EEG activity in the AD group was less synchronized thanin the controls or MCI, a finding which is in line with a previousreport showing that the EEG synchronization decreases in relation
to cognitive impairment (Koenig et al., 2005).P30 and P200 amplitudes of the MCI group were about halfwaybetween the values of the AD and control group which is in line withthe current concept of MCI being a transition state from healthyaging to AD (Petersen et al., 1995). However, the MCI group showedslightly increased activity in the P30 GFP magnitude. In recentstudies, increased fMRI activation has been found in MCI subjects(Dickerson et al., 2004, 2005; Hamalainen et al., 2007) and corre-spondingly, another study suggested that the cholinergic activity inMCI subjects may actually be increased (DeKosky et al., 2002). Thus,the MCI subjects may be in a “compensatory” hyperactive cholin-ergic state leading to exaggerated neuronal responses to extrinsicstimuli. The MCI group also had the highest variation in TMS-lockedEEG activation (Table 2), which may reflect the intrinsic heterogene-ity of the MCI (Gauthier et al., 2006). The small number of subjectsin this study as well as the heterogeneity among MCI subjects war-rants future research with larger sample sizes.
The magnitude of TMS-evoked EEG responses was consideredto reflect predominantly the synchronized activation of underlyingneuronal population activity and thus the functional connectivity ofthe neuronal pathways originating from M1. Highest observed peak
Red indicates high and blue low spectral density. Statistical pixel-wise comparisonhe analyses of spectrograms, off-line filtering was not applied. In AD group, froml frequencies indicating lower activity reflecting reduced connectivity. In the rightboxes and the stimulation moment by a dashed red line.
amplitudes (P30, N100 and P200), that have also been detected inseveral other studies (Bonato et al., 2006; Nikouline et al., 1999;Paus et al., 2001; Tiitinen et al., 1999) were presumed to provide ameasure of functional connectivity from the site of magnetic stim-ulation to the sources of these evoked responses. Alterations inconnectivity were clearest in the spatial p-value map between theAD and control group (Fig. 4).
The synchronization of EEG was considered to reflect the con-nectivity of the neuronal pathways, whereas the magnitude of GFPwas suggested to reflect subjects’ intrinsic reactivity to TMS. The ADgroup had a lower spectral density of EEG at CZ at 30 ms post-stimulithan in the other groups (Fig. 6). This is in good agreement with pre-vious studies showing reduced, spontaneously synchronized alphaand beta activity in AD patients (Huang et al., 2000).
The TMS-pulse was found to produce a large artefact. A similareffect has been observed in other studies (Julkunen et al., 2008;Paus et al., 2001; Raij et al., 2008). Therefore, the first 20 ms afterthe TMS pulse were excluded from the statistical analyses. Click-induced auditory responses observed by Nikouline et al. (1999)were minimized by using earplugs. However, we found clear differ-ences in N100 latencies between the groups. Previously, defects incholinergic system have been related to prolonged auditory N100,which may partly explain the delay in N100 observed in AD group(Pekkonen et al., 1999, 2005).
Despite the small group sizes in the present pilot study, we foundstatistically significant changes in cortical connectivity and reac-tivity in the AD patients. These changes should be studied in thefuture with a larger population in both AD and MCI. However, in thepresent study, the proof of concept for the potential of NBS–EEG inAD research was reached.
Conflicts of interest
Jari Karhu works part-time as professor in the Faculty ofMedicine at University of Kuopio and part-time as Chief Medical

oscien
Ransil BJ, Schachter SC. Test–retest reliability of the Edinburgh Handedness Inven-
276 P. Julkunen et al. / Journal of Neur
Officer in Nexstim Ltd., manufacturer of navigated brain stimula-tion instruments. The recordings and analysis of the present studywere performed solely in the premises of the Kuopio UniversityHospital by the other authors.
Acknowledgements
This study was supported by the National Technological Agencyof Finland (TEKES) Helsinki, Finland and an EVO (5772739) grantfrom Kuopio University Hospital.
References
Alagona G, Bella R, Ferri R, Carnemolla A, Pappalardo A, Costanzo E, et al. Transcra-nial magnetic stimulation in Alzheimer disease: motor cortex excitability andcognitive severity. Neurosci Lett 2001;314:57–60.
Bonato C, Miniussi C, Rossini PM. Transcranial magnetic stimulation and cor-tical evoked potentials: a TMS/EEG co-registration study. Clin Neurophysiol2006;117:1699–707.
Braak H, Braak E. Neuropathological stageing of Alzheimer-related changes. ActaNeuropathol (Berl) 1991;82:239–59.
de Carvalho M, de Mendonca A, Miranda PC, Garcia C, Luis ML. Magnetic stimulationin Alzheimer’s disease. J Neurol 1997;244:304–7.
De Santi S, de Leon MJ, Rusinek H, Convit A, Tarshish CY, Roche A, et al. Hippocampalformation glucose metabolism and volume losses in MCI and AD. NeurobiolAging 2001;22:529–39.
DeKosky ST, Ikonomovic MD, Styren SD, Beckett L, Wisniewski S, Bennett DA,et al. Upregulation of choline acetyltransferase activity in hippocampus andfrontal cortex of elderly subjects with mild cognitive impairment. Ann Neurol2002;51:145–55.
Di Lazzaro V, Oliviero A, Pilato F, Saturno E, Dileone M, Marra C, et al. Motor cortexhyperexcitability to transcranial magnetic stimulation in Alzheimer’s disease. JNeurol Neurosurg Psychiatry 2004;75:555–9.
Di Lazzaro V, Oliviero A, Tonali PA, Marra C, Daniele A, Profice P, et al. Noninvasive invivo assessment of cholinergic cortical circuits in AD using transcranial magneticstimulation. Neurology 2002;59:392–7.
Dickerson BC, Salat DH, Bates JF, Atiya M, Killiany RJ, Greve DN, et al. Medial tem-poral lobe function and structure in mild cognitive impairment. Ann Neurol2004;56:27–35.
Dickerson BC, Salat DH, Greve DN, Chua EF, Rand-Giovannetti E, Rentz DM, et al.Increased hippocampal activation in mild cognitive impairment compared tonormal aging and AD. Neurology 2005;65:404–11.
Ferreri F, Pauri F, Pasqualetti P, Fini R, Dal Forno G, Rossini PM. Motor cortex excitabil-ity in Alzheimer’s disease: a transcranial magnetic stimulation study. Ann Neurol2003;53:102–8.
Folstein MF, Folstein SE, McHugh PR. “Mini-mental state”. A practical methodfor grading the cognitive state of patients for the clinician. J Psychiatry Res
1975;12:189–98.Gauthier S, Reisberg B, Zaudig M, Petersen RC, Ritchie K, Broich K, et al. Mild cognitiveimpairment. Lancet 2006;367:1262–70.
Grady CL, Furey ML, Pietrini P, Horwitz B, Rapoport SI. Altered brain functionalconnectivity and impaired short-term memory in Alzheimer’s disease. Brain2001;124:739–56.
Gratton G, Coles MG, Donchin E. A new method for off-line removal of ocular artifact.Electroencephalogr Clin Neurophysiol 1983;55:468–84.
Hardy JA, Mann DM, Wester P, Winblad B. An integrative hypothesis concern-ing the pathogenesis and progression of Alzheimer’s disease. Neurobiol Aging1986;7:489–502.
Huang C, Wahlund L, Dierks T, Julin P, Winblad B, Jelic V. Discrimination ofAlzheimer’s disease and mild cognitive impairment by equivalent EEG sources:a cross-sectional and longitudinal study. Clin Neurophysiol 2000;111:1961–7.
Hughes CP, Berg L, Danziger WL, Coben LA, Martin RL. A new clinical scale for thestaging of dementia. Br J Psychiatry 1982;140:566–72.
Hamalainen A, Pihlajamaki M, Tanila H, Hanninen T, Niskanen E, Tervo S, et al.Increased fMRI responses during encoding in mild cognitive impairment. Neu-robiol Aging 2007;28:1889–903.
Hanninen T, Hallikainen M, Tuomainen S, Vanhanen M, Soininen H. Prevalence ofmild cognitive impairment: a population-based study in elderly subjects. ActaNeurol Scand 2002;106:148–54.
Ilmoniemi RJ, Virtanen J, Ruohonen J, Karhu J, Aronen HJ, Naatanen R, et al. Neuronalresponses to magnetic stimulation reveal cortical reactivity and connectivity.Neuroreport 1997;10:3537–40.
Julkunen P, Paakkonen A, Hukkanen T, Kononen M, Tiihonen P, Vanhatalo S, et al.Efficient reduction of stimulus artefact in TMS-EEG by epithelial short-circuitingby mini-punctures. Clin Neurophysiol 2008;119:475–81.
ce Methods 172 (2008) 270–276
Koenig T, Prichep L, Dierks T, Hubl D, Wahlund LO, John ER, et al. Decreased EEG syn-chronization in Alzheimer’s disease and mild cognitive impairment. NeurobiolAging 2005;26:165–71.
Komssi S, Kahkonen S, Ilmoniemi RJ. The effect of stimulus intensity on brainresponses evoked by transcranial magnetic stimulation. Hum Brain Mapp2004;21:154–64.
Kahkonen S, Kesaniemi M, Nikouline VV, Karhu J, Ollikainen M, Holi M, et al. Ethanolmodulates cortical activity: direct evidence with combined TMS and EEG. Neu-roimage 2001;14:322–8.
Laakso MP, Soininen H, Partanen K, Lehtovirta M, Hallikainen M, Hanninen T, etal. MRI of the hippocampus in Alzheimer’s disease: sensitivity, specificity, andanalysis of the incorrectly classified subjects. Neurobiol Aging 1998;19:23–31.
Lehmann D, Skrandies W. Reference-free identification of components ofcheckerboard-evoked multichannel potential fields. Electroencephalogr ClinNeurophysiol 1980;48:609–21.
McKhann G, Drachman D, Folstein M, Katzman R, Price D, Stadlan EM. Clinicaldiagnosis of Alzheimer’s disease: report of the NINCDS-ADRDA Work Groupunder the auspices of Department of Health and Human Services Task Forceon Alzheimer’s Disease. Neurology 1984;34:939–44.
Morrison JH, Scherr S, Levis DA, Capbell MJ, Bloom FE, Rogers J, et al. The laminar andregional distribution of neocortical somatostatin and neuritic plaques: implica-tions for Alzheimer’s disease as a global neocortical disconnection syndrome. In:Scheibel AD, Wechsler AF, et al., editors. The biological substrates of Alzheimer’sdisease. Orlando, FL: Academic Press; 1986. p. 115–31.
Nardone R, Bratti A, Tezzon F. Motor cortex inhibitory circuits in dementia with Lewybodies and in Alzheimer’s disease. J Neural Transm 2006;113:1679–84.
Nikouline V, Ruohonen J, Ilmoniemi RJ. The role of the coil click in TMS assessedwith simultaneous EEG. Clin Neurophysiol 1999;110:1325–8.
Paus T, Sipila PK, Strafella AP. Synchronization of neuronal activity in the humanprimary motor cortex by transcranial magnetic stimulation: an EEG study. JNeurophysiol 2001;86:1983–90.
Pekkonen E, Jaaskelainen IP, Hietanen M, Huotilainen M, Naatanen R, IlmoniemiRJ, et al. Impaired preconscious auditory processing and cognitive functions inAlzheimer’s disease. Clin Neurophysiol 1999;110:1942–7.
Pekkonen E, Jaaskelainen IP, Kaakkola S, Ahveninen J. Cholinergic modulation ofpreattentive auditory processing in aging. Neuroimage 2005;27:387–92.
Pennanen C, Kivipelto M, Tuomainen S, Hartikainen P, Hanninen T, Laakso MP, et al.Hippocampus and entorhinal cortex in mild cognitive impairment and early AD.Neurobiol Aging 2004;25:303–10.
Pennisi G, Alagona G, Ferri R, Greco S, Santonocito D, Pappalardo A, et al. Motorcortex excitability in Alzheimer disease: one year follow-up study. Neurosci Lett2002;329:293–6.
Petersen RC, Smith GE, Ivnik RJ, Tangalos EG, Schaid DJ, Thibodeau SN, et al.Apolipoprotein E status as a predictor of the development of Alzheimer’s diseasein memory-impaired individuals. JAMA 1995;273:1274–8.
Petersen RC, Stevens JC, Ganguli M, Tangalos EG, Cummings JL, DeKosky ST. Prac-tice parameter: early detection of dementia: mild cognitive impairment (anevidence-based review). Report of the Quality Standards Subcommittee of theAmerican Academy of Neurology. Neurology 2001;56:1133–42.
Raij T, Karhu J, Kicic D, Lioumis P, Julkunen P, Lin F-H, et al. Parallel input makes thebrain run faster. Neuroimage 2008;40:1792–7.
tory and Global Handedness preference measurements, and their correlation.Percept Mot Skills 1994;79:1355–72.
Rosnow RL, Rosenthal R. Computing contrasts, effect sizes, and counternulls on otherpeople’s published data: general procedures for research consumers. PsycholMethods 1996;1:331–40.
Ruohonen J, Ilmoniemi RJ. Modeling of the stimulating field generation in TMS.Electroencephalogr Clin Neurophysiol Suppl 1999;51:30–40.
Saisanen L, Pirinen E, Teitti S, Kononen M, Julkunen P, Maatta S, et al. Factors influ-encing cortical silent period: optimized stimulus location, intensity and musclecontraction. J Neurosci Methods 2008;169:231–8.
Tervo S, Kivipelto M, Hanninen T, Vanhanen M, Hallikainen M, Mannermaa A, etal. Incidence and risk factors for mild cognitive impairment: a population-basedthree-year follow-up study of cognitively healthy elderly subjects. Dement Geri-atr Cogn Disord 2004;17:196–203.
Tiitinen H, Virtanen J, Ilmoniemi RJ, Kamppuri J, Ollikainen M, Ruohonen J,et al. Separation of contamination caused by coil clicks from responseselicited by transcranial magnetic stimulation. Clin Neurophysiol 1999;110:982–5.
Van Der Werf YD, Paus T. The neural response to transcranial magnetic stimulationof the human motor cortex. I. Intracortical and cortico-cortical contributions.Exp Brain Res 2006;175:231–45.
Van Der Werf YD, Sadikot AF, Strafella AP, Paus T. The neural response to tran-scranial magnetic stimulation of the human motor cortex. II. Thalamocorticalcontributions. Exp Brain Res 2006;175:246–55.
Virtanen J, Ruohonen J, Naatanen R, Ilmoniemi RJ. Instrumentation for the measure-ment of electric brain responses to transcranial magnetic stimulation. Med BiolEng Comput 1999;37:322–6.