naval air station lemoore, ca (1002k/14pp/pdf)
TRANSCRIPT
Case Study for the Use of a Decision Support Tool: Evaluating the Applicability of Remediation by Natural Attenuation Using BIOSCREEN at the Administration Area Naval Exchange (NEX) Gas Station, Naval
Air Station Lemoore, Lemoore, California
August 2005
Prepared by:
U.S. Environmental Protection Agency Office of Superfund Remediation and Technology Innovation
Brownfields Technology Support Center Washington D.C. 20460

Case Study for the Use of a Decision Support Tool: Naval Air Station Lemoore, California
i
NOTICE AND DISCLAIMER
This material has been funded wholly by the U.S. Environmental Protection Agency (EPA) under Contract Number 68-W-02-034. Mention of trade names or commercial products does not constitute endorsement or recommendation for use. Comments or questions about this report may be directed to Dan Powell, EPA, Office of Superfund Remediation and Technology Innovation (5102G), 1200 Pennsylvania Avenue NW, Washington, D.C. 20460; telephone (703) 603-7196; e-mail: [email protected].
Case Study for the Use of a Decision Support Tool: Naval Air Station Lemoore, California
ii
FOREWORD This case study is one in a series designed to provide information on use of decision support tools that support the use of data, models, and structured decision processes in decision-making. These case studies include reports on selected tools that have been used to support activities such as site assessment and remediation, data management and visualization, and optimization. They are prepared to offer operational experience and to further disseminate information to project managers, site owners, environmental consultants, and others who wish to screen decision support tools and benefit from their previous use at sites.
ACKNOWLEDGMENTS This document was prepared by the U.S. Environmental Protection Agency’s (EPA) Office of Superfund Remediation and Technology Innovation, with support provided under EPA Contract No. 68-W-02-034.
Case Study for the Use of a Decision Support Tool: Naval Air Station Lemoore, California
iii
TABLE OF CONTENTS Section Page NOTICE .........................................................................................................................................................i FOREWORD................................................................................................................................................ ii ACKNOWLEDGEMENTS ......................................................................................................................... ii 1.0 SITE BACKGROUND ....................................................................................................................1 2.0 USE OF DECISION SUPPORT TOOLS ........................................................................................3 3.0 LESSONS LEARNED.....................................................................................................................7 4.0 POINTS OF CONTACT..................................................................................................................9 5.0 REFERENCES.................................................................................................................................9
FIGURES Figure 1 SITE AND WELL LOCATION MAP.............................................................................................2 2 BIOSCREEN NATURAL ATTENUATION DECISION SUPPORT SYSTEM............................7 3 DISSOLVED HYDROCARBON CONCENTRATION ALONG
PLUME CENTERLINE IN MG/L...................................................................................................8
TABLES
Table 1 COMPARISON OF GEOCHEMICAL PARAMETERS AT SITE WITH
AFCEE DATABASE.......................................................................................................................5
Case Study for the Use of a Decision Support Tool: Naval Air Station Lemoore, California
1
1.0 SITE BACKGROUND
The Administration Area Naval Exchange (NEX) gas station at Naval Air Station (NAS) Lemoore was
built in 1962. The fuel storage and distribution system at the gas station consisted of five 10,000-gallon
gasoline underground storage tanks (USTs), one waste oil UST, and associated piping. The USTs were
installed in 1974, and a release of gasoline from the USTs and associated piping was discovered in 1988.
Floating free product (up to 9 inches) was observed during the excavation and initial investigation of the
UST in 1988. The area affected by free product covered 18,000 square feet and was located directly north
and south of the pump islands. More than 10,000 gallons of free product (gasoline) were removed from
extraction well (EW)-1 between 1989 and 1994. In 1995, the five USTs were removed, and the tank
excavations were backfilled with native soil. Three new USTs were installed in the northern portion of
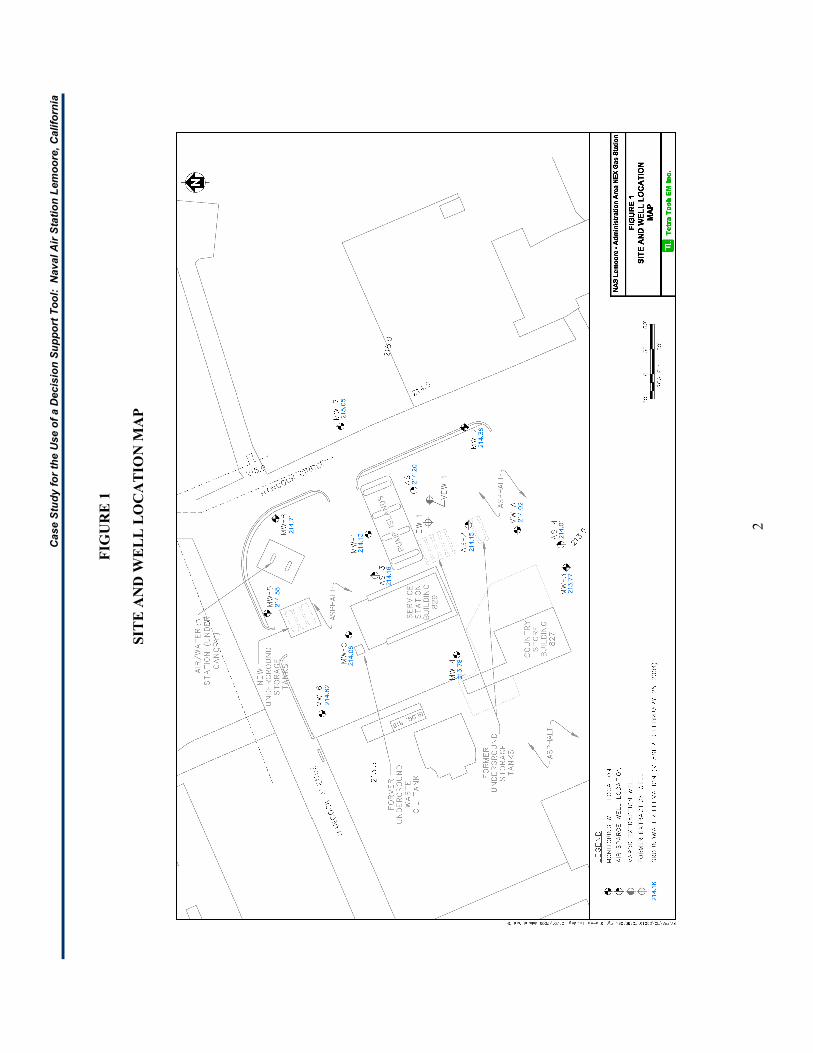
the site and are currently in use. Figure 1 shows the layout of the site.
Near-surface geology consists primarily of silts and clays with lesser amounts of silty sands. Interbedded
silt and clay predominate from ground surface to approximately 16 feet below ground surface (bgs).
Moderately graded, fine- to medium-grained sands are present below 16 feet bgs. Early estimates of
permeability for near-surface soils were in the range of 4.2 x 10⁻⁵ to 1.41 x 10⁻⁴ centimeters per second
(cm/sec) (Krazan 1989). Based on improved understanding of site lithology, this permeability is
appropriate for silt and clay; however, the permeability of the sand layer is estimated to be higher
(approximately 1 x 10⁻³ cm/sec). Depth to water beneath the site averages 4 feet bgs. The horizontal
gradient is relatively flat (0.002 to 0.003 feet per foot) and is oriented to the southwest.
The constituents of concern include benzene, toluene, ethylbenzene and xylene (BTEX) and methyl tert
butyl ether (MTBE.) The highest concentrations of MTBE and BTEX were detected in samples from
well MW-1. Floating product was historically present in this well; however, no measurable product has
been observed recently, and only a thin sheen of gasoline was observed in April 2003. Samples collected
from wells AS-2 and MW-A also exhibit elevated concentrations of benzene and MTBE.
In general, concentrations of fuel constituents have remained stable over time. Concentrations of MTBE
in well MW-1 fluctuate; however, in general, they remain greater than 100 milligrams per liter (mg/L).
Very low concentrations of MTBE and benzene were detected in a sample from well AS-4, indicating that
fuel is likely migrating toward the south-southwest within more permeable sand layers below 16 feet bgs.
(Well AS-4 is screened from 20 to 25 feet bgs in a sand interval that is fairly continuous beneath the site.)
Samples from wells located at the perimeter of the site, (MW-3, MW-4, and MW-B) contained no BTEX,
MTBE, or total petroleum hydrocarbon (TPH) constituents.
Cas
e S
tud
y fo
r th
e U
se o
f a
Dec
isio
n S
up
po
rt T
oo
l:
Nav
al A
ir S
tati
on
Lem
oo
re, C
alif
orn
ia
2
FIG
UR
E 1
SIT
E A
ND
WE
LL
LO
CA
TIO
N M
AP
Case Study for the Use of a Decision Support Tool: Naval Air Station Lemoore, California
3
A risk assessment conducted in 2003 indicated that corrective action was warranted at the NEX gas
station based on the levels of BTEX and MTBE in soil and ground water.
2.0 USE OF DECISION SUPPORT TOOLS
Remediation by natural attenuation relies on natural attenuation (NA) processes to achieve site-specific
remedial objectives within a timeframe that is reasonable compared with other methods (U.S.
Environmental Protection Agency [EPA] 1998). The applicability of using NA as the remedy for the
Administrative Area NEX gas station at NAS Lemoore in Lemoore, California, was evaluated because the
site fulfills many of the requirements for monitored natural attenuation (MNA) to be considered as a
remedial approach. Office of Solid Waste and Emergency Response (OSWER) Directive 9200.4-17
identifies three lines of evidence that can be used to demonstrate the efficacy of MNA. The first line of
evidence – evaluating historical soil and ground water chemistry data to demonstrate a meaningful trend
of decreasing contaminant mass or concentration over time – was inconclusive. The second line of
evidence – using hydrogeologic and geochemical data to demonstrate that NA processes are active and
estimate degradation rates – can be developed using BIOSCREEN
(http://www.epa.gov/ada/csmos/models/bioscrn.html - AFCEE 1997). (The third line of evidence – using
field or microcosm studies to directly demonstrate the occurrence of a particular NA process – only
required if the first two lines are inconclusive). This case study demonstrates the use of BIOSCREEN to
evaluate NA processes at the NEX site.
Review of Conceptual Site Model
Three aspects of the conceptual site model (CSM) that must be identified to provide input values for the
BIOSCREEN model are the timing of release, the configuration of the source term, and the soluble mass
remaining in the soil of the source zone. The site stratigraphy must also be identified to run the model.
The timing of the release is not known. The tanks were installed in 1973, and the leak was first
discovered in 1988; therefore, reasonable estimates of the time since release range from 16 to 31 years.
The configuration of the source term is difficult to estimate. The only reported location of a release is a
joint in one of the product lines between the tanks and the pump island. The product odor was reported
first at the cashier’s booth, located north of the fueling islands, and the highest concentrations of BTEX
and MTBE are found at a well north of the fueling islands (well MW-1). The distribution of high
concentrations of benzene (above its effective solubility) — which encompasses the area below both the
Case Study for the Use of a Decision Support Tool: Naval Air Station Lemoore, California
4
former tank pits, distribution piping and the fueling island — suggests that product likely filled both tank
pits and the distribution pipeline trenches at one time. Therefore, the source was modeled as located at
the downgradient (southwest) edge of the tank excavation. The concentration of benzene in the closest
borehole (24 milligrams per kilogram [mg/kg]) was used as a source concentration.
The soluble mass of hydrocarbon constituents is required as an input for modeling. The source volume
for both simulations was obtained by multiplying the cumulative length of the former pit sidewalls and
distribution piping by a 4-foot wide “lateral impact zone” and a 6-foot thick “vertical smear zone” to
estimate the soil volume that may be affected by residual product. The result was multiplied by an
assumed bulk density for soil of 1.7 grams per cubic centimeter (g/cm3) and an average benzene
concentration of 37 mg/kg in soil at the source area, to yield an estimate of 20,000 kilograms of soluble
mass in the source area.
Borehole logging suggests that the shallow aquifer must be separated into two vertical components, or
“zones.” The upper zone is characterized by alternating beds of silt and clay between the water table
(approximately 4 to 5 feet bgs) and a depth of 16 feet bgs. The lower zone consists of a well-sorted,
medium-grained sand channel deposit between depths of 16 and 26 feet bgs. The channel extends at least
to the southern extent of the site. The difference in geologic characteristics between the upper and lower
zones required estimating two sets of hydrogeologic parameters and two separate BIOSCREEN model
runs.
Evaluation of Field Geochemical Data
The geochemical evaluation of the site indicates that the components of BTEX have been undergoing
biodegradation. BIOSCREEN, which follows the Air Force Center for Environmental Excellence
(AFCEE) NA protocol, uses the change in geochemical indicator concentrations observed between
background and in-plume wells as a direct indication of mass reduction caused by biodegradation
(AFCEE 1997). Changes in five geochemical indicators are tracked in the protocol: dissolved oxygen,
nitrate, ferrous iron, sulfate, and methane. Oxygen, nitrate, and sulfate are electron acceptors that are
consumed, along with BTEX, by microorganisms in biologically mediated redox reactions. Ferrous iron
and methane are metabolic byproducts that are produced by similar reactions. Table 1 summarizes site
geochemical data for in-plume and background wells and shows the observed changes in concentration of
these geochemical parameters between source area and in-plume wells at the site.
Case Study for the Use of a Decision Support Tool: Naval Air Station Lemoore, California
5
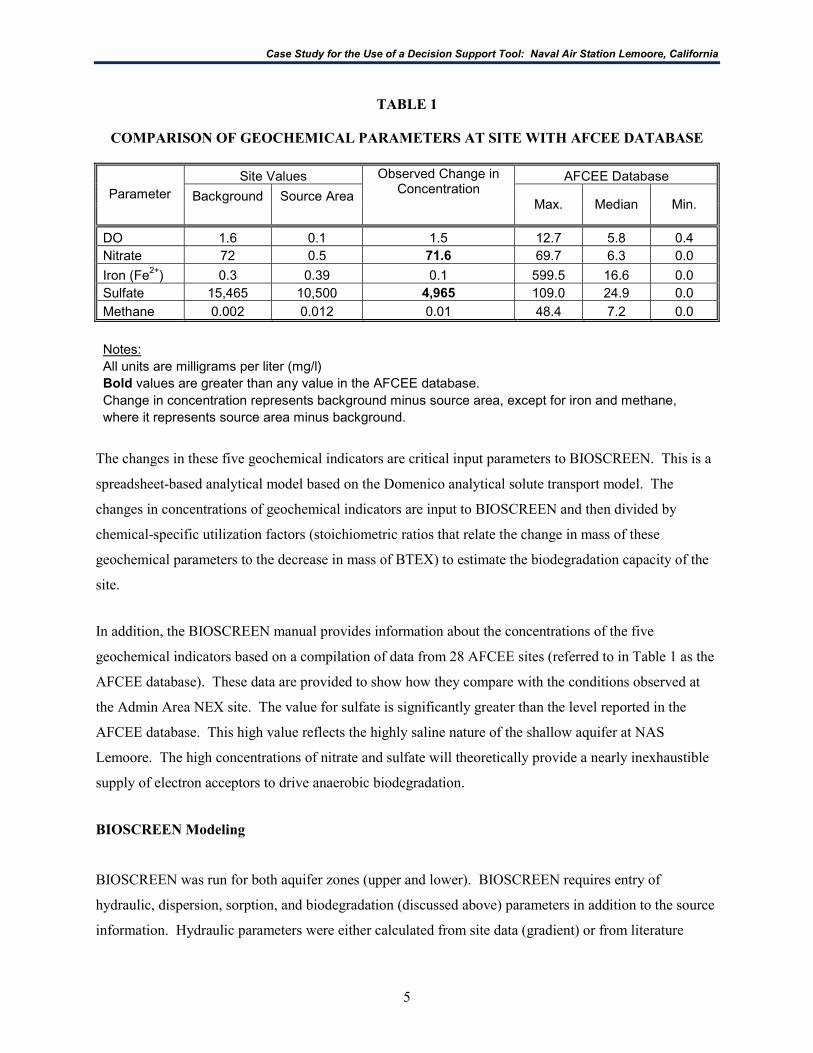
TABLE 1
COMPARISON OF GEOCHEMICAL PARAMETERS AT SITE WITH AFCEE DATABASE
Site Values AFCEE Database
Background Source Area Parameter
Observed Change in Concentration
Max. Median Min.
DO 1.6 0.1 1.5 12.7 5.8 0.4 Nitrate 72 0.5 71.6 69.7 6.3 0.0
Iron (Fe2+) 0.3 0.39 0.1 599.5 16.6 0.0 Sulfate 15,465 10,500 4,965 109.0 24.9 0.0
Methane 0.002 0.012 0.01 48.4 7.2 0.0
Notes: All units are milligrams per liter (mg/l) Bold values are greater than any value in the AFCEE database. Change in concentration represents background minus source area, except for iron and methane, where it represents source area minus background.
The changes in these five geochemical indicators are critical input parameters to BIOSCREEN. This is a
spreadsheet-based analytical model based on the Domenico analytical solute transport model. The
changes in concentrations of geochemical indicators are input to BIOSCREEN and then divided by
chemical-specific utilization factors (stoichiometric ratios that relate the change in mass of these
geochemical parameters to the decrease in mass of BTEX) to estimate the biodegradation capacity of the
site.
In addition, the BIOSCREEN manual provides information about the concentrations of the five
geochemical indicators based on a compilation of data from 28 AFCEE sites (referred to in Table 1 as the
AFCEE database). These data are provided to show how they compare with the conditions observed at
the Admin Area NEX site. The value for sulfate is significantly greater than the level reported in the
AFCEE database. This high value reflects the highly saline nature of the shallow aquifer at NAS
Lemoore. The high concentrations of nitrate and sulfate will theoretically provide a nearly inexhaustible
supply of electron acceptors to drive anaerobic biodegradation.
BIOSCREEN Modeling
BIOSCREEN was run for both aquifer zones (upper and lower). BIOSCREEN requires entry of
hydraulic, dispersion, sorption, and biodegradation (discussed above) parameters in addition to the source
information. Hydraulic parameters were either calculated from site data (gradient) or from literature
Case Study for the Use of a Decision Support Tool: Naval Air Station Lemoore, California
6
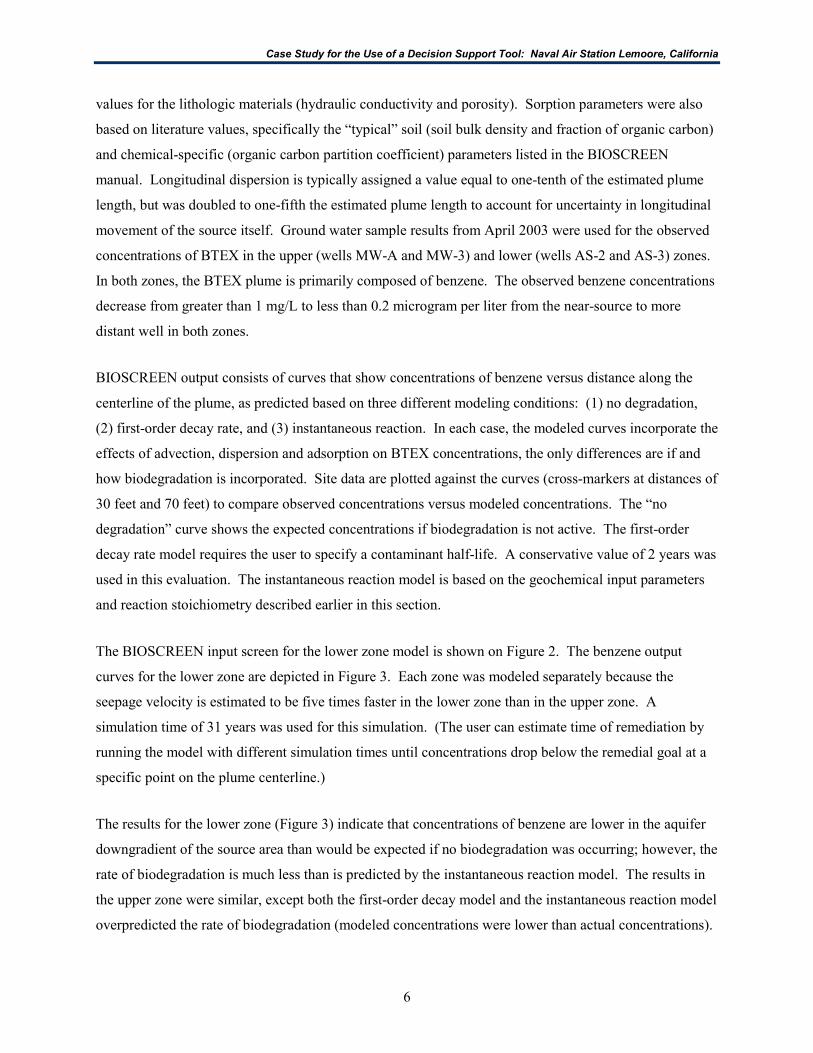
values for the lithologic materials (hydraulic conductivity and porosity). Sorption parameters were also
based on literature values, specifically the “typical” soil (soil bulk density and fraction of organic carbon)
and chemical-specific (organic carbon partition coefficient) parameters listed in the BIOSCREEN
manual. Longitudinal dispersion is typically assigned a value equal to one-tenth of the estimated plume
length, but was doubled to one-fifth the estimated plume length to account for uncertainty in longitudinal
movement of the source itself. Ground water sample results from April 2003 were used for the observed
concentrations of BTEX in the upper (wells MW-A and MW-3) and lower (wells AS-2 and AS-3) zones.
In both zones, the BTEX plume is primarily composed of benzene. The observed benzene concentrations
decrease from greater than 1 mg/L to less than 0.2 microgram per liter from the near-source to more
distant well in both zones.
BIOSCREEN output consists of curves that show concentrations of benzene versus distance along the
centerline of the plume, as predicted based on three different modeling conditions: (1) no degradation,
(2) first-order decay rate, and (3) instantaneous reaction. In each case, the modeled curves incorporate the
effects of advection, dispersion and adsorption on BTEX concentrations, the only differences are if and
how biodegradation is incorporated. Site data are plotted against the curves (cross-markers at distances of
30 feet and 70 feet) to compare observed concentrations versus modeled concentrations. The “no
degradation” curve shows the expected concentrations if biodegradation is not active. The first-order
decay rate model requires the user to specify a contaminant half-life. A conservative value of 2 years was
used in this evaluation. The instantaneous reaction model is based on the geochemical input parameters
and reaction stoichiometry described earlier in this section.
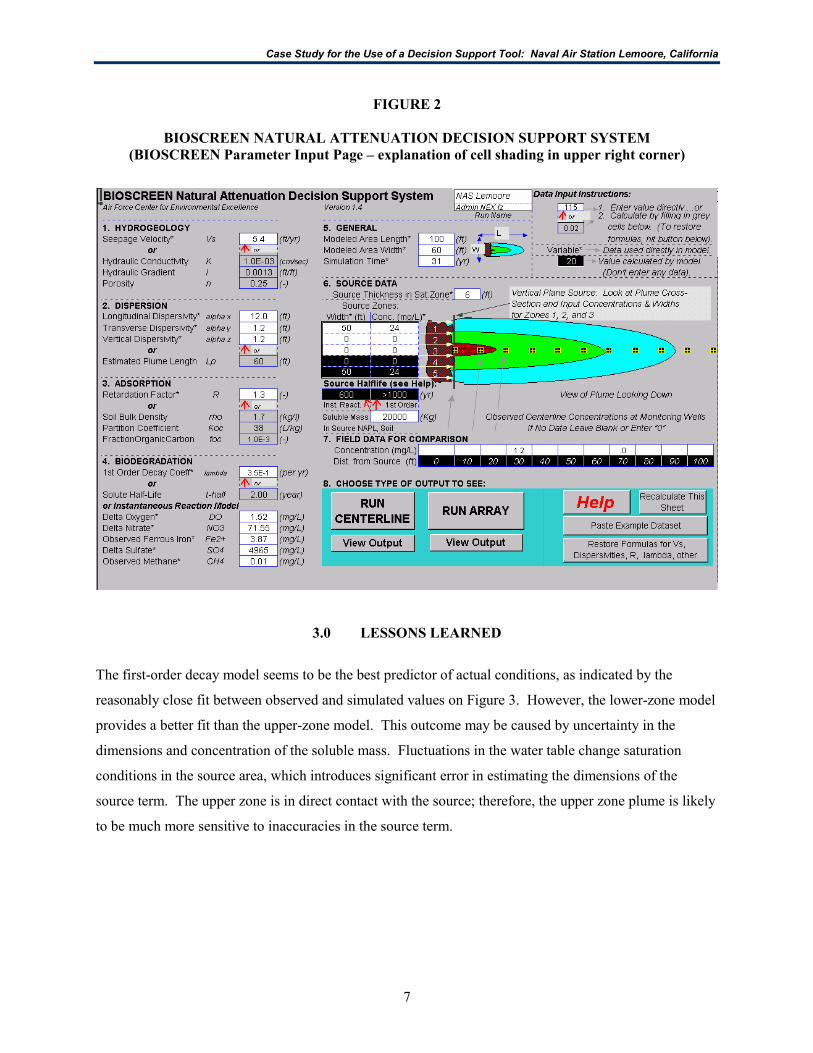
The BIOSCREEN input screen for the lower zone model is shown on Figure 2. The benzene output
curves for the lower zone are depicted in Figure 3. Each zone was modeled separately because the
seepage velocity is estimated to be five times faster in the lower zone than in the upper zone. A
simulation time of 31 years was used for this simulation. (The user can estimate time of remediation by
running the model with different simulation times until concentrations drop below the remedial goal at a
specific point on the plume centerline.)
The results for the lower zone (Figure 3) indicate that concentrations of benzene are lower in the aquifer
downgradient of the source area than would be expected if no biodegradation was occurring; however, the
rate of biodegradation is much less than is predicted by the instantaneous reaction model. The results in
the upper zone were similar, except both the first-order decay model and the instantaneous reaction model
overpredicted the rate of biodegradation (modeled concentrations were lower than actual concentrations).
Case Study for the Use of a Decision Support Tool: Naval Air Station Lemoore, California
7
FIGURE 2
BIOSCREEN NATURAL ATTENUATION DECISION SUPPORT SYSTEM (BIOSCREEN Parameter Input Page – explanation of cell shading in upper right corner)
3.0 LESSONS LEARNED
The first-order decay model seems to be the best predictor of actual conditions, as indicated by the
reasonably close fit between observed and simulated values on Figure 3. However, the lower-zone model
provides a better fit than the upper-zone model. This outcome may be caused by uncertainty in the
dimensions and concentration of the soluble mass. Fluctuations in the water table change saturation
conditions in the source area, which introduces significant error in estimating the dimensions of the
source term. The upper zone is in direct contact with the source; therefore, the upper zone plume is likely
to be much more sensitive to inaccuracies in the source term.
Case Study for the Use of a Decision Support Tool: Naval Air Station Lemoore, California
8
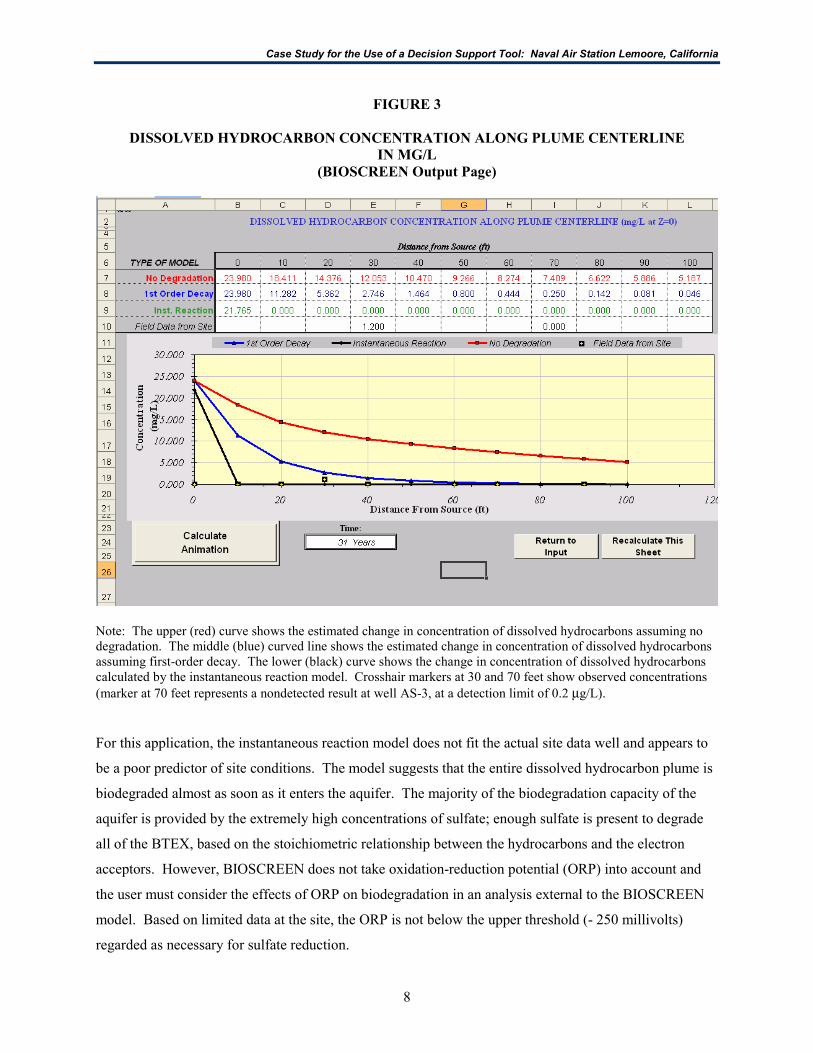
FIGURE 3
DISSOLVED HYDROCARBON CONCENTRATION ALONG PLUME CENTERLINE IN MG/L
(BIOSCREEN Output Page)
Note: The upper (red) curve shows the estimated change in concentration of dissolved hydrocarbons assuming no degradation. The middle (blue) curved line shows the estimated change in concentration of dissolved hydrocarbons assuming first-order decay. The lower (black) curve shows the change in concentration of dissolved hydrocarbons calculated by the instantaneous reaction model. Crosshair markers at 30 and 70 feet show observed concentrations (marker at 70 feet represents a nondetected result at well AS-3, at a detection limit of 0.2 µg/L). For this application, the instantaneous reaction model does not fit the actual site data well and appears to
be a poor predictor of site conditions. The model suggests that the entire dissolved hydrocarbon plume is
biodegraded almost as soon as it enters the aquifer. The majority of the biodegradation capacity of the
aquifer is provided by the extremely high concentrations of sulfate; enough sulfate is present to degrade
all of the BTEX, based on the stoichiometric relationship between the hydrocarbons and the electron
acceptors. However, BIOSCREEN does not take oxidation-reduction potential (ORP) into account and
the user must consider the effects of ORP on biodegradation in an analysis external to the BIOSCREEN
model. Based on limited data at the site, the ORP is not below the upper threshold (- 250 millivolts)
regarded as necessary for sulfate reduction.
Case Study for the Use of a Decision Support Tool: Naval Air Station Lemoore, California
9
BIOSCREEN was used to evaluate whether the dissolved BTEX plume at the Administration area NEX
could be remediated through natural attenuation within a reasonable timeframe. BIOSCREEN can be
used to obtain an estimate of remedial timeframe at any point along the plume centerline by iteratively
running the model with different values of simulation time and noting when the concentration at the point
of compliance is less than the action level. In this case, the remedial timeframe clearly is unreasonable.
Biodegradation of BTEX appears to be occurring, based on the relationship of the “no decay” curve to the
observed data, but the dissolved plume will likely remain for a long period (hundreds to thousands of
years).
The BIOSCREEN input screen (Figure 2) indicates a possible explanation: the half-life of a residual
source of this size may exceed 1,000 years (see the model-calculated source half life on the source data
section of the input screen). The large soluble contaminant mass in the source zone may continue to
bleed dissolved hydrocarbons to the aquifer during periods of high recharge or whenever the water table
rises into the source zone soil. Because of this result, the project team recommended aggressive mass
reduction measures in the corrective action plan (CAP), rather than relying on MNA alone.
4.0 POINTS OF CONTACT Jim Wulff Tetra Tech EM Inc. 950 17th Street, 22nd Floor Denver, CO 80202
(303) 312-8834 [email protected]
Mr. Juris Sinats, Code 052JS Remedial Project Manager Naval Facilities Engineering Command -Southwest Integrated Product Team West 2001 Junipero Serra Blvd., Suite 600 Daly City, CA 94014-1976
(650) 746-7453 [email protected]
5.0 REFERENCES
Air Force Center for Environmental Excellence (AFCEE). 1997. BIOSCREEN Natural Attenuation Decision Support System, Version 1.4. July.
Happel, A.M., E.H. Beckenbach, and R.U. Halden. 1998. An Evaluation of MTBE Impacts to California
Ground Water Resources. Lawrence Livermore National Laboratory (LLNL). UCLR-AR-130897. June 11.
Krazan & Associates, Inc. 1989. Remedial Investigation, Fuel Spill cleanup Report, Navy Exchange Gas
Station, NAS Lemoore, Lemoore, California. March 13. Tetra Tech EM Inc. 2003. “Draft Administration Area NEX Gas Station, Site Investigation Report,
NAS Lemoore, Lemoore, California.” September 12.

Case Study for the Use of a Decision Support Tool: Naval Air Station Lemoore, California
10
U.S. Environmental Protection Agency (EPA). 1997. Use of Monitored Natural Attenuation at Superfund, RCRA Corrective Action, and Underground Storage Tank Sites. Office of Solid Waste and Emergency Response Directive 9200.4-17.