natural gas‐electricity primer - ferc.gov · natural gas storage facilities most of the natural...
TRANSCRIPT
NaturalGas‐ElectricityPrimer
PowerandNaturalGasPlanningTaskForce
August2012
1 August 2012
Acknowledgements
This Primer was developed and reviewed by members of the PNUCC/NWGA Power and Natural Gas Planning Task Force. Several contributed significant time and effort.
Key contributors include:
Randy Friedman, Northwest Natural Gas Teresa Hagins, Williams Pipeline
Jennifer Miller, PNUCC Clay Riding, Puget Sound Energy
Jay Story, Transcanada Gas Transmission NW
Electronic copies of this report are available on the PNUCC Website www.PNUCC.org
101 SW Main Street, Suite 1605 Portland, OR
For further information contact Jennifer Miller, PNUCC at [email protected]
2 August 2012
TableofContents
Background ......................................................................................................................... 3
Gas-Fired Electric Generation ............................................................................................ 4
Existing Natural Gas Generation ................................................................................ 5
Future Power Supply........................................................................................................... 6
Natural Gas Pipelines .......................................................................................................... 7
Map of NW Pipelines, Storage, Delivery Hubs .............................................................. 7
Williams Northwest Pipeline .......................................................................................... 7
TransCanada Gas Transmission Northwest .................................................................... 8
Ruby ................................................................................................................................ 8
Spectra BC Pipeline ........................................................................................................ 8
Northwest Market Access Expansion/Palomar Project .................................................. 8
Northwest Pipeline Washington Expansion Project ....................................................... 9
Natural Gas Storage Facilities ............................................................................................ 9
Jackson Prairie ................................................................................................................ 9
Mist ................................................................................................................................. 9
Liquefied Natural Gas ................................................................................................... 10
Other Storage Technologies .......................................................................................... 10
Natural Gas Use ................................................................................................................ 10
Residential..................................................................................................................... 11
Commercial ................................................................................................................... 11
Industrial ....................................................................................................................... 11
Power Generation .......................................................................................................... 11
Operational Challenges ..................................................................................................... 11
Scheduling Practices ..................................................................................................... 11
Physical Characteristics ................................................................................................ 12
Markets ......................................................................................................................... 12
Supply/Demand Balance ................................................................................................... 13
Peak Day – I-5 Corridor ................................................................................................ 13
Terms and Conversion Factors ......................................................................................... 14
3 August 2012
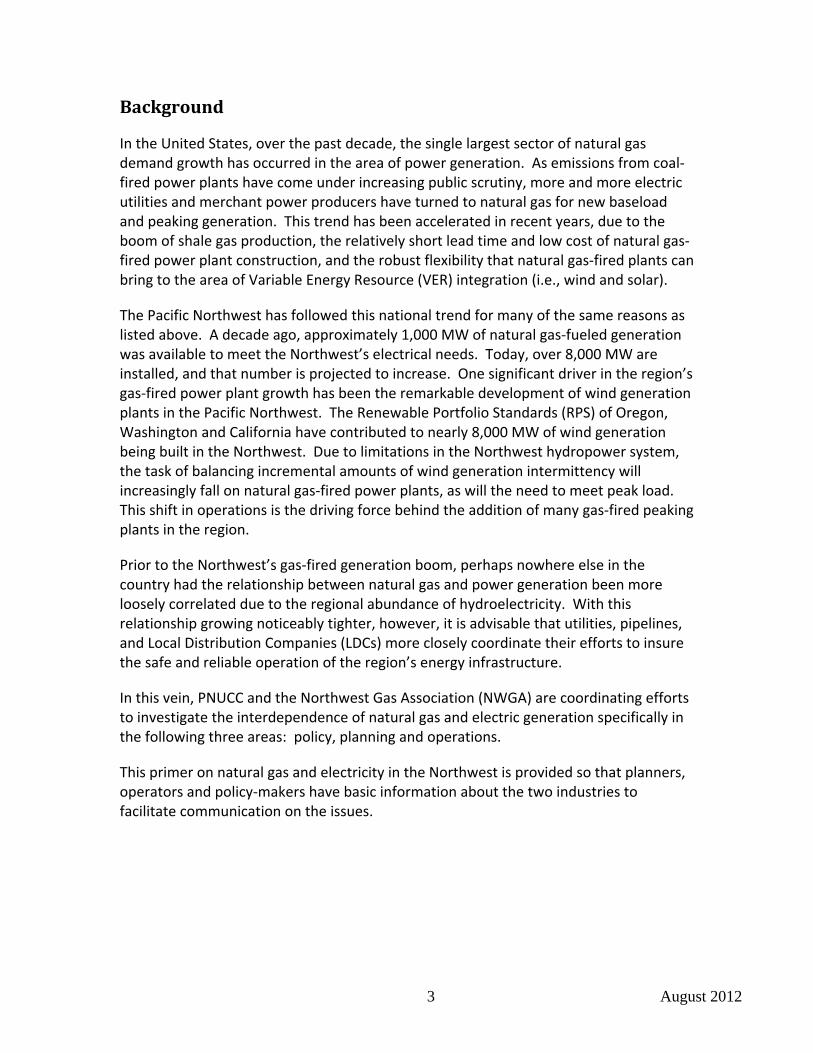
Background
In the United States, over the past decade, the single largest sector of natural gas demand growth has occurred in the area of power generation. As emissions from coal‐fired power plants have come under increasing public scrutiny, more and more electric utilities and merchant power producers have turned to natural gas for new baseload and peaking generation. This trend has been accelerated in recent years, due to the boom of shale gas production, the relatively short lead time and low cost of natural gas‐fired power plant construction, and the robust flexibility that natural gas‐fired plants can bring to the area of Variable Energy Resource (VER) integration (i.e., wind and solar).
The Pacific Northwest has followed this national trend for many of the same reasons as listed above. A decade ago, approximately 1,000 MW of natural gas‐fueled generation was available to meet the Northwest’s electrical needs. Today, over 8,000 MW are installed, and that number is projected to increase. One significant driver in the region’s gas‐fired power plant growth has been the remarkable development of wind generation plants in the Pacific Northwest. The Renewable Portfolio Standards (RPS) of Oregon, Washington and California have contributed to nearly 8,000 MW of wind generation being built in the Northwest. Due to limitations in the Northwest hydropower system, the task of balancing incremental amounts of wind generation intermittency will increasingly fall on natural gas‐fired power plants, as will the need to meet peak load. This shift in operations is the driving force behind the addition of many gas‐fired peaking plants in the region.
Prior to the Northwest’s gas‐fired generation boom, perhaps nowhere else in the country had the relationship between natural gas and power generation been more loosely correlated due to the regional abundance of hydroelectricity. With this relationship growing noticeably tighter, however, it is advisable that utilities, pipelines, and Local Distribution Companies (LDCs) more closely coordinate their efforts to insure the safe and reliable operation of the region’s energy infrastructure.
In this vein, PNUCC and the Northwest Gas Association (NWGA) are coordinating efforts to investigate the interdependence of natural gas and electric generation specifically in the following three areas: policy, planning and operations.
This primer on natural gas and electricity in the Northwest is provided so that planners, operators and policy‐makers have basic information about the two industries to facilitate communication on the issues.
4 August 2012
Gas‐FiredElectricGeneration
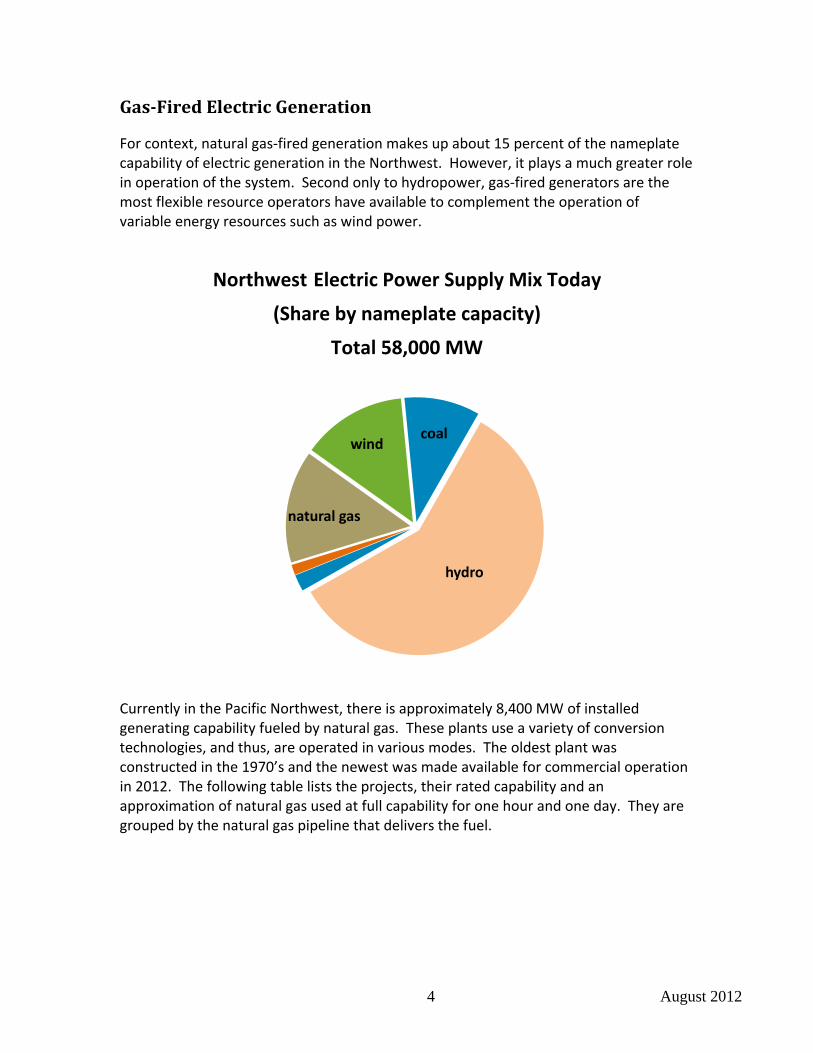
For context, natural gas‐fired generation makes up about 15 percent of the nameplate capability of electric generation in the Northwest. However, it plays a much greater role in operation of the system. Second only to hydropower, gas‐fired generators are the most flexible resource operators have available to complement the operation of variable energy resources such as wind power.
Northwest Electric Power Supply Mix Today
(Share by nameplate capacity)
Total 58,000 MW
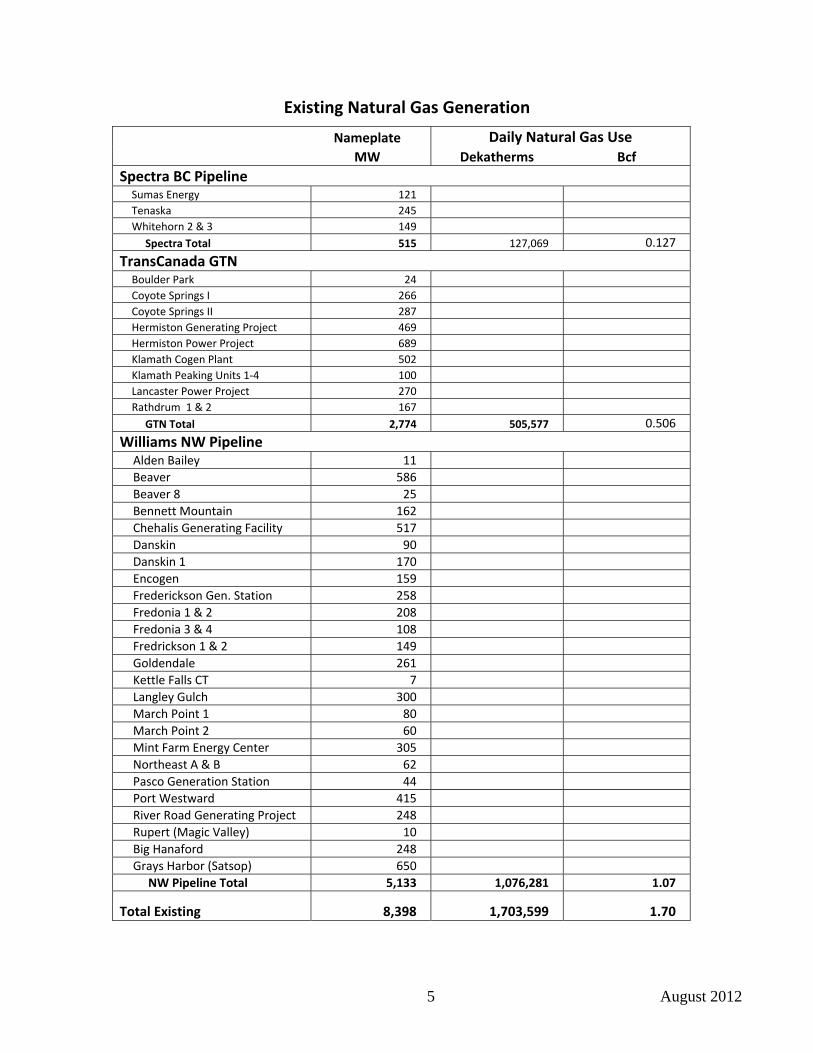
Currently in the Pacific Northwest, there is approximately 8,400 MW of installed generating capability fueled by natural gas. These plants use a variety of conversion technologies, and thus, are operated in various modes. The oldest plant was constructed in the 1970’s and the newest was made available for commercial operation in 2012. The following table lists the projects, their rated capability and an approximation of natural gas used at full capability for one hour and one day. They are grouped by the natural gas pipeline that delivers the fuel.
natural gas
windcoal
hydro
5 August 2012
Existing Natural Gas Generation
Nameplate Daily Natural Gas Use MW Dekatherms Bcf
Spectra BC Pipeline Sumas Energy 121
Tenaska 245
Whitehorn 2 & 3 149
Spectra Total 515 127,069 0.127
TransCanada GTN Boulder Park 24
Coyote Springs I 266
Coyote Springs II 287
Hermiston Generating Project 469
Hermiston Power Project 689
Klamath Cogen Plant 502
Klamath Peaking Units 1‐4 100
Lancaster Power Project 270
Rathdrum 1 & 2 167
GTN Total 2,774 505,577 0.506
Williams NW Pipeline
Alden Bailey 11
Beaver 586
Beaver 8 25
Bennett Mountain 162
Chehalis Generating Facility 517
Danskin 90
Danskin 1 170
Encogen 159
Frederickson Gen. Station 258
Fredonia 1 & 2 208
Fredonia 3 & 4 108
Fredrickson 1 & 2 149
Goldendale 261
Kettle Falls CT 7
Langley Gulch 300
March Point 1 80
March Point 2 60
Mint Farm Energy Center 305
Northeast A & B 62
Pasco Generation Station 44
Port Westward 415
River Road Generating Project 248
Rupert (Magic Valley) 10
Big Hanaford 248
Grays Harbor (Satsop) 650
NW Pipeline Total 5,133 1,076,281 1.07
Total Existing 8,398 1,703,599 1.70
6 August 2012
FuturePowerSupply
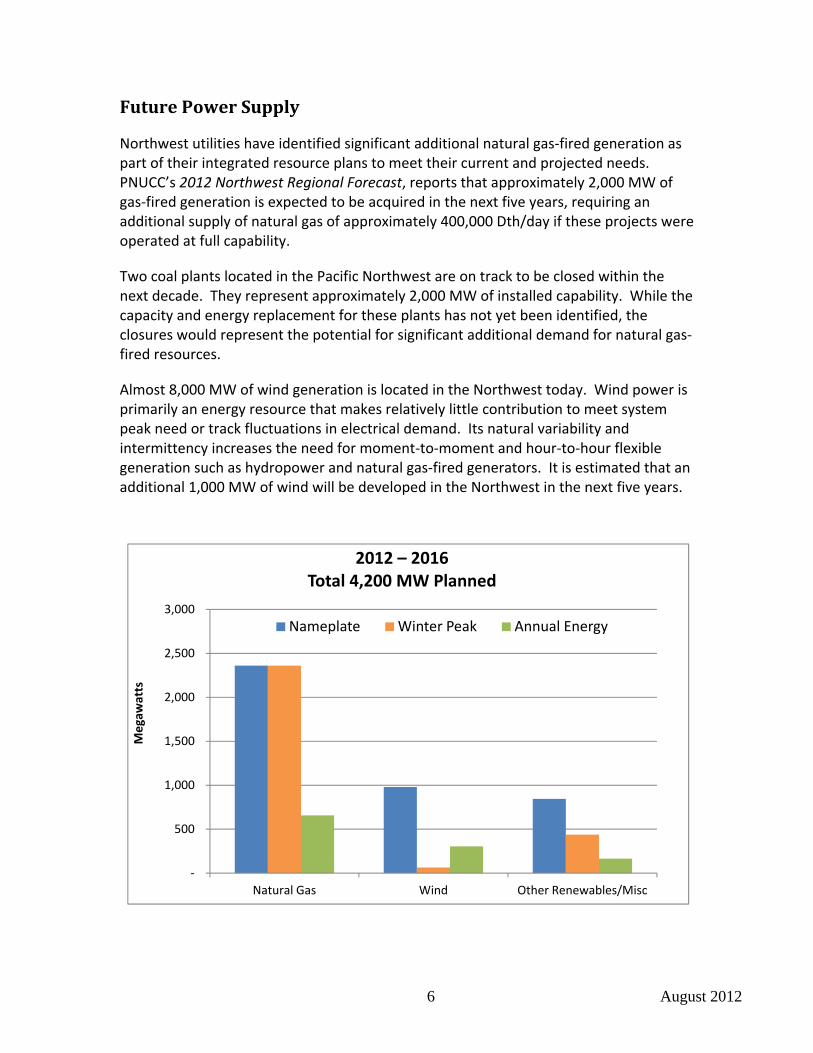
Northwest utilities have identified significant additional natural gas‐fired generation as part of their integrated resource plans to meet their current and projected needs. PNUCC’s 2012 Northwest Regional Forecast, reports that approximately 2,000 MW of gas‐fired generation is expected to be acquired in the next five years, requiring an additional supply of natural gas of approximately 400,000 Dth/day if these projects were operated at full capability.
Two coal plants located in the Pacific Northwest are on track to be closed within the next decade. They represent approximately 2,000 MW of installed capability. While the capacity and energy replacement for these plants has not yet been identified, the closures would represent the potential for significant additional demand for natural gas‐fired resources.
Almost 8,000 MW of wind generation is located in the Northwest today. Wind power is primarily an energy resource that makes relatively little contribution to meet system peak need or track fluctuations in electrical demand. Its natural variability and intermittency increases the need for moment‐to‐moment and hour‐to‐hour flexible generation such as hydropower and natural gas‐fired generators. It is estimated that an additional 1,000 MW of wind will be developed in the Northwest in the next five years.
‐
500
1,000
1,500
2,000
2,500
3,000
Natural Gas Wind Other Renewables/Misc
Megawatts
2012 – 2016Total 4,200 MW Planned
Nameplate Winter Peak Annual Energy
7 August 2012
NaturalGasPipelines
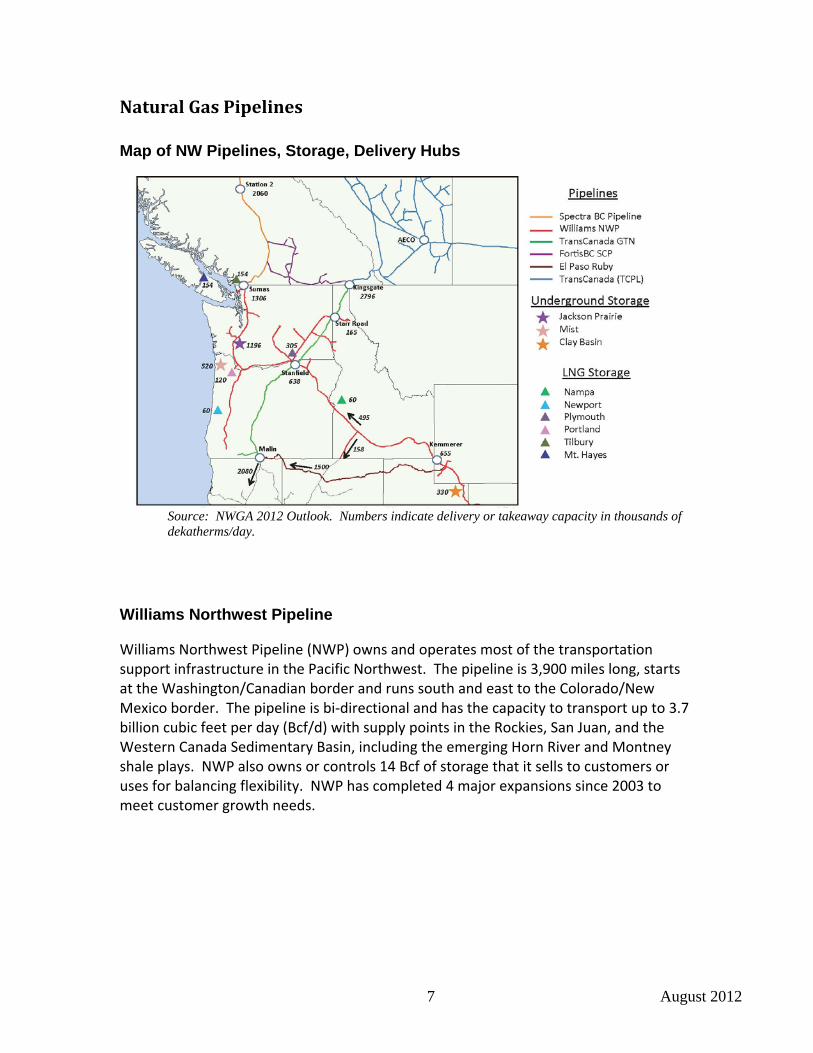
Map of NW Pipelines, Storage, Delivery Hubs
Source: NWGA 2012 Outlook. Numbers indicate delivery or takeaway capacity in thousands of dekatherms/day.
Williams Northwest Pipeline
Williams Northwest Pipeline (NWP) owns and operates most of the transportation support infrastructure in the Pacific Northwest. The pipeline is 3,900 miles long, starts at the Washington/Canadian border and runs south and east to the Colorado/New Mexico border. The pipeline is bi‐directional and has the capacity to transport up to 3.7 billion cubic feet per day (Bcf/d) with supply points in the Rockies, San Juan, and the Western Canada Sedimentary Basin, including the emerging Horn River and Montney shale plays. NWP also owns or controls 14 Bcf of storage that it sells to customers or uses for balancing flexibility. NWP has completed 4 major expansions since 2003 to meet customer growth needs.
8 August 2012
TransCanada Gas Transmission Northwest
Gas Transmission Northwest Corporation (GTN) owns and operates 1,351 miles of pipeline that begins at the British Columbia‐Idaho border, extends through northern Idaho, southeastern Washington and central Oregon, and ends at the Oregon‐California border. GTN’s pipeline can transport more than 2.9 Bcf of gas a day. More than 2.1 Bcf/d can be delivered to California, and up to 1 Bcf/d to the Pacific Northwest (though typical deliveries there are 600 – 700 million cubic feet per day (Mcf/d) available). Western Canada is the primary gas source with primary system flow being in a north to south direction, but GTN also receives U.S. domestic gas supplies at Stanfield and Malin, OR. With the interconnection of the Ruby Pipeline in 2011, and minor facility changes, the GTN system now has the ability to provide firm, south to north transportation service.
Ruby
Ruby is a new (2011) 680 mile, 42‐inch natural gas pipeline beginning at the Opal Hub in Wyoming and terminating near Malin, Oregon, interconnecting with GTN and Pacific Gas & Electric. Ruby has an initial capacity of up to 1.5 billion cubic feet per day (Bcf/d) and traverses portions of four states: Wyoming, Utah, Nevada, and Oregon. The project utilizes four compressor stations: one near the Opal Hub in southwestern Wyoming; one south of Curlew Junction, Utah; one at the mid‐point of the project, north of Elko, Nevada; and one in northwestern Nevada.
Spectra BC Pipeline
Spectra BC Pipeline is 1,700 miles of natural gas transmission pipeline which starts at the British Columbia/Alberta border, and runs to the southern‐most point at the British Columbia/U.S. border at Huntington/Sumas. The pipeline has the capacity to transport 2.4 Bcf/d and is fully regulated by Canada’s National Energy Board.
Northwest Market Access Expansion/Palomar Project
Palomar was conceived as a new cross‐Cascades pipeline linking the GTN system in central Oregon with NWP and Northwest Natural Gas (NW Natural) systems near Molalla, Oregon. Construction of Palomar has been proposed in conjunction with an expansion of the existing NWP System, the Northwest Market Access Expansion would combine an expansion on NWP System in the I‐5 Corridor with available capacity on the GTN system and proposed Palomar pipeline to provide incremental firm transportation service from the Stanfield hub to markets in western Washington and Oregon.
9 August 2012
Northwest Pipeline Washington Expansion Project
Northwest Pipeline is developing an expansion of its mainline system in Washington to create incremental firm transportation service from it’s interconnect with Spectra’s BC pipeline at Sumas to markets in the Washington I‐5 Corridor. The anchor customer for the project is Oregon LNG (OLNG). They are developing a proposed LNG export terminal in Warrenton, Oregon. The initial design of the project is for 750 MDth/d, but it may be increased as additional markets commit to the project. The project is targeting service by 2017‐2018 to meet OLNG’s needs, but it could be phased in as early as fall of 2016 to meet other market needs.
NaturalGasStorageFacilities
Most of the natural gas consumed by the Pacific Northwest moves straight to consumers through pipelines, gas mains, and other utility infrastructure. A portion however, is delivered through underground storage reservoirs, primarily during the winter months. Storage facilities play an important role in ensuring cost‐effective, reliable service for consumers during wintertime peaks in natural gas demand, and in balancing fluctuating demand throughout the year.
Jackson Prairie
Jackson Prairie is the Pacific Northwest’s largest natural‐gas storage facility. The 3,200‐acre, underground reservoir located in Lewis County, WA is operated by Puget Sound Energy and is jointly owned by Northwest Pipeline, Puget Sound Energy and Avista Corp. Jackson Prairie is an aquifer‐driven storage reservoir; natural gas storage capacity is created by pumping out the water found and replacing it with natural gas. The facility has 25 Bcf of working gas capacity and is capable of delivering 1.15 Bcf of natural gas per day.
Mist
The first commercial quantities of natural gas in the Pacific Northwest were discovered in 1979 near Mist, Oregon, about 60 miles northwest of Portland. As the native natural gas is extracted from its various reservoirs, they are converted for use as underground storage. (FYI, most of the 400‐ plus underground storage facilities in the U.S. were developed in this manner.) The Mist underground gas storage facility currently has 16 Bcf of working gas storage capacity and delivery capability of 520,000 Dth/day.
10 August 2012
Liquefied Natural Gas
There are six existing Liquefied Natural Gas (LNG) plants in Oregon, Washington, Idaho and British Columbia, with five of the six constructed in the period from the late 1960s to the late 1980s. Two are owned and operated by NW Natural, two by FortisBC, one by NWP and one by Intermountain Gas. Not to be confused with LNG import or export terminals proposed for the Northwest, these plants are similar to the 100 or so LNG peak‐shaving plants in existence across the country. They have the equipment to make LNG from natural gas available during the off‐peak months, store the liquid in above‐ground tanks and re‐vaporize the liquefied natural gas when needed for peak cold weather or such other events that require a rapid supply of natural gas for a short duration. The typical LNG plant takes 6 months or more to fill but can be emptied in roughly a week. This makes them ideal for the short duration “Siberian Express” type cold episodes that, while infrequent in the Pacific Northwest, cause dramatic surges in heating demand when they occur. Because of the refill time and cost, LNG is not typically used for load balancing or other system requirements during normal weather. Their high vaporization rates, however, can make them quite cost‐effective as peak day resources.
Other Storage Technologies
Satellite LNG consists of one or more storage tanks combined with vaporization equipment, but must be filled and refilled from a plant that makes LNG. Typically these facilities are quite small and are used to supply niche markets where construction or reinforcement of a pipeline network is not cost‐effective.
Compressed natural gas (CNG) storage is basically just larger or bundled versions of the same tanks found on CNG vehicles. The natural gas that can be stored in a CNG trailer is quite limited. They are only used to supply gas for small projects such as pipeline maintenance or an outage affecting a neighborhood.
Propane, when mixed with air, can be injected into the natural gas under certain conditions. While some use of propane/air storage can be found in the Pacific Northwest, it is not prevalent and does not appear in many resource plans as new peaking resources.
NaturalGasUse
Northwest regional natural gas consumption is expected to grow over the next ten years by an average of only 0.9 percent per year according to the NWGA 2012 Gas Outlook, as a result of the weak economic conditions that continue to linger and affect projections for the demand of natural gas across every sector.
11 August 2012
Residential
A modest but steady growth is anticipated in the residential sector as the economy slowly recovers. New housing construction remains sluggish at 1.1 percent average annual growth combined with less natural gas use as consumers install more efficient appliances, weatherize their homes or simply turn down the thermostat.
Commercial
NWGA projects a 1.0 percent average annual growth in the commercial sector citing the economy. The assumption reflects that commercial consumption will continue to slow down and large commercial and industrial consumers will remain cautious about adding additional facilities.
Industrial
In the course of the 2008‐09 recession, the region lost almost 15 percent of its industrial natural gas load. NWGA projects a 0.6 percent average annual growth in industrial gas demand going forward. The Outlook projects some growth in the 2012‐14 timeframe citing a recovering economy and return to pre‐recession production levels.
Power Generation
Natural gas‐fired electrical generation claimed more than 25 percent of the annual gas demand in 2010. That number is expected to increase as the majority of demand growth is anticipated to come from new gas‐fired power plants over the next 20 years, as additional natural gas‐fired generators replace base‐load coal‐fired generators and as they increasingly are operated to firm‐up variable energy resources.
OperationalChallenges
Northwest electric utilities are expecting that their demand for gas to produce power will continue to grow in the form of base‐load units and peaking units to firm up variable energy resources (e.g., wind). To meet this intermittency, power producers are also counting on being able to draw upon large amounts of natural gas on an intra‐day basis. There are a number of operational challenges facing natural gas‐fired generators as they turn to natural gas to meet intra‐day generation needs.
Scheduling Practices
There are two differences in scheduling practices between natural gas and electric industries: First, the days don’t’ line up. For example, A “gas trading day” is defined nationally as 9:00 a.m. to 9:00 a.m. Central clock time, (8:00 a.m. Mountain time and
12 August 2012
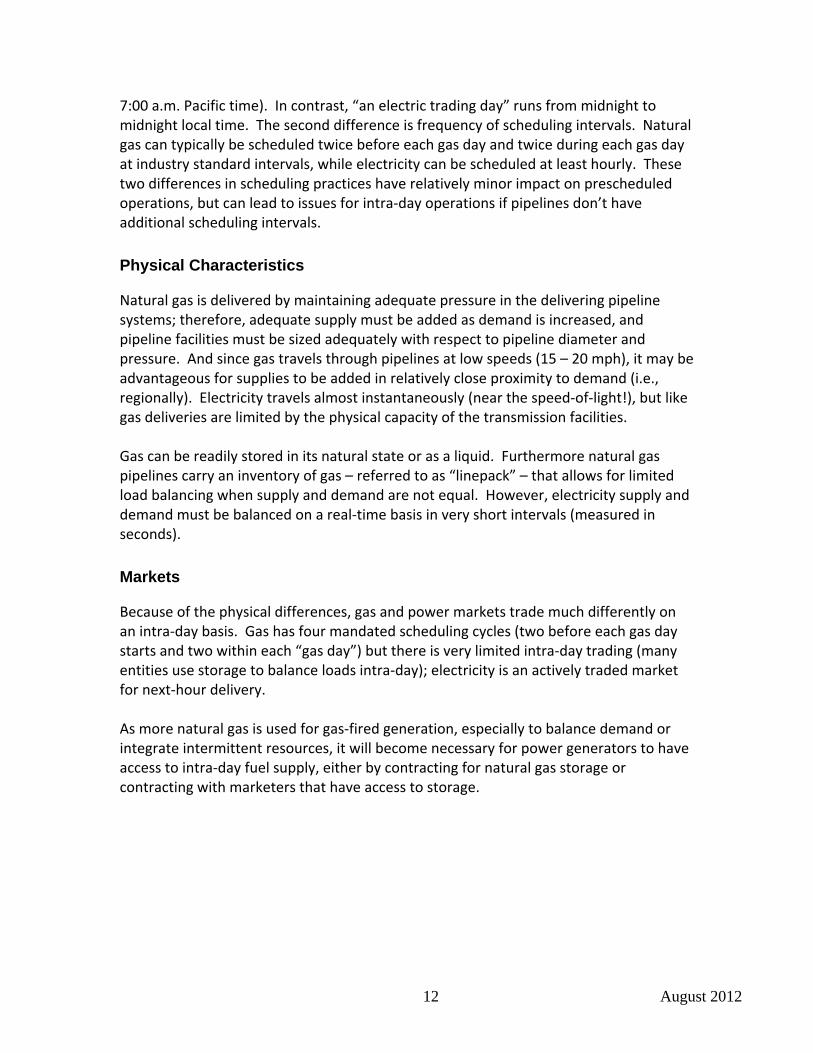
7:00 a.m. Pacific time). In contrast, “an electric trading day” runs from midnight to midnight local time. The second difference is frequency of scheduling intervals. Natural gas can typically be scheduled twice before each gas day and twice during each gas day at industry standard intervals, while electricity can be scheduled at least hourly. These two differences in scheduling practices have relatively minor impact on prescheduled operations, but can lead to issues for intra‐day operations if pipelines don’t have additional scheduling intervals.
Physical Characteristics
Natural gas is delivered by maintaining adequate pressure in the delivering pipeline systems; therefore, adequate supply must be added as demand is increased, and pipeline facilities must be sized adequately with respect to pipeline diameter and pressure. And since gas travels through pipelines at low speeds (15 – 20 mph), it may be advantageous for supplies to be added in relatively close proximity to demand (i.e., regionally). Electricity travels almost instantaneously (near the speed‐of‐light!), but like gas deliveries are limited by the physical capacity of the transmission facilities. Gas can be readily stored in its natural state or as a liquid. Furthermore natural gas pipelines carry an inventory of gas – referred to as “linepack” – that allows for limited load balancing when supply and demand are not equal. However, electricity supply and demand must be balanced on a real‐time basis in very short intervals (measured in seconds).
Markets
Because of the physical differences, gas and power markets trade much differently on an intra‐day basis. Gas has four mandated scheduling cycles (two before each gas day starts and two within each “gas day”) but there is very limited intra‐day trading (many entities use storage to balance loads intra‐day); electricity is an actively traded market for next‐hour delivery. As more natural gas is used for gas‐fired generation, especially to balance demand or integrate intermittent resources, it will become necessary for power generators to have access to intra‐day fuel supply, either by contracting for natural gas storage or contracting with marketers that have access to storage.
13 August 2012
Supply/DemandBalance
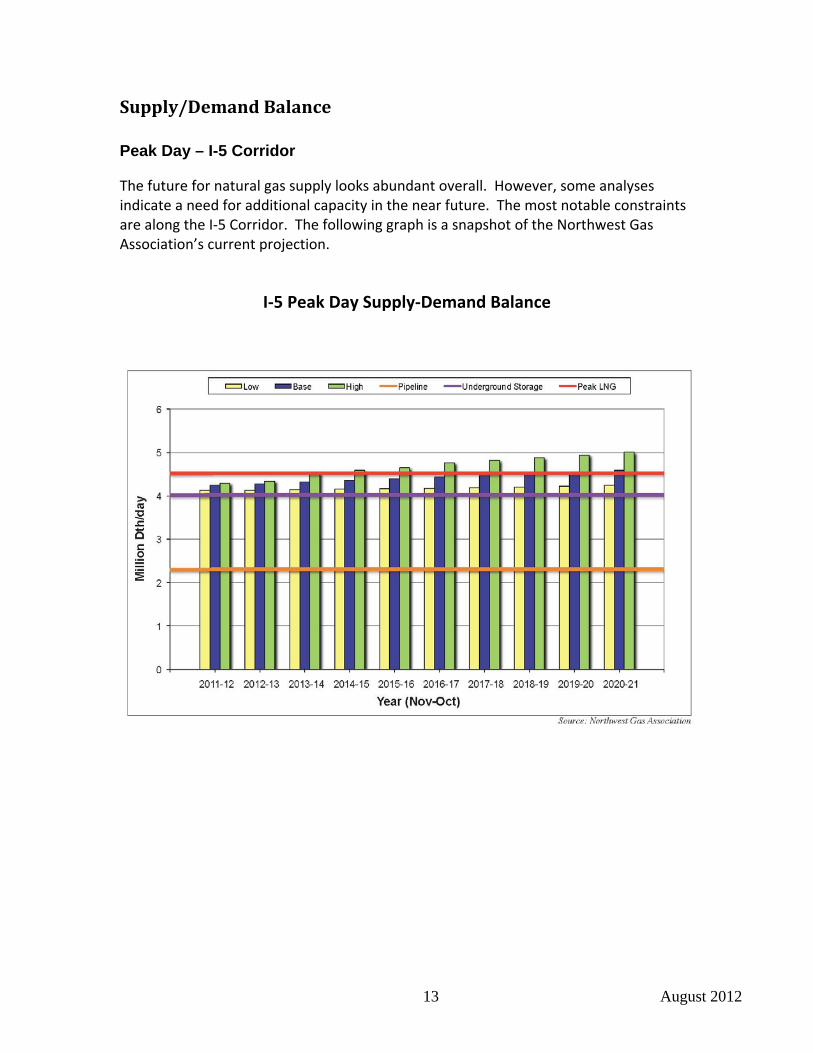
Peak Day – I-5 Corridor
The future for natural gas supply looks abundant overall. However, some analyses indicate a need for additional capacity in the near future. The most notable constraints are along the I‐5 Corridor. The following graph is a snapshot of the Northwest Gas Association’s current projection.
I‐5 Peak Day Supply‐Demand Balance
14 August 2012
TermsandConversionFactors
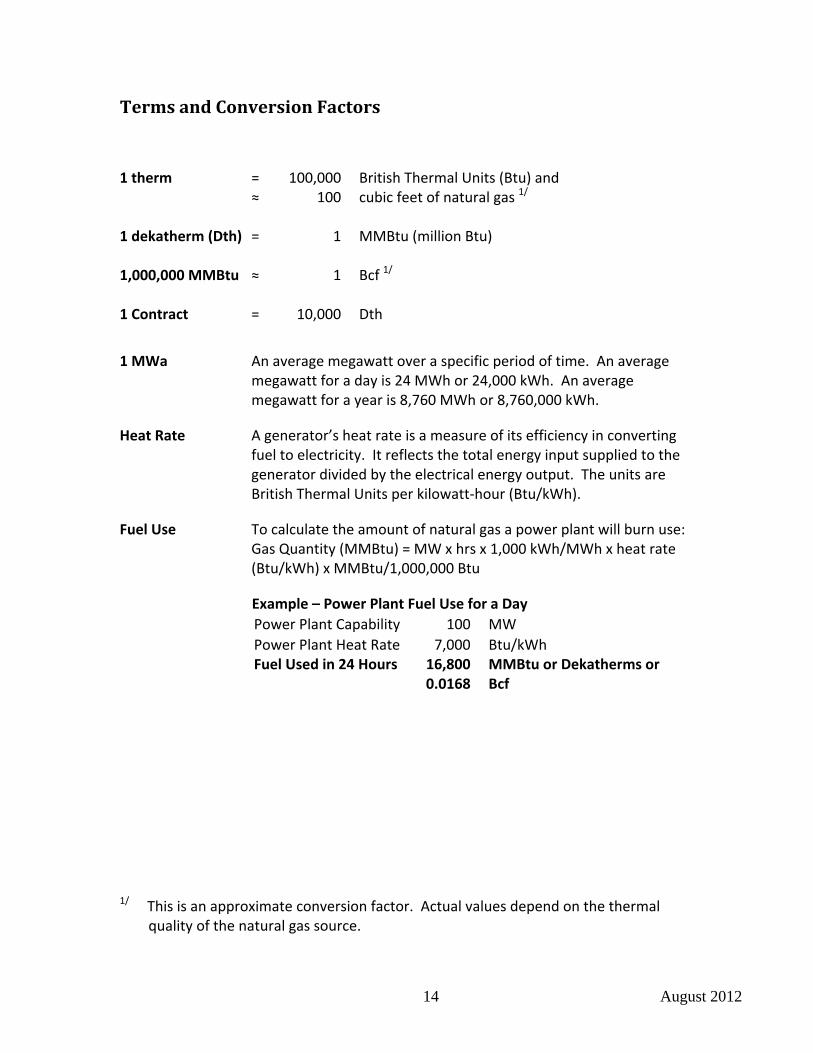
1 therm = 100,000 British Thermal Units (Btu) and ≈ 100 cubic feet of natural gas 1/
1 dekatherm (Dth) = 1 MMBtu (million Btu)
1,000,000 MMBtu ≈ 1 Bcf 1/ 1 Contract = 10,000 Dth
1 MWa An average megawatt over a specific period of time. An average megawatt for a day is 24 MWh or 24,000 kWh. An average megawatt for a year is 8,760 MWh or 8,760,000 kWh.
Heat Rate A generator’s heat rate is a measure of its efficiency in converting fuel to electricity. It reflects the total energy input supplied to the generator divided by the electrical energy output. The units are British Thermal Units per kilowatt‐hour (Btu/kWh).
Fuel Use To calculate the amount of natural gas a power plant will burn use: Gas Quantity (MMBtu) = MW x hrs x 1,000 kWh/MWh x heat rate (Btu/kWh) x MMBtu/1,000,000 Btu
Example – Power Plant Fuel Use for a Day
Power Plant Capability 100 MW
Power Plant Heat Rate 7,000 Btu/kWh Fuel Used in 24 Hours 16,800 MMBtu or Dekatherms or 0.0168 Bcf
1/ This is an approximate conversion factor. Actual values depend on the thermal
quality of the natural gas source.