nationwide survey of wildlife in costa rican … university of costa rica presented to ......
TRANSCRIPT
"Wildlife in Costa Rican households - a nationwide survey"
A pictorial report
by
Carlos Drews, Ph.D.1
Regional Wildlife Management Program National University of Costa Rica
Presented to Humane Society International
Washington, D.C.
December 1999
1
AT
Citation of this document: Drews, C. 1999. Wildlife in Costa Rican households - a nationwide survey. Technical report, Humane Society International, Washington, D.C. pp. 78.
Regional Wildlife Management Program, National University of Costa Rica partado 1350 – 3000 Heredia, Costa Rica el. +506-2773600 or 2377039, Fax +506-2377036, E-mail: [email protected]
2
Contents Page
- Introduction 3 - Methods 4 - Results 7 1. Incidence and species 7 2. Reasons for keeping and not keeping wildlife 14 3. Care and captivity conditions of the animal 20 4. Variables associated with households that keep wildlife 27 5. Attitude toward keeping wildlife as pets 34 6. Attribution of feelings to animals 41 7. Perception about the experience of keeping wildlife at home 47 8. Knowledge of the law and legal status of the animals 51 9. Assignment of care duties among family members 55 10. Acquisition process 59 11. Demand for wild animals and their fate 65
- Conclusions 75 - Acknowledgements 76 - List of figures 77
3
Introduction
One manifestation of the relationship between society and wildlife is the keeping of animals at home. The motivations behind this practice may vary greatly between individuals and between cultures. But the consequence of keeping wildlife as pet is in most cases the same: the wellbeing of the animals is compromised. In contrast to domestic species, the movement and general behavior of wild animals need to be severely restrained in order to make its coexistence with people in a home environment possible. Concern for the wellbeing of the animals and the potential impact of a pet market on natural populations urge for a better understanding of wildlife keeping habits.
This report summarizes the main results of a nationwide survey about the keeping of wildlife in households, carried out in Costa Rica in 1999. The data presented are pertinent to the design and targeting of information in awareness initiatives that arise from humanitarian and conservation concerns. The results provide the platform for calculations of the magnitude of the national pet trade and an estimation of its potential impact on wild populations of these animals. This study seeks both to characterize the practice of keeping wild animals at home and to elucidate the reasons and social correlates of this habit. The report includes information such as incidence of wildlife in Costa Rican households, species involved and their fate, captivity conditions, acquisition process, reasons for keeping and not keeping wildlife, knowledge about the relevant laws, and perception of the cognitive abilities of animals2. Domestic animals are referred to marginally in this report.
Data are shown graphically, with a brief comment of each result in a legend. Codes in the figures are not dependent on colors. The color plates can thus be reproduced in black & white without loosing information.
2 The results of a research module about the attitudes of Costa Ricans toward wildlife are omitted here.

4
Methods
Overview
Coverage: nationwide Sample size: 1021 households, 1021
adults, 177 minors Sampling error at alpha=0.05:
3.1% for n=1021 7.4% for n=177
Data collection: personal interviews Sampling period: 16. March-6.May 1999 Sample composition:
48.8% male and 51.2% female adults, 47.8% urban and 52.2% rural settings
Rejection rate: less than 15%
5
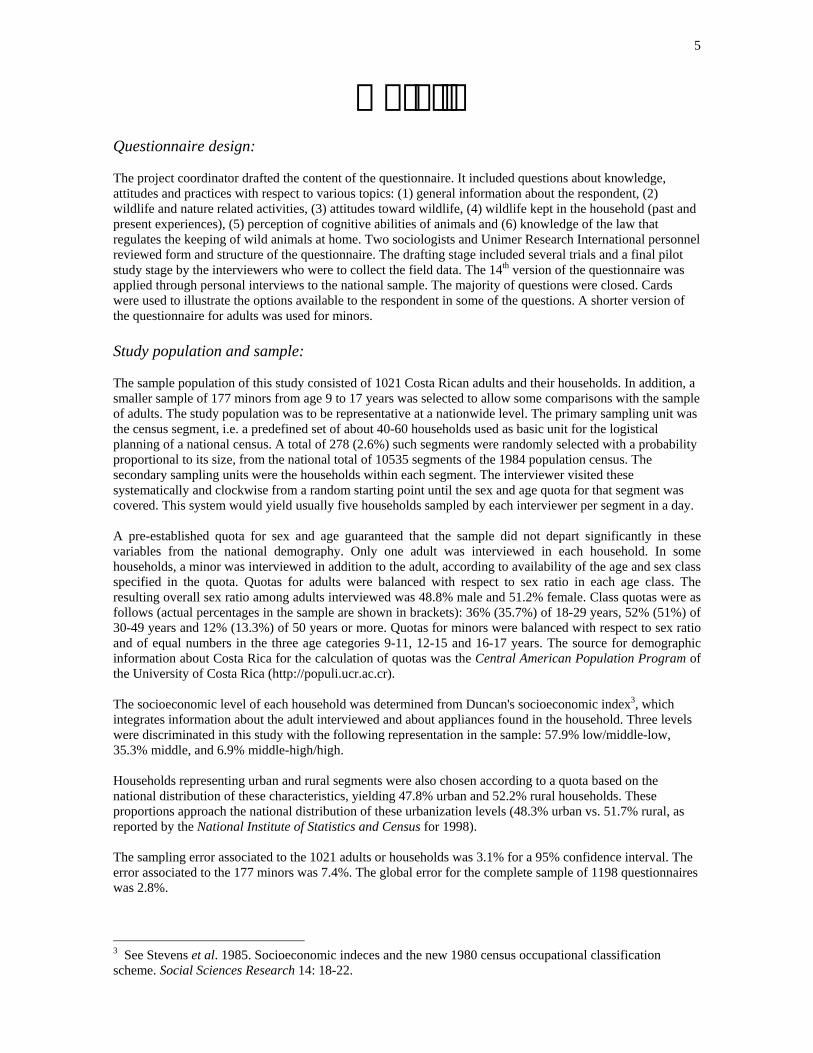
Details Questionnaire design: The project coordinator drafted the content of the questionnaire. It included questions about knowledge, attitudes and practices with respect to various topics: (1) general information about the respondent, (2) wildlife and nature related activities, (3) attitudes toward wildlife, (4) wildlife kept in the household (past and present experiences), (5) perception of cognitive abilities of animals and (6) knowledge of the law that regulates the keeping of wild animals at home. Two sociologists and Unimer Research International personnel reviewed form and structure of the questionnaire. The drafting stage included several trials and a final pilot study stage by the interviewers who were to collect the field data. The 14th version of the questionnaire was applied through personal interviews to the national sample. The majority of questions were closed. Cards were used to illustrate the options available to the respondent in some of the questions. A shorter version of the questionnaire for adults was used for minors. Study population and sample: The sample population of this study consisted of 1021 Costa Rican adults and their households. In addition, a smaller sample of 177 minors from age 9 to 17 years was selected to allow some comparisons with the sample of adults. The study population was to be representative at a nationwide level. The primary sampling unit was the census segment, i.e. a predefined set of about 40-60 households used as basic unit for the logistical planning of a national census. A total of 278 (2.6%) such segments were randomly selected with a probability proportional to its size, from the national total of 10535 segments of the 1984 population census. The secondary sampling units were the households within each segment. The interviewer visited these systematically and clockwise from a random starting point until the sex and age quota for that segment was covered. This system would yield usually five households sampled by each interviewer per segment in a day. A pre-established quota for sex and age guaranteed that the sample did not depart significantly in these variables from the national demography. Only one adult was interviewed in each household. In some households, a minor was interviewed in addition to the adult, according to availability of the age and sex class specified in the quota. Quotas for adults were balanced with respect to sex ratio in each age class. The resulting overall sex ratio among adults interviewed was 48.8% male and 51.2% female. Class quotas were as follows (actual percentages in the sample are shown in brackets): 36% (35.7%) of 18-29 years, 52% (51%) of 30-49 years and 12% (13.3%) of 50 years or more. Quotas for minors were balanced with respect to sex ratio and of equal numbers in the three age categories 9-11, 12-15 and 16-17 years. The source for demographic information about Costa Rica for the calculation of quotas was the Central American Population Program of the University of Costa Rica (http://populi.ucr.ac.cr). The socioeconomic level of each household was determined from Duncan's socioeconomic index3, which integrates information about the adult interviewed and about appliances found in the household. Three levels were discriminated in this study with the following representation in the sample: 57.9% low/middle-low, 35.3% middle, and 6.9% middle-high/high. Households representing urban and rural segments were also chosen according to a quota based on the national distribution of these characteristics, yielding 47.8% urban and 52.2% rural households. These proportions approach the national distribution of these urbanization levels (48.3% urban vs. 51.7% rural, as reported by the National Institute of Statistics and Census for 1998). The sampling error associated to the 1021 adults or households was 3.1% for a 95% confidence interval. The error associated to the 177 minors was 7.4%. The global error for the complete sample of 1198 questionnaires was 2.8%.
3 See Stevens et al. 1985. Socioeconomic indeces and the new 1980 census occupational classification scheme. Social Sciences Research 14: 18-22.
6
Data collection and processing: The marketing research company Unimer Research International (based in San José, Costa Rica) was given the task of collecting the data in the field, preparing the digital database and performing a subset of the foreseen analyses under the supervision of the project coordinator. Prior to departing to the field for the pilot study, the 16 interviewers and 5 group supervisors allocated to this study underwent a training session led by the project coordinator and Unimer's project administrator. Teams composed of four interviewers and a group supervisor visited households in the locations predetermined by the sample. This investigation was introduced to the potential respondent as "...a study about the relationship between Costa Ricans and nature". In 5.7% of the cases the interview was refused up-front. Eight interviews (0.7%) were interrupted and therefore excluded from the sample. In 9% of cases nobody opened the door (a maximum of three revisits were made in such cases). Substitute, additional households were visited to complete the target sample. The average interview from a random subsample of cases lasted 34 minutes and 30 minutes for adults (range 20-55 min, n=55) and minors (range 17-69 min, n=48), respectively. The data were collected over a 52-day period, between 16. March and 6. May 1999. The filled questionnaires were subject to an initial revision by the group supervisor in the field and then forwarded to Unimer's office. About one third of the interviews were confirmed by the project administration through telephone calls to respondents. Open questions were codified and the questionnaire checked again for completeness and consistency prior to their entry into a digital database in SPSS Inc. format. The database was checked for outlying and extreme values and inconsistencies. In addition, the contents of the database and the questionnaires were cross-checked in a subsample of 30 cases. The statistics software package SPSS Version 8.0 was used for the analyses and Microsoft Excel for graphical representations. A confidence interval of 95% was used in all tests (alpha=0.05).
7
Results
1. Incidence and species
8
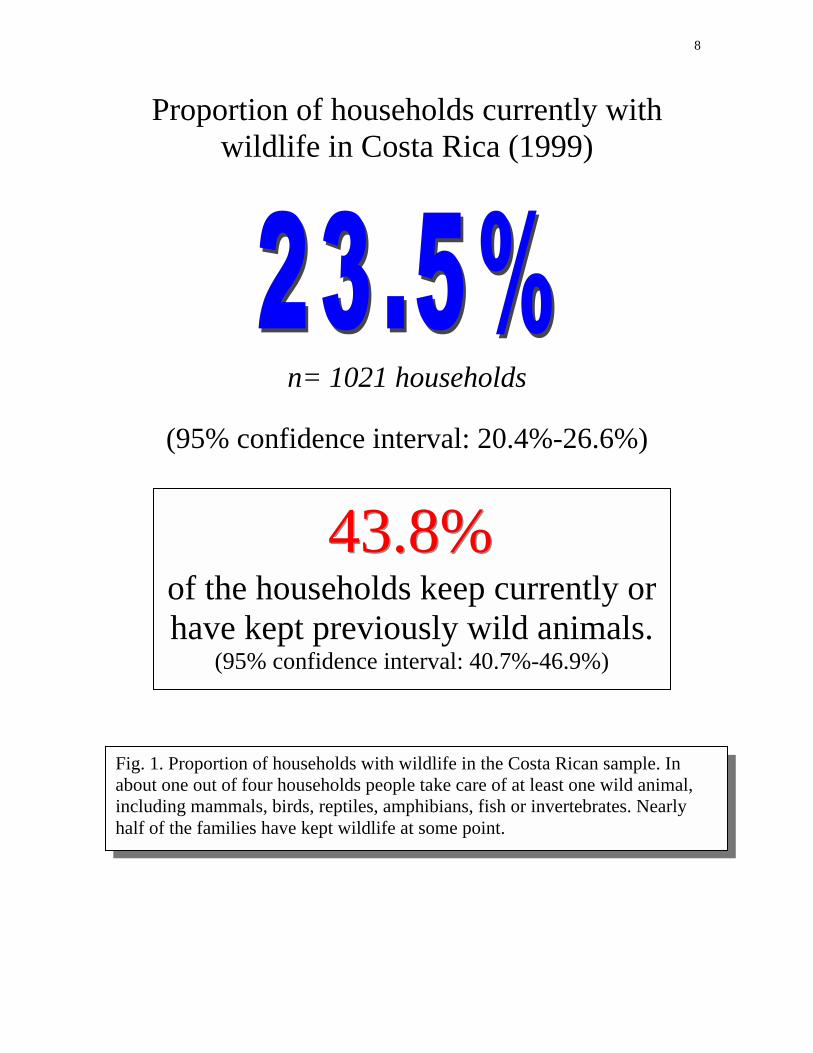
Proportion of households currently with wildlife in Costa Rica (1999)
n= 1021 households
(95% confidence interval: 20.4%-26.6%)
43.8% of the households keep currently or have kept previously wild animals.
(95% confidence interval: 40.7%-46.9%)
4433..88%%
Fig. 1. Proportion of households with wildlife in the Costa Rican sample. In about one out of four households people take care of at least one wild animal, including mammals, birds, reptiles, amphibians, fish or invertebrates. Nearly half of the families have kept wildlife at some point.
9
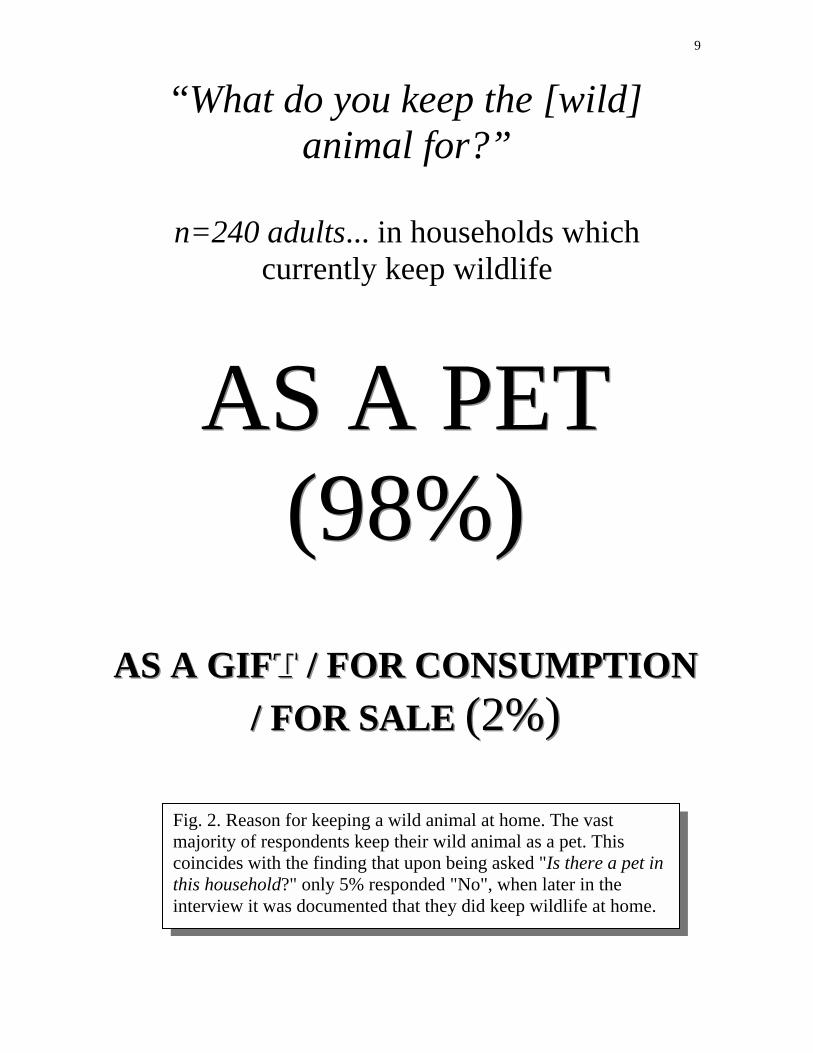
“What do you keep the [wild] animal for?”
n=240 adults... in households which
currently keep wildlife
AS A PET (98%)
AASS AA PPEETT ((9988%%))
AS A GIFTT / FOR CONSUMPTION / FOR SALE (2%)
AASS AA GGIIFFT // FFOORR CCOONNSSUUMMPPTTIIOONN// FFOORR SSAALLEE ((22%%))
Fig. 2. Reason for keeping a wild animal at home. The vast majority of respondents keep their wild animal as a pet. This coincides with the finding that upon being asked "Is there a pet in this household?" only 5% responded "No", when later in the interview it was documented that they did keep wildlife at home.
10
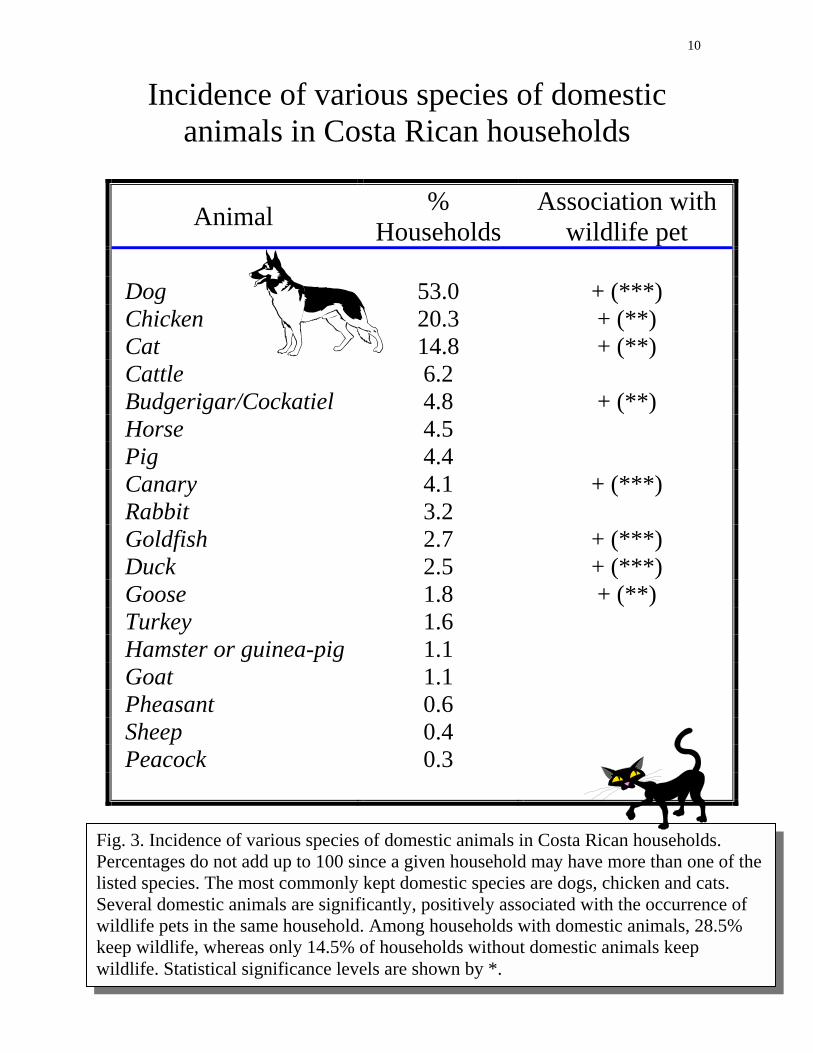
Incidence of various species of domestic animals in Costa Rican households
Animal % Households
Association with wildlife pet
Dog 53.0 + (***) Chicken 20.3 + (**) Cat 14.8 + (**) Cattle 6.2 Budgerigar/Cockatiel 4.8 + (**) Horse 4.5 Pig 4.4 Canary 4.1 + (***) Rabbit 3.2 Goldfish 2.7 + (***) Duck 2.5 + (***) Goose 1.8 + (**) Turkey 1.6 Hamster or guinea-pig 1.1 Goat 1.1 Pheasant 0.6 Sheep 0.4 Peacock 0.3
Fig. 3. Incidence of various species of domestic animals in Costa Rican households. Percentages do not add up to 100 since a given household may have more than one of the listed species. The most commonly kept domestic species are dogs, chicken and cats. Several domestic animals are significantly, positively associated with the occurrence of wildlife pets in the same household. Among households with domestic animals, 28.5% keep wildlife, whereas only 14.5% of households without domestic animals keep wildlife. Statistical significance levels are shown by *.
11
Incidence of 15 most commonly mentioned species among wild animals in Costa Rican households
Fig. 4. Frequency of most commonly kept wild species from a list of predetermined answers. Some households keep more than one species. Birds –mostly parakeets and parrots - are the most common pet wildlife. The most commonly kept psittacids are the Orange-chinned Parakeet (Brotogeris jugularis) and three species of Amazona in similar proportions (Red-lored Parrot A. autumnalis, White-fronted Parrot A. albifrons and Yellow-naped Parrot A. auropalliata).
76% keep parrots
785.000 houseCosta Ri
184.475 ho
12% keepor invert
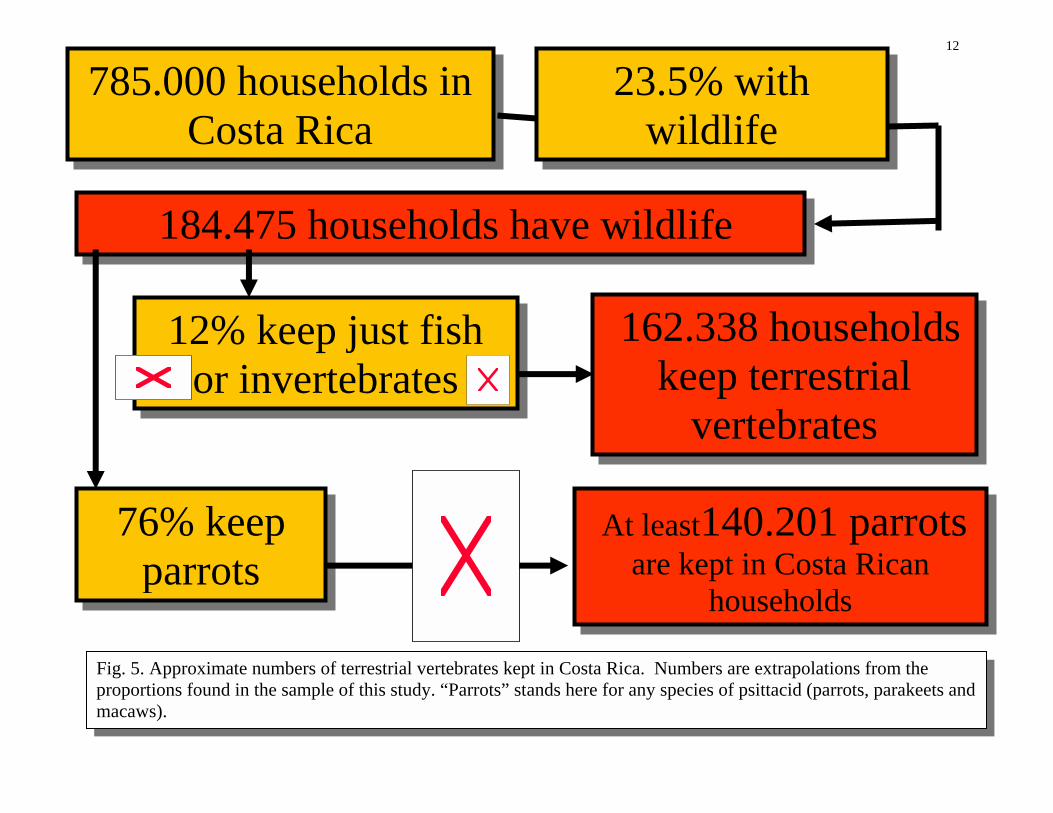
Fig. 5. Approximate numbers ofproportions found in the samplemacaws).
holds in ca
23.5% wiwildlife
useholds have wildlife
just fish ebrates
162.338 hkeep te
verte
At least140.are kept in
house
terrestrial vertebrates kept in Costa Rica. Numbers are ex of this study. “Parrots” stands here for any species of psitta
12
th
ouseholds rrestrial brates
201 parrots Costa Rican holds
trapolations from the cid (parrots, parakeets and

13
Species and specimen totals per household
n
0
1 0
2 0
3 0
4 0
5 0
6 0
7 0
8 0
PER
CEN
TAG
E
1 2 3 4 5S P E C IE S T O T A L
= 2 4 0 h o u s e h o ld s
n =
0
1 0
2 0
3 0
4 0
5 0
6 0
PER
CEN
TAG
E
1 2 3 4 5 6 +S P E C IM E N T O T A L S
2 3 7 h o u s e h o ld s
Fig. 6. Species and specimen totals per household. The vast majority of households with wildlife keep one individual of just one species of animal. People who keep songbirds and ornamental birds (other than parrots or parakeets) tend to keep more than one individual, typically two. In households with an aquarium the median number of fishes kept was four.

14
2. Reasons for keeping and not keeping
wildlife

15
"Please mention two reasons, in order of importance, why you keep wild animals at home."
- Table shows frequencies for first mention only -
Fig. 7. Main reason for currently keeping wild animals at home. This item was an open question in the interview. All of the remaining 24.1% of answers had less than 2% representation in the sample.
16
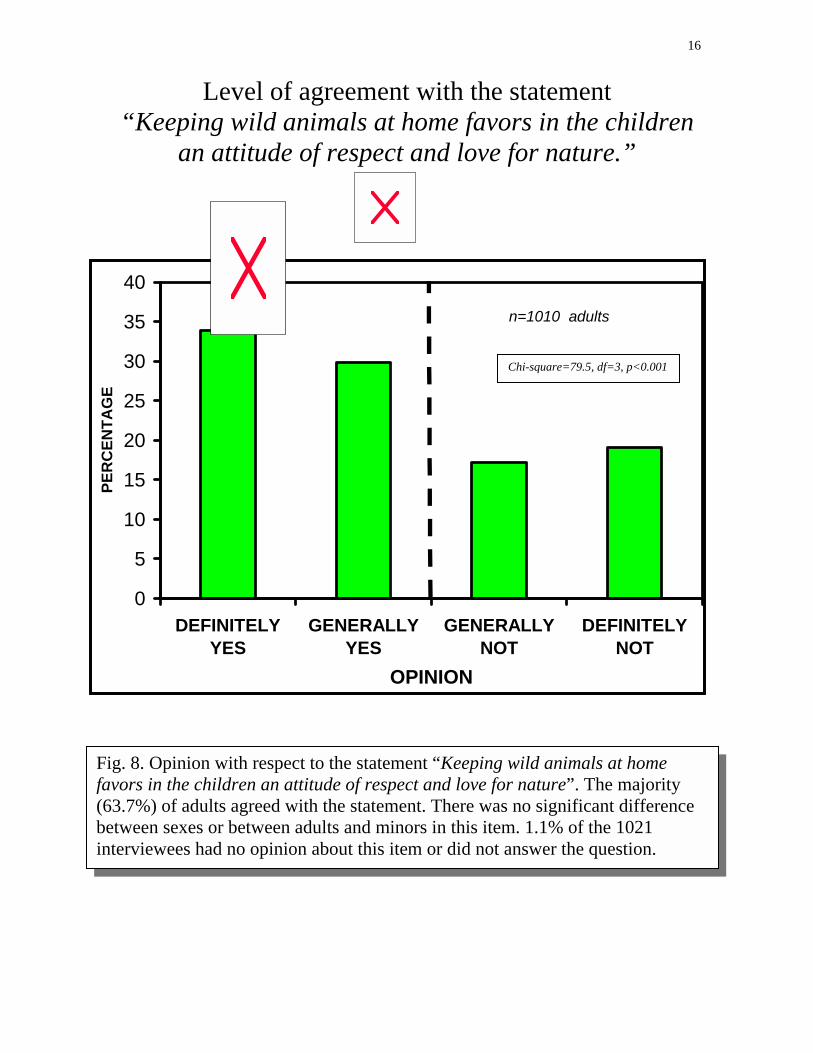
Level of agreement with the statement “Keeping wild animals at home favors in the children
an attitude of respect and love for nature.”
0
5
10
15
20
25
30
35
40
DEFINITELYYES
GENERALLYYES
GENERALLYNOT
DEFINITELYNOT
OPINION
PER
CEN
TAG
E
n=1010 adults
Chi-square=79.5, df=3, p<0.001
Fig. 8. Opinion with respect to the statement “Keeping wild animals at home favors in the children an attitude of respect and love for nature”. The majority (63.7%) of adults agreed with the statement. There was no significant difference between sexes or between adults and minors in this item. 1.1% of the 1021 interviewees had no opinion about this item or did not answer the question.
17
“Do you think that keeping wild animals at home
makes the people better known in the neighborhood?”
05
1015202530354045
DEFINITELYYES
GENERALLYYES
GENERALLYNOT
DEFINITELYNOT
OPINION
PER
CEN
TAG
E
MALES
n=1009 adults
FEMALES
Chi-square=12.2, df=3, p<0.01
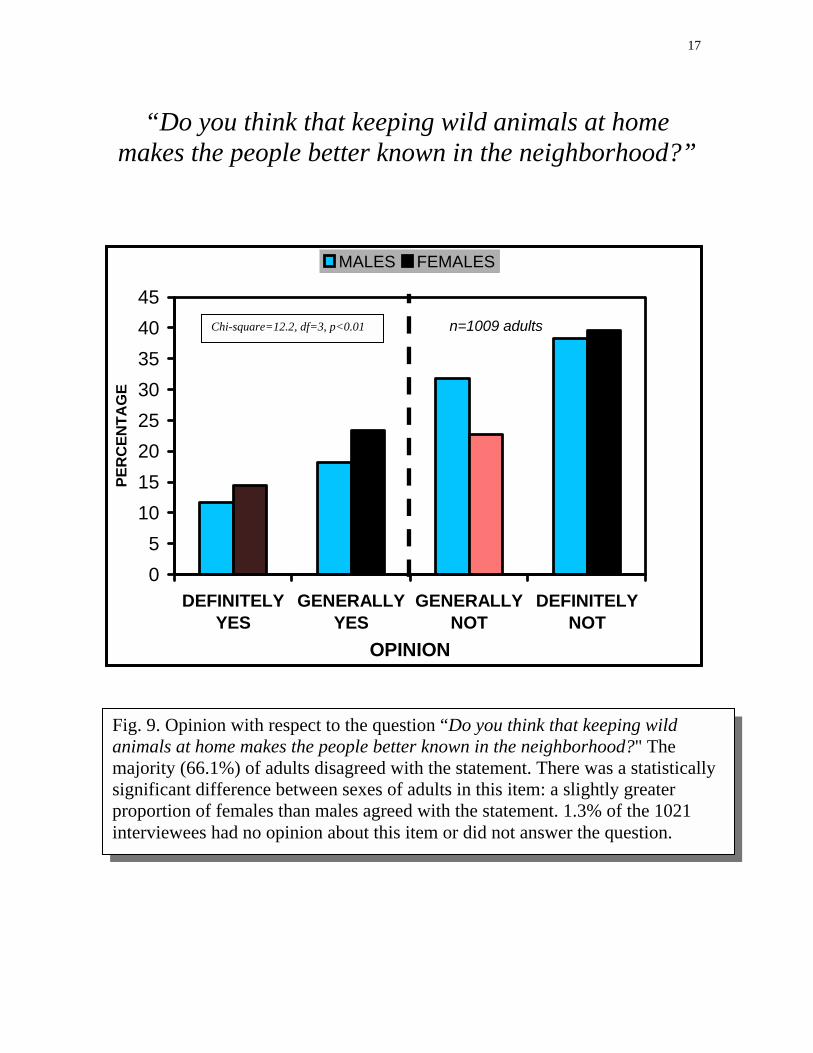
Fig. 9. Opinion with respect to the question “Do you think that keeping wild animals at home makes the people better known in the neighborhood?" The majority (66.1%) of adults disagreed with the statement. There was a statistically significant difference between sexes of adults in this item: a slightly greater proportion of females than males agreed with the statement. 1.3% of the 1021 interviewees had no opinion about this item or did not answer the question.
18
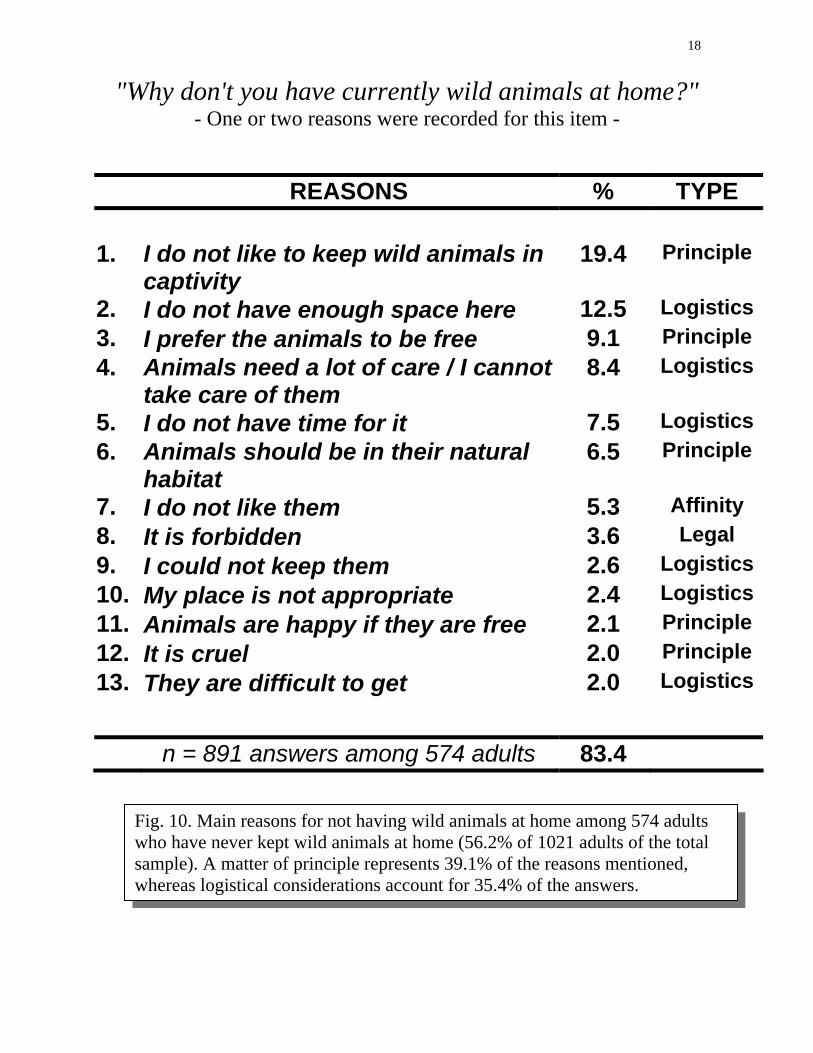
"Why don't you have currently wild animals at home?" - One or two reasons were recorded for this item -
REASONS % TYPE 1. I do not like to keep wild animals in
captivity 19.4 Principle
2. I do not have enough space here 12.5 Logistics3. I prefer the animals to be free 9.1 Principle4. Animals need a lot of care / I cannot
take care of them 8.4 Logistics
5. I do not have time for it 7.5 Logistics6. Animals should be in their natural
habitat 6.5 Principle
7. I do not like them 5.3 Affinity 8. It is forbidden 3.6 Legal 9. I could not keep them 2.6 Logistics10. My place is not appropriate 2.4 Logistics11. Animals are happy if they are free 2.1 Principle12. It is cruel 2.0 Principle13. They are difficult to get 2.0 Logistics n = 891 answers among 574 adults 83.4
Fig. 10. Main reasons for not having wild animals at home among 574 adults who have never kept wild animals at home (56.2% of 1021 adults of the totalsample). A matter of principle represents 39.1% of the reasons mentioned, whereas logistical considerations account for 35.4% of the answers.

19
“Would you mention two reasons why, in general, people in Costa Rica decide to keep a wild animal as a pet?”
CURRENTLY KEEPS WILDLIFE HAS NEVER KEPT WILDLIFE
1. THEY LIKE THEM 1. THEY LIKE THEM 2. THEY ARE NICE 2. AS A LUXURY ITEM 3. FOR COMPANY 3. FOR COMMERCIAL TRADE 4. TO PLEASE THEIR CHILDREN 4. THEY ARE NICE 5. FOR ENTERTAINMENT 5. TO IMPRESS 6. FOR COMMERCIAL TRADE 6. FOR ENTERTAINMENT 7. THEY ARE DIFFERENT 7. FOR COMPANY 8. AS A LUXURY ITEM 8. AS HOME DECORATION 9. FOR FUN 9. THEY ARE DIFFERENT
10. TO TAKE BETTER CARE OF THEM 10. FOR FUN 11. BECAUSE OF IGNORANCE 11. TO PLEASE THEIR CHILDREN 12. TO GIVE THEM LOVE 12. BECAUSE OF IGNORANCE
n=413 answers among 240 adults n=969 answers among 574 adults
Fig. 11. Twelve most common reasons reported by interviewees for why Costa Ricans in general keep wild animals as pets. Answers are ordered from highest to lowest frequency. Although most reasons are common to both groups, adults who have never kept wild animals as pets and those who currently keep wildlife, the groups differ with respect to the relative importance attributed to these reasons.
20
3. Care and captivity conditions of the animal
21
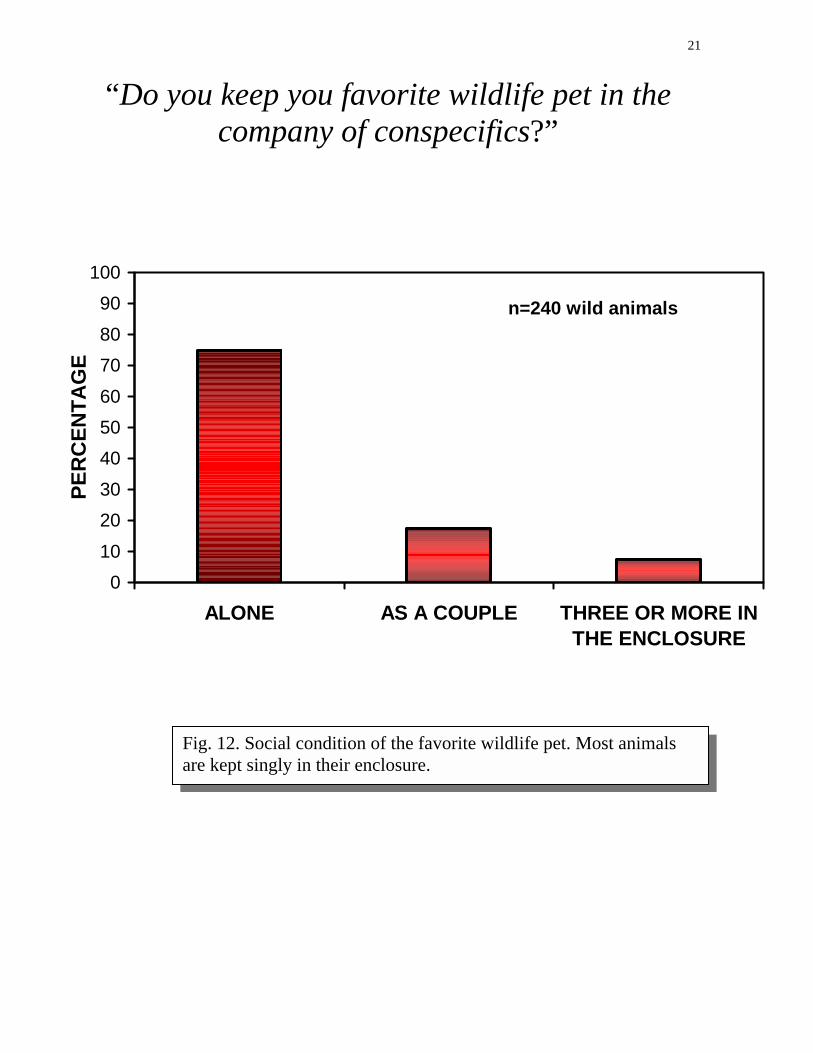
“Do you keep you favorite wildlife pet in the company of conspecifics?”
0102030405060708090
100
ALONE AS A COUPLE THREE OR MORE INTHE ENCLOSURE
PER
CEN
TAG
E
n=240 wild animals
Fig. 12. Social condition of the favorite wildlife pet. Most animals
are kept singly in their enclosure.
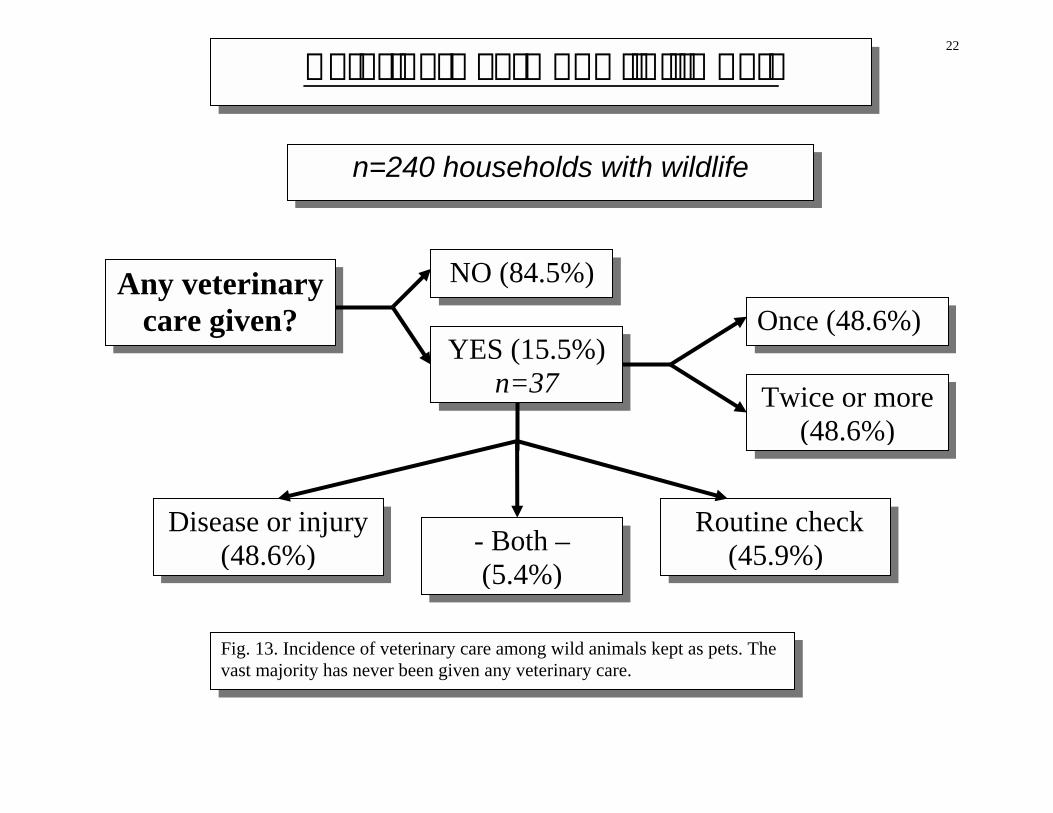
Veterinary ca
n=240 hous
Any veterinary care given?
NO
YESn
Disease or injury(48.6%) - B
(5
Fig. 13. Incidence of veterinary care avast majority has never been given an
22
re of wildlife pets
eholds with wildlife
(84.5%)
(15.5%)=37
Once (48.6%)
Twice or more (48.6%)
Routine check (45.9%)oth –
.4%)
mong wild animals kept as pets. The y veterinary care.
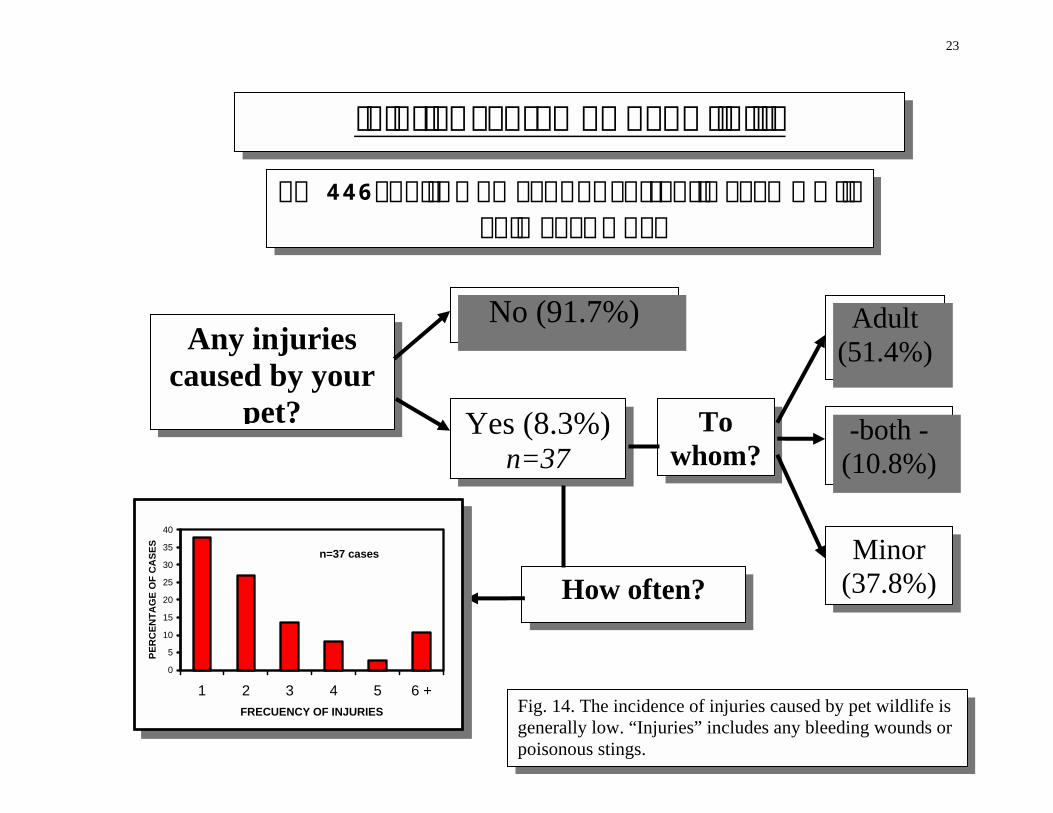
Injuries caused by pe
n=446 adults who kept or curranimal as a pet
Any injuries caused by your
pet?
No (91.7%)
Yes (8.3%) n=37
How oft
0
5
10
15
20
25
30
35
40
1 2 3 4 5 6 +FRECUENCY OF INJURIES
PER
CEN
TAG
E O
F C
ASE
S
n=37 cases
0
5
10
15
20
25
30
35
40
1 2 3 4 5 6 +FRECUENCY OF INJURIES
PER
CEN
TAG
E O
F C
ASE
S
n=37 cases
Fig. 14. The incidegenerally low. “Injpoisonous stings.
23
t wildlife
ently keep a wild
To whom?
Adult (51.4%)
-both - (10.8%)
Minor (37.8%)en?
nce of injuries caused by pet wildlife is uries” includes any bleeding wounds or
24
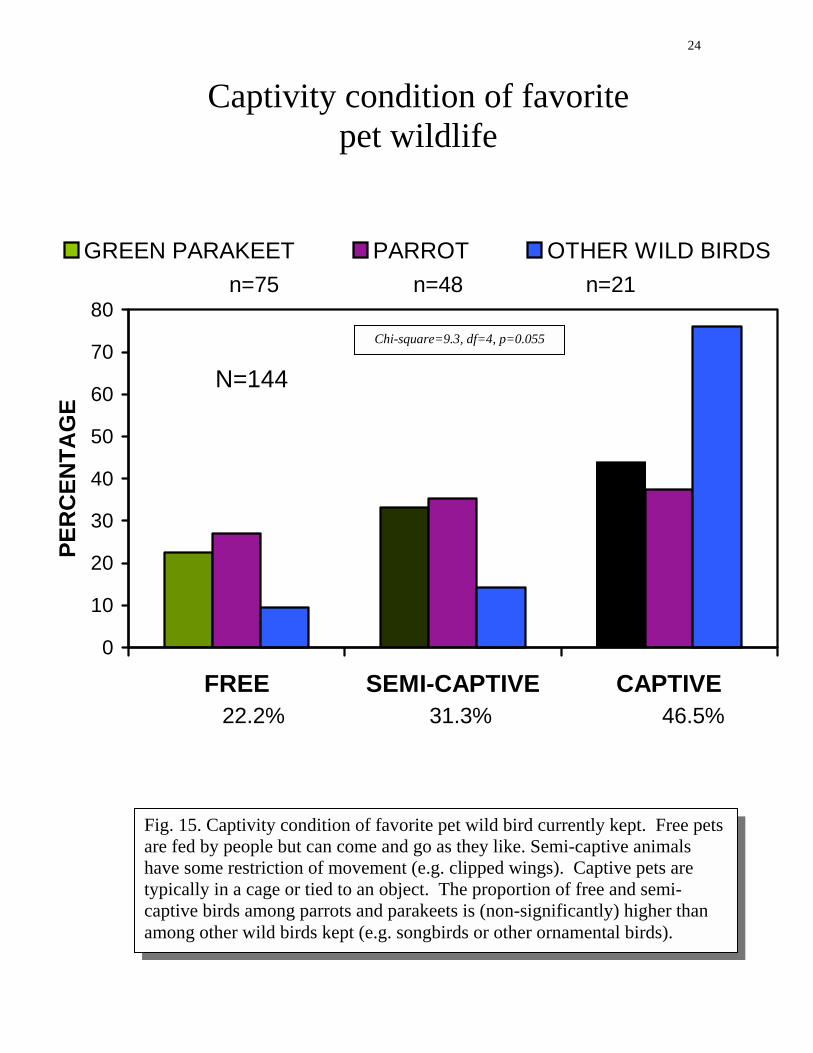
Captivity condition of favorite pet wildlife
0
10
20
30
40
50
60
70
80
FREE SEMI-CAPTIVE CAPTIVE
PER
CEN
TAG
E
OTHER WILD BIRDSn=75 n=48 n=21
22.2% 31.3% 46.5%
N=144
GREEN PARAKEET PARROT
Chi-square=9.3, df=4, p=0.055
Fig. 15. Captivity condition of favorite pet wild bird currently kept. Free pets are fed by people but can come and go as they like. Semi-captive animals have some restriction of movement (e.g. clipped wings). Captive pets are typically in a cage or tied to an object. The proportion of free and semi-captive birds among parrots and parakeets is (non-significantly) higher than among other wild birds kept (e.g. songbirds or other ornamental birds).
25
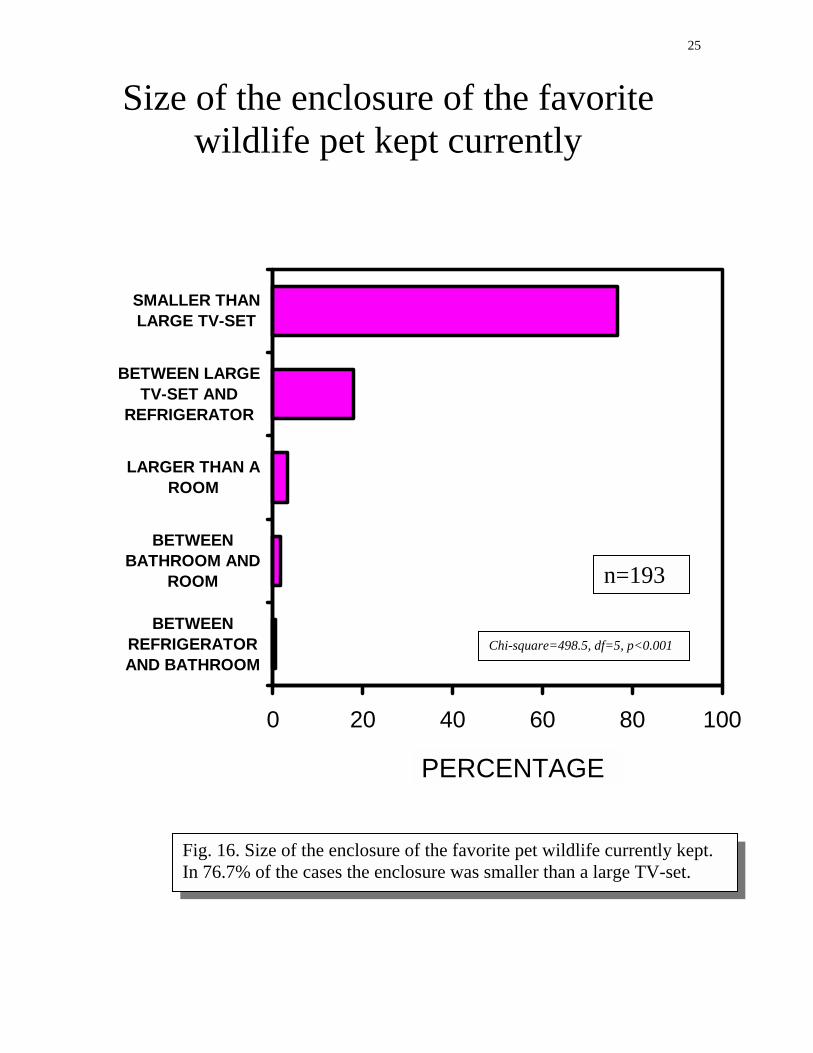
Size of the enclosure of the favorite wildlife pet kept currently
0 20 40 60 80 10
BETWEENREFRIGERATORAND BATHROOM
BETWEENBATHROOM AND
ROOM
LARGER THAN AROOM
BETWEEN LARGETV-SET AND
REFRIGERATOR
SMALLER THANLARGE TV-SET
Chi-square=498.5, df=5, p<0.001
n=193
E
0
Fig. 16. Size of the enclosure oIn 76.7% of the cases the enclo
PERCENTAG
f the favorite pet wildlife currently kept. sure was smaller than a large TV-set.
26
“How do you think that the animals living in your home feel?”
Chi-square=101.1, df=3, p<0.001
Chi-square=158.6, df=3, p<0.001
Chi-square=187.3, df=3, p<0.001
Fig. 17. Owner’s opinion about their pet’s welfare (n=240 adults). In general, owners state that their pet wildlife is happy, pleased and not lonely.
27
4. Variables associated with households that
keep wildlife
28
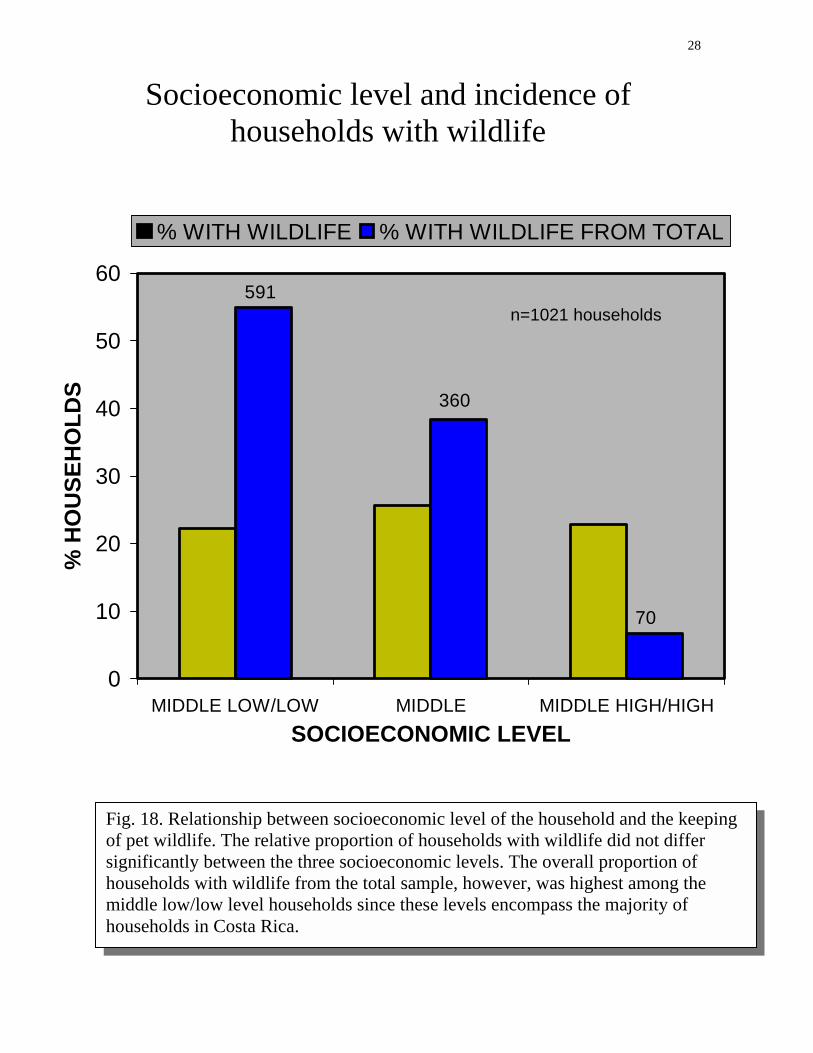
Socioeconomic level and incidence of households with wildlife
0
10
20
30
40
50
60
MIDDLE LOW/LOW MIDDLE MIDDLE HIGH/HIGHSOCIOECONOMIC LEVEL
% H
OU
SEH
OLD
S
% WITH WILDLIFE % WITH WILDLIFE FROM TOTAL
591
360
70
n=1021 households
Fig. 18. Relationship between socioeconomic level of the household and the keeping of pet wildlife. The relative proportion of households with wildlife did not differ significantly between the three socioeconomic levels. The overall proportion of households with wildlife from the total sample, however, was highest among the middle low/low level households since these levels encompass the majority of households in Costa Rica.
29
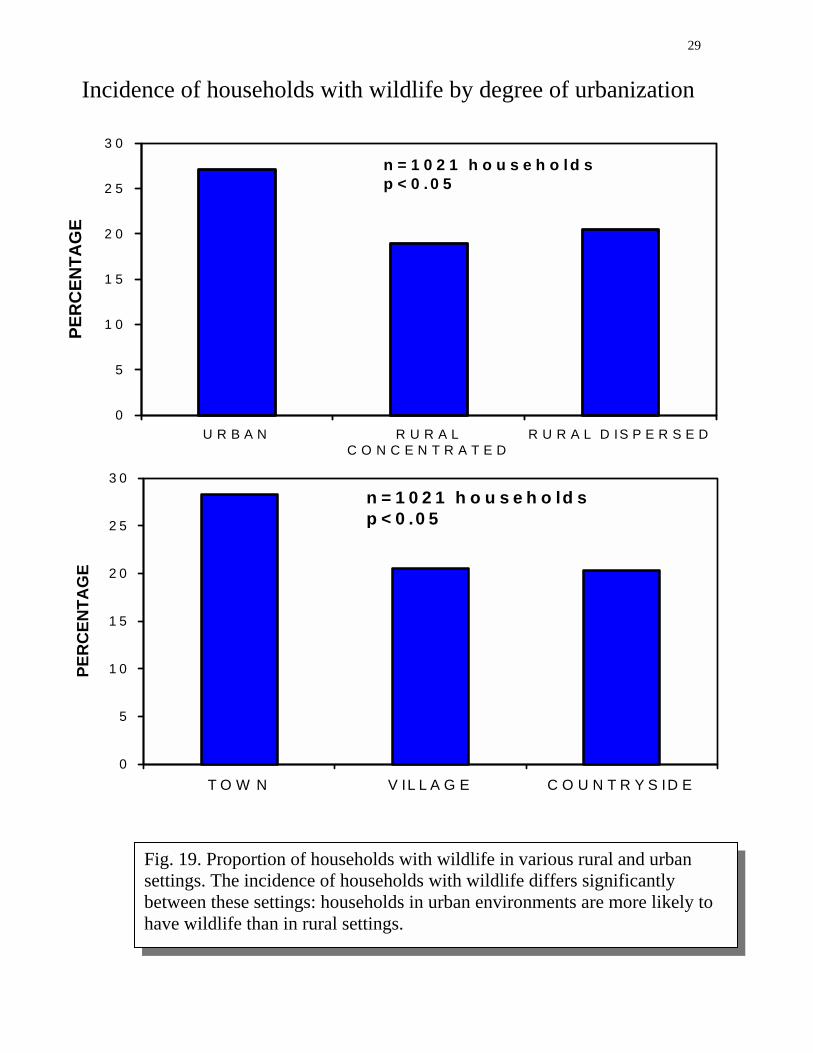
Incidence of households with wildlife by degree of urbanization
0
5
1 0
1 5
2 0
2 5
3 0
U R B A N R U R A LC O N C E N T R A T E D
R U R A L D IS P E R S E D
PER
CEN
TAG
E
n = 1 0 2 1 h o u s e h o l d sp < 0 . 0 5
0
5
1 0
1 5
2 0
2 5
3 0
T O W N V IL L A G E C O U N T R Y S ID E
PER
CEN
TAG
E
n = 1 0 2 1 h o u s e h o ld sp < 0 .0 5
Fig. 19. Proportion of households with wildlife in various rural and urban settings. The incidence of households with wildlife differs significantly between these settings: households in urban environments are more likely to have wildlife than in rural settings.
30
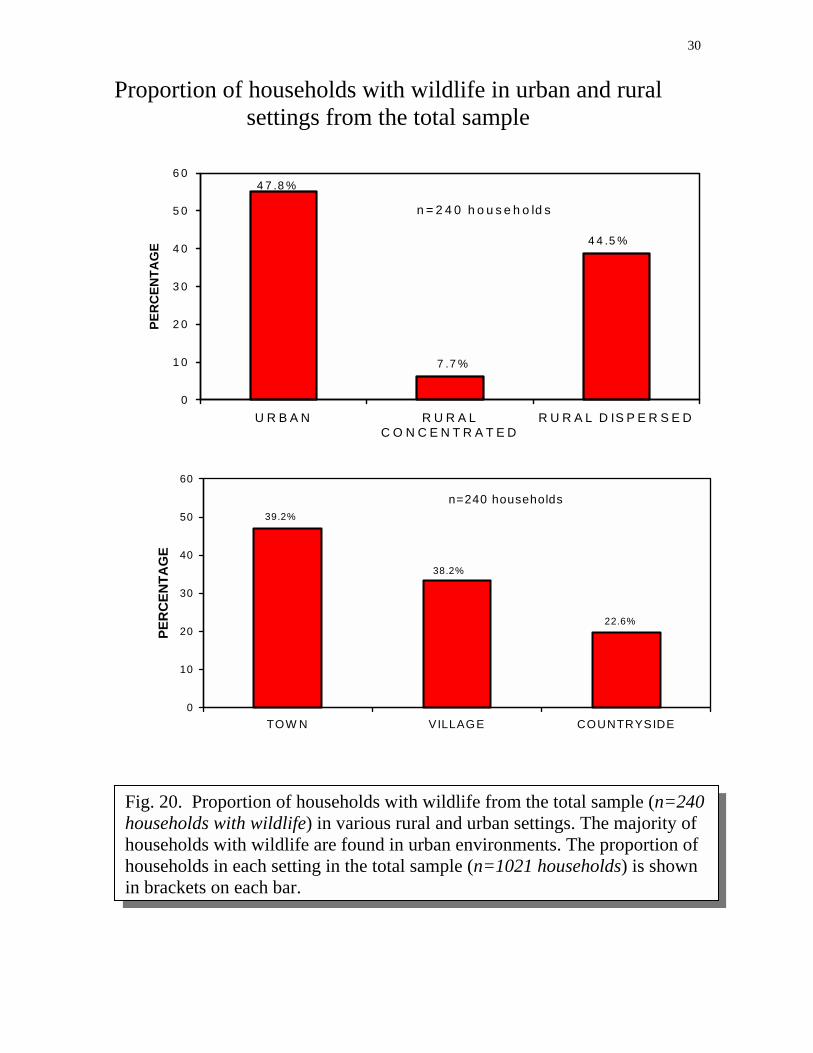
Proportion of households with wildlife in urban and rural settings from the total sample
0
1 0
2 0
3 0
4 0
5 0
6 0
U R B A N R U R A LC O N C E N T R A T E D
R U R A L D IS P E R S E D
PER
CEN
TAG
E
n = 2 4 0 h o u s e h o ld s
4 7 .8 %
7 .7 %
4 4 .5 %
0
10
20
30
40
50
60
TOW N VILLAGE COUNTRYSIDE
PER
CEN
TAG
E
n=240 households39.2%
38.2%
22.6%
Fig. 20. Proportion of households with wildlife from the total sample (n=240households with wildlife) in various rural and urban settings. The majority of households with wildlife are found in urban environments. The proportion of households in each setting in the total sample (n=1021 households) is shown in brackets on each bar.