national report on schooling in australia 2014 - … · national report on schooling in australia ....
TRANSCRIPT

National Report on Schooling in Australia
2014
National Report on Schooling in Australia 2014
Copyright
© Australian Curriculum, Assessment and Reporting Authority (ACARA) 2016, unless otherwise indicated.
Subject to the exceptions listed below, copyright in this document is licensed under a Creative Commons Attribution 4.0 International (CC BY) licence. This means that you can use these materials for any purpose, including commercial use, provided that you attribute ACARA as the source of the copyright material.
Exceptions:
The Creative Commons licence does not apply to:
1. logos, including (without limitation) the ACARA logo, the NAP logo, the Australian Curriculum logo, the My School logo, the Australian Government logo and the Education Services Australia Limited logo;
2. other trade mark protected material;
3. photographs; and
4. material owned by third parties that has been reproduced with their permission. Permission will need to be
obtained from third parties to re-use their material.
Attribution:
ACARA requests attribution as:
“© Australian Curriculum, Assessment and Reporting Authority (ACARA) 2016, unless otherwise indicated. This material was downloaded from the ACARA website (accessed [insert date]) and [was] [was not] modified. The material is licensed under CC BY 4.0. ACARA does not endorse any product that uses ACARA’s material or make any representations as to the quality of such products. Any product that uses ACARA’s material should not be taken to be affiliated with ACARA or have the sponsorship or approval of ACARA. It is up to each person to make their own assessment of the product.”
Copyright queries: [email protected]
Contact details:
Australian Curriculum, Assessment and Reporting Authority Level 13, 280 Elizabeth Street Sydney NSW 2000 telephone: 1300 895 563 email: [email protected] website: www.acara.edu.au
National Report on Schooling in Australia 2014 ISSN 1036-0972
iii
National Report on Schooling in Australia 2014
Table of Contents
Executive summary 1
Part 1: Schools and schooling 11
Part 1.1 – School numbers 12
Part 1.2 – Student numbers 16
Part 1.3 – Staff numbers 22
Part 1.4 – School structures 25
Part 1.5 – School funding 27
Part 2: Policies and priorities 49
Part 2.1 – National policy context 50
Part 2.2 – Educational goals 52
Part 2.3 – Developing stronger partnerships 54
Part 2.4 – Supporting quality teaching and school leadership 55
Part 2.5 – Strengthening early childhood education 57
Part 2.6 – Enhancing middle years development 60
Part 2.7 – Supporting senior years of schooling and youth transitions 62
Part 2.8 – Promoting world-class curriculum and assessment 65
Part 2.9 – Improving educational outcomes for Indigenous youth and disadvantaged young Australians, especially those from low socio-economic backgrounds 71
Part 2.10 – Strengthening accountability and transparency 73
Part 3: Measuring and reporting performance 79
Part 3.1 – Measurement Framework for Schooling in Australia 80
Part 3.2 – Student participation 81
Part 3.3 – Student Achievement – National Assessment Program 92
Part 3.4 – Senior schooling and youth transitions 103
Part 4: Glossary 114
2
National Report on Schooling in Australia 2014

3
National Report on Schooling in Australia 2014
Executive summary
2
National Report on Schooling in Australia 2014
Executive Summary
The National Report on Schooling in Australia 2014 is the annual report on Australia’s school education sector. It has been produced by the Australian Curriculum, Assessment and Reporting Authority (ACARA) on behalf of the Education Council1.
1 The (COAG) Education Council replaced the Standing Council on School Education and Early Childhood (SCSEEC) in July 2014 as the ministerial council with responsibility for schooling in Australia.
The report highlights progress in 2014 towards the Melbourne Declaration on Educational Goals for Young Australians agreed by Australian education ministers in 2008.
The National Report on Schooling in Australia 2014 addresses the eight areas of commitment to action specified in the Melbourne Declaration. It describes the national policy and reporting context for school education in Australia and reports against the nationally agreed key performance measures (KPMs) for schooling, covering student participation, student achievement in national assessments and student transitions to further education and work. A selection of other statistical information on Australian schooling in 2014 and for the six-year period 2009–2014 is included in the report, with more extensive data sets accessible through the National Report on Schooling Data Portal.
The data portal is a new component of the 2014 report. The data portal provides readers with interactive access to a wide range of data on schooling in Australia, including general statistics on enrolments and funding and data on the agreed KPMs. In most cases, the portal allows readers to download data at the national level, but also by state and territory, by school sector, by calendar year and by other breakdowns such as gender and Indigenous status.
This is the sixth annual National Report on Schooling in Australia to address the Melbourne Declaration and the twenty-sixth annual report overall.
The National Report on Schooling in Australia 2009, 2010, 2011, 2012 and 2013 are available on the ACARA website. Editions prior to 2009 are available on the SCSEEC website.
NATIONAL REPORTON SCHOOLINGDATA PORTAL
Introduction
3
National Report on Schooling in Australia 2014
Overview of the report
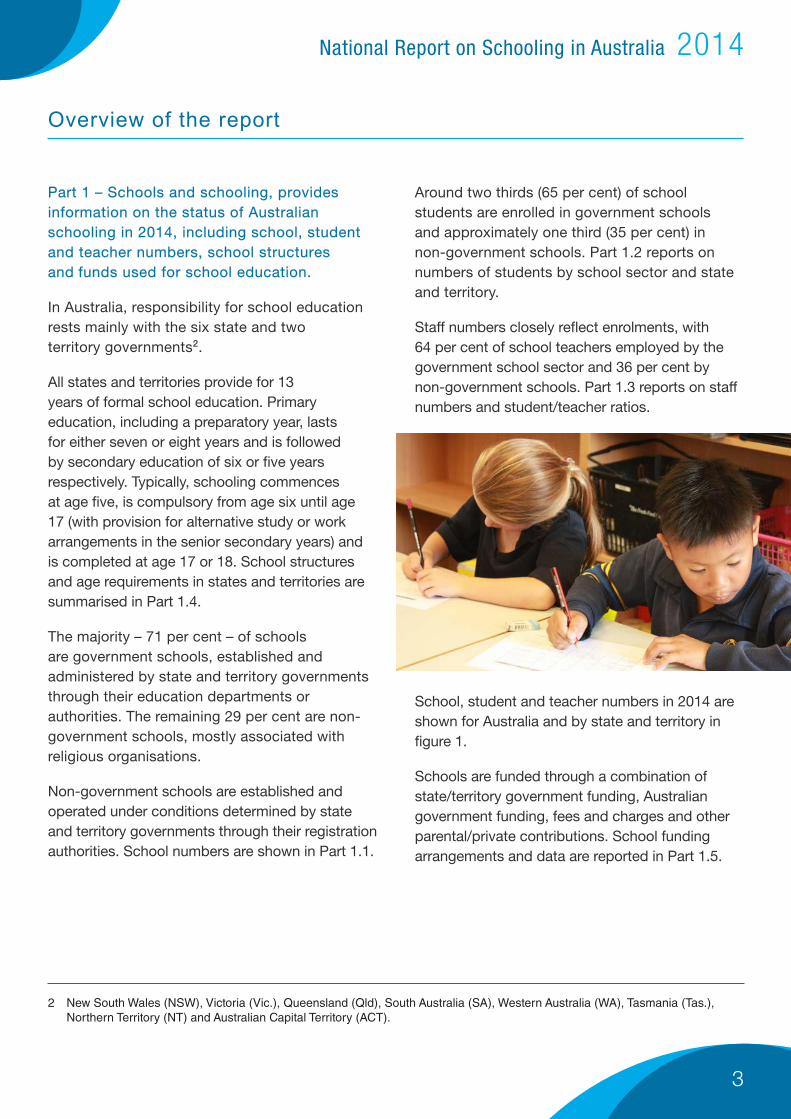
Part 1 – Schools and schooling, provides information on the status of Australian schooling in 2014, including school, student and teacher numbers, school structures and funds used for school education.
In Australia, responsibility for school education rests mainly with the six state and two territory governments2.
All states and territories provide for 13 years of formal school education. Primary education, including a preparatory year, lasts for either seven or eight years and is followed by secondary education of six or five years respectively. Typically, schooling commences at age five, is compulsory from age six until age 17 (with provision for alternative study or work arrangements in the senior secondary years) and is completed at age 17 or 18. School structures and age requirements in states and territories are summarised in Part 1.4.
The majority – 71 per cent – of schools are government schools, established and administered by state and territory governments through their education departments or authorities. The remaining 29 per cent are non-government schools, mostly associated with religious organisations.
Non-government schools are established and operated under conditions determined by state and territory governments through their registration authorities. School numbers are shown in Part 1.1.
Around two thirds (65 per cent) of school students are enrolled in government schools and approximately one third (35 per cent) in non-government schools. Part 1.2 reports on numbers of students by school sector and state and territory.
Staff numbers closely reflect enrolments, with 64 per cent of school teachers employed by the government school sector and 36 per cent by non-government schools. Part 1.3 reports on staff numbers and student/teacher ratios.
School, student and teacher numbers in 2014 are shown for Australia and by state and territory in figure 1.
Schools are funded through a combination of state/territory government funding, Australian government funding, fees and charges and other parental/private contributions. School funding arrangements and data are reported in Part 1.5.
2 New South Wales (NSW), Victoria (Vic.), Queensland (Qld), South Australia (SA), Western Australia (WA), Tasmania (Tas.), Northern Territory (NT) and Australian Capital Territory (ACT).

4
National Report on Schooling in Australia 2014
Numbers of schools, students and teachers by state and territory, Australia, 2014
Figure 1
AUSTRALIASchools 9,389 Students 3,694,101 Teachers 264,065
Western Australia
Schools 1,076
Students 393,505
Teachers 27,248
Northern Territory
Schools 190
Students 40,878
Teachers 3,376
Queensland
Schools 1,715
Students 782,103
Teachers 54,124
New South Wales
Schools 3,083
Students 1,169,371
Teachers 83,259
South Australia
Schools 721
Students 262,292
Teachers 18,572
Victoria
Schools 2,217
Students 900,185
Teachers 66,780
Tasmania
Schools 257
Students 81,153
Teachers 5,841
Australian Capital Territory
Schools 130
Students 64,614
Teachers 4,865Notes
Student numbers are individuals (full-time students plus part-time students). Teacher numbers are full-time equivalent (FTE).Source: ABS, Cat. No. 4221.0, Schools, Australia, 2014

5
National Report on Schooling in Australia 2014
Part 2 – Policies and priorities, outlines the national policy context for Australian schooling in 2014 and reports against the commitments to action agreed by Australian education ministers in the Melbourne Declaration on the Educational Goals for Young Australians.
Part 2.1 of this report summarises the roles of the Council of Australian Governments (COAG) and the Education Council in deciding agreed national policy and initiatives for education. Part 2.2 outlines the goals and commitments contained in the Melbourne Declaration and the COAG targets for education.
Parts 2.3 – 2.10 report on progress in implementing the Melbourne Declaration commitments to action with a focus on developments in 2014.
Progress towards the commitments to action reported for 2014 include:
• the remaining national partnershipagreements on schooling undertakenthrough COAG between 2009 and 2014were completed
• all states and territories were implementingthe Australian Professional Standards forTeachers, as part of a nationally consistentapproach to teacher registration (from 2013)
• all states and territories were implementingthe Australian Curriculum in English,Mathematics, Science and History
• annual tests in literacy and numeracy forYears 3, 5, 7 and 9 were conducted throughthe National Assessment Program - Literacyand Numeracy (NAPLAN) for the seventhtime
• the cohort that undertook the firstNAPLAN tests in Year 3 in 2008 – tookpart in their fourth and final NAPLAN testsas Year 9 students in 2014
• education ministers agreed that NAPLANtests will be conducted online from 2017with states and territories opting in to onlinetesting over two to three years
• the three-yearly NAP sample assessmentin Information and CommunicationTechnology (ICT) Literacy for Year 3 and 6students was conducted for the fourth time
• the fifth release of the My SchoolWebsite occurred
• the Education Council released Preparing Secondary Students for Work – A framework for vocational learning and VET delivered to secondary students
Part 2 also includes contributions from states and territories on how the commitments to action have been addressed within jurisdictions.
6
National Report on Schooling in Australia 2014
Part 3 – Measuring and reporting performance, reports on the performance of Australian schooling in 2014, using the nationally agreed key performance measures (KPMs) for schooling specified in the Measurement Framework for Schooling in Australia 2012.
Part 3 reports on 16 of the 23 agreed KPMs 3 along with, in some cases, associated COAG targets. The measures are reported at the national level, and by various breakdowns such as school sector, state and territory, school year and Indigenous status. For selected KPMs, time series for the six years 2009–2014 since the Melbourne Declaration are also included. Where relevant breakdowns or time series are not reported in Part 3, a link to the National Report on Schooling Data Portal or other data source is provided.
Data reported for 2014 include:
• The average national attendance rate forstudents in Years 1–10 was 92.7 per cent.At 83.5 per cent, the average attendancerate for Aboriginal and Torres Strait Islanderstudents was 9.7 percentage points lowerthan for non-Indigenous students (93.2 percent). Attendance rates were lower for Years8, 9 and 10 than for Years 1–7.
• NAPLAN participation rates for reading,writing and literacy were over 90 per centfor each of Years 3, 5, 7 and 9 but werelower in each domain for Year 9 than forYears 3, 5 and 7.
• The proportion of students achieving at orabove the minimum standard in NAPLANtests was over 90 per cent for all Yeargroups tested in reading, and numeracyand for Years 3 and 5 in writing.
• There were significant decreases in theproportions of students achieving ator above the proficient standard in ICTLiteracy since this sample assessmentwas last conducted in 2011. For Year6 students, this measure fell from 62per cent in 2011 to 55 per cent in 2014.For Year 10 students, the proportiondecreased further, from 65 per cent in2011 to 52 per cent in 2014.
• The proportion of students proceeding toYear 12 (as measured by the apparentretention rate from Year 10 to Year 12) roseby 1.8 percentage points to 82.5 per cent.The apparent retention rate from Year 10to Year 12 for Aboriginal and Torres StraitIslander students rose by 4.6 percentagepoints to 60.4 per cent, reducing the gapbetween Indigenous and non-Indigenousrates from 26.1 to 23.2 percentage points.
• The proportion of the 20 to 24-year-oldpopulation that has attained at least Year 12or equivalent or AQF Certificate III or aboveremained stable at around 85 per cent.
3 The remaining seven KPMs do not apply to the 2014 reporting year. For example, NAP international assessments and NAP sample assessments in Science Literacy and Civics and Citizenship were not conducted in 2014.
7
National Report on Schooling in Australia 2014
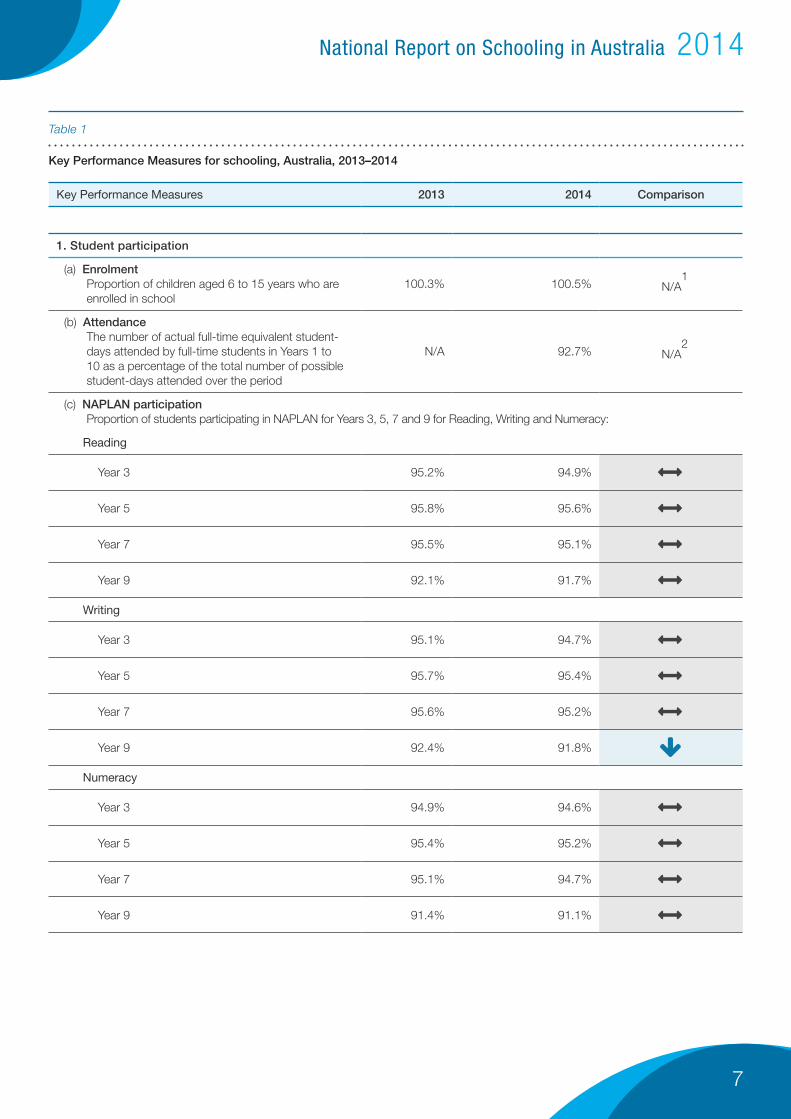
Key Performance Measures for schooling, Australia, 2013–2014
Table 1
Key Performance Measures 2013 2014 Comparison
1. Student participation
(a) Enrolment Proportion of children aged 6 to 15 years who are enrolled in school
100.3% 100.5% N/A1
(b) Attendance The number of actual full-time equivalent student-days attended by full-time students in Years 1 to 10 as a percentage of the total number of possible student-days attended over the period
N/A 92.7% N/A2
(c) NAPLAN participation Proportion of students participating in NAPLAN for Years 3, 5, 7 and 9 for Reading, Writing and Numeracy:
Reading
Year 3 95.2% 94.9% ��
Year 5 95.8% 95.6% ��
Year 7 95.5% 95.1% ��
Year 9 92.1% 91.7% ��
Writing
Year 3 95.1% 94.7% ��
Year 5 95.7% 95.4% ��
Year 7 95.6% 95.2% ��
Year 9 92.4% 91.8% �y
Numeracy
Year 3 94.9% 94.6% ��
Year 5 95.4% 95.2% ��
Year 7 95.1% 94.7% ��
Year 9 91.4% 91.1% ��

8
National Report on Schooling in Australia 2014
Key Performance Measures 2013 2014 Comparison
(d) Apparent retention rates from Year 10 to Year 12 (Indigenous school students cf non-Indigenous school students)
Indigenous school students 55.8% 60.4% �xNon-Indigenous students 81.9% 83.6% �xAll students 80.7% 82.5% �x
(e) Participation of young people in VET including VET in Schools Proportion of the population aged 15 to 19 years who in the calendar year successfully completed at least one Unit of Competency as part of a VET qualification at AQF Certificate II or above
27.0% 33.6% N/A3
(f) Proportion of 15 to 19-year-olds in full-time education or training, in full-time work, or both in parttime work and part-time education or training
86.3% 87.2% ��
(g) Proportion of 20 to 24-year-olds in full-time education or training, in full-time work, or both in part-time work and part-time education or training
73.8% 74.1% ��
2. Student achievement: National Assessment Program – Literacy
(a) Proportion of students achieving at or above the national minimum standard for Reading:
Year 3—Band 2 95.30% 93.5% �y
Year 5—Band 4 96.10% 92.9% �yYear 7—Band 5 94.20% 94.9%
Year 9—Band 6 93.40% 92.1%
(b) NAPLAN mean scale scores for Reading
Year 3 419.1 418.3 ��
Year 5 502.3 500.6 ��Year 7 540.6 546.1
Year 9 580.2 580.4 ��(c) Proportion of students achieving at or above the national minimum standard for Writing:
Year 3—Band 2 95.0% 93.8%
Year 5—Band 4 91.7% 90.2% ��
Year 7—Band 5 89.3% 88.5% ��
Year 9—Band 6 82.6% 81.8% ��
��
��
��
��

9
National Report on Schooling in Australia 2014
Key Performance Measures 2013 2014 Comparison
(d) NAPLAN mean scale scores for Writing
Year 3 415.6 402.2
Year 5 477.9 468.3 ��
Year 7 517.0 511.6 ��
Year 9 554.1 550.3 ��
3. Student achievement: National Assessment Program – Numeracy
(a) Proportion of students achieving at or above the national minimum standard for Numeracy:
Year 3—Band 2 95.7% 94.6%
Year 5—Band 4 93.4% 93.5% ��
Year 7—Band 5 95.0% 95.1% ��Year 9—Band 6 90.6% 94.1% �x
(b) NAPLAN mean scale scores for Numeracy
Year 3 396.9 401.8 ��
Year 5 485.8 487.6 ��
Year 7 542.1 545.9 ��
Year 9 583.6 587.8 ��
6. Student achievement:National Assessment Program – Information and Communication Technology Literacy
Proportion of students achieving at or above the proficient standard in ICT Literacy:
Year 6—Level 3 62.0% (2011) 55.0% �y
Year 10—Level 4 65.0% (2011) 52.0% �y7. Student attainment
(a) Proportion of the 20 to 24-year-old population having attained at least Year 12 or equivalent or AQF Certificate II or above
86.7% 86.1% ��
(b) Proportion of the 20 to 24-year-old population having attained at least Year 12 or equivalent or AQF Certificate III or above
85.7% 84.9% ��
��
��
10
National Report on Schooling in Australia 2014
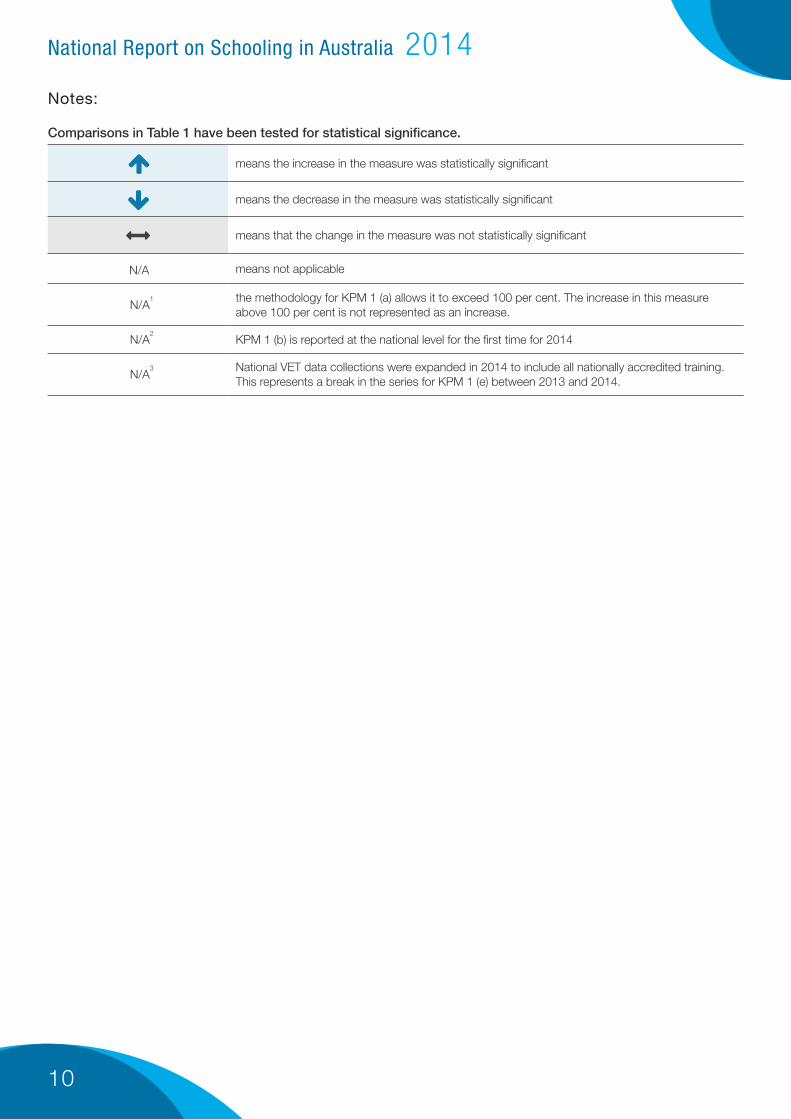
Notes:
Comparisons in Table 1 have been tested for statistical significance.
�x means the increase in the measure was statistically significant
�y means the decrease in the measure was statistically significant
�� means that the change in the measure was not statistically significant
N/A0 means not applicable
N/A1 the methodology for KPM 1 (a) allows it to exceed 100 per cent. The increase in this measure
above 100 per cent is not represented as an increase.
N/A2
KPM 1 (b) is reported at the national level for the first time for 2014
N/A3 National VET data collections were expanded in 2014 to include all nationally accredited training.
This represents a break in the series for KPM 1 (e) between 2013 and 2014.
Schools and schooling
Part 1

12
National Report on Schooling in Australia 2014
Part 1: Schools and schooling
Part 1 provides information on the status of Australian schooling in 2014, including school, student and teacher numbers, school structures and funds used for school education.
Part 1.1 – School numbers
In 2014 there were 9,389 schools in Australia.4 This total included primary, secondary, combined (primary and secondary) and special schools, across government and non-government school sectors. (See Part 4: Glossary for definitions of school levels, types and sectors.)
4 As at the National Schools Statistics Collection (NSSC) census, August 2014.
5 Independent public schools established in Western Australia and Queensland are counted as government schools in the NSSC and in this report.
Of the total number of schools, 71 per cent were
administered by state and territory governments, 18
per cent identified as having Catholic affiliation, and
11 per cent were classified as independent.
Most independent schools are affiliated with religious denominations or promote a particular educational philosophy5.
The number and proportion of schools by school type and school sector in 2014 are shown in table 1.1. The proportion of schools by school sector in 2014 is illustrated in figure 1.1.

13
National Report on Schooling in Australia 2014
Number and proportion of schools by school type and school sector, Australia, 2014
Table 1.1
Government Non-government All schools
Government Catholic Independent Total
Australia No. % No. % No. % No. % No. %
Primary 4,799 76.8 1,229 19.7 222 3.6 1,451 23.2 6,250 66.6
Secondary 1,022 74.1 304 22.0 53 3.8 357 25.9 1,379 14.7
Combined 500 37.7 156 11.8 669 50.5 825 62.3 1,325 14.1
Special 330 75.9 33 7.6 72 16.6 105 24.1 435 4.6
Total 6,651 70.8 1,722 18.3 1,016 10.8 2,738 29.2 9,389 100.0
Notes:
Primary education comprises a pre-Year 1 grade followed by Years 1–6 in New South Wales (NSW), Victoria (Vic.), Tasmania (Tas.), Northern Territory (NT) and Australian Capital Territory (ACT). In Queensland (Qld), South Australia (SA) and Western Australia (WA), primary education comprises a pre-Year 1 grade followed by Years 1–7.
Percentage columns for each sector show the proportion of schools of each type in that sector. The total row shows the number and proportion of all schools in each sector. The total percentage column shows the overall proportions of schools of each type. Percentages may not add to 100 due to rounding.
Source: ABS, Cat. No. 4221.0, Schools, Australia, 2014.
See also National Report on Schooling Data Portal.
Proportion of schools by school sector, Australia, 2014
Figure 1.1
Source: ABS, Cat. No. 4221.0, Schools, Australia, 2014
Independent
Catholic
Government
71%
18%
11%

14
National Report on Schooling in Australia 2014
The total number of schools by state and territory in 2014 is shown in table 1.2.
State/territory
School type NSW Vic. Qld SA WA Tas. NT ACT Australia
Primary 2,110 1,549 1,140 464 673 156 79 79 6,250
Secondary 514 335 254 83 105 41 23 24 1,379
Combined 302 234 253 153 223 55 83 22 1,325
Special 157 99 68 21 75 5 5 5 435
Total 3,083 2,217 1,715 721 1,076 257 190 130 9,389
Notes:
Source: ABS Cat. No. 4221.0, Schools, Australia, 2014
See also National Report on Schooling data portal.
The number of schools in each state and territory is largely determined by the size and geographical distribution of the school-aged population in each jurisdiction.
For the number of schools by school type and school sector by state and territory 2014, see the National Report on Schooling data portal.
The total number of schools in Australia fell from 9,393 in 2013 to 9,389 in 2014. There
was a net fall of 79 (0.8 per cent) in the total number of schools over the period 2010–2014. This resulted from falls of 1.4 per cent in the number of government schools and 0.1 per cent in the number of independent schools, partially offset by a rise of 0.8 per cent in the number of Catholic schools. The number and proportion of schools in the three school sectors within this period are shown in table 1.3.
Number of schools by school type and state and territory , Australia, 2014
Table 1.2
15
National Report on Schooling in Australia 2014
Number and proportion of schools by school sector, Australia, 2010-14
Table 1.3
Government Catholic Independent Total
No. % No. % No. % No.
2010 6,743 71.2 1,708 18.0 1,017 10.7 9,468
2011 6,705 71.1 1,710 18.1 1,020 10.8 9,435
2012 6,697 71.0 1,713 18.2 1,017 10.8 9,427
2013 6,661 70.9 1,717 18.3 1,015 10.8 9,393
2014 6,651 70.8 1,722 18.3 1,016 10.8 9,389
Notes:
Percentages may not add to 100 due to rounding.
Source: ABS Cat. No. 4221.0, Schools, Australia, 2014
See also National Report on Schooling Data Portal.
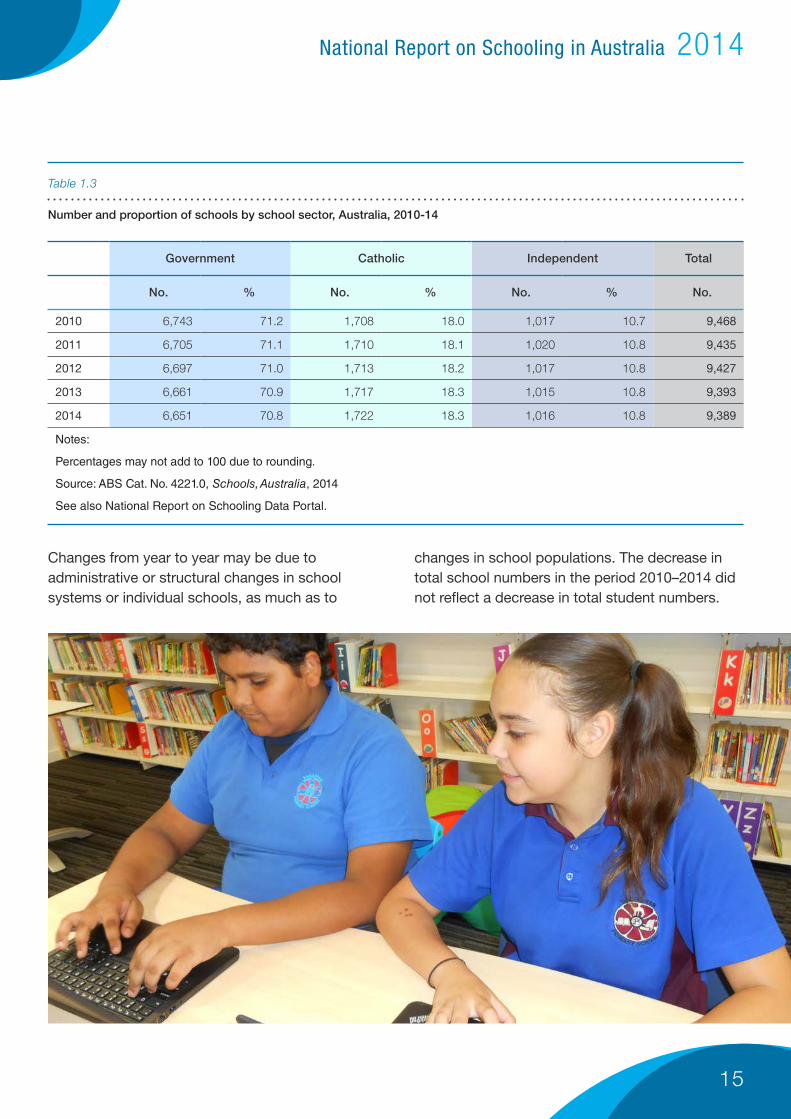
Changes from year to year may be due to administrative or structural changes in school systems or individual schools, as much as to
changes in school populations. The decrease in total school numbers in the period 2010–2014 did not reflect a decrease in total student numbers.
16
National Report on Schooling in Australia 2014
Part 1.2 – Student numbers
Enrolments by school level and sector
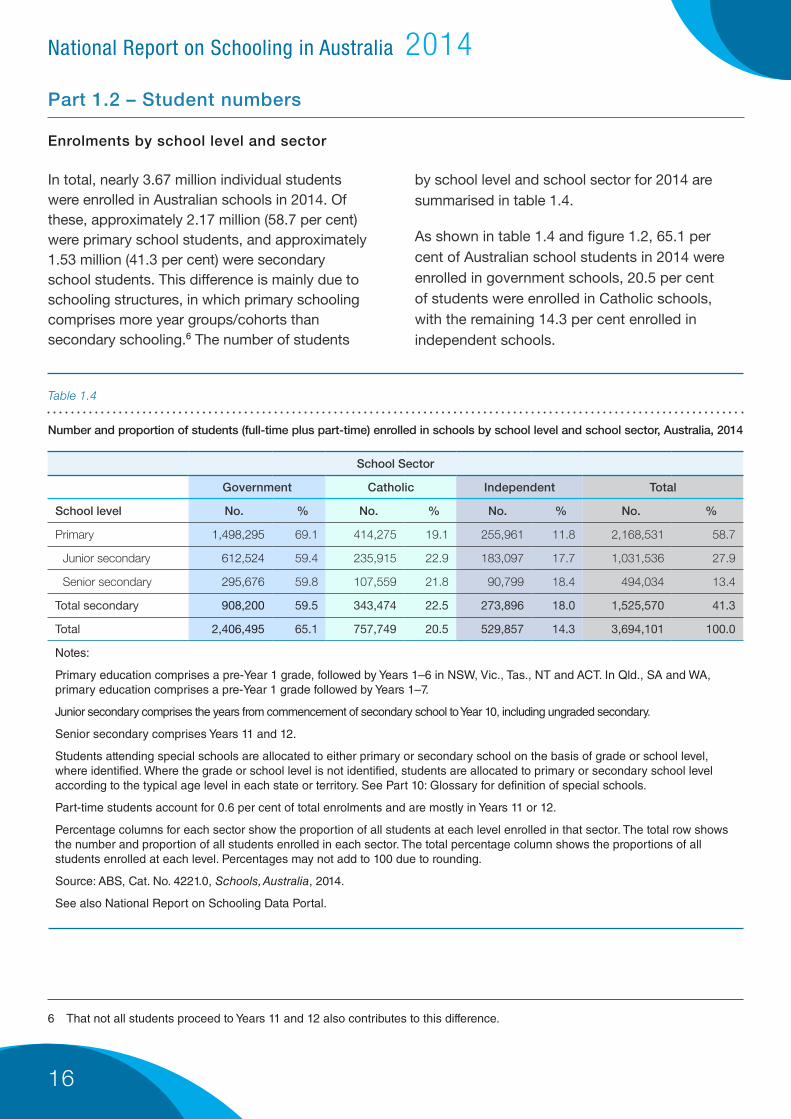
In total, nearly 3.67 million individual students were enrolled in Australian schools in 2014. Of these, approximately 2.17 million (58.7 per cent) were primary school students, and approximately 1.53 million (41.3 per cent) were secondary school students. This difference is mainly due to schooling structures, in which primary schooling comprises more year groups/cohorts than secondary schooling.6 The number of students
by school level and school sector for 2014 are summarised in table 1.4.
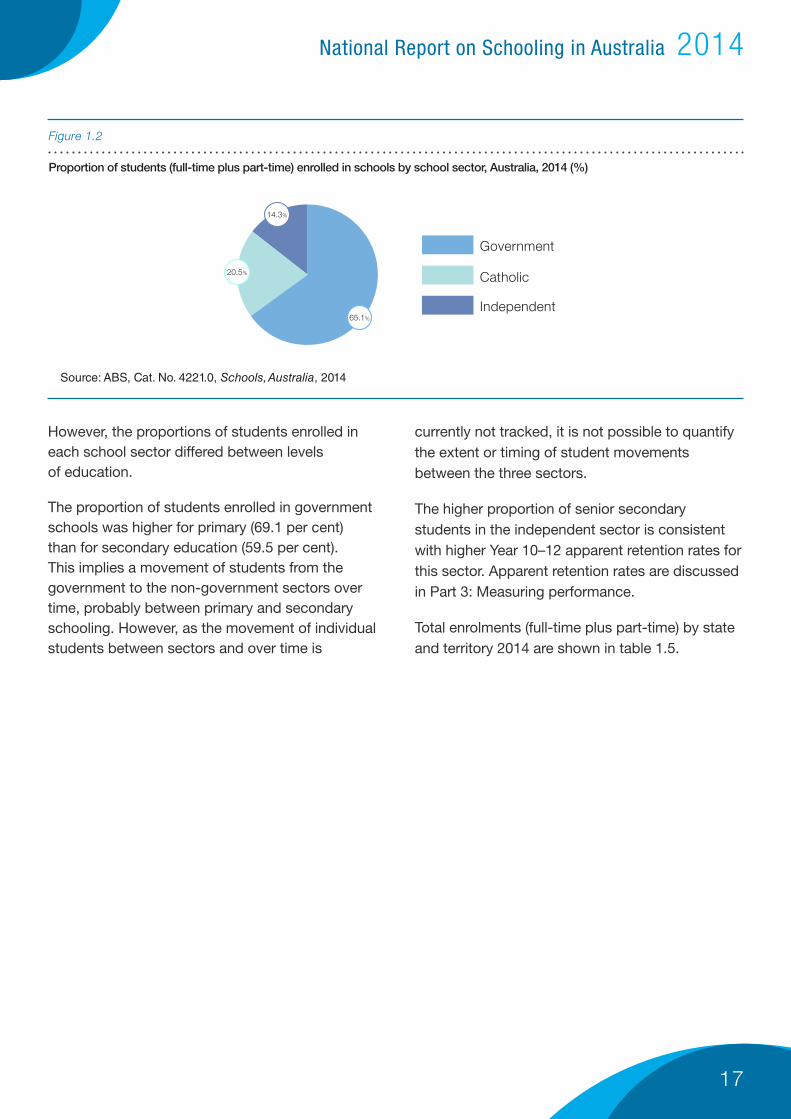
As shown in table 1.4 and figure 1.2, 65.1 per cent of Australian school students in 2014 were enrolled in government schools, 20.5 per cent of students were enrolled in Catholic schools, with the remaining 14.3 per cent enrolled in independent schools.
6 That not all students proceed to Years 11 and 12 also contributes to this difference.
Number and proportion of students (full-time plus part-time) enrolled in schools by school level and school sector, Australia, 2014
Table 1.4
School Sector
Government Catholic Independent Total
School level No. % No. % No. % No. %
Primary 1,498,295 69.1 414,275 19.1 255,961 11.8 2,168,531 58.7
Junior secondary 612,524 59.4 235,915 22.9 183,097 17.7 1,031,536 27.9
Senior secondary 295,676 59.8 107,559 21.8 90,799 18.4 494,034 13.4
Total secondary 908,200 59.5 343,474 22.5 273,896 18.0 1,525,570 41.3
Total 2,406,495 65.1 757,749 20.5 529,857 14.3 3,694,101 100.0
Notes:
Primary education comprises a pre-Year 1 grade, followed by Years 1–6 in NSW, Vic., Tas., NT and ACT. In Qld., SA and WA, primary education comprises a pre-Year 1 grade followed by Years 1–7.
Junior secondary comprises the years from commencement of secondary school to Year 10, including ungraded secondary.
Senior secondary comprises Years 11 and 12.
Students attending special schools are allocated to either primary or secondary school on the basis of grade or school level, where identified. Where the grade or school level is not identified, students are allocated to primary or secondary school level according to the typical age level in each state or territory. See Part 10: Glossary for definition of special schools.
Part-time students account for 0.6 per cent of total enrolments and are mostly in Years 11 or 12.
Percentage columns for each sector show the proportion of all students at each level enrolled in that sector. The total row shows the number and proportion of all students enrolled in each sector. The total percentage column shows the proportions of all students enrolled at each level. Percentages may not add to 100 due to rounding.
Source: ABS, Cat. No. 4221.0, Schools, Australia, 2014.
See also National Report on Schooling Data Portal.
17
National Report on Schooling in Australia 2014
However, the proportions of students enrolled in each school sector differed between levels of education.
The proportion of students enrolled in government schools was higher for primary (69.1 per cent) than for secondary education (59.5 per cent). This implies a movement of students from the government to the non-government sectors over time, probably between primary and secondary schooling. However, as the movement of individual students between sectors and over time is
currently not tracked, it is not possible to quantify the extent or timing of student movements between the three sectors.
The higher proportion of senior secondary students in the independent sector is consistent with higher Year 10–12 apparent retention rates for this sector. Apparent retention rates are discussed in Part 3: Measuring performance.
Total enrolments (full-time plus part-time) by state and territory 2014 are shown in table 1.5.
Proportion of students (full-time plus part-time) enrolled in schools by school sector, Australia, 2014 (%)
Figure 1.2
Source: ABS, Cat. No. 4221.0, Schools, Australia, 2014
Independent
Catholic
Government
14.3%
20.5%
65.1%
18
National Report on Schooling in Australia 2014
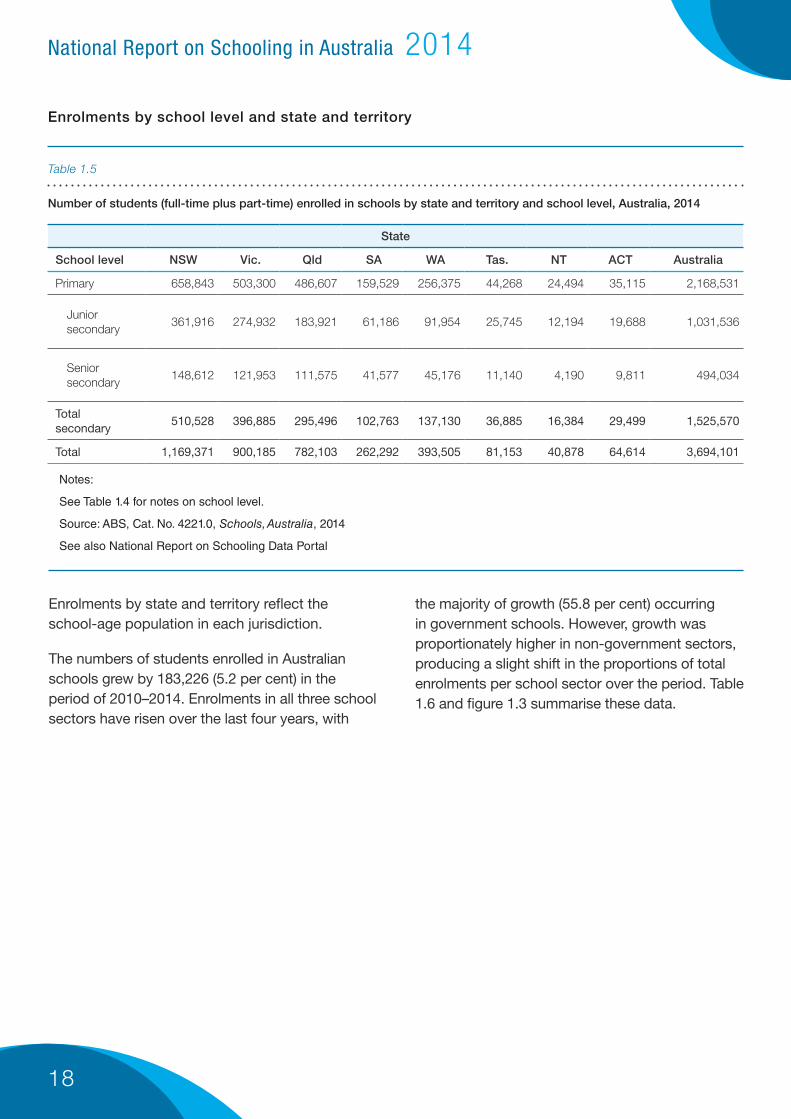
Enrolments by school level and state and territory
Number of students (full-time plus part-time) enrolled in schools by state and territory and school level, Australia, 2014
Table 1.5
State
School level NSW Vic. Qld SA WA Tas. NT ACT Australia
Primary 658,843 503,300 486,607 159,529 256,375 44,268 24,494 35,115 2,168,531
Junior secondary
361,916 274,932 183,921 61,186 91,954 25,745 12,194 19,688 1,031,536
Senior secondary
148,612 121,953 111,575 41,577 45,176 11,140 4,190 9,811 494,034
Total secondary
510,528 396,885 295,496 102,763 137,130 36,885 16,384 29,499 1,525,570
Total 1,169,371 900,185 782,103 262,292 393,505 81,153 40,878 64,614 3,694,101
Notes:
See Table 1.4 for notes on school level.
Source: ABS, Cat. No. 4221.0, Schools, Australia, 2014
See also National Report on Schooling Data Portal
Enrolments by state and territory reflect the school-age population in each jurisdiction.
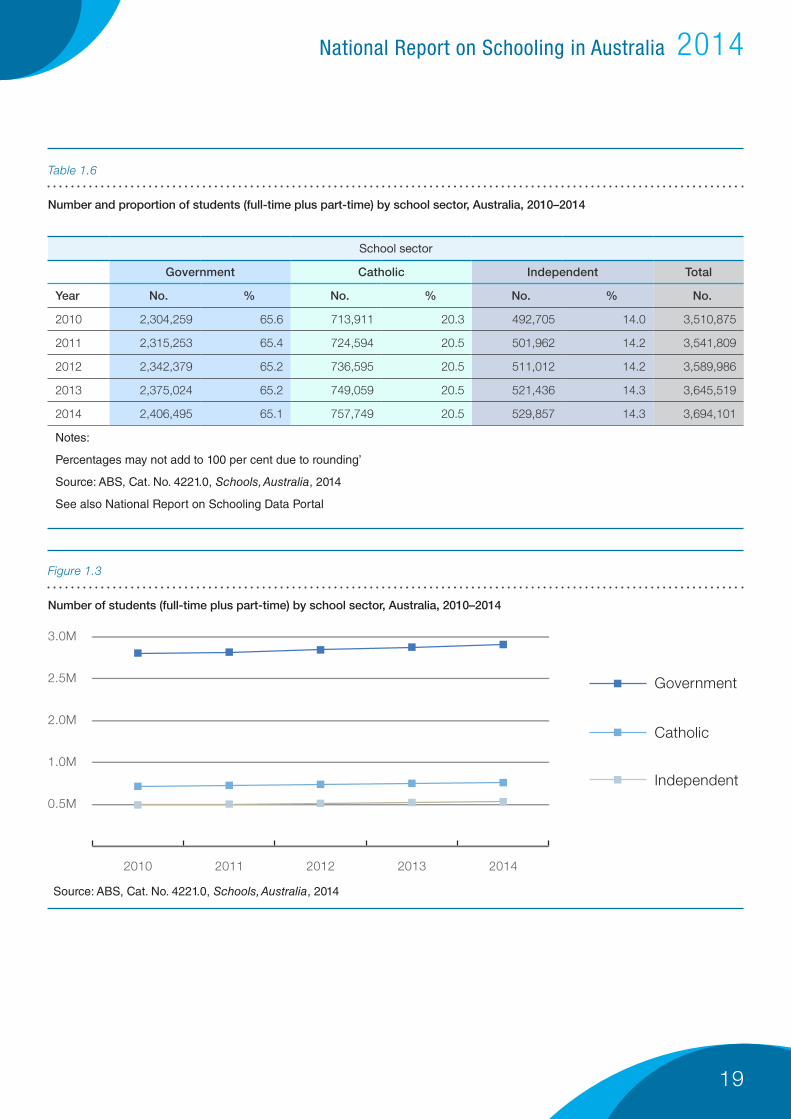
The numbers of students enrolled in Australian schools grew by 183,226 (5.2 per cent) in the period of 2010–2014. Enrolments in all three school sectors have risen over the last four years, with
the majority of growth (55.8 per cent) occurring in government schools. However, growth was proportionately higher in non-government sectors, producing a slight shift in the proportions of total enrolments per school sector over the period. Table 1.6 and figure 1.3 summarise these data.
19
National Report on Schooling in Australia 2014
Number and proportion of students (full-time plus part-time) by school sector, Australia, 2010–2014
Number of students (full-time plus part-time) by school sector, Australia, 2010–2014
Table 1.6
Figure 1.3
School sector
Government Catholic Independent Total
Year No. % No. % No. % No.
2010 2,304,259 65.6 713,911 20.3 492,705 14.0 3,510,875
2011 2,315,253 65.4 724,594 20.5 501,962 14.2 3,541,809
2012 2,342,379 65.2 736,595 20.5 511,012 14.2 3,589,986
2013 2,375,024 65.2 749,059 20.5 521,436 14.3 3,645,519
2014 2,406,495 65.1 757,749 20.5 529,857 14.3 3,694,101
Notes:
Percentages may not add to 100 per cent due to rounding’
Source: ABS, Cat. No. 4221.0, Schools, Australia, 2014
See also National Report on Schooling Data Portal
Source: ABS, Cat. No. 4221.0, Schools, Australia, 2014
0.5M
1.0M
2.0M
2.5M
3.0M
Government
Catholic
Independent
20142013201220112010

20
National Report on Schooling in Australia 2014
Aboriginal and Torres Strait Islander students
Aboriginal and Torres Strait Islander (Indigenous)7 students make up 5.2 per cent of the total school population. Table 1.7 shows the number of Indigenous students by school level and sector.
Compared to total enrolments (table 1.4), Indigenous students are more concentrated in government schools, especially at primary level. Indigenous students are under-represented in senior secondary years, with 9.1 per cent of Indigenous students enrolled in Years 11 and 12 compared to 13.4 per cent of all students. This reflects lower Year 10–12 apparent retention rates amongst Aboriginal
and Torres Strait Islander students compared to the overall school population.8
Aboriginal and Torres Strait Islander students are not evenly or proportionately distributed among states and territories.
With 61,085 Indigenous students, NSW has the both the highest number of Indigenous enrolments and the highest proportion (31.7 per cent) of the national total. This corresponds to that state’s share of total enrolments nationally and represents 5.2 per cent of the state’s students, the same as the national average.
Number and proportion of Indigenous students (full-time and part-time) enrolled in schools by school level and sector,
Australia, 2014
Table 1.7
School Sector
Government Catholic Independent Total
School level No. % No. % No. % No. %
Primary 105,416 87.0 11,260 9.3 4,448 3.7 121,124 62.9
Junior secondary
42,167 80.1 6,358 12.1 4,089 7.8 52,614 27.3
Senior secondary
14,554 77.6 2,394 12.8 1,799 9.6 18,747 9.7
Total secondary 56,721 79.5 8,752 12.3 5,888 8.3 71,361 37.1
Total 162,137 84.2 20,012 10.4 10,336 5.4 192,485 100
Notes:
See table 1.4 for notes on school level.
Percentage columns for each sector show the proportion of Indigenous students at each level enrolled in that sector. The total row shows the number and proportion of all Indigenous students enrolled in each sector. The total percentage column shows the proportions of all students enrolled at each level. Percentages may not add to 100 due to rounding.
Source: ABS, Cat. No. 4221.0, Schools, Australia, 2014.
See also National Report on Schooling Data Portal
7 The Melbourne Declaration and national data collections use the term ‘Indigenous’ to refer to Australia’s Aboriginal and Torres Strait Islander peoples. Where possible, this report uses ‘Aboriginal and Torres Strait Islander’ in preference to ‘Indigenous’.
8 Apparent retention rates are discussed in Part 3: Measuring and reporting performance.

21
National Report on Schooling in Australia 2014
Number and proportion of Indigenous students (full-time plus part-time) enrolled in schools by school level and state and
territory, Australia, 2014
Table 1.8
State/territory
School level NSW Vic. Qld SA WA Tas. NT ACT Australia
Primary (No.)
36,114 7,688 37,723 7,020 17,637 3,643 10,322 977 121,124
Secondary (No.) 24,971 5,331 19,751 4,006 7,594 2,764 6,227 717 71,361
Total (No.) 61,085 13,019 57,474 11,026 25,231 6,407 16,549 1,694 192,485
Proportion of indigenous students per state (%)
31.7 6.8 29.9 5.7 13.1 3.3 8.6 0.9 100
Proportion of total enrolments (%)
5.2 1.4 7.3 4.2 6.4 7.9 40.5 2.6 5.2
Source: ABS, Cat. No. 4221.0, Schools, Australia, 2014.
See also National Report on schooling Data Portal.
Victoria, with 24.4 per cent of all school students, has 6.8 per cent of all Indigenous students, representing 1.4 per cent of students in that state. Western Australia, with 10.7 per cent of total enrolments Australia-wide, accounts for 13.1 per cent of Indigenous enrolments.
The highest concentration of Aboriginal and Torres Strait Islander students is in the Northern Territory, which accounts for only 1.1 per cent of total school enrolments, but for 8.6 per cent of Indigenous enrolments. The 16,549 Indigenous
students enrolled in Northern Territory schools make up 40.5 per cent of the school population. As such, data on Indigenous students have a much greater effect on overall statistics (including performance measures) for the Northern Territory than for any other state or territory.
More detailed data on full-time, part-time and full-time equivalent (FTE) enrolments by state and territory and school sector, Indigenous status and sex, are available in the National Report on Schooling Data Portal.
22
National Report on Schooling in Australia 2014
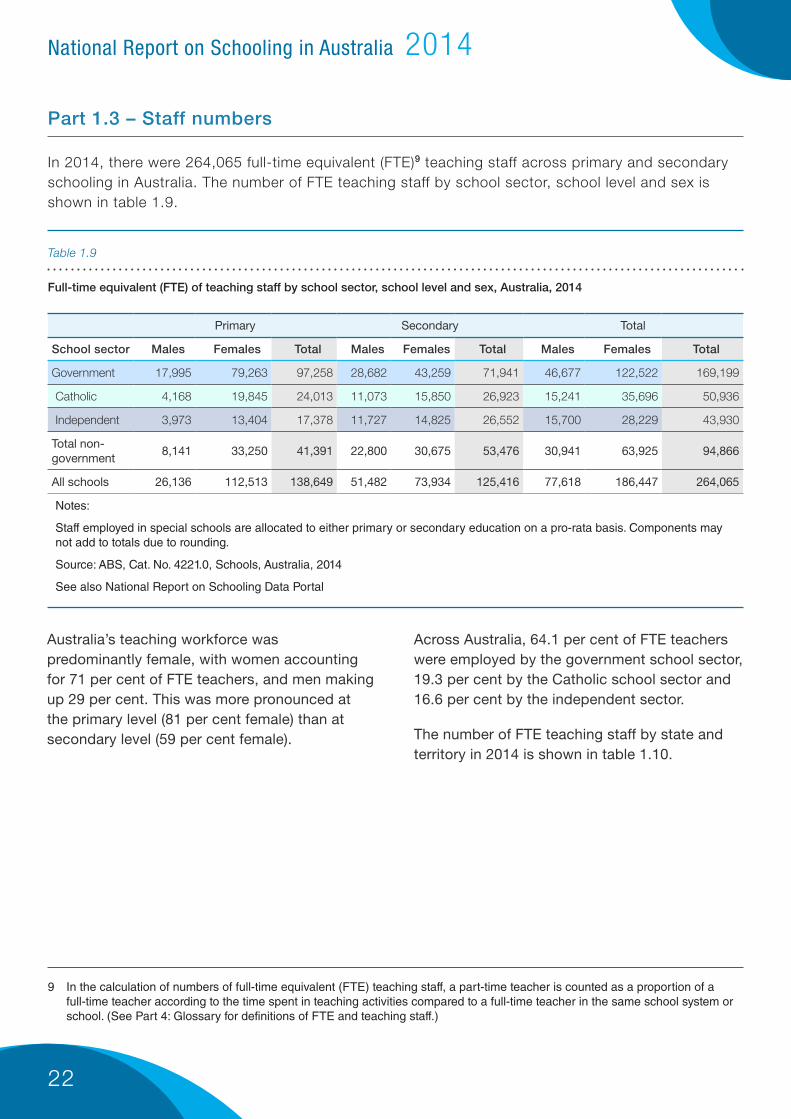
Australia’s teaching workforce was predominantly female, with women accounting for 71 per cent of FTE teachers, and men making up 29 per cent. This was more pronounced at the primary level (81 per cent female) than at secondary level (59 per cent female).
Across Australia, 64.1 per cent of FTE teachers were employed by the government school sector, 19.3 per cent by the Catholic school sector and 16.6 per cent by the independent sector.
The number of FTE teaching staff by state and territory in 2014 is shown in table 1.10.
Part 1.3 – Staff numbers
In 2014, there were 264,065 full-time equivalent (FTE)9 teaching staff across primary and secondary schooling in Australia. The number of FTE teaching staff by school sector, school level and sex is shown in table 1.9.
Full-time equivalent (FTE) of teaching staff by school sector, school level and sex, Australia, 2014
Table 1.9
9 In the calculation of numbers of full-time equivalent (FTE) teaching staff, a part-time teacher is counted as a proportion of a full-time teacher according to the time spent in teaching activities compared to a full-time teacher in the same school system or school. (See Part 4: Glossary for definitions of FTE and teaching staff.)
Primary Secondary Total
School sector Males Females Total Males Females Total Males Females Total
Government 17,995 79,263 97,258 28,682 43,259 71,941 46,677 122,522 169,199
Catholic 4,168 19,845 24,013 11,073 15,850 26,923 15,241 35,696 50,936
Independent 3,973 13,404 17,378 11,727 14,825 26,552 15,700 28,229 43,930
Total non-government
8,141 33,250 41,391 22,800 30,675 53,476 30,941 63,925 94,866
All schools 26,136 112,513 138,649 51,482 73,934 125,416 77,618 186,447 264,065
Notes:
Staff employed in special schools are allocated to either primary or secondary education on a pro-rata basis. Components may not add to totals due to rounding.
Source: ABS, Cat. No. 4221.0, Schools, Australia, 2014
See also National Report on Schooling Data Portal

23
National Report on Schooling in Australia 2014
Full-time equivalent (FTE) of teaching staff by state and school type, Australia, 2014
Full-time equivalent (FTE) of teaching staff by school sector, Australia, 2010–2014
Table 1.10
Table 1.11
State/territory
NSW Vic. Qld SA WA Tas. NT ACT Australia
Primary 41,388 33,408 30,469 10,454 15,654 2,925 1,914 2,438 138,649
Secondary 41,872 33,372 23,655 8,118 11,594 2,916 1,462 2,427 125,416
Total 83,259 66,780 54,124 18,572 27,248 5,841 3,376 4,865 264,065
Notes:
Source: ABS, Cat. No. 4221.0, Schools, Australia, 2014
See also National Report on Schooling Data Portal
Between 2010 and 2014, the total number of FTE teaching staff grew by 12,643 or 5.0 per cent. This was commensurate with the growth in student enrolments.
Sector 2010 2011 2012 2013 2014
Government 163,697 165,272 167,152 167,903 169,199
Catholic 47,391 48,393 49,427 50,527 50,936
Independent 40,333 41,445 42,407 43,154 43,930
Total non-government 87,724 89,838 91,834 93,682 94,866
All schools 251,422 255,110 258,986 261,585 264,065
Notes:
Source: ABS, Cat. No. 4221.0, Schools, Australia, 2014
See also National Report on Schooling Data Portal
24
National Report on Schooling in Australia 2014
Sector Primary Secondary All schools
Government 15.4 12.5 14.2
Non-government 16.2 11.5 13.6
Catholic 17.2 12.8 14.9
Independent 14.7 10.3 12.1
All schools 15.6 12.1 13.9
Notes:
Source: ABS, Cat. No. 4221.0, Schools, Australia, 2014
See also National Report on Schooling Data Portal
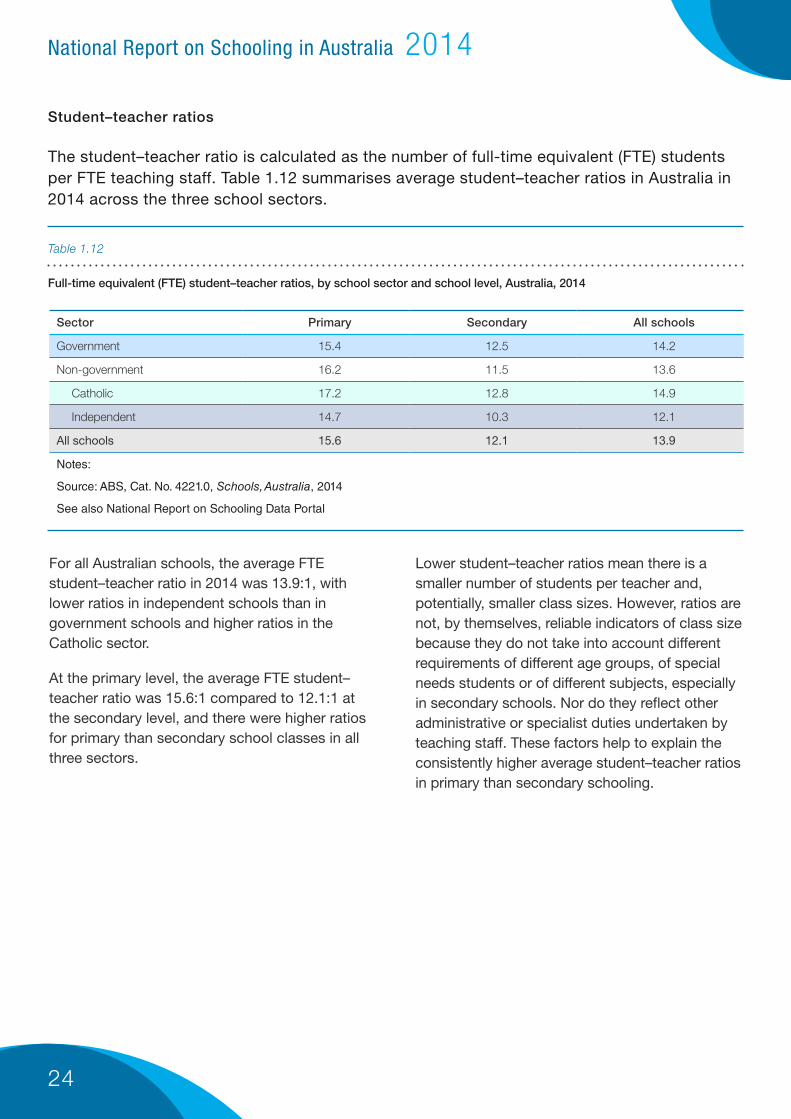
Student–teacher ratios
The student–teacher ratio is calculated as the number of full-time equivalent (FTE) students per FTE teaching staff. Table 1.12 summarises average student–teacher ratios in Australia in 2014 across the three school sectors.
Full-time equivalent (FTE) student–teacher ratios, by school sector and school level, Australia, 2014
Table 1.12
For all Australian schools, the average FTE student–teacher ratio in 2014 was 13.9:1, with lower ratios in independent schools than in government schools and higher ratios in the Catholic sector.
At the primary level, the average FTE student–teacher ratio was 15.6:1 compared to 12.1:1 at the secondary level, and there were higher ratios for primary than secondary school classes in all three sectors.
Lower student–teacher ratios mean there is a smaller number of students per teacher and, potentially, smaller class sizes. However, ratios are not, by themselves, reliable indicators of class size because they do not take into account different requirements of different age groups, of special needs students or of different subjects, especially in secondary schools. Nor do they reflect other administrative or specialist duties undertaken by teaching staff. These factors help to explain the consistently higher average student–teacher ratios in primary than secondary schooling.
25
National Report on Schooling in Australia 2014
Part 1.4 – School structures
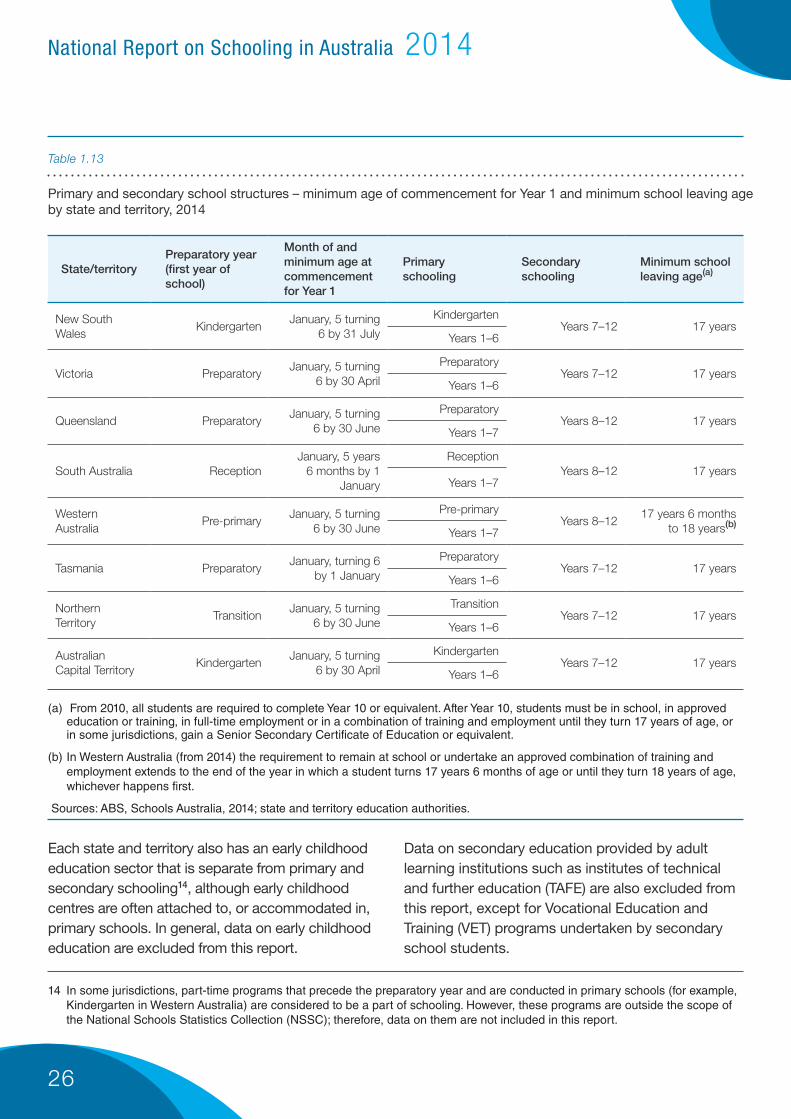
Differences between Australian states and territories in school structures and in age requirements for student enrolment have been substantially reduced in recent years. School structures and age requirements are summarised in table 1.13.
In New South Wales, Victoria, Tasmania, the Northern Territory and the Australian Capital Territory, primary education consists of a preparatory year followed by Years 1–6. Secondary education consists of Years 7–12. In Queensland, South Australia and Western Australia, primary education consists of a preparatory year followed by Years 1–7, and secondary education consists of Years 8–12.10 The preparatory year has different names in the various jurisdictions.11
The age at which schooling becomes compulsory is six years in most states and territories; in Western Australia and Tasmania it is five years. In practice, most children start the preparatory year of primary school at between four and a half and five and a half years.
All states and territories require young people to participate in schooling until they complete Year 10 and to participate full time in education, training or employment, or a combination of these activities, until at least the age of 17.12
Figure 1.13 summarises school structures and requirements for school enrolment by jurisdiction.
Within the overall structure of primary and secondary education, there is further variation. Individual schools may be primary only, secondary only or combined primary and secondary. Secondary schools may accommodate the full age range of secondary students or be divided into junior and senior campuses (sometimes known as ‘senior colleges’).
There are both government and non-government special schools for students with disabilities and other special needs. In some states and territories, many students with special needs are integrated into mainstream schools. (See Part 4: Glossary for definition of special schools).
Students who are geographically isolated, or who are otherwise unable to attend a local school, may study through distance education schools or centres. Boarding facilities are available at some schools, mainly in the non-government sectors13.
10 From 2015 Year 7 will become the first year of secondary school in Queensland and Western Australia. Year 7 enrolments in these states are counted as primary enrolments in this report.
11 These are listed in table 1.13. The Australian Curriculum uses the term ‘Foundation’ for this year of schooling.
12 Up until 2010, the minimum school leaving age in most jurisdictions was 15 or 16. In 2010, the National Youth Participation Requirement, agreed by the Council of Australian Governments (COAG), came into effect across all states and territories, effectively lengthening the period of compulsory education. From 2014, the age requirement in Western Australia was lifted to ‘until the end of the year in which the child reaches the age of 17 years and 6 months or the child reaches the age of 18, whichever happens first’.
13 Students of compulsory school age may also be home-schooled if they have met the criteria set down by the relevant state or, in some jurisdictions, territory education authority. However, as these students are not enrolled in a school, they are outside the scope of the National Schools Statistics Collection (NSSC); therefore, data on them are not included in this report.
26
National Report on Schooling in Australia 2014
State/territoryPreparatory year (first year of school)
Month of and minimum age at commencement for Year 1
Primary schooling
Secondary schooling
Minimum school leaving age(a)
New South Wales
KindergartenJanuary, 5 turning
6 by 31 July
KindergartenYears 7–12 17 years
Years 1–6
Victoria PreparatoryJanuary, 5 turning
6 by 30 April
PreparatoryYears 7–12 17 years
Years 1–6
Queensland PreparatoryJanuary, 5 turning
6 by 30 June
PreparatoryYears 8–12 17 years
Years 1–7
South Australia ReceptionJanuary, 5 years
6 months by 1 January
ReceptionYears 8–12 17 years
Years 1–7
Western Australia
Pre-primaryJanuary, 5 turning
6 by 30 June
Pre-primaryYears 8–12
17 years 6 months to 18 years(b)
Years 1–7
Tasmania PreparatoryJanuary, turning 6
by 1 January
PreparatoryYears 7–12 17 years
Years 1–6
Northern Territory
TransitionJanuary, 5 turning
6 by 30 June
TransitionYears 7–12 17 years
Years 1–6
Australian Capital Territory
KindergartenJanuary, 5 turning
6 by 30 April
KindergartenYears 7–12 17 years
Years 1–6
(a) From 2010, all students are required to complete Year 10 or equivalent. After Year 10, students must be in school, in approved education or training, in full-time employment or in a combination of training and employment until they turn 17 years of age, or in some jurisdictions, gain a Senior Secondary Certificate of Education or equivalent.
(b) In Western Australia (from 2014) the requirement to remain at school or undertake an approved combination of training and employment extends to the end of the year in which a student turns 17 years 6 months of age or until they turn 18 years of age, whichever happens first.
Sources: ABS, Schools Australia, 2014; state and territory education authorities.
Primary and secondary school structures – minimum age of commencement for Year 1 and minimum school leaving age by state and territory, 2014
Table 1.13
Each state and territory also has an early childhood education sector that is separate from primary and secondary schooling14, although early childhood centres are often attached to, or accommodated in, primary schools. In general, data on early childhood education are excluded from this report.
Data on secondary education provided by adult learning institutions such as institutes of technical and further education (TAFE) are also excluded from this report, except for Vocational Education and Training (VET) programs undertaken by secondary school students.
14 In some jurisdictions, part-time programs that precede the preparatory year and are conducted in primary schools (for example, Kindergarten in Western Australia) are considered to be a part of schooling. However, these programs are outside the scope of the National Schools Statistics Collection (NSSC); therefore, data on them are not included in this report.

27
National Report on Schooling in Australia 2014
15 The cost per full-time equivalent student derived from these financial year figures uses the average of the full-time equivalent student numbers for the 2013 and 2014 calendar years.
Part 1.5 – School funding
1.5.0 Overview
Part 1.5 provides information on five main areas:
1. funding arrangements
2. funding for government schools
3. funding for non-government schools
4. capital expenditure
5. My School financial information for the 2013 calendar year.
The first four sections provide an outline of government (state/territory and Australian government) funding arrangements for both government and non-government schools.
In line with state and territory government budgets, government school funding is historically reported on a financial year basis. The financial year reported is the period 1 July 2013 to 30 June 2014. This is referred to as 2014 funding in this part of the report.
Non-government school funding is reported on a calendar year basis and reflects funding and expenditure for the 2014 calendar year except for data sourced from the Report on Government Services (ROGS), which are calculated for the 2013–14 financial year15.
The final section of this part of the report provides high-level profiles of recurrent funding information for the 2013 calendar year published for individual schools on the My School website. These data were released at the same time (March 2015) as My School non-finance data for the 2014 school year. Due to reporting timeframes, My School calendar year finance data will always lag by one year relative to most My School non-finance data.
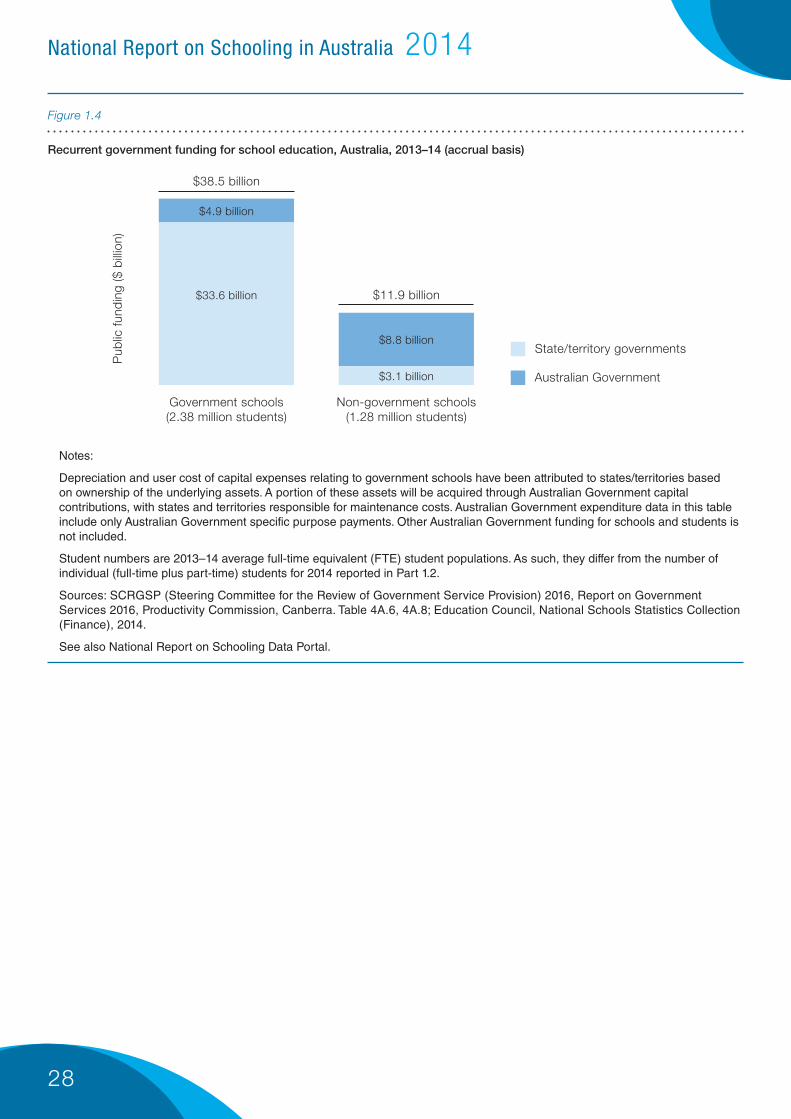
Australian and state and territory government recurrent expenditure on school education in Australia for 2014 was $50.4 billion. Of this amount, $36.7 billion (72.8 per cent) was provided through state and territory budgets, and $13.7 billion (27.2 per cent) was provided
through the Australian Government budget. The majority of state and territory funds was applied to government schools; the majority of Australian Government funds was applied to non-government schools. This is illustrated in figure 1.4.
28
National Report on Schooling in Australia 2014
Recurrent government funding for school education, Australia, 2013–14 (accrual basis)
Figure 1.4
Notes:
Depreciation and user cost of capital expenses relating to government schools have been attributed to states/territories based on ownership of the underlying assets. A portion of these assets will be acquired through Australian Government capital contributions, with states and territories responsible for maintenance costs. Australian Government expenditure data in this table include only Australian Government specific purpose payments. Other Australian Government funding for schools and students is not included.
Student numbers are 2013–14 average full-time equivalent (FTE) student populations. As such, they differ from the number of individual (full-time plus part-time) students for 2014 reported in Part 1.2.
Sources: SCRGSP (Steering Committee for the Review of Government Service Provision) 2016, Report on Government Services 2016, Productivity Commission, Canberra. Table 4A.6, 4A.8; Education Council, National Schools Statistics Collection (Finance), 2014.
See also National Report on Schooling Data Portal.
Australian Government
State/territory governments
Government schools(2.38 million students)
$38.5 billion
$11.9 billion
Pub
lic fu
ndin
g ($
bill
ion)
$33.6 billion
$3.1 billion
$4.9 billion
$8.8 billion
Non-government schools(1.28 million students)
29
National Report on Schooling in Australia 2014
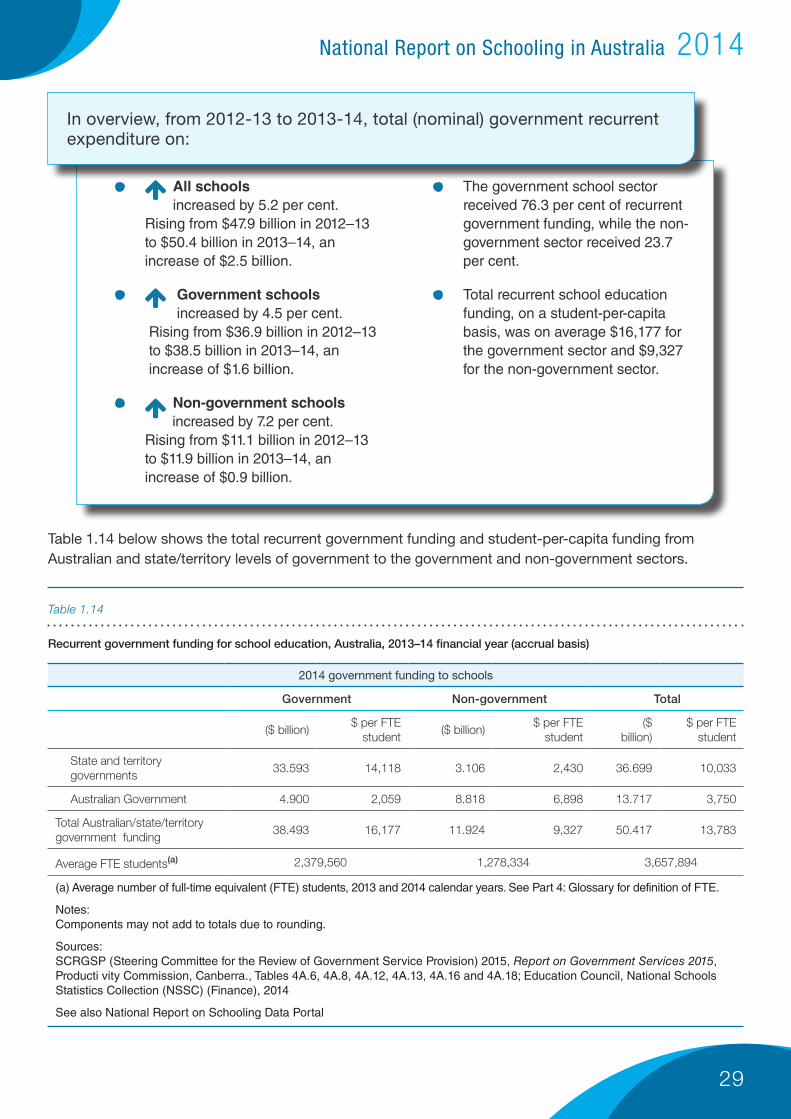
• All schools increased by 5.2 per cent. Rising from $47.9 billion in 2012–13 to $50.4 billion in 2013–14, an increase of $2.5 billion.
• Government schools increased by 4.5 per cent. Rising from $36.9 billion in 2012–13 to $38.5 billion in 2013–14, an increase of $1.6 billion.
• Non-government schools increased by 7.2 per cent. Rising from $11.1 billion in 2012–13 to $11.9 billion in 2013–14, an increase of $0.9 billion.
• The government school sector received 76.3 per cent of recurrent government funding, while the non-government sector received 23.7 per cent.
• Total recurrent school education funding, on a student-per-capita basis, was on average $16,177 for the government sector and $9,327 for the non-government sector.
In overview, from 2012-13 to 2013-14, total (nominal) government recurrent expenditure on:
�x
�x
�x
Table 1.14 below shows the total recurrent government funding and student-per-capita funding from Australian and state/territory levels of government to the government and non-government sectors.
Recurrent government funding for school education, Australia, 2013–14 financial year (accrual basis)
Table 1.14
2014 government funding to schools
Government Non-government Total
($ billion)$ per FTE
student($ billion)
$ per FTE student
($ billion)
$ per FTE student
State and territory governments
33.593 14,118 3.106 2,430 36.699 10,033
Australian Government 4.900 2,059 8.818 6,898 13.717 3,750
Total Australian/state/territory government funding
38.493 16,177 11.924 9,327 50.417 13,783
Average FTE students(a) 2,379,560 1,278,334 3,657,894
(a) Average number of full-time equivalent (FTE) students, 2013 and 2014 calendar years. See Part 4: Glossary for definition of FTE.
Notes: Components may not add to totals due to rounding.
Sources: SCRGSP (Steering Committee for the Review of Government Service Provision) 2015, Report on Government Services 2015, Producti vity Commission, Canberra., Tables 4A.6, 4A.8, 4A.12, 4A.13, 4A.16 and 4A.18; Education Council, National Schools Statistics Collection (NSSC) (Finance), 2014
See also National Report on Schooling Data Portal
30
National Report on Schooling in Australia 2014
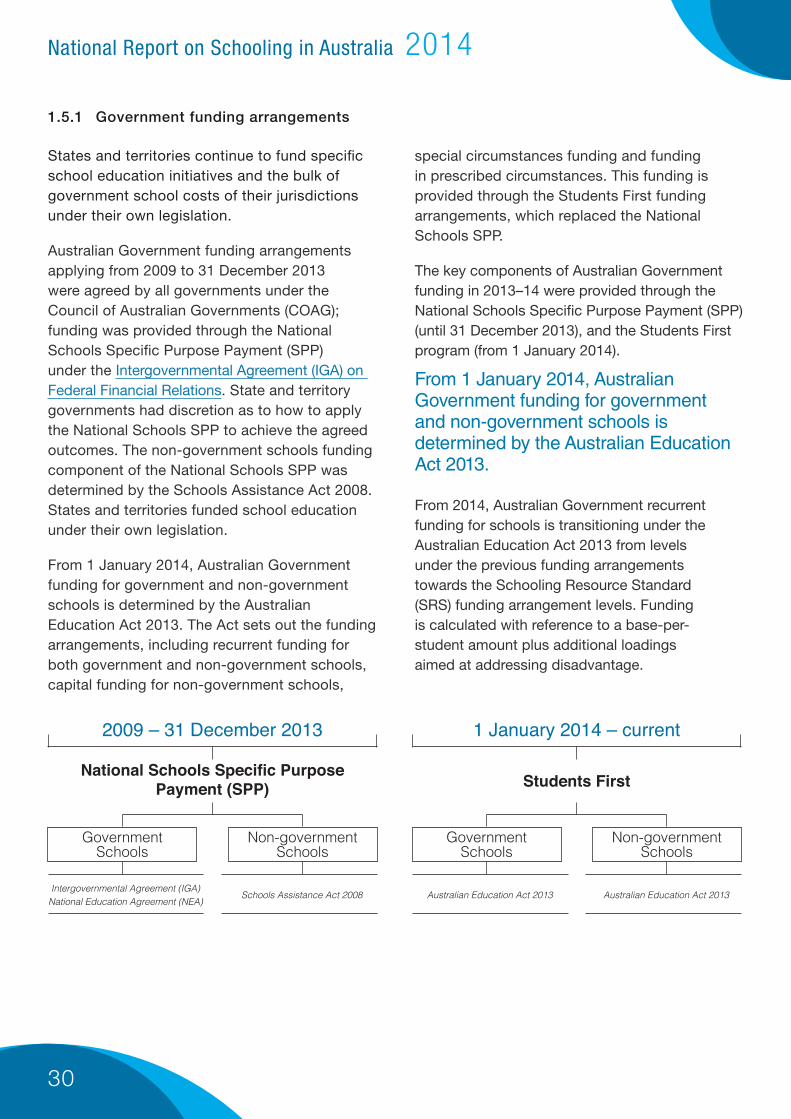
1.5.1 Government funding arrangements
States and territories continue to fund specific school education initiatives and the bulk of government school costs of their jurisdictions under their own legislation.
Australian Government funding arrangements applying from 2009 to 31 December 2013 were agreed by all governments under the Council of Australian Governments (COAG); funding was provided through the National Schools Specific Purpose Payment (SPP) under the Intergovernmental Agreement (IGA) on Federal Financial Relations. State and territory governments had discretion as to how to apply the National Schools SPP to achieve the agreed outcomes. The non-government schools funding component of the National Schools SPP was determined by the Schools Assistance Act 2008. States and territories funded school education under their own legislation.
From 1 January 2014, Australian Government funding for government and non-government schools is determined by the Australian Education Act 2013. The Act sets out the funding arrangements, including recurrent funding for both government and non-government schools, capital funding for non-government schools,
special circumstances funding and funding in prescribed circumstances. This funding is provided through the Students First funding arrangements, which replaced the National Schools SPP.
The key components of Australian Government funding in 2013–14 were provided through the National Schools Specific Purpose Payment (SPP) (until 31 December 2013), and the Students First program (from 1 January 2014).
From 2014, Australian Government recurrent funding for schools is transitioning under the Australian Education Act 2013 from levels under the previous funding arrangements towards the Schooling Resource Standard (SRS) funding arrangement levels. Funding is calculated with reference to a base-per-student amount plus additional loadings aimed at addressing disadvantage.
From 1 January 2014, Australian Government funding for government and non-government schools is determined by the Australian Education Act 2013.
National Schools Specific Purpose Payment (SPP) Students First
GovernmentSchools
GovernmentSchools
Intergovernmental Agreement (IGA) National Education Agreement (NEA) Australian Education Act 2013Schools Assistance Act 2008 Australian Education Act 2013
Non-governmentSchools
Non-governmentSchools
2009 – 31 December 2013 1 January 2014 – current
31
National Report on Schooling in Australia 2014
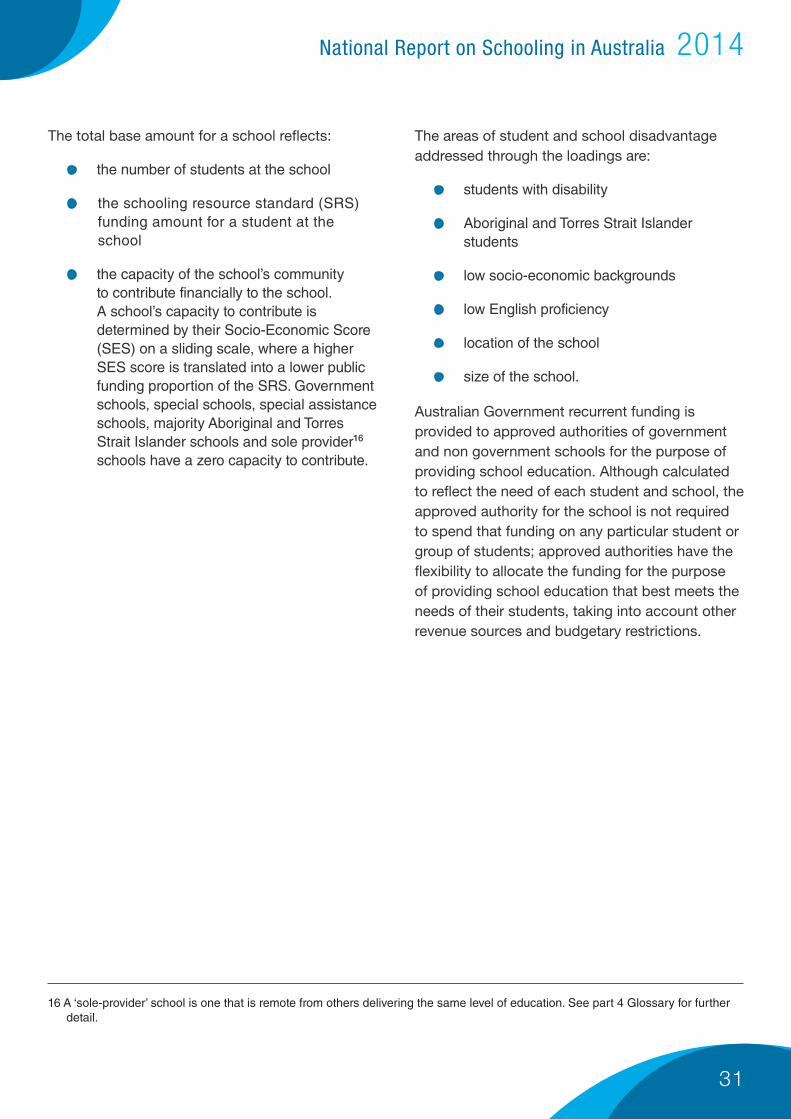
The total base amount for a school reflects:
• the number of students at the school
• the schooling resource standard (SRS) funding amount for a student at the school
• the capacity of the school’s community to contribute financially to the school. A school’s capacity to contribute is determined by their Socio-Economic Score (SES) on a sliding scale, where a higher SES score is translated into a lower public funding proportion of the SRS. Government schools, special schools, special assistance schools, majority Aboriginal and Torres Strait Islander schools and sole provider16 schools have a zero capacity to contribute.
The areas of student and school disadvantage addressed through the loadings are:
• students with disability
• Aboriginal and Torres Strait Islander students
• low socio-economic backgrounds
• low English proficiency
• location of the school
• size of the school.
Australian Government recurrent funding is provided to approved authorities of government and non government schools for the purpose of providing school education. Although calculated to reflect the need of each student and school, the approved authority for the school is not required to spend that funding on any particular student or group of students; approved authorities have the flexibility to allocate the funding for the purpose of providing school education that best meets the needs of their students, taking into account other revenue sources and budgetary restrictions.
16 A ‘sole-provider’ school is one that is remote from others delivering the same level of education. See part 4 Glossary for further detail.

32
National Report on Schooling in Australia 2014
1.5.2 Funding for government schools
State and territory governments are the major funders of government schools, in 2013–14 they contributed 87.3 per cent ($33.6 b) of total recurrent funding, with the Australian Government contributing the remaining 12.7 per cent ($4.9 b).
Total government recurrent expenditure per student, government schools, Australia, 2013–14 (%)
Figure 1.5
Source: SCRGSP (Steering Committee for the Review of Government Service Provision) 2016, Report on Government Services 2016, Productivity Commission, Canberra, table 4A.7.
Australian Government
State and territory governments
12.7%
87.3%
Government school recurrent expenditure
Finance data for the National Schools Statistics Collection (NSSC – Finance) is provided by the various state and federal education departments.
It is a financial year, annual collection of total government funded expenditure data (expenditure on salary and non-salary costs) on government schools only.
It provides a true audited perspective of government systems and is used to inform education ministers about government expenditure on school education on a consistent and progressive basis.
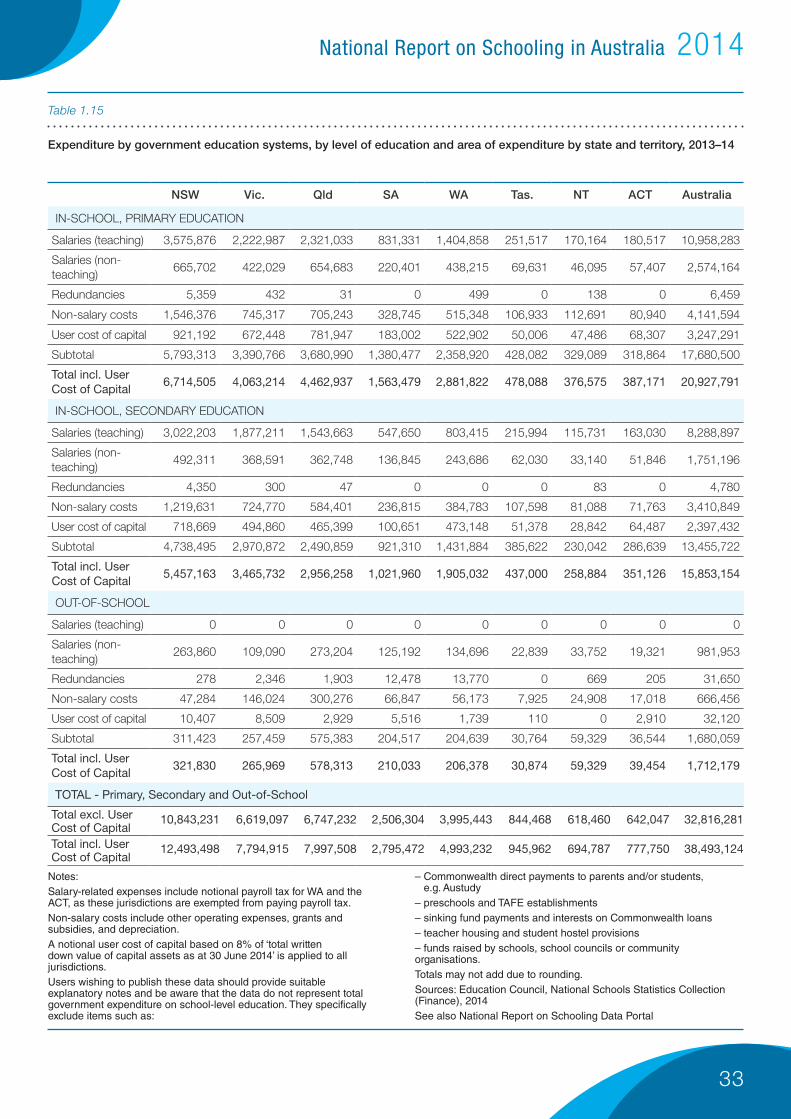
Table 1.15 shows a national overview of expenditure levels by states in 2013–14 in key operational areas such as the relative levels of salary and non-salary costs. The user cost of capital reflects the opportunity cost of being able to utilise capital funding for recurrent purposes (based on eight per cent of the written down value of capital assets).
• Excluding user cost of capital, teacher salaries expenditure accounts for 62 per cent of in-school expenditure.
• Excluding user cost of capital, in-school non-salary costs account for 24 per cent of in-school expenditure. These expenditures include school materials, maintenance, cleaning and student transport costs.
• Out-of-school expenditure for government systems includes state office, regional and local functions supporting schools.
• In-school expenditure includes teaching, learning, and school administration, and library functions within schools.
• Expenditure on out-of-school support functions represents approximately four per cent of total government funding on state and territory government schools. The major component of funding, some 95 per cent, goes to fund schools directly.
33
National Report on Schooling in Australia 2014
Expenditure by government education systems, by level of education and area of expenditure by state and territory, 2013–14
Table 1.15
NSW Vic. Qld SA WA Tas. NT ACT Australia
IN-SCHOOL, PRIMARY EDUCATION
Salaries (teaching) 3,575,876 2,222,987 2,321,033 831,331 1,404,858 251,517 170,164 180,517 10,958,283
Salaries (non-teaching)
665,702 422,029 654,683 220,401 438,215 69,631 46,095 57,407 2,574,164
Redundancies 5,359 432 31 0 499 0 138 0 6,459
Non-salary costs 1,546,376 745,317 705,243 328,745 515,348 106,933 112,691 80,940 4,141,594
User cost of capital 921,192 672,448 781,947 183,002 522,902 50,006 47,486 68,307 3,247,291
Subtotal 5,793,313 3,390,766 3,680,990 1,380,477 2,358,920 428,082 329,089 318,864 17,680,500
Total incl. User Cost of Capital
6,714,505 4,063,214 4,462,937 1,563,479 2,881,822 478,088 376,575 387,171 20,927,791
IN-SCHOOL, SECONDARY EDUCATION
Salaries (teaching) 3,022,203 1,877,211 1,543,663 547,650 803,415 215,994 115,731 163,030 8,288,897
Salaries (non-teaching)
492,311 368,591 362,748 136,845 243,686 62,030 33,140 51,846 1,751,196
Redundancies 4,350 300 47 0 0 0 83 0 4,780
Non-salary costs 1,219,631 724,770 584,401 236,815 384,783 107,598 81,088 71,763 3,410,849
User cost of capital 718,669 494,860 465,399 100,651 473,148 51,378 28,842 64,487 2,397,432
Subtotal 4,738,495 2,970,872 2,490,859 921,310 1,431,884 385,622 230,042 286,639 13,455,722
Total incl. User Cost of Capital
5,457,163 3,465,732 2,956,258 1,021,960 1,905,032 437,000 258,884 351,126 15,853,154
OUT-OF-SCHOOL
Salaries (teaching) 0 0 0 0 0 0 0 0 0
Salaries (non-teaching)
263,860 109,090 273,204 125,192 134,696 22,839 33,752 19,321 981,953
Redundancies 278 2,346 1,903 12,478 13,770 0 669 205 31,650
Non-salary costs 47,284 146,024 300,276 66,847 56,173 7,925 24,908 17,018 666,456
User cost of capital 10,407 8,509 2,929 5,516 1,739 110 0 2,910 32,120
Subtotal 311,423 257,459 575,383 204,517 204,639 30,764 59,329 36,544 1,680,059
Total incl. User Cost of Capital
321,830 265,969 578,313 210,033 206,378 30,874 59,329 39,454 1,712,179
TOTAL - Primary, Secondary and Out-of-School
Total excl. User Cost of Capital
10,843,231 6,619,097 6,747,232 2,506,304 3,995,443 844,468 618,460 642,047 32,816,281
Total incl. User Cost of Capital
12,493,498 7,794,915 7,997,508 2,795,472 4,993,232 945,962 694,787 777,750 38,493,124
Notes:Salary-related expenses include notional payroll tax for WA and the ACT, as these jurisdictions are exempted from paying payroll tax.Non-salary costs include other operating expenses, grants and subsidies, and depreciation.A notional user cost of capital based on 8% of ‘total written down value of capital assets as at 30 June 2014’ is applied to all jurisdictions.Users wishing to publish these data should provide suitable explanatory notes and be aware that the data do not represent total government expenditure on school-level education. They specifically exclude items such as:
– Commonwealth direct payments to parents and/or students, e.g. Austudy– preschools and TAFE establishments– sinking fund payments and interests on Commonwealth loans– teacher housing and student hostel provisions– funds raised by schools, school councils or community organisations.Totals may not add due to rounding.Sources: Education Council, National Schools Statistics Collection (Finance), 2014See also National Report on Schooling Data Portal
34
National Report on Schooling in Australia 2014
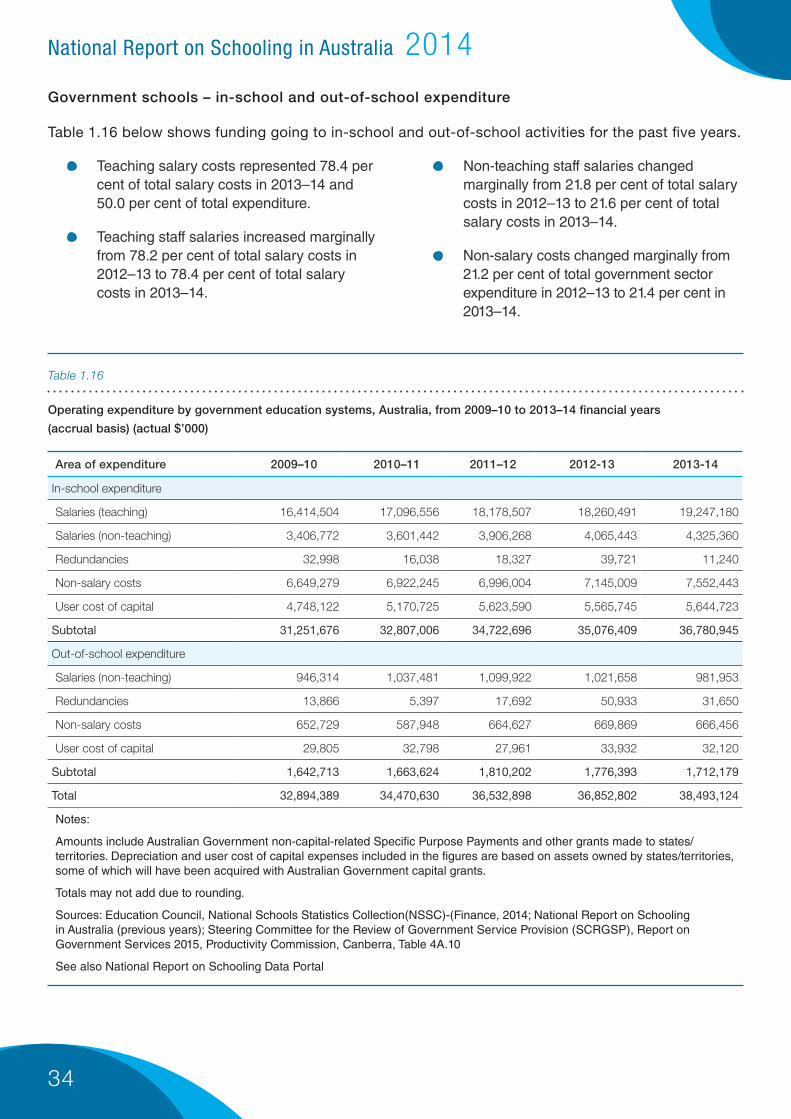
Government schools – in-school and out-of-school expenditure
Table 1.16 below shows funding going to in-school and out-of-school activities for the past five years.
• Teaching salary costs represented 78.4 per cent of total salary costs in 2013–14 and 50.0 per cent of total expenditure.
• Teaching staff salaries increased marginally from 78.2 per cent of total salary costs in 2012–13 to 78.4 per cent of total salary costs in 2013–14.
• Non-teaching staff salaries changed marginally from 21.8 per cent of total salary costs in 2012–13 to 21.6 per cent of total salary costs in 2013–14.
• Non-salary costs changed marginally from 21.2 per cent of total government sector expenditure in 2012–13 to 21.4 per cent in 2013–14.
Operating expenditure by government education systems, Australia, from 2009–10 to 2013–14 financial years
(accrual basis) (actual $’000)
Table 1.16
Area of expenditure 2009–10 2010–11 2011–12 2012-13 2013-14
In-school expenditure
Salaries (teaching) 16,414,504 17,096,556 18,178,507 18,260,491 19,247,180
Salaries (non-teaching) 3,406,772 3,601,442 3,906,268 4,065,443 4,325,360
Redundancies 32,998 16,038 18,327 39,721 11,240
Non-salary costs 6,649,279 6,922,245 6,996,004 7,145,009 7,552,443
User cost of capital 4,748,122 5,170,725 5,623,590 5,565,745 5,644,723
Subtotal 31,251,676 32,807,006 34,722,696 35,076,409 36,780,945
Out-of-school expenditure
Salaries (non-teaching) 946,314 1,037,481 1,099,922 1,021,658 981,953
Redundancies 13,866 5,397 17,692 50,933 31,650
Non-salary costs 652,729 587,948 664,627 669,869 666,456
User cost of capital 29,805 32,798 27,961 33,932 32,120
Subtotal 1,642,713 1,663,624 1,810,202 1,776,393 1,712,179
Total 32,894,389 34,470,630 36,532,898 36,852,802 38,493,124
Notes:
Amounts include Australian Government non-capital-related Specific Purpose Payments and other grants made to states/territories. Depreciation and user cost of capital expenses included in the figures are based on assets owned by states/territories, some of which will have been acquired with Australian Government capital grants.
Totals may not add due to rounding.
Sources: Education Council, National Schools Statistics Collection(NSSC)-(Finance, 2014; National Report on Schooling in Australia (previous years); Steering Committee for the Review of Government Service Provision (SCRGSP), Report on Government Services 2015, Productivity Commission, Canberra, Table 4A.10
See also National Report on Schooling Data Portal
35
National Report on Schooling in Australia 2014
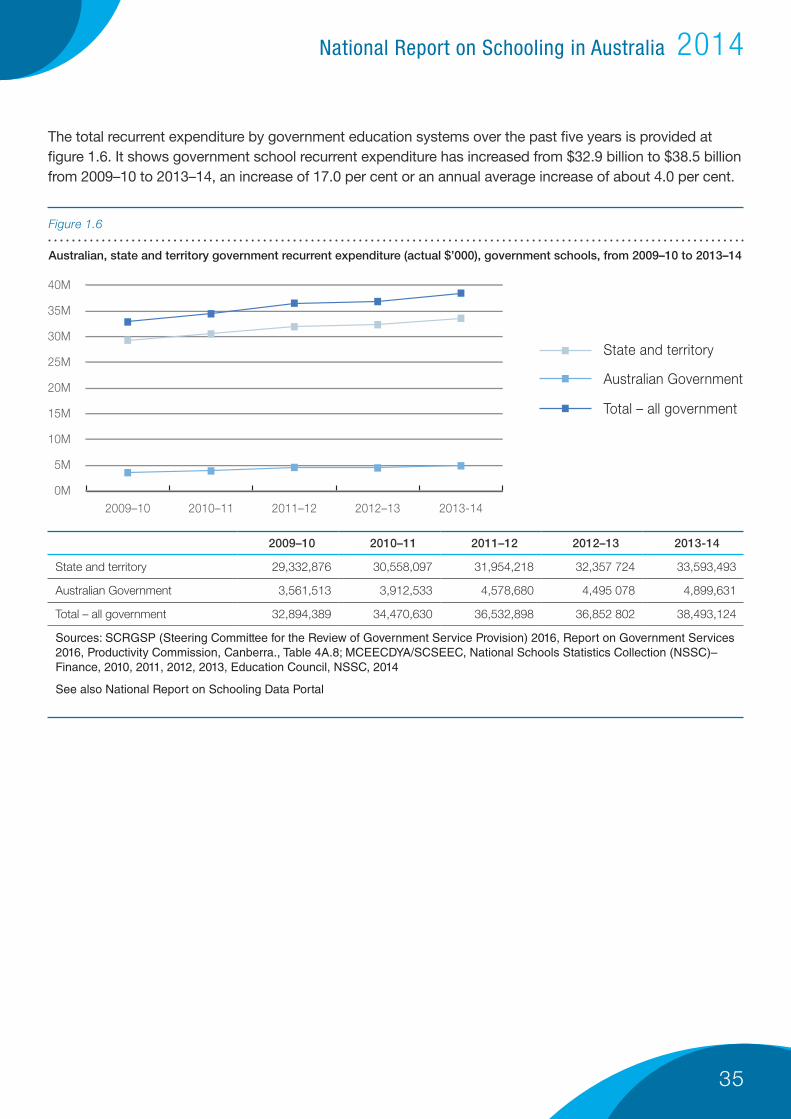
The total recurrent expenditure by government education systems over the past five years is provided at figure 1.6. It shows government school recurrent expenditure has increased from $32.9 billion to $38.5 billion from 2009–10 to 2013–14, an increase of 17.0 per cent or an annual average increase of about 4.0 per cent.
2009–10 2010–11 2011–12 2012–13 2013-14
State and territory 29,332,876 30,558,097 31,954,218 32,357 724 33,593,493
Australian Government 3,561,513 3,912,533 4,578,680 4,495 078 4,899,631
Total – all government 32,894,389 34,470,630 36,532,898 36,852 802 38,493,124
Sources: SCRGSP (Steering Committee for the Review of Government Service Provision) 2016, Report on Government Services 2016, Productivity Commission, Canberra., Table 4A.8; MCEECDYA/SCSEEC, National Schools Statistics Collection (NSSC)–Finance, 2010, 2011, 2012, 2013, Education Council, NSSC, 2014
See also National Report on Schooling Data Portal
Australian, state and territory government recurrent expenditure (actual $’000), government schools, from 2009–10 to 2013–14
Figure 1.6
0M
5M
10M
15M
20M
25M
30M
35M
40M
Total – all government
Australian Government
State and territory
2013-142012–132011–122010–112009–10
36
National Report on Schooling in Australia 2014
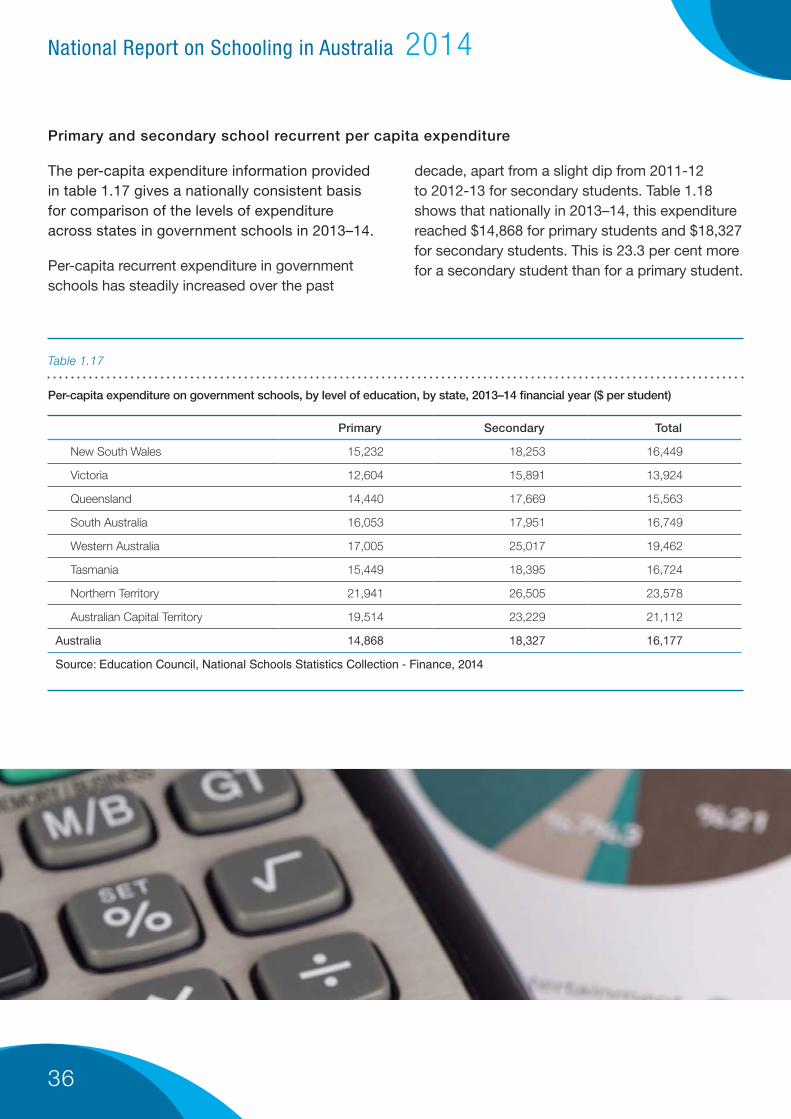
Primary and secondary school recurrent per capita expenditure
The per-capita expenditure information provided in table 1.17 gives a nationally consistent basis for comparison of the levels of expenditure across states in government schools in 2013–14.
Per-capita recurrent expenditure in government schools has steadily increased over the past
decade, apart from a slight dip from 2011-12 to 2012-13 for secondary students. Table 1.18 shows that nationally in 2013–14, this expenditure reached $14,868 for primary students and $18,327 for secondary students. This is 23.3 per cent more for a secondary student than for a primary student.
Per-capita expenditure on government schools, by level of education, by state, 2013–14 financial year ($ per student)
Table 1.17
Primary Secondary Total
New South Wales 15,232 18,253 16,449
Victoria 12,604 15,891 13,924
Queensland 14,440 17,669 15,563
South Australia 16,053 17,951 16,749
Western Australia 17,005 25,017 19,462
Tasmania 15,449 18,395 16,724
Northern Territory 21,941 26,505 23,578
Australian Capital Territory 19,514 23,229 21,112
Australia 14,868 18,327 16,177
Source: Education Council, National Schools Statistics Collection - Finance, 2014
37
National Report on Schooling in Australia 2014
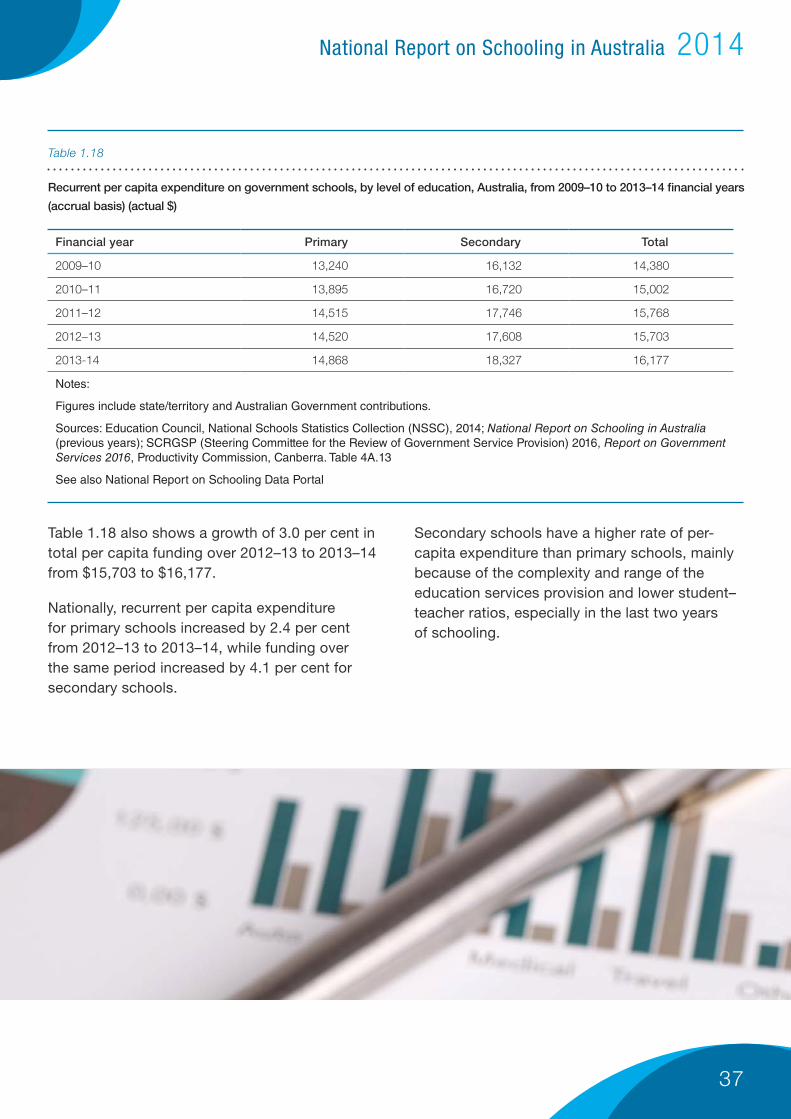
Recurrent per capita expenditure on government schools, by level of education, Australia, from 2009–10 to 2013–14 financial years
(accrual basis) (actual $)
Table 1.18
Financial year Primary Secondary Total
2009–10 13,240 16,132 14,380
2010–11 13,895 16,720 15,002
2011–12 14,515 17,746 15,768
2012–13 14,520 17,608 15,703
2013-14 14,868 18,327 16,177
Notes:
Figures include state/territory and Australian Government contributions.
Sources: Education Council, National Schools Statistics Collection (NSSC), 2014; National Report on Schooling in Australia (previous years); SCRGSP (Steering Committee for the Review of Government Service Provision) 2016, Report on Government Services 2016, Productivity Commission, Canberra. Table 4A.13
See also National Report on Schooling Data Portal
Table 1.18 also shows a growth of 3.0 per cent in total per capita funding over 2012–13 to 2013–14 from $15,703 to $16,177.
Nationally, recurrent per capita expenditure for primary schools increased by 2.4 per cent from 2012–13 to 2013–14, while funding over the same period increased by 4.1 per cent for secondary schools.
Secondary schools have a higher rate of per-capita expenditure than primary schools, mainly because of the complexity and range of the education services provision and lower student–teacher ratios, especially in the last two years of schooling.
38
National Report on Schooling in Australia 2014
Non-government school per-capita incomes, by source, Australia, 2014 calendar year
Table 1.19
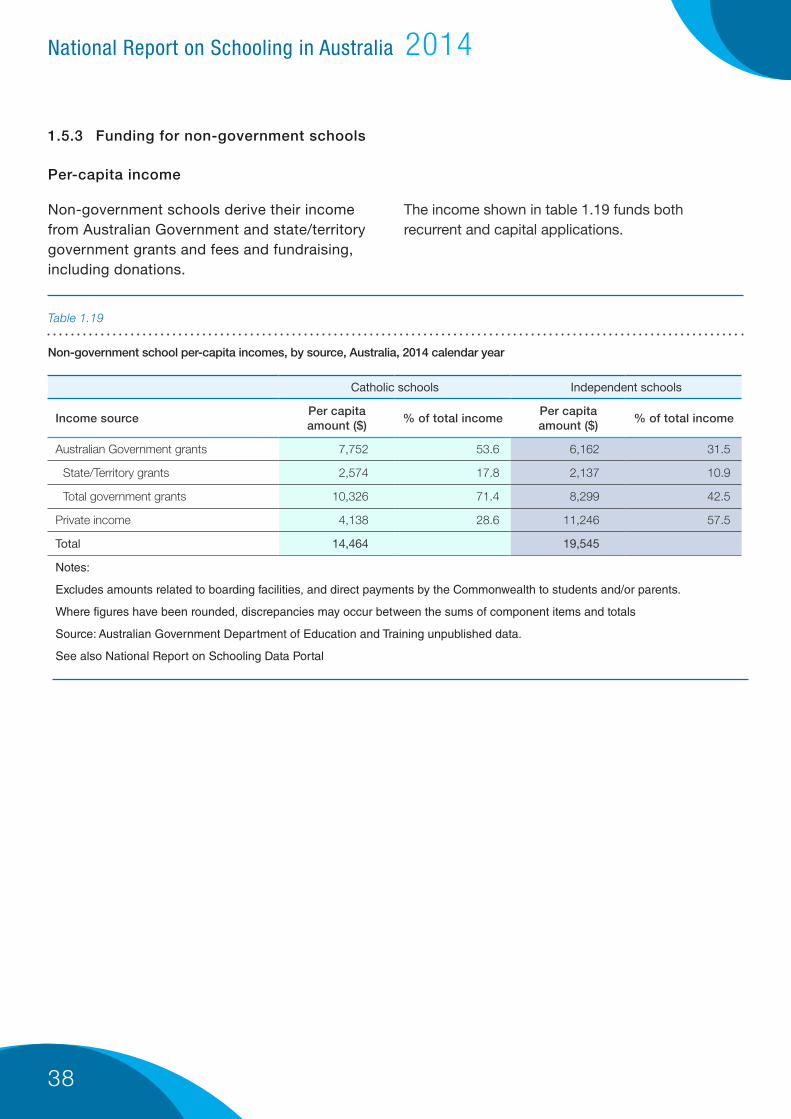
1.5.3 Funding for non-government schools
Per-capita income
Non-government schools derive their income from Australian Government and state/territory government grants and fees and fundraising, including donations.
The income shown in table 1.19 funds both recurrent and capital applications.
Catholic schools Independent schools
Income sourcePer capita amount ($)
% of total incomePer capita amount ($)
% of total income
Australian Government grants 7,752 53.6 6,162 31.5
State/Territory grants 2,574 17.8 2,137 10.9
Total government grants 10,326 71.4 8,299 42.5
Private income 4,138 28.6 11,246 57.5
Total 14,464 19,545
Notes:
Excludes amounts related to boarding facilities, and direct payments by the Commonwealth to students and/or parents.
Where figures have been rounded, discrepancies may occur between the sums of component items and totals
Source: Australian Government Department of Education and Training unpublished data.
See also National Report on Schooling Data Portal
39
National Report on Schooling in Australia 2014
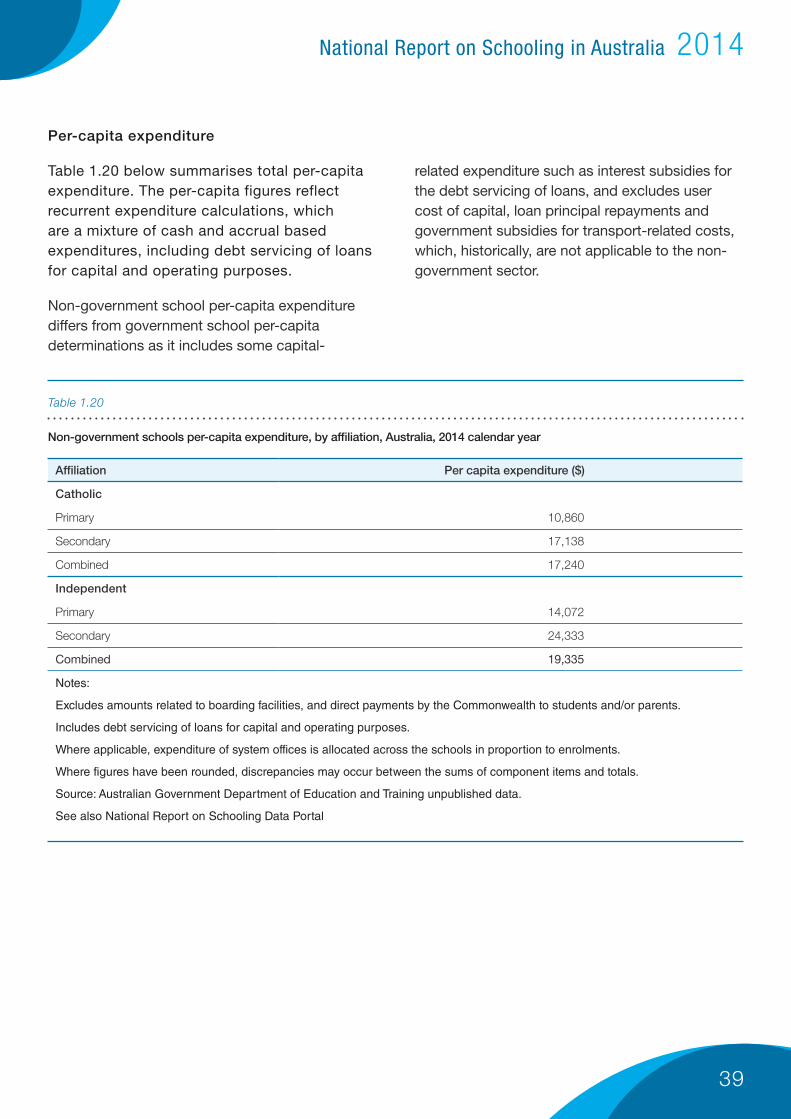
Per-capita expenditure
Table 1.20 below summarises total per-capita expenditure. The per-capita figures reflect recurrent expenditure calculations, which are a mixture of cash and accrual based expenditures, including debt servicing of loans for capital and operating purposes.
Non-government school per-capita expenditure differs from government school per-capita determinations as it includes some capital-
related expenditure such as interest subsidies for the debt servicing of loans, and excludes user cost of capital, loan principal repayments and government subsidies for transport-related costs, which, historically, are not applicable to the non-government sector.
Non-government schools per-capita expenditure, by affiliation, Australia, 2014 calendar year
Table 1.20
Affiliation Per capita expenditure ($)
Catholic
Primary 10,860
Secondary 17,138
Combined 17,240
Independent
Primary 14,072
Secondary 24,333
Combined 19,335
Notes:
Excludes amounts related to boarding facilities, and direct payments by the Commonwealth to students and/or parents.
Includes debt servicing of loans for capital and operating purposes.
Where applicable, expenditure of system offices is allocated across the schools in proportion to enrolments.
Where figures have been rounded, discrepancies may occur between the sums of component items and totals.
Source: Australian Government Department of Education and Training unpublished data.
See also National Report on Schooling Data Portal
40
National Report on Schooling in Australia 2014
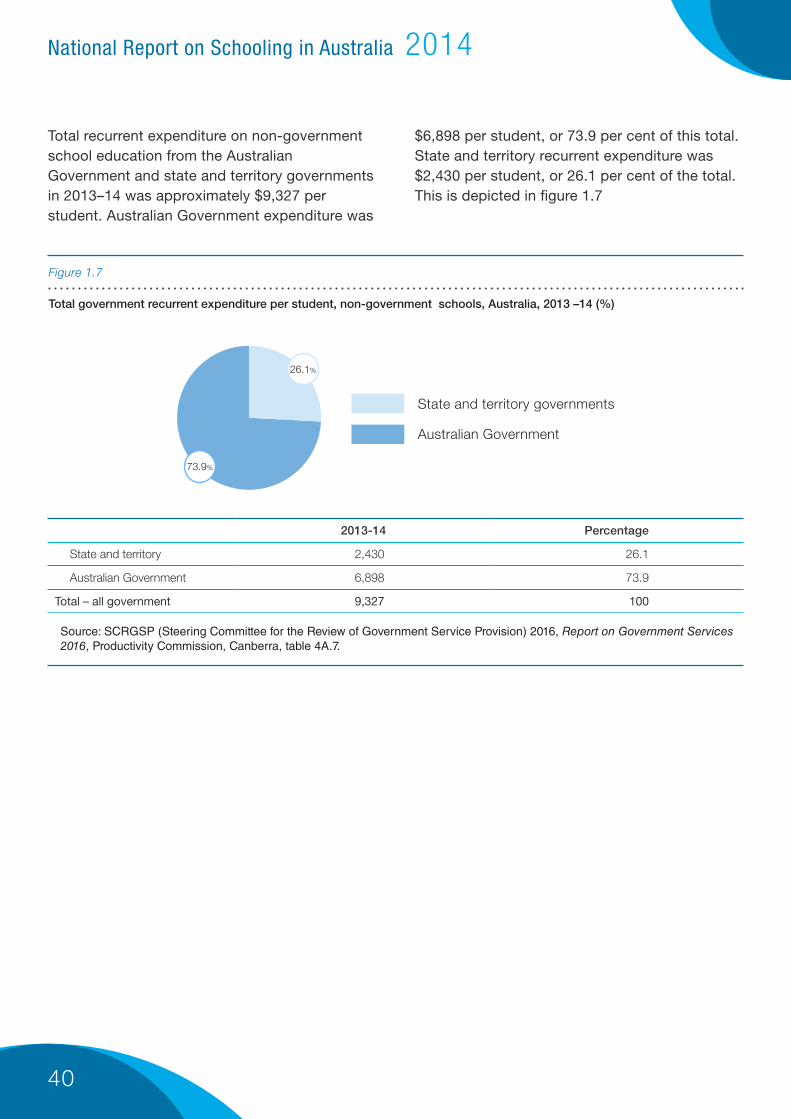
Total recurrent expenditure on non-government school education from the Australian Government and state and territory governments in 2013–14 was approximately $9,327 per student. Australian Government expenditure was
$6,898 per student, or 73.9 per cent of this total. State and territory recurrent expenditure was $2,430 per student, or 26.1 per cent of the total. This is depicted in figure 1.7
Total government recurrent expenditure per student, non-government schools, Australia, 2013 –14 (%)
Figure 1.7
Source: SCRGSP (Steering Committee for the Review of Government Service Provision) 2016, Report on Government Services 2016, Productivity Commission, Canberra, table 4A.7.
2013-14 Percentage
State and territory 2,430 26.1
Australian Government 6,898 73.9
Total – all government 9,327 100
Australian Government
State and territory governments
26.1%
73.9%

41
National Report on Schooling in Australia 2014
State and territory government recurrent funding for non-government schools
As well as providing recurrent grants to government schools, all states and territories contribute to funding for non-government schools. State/territory governments used a variety of mechanisms for allocating funding to non-government schools in 2014.
Table 1.21 below outlines total Australian, state and territory recurrent expenditure on non-government schools in 2013–14.
Total recurrent expenditure on non-government school education from the Australian Government and state and territory governments in 2013–14 was approximately $11.9 billion. Australian Government expenditure was $8.8 billion, or 73.0 per cent of this total. State and territory recurrent expenditure was $3.1 billion or 27.0 per cent of the total.
Australia
Australian Government specific purpose payments (excluding capital grants and including National Partnership payments – literacy and numeracy)
8,817,739
State and territory government recurrent expenditure 3,105,886
Australian, state and territory government recurrent expenditure 11,923,625
Note: Australian Government specific purpose payments include recurrent, targeted and Indigenous program expenditure, until 2008-09. From 2009-10 onwards, these categories are not separately reported but funds expended on these purposes are included in the total specific purpose payment provision.
Source: SCRGSP (Steering Committee for the Review of Government Service Provision) 2016, Report on Government Services 2016, Productivity Commission, Table 4A.8
Australian, state and territory government recurrent expenditure, non-government schools ($’000) (2013–14)
Table 1.21
42
National Report on Schooling in Australia 2014
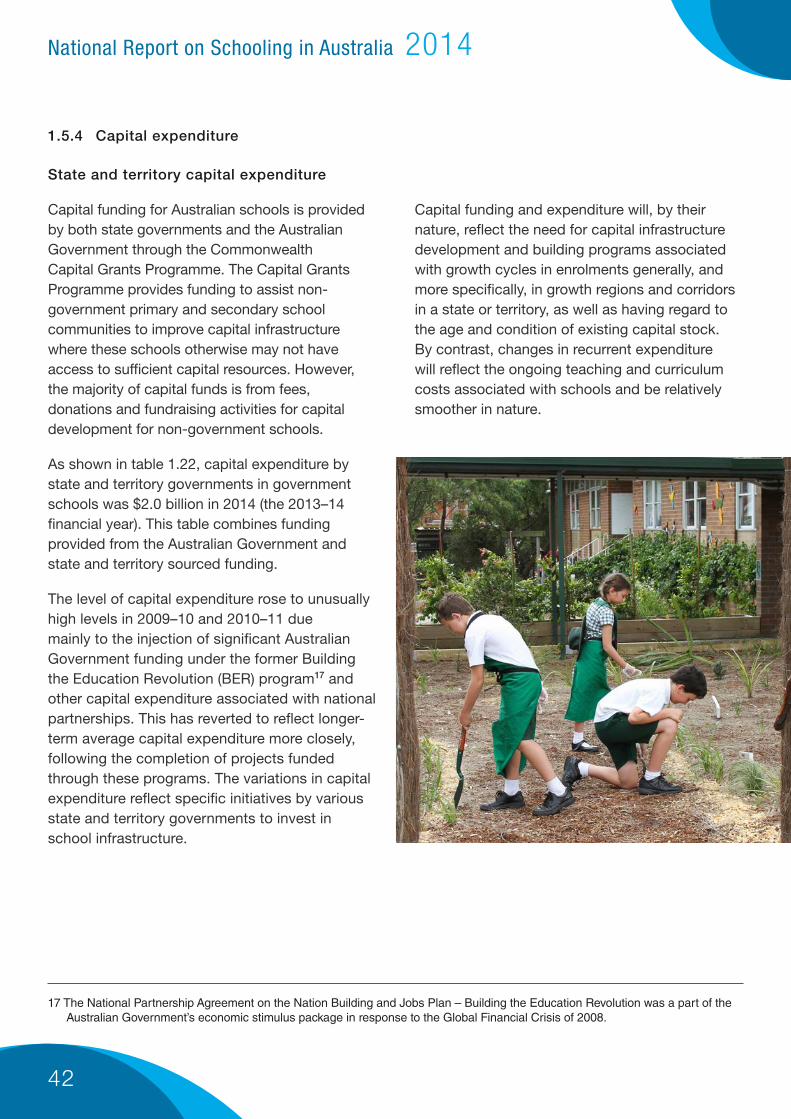
1.5.4 Capital expenditure
State and territory capital expenditure
Capital funding for Australian schools is provided by both state governments and the Australian Government through the Commonwealth Capital Grants Programme. The Capital Grants Programme provides funding to assist non-government primary and secondary school communities to improve capital infrastructure where these schools otherwise may not have access to sufficient capital resources. However, the majority of capital funds is from fees, donations and fundraising activities for capital development for non-government schools.
As shown in table 1.22, capital expenditure by state and territory governments in government schools was $2.0 billion in 2014 (the 2013–14 financial year). This table combines funding provided from the Australian Government and state and territory sourced funding.
The level of capital expenditure rose to unusually high levels in 2009–10 and 2010–11 due mainly to the injection of significant Australian Government funding under the former Building the Education Revolution (BER) program17 and other capital expenditure associated with national partnerships. This has reverted to reflect longer-term average capital expenditure more closely, following the completion of projects funded through these programs. The variations in capital expenditure reflect specific initiatives by various state and territory governments to invest in school infrastructure.
Capital funding and expenditure will, by their nature, reflect the need for capital infrastructure development and building programs associated with growth cycles in enrolments generally, and more specifically, in growth regions and corridors in a state or territory, as well as having regard to the age and condition of existing capital stock. By contrast, changes in recurrent expenditure will reflect the ongoing teaching and curriculum costs associated with schools and be relatively smoother in nature.
17 The National Partnership Agreement on the Nation Building and Jobs Plan – Building the Education Revolution was a part of the Australian Government’s economic stimulus package in response to the Global Financial Crisis of 2008.

43
National Report on Schooling in Australia 2014
Capital expenditure by state and territory governments in government schools, Australia, from
2008–09 to 2013–14 financial years (accrual basis) ($’000)
Table 1.22
Financial year
NSW Vic. Qld. SA WA Tas. NT ACT Australia
2008-09 607,518 521,230 668,141 50,616 269,326 38,896 44,223 92,504 2,292,453
2009-10 2,567,386 1,269,900 1,977,011 488,650 690,849 223,232 154,695 199,437 7,571,161
2010-11 1,799,683 1,835,015 1,437,641 440,642 820,969 200,907 106,052 198,547 6,839,455
2011-12 584,824 720,258 434,002 144,570 668,824 36,746 54,187 96,735 2,740,147
2012-13 426,911 444,307 345,810 106,720 465,354 8,356 19,416 74,055 1,890,928
2013-14 399,794 387,953 428,176 134,026 520,537 20,071 33,589 61,418 1,985,564
Notes:
Figures include Australian Government capital grants contributions.
Components may not add to totals due to rounding.
Sources: Education Council, National Schools Statistics Collection (Finance), 2014; National Report on Schooling in Australia, 2010–13
See also National Report on Schooling Data Portal
44
National Report on Schooling in Australia 2014
1.5.5 My School financial information
Important note: As indicated below, there are key differences between My School finance data, and National Schools Statistics Collection (NSSC) (Finance) and other finance data reported in previous sections of this part. The income-based finance data from My School should not be compared to the expenditure-based finance data quoted in previous subsections.
This part provides high-level profiles of recurrent funding information for the 2013 calendar year, aggregated from school financial details published on the My School website in March 2015.
The key financial measure reported on My School is school net recurrent income and net recurrent income per student (NRIPS). Government and non-government schools and systems that allocate some of their gross income to capital purposes have these amounts shown and deducted from their gross income. Gross income that is allocated to capital expenses in the reporting year is included in the school’s capital expenditure report.
The methodology and other associated material related to My School finance data classification may be obtained from the My School website.
My School finance data were developed to show the income available to a school, over a calendar year (not financial year), to deliver education services to students. My School income data include private funding that supports a school but exclude user cost of capital (a notional opportunity cost), payroll tax and the cost of transporting students to and from school.
In addition, private funding, as reported on My School for the government sector, is excluded from the NSSC (Finance) collection, whereas payroll tax, student transport and user cost of capital are included in NSSC expenditure information. Also, the NSSC finance data are reported on a financial year basis. Therefore, recurrent income information contained within this section and recurrent expenditure in the preceding sections are not directly comparable.
For government and systemic schools, where a ‘system’ or managing organisation (such as a district, region or state office) other than the school itself incurs expenditure and manages finances for the school, each school’s income is composed of all such funds used for, and on behalf of, the school plus any cash income received at the school level, as if each school were accounted for as a stand-alone entity. This approach is consistent with the principles of Australian Accounting Standard AASB 1004 – Contributions.
It also is important to note that the definitions and counting rules for schools and enrolments used for the My School website differ, in some respects, to those of the National Schools Statistics Collection (Non-Finance)18 used for the reporting of school and student data elsewhere in this report.
18 The National Schools Statistics Collection (NSSC) (Non-finance) is the source of school number and student enrolment data reported elsewhere in this report. Data included in this section on a per-school, per-student or per-school-sector basis cannot be directly compared to data reported elsewhere in this report. Further information on the NSSC (Non-finance) is included in Part 4: Glossary.
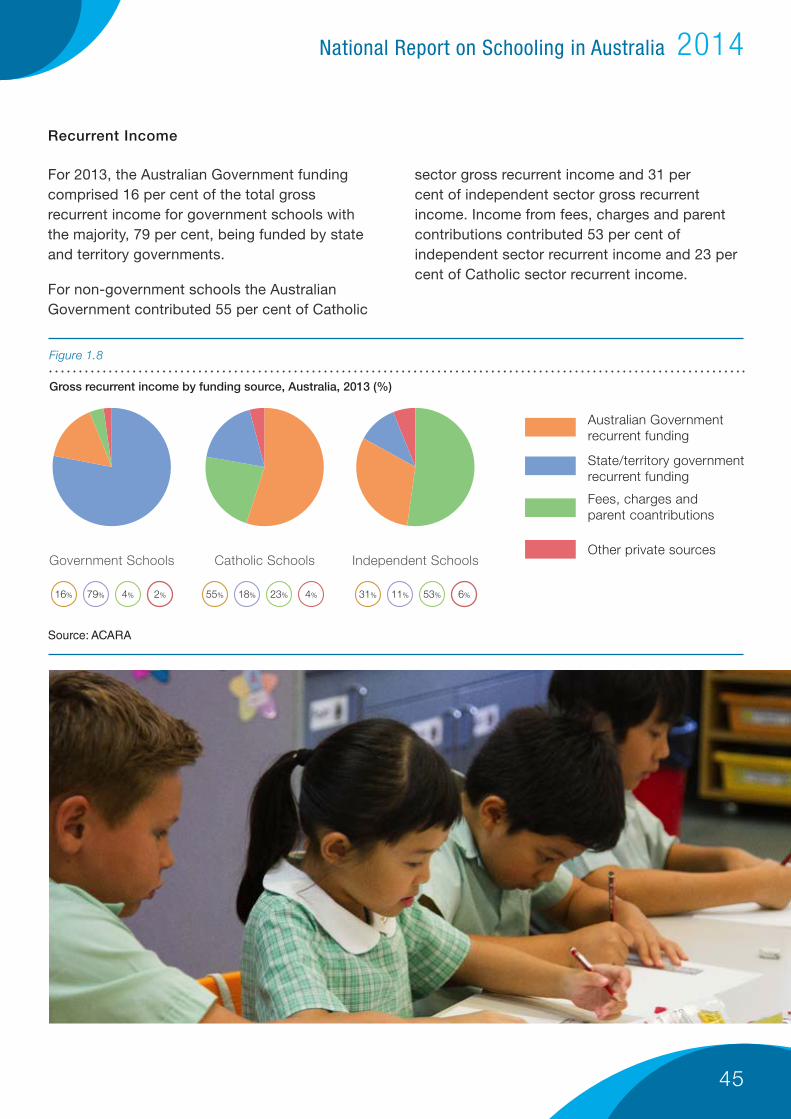
45
National Report on Schooling in Australia 2014
Recurrent Income
For 2013, the Australian Government funding comprised 16 per cent of the total gross recurrent income for government schools with the majority, 79 per cent, being funded by state and territory governments.
For non-government schools the Australian Government contributed 55 per cent of Catholic
sector gross recurrent income and 31 per cent of independent sector gross recurrent income. Income from fees, charges and parent contributions contributed 53 per cent of independent sector recurrent income and 23 per cent of Catholic sector recurrent income.
Gross recurrent income by funding source, Australia, 2013 (%)
Figure 1.8
Source: ACARA
Other private sources
Fees, charges andparent coantributions
State/territory governmentrecurrent funding
Australian Governmentrecurrent funding
Independent SchoolsCatholic SchoolsGovernment Schools
16% 55% 31%79% 18% 11%4% 23% 53%2% 4% 6%
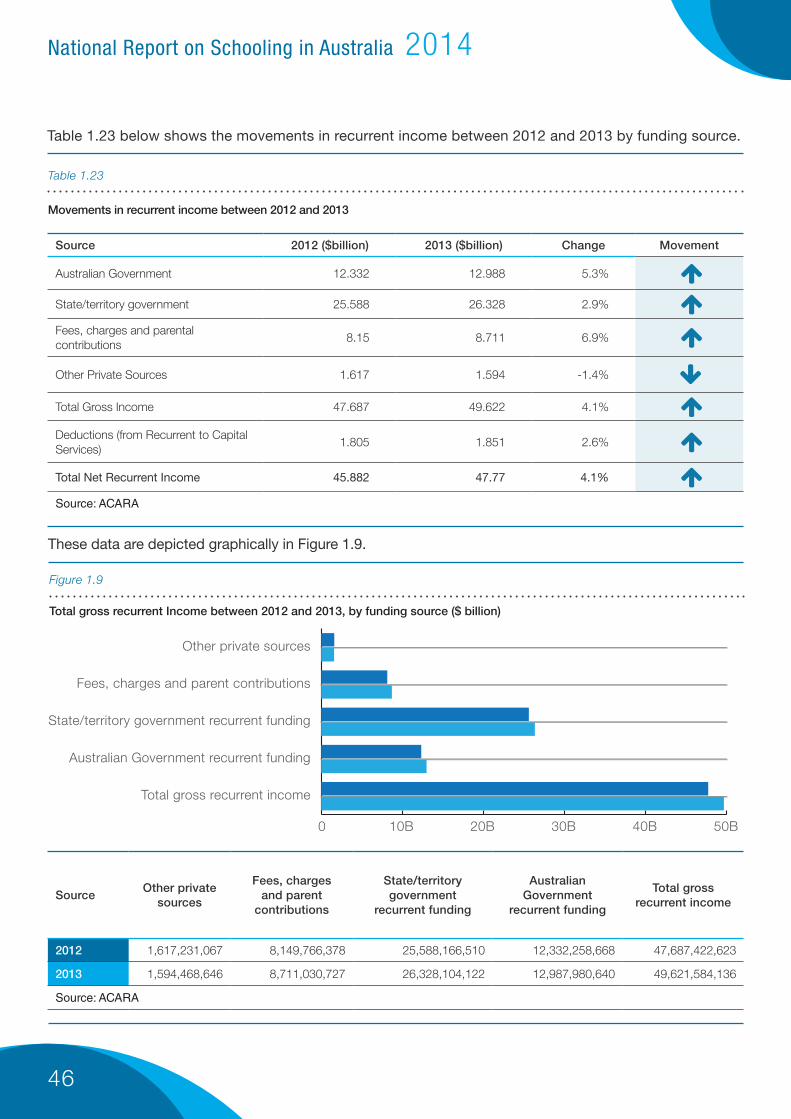
46
National Report on Schooling in Australia 2014
Movements in recurrent income between 2012 and 2013
Table 1.23
Source 2012 ($billion) 2013 ($billion) Change Movement
Australian Government 12.332 12.988 5.3% �x
State/territory government 25.588 26.328 2.9% �x Fees, charges and parental contributions
8.15 8.711 6.9% �x
Other Private Sources 1.617 1.594 -1.4% �y
Total Gross Income 47.687 49.622 4.1% �x
Deductions (from Recurrent to Capital Services)
1.805 1.851 2.6% �x
Total Net Recurrent Income 45.882 47.77 4.1% �x Source: ACARA
These data are depicted graphically in Figure 1.9.
Total gross recurrent Income between 2012 and 2013, by funding source ($ billion)
Figure 1.9
SourceOther private
sources
Fees, charges and parent
contributions
State/territory government
recurrent funding
Australian Government
recurrent funding
Total gross recurrent income
2012 1,617,231,067 8,149,766,378 25,588,166,510 12,332,258,668 47,687,422,623
2013 1,594,468,646 8,711,030,727 26,328,104,122 12,987,980,640 49,621,584,136
Source: ACARA
0 10B 20B 30B 40B 50B
2013
2012
Total gross recurrent income
Australian Government recurrent funding
State/territory government recurrent funding
Fees, charges and parent contributions
Other private sources
Table 1.23 below shows the movements in recurrent income between 2012 and 2013 by funding source.
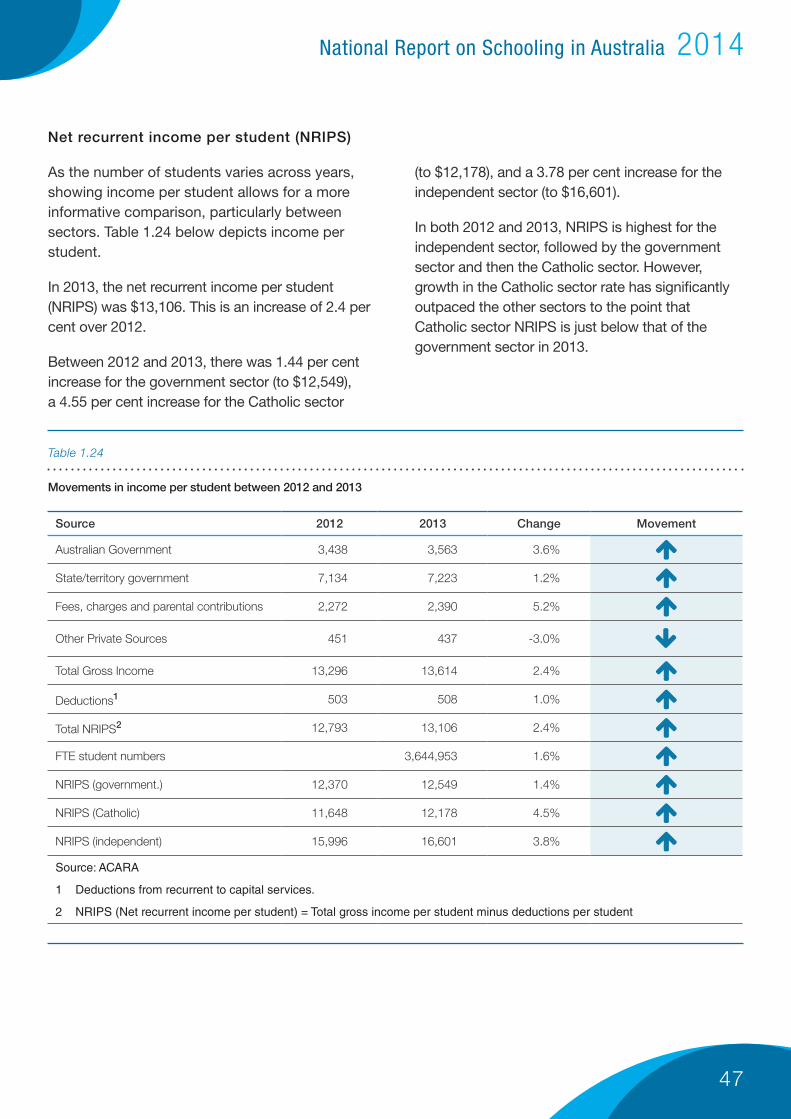
47
National Report on Schooling in Australia 2014
Net recurrent income per student (NRIPS)
As the number of students varies across years, showing income per student allows for a more informative comparison, particularly between sectors. Table 1.24 below depicts income per student.
In 2013, the net recurrent income per student (NRIPS) was $13,106. This is an increase of 2.4 per cent over 2012.
Between 2012 and 2013, there was 1.44 per cent increase for the government sector (to $12,549), a 4.55 per cent increase for the Catholic sector
(to $12,178), and a 3.78 per cent increase for the independent sector (to $16,601).
In both 2012 and 2013, NRIPS is highest for the independent sector, followed by the government sector and then the Catholic sector. However, growth in the Catholic sector rate has significantly outpaced the other sectors to the point that Catholic sector NRIPS is just below that of the government sector in 2013.
Movements in income per student between 2012 and 2013
Table 1.24
Source 2012 2013 Change Movement
Australian Government 3,438 3,563 3.6% �x
State/territory government 7,134 7,223 1.2% �x
Fees, charges and parental contributions 2,272 2,390 5.2% �x
Other Private Sources 451 437 -3.0% �y
Total Gross Income 13,296 13,614 2.4% �x
Deductions1 503 508 1.0% �x
Total NRIPS2 12,793 13,106 2.4% �x
FTE student numbers 3,644,953 1.6% �x
NRIPS (government.) 12,370 12,549 1.4% �x
NRIPS (Catholic) 11,648 12,178 4.5% �x
NRIPS (independent) 15,996 16,601 3.8% �x Source: ACARA
1 Deductions from recurrent to capital services.
2 NRIPS (Net recurrent income per student) = Total gross income per student minus deductions per student

48
National Report on Schooling in Australia 2014

Policies and priorities
Part 2

50
National Report on Schooling in Australia 2014
Part 2: Policies and priorities
Part 2 outlines the national policy context for Australian schooling in 2014 and reports against the commitments to action agreed by Australian education ministers in the Melbourne Declaration on the Educational Goals for Young Australians.
Part 2.1 – National policy context
Within Australia’s federal system of government, constitutional responsibility for school education rests mainly with the Australian states and territories. The six state and two territory governments and the Australian Government have cooperated to work towards agreed goals and commitments expressed in the Melbourne Declaration on the Educational Goals for Young Australians.
In Australia, joint decisions on agreed national policy and shared priorities are made through intergovernmental policy councils. For education and training in 2014, these councils are the Council of Australian Governments (COAG), the COAG Education Council and the COAG Industry and Skills Council.

51
National Report on Schooling in Australia 2014
COAG
COAG is the peak intergovernmental forum in Australia. Its members are the Prime Minister, state premiers, territory chief ministers and the president of the Australian Local Government Association.
The COAG Education Council replaced the Standing Council on School Education and Early Childhood (SCSEEC) as the ministerial council with responsibility for schooling in July 201419.
Membership of the Education Council comprises state, territory, Australian Government and New Zealand ministers with responsibility for the portfolios of school education and/or early childhood education.
The Education Council’s scope of responsibility covers:
• early childhood education and care
• primary and secondary education (including vocational education and training in schools)
• higher education
• international education20.
The COAG Education Council provides a forum through which strategic policy on education can be coordinated at the national level and through which information can be shared, and resources used collaboratively, to address issues of national significance. The Council oversees progress towards the Melbourne Declaration.
In 2014–15, the Council’s priority actions include helping to ensure all mainstream and Indigenous-specific policy, program and service delivery, improves outcomes for Indigenous people. They also include ensuring performance information is in place to monitor the outcomes and address data gaps21.
The COAG Industry and Skills Council has responsibility for national collaboration in vocational education and training (VET).
19 In this report, contemporary references to the council of Australian education ministers are to the Education Council. Historical references are to SCSEEC or to its predecessors, the Ministerial Council for Education, Early Childhood Development and Youth Affairs (MCEECDYA) and the Ministerial Council on Education, Employment, Training and Youth Affairs (MCEETYA).
20 Higher education and international education are additional responsibilities of the Education Council.
21 COAG Education Council 2014 Terms of Reference

52
National Report on Schooling in Australia 2014
Part 2.2 – Educational goals
The Melbourne Declaration on Educational Goals for Young Australians22
sets the directions for Australian schooling for the ten-year period from 2009 to 2018, as agreed to by all Australian education ministers.
The Melbourne Declaration has two overarching educational goals23 for young Australians:
22 The Melbourne Declaration on Educational Goals for Young Australians (2008) replaced the National Goals for Schooling in the Twenty-First Century (the Adelaide Declaration, agreed in 1999), which itself superseded the original National Goals for Schooling in Australia (Hobart Declaration, agreed in 1989).
23 For a full explanation of the goals, see the Melbourne Declaration, pp. 6–9.
Goal 1: Australian schooling promotes equity and excellence
Goal 2: All young Australians become successful learners, confident and creative individuals, and active and informed citizens
Commitment to Action
The Melbourne Declaration includes a Commitment to Action in eight interrelated areas in order to support the achievement of the educational goals:
• developing stronger partnerships
• supporting quality teaching and school leadership
• strengthening early childhood education
• enhancing middle years development
• supporting senior years of schooling and youth transitions
• promoting world-class curriculum and assessment
• improving educational outcomes for Indigenous youth and disadvantaged young Australians, especially those from low socio-economic backgrounds
• strengthening accountability and transparency.
Progress in 2014 in addressing the areas for action is outlined in the following sections.

53
National Report on Schooling in Australia 2014
• lift the Year 12 or equivalent or Certificate II attainment rate to 90 per cent by 2015
• lift the Year 12 or equivalent or Certificate III attainment rate to 90 per cent by 2020
• halve the gap between Indigenous and non-Indigenous students in reading, writing and numeracy by 2018
• at least halve the gap between Indigenous and non-Indigenous students’ Year 12 or equivalent attainment rates by 2020.
In May 2014, COAG agreed to a new target to close the gap in school attendance by the end of 2018.
Progress against COAG targets for education is reported in Part 3: Measuring Performance
COAG targets
In 2008, COAG set targets to lift educational attainment overall and to close the gap between the educational outcomes of Indigenous and non-Indigenous students. These are to:
54
National Report on Schooling in Australia 2014
Part 2.3 – Developing stronger partnerships
Following the commitment to develop stronger partnerships made in the Melbourne Declaration, the Australian Government and state and territory governments entered into a set of formal national partnership agreements in education through COAG. Under these agreements, Australian Government funding was provided to states and territories. States and territories contributed to the implementation of the agreements in money terms and in kind.
National partnership agreements for:
• improving teacher quality
• education in low socio-economic status school communities
• literacy and numeracy
• school construction and refurbishment24
• information and communication technology (ICT) resources in secondary schools25
• youth attainment and transitions
were implemented over four or five years from 2009, concluding in 2012 or 2013. Detailed information on these partnerships is included in previous editions of this report.
Unallocated partnership funds were redirected to needs-based funding arrangements specified in the Australian Education Act 2013, which took effect in January 2014.
Information on national partnerships for early childhood education that continued in 2014 is included in Part 2.4: Policies and priorities – strengthening early childhood.
In line with the commitment to stronger partnerships, states and territories have worked on an individual basis to establish:
• school-based partnerships with parents, carers and families; with local community groups; with Indigenous communities and between schools
• system-based partnerships with business, higher education, government agencies and others.
24 Building the Education Revolution (BER)
25 Digital Education Revolution (DER)
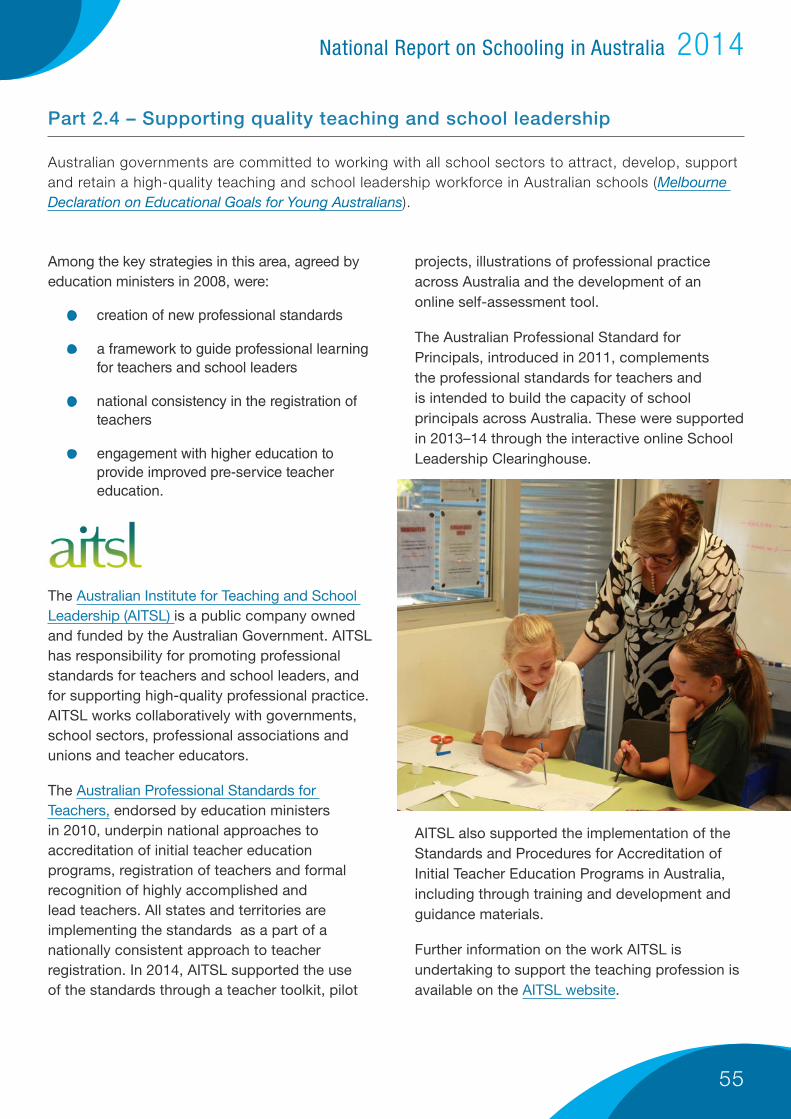
55
National Report on Schooling in Australia 2014
Part 2.4 – Supporting quality teaching and school leadership
Australian governments are committed to working with all school sectors to attract, develop, support and retain a high-quality teaching and school leadership workforce in Australian schools (Melbourne Declaration on Educational Goals for Young Australians).
Among the key strategies in this area, agreed by education ministers in 2008, were:
• creation of new professional standards
• a framework to guide professional learning for teachers and school leaders
• national consistency in the registration of teachers
• engagement with higher education to provide improved pre-service teacher education.
The Australian Institute for Teaching and School Leadership (AITSL) is a public company owned and funded by the Australian Government. AITSL has responsibility for promoting professional standards for teachers and school leaders, and for supporting high-quality professional practice. AITSL works collaboratively with governments, school sectors, professional associations and unions and teacher educators.
The Australian Professional Standards for Teachers, endorsed by education ministers in 2010, underpin national approaches to accreditation of initial teacher education programs, registration of teachers and formal recognition of highly accomplished and lead teachers. All states and territories are implementing the standards as a part of a nationally consistent approach to teacher registration. In 2014, AITSL supported the use of the standards through a teacher toolkit, pilot
projects, illustrations of professional practice across Australia and the development of an online self-assessment tool.
The Australian Professional Standard for Principals, introduced in 2011, complements the professional standards for teachers and is intended to build the capacity of school principals across Australia. These were supported in 2013–14 through the interactive online School Leadership Clearinghouse.
AITSL also supported the implementation of the Standards and Procedures for Accreditation of Initial Teacher Education Programs in Australia, including through training and development and guidance materials.
Further information on the work AITSL is undertaking to support the teaching profession is available on the AITSL website.
56
National Report on Schooling in Australia 2014
Initial teacher education
In 2014, a Teacher Education Ministerial Advisory Group was established to provide advice on changes needed to improve teacher preparation courses, with particular focus on pedagogical approaches, subject content and teaching practice.
Throughout 2014, the group conducted a consultation process with stakeholders, receiving over 170 submissions from interested groups and individuals. The final report, ‘Action Now: Classroom Ready Teachers’, was received by the Australian Government in December 2014.
Teacher workforce data
Developments in the collection of teacher workforce data in 2014 are outlined in Part 2.10: Strengthening accountability and transparency.
The More Aboriginal and Torres Strait Islander Teachers Initiative
The More Aboriginal and Torres Strait Islander Teachers Initiative (2011–2015), delivered through the University of South Australia, seeks to increase the number and retention of Aboriginal and Torres Strait Islander teachers working in schools across Australia. Strategies to enhance the professional and leadership capabilities of experienced Aboriginal and Torres Strait Islander teachers form a key component of the initiative.
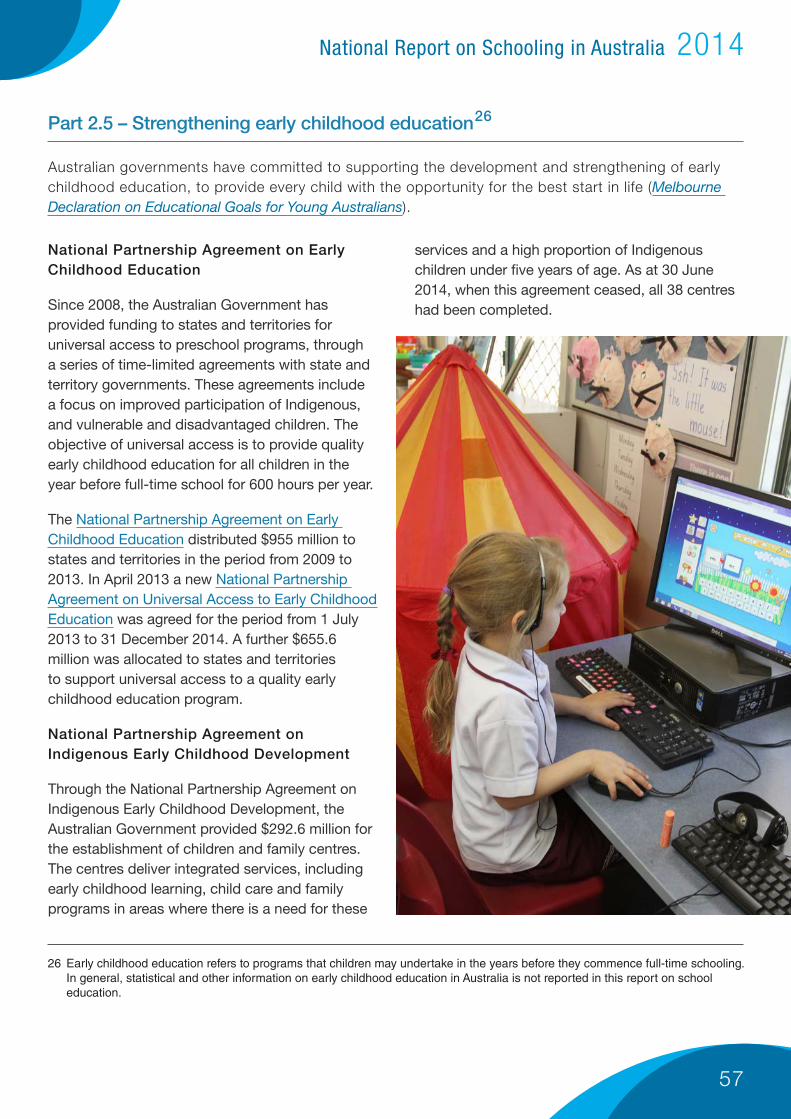
57
National Report on Schooling in Australia 2014
Part 2.5 – Strengthening early childhood education26
Australian governments have committed to supporting the development and strengthening of early childhood education, to provide every child with the opportunity for the best start in life (Melbourne Declaration on Educational Goals for Young Australians).
26 Early childhood education refers to programs that children may undertake in the years before they commence full-time schooling. In general, statistical and other information on early childhood education in Australia is not reported in this report on school education.
National Partnership Agreement on Early Childhood Education
Since 2008, the Australian Government has provided funding to states and territories for universal access to preschool programs, through a series of time-limited agreements with state and territory governments. These agreements include a focus on improved participation of Indigenous, and vulnerable and disadvantaged children. The objective of universal access is to provide quality early childhood education for all children in the year before full-time school for 600 hours per year.
The National Partnership Agreement on Early Childhood Education distributed $955 million to states and territories in the period from 2009 to 2013. In April 2013 a new National Partnership Agreement on Universal Access to Early Childhood Education was agreed for the period from 1 July 2013 to 31 December 2014. A further $655.6 million was allocated to states and territories to support universal access to a quality early childhood education program.
National Partnership Agreement on Indigenous Early Childhood Development
Through the National Partnership Agreement on Indigenous Early Childhood Development, the Australian Government provided $292.6 million for the establishment of children and family centres. The centres deliver integrated services, including early childhood learning, child care and family programs in areas where there is a need for these
services and a high proportion of Indigenous children under five years of age. As at 30 June 2014, when this agreement ceased, all 38 centres had been completed.
58
National Report on Schooling in Australia 2014
National Partnership Agreement on the National Quality Agenda for Early Childhood Education and Care
The National Partnership Agreement on the National Quality Agenda for Early Childhood Education and Care supports the National Quality Framework (NQF), introduced in 2012, which drives continuous improvement in the quality of early childhood and child care services and national consistency in service quality. The NQF applies to most long day care, family day care, kindergarten/preschool and outside school hours care services in Australia27. Regulatory authorities in each state and territory are responsible for administration of the NQF, assessing and rating services against the National Quality Standard. As at 31 December 2014, 52 per cent of services had received a quality rating. The Australian Children’s Education and Care Quality Authority (ACECQA) is a national body that supports the regulatory activities.
National Information Agreement on Early Childhood Education and Care
The National Information Agreement on Early Childhood Education and Care facilitates collection, sharing and reporting of early childhood education and care information. The agreement is a key element of COAG monitoring and reporting arrangements, especially for children in the year before school, under the National Partnership Agreement on Early Childhood Education and the Closing the Gap agenda.
State and territory initiatives
In 2014, the NSW Government implemented a new preschool funding model for community preschools to better target subsidies toward
children from disadvantaged backgrounds and those in their year before school. The NSW Government also launched the NSW Transition to School Statement to make it easier for information to be shared between families, early childhood services and schools.
The NSW Government has also committed $261 million over 2012–2016 to implement the Literacy and Numeracy Action Plan in the early years of schooling in government and non-government schools. In 2014, 337 targeted schools received support through the action plan to address the literacy and numeracy needs of more than 30,000 Kindergarten28 – Year 2 students.
To maintain a high kindergarten29 participation rate, Victoria introduced:
• An Aboriginal and Torres Strait Islander participation strategy to improve identification and increase the participation of indigenous children in kindergarten (in collaboration with local government and Aboriginal and Torres Strait Islander organisations).
• The Early Childhood Agreement for Children in Out-of-Home Care to better support young children living in out-of-home care to access maternal and child health and kindergarten services.
South Australia provided a range of services to support early nurture, wellbeing, development, education and care of the state’s children, focusing on the needs of the children and families in their local communities.
Tasmania opened 12 Child and Family Centres from 2011 to 2014. These centres aim to improve
27 In jurisdictions where preschool is currently delivered by government or non-government schools, there is an option of administering the National Quality Framework for Early Childhood Education and Care through existing government quality assurance processes with respect to preschools (National Partnership Agreement on the National Quality Agenda for Early Childhood Education and Care, Appendix B-8.53).
28 In NSW, Kindergarten is the name used for the first year of schooling.
29 In Victoria, Kindergarten is the name used for preschool early childhood education.
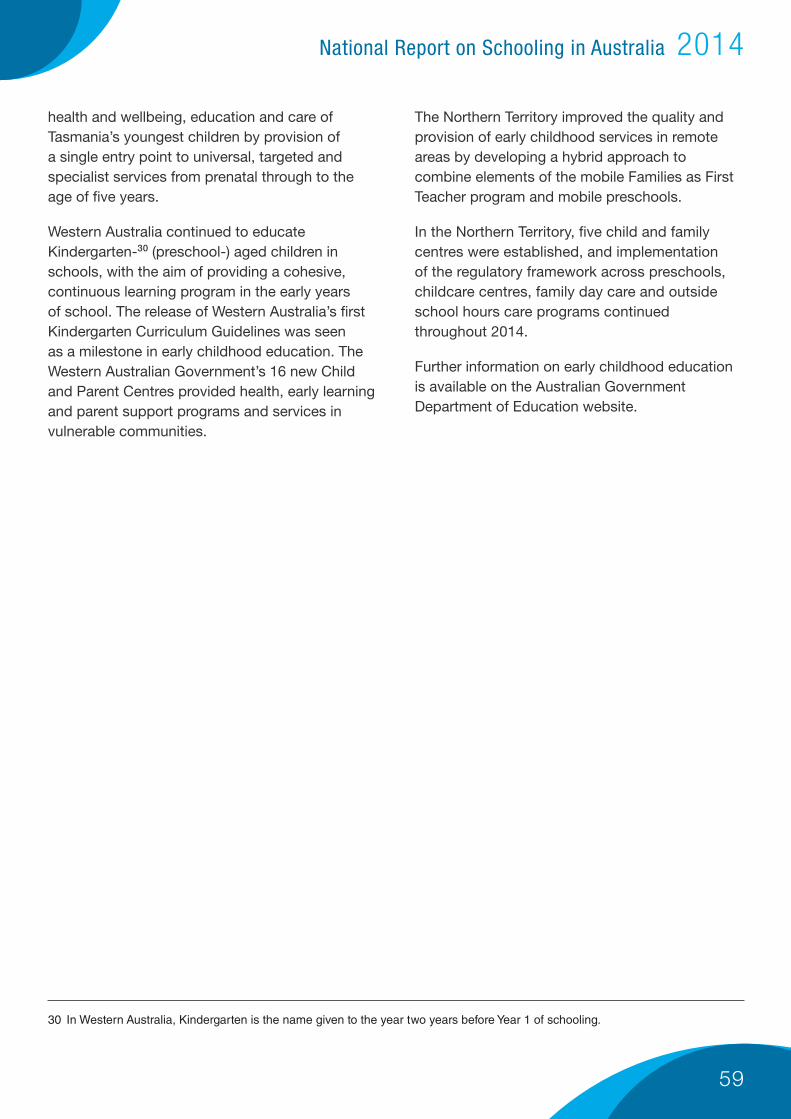
59
National Report on Schooling in Australia 2014
30 In Western Australia, Kindergarten is the name given to the year two years before Year 1 of schooling.
health and wellbeing, education and care of Tasmania’s youngest children by provision of a single entry point to universal, targeted and specialist services from prenatal through to the age of five years.
Western Australia continued to educate Kindergarten-30 (preschool-) aged children in schools, with the aim of providing a cohesive, continuous learning program in the early years of school. The release of Western Australia’s first Kindergarten Curriculum Guidelines was seen as a milestone in early childhood education. The Western Australian Government’s 16 new Child and Parent Centres provided health, early learning and parent support programs and services in vulnerable communities.
The Northern Territory improved the quality and provision of early childhood services in remote areas by developing a hybrid approach to combine elements of the mobile Families as First Teacher program and mobile preschools.
In the Northern Territory, five child and family centres were established, and implementation of the regulatory framework across preschools, childcare centres, family day care and outside school hours care programs continued throughout 2014.
Further information on early childhood education is available on the Australian Government Department of Education website.
60
National Report on Schooling in Australia 2014
Part 2.6 – Enhancing middle years development
Australian governments commit to working with all school sectors to ensure that schools provide programs that are responsive to students’ developmental and learning needs in the middle years, and which are challenging, engaging and rewarding (Melbourne Declaration on Educational Goals for Young Australians 2008).
States and territories continue to progress work in this area on an individual basis:
Victoria examined options to reform the design of secondary schooling to increase learning gain and improve transition to further education and employment for all student cohorts. The Victorian Auditor-General commenced an audit of supports for the education transitions of children, including from primary to secondary school.
In Queensland, the planned move of Year 7 from a primary to a secondary school year from 2015 was piloted in 20 government schools.
In South Australia, a range of services and policies is in place to support the learning and development of students, including individual learning plans to inform schools’ work with Aboriginal students, and the Innovative Community Action Networks program for young people who have disengaged or are at risk of disengaging from school.
In late 2013, the South Australian Department of Education and Childhood Development led a research trial of the Middle Years Development Instrument (MDI) in Australia. The MDI, developed in Canada, is a self-report survey for children aged 8–14, which covers non-academic factors relevant to learning, participation and wellbeing. The trial was conducted in 167 government and non-government schools in South Australia and 21 schools in two regional areas in Victoria. The department undertook a second MDI collection in Term 4 2014 with more than 190 schools and 17,620 students participating.
In Western Australia, preparations continued for the move of Year 7 from a primary school year to a secondary school year in 2015. This involved government schools and regional Catholic schools.
Over 2600 students in Western Australia were offered positions in Primary Extension and Challenge courses, and 17 secondary schools hosted Gifted and Talented programs. All Western Australian Catholic schools are expected to cater for gifted and talented students as a part of their differentiated teaching and learning.
In the Northern Territory, Work Like the Best, an independent review into middle years schooling, was completed and published in September 2014. The report contained 25 recommendations, which were endorsed by the government and will be progressively implemented from 2015.
The development and implementation of the Foundation – Year 10 (F–10) Australian Curriculum has also catered for the provision of challenging, engaging and rewarding programs in the middle years.

61
National Report on Schooling in Australia 2014
Examples of implementation include:
In NSW, phased implementation of new K–1031 syllabuses, incorporating the Australian curriculum, commenced in 2014. Syllabuses were developed for English, Mathematics, Science (including Science and Technology K–6) and History.
In Western Australia Phase 1 of the Australian Curriculum was being taught by most Western Australian schools in preparation
for full implementation in 2015; work had commenced on adapting the Phase 2 and 3 Australian Curriculum content to suit the needs of Western Australian students and schools.
Further information on the Australian Curriculum is provided in part 2.8 promoting world-class curriculum and assessment and on the ACARA Australian Curriculum website.
31 In NSW, the Foundation Year is Kindergarten (K).
By 2014 all states and territories had commenced implementation of Phase 1 of the F–10 curriculum, which includes English, Mathematics, Science and History.

62
National Report on Schooling in Australia 2014
Part 2.7 – Supporting senior years of schooling and youth transitions
Australian governments are committed to working with all school sectors to support the senior years of schooling and provision of high-quality pathways to facilitate effective transitions between further study, training and employment (Melbourne Declaration on Educational Goals for Young Australians 2008).
Within the Melbourne Declaration, education ministers agreed on the need for schooling to facilitate the progression of students to post-school education, training and employment:
The senior years of schooling should provide all students with the high-quality education necessary to complete their secondary school education and make the transition to further education, training or employment. Schooling should offer a range of pathways to meet the diverse needs and aspirations of all young Australians, encouraging them to pursue university or postsecondary vocational qualifications that increase their opportunities for rewarding and productive employment.
In addition, COAG established targets to lift the Year 12 or equivalent attainment rate.
In 2010 the minimum school (or approved equivalent) leaving age was raised, by national agreement, to 17 years of age. Since that time, there have been overall increases in the apparent rates of student retention to the later years of schooling, and in the proportion of 15–19-year-olds participating in education and training. These developments and progress towards the COAG educational attainment targets are reported in Part 3: Measuring and Reporting Performance.
Preparing Secondary Students for Work
Preparing Secondary Students for Work – A framework for vocational learning and VET delivered to secondary students is a policy
document released by the Education Council in December 2014. It updates the New Framework for Vocational Education in Schools originally released in 2001 by education and training ministers.
The framework was developed by representatives of government and non-government school sectors, industry organisations and the training sector. The framework is intended to ensure vocational learning, and Vocational Education and Training (VET) delivered to secondary students reflect modern schools and workplaces.
The framework clarifies the distinction between vocational learning, including career education and general work-related curriculum such as Work Studies and VET, as nationally recognised training described within an industry-developed training package or an accredited course. It emphasises that VET delivered to secondary students is the same as all other VET, and that the same quality standards apply.32
VET delivered to secondary students
Programs for the delivery of VET to secondary students, including school-based apprenticeships and traineeships, operate in all states and territories. Under these programs, school students can combine school study with training towards an accredited Australian Qualifications Framework33 (AQF) VET qualification. The achievement of a VET qualification signifies that a student has demonstrated competency against the skills and knowledge required to perform effectively in the workplace. All VET qualifications must be issued by registered training organisations (RTOs).
32 For this reason, the framework recommends that the term ‘VET delivered to secondary students’ be used in preference to the term ‘VET in Schools’ (VETiS).

63
National Report on Schooling in Australia 2014
Examples of VET for secondary students in practice in states and territories include:
• NSW students in Years 9–12 enrolled in VET courses receive recognition towards their school qualification (with some courses contributing to the Australian Tertiary Admissions Rank (ATAR)), as well as a nationally recognised VET qualification. In 2014, one third of NSW Year 11 and 12 students completed a VET course as a part of their Higher School Certificate (HSC)34.
• Enrolments in VET within the Victorian Certificate of Education (VCE) or Victorian Certificate of Applied Learning (VCAL)35 continued to grow in 2014. Industry pathways in the VCE and VCAL will be introduced from 2015, following successful pilots completed in 2014, which incorporated VET, work placement and further studies all related to a specific industry theme. A guide on school-based apprenticeships and traineeships to support Victorian schools, students, parents and employers was published.
• In 2014, 5,558 students completed the South Australian Certificate of Education (SACE)36 with a VET component, (41 per cent of SACE completers). A survey conducted in October 2014 reported 255 industry pathways programs leading to Certificate III pathways in 106 South Australian secondary schools, with more than 10,000 students enrolled. By the end of 2014, more than 6,000 students had
successfully commenced Trade Schools.
• In Western Australia, two-thirds of Year 11 and 12 government school students participated in VET programs. The Aboriginal School-Based Training Program supported students to develop workplace skills.
Trade Training Centres in Schools Program
The Trade Training Centres in Schools Program, which commenced in 2008, was designed to provide secondary students with access to modern facilities to undertake VET. Funding has been provided to construct new or upgrade existing training facilities and install state-of-the-art industry standard equipment. $1.4 billion funding has been approved for 511 projects benefiting 1,289 schools.
In 2014, 355 trade training centres and one trades skills centre were operational with over 30,000 enrolments. Certificate II courses had the highest proportion of enrolments. The food/hospitality, building/construction, engineering and automotive training streams had the greatest number of enrolments.
The Trade Training Centres in Schools Independent Review (2014) identified that the two critical success factors for these trade centres were strong school leadership and local employer engagement.
33 The AQF is the national framework of qualifications in the school, vocational education and training (VET), and higher education sectors in Australia. The Senior Secondary Certificate of Education, Certificate II and Certificate III are qualifications within the AQF.
34 The HSC is the NSW senior secondary certificate of education.
35 VCE and VCAL are the Victorian senior secondary certificates of education.
36 SACE is the South Australian senior secondary certificate of education.

64
National Report on Schooling in Australia 2014
Career education resources and initiatives
myfuture is Australia’s national online career information and exploration service created to assist career planning, career pathways and work transitions. It is accessed by a range of users including secondary school students, school leavers, parents, teachers, career practitioners and adults.
The myfuture website was updated and relaunched in December 2013. Throughout
2014, the website was jointly funded by the Australian Government, and state and territory governments through the Education Council.
The Job Guide publication helps young people to explore entry level occupations and to make subject choices. The Job Guide also provides information for those who have a role in supporting students, such as teachers, career practitioners in schools and employment service providers. In 2014 the Job Guide was distributed to all Australian schools with Year 10 students.
In Victoria, a modified Regional Career Development Officer program continued to strengthen careers practitioners’ capacity to deliver improved services to young people. This complemented the work of School University Liaison Officers on capacity building within Victorian low SES schools to increase low SES students’ participation in higher education.
In Western Australia, government schools, community organisations and registered training providers received $2.5 million to support 28 initiatives specifically to address student disengagement.
To successfully meet the literacy and numeracy requirement to achieve the Western Australian Certificate of Education (WACE) from 2016, Year 10 students had the opportunity to sit the Online Literacy and Numeracy Assessment (OLNA).
Further information on senior schooling and youth transitions is provided in Part 3: Measuring performance
Examples of measures to support senior students and transitions in states and territories include:
65
National Report on Schooling in Australia 2014
Part 2.8 – Promoting world-class curriculum and assessment
Australian governments are committed to working together with all school sectors to ensure world-class curriculum and assessment for Australia at national and local levels (Melbourne Declaration on Educational Goals for Young Australians 2008).
The Australian Curriculum, Assessment and Reporting Authority
The Australian Curriculum, Assessment and Reporting Authority (ACARA) is an independent statutory authority responsible to the Education Council.
In terms of curriculum and assessment, the functions of ACARA37 are to:
• develop and administer a national school curriculum, including content of the curriculum and achievement standards, for school subjects specified in the charter38
• develop and administer national assessments
• provide school curriculum resource services
• provide information, resources, support and guidance to the teaching profession.
The ACARA Charter specifies strategic directions for the authority in the key areas of curriculum and assessment at the national level as:
1. a national curriculum from Foundation39 to Year 12 (F–12) in specified learning areas
2. a national assessment program aligned to the national curriculum, that measures students’ progress.
2.8.1 The Australian Curriculum
State, territory and the Australian governments, and all school sectors work with ACARA to ensure world-class curriculum in Australia. The processes used to develop the curriculum are available on the ACARA website.
Reflecting the goals of the Melbourne Declaration, the Australian Curriculum is described as a three-dimensional curriculum that recognises the central
importance of disciplinary knowledge, skills and understanding; general capabilities and cross-curriculum priorities.
37 Australian Curriculum, Assessment and Reporting Authority Act (2008), Section 6. (ACARA’s functions in data collection and reporting are outlined in Part 2.10: Policies and priorities – strengthening accountability and transparency.)
38 Education Council determines the ACARA Charter and specifies subjects for development within the charter and letter of expectations.
39 The Foundation Year (first year of full-time schooling) is known as Preparatory in Victoria, Queensland and Tasmania; Kindergarten in New South Wales and the Australian Capital Territory; Reception in South Australia; Pre-primary in Western Australia; and Transition in the Northern Territory.

66
National Report on Schooling in Australia 2014
Learning areas
Disciplinary knowledge, skills and understanding are found in the eight learning areas of the Australian Curriculum. During 2014, ACARA made significant progress towards the development and publication of a full Australian curriculum. In addition to the already published F–12 curricula for English, Mathematics, Science, History and Geography, the following curricula were made available on the Australian Curriculum website:
• F–10 Australian Curriculum for Health and Physical Education, Economics and Business, Civics and Citizenship, Technologies and The Arts in February 2014
• F–10 Australian Curriculum for languages for Chinese, French, Indonesian and Italian in June 2014
• Australian Curriculum: Work Studies, an optional subject for students in Years 9 and 10, in October 2014.
In May 2014 the Australian Government announced in that it would fund a further stage of language curricula development. In August 2014, curriculum development of Hindi, Turkish, Australian Sign Language (Auslan) and Classical languages was referred to ACARA.
In 2014, states, territories and ACARA together explored the improvement of the Australian Curriculum senior secondary achievement standards and processes, options and timelines for further senior secondary Australian Curriculum subjects, with the findings reported to the Education Council. No consensus was reached and the chief finding of the discussions was that the no additional senior secondary development was possible at this time.
General capabilities
Alongside disciplinary knowledge, the Australian Curriculum provides seven general capabilities.
The general capabilities comprise an integrated and interconnected set of knowledge, skills, behaviours and dispositions that equip students to be lifelong learners and to be able to operate with confidence in a complex, information-rich, globalised world. General capabilities are developed and applied, where relevant, through the learning areas.
Intensive work was undertaken in 2014 to review the identification of general capabilities in learning area content and resulted in general capabilities being identified, to the sub-element level, in content descriptions and content elaborations in all eight Australian Curriculum learning areas.
Cross-curriculum priorities
The Australian Curriculum also includes three current cross-curriculum priorities that are developed, where relevant, through the learning areas. These are: Aboriginal and Torres Strait Islander Histories and Cultures; Asia and Australia’s Engagement with Asia; and Sustainability. The priorities are not separate subjects in themselves; they are addressed through learning area content, where appropriate.
The mapping of cross-curriculum priority organising ideas to content across and between all learning areas was completed in 2014.
Implementation
In 2014 all states and territories were implementing the Australian Curriculum in English, Mathematics, Science and History. To assist schools in the implementation, ACARA developed and published support material, including:
• enhanced student work sample portfolios for F–10 English, Mathematics, Science and History, which illustrate three levels of student achievement at each year level
• illustrations of personalised learning to the ‘Student diversity’ section of the
67
National Report on Schooling in Australia 2014
Australian Curriculum website; each illustration presents a view of school-based examples of teaching/learning from diverse school settings.
Throughout 2014, state and territory curriculum directors and peak bodies in primary education worked with ACARA to share approaches being taken to the implementation of the Australian Curriculum in primary schools nationally. This included capturing and sharing illustrations of successful implementation, a quarterly newsletter and improvements to the functionality of the Australian Curriculum website.
Continued collaboration between ACARA, Education Services Australia (ESA) and the Australian Institute for Teaching and School Leadership (AITSL) has further enhanced online resource discovery, development and access, as well as professional learning in relation to the Australian Curriculum.
Monitoring
ACARA’s Charter requires the authority to advise on the most effective processes for ensuring the continuous improvement of the Australian Curriculum. This improvement must reflect evidence and the experience of the various stakeholders as they engage with the curriculum.
The first report, Monitoring the effectiveness of the Australian Curriculum, was completed by the ACARA in October 2014. All state and territory curriculum and school authorities were formally invited to provide feedback on their implementation of the Australian Curriculum; this contributed directly to the report.
Review of the Australian Curriculum
During 2014, the Australian Government commissioned a review of the Australian Curriculum. The terms of reference of the review described it as an evaluation of the development and implementation of the Australian Curriculum,
its main brief being to consider the robustness, independence and balance of the curriculum and an examination of its content and its development and refinement processes.
The final report of the review was released on 12 October 2014 and is available on the Australian Government’s Students First website. The report made 30 key recommendations on issues as diverse as the inclusion of phonics and phonemic awareness in the Australian Curriculum: English and the composition of ACARA’s Board.
The release of the Initial Australian Government Response to the review was timed with the release of the final report of the review and encompassed five themes. The response proposed that if the five themes were addressed in a collaborative manner, a strong, robust national curriculum would result. The five themes were:
iii. Resolving the overcrowded curriculum
iv. Improving parental engagement around the curriculum
v. Improving accessibility for all students
vi. Rebalancing the curriculum; and
vii. Reviewing the governance of ACARA.
At the December 2014 Education Council meeting, ministers referred the review recommendations relating to themes i–iv to ACARA for advice.
Alternative curriculum frameworks
ACARA administers a process to assess the extent to which well-established alternative curriculum frameworks can deliver educational outcomes that are comparable with those delivered by the Australian Curriculum. The assessment process is undertaken by a recognition committee, with the results published on ACARA’s Recognition Register.
68
National Report on Schooling in Australia 2014
2.8.2 The National Assessment Program
The National Assessment Program (NAP) is an ongoing program of national assessments run at the direction of the Education Council. The NAP includes:
• the annual national literacy and numeracy tests (NAPLAN)
• three-yearly sample assessments in science literacy, civics and citizenship, and information and communication technology (ICT) literacy
• Australia’s participation in international assessments.
NAP provides the measure through which governments, education authorities and schools can determine whether or not young Australians are meeting important educational outcomes.
National Assessment Program – Literacy and Numeracy (NAPLAN)
The National Assessment Program – Literacy and Numeracy (NAPLAN) is an annual national assessment for all students in Years 3, 5, 7 and 9. All students in these year levels are expected to participate in tests in reading, writing, language conventions (spelling, grammar and punctuation) and numeracy.
NAPLAN tests were first conducted in 2008, replacing former state- and territory-based literacy and numeracy tests. ACARA has been responsible for the development and oversight of the delivery of the NAPLAN tests since 2010.
For national reporting purposes, key performance measures (KPMs) have been approved by ministers for reading, writing, numeracy and participation. These KPMs are reported for NAPLAN 2014 in Part 3: Measuring performance.
The National Assessment Program – sample assessments
The national sample assessments test students’ skills and understanding in science literacy (Year
6), civics and citizenship literacy (Years 6 and 10) and information and communication technology (ICT) literacy (Years 6 and 10). Sample groups of students participate in these assessments, which are held on a rolling three-yearly basis. Sample assessments began in 2003 with science literacy, followed by civics and citizenship literacy in 2004 and ICT literacy in 2005.
The fourth cycle of the NAP–ICTL sample assessment was administered between October and November 2014. Approximately 11,000 students in Year 6 and Year 10 from 649 government and non-government schools participated in the online assessment. Students were from all states and territories including metropolitan, regional and remote areas. The KPM for NAP ICTL 2014 is reported in Part 3: Measuring performance.
National Assessment Program – international assessments
There are two NAP sample assessments, conducted by international organisations, which are used as a basis for key performance measures in the Measurement Framework for Schooling in Australia: the Programme for International Student Assessment (PISA) and the Trends in International Mathematics and Science Study (TIMSS).
PISA is conducted every three years by the Organisation for Economic Co-operation and Development (OECD) and involves assessment of a sample of 15-year-old students in reading, mathematical and scientific literacy. The most recent PISA assessment was conducted in 2012 and was reported in the National Report on Schooling in Australia 2012. Reports and key findings from PISA 2012 are available on the Australian Council for Educational Research (ACER) website. The next PISA assessment is scheduled for 2015.
69
National Report on Schooling in Australia 2014
TIMSS is a four-yearly international sample assessment of student achievement in mathematics and science at Years 4 and 8, administered by the International Association for the Evaluation of Educational Achievement (IEA). The most recent TIMSS assessment was TIMSS 2011. Information on the performance of Australian students in TIMSS 2011 is available on the ACER website. The next TIMMS assessment is scheduled for 2015.
National online assessment
In October 2014, education ministers agreed that NAPLAN online would be implemented from 2017 on an opt-in basis over two–three years (no later than 2019). Jurisdictions, school systems and schools will determine implementation, based on readiness, to ensure an effective and efficient transition. NAPLAN online will provide better assessment, more precise results and faster turnaround of information.
An online assessment platform is being built by Education Services Australia, with funds from the Australian Government. The platform will be used to trial online assessment both through a practice environment and the NAP sample program in 2016.
ACARA is working to develop national protocols and the associated operational policy for NAPLAN online. This work, along with the development and implementation of a national communications strategy, will continue until the start of NAPLAN online in 2017.
Online assessment research
ACARA is responsible for developing the NAPLAN tests and for research to support the move online. Significant planning, development, research and trialling are going on behind the scenes to make sure everyone will be ready to move NAPLAN online.
A key element in ACARA’s work is a comprehensive research and development program that will assist the preparation for delivery of NAPLAN online tests from 2017.
In September 2014, ACARA released the results of its National Assessment and Surveys Online Program: tailored test design 2013 study.
Key findings from the research, completed by ACARA and funded by the Australian Government, have revealed that the tailored test design – a key concept in the move to online assessment – is sound, feasible and more engaging for students. The research also found that as many as 50 per cent of students, particularly high- and low-achieving students, will have an enhanced assessment experience.
As students concluded the trials of online tailored test design, they reported feeling more positive and accomplished, regardless of their abilities and educational background. The trials also provided an opportunity for students to be assessed by tests catering to their needs and provided more accurate and timely diagnostic information about student learning needs.
In August and September 2014 ACARA conducted the second trial of the multistage adaptive test (‘the tailored test design’) in numeracy and reading. A pilot study of spelling, grammar and punctuation was also conducted. Spelling items were delivered to students via audio files. More than 39,000 tests were delivered in 260 schools during the trial period.
In some schools, researchers conducted cognitive interviews with students, designed to investigate the impact of the test design on students’ test-taking behaviour. This also involved gathering information about students’ interactions with technically enhanced item types and more difficult questions. The results of this research will be published in 2015. Further information on online assessment is available on ACARA’s NAP website.

70
National Report on Schooling in Australia 2014
You’re not alone…
TEACHERS: Help teachers to challenge higher performers and identify students needing support.
NATIONAL STANDARDS:KNOWLEDGE:
Comparable data about literacy and numeracy standards.
EQUITY:
A fair go for all Australian students.
Open conversation about the important skills of literacy and numeracy.
SCHOOLS: Map student progress, identify strengths and weaknesses in teaching programs and set goals.
Students take the test in years 3, 5, 7
and 9.
No pass. No fail. Familiarisation is important.
Drilling and excessive practice is unnecessary.
TEST DOMAINS
sit the NAPLAN test.
NAPLAN provides bene�ts from the ground up for students, schools and Australian education systems.
Students and parents: Discuss progress with teachers and compare performance against
national peers.
School systems and governments:
Valuable data to support good teaching and
learning, and school improvement.
NAPLANNAPLANNational Assessment Program – Literacy and Numeracy
The data and information we gain from NAPLAN drives ongoing improvement at school, state and national levels.
www.nap.edu.au
LANGUAGE CONVENTIONS
NUMERACY
WRITING
READING
??
??
??
Infographic showing NAPLAN benefits from the ground up for students, schools and Australian education systems.
Figure 2.1
71
National Report on Schooling in Australia 2014
Part 2.9 – Improving educational outcomes for Indigenous youth and disadvantaged young Australians, especially those from low socio-economic backgrounds
The first goal of the Melbourne Declaration on Educational Goals for Young Australians schooling promotes equity and excellence.
Within the Melbourne Declaration, education ministers acknowledged that:
• Educational outcomes for Indigenous40 children and young people are substantially behind those of other students in key areas of enrolment, attendance, participation, literacy, numeracy, retention and completion.
• Students from low socio-economic backgrounds, those from remote areas, refugees, homeless young people, and students with disabilities often experience educational disadvantage.
• Australian governments must support all young Australians to achieve not only equality of opportunity, but also more equitable outcomes.
• Ministers committed Australian governments to working with all school sectors to:
• ‘close the gap’ for young Indigenous Australians
• provide targeted support to disadvantaged students
• focus on school improvement in low socio-economic communities.
COAG also set targets to lift educational attainment overall and to close the gap between the educational outcomes of Indigenous and non-Indigenous students. Progress towards these targets is reported in Part 3: Measuring performance.
Aboriginal and Torres Strait Islander youth
State and territory governments, non-government education authorities and Aboriginal and Torres Strait Islander communities are working in collaboration to close the gap between the outcomes of schooling for Aboriginal and Torres Strait Islander and non-Indigenous students.
The Aboriginal and Torres Strait Islander Education Action Plan 2010–2014 was developed as a commitment under the Melbourne Declaration and as a part of the COAG reform agenda to improve life outcomes for Aboriginal and Torres Strait Islander Australians.
The action plan sought to bring together commitments made through the National Indigenous Reform Agreement (NIRA) with other commitments by governments for reforms in early childhood education, schooling and youth engagement. The action plan focused on six priority areas identified as having the greatest impact on closing the gap.
Annual reports for 2012, 2011 and 2010 on progress against the action plan are available on the SCSEEC website.
Under the action plan, a key group of focus schools were identified as sites for specific action. The Investing in Focus Schools Project was a $40-million initiative over two years from 2012. Funding was provided as a one-off payment to states and territories under a project agreement. The initiative supported approximately 300 government and non-government schools
40 The Melbourne Declaration and national data collections use the term ‘Indigenous’ to refer to Australia’s Aboriginal and Torres Strait Islander people. Where possible, this report uses ‘Aboriginal and Torres Strait Islander’ in preference to the term ‘Indigenous’.

72
National Report on Schooling in Australia 2014
(selected by states and territories) to complement and accelerate implementation of local level actions in the engagement and connections, attendance, and literacy and numeracy domains of the action plan.
The Focus Schools Next Steps Initiative was an Australian Government commitment of $30 million under the Indigenous Education (Targeted Assistance) Act 2000. The two-year funding, finishing in 2014, assisted approximately 100 schools (selected by states and territories) to address the attendance, engagement and educational achievement of Aboriginal and Torres Strait Islander students.
In 2014 an independent review of Indigenous Education in the Northern Territory, A Share in the Future, was completed. The review made a number of recommendations to government, which are being implemented as a part of A Share in the Future Indigenous Education Strategy 2015–2024.
More information on initiatives for Aboriginal and Torres Strait Islander youth is available on the Australian Government’s Indigenous website.
Low socio-economic status school communities
All governments have agreed that they have mutual interest in, and shared responsibility for, improving educational outcomes in low socio-economic status (SES) school communities and in supporting reforms in the way schooling is delivered to those communities.
Unallocated funds from the former National Partnership for Low Socio-economic Status School Communities (which was due to conclude in 2015) were redirected to needs-based funding arrangements in the Australian Education Act 2013, applying from January 2014.

73
National Report on Schooling in Australia 2014
Part 2.10 – Strengthening accountabilityand transparency
The Melbourne Declaration on Educational Goals for Young Australians emphasises transparency in reporting educational information to the community and accountability for the use of public resources for education.
This includes access to national reporting on the performance of all schools, contextual information and information about individual schools’ enrolment profile.
In the Melbourne Declaration, Australian governments committed to working with all school sectors to ensure that public reporting of education:
• focuses on improving performance and student outcomes
• is both locally and nationally relevant
• is timely, consistent and comparable.
The Australian Curriculum, Assessment and Reporting Authority
In terms of data collection and reporting, the functions of ACARA are to:
• collect, manage and analyse student assessment data and other data relating to schools and comparative school performance
• facilitate information-sharing arrangements between Australian government bodies in relation to the collection, management and analysis of school data
• publish information relating to school education, including information relating to comparative school performance.
ACARA’s reporting priorities under its charter include:
• the monitoring and review of the Measurement Framework for Schooling in Australia, which sets out agreed national key performance measures (KPMs) for schooling
• producing a comprehensive and authoritative National Report on Schooling in Australia related to the Melbourne Declaration and national KPMs
• developing, or supporting the development of, national definitions
• managing the collection, quality assurance and reporting of school information through the My School website.
Measurement Framework for Schooling in Australia
In 2014 ACARA commenced a periodic review of the Measurement Framework for Schooling in Australia, to take effect from the 2015 reporting year. National reporting for 2014 reflects the Measurement Framework for Schooling in Australia 2012.
National Report on Schooling in Australia
In 2014 ACARA published the majority of the National Report on Schooling in Australia 2012 on behalf of the Education Council. ACARA also undertook the preparation of the National Report on Schooling in Australia 2013 in consultation with representatives of state and territory education authorities, other government agencies, and non-government school sectors. Work also commenced on a plan to publish the data contained in the report in a more interactive form from the 2014 reporting year.
74
National Report on Schooling in Australia 2014
Student attendance data reporting
From the 2014 reporting year, nationally comparable student attendance data are being collected, as set out in the National Standards for Student Attendance Data Reporting. All jurisdictions and sectors have agreed to provide student attendance data that comply with these standards, with the non-government sectors complying with the standards from 2013 onwards; government schools in all jurisdictions except NSW, from 2014; and with NSW government schools working towards implementing the standards in 2016.
The National Report on Schooling in Australia 2014 is the first edition of this report in which the national KPM for the rate of student attendance for Years 1–10 is reported.41
During 2014, at the direction of COAG and the Education Council, ACARA developed new national and school level measures of the proportion of Year 1–10 students, whose attendance rate is 90 per cent or more, disaggregated by Indigenous status. The measures were developed in collaboration with jurisdictions and school sectors and are due to take effect from the 2015 reporting year.
My School
ACARA is responsible for the national data collection on individual schools housed on the My School website. The fifth My School release occurred on 5 March 2014.
My School provides an opportunity for educators, parents and the wider community to view up-to-date information on all schools across Australia, and to make comparisons between them.
A new feature of the 2014 My School release was a mapping function, which allows visitors to the
site to view the school’s location and other local schools on the same map. ACARA also enhanced the calculation of the index of community socio-educational advantage (ICSEA). In the 2013–14 financial year, there were over 17 million page views of the My School website.
In mid-2014 ACARA commissioned qualitative research with parents, principals, partners and stakeholder groups to evaluate the My School website. This research ran in parallel with the Australian Government-initiated My School Review.
In December 2014, as a part of the COAG initiative to help improve student attendance rates, the My School website was updated to include student attendance data disaggregated by indigeneity.
Australian Schools List
In 2014 ACARA began work to establish and maintain a current Australian Schools List (ASL). This work will support national assessment and reporting activities.
Third party data provision
In 2014 ACARA also began a review of its Data Access Protocols 2012, with the aim of streamlining ACARA’s data access processes to facilitate timely provision of data from the NAP and other ACARA data collections to school authorities and researchers.
Teacher workforce data
The National Teacher Workforce Dataset comprises data from teacher employers and registration authorities collected between 2012 and 2013 on approximately 440,000 individual teachers. It includes data on teacher demographics, qualifications, registration status and current employment. A set of three reports was released in 2014. While the dataset is a point-
41 The national KPMs for schooling are reported in Part 3: Measuring and reporting performance.

75
National Report on Schooling in Australia 2014
in-time collection, it may inform potential ongoing collections of teacher workforce data.
The Staff in Australia’s Schools (SiAS) 2013 report was also released in 2014. SiAS 2013 surveyed 5,213 primary and 10,349 secondary teachers and school leaders in 765 primary and 874 secondary schools to provide information on a wide range of teacher workforce issues including initial teacher education, employment, job satisfaction, career paths and intentions, principal authority and teacher appraisal.
The OECD 2013 Teaching and Learning International Survey (TALIS) collected data on the learning environment and working conditions of teachers across 34 countries and economies. The Australian country report, Australian Teachers and the Learning Environment, an Analysis of Teacher Response to TALIS 2013, containing information from over 2,000 teachers of Years 7–10 and 116 principals, was released in August 2014.

76
National Report on Schooling in Australia 2014
Measuring and reporting performance
Part 3
80
National Report on Schooling in Australia 2014
Part 3: Measuring and reporting performance
Part 3 reports on the performance of Australian schooling in 2014, using the nationally agreed key performance measures (KPMs) for schooling specified in the Measurement Framework for Schooling in Australia 2012.
Part 3.1 – Measurement Framework for Schooling in Australia
The Measurement Framework for Schooling in Australia 2012 provides the basis for national reporting on the performance of schooling in 2014, as agreed by education ministers, and is the main focus of the statistical data included in this report.
The measurement framework defines 23 national key performance measures (KPMs) for schooling, specifies the data sources for these KPMs and outlines the reporting cycle for the period 2012–201742.
By intent, the KPMs contained in the measurement framework are:
• strategic measures that provide nationally comparable data on aspects of performance critical to monitoring progress against the Melbourne Declaration
• focused on student participation, achievement, attainment and equity
• based on sound and reliable assessment practice
• supportive of open and transparent reporting
• relevant and of interest to the public
• cost-effective, practical to collect, and take account of the burden and impact that data collection may place on students, schools and schooling systems
For national reporting purposes, KPMs for student participation, achievement and attainment are disaggregated by equity measures: Indigenous status; sex; geolocation; socio-economic status and language background; where it is possible and appropriate to do so43.
42 Most KPMs are reported annually but some are collected and reported on a cyclical basis of three, four or five years.
43 With the exception of retention to Year 12 by Indigenous students, which relates to COAG targets for Closing the Gap, equity measures are not listed separately in the schedule of KPMs contained in the measurement framework.
81
National Report on Schooling in Australia 2014
Part 3.2 – Student participation
Part 3.2 reports on KPMs for student enrolment and attendance specified in the Measurement Framework for Schooling in Australia 2012. It also reports on apparent retention from Year 10 to Year 12 including the KPM for retention to Year 12 for Indigenous students.
3.2.1 Enrolment
Part 1.2 of this report provides data on the number of students enrolled by school sector, by school level, by state and territory and over time. This part reports on the number of students enrolled as a proportion the Australian population in the relevant age group, as a KPM for schooling. This is a measure of the coverage of Australian schooling and of the extent to which young people have access to school education. The KPM is specified as the number of students aged 6–15 years enrolled in school, expressed as a proportion of the 6–15-year-old population. This approximates the age range of students for whom schooling is compulsory.
Key Performance Measure 1(a)
Proportion of children aged 6–15 years who are enrolled in school
The numerator for this measure is school enrolment data drawn from the National Schools Statistics Collection (NSSC). The denominator for the 6–15-year-old population is drawn from the Estimated Residential Population (ERP) for this age group, which is estimated by projection from the five-yearly Australian Census of Population and Housing.
KPM 1(a) is reported by state and territory for 2014 in Table 3.1.

82
National Report on Schooling in Australia 2014
NSW Vic. Qld SA WA Tas. NT ACT Australia
Number of children aged 6 to 15 years enrolled in school(a)
914,500 697,766 619,742 198,468 313,188 63,443 32,907 49,278 2,889,292
Total 6 to 15-year-old population(b) 916,428 689,175 613,577 196,526 317,013 63,892 34,462 44,532 2,875,953
Proportion of 6 to 15-year-old population enrolled in school (%)
99.79 101.25 101.00 100.99 98.79 99.30 95.49 110.66 100.46
(a) Enrolment data are drawn from the National Schools Statistics Collection (NSSC) published in ABS Cat. No. 4221 Schools Australia. Includes students enrolled full-time or part-time. Jervis Bay enrolments are included with ACT; Norfolk Island enrolments are included with NSW. ‘Other territory’ enrolments are excluded. Data include students who cross state and territory boundaries to attend school. In the case of the ACT this causes the proportion to significantly exceed 100 per cent.
(b) Estimates for the total population are at 30 June each year and are sourced from the most recent release of ABS, Cat. No. 3101.0, Australian Demographic Statistics. As estimates, ERP figures are subject to error and to periodic revision. The Australian totals include ‘other territories’ including Jervis Bay and Norfolk Island. However, Jervis Bay and Norfolk Island are excluded from ACT and NSW totals. Therefore, state and territory Estimated Resident Population numbers will not add to Australian totals
Note: When developing an indicator using data from different sources, significant data comparability issues can emerge that will affect the accuracy of the indicator. These differences can have unexpected effects such as producing an estimate greater than 100 per cent of the population. Differences in this KPM should be interpreted with care.
Sources: ABS, Cat. No. 4221.0, Schools, Australia, 2014; ABS, Cat. No. 3101.0, Australian Demographic Statistics, Australian States and Territories, September 2015
Number and proportion of the population aged 6–15 years enrolled in school, by state and territory, 2014
Table 3.1
KPM 1(a) for the period 2009–2014 is reported in table 3.2.
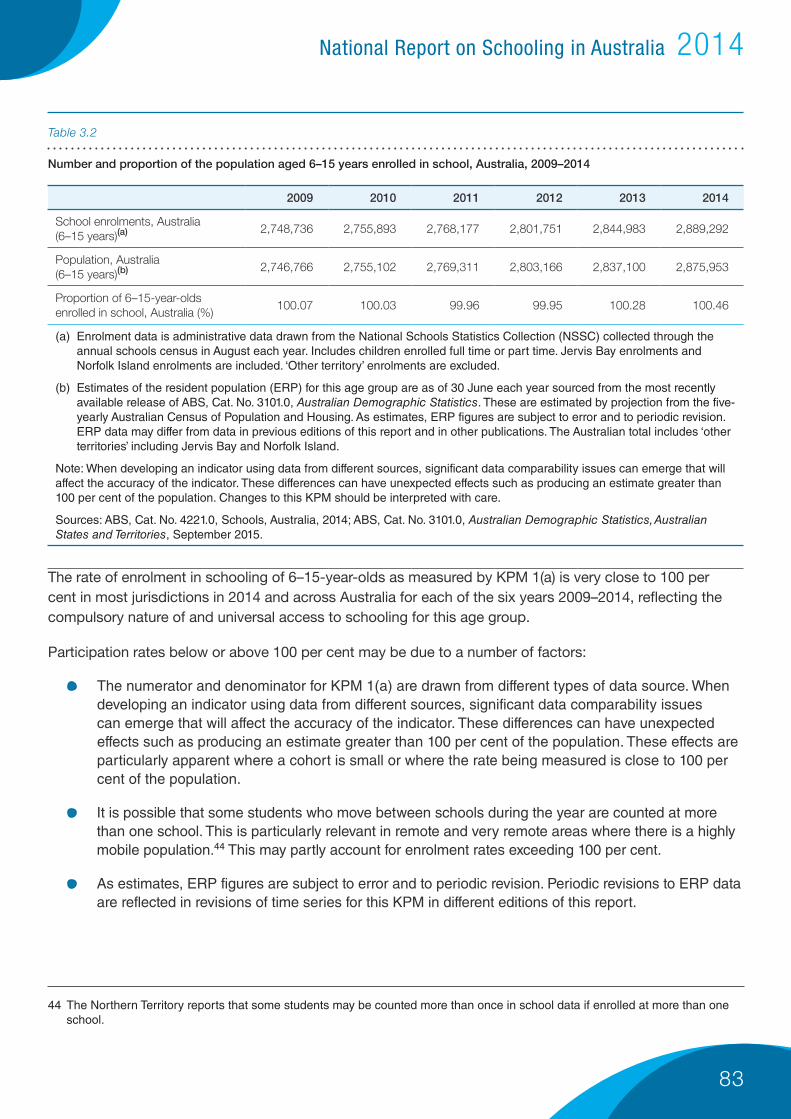
83
National Report on Schooling in Australia 2014
Number and proportion of the population aged 6–15 years enrolled in school, Australia, 2009–2014
Table 3.2
2009 2010 2011 2012 2013 2014
School enrolments, Australia (6–15 years)(a) 2,748,736 2,755,893 2,768,177 2,801,751 2,844,983 2,889,292
Population, Australia (6–15 years)(b) 2,746,766 2,755,102 2,769,311 2,803,166 2,837,100 2,875,953
Proportion of 6–15-year-olds enrolled in school, Australia (%)
100.07 100.03 99.96 99.95 100.28 100.46
(a) Enrolment data is administrative data drawn from the National Schools Statistics Collection (NSSC) collected through the annual schools census in August each year. Includes children enrolled full time or part time. Jervis Bay enrolments and Norfolk Island enrolments are included. ‘Other territory’ enrolments are excluded.
(b) Estimates of the resident population (ERP) for this age group are as of 30 June each year sourced from the most recently available release of ABS, Cat. No. 3101.0, Australian Demographic Statistics. These are estimated by projection from the five-yearly Australian Census of Population and Housing. As estimates, ERP figures are subject to error and to periodic revision. ERP data may differ from data in previous editions of this report and in other publications. The Australian total includes ‘other territories’ including Jervis Bay and Norfolk Island.
Note: When developing an indicator using data from different sources, significant data comparability issues can emerge that will affect the accuracy of the indicator. These differences can have unexpected effects such as producing an estimate greater than 100 per cent of the population. Changes to this KPM should be interpreted with care.
Sources: ABS, Cat. No. 4221.0, Schools, Australia, 2014; ABS, Cat. No. 3101.0, Australian Demographic Statistics, Australian States and Territories, September 2015.
The rate of enrolment in schooling of 6–15-year-olds as measured by KPM 1(a) is very close to 100 per cent in most jurisdictions in 2014 and across Australia for each of the six years 2009–2014, reflecting the compulsory nature of and universal access to schooling for this age group.
Participation rates below or above 100 per cent may be due to a number of factors:
• The numerator and denominator for KPM 1(a) are drawn from different types of data source. When developing an indicator using data from different sources, significant data comparability issues can emerge that will affect the accuracy of the indicator. These differences can have unexpected effects such as producing an estimate greater than 100 per cent of the population. These effects are particularly apparent where a cohort is small or where the rate being measured is close to 100 per cent of the population.
• It is possible that some students who move between schools during the year are counted at more than one school. This is particularly relevant in remote and very remote areas where there is a highly mobile population.44 This may partly account for enrolment rates exceeding 100 per cent.
• As estimates, ERP figures are subject to error and to periodic revision. Periodic revisions to ERP data are reflected in revisions of time series for this KPM in different editions of this report.
44 The Northern Territory reports that some students may be counted more than once in school data if enrolled at more than one school.
84
National Report on Schooling in Australia 2014
• Enrolment rates for states and territories are also affected by the inclusion of students who cross state and territory boundaries to attend school. These students are counted in the school population of one state but the residential population of another. This occurs in many areas close to state and territory boundaries but, in most cases, movement occurs in both directions or is too small to noticeably influence the overall rate for the state. However, in the case of the ACT, the number of students from interstate (and children of embassy staff)45 attending ACT schools causes the proportion of 6–15-year-olds enrolled in school to significantly exceed 100 per cent.
Because of these factors, further disaggregation of this KPM is unreliable and jurisdictions have agreed that it will be reported at state and national levels only.
45 Children of embassy staff attending Canberra schools are counted in ACT school enrolments but are not included in ERP.
3.2.2 Attendance
As with enrolment, the national KPM for attendance specified in the Measurement Framework for Schooling in Australia 2012 relates to students in the compulsory years of schooling.
Key Performance Measure 1(b)
The number of actual full-time equivalent student-days attended by full-time students in Years 1 to 10 as a percentage of the total number of possible
student-days attended over the period.
From 2013, a common reference period of Semester 1 in each school year has been adopted by all school sectors in all states and territories for the collection of these data.
This is consistent with the National Standards for Student Attendance Data Reporting, which came into operation for the 2014 data collection period and onwards.
From the 2014 reporting year, nationally comparable student attendance data are being collected as set out in the standards. All jurisdictions and school sectors have agreed to provide data that comply with the standards, with the with the non-government sectors complying with the standards from 2013 onwards and government schools in all jurisdictions except NSW, from 2014. NSW government schools are working towards implementing the standards in 2016.
The implementation of the national standards enables consistent and comparable reporting of attendance rates, including the calculation of KPM 1(b) at the national level, for students in Years 1–10 (including ungraded students where applicable) across all sectors and jurisdictions.
This is the first year in which this KPM is reported nationally, by sector and by state and territory. Table 3.3 reports KPM 1(b) as a national rate by school sector for 2014. Table 3.4 reports the KPM by state and territory for 2014. Further breakdowns, including by sex, year level and geolocation are available in the National Report on Schooling Data Portal.
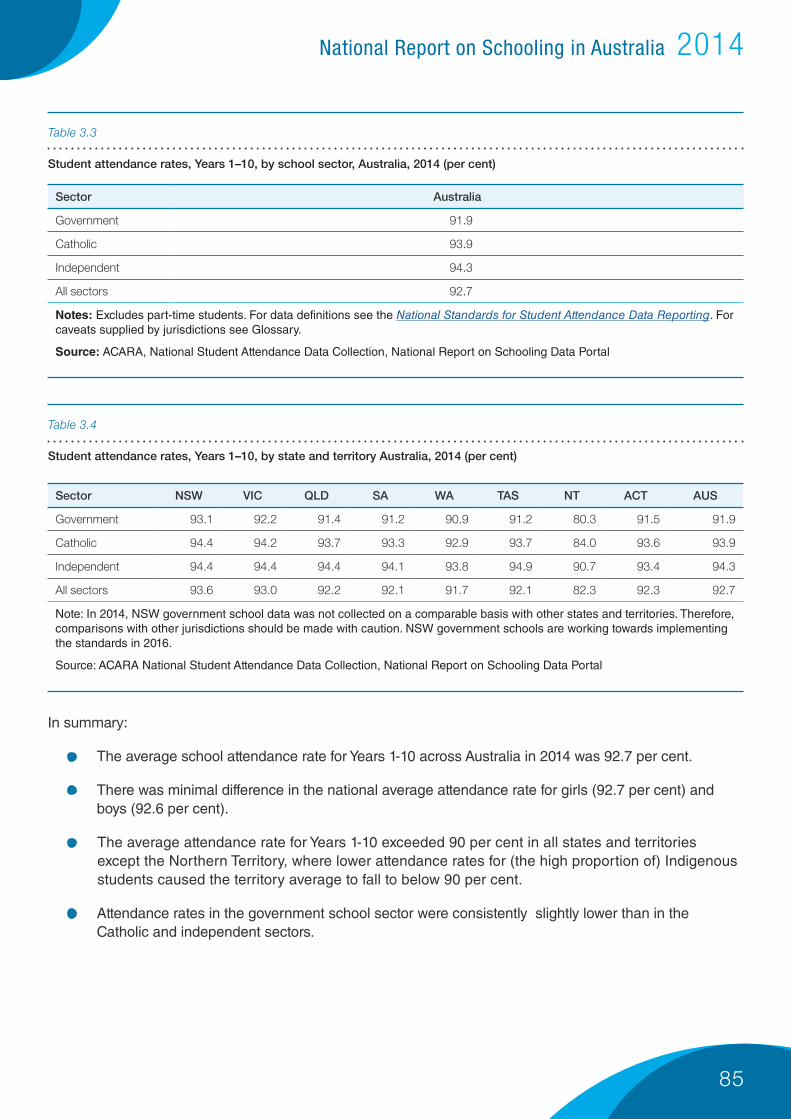
85
National Report on Schooling in Australia 2014
Sector Australia
Government 91.9
Catholic 93.9
Independent 94.3
All sectors 92.7
Notes: Excludes part-time students. For data definitions see the National Standards for Student Attendance Data Reporting. For caveats supplied by jurisdictions see Glossary.
Source: ACARA, National Student Attendance Data Collection, National Report on Schooling Data Portal
Student attendance rates, Years 1–10, by school sector, Australia, 2014 (per cent)
Student attendance rates, Years 1–10, by state and territory Australia, 2014 (per cent)
Table 3.3
Table 3.4
Sector NSW VIC QLD SA WA TAS NT ACT AUS
Government 93.1 92.2 91.4 91.2 90.9 91.2 80.3 91.5 91.9
Catholic 94.4 94.2 93.7 93.3 92.9 93.7 84.0 93.6 93.9
Independent 94.4 94.4 94.4 94.1 93.8 94.9 90.7 93.4 94.3
All sectors 93.6 93.0 92.2 92.1 91.7 92.1 82.3 92.3 92.7
Note: In 2014, NSW government school data was not collected on a comparable basis with other states and territories. Therefore, comparisons with other jurisdictions should be made with caution. NSW government schools are working towards implementing the standards in 2016.
Source: ACARA National Student Attendance Data Collection, National Report on Schooling Data Portal
In summary:
• The average school attendance rate for Years 1-10 across Australia in 2014 was 92.7 per cent.
• There was minimal difference in the national average attendance rate for girls (92.7 per cent) and boys (92.6 per cent).
• The average attendance rate for Years 1-10 exceeded 90 per cent in all states and territories except the Northern Territory, where lower attendance rates for (the high proportion of) Indigenous students caused the territory average to fall to below 90 per cent.
• Attendance rates in the government school sector were consistently slightly lower than in the Catholic and independent sectors.
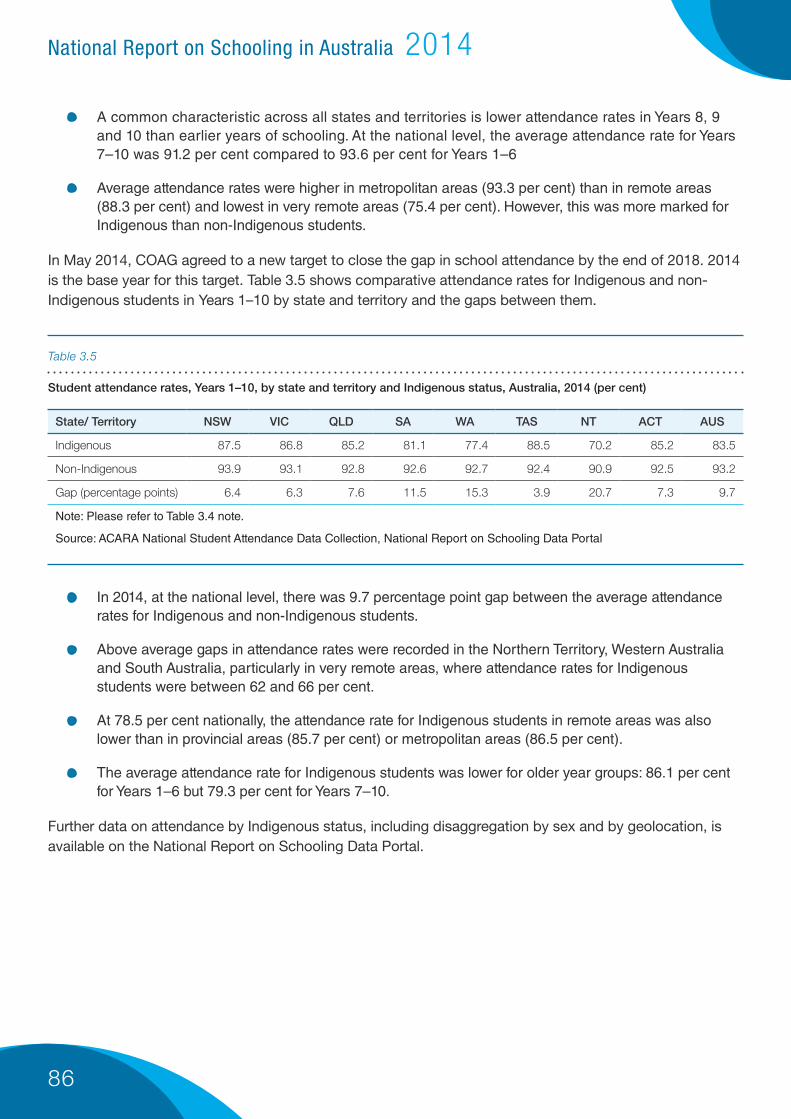
86
National Report on Schooling in Australia 2014
• A common characteristic across all states and territories is lower attendance rates in Years 8, 9 and 10 than earlier years of schooling. At the national level, the average attendance rate for Years 7–10 was 91.2 per cent compared to 93.6 per cent for Years 1–6
• Average attendance rates were higher in metropolitan areas (93.3 per cent) than in remote areas (88.3 per cent) and lowest in very remote areas (75.4 per cent). However, this was more marked for Indigenous than non-Indigenous students.
In May 2014, COAG agreed to a new target to close the gap in school attendance by the end of 2018. 2014 is the base year for this target. Table 3.5 shows comparative attendance rates for Indigenous and non-Indigenous students in Years 1–10 by state and territory and the gaps between them.
Student attendance rates, Years 1–10, by state and territory and Indigenous status, Australia, 2014 (per cent)
Table 3.5
State/ Territory NSW VIC QLD SA WA TAS NT ACT AUS
Indigenous 87.5 86.8 85.2 81.1 77.4 88.5 70.2 85.2 83.5
Non-Indigenous 93.9 93.1 92.8 92.6 92.7 92.4 90.9 92.5 93.2
Gap (percentage points) 6.4 6.3 7.6 11.5 15.3 3.9 20.7 7.3 9.7
Note: Please refer to Table 3.4 note.
Source: ACARA National Student Attendance Data Collection, National Report on Schooling Data Portal
• In 2014, at the national level, there was 9.7 percentage point gap between the average attendance rates for Indigenous and non-Indigenous students.
• Above average gaps in attendance rates were recorded in the Northern Territory, Western Australia and South Australia, particularly in very remote areas, where attendance rates for Indigenous students were between 62 and 66 per cent.
• At 78.5 per cent nationally, the attendance rate for Indigenous students in remote areas was also lower than in provincial areas (85.7 per cent) or metropolitan areas (86.5 per cent).
• The average attendance rate for Indigenous students was lower for older year groups: 86.1 per cent for Years 1–6 but 79.3 per cent for Years 7–10.
Further data on attendance by Indigenous status, including disaggregation by sex and by geolocation, is available on the National Report on Schooling Data Portal.

87
National Report on Schooling in Australia 2014
Apparent retention rates, Year 10 to Year 12 by school sector, Australia, 2009–2014 (%)
Apparent retention rates, Year 10 to Year 12 by school sector, Australia, 2009–2014 (%)
Table 3.6
Figure 3.1
3.2.3 Apparent retention
Apparent retention rates estimate the progression of students through school over several years through several grades/year levels.
This section reports on the apparent retention of students from Year 10 to Year 12, with a focus on comparative rates for Indigenous and non-Indigenous students.
Retention rates are designated as ‘apparent’, and are estimates only, as they are based on aggregate enrolment data and do not record the progression of individual students46. They do not take into account that some students may repeat a grade or be promoted, thus moving between cohorts, that students may choose to adopt flexible study patterns in senior years, or that new students may join a cohort through immigration.
Table 3.6 and figure 3.1 show national apparent retention rates from Year 10 to Year 12 for full-time students by school sector over the period 2009–2014.
School sector 2009 2010 2011 2012 2013 2014
Government 71.4 74.1 75.0 74.8 76.7 78.6
Catholic 80.5 81.8 83.9 84.2 85.4 86.8
Independent 91.0 89.8 90.1 89.0 88.9 90.9
All sectors 76.7 78.5 79.5 79.3 80.7 82.5
Notes: The apparent retention rate measures the number of full-time school students in a designated level/year of schooling as a percentage of their respective cohort group in a base year. The base year for apparent retention rates Year 10-12 is Year 10, two years before. Part-time students are not included. Ungraded students are not included.
Source: ABS, Cat. No. 4221.0, Schools, Australia, 2014
46 Unit record enrolment data by student is not currently collected at the national level.
0
10
20
30
40
50
60
70
80
90
100
All sectors
Government
Catholic
Independent
201420132012201120102009
Source: ABS, Cat. No. 4221.0, Schools, Australia, 2014
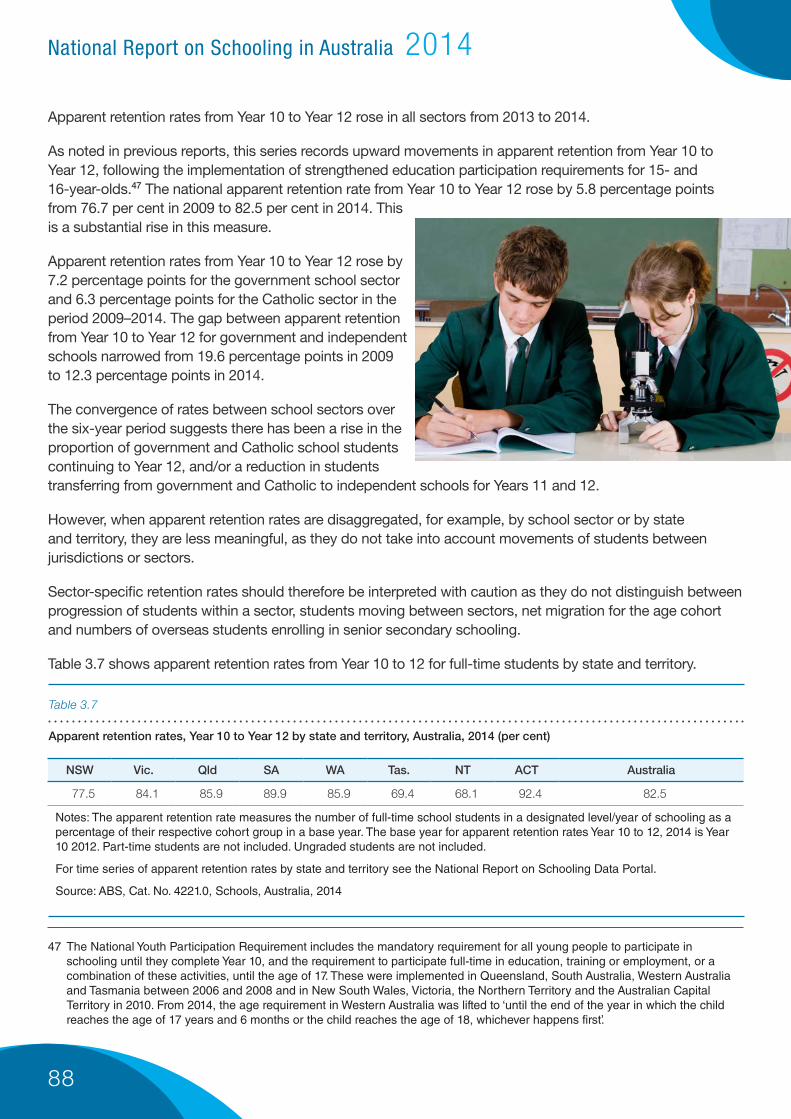
88
National Report on Schooling in Australia 2014
Apparent retention rates, Year 10 to Year 12 by state and territory, Australia, 2014 (per cent)
Table 3.7
NSW Vic. Qld SA WA Tas. NT ACT Australia
77.5 84.1 85.9 89.9 85.9 69.4 68.1 92.4 82.5
Notes: The apparent retention rate measures the number of full-time school students in a designated level/year of schooling as a percentage of their respective cohort group in a base year. The base year for apparent retention rates Year 10 to 12, 2014 is Year 10 2012. Part-time students are not included. Ungraded students are not included.
For time series of apparent retention rates by state and territory see the National Report on Schooling Data Portal.
Source: ABS, Cat. No. 4221.0, Schools, Australia, 2014
Apparent retention rates from Year 10 to Year 12 rose in all sectors from 2013 to 2014.
As noted in previous reports, this series records upward movements in apparent retention from Year 10 to Year 12, following the implementation of strengthened education participation requirements for 15- and 16-year-olds.47 The national apparent retention rate from Year 10 to Year 12 rose by 5.8 percentage points from 76.7 per cent in 2009 to 82.5 per cent in 2014. This is a substantial rise in this measure.
Apparent retention rates from Year 10 to Year 12 rose by 7.2 percentage points for the government school sector and 6.3 percentage points for the Catholic sector in the period 2009–2014. The gap between apparent retention from Year 10 to Year 12 for government and independent schools narrowed from 19.6 percentage points in 2009 to 12.3 percentage points in 2014.
The convergence of rates between school sectors over the six-year period suggests there has been a rise in the proportion of government and Catholic school students continuing to Year 12, and/or a reduction in students transferring from government and Catholic to independent schools for Years 11 and 12.
However, when apparent retention rates are disaggregated, for example, by school sector or by state and territory, they are less meaningful, as they do not take into account movements of students between jurisdictions or sectors.
Sector-specific retention rates should therefore be interpreted with caution as they do not distinguish between progression of students within a sector, students moving between sectors, net migration for the age cohort and numbers of overseas students enrolling in senior secondary schooling.
Table 3.7 shows apparent retention rates from Year 10 to 12 for full-time students by state and territory.
47 The National Youth Participation Requirement includes the mandatory requirement for all young people to participate in schooling until they complete Year 10, and the requirement to participate full-time in education, training or employment, or a combination of these activities, until the age of 17. These were implemented in Queensland, South Australia, Western Australia and Tasmania between 2006 and 2008 and in New South Wales, Victoria, the Northern Territory and the Australian Capital Territory in 2010. From 2014, the age requirement in Western Australia was lifted to ‘until the end of the year in which the child reaches the age of 17 years and 6 months or the child reaches the age of 18, whichever happens first’.

89
National Report on Schooling in Australia 2014
48 These students will be included in the annual schools census conducted in August and therefore in the numerator of the apparent Year 10 to 12 retention rate. The higher age participation requirement in Western Australia will also tend to increase the apparent Year 10 to 12 retention rate in that state.
49 This target is discussed in Part 3.4 Senior schooling and youth transitions
A number of factors may contribute to differences in apparent retention rates from Year 10 to Year 12 between states and territories:
• Rates at the state and territory level can be inflated or deflated by interstate migration, includingstudents transferring from one state to another to undertake senior secondary schooling. Differentialrates of international immigration, including the temporary entry of overseas students for Years 11 and12, will also inflate apparent retention rates in those jurisdictions where these incoming students areconcentrated. These changes are not taken into account in calculating apparent retention rates.
• The age distribution of the school population also affects the year level (Year 11 or Year 12) to whichmost students must remain at school (or in alternative participation pathways) in order to meetparticipation requirements. This varies between states and territories because of historical differencein enrolment requirements and practices. States and territories with younger year cohorts will tendto have higher Year 10 to Year 12 retention rates, as a higher proportion of their student population isrequired to remain at school until the second half of Year 12.48
• State and territory retention rates will also be affected by factors that are independent of schoolingsuch as differences in prevailing economic circumstances, including youth employment, and theavailability and promotion of training and employment pathways that are alternatives to seniorsecondary schooling.
The overall increase in retention from Year 10 to Year 12 over the last six years is in line with the policy intent of governments in strengthening requirements for 15–16-year-olds to participate full-time in education and/or training and/or employment.
However, it is not a KPM for the full student population, because progressing to Year 12 is one of several acceptable means by which students can meet these requirements.
KPM 1(d) in the Measurement Framework for Schooling in Australia 2012 is a measure of retention to Year 12, but its target population is Aboriginal and Torres Strait Islander students (compared with non-Indigenous students). This KPM reflects concern by all governments at significantly lower rates of school retention and completion for Aboriginal and Torres Islander students than other groups.
Key Performance Measure 1(d)
Apparent retention rates from Year 10 to Year 12 (Indigenous school students cf non-Indigenous school students)
This KPM relates to the COAG target to at least halve the gap between Indigenous and non-Indigenous 20–24 year olds in Year 12 or equivalent attainment rates by 2020 but is not a direct measure of progress towards the target49.
Table 3.8 and Figure 3.2 report this KPM for the period 2009–2014.
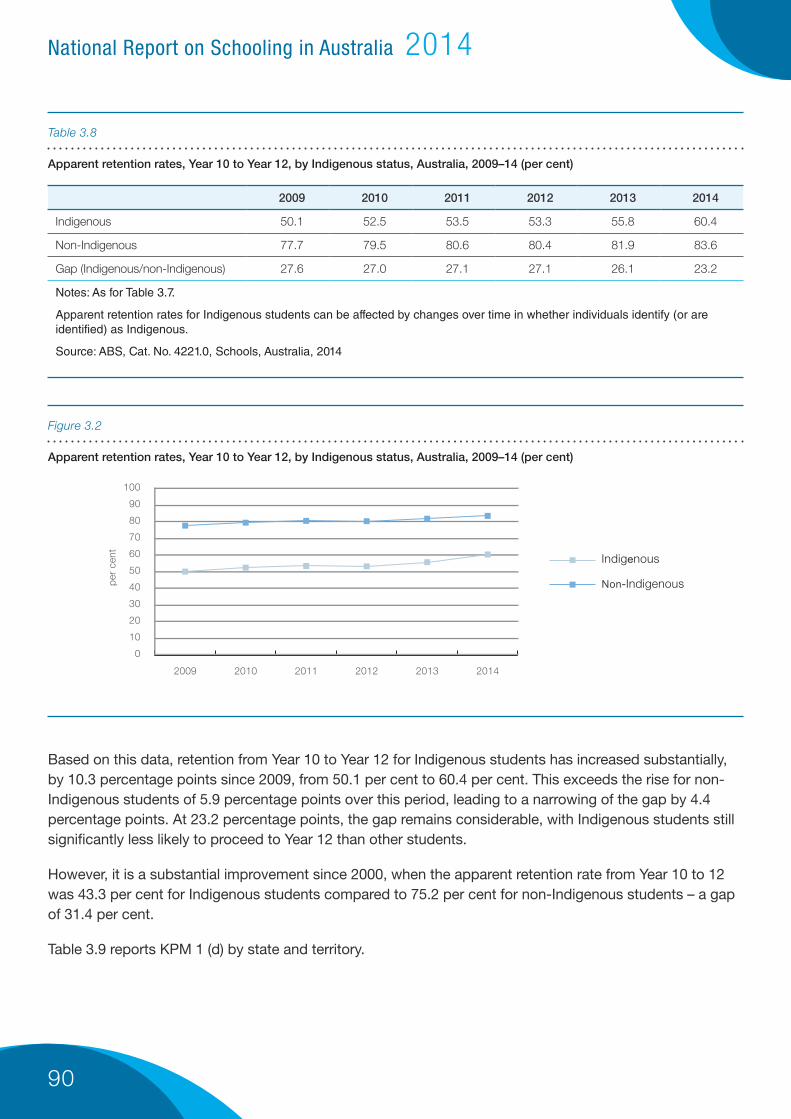
90
National Report on Schooling in Australia 2014
Apparent retention rates, Year 10 to Year 12, by Indigenous status, Australia, 2009–14 (per cent)
Apparent retention rates, Year 10 to Year 12, by Indigenous status, Australia, 2009–14 (per cent)
Table 3.8
Figure 3.2
2009 2010 2011 2012 2013 2014
Indigenous 50.1 52.5 53.5 53.3 55.8 60.4
Non-Indigenous 77.7 79.5 80.6 80.4 81.9 83.6
Gap (Indigenous/non-Indigenous) 27.6 27.0 27.1 27.1 26.1 23.2
Notes: As for Table 3.7.
Apparent retention rates for Indigenous students can be affected by changes over time in whether individuals identify (or are identified) as Indigenous.
Source: ABS, Cat. No. 4221.0, Schools, Australia, 2014
Based on this data, retention from Year 10 to Year 12 for Indigenous students has increased substantially, by 10.3 percentage points since 2009, from 50.1 per cent to 60.4 per cent. This exceeds the rise for non-Indigenous students of 5.9 percentage points over this period, leading to a narrowing of the gap by 4.4 percentage points. At 23.2 percentage points, the gap remains considerable, with Indigenous students still significantly less likely to proceed to Year 12 than other students.
However, it is a substantial improvement since 2000, when the apparent retention rate from Year 10 to 12 was 43.3 per cent for Indigenous students compared to 75.2 per cent for non-Indigenous students – a gap of 31.4 per cent.
Table 3.9 reports KPM 1 (d) by state and territory.
0
10
20
30
40
50
60
70
80
90
100
Indigenous
Non-Indigenous
201420132012201120102009
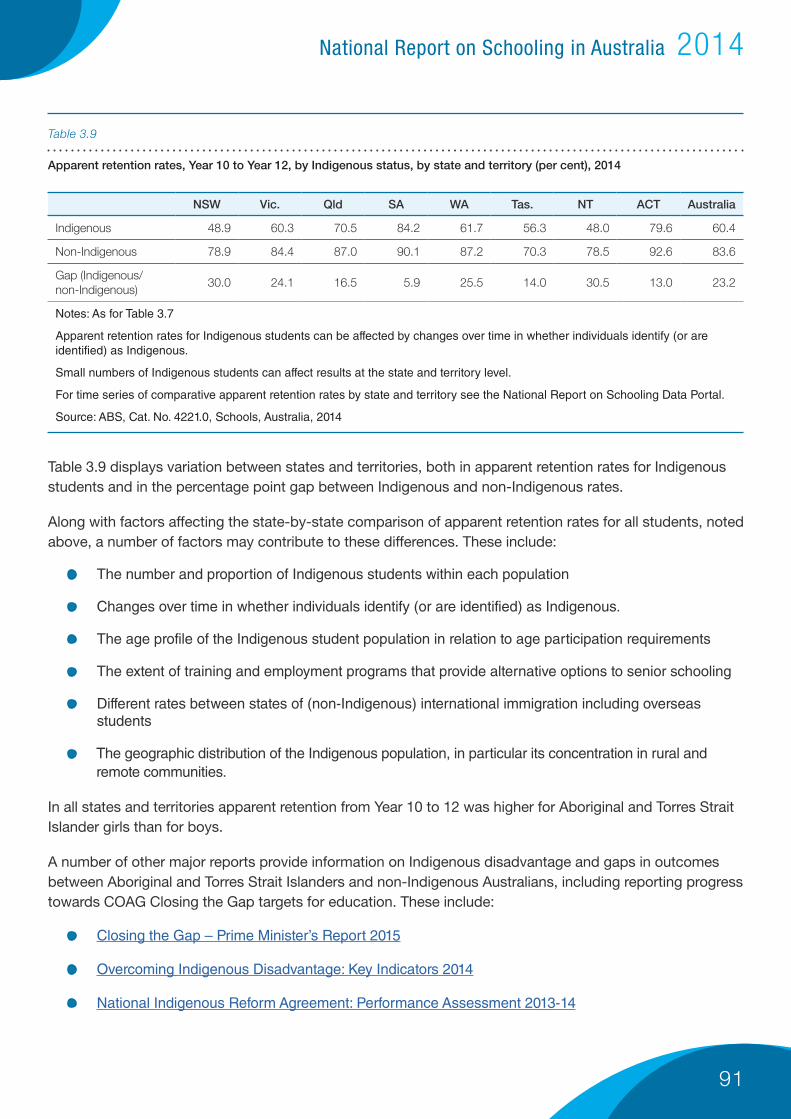
91
National Report on Schooling in Australia 2014
Apparent retention rates, Year 10 to Year 12, by Indigenous status, by state and territory (per cent), 2014
Table 3.9
NSW Vic. Qld SA WA Tas. NT ACT Australia
Indigenous 48.9 60.3 70.5 84.2 61.7 56.3 48.0 79.6 60.4
Non-Indigenous 78.9 84.4 87.0 90.1 87.2 70.3 78.5 92.6 83.6
Gap (Indigenous/ non-Indigenous)
30.0 24.1 16.5 5.9 25.5 14.0 30.5 13.0 23.2
Notes: As for Table 3.7
Apparent retention rates for Indigenous students can be affected by changes over time in whether individuals identify (or are identified) as Indigenous.
Small numbers of Indigenous students can affect results at the state and territory level.
For time series of comparative apparent retention rates by state and territory see the National Report on Schooling Data Portal.
Source: ABS, Cat. No. 4221.0, Schools, Australia, 2014
Table 3.9 displays variation between states and territories, both in apparent retention rates for Indigenous students and in the percentage point gap between Indigenous and non-Indigenous rates.
Along with factors affecting the state-by-state comparison of apparent retention rates for all students, noted above, a number of factors may contribute to these differences. These include:
• The number and proportion of Indigenous students within each population
• Changes over time in whether individuals identify (or are identified) as Indigenous.
• The age profile of the Indigenous student population in relation to age participation requirements
• The extent of training and employment programs that provide alternative options to senior schooling
• Different rates between states of (non-Indigenous) international immigration including overseasstudents
• The geographic distribution of the Indigenous population, in particular its concentration in rural andremote communities.
In all states and territories apparent retention from Year 10 to 12 was higher for Aboriginal and Torres Strait Islander girls than for boys.
A number of other major reports provide information on Indigenous disadvantage and gaps in outcomes between Aboriginal and Torres Strait Islanders and non-Indigenous Australians, including reporting progress towards COAG Closing the Gap targets for education. These include:
• Closing the Gap – Prime Minister’s Report 2015
• Overcoming Indigenous Disadvantage: Key Indicators 2014
• National Indigenous Reform Agreement: Performance Assessment 2013-14
92
National Report on Schooling in Australia 2014
Part 3.3 – Student Achievement – National Assessment Program
Part 3.3 reports on the KPMs for student achievement in the National Assessment Program (NAP) specified in the Measurement Framework for Schooling in Australia 2012.
For 2014, this includes KPMs for NAPLAN and ICT literacy. International assessments included in the NAP were not conducted or not finalised in 2014.
3.3.1 NAP – Literacy and Numeracy (NAPLAN)
In 2014, the seventh year of national literacy and numeracy testing, Year 3, 5, 7 and 9 students in Australia were assessed on reading, writing, language conventions (spelling, grammar and punctuation) and numeracy.
The 2014 NAPLAN National Report provides nationally comparable information about the achievements of students who sat the inaugural tests in Year 3 in 2008, through to 2014 when students in this cohort sat their final NAPLAN tests in Year 9.
NAPLAN participation rates, mean scale scores and proportions of students achieving at or above the national minimum standard in reading, writing and numeracy at each year level are specified as key performance measures (KPMs) in the Measurement Framework for Schooling in Australia 2012. These are reported for 2014 in the tables below and for previous years on the results page of the NAP website.
Data are also presented for the years 2008–2014 by state and territory, sex, Indigenous status, language background other than English, geolocation, parental education and parental occupation at each year level and for each domain of the test on the results page of the NAP website.
Information about how to interpret scales and standards is also available on the NAP website.
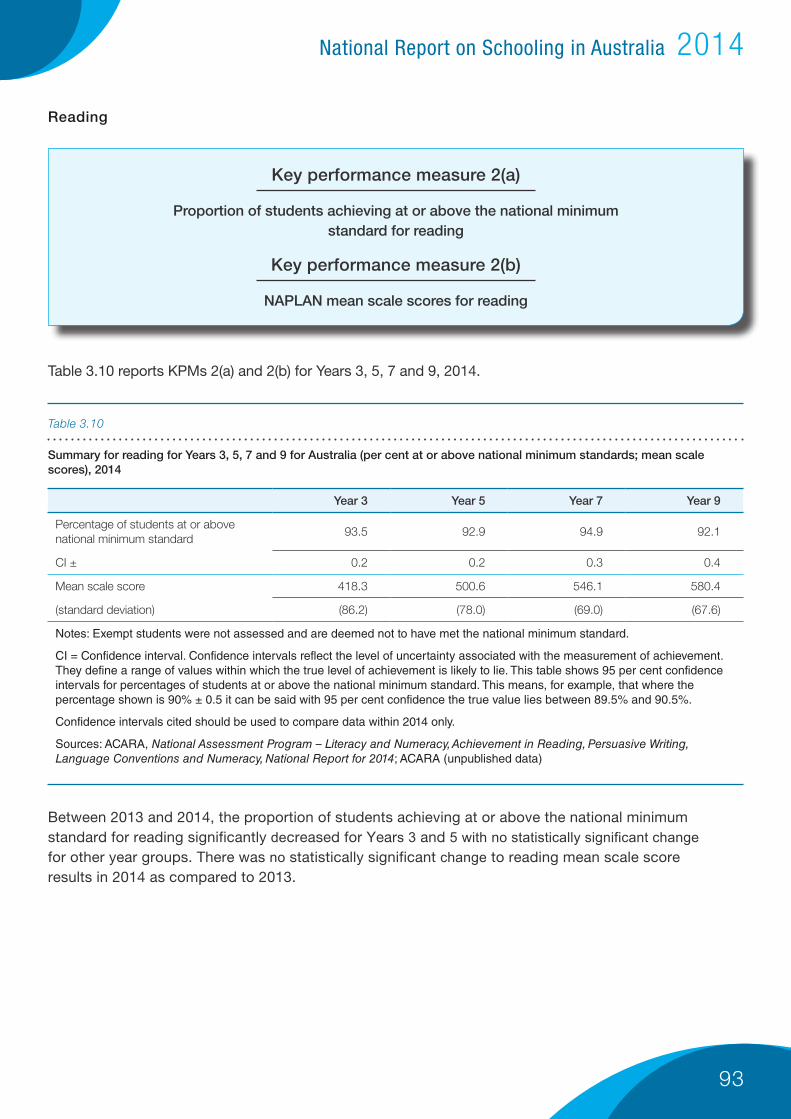
93
National Report on Schooling in Australia 2014
Reading
Key performance measure 2(a)
Proportion of students achieving at or above the national minimum standard for reading
Key performance measure 2(b)
NAPLAN mean scale scores for reading
Table 3.10 reports KPMs 2(a) and 2(b) for Years 3, 5, 7 and 9, 2014.
Between 2013 and 2014, the proportion of students achieving at or above the national minimum standard for reading significantly decreased for Years 3 and 5 with no statistically significant change for other year groups. There was no statistically significant change to reading mean scale score results in 2014 as compared to 2013.
Summary for reading for Years 3, 5, 7 and 9 for Australia (per cent at or above national minimum standards; mean scale scores), 2014
Table 3.10
Year 3 Year 5 Year 7 Year 9
Percentage of students at or above national minimum standard
93.5 92.9 94.9 92.1
CI ± 0.2 0.2 0.3 0.4
Mean scale score 418.3 500.6 546.1 580.4
(standard deviation) (86.2) (78.0) (69.0) (67.6)
Notes: Exempt students were not assessed and are deemed not to have met the national minimum standard.
CI = Confidence interval. Confidence intervals reflect the level of uncertainty associated with the measurement of achievement. They define a range of values within which the true level of achievement is likely to lie. This table shows 95 per cent confidence intervals for percentages of students at or above the national minimum standard. This means, for example, that where the percentage shown is 90% ± 0.5 it can be said with 95 per cent confidence the true value lies between 89.5% and 90.5%.
Confidence intervals cited should be used to compare data within 2014 only.
Sources: ACARA, National Assessment Program – Literacy and Numeracy, Achievement in Reading, Persuasive Writing, Language Conventions and Numeracy, National Report for 2014; ACARA (unpublished data)
94
National Report on Schooling in Australia 2014
Summary of trends in reading
• Nationally, there has been a moderate increase in mean scale scores for Year 3 and Year 5 reading performance since 2008. However, a moderate decrease in the percentage of students performing at or above national minimum standard in reading, relative to 2013, was also observed.
• In Year 3, there was a general improvement, in mean scale scores, from 2008 to 2014 but no significant change between 2013 and 2014, and no significant change since 2012. The improvement in Year 3 reading achievement from 2008 to 2014 can be partly attributed to the notable improvements in Queensland, Western Australia and the ACT.
• An improvement in mean scale scores in reading achievement from 2008 to 2014 was evident, and of similar magnitude, for Indigenous and non-Indigenous students.
• In Year 5, there was also an overall improvement in mean scale scores for reading over the period from 2008 to 2014, but no change between 2013 and 2014 (or between 2012 and 2013). Improvements were evident in Queensland, Western Australia, Tasmania and the ACT.
• There was an overall improvement in reading from 2008 to 2014 among Year 5 Indigenous students but a decline between 2013 and 2014.
• For Year 7, improvements in mean reading achievement over the period from 2008 to 2014 were evident in Queensland and Western Australia but not in any other jurisdiction.
• In Queensland, this improvement may be partly attributed to a flow through of improvements for Year 5 and Year 3 in earlier cycles of NAPLAN. At Year 9, the only evidence of any improvement from 2008 to 2014 was in Western Australia.
Writing
Key performance measure 2(c)
Proportion of students achieving at or above the national minimum standard for writing
Key performance measure 2(d)
NAPLAN mean scale scores for writing
Table 3.11 reports on KPM 2(c) and 2(d) for Years 3, 5, 7 and 9, 2014
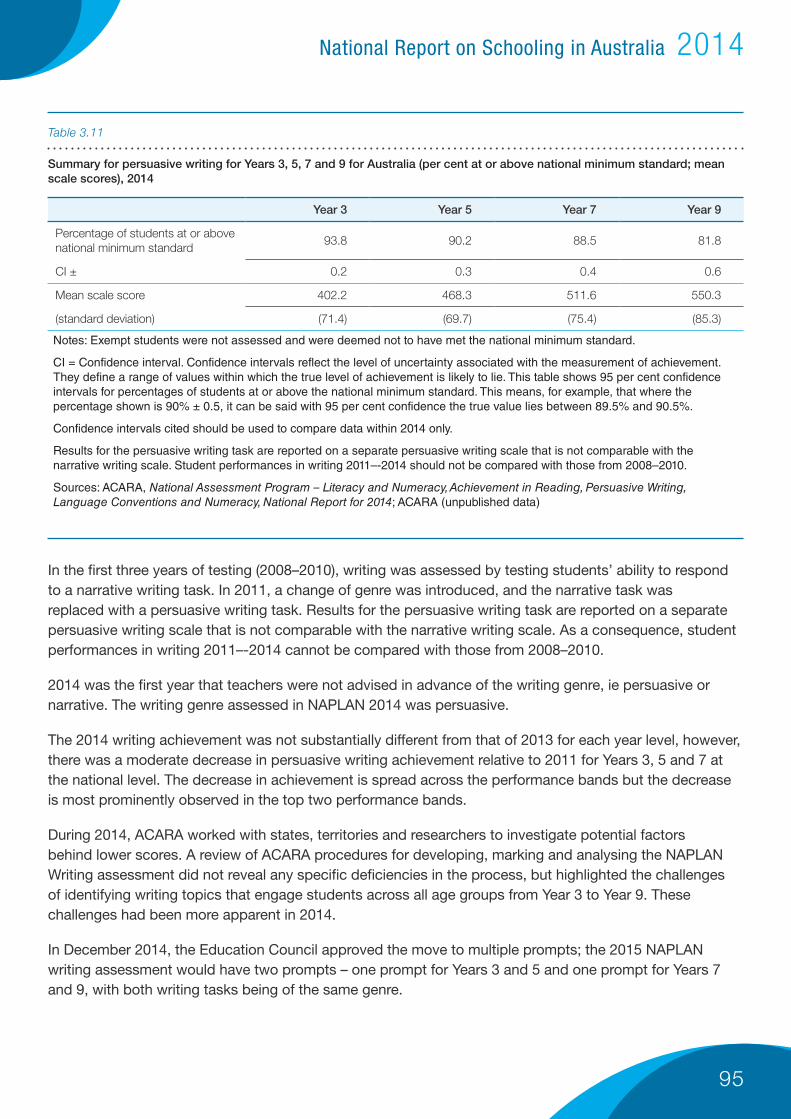
95
National Report on Schooling in Australia 2014
Summary for persuasive writing for Years 3, 5, 7 and 9 for Australia (per cent at or above national minimum standard; mean scale scores), 2014
Table 3.11
Year 3 Year 5 Year 7 Year 9
Percentage of students at or above national minimum standard
93.8 90.2 88.5 81.8
CI ± 0.2 0.3 0.4 0.6
Mean scale score 402.2 468.3 511.6 550.3
(standard deviation) (71.4) (69.7) (75.4) (85.3)
Notes: Exempt students were not assessed and were deemed not to have met the national minimum standard.
CI = Confidence interval. Confidence intervals reflect the level of uncertainty associated with the measurement of achievement. They define a range of values within which the true level of achievement is likely to lie. This table shows 95 per cent confidence intervals for percentages of students at or above the national minimum standard. This means, for example, that where the percentage shown is 90% ± 0.5, it can be said with 95 per cent confidence the true value lies between 89.5% and 90.5%.
Confidence intervals cited should be used to compare data within 2014 only.
Results for the persuasive writing task are reported on a separate persuasive writing scale that is not comparable with the narrative writing scale. Student performances in writing 2011–-2014 should not be compared with those from 2008–2010.
Sources: ACARA, National Assessment Program – Literacy and Numeracy, Achievement in Reading, Persuasive Writing, Language Conventions and Numeracy, National Report for 2014; ACARA (unpublished data)
In the first three years of testing (2008–2010), writing was assessed by testing students’ ability to respond to a narrative writing task. In 2011, a change of genre was introduced, and the narrative task was replaced with a persuasive writing task. Results for the persuasive writing task are reported on a separate persuasive writing scale that is not comparable with the narrative writing scale. As a consequence, student performances in writing 2011–-2014 cannot be compared with those from 2008–2010.
2014 was the first year that teachers were not advised in advance of the writing genre, ie persuasive or narrative. The writing genre assessed in NAPLAN 2014 was persuasive.
The 2014 writing achievement was not substantially different from that of 2013 for each year level, however, there was a moderate decrease in persuasive writing achievement relative to 2011 for Years 3, 5 and 7 at the national level. The decrease in achievement is spread across the performance bands but the decrease is most prominently observed in the top two performance bands.
During 2014, ACARA worked with states, territories and researchers to investigate potential factors behind lower scores. A review of ACARA procedures for developing, marking and analysing the NAPLAN Writing assessment did not reveal any specific deficiencies in the process, but highlighted the challenges of identifying writing topics that engage students across all age groups from Year 3 to Year 9. These challenges had been more apparent in 2014.
In December 2014, the Education Council approved the move to multiple prompts; the 2015 NAPLAN writing assessment would have two prompts – one prompt for Years 3 and 5 and one prompt for Years 7 and 9, with both writing tasks being of the same genre.
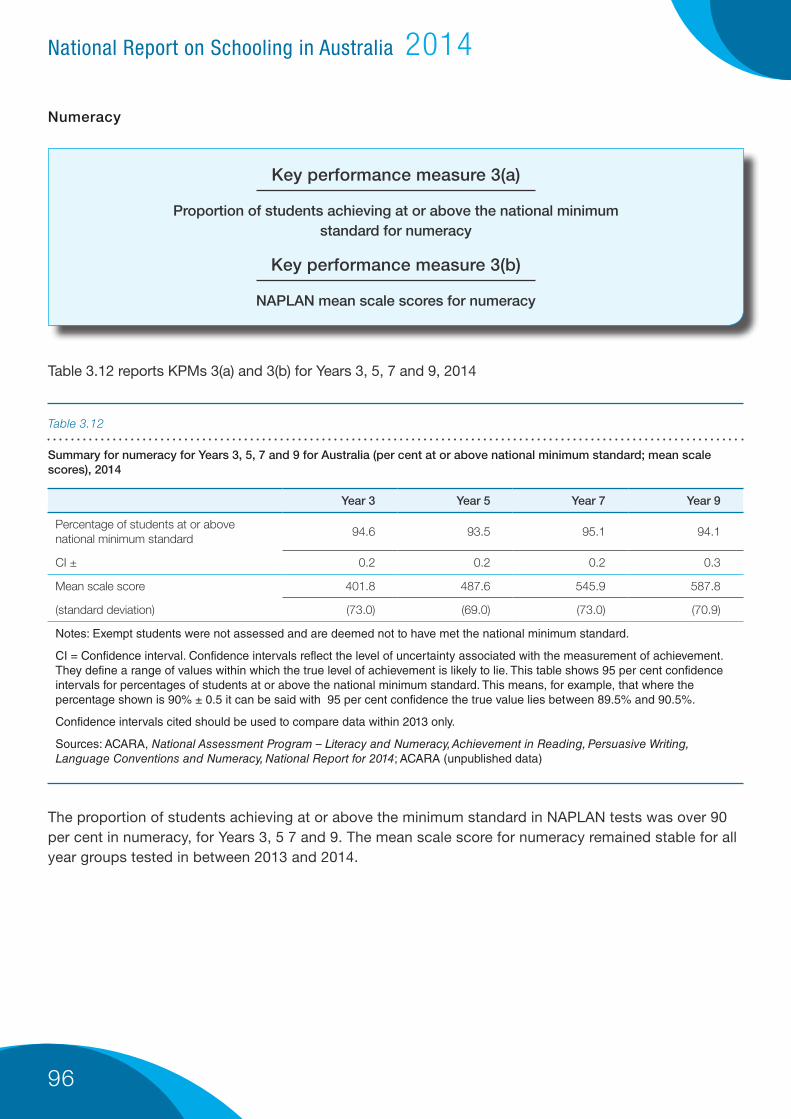
96
National Report on Schooling in Australia 2014
Numeracy
Key performance measure 3(a)
Proportion of students achieving at or above the national minimum standard for numeracy
Key performance measure 3(b)
NAPLAN mean scale scores for numeracy
Table 3.12 reports KPMs 3(a) and 3(b) for Years 3, 5, 7 and 9, 2014
Summary for numeracy for Years 3, 5, 7 and 9 for Australia (per cent at or above national minimum standard; mean scale scores), 2014
Table 3.12
Year 3 Year 5 Year 7 Year 9
Percentage of students at or above national minimum standard
94.6 93.5 95.1 94.1
CI ± 0.2 0.2 0.2 0.3
Mean scale score 401.8 487.6 545.9 587.8
(standard deviation) (73.0) (69.0) (73.0) (70.9)
Notes: Exempt students were not assessed and are deemed not to have met the national minimum standard.
CI = Confidence interval. Confidence intervals reflect the level of uncertainty associated with the measurement of achievement. They define a range of values within which the true level of achievement is likely to lie. This table shows 95 per cent confidence intervals for percentages of students at or above the national minimum standard. This means, for example, that where the percentage shown is 90% ± 0.5 it can be said with 95 per cent confidence the true value lies between 89.5% and 90.5%.
Confidence intervals cited should be used to compare data within 2013 only.
Sources: ACARA, National Assessment Program – Literacy and Numeracy, Achievement in Reading, Persuasive Writing, Language Conventions and Numeracy, National Report for 2014; ACARA (unpublished data)
The proportion of students achieving at or above the minimum standard in NAPLAN tests was over 90 per cent in numeracy, for Years 3, 5 7 and 9. The mean scale score for numeracy remained stable for all year groups tested in between 2013 and 2014.
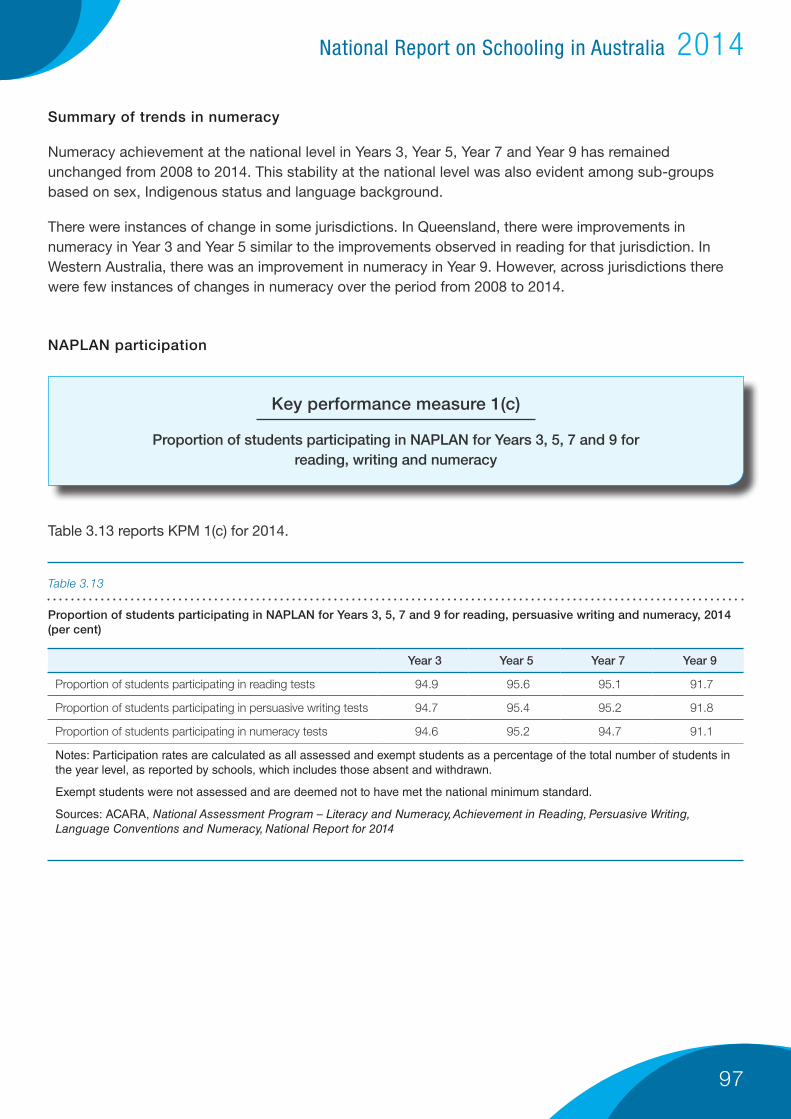
97
National Report on Schooling in Australia 2014
Proportion of students participating in NAPLAN for Years 3, 5, 7 and 9 for reading, persuasive writing and numeracy, 2014 (per cent)
Table 3.13
Summary of trends in numeracy
Numeracy achievement at the national level in Years 3, Year 5, Year 7 and Year 9 has remained unchanged from 2008 to 2014. This stability at the national level was also evident among sub-groups based on sex, Indigenous status and language background.
There were instances of change in some jurisdictions. In Queensland, there were improvements in numeracy in Year 3 and Year 5 similar to the improvements observed in reading for that jurisdiction. In Western Australia, there was an improvement in numeracy in Year 9. However, across jurisdictions there were few instances of changes in numeracy over the period from 2008 to 2014.
NAPLAN participation
Key performance measure 1(c)
Proportion of students participating in NAPLAN for Years 3, 5, 7 and 9 for reading, writing and numeracy
Table 3.13 reports KPM 1(c) for 2014.
Year 3 Year 5 Year 7 Year 9
Proportion of students participating in reading tests 94.9 95.6 95.1 91.7
Proportion of students participating in persuasive writing tests 94.7 95.4 95.2 91.8
Proportion of students participating in numeracy tests 94.6 95.2 94.7 91.1
Notes: Participation rates are calculated as all assessed and exempt students as a percentage of the total number of students in the year level, as reported by schools, which includes those absent and withdrawn.
Exempt students were not assessed and are deemed not to have met the national minimum standard.
Sources: ACARA, National Assessment Program – Literacy and Numeracy, Achievement in Reading, Persuasive Writing, Language Conventions and Numeracy, National Report for 2014
98
National Report on Schooling in Australia 2014
In summary:
• There has been a small but steady decrease in participation rates in NAPLAN over the period from 2008 to 2014, with the average total decrease across the four year levels and two domains approximately 1.6 percentage points, or an average of 0.2 – 0.3 percentage points per year.
• Since 2010, when withdrawals were first reported, there has been an increase in the withdrawn rate, with 2014 the highest across all year levels in both reading and numeracy.
• Participation rates were similar across Years 3, 5 and 7, but lower in Year 9 by 3–4 percentage points. In all year levels, participation rates in reading were slightly higher than in numeracy.
• In Year 9, compared to other year levels, absence is a substantial contribution to non-participation, with absence rates at 6.0 per cent in reading and 6.5 per cent in numeracy.
• As with previous years, participation rates in NAPLAN in 2014 were lower for Indigenous students than for non-Indigenous students across all cohorts and key domains.
Detailed data on NAPLAN 2014 are available in the 2014 NAPLAN National Report, and in interactive form and for previous years on the results page of the NAP website.
NAPLAN results are also reported at the school level on the My School website and parents receive an individual report on their child’s achievement in the NAPLAN tests. A student report shows student performance against the national average and relative to the achievement band scale.
Closing the gap in literacy and numeracy
Closing the Gap target
Halve the gap in Reading, Writing and Numeracy achievement between Indigenous students and non-Indigenous students by 2018
The gap for this target is measured as the difference between the proportion of Indigenous and non Indigenous students at or above the national minimum standard in reading and numeracy at Years 3, 5, 7 and 9. Writing results from 2011 onwards cannot be directly compared to the writing results from previous years.
The Closing the Gap Prime Minister’s Report 2015 reports that in 2014, results in two of the eight year domains (Year 7 reading and Year 9 numeracy) were consistent with the trajectory points required to meet the target for halving the gap in meeting minimum standards at the national level. In the other six areas, 2014 results were below the required trajectory points, which means that progress will need to accelerate for this target to be met.
In all year levels, participation rates for Indigenous students are lower than for non-Indigenous students.
COAG Closing the Gap targets for education include the following target for literacy and numeracy.
99
National Report on Schooling in Australia 2014
The difference is greatest in Year 9, where absence contributes substantially to non-participation by Indigenous students.
In summary:
• There has been no overall improvement in Indigenous reading and numeracy since 2008
• Between 2008 and 2014, the proportion of Aboriginal and Torres Strait Islander students at or above the national minimum standard in reading and numeracy has shown no statistically significant improvement nationally in any of the eight measures (Years 3, 5, 7 and 9 in reading and numeracy).
• In Year 5 reading a large apparent rise occurred in the proportion of Indigenous students meeting
national minimum standards from 2012 to 2013 (from 64.7 to 83.3 per cent). However this proportion fell back to 70.3 per cent in 2014.
For further information on Closing the Gap targets, see the Closing the Gap Prime Minister’s Report 2015 or Overcoming Indigenous Disadvantage: Key Indicators 2014.
NAPLAN results disaggregated by Indigenous status can be found on the NAP results page.
100
National Report on Schooling in Australia 2014
3.3.2 NAP Sample – Information and Communication Technology Literacy
The National Sample Assessment in Information and Communication Technology Literacy (NAP – ICT Literacy) commenced in 2005. As part of a rotating assessment cycle, every three years samples of Year 6 and Year 10 students from across Australia are tested on their ability to use ICT to appropriately access, manage, integrate and evaluate information, develop new understandings and communicate with others in order to participate effectively in society. Four cycles of the NAP – ICT Literacy have now been completed (2005, 2008, 2011 and 2014).
In 2014, NAP–ICT Literacy was trialled and delivered to students online for the first time. The NAP–ICTL sample assessment was administered to 10,562 students from 649 government, Catholic and independent schools between 13 October and 14 November 2014 in all states and territories. The assessment included an online test with multiple-choice and open-ended questions, and an online student questionnaire. The same test was made available to a small number of schools on USB drives as a back-up delivery method.
The next NAP – ICT Literacy assessment is scheduled for 2017.
Proficient Standards for Information and Communication Technology Literacy
Proficient standards for ICT Literacy were established for both Years 6 and 10 in 2005. Each proficient standard is a point on the NAP – ICT Literacy proficiency scale that represents ‘a challenging but reasonable’ expectation of student achievement at the respective year level.
• The Proficient Standard for Year 6 was defined as the boundary between levels 2 and 3 on the ICT Literacy proficiency scale.
• The Proficient Standard for Year 10 was defined as the boundary between levels 3 and 4 on the ICT Literacy proficiency scale.
The full ICT Literacy proficiency scale and descriptions are available on the National Assessment Program website.
The proportion of students achieving at or above the proficient standard (Level 3 in Year 6 and Level 4 in Year 10) is a KPM in the Measurement Framework for Schooling in Australia 2012.
Key performance measure 6
Proportion of students achieving at or above the proficient standard in NAP ICT Literacy
Table 3.14 reports on KPM 6 (and the proportion of students achieving at each proficiency level) for 2014.

101
National Report on Schooling in Australia 2014
Proportion of students achieving at or above the proficient standards (Level 3 in Year 6; Level 4 in Year 10) in ICT Literacy, 2014 (per cent)
Table 3.14
At or above the proficient standard
Year 6
Australia (%) 55
CI± 2.5
Year 10
Australia (%) 52
CI± 2.5
Notes: CI = Confidence interval
Source: ACARA, National Assessment Program – ICT Literacy Report 2014
As shown in table 3.14, 52 per cent of Year 10 students achieved at or above the proficient standard for ICT Literacy in 2014.
When comparing this proportion across states and territories, the lowest percentage was recorded for the Northern Territory (43%), while the highest percentage was for the ACT (60%). The national percentage of Year 10 students attaining the proficient standard for this year level was significantly lower than in the previous assessments in 2011.
Caution should be used when making state level inferences and comparisons, given the relatively small numbers of students participating in the NAP sample assessments and the wide margins of error associated with these results at a jurisdictional level.
At the national level, 55 per cent of Year 6 students reached the proficient standard. Across jurisdictions, these percentages ranged from 43 per cent in the Northern Territory to 64 per cent in Victoria.
In summary:
When comparing test results from NAP – ICTL 2014 with those from the 2011 cycle, there was a statistically significant decrease at the national level compared with 2011. At the national level:
• 55 per cent of Year 6 students attained the Proficient Standard in 2014 compared to 62 per cent in 2011.
• 52 per cent of Year 10 students met or exceeded the Proficient Standard compared to 65 per cent in 2011.
The performance of Year 10 students had not changed significantly across the three previous NAP – ICT Literacy cycles from 2005 to 2011. However, in 2014, the mean performance of Year 10 students decreased by 39 scale points. This large decrease resulted in the 2014 mean performance being significantly lower than the mean performance in all of the previous NAP – ICT Literacy assessments.

102
National Report on Schooling in Australia 2014
Although the mean performance of students in Year 6 increased steadily from 2005 to 2011 across the three assessment cycles, it decreased significantly by 22 scale points between 2011 and 2014. The mean performance of Year 6 students in 2014 was statistically significantly lower than the mean performance in 2011, but not significantly different from the mean performance in 2005 or 2008.
The NAP ICT Literacy Report 2014 highlights the risk that, as students increase their personal use of technology, assumptions will be made about a student’s level of expertise and knowledge of technology for more formal (non-social) applications.
For further detail, the National Assessment Program – ICT Literacy Years 6 and 10 Report 2014 is available on the National Assessment Program website.
103
National Report on Schooling in Australia 2014
Part 3.4 – Senior schooling and youth transitions
Part 3.4 reports on Key Performance Measures (KPMs) for
• the participation of young people, including secondary students, in Vocational Education and Training (VET), and in education, training and work
• the attainment of young people in senior schooling and/or post-school education and training.
These measures reflect the intent of the Melbourne Declaration to define educational goals, not only for school students, but for all young Australians, and the role of the National Report on Schooling in Australia to report on the outcomes of schooling.
They also reflect the Melbourne Declaration commitment to ‘support the senior years of schooling and the provision of high-quality pathways to facilitate effective transitions between further study, training and employment.’ As such, these are indicators of the success of schooling in preparing students for further education and work.
3.4.1 Participation of young people in VET, including VET in Schools
The Australian vocational education and training (VET) sector provides nationally consistent training and qualifications for those entering or already engaged in the workforce. Competency standards (units of competency) for VET qualifications in different industries and occupations are included in national training packages, which also define qualifications in each industry.
The requirements for each level of VET qualification are set out in the Australian Qualifications Framework (AQF)50, which also provides guidelines for senior secondary certificates of education (Year 12 qualifications) and qualifications in the higher education sector.
Secondary school students in all states and territories can undertake accredited VET courses as part of their school program (VET in Schools51 courses), usually in the senior years of schooling as a part of the Senior Secondary Certificate of Education in each jurisdiction.
VET in Schools students include school-based apprentices and trainees. These are students who, as well as undertaking an accredited VET qualification as a part of their school studies, have entered into a formal contract of part-time paid employment and training with an employer. Typically, these students undertake part of their traineeship or apprenticeship while at school, and complete it once they have left school.
Senior secondary students can also take VET courses in addition to their school studies, or leave school to take up full-time VET study, or a combination of part-time VET and work, as alternative pathways to meet youth participation requirements.
50 The AQF is the national framework of qualifications in the school, vocational education and training (VET), and higher education sectors in Australia. The Senior Secondary Certificate of Education, Certificate II and Certificate III are examples of qualifications within the AQF
51 Preparing Secondary Students for Work – A framework for vocational learning and VET delivered to secondary students (December 2014) recommends that the term ‘VET delivered to secondary students’ be adopted to replace the term VET in Schools (VETiS) currently used for these programs. See glossary for further explanation of VETiS.
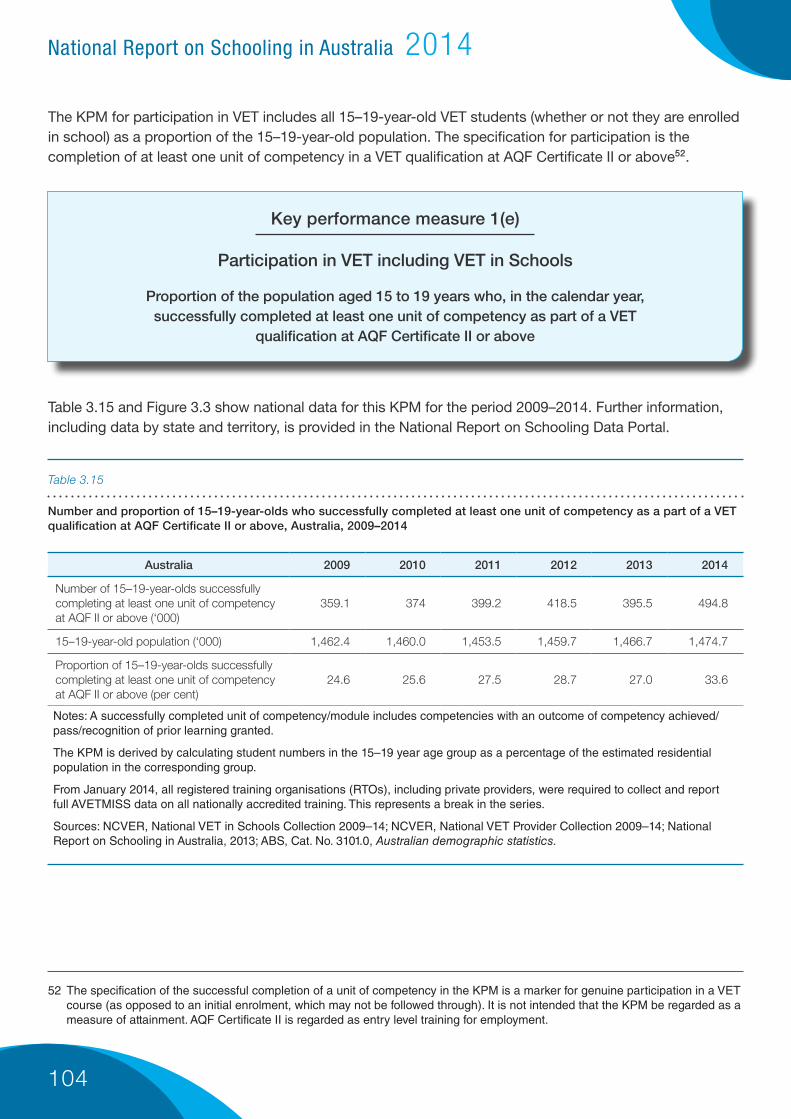
104
National Report on Schooling in Australia 2014
The KPM for participation in VET includes all 15–19-year-old VET students (whether or not they are enrolled in school) as a proportion of the 15–19-year-old population. The specification for participation is the completion of at least one unit of competency in a VET qualification at AQF Certificate II or above52.
52 The specification of the successful completion of a unit of competency in the KPM is a marker for genuine participation in a VET course (as opposed to an initial enrolment, which may not be followed through). It is not intended that the KPM be regarded as a measure of attainment. AQF Certificate II is regarded as entry level training for employment.
Number and proportion of 15–19-year-olds who successfully completed at least one unit of competency as a part of a VET qualification at AQF Certificate II or above, Australia, 2009–2014
Table 3.15
Key performance measure 1(e)
Participation in VET including VET in Schools
Proportion of the population aged 15 to 19 years who, in the calendar year, successfully completed at least one unit of competency as part of a VET
qualification at AQF Certificate II or above
Table 3.15 and Figure 3.3 show national data for this KPM for the period 2009–2014. Further information, including data by state and territory, is provided in the National Report on Schooling Data Portal.
Australia 2009 2010 2011 2012 2013 2014
Number of 15–19-year-olds successfully completing at least one unit of competency at AQF II or above (‘000)
359.1 374 399.2 418.5 395.5 494.8
15–19-year-old population (‘000) 1,462.4 1,460.0 1,453.5 1,459.7 1,466.7 1,474.7
Proportion of 15–19-year-olds successfully completing at least one unit of competency at AQF II or above (per cent)
24.6 25.6 27.5 28.7 27.0 33.6
Notes: A successfully completed unit of competency/module includes competencies with an outcome of competency achieved/pass/recognition of prior learning granted.
The KPM is derived by calculating student numbers in the 15–19 year age group as a percentage of the estimated residential population in the corresponding group.
From January 2014, all registered training organisations (RTOs), including private providers, were required to collect and report full AVETMISS data on all nationally accredited training. This represents a break in the series.
Sources: NCVER, National VET in Schools Collection 2009–14; NCVER, National VET Provider Collection 2009–14; National Report on Schooling in Australia, 2013; ABS, Cat. No. 3101.0, Australian demographic statistics.
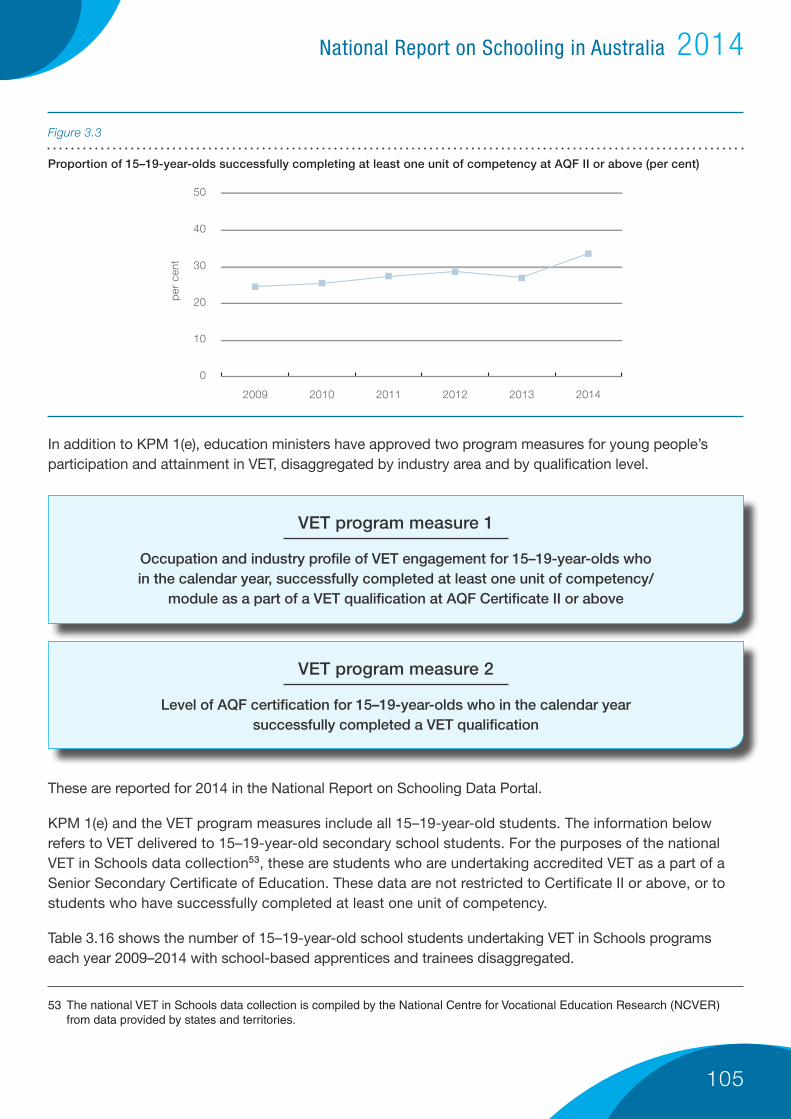
105
National Report on Schooling in Australia 2014
53 The national VET in Schools data collection is compiled by the National Centre for Vocational Education Research (NCVER) from data provided by states and territories.
Proportion of 15–19-year-olds successfully completing at least one unit of competency at AQF II or above (per cent)
Figure 3.3
VET program measure 1
Occupation and industry profile of VET engagement for 15–19-year-olds who in the calendar year, successfully completed at least one unit of competency/
module as a part of a VET qualification at AQF Certificate II or above
VET program measure 2
Level of AQF certification for 15–19-year-olds who in the calendar year successfully completed a VET qualification
These are reported for 2014 in the National Report on Schooling Data Portal.
KPM 1(e) and the VET program measures include all 15–19-year-old students. The information below refers to VET delivered to 15–19-year-old secondary school students. For the purposes of the national VET in Schools data collection53, these are students who are undertaking accredited VET as a part of a Senior Secondary Certificate of Education. These data are not restricted to Certificate II or above, or to students who have successfully completed at least one unit of competency.
Table 3.16 shows the number of 15–19-year-old school students undertaking VET in Schools programs each year 2009–2014 with school-based apprentices and trainees disaggregated.
In addition to KPM 1(e), education ministers have approved two program measures for young people’s participation and attainment in VET, disaggregated by industry area and by qualification level.
0
10
20
30
40
50
201420132012201120102009
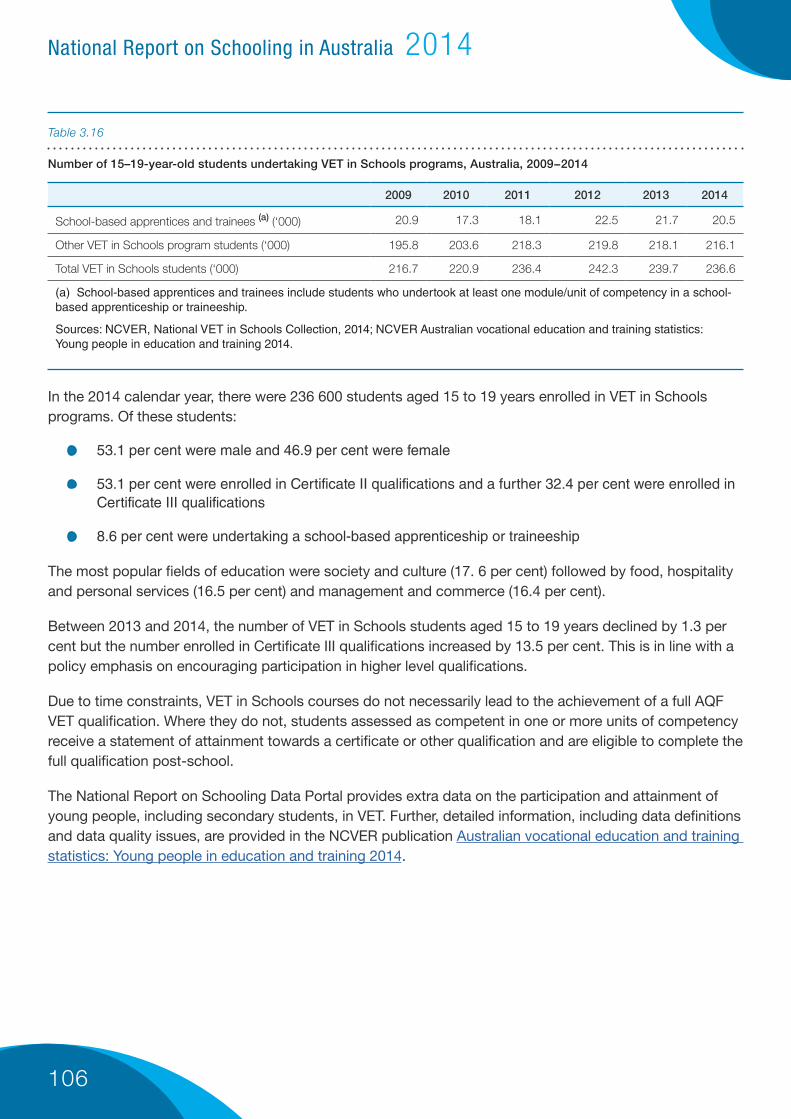
106
National Report on Schooling in Australia 2014
Number of 15–19-year-old students undertaking VET in Schools programs, Australia, 2009−2014
Table 3.16
2009 2010 2011 2012 2013 2014
School-based apprentices and trainees (a) (‘000) 20.9 17.3 18.1 22.5 21.7 20.5
Other VET in Schools program students (‘000) 195.8 203.6 218.3 219.8 218.1 216.1
Total VET in Schools students (‘000) 216.7 220.9 236.4 242.3 239.7 236.6
(a) School-based apprentices and trainees include students who undertook at least one module/unit of competency in a school-based apprenticeship or traineeship.
Sources: NCVER, National VET in Schools Collection, 2014; NCVER Australian vocational education and training statistics: Young people in education and training 2014.
In the 2014 calendar year, there were 236 600 students aged 15 to 19 years enrolled in VET in Schools programs. Of these students:
• 53.1 per cent were male and 46.9 per cent were female
• 53.1 per cent were enrolled in Certificate II qualifications and a further 32.4 per cent were enrolled in Certificate III qualifications
• 8.6 per cent were undertaking a school-based apprenticeship or traineeship
The most popular fields of education were society and culture (17. 6 per cent) followed by food, hospitality and personal services (16.5 per cent) and management and commerce (16.4 per cent).
Between 2013 and 2014, the number of VET in Schools students aged 15 to 19 years declined by 1.3 per cent but the number enrolled in Certificate III qualifications increased by 13.5 per cent. This is in line with a policy emphasis on encouraging participation in higher level qualifications.
Due to time constraints, VET in Schools courses do not necessarily lead to the achievement of a full AQF VET qualification. Where they do not, students assessed as competent in one or more units of competency receive a statement of attainment towards a certificate or other qualification and are eligible to complete the full qualification post-school.
The National Report on Schooling Data Portal provides extra data on the participation and attainment of young people, including secondary students, in VET. Further, detailed information, including data definitions and data quality issues, are provided in the NCVER publication Australian vocational education and training statistics: Young people in education and training 2014.
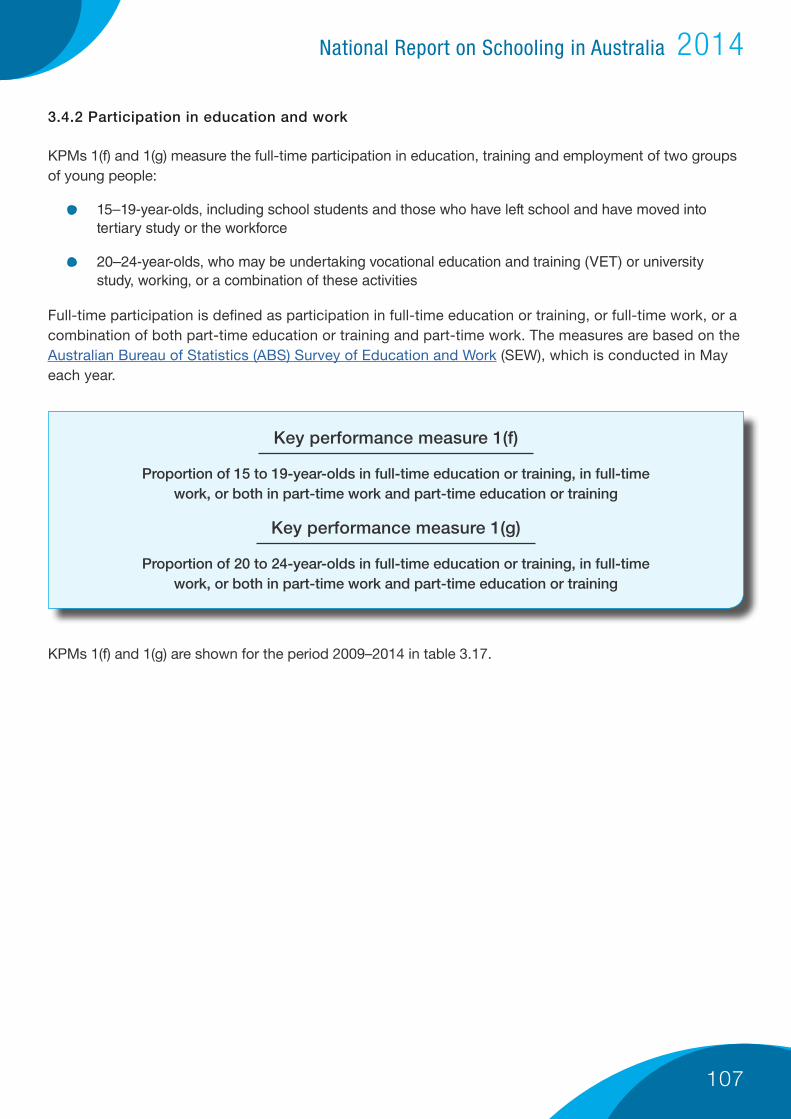
107
National Report on Schooling in Australia 2014
3.4.2 Participation in education and work
KPMs 1(f) and 1(g) measure the full-time participation in education, training and employment of two groups of young people:
• 15–19-year-olds, including school students and those who have left school and have moved into tertiary study or the workforce
• 20–24-year-olds, who may be undertaking vocational education and training (VET) or university study, working, or a combination of these activities
Full-time participation is defined as participation in full-time education or training, or full-time work, or a combination of both part-time education or training and part-time work. The measures are based on the Australian Bureau of Statistics (ABS) Survey of Education and Work (SEW), which is conducted in May each year.
KPMs 1(f) and 1(g) are shown for the period 2009–2014 in table 3.17.
Key performance measure 1(f)
Proportion of 15 to 19-year-olds in full-time education or training, in full-time work, or both in part-time work and part-time education or training
Key performance measure 1(g)
Proportion of 20 to 24-year-olds in full-time education or training, in full-time work, or both in part-time work and part-time education or training
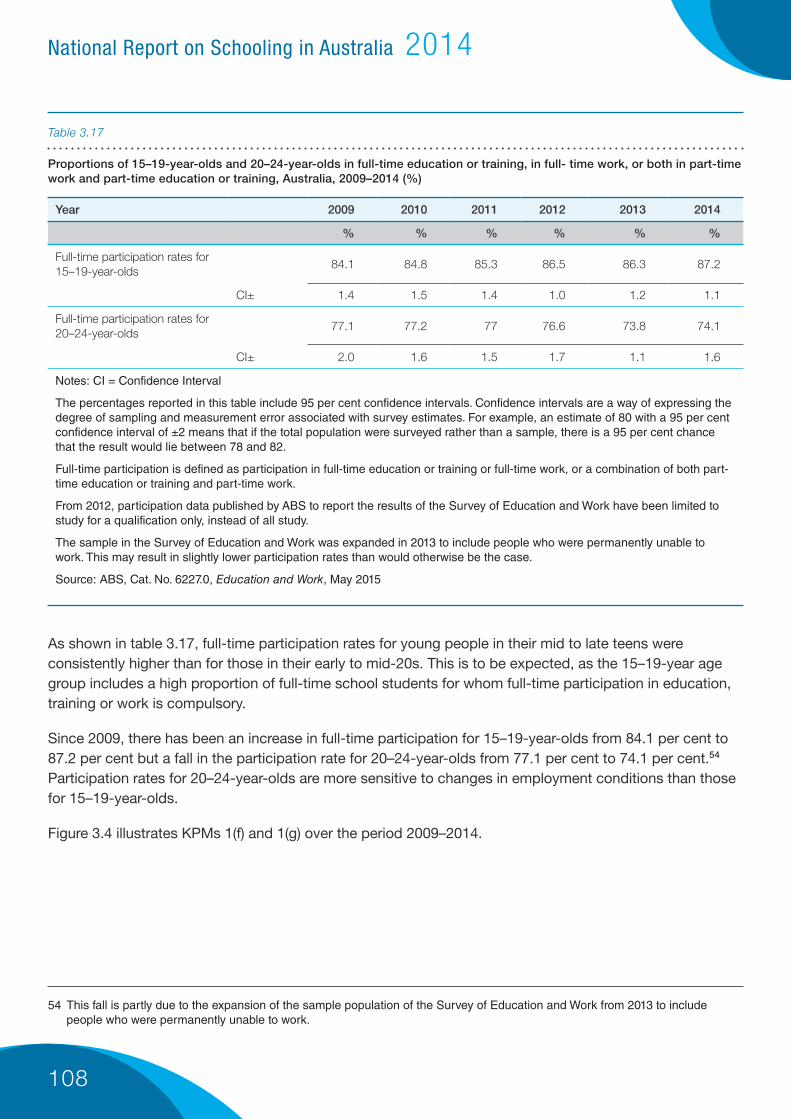
108
National Report on Schooling in Australia 2014
Proportions of 15–19-year-olds and 20–24-year-olds in full-time education or training, in full- time work, or both in part-time work and part-time education or training, Australia, 2009–2014 (%)
Table 3.17
Year 2009 2010 2011 2012 2013 2014
% % % % % %
Full-time participation rates for 15–19-year-olds
84.1 84.8 85.3 86.5 86.3 87.2
CI± 1.4 1.5 1.4 1.0 1.2 1.1
Full-time participation rates for 20–24-year-olds
77.1 77.2 77 76.6 73.8 74.1
CI± 2.0 1.6 1.5 1.7 1.1 1.6
Notes: CI = Confidence Interval
The percentages reported in this table include 95 per cent confidence intervals. Confidence intervals are a way of expressing the degree of sampling and measurement error associated with survey estimates. For example, an estimate of 80 with a 95 per cent confidence interval of ±2 means that if the total population were surveyed rather than a sample, there is a 95 per cent chance that the result would lie between 78 and 82.
Full-time participation is defined as participation in full-time education or training or full-time work, or a combination of both part-time education or training and part-time work.
From 2012, participation data published by ABS to report the results of the Survey of Education and Work have been limited to study for a qualification only, instead of all study.
The sample in the Survey of Education and Work was expanded in 2013 to include people who were permanently unable to work. This may result in slightly lower participation rates than would otherwise be the case.
Source: ABS, Cat. No. 6227.0, Education and Work, May 2015
As shown in table 3.17, full-time participation rates for young people in their mid to late teens were consistently higher than for those in their early to mid-20s. This is to be expected, as the 15–19-year age group includes a high proportion of full-time school students for whom full-time participation in education, training or work is compulsory.
Since 2009, there has been an increase in full-time participation for 15–19-year-olds from 84.1 per cent to 87.2 per cent but a fall in the participation rate for 20–24-year-olds from 77.1 per cent to 74.1 per cent.54 Participation rates for 20–24-year-olds are more sensitive to changes in employment conditions than those for 15–19-year-olds.
Figure 3.4 illustrates KPMs 1(f) and 1(g) over the period 2009–2014.
54 This fall is partly due to the expansion of the sample population of the Survey of Education and Work from 2013 to include people who were permanently unable to work.

109
National Report on Schooling in Australia 2014
Proportions of 15–19-year-olds and 20–24-year-olds in full-time education or training, in full-time work, or both in part-time work and part-time education or training, Australia, 2009–14 (per cent)
Figure 3.4
Data on KPMs 1(f) and 1(g) by state and territory are provided on the National Report on Schooling data portal. However, because of sample size and other factors, SEW data for particular age groups are less reliable when disaggregated by state and territory, especially for smaller jurisdictions. SEW data cannot be disaggregated by Indigenous status.
Based on SEW data, 81.7 per cent of 15–19-year-olds in 2014 were engaged in formal study, a rise from 80.9 per cent in 2013 and from 76.4 per cent in 2009.55
Using a range of administrative data sources, the National Centre for Vocational Education Research (NCVER) has estimated that 82.7 per cent of Australians aged 15 to 19 years were participating in education and training as at August 2014. This included school students (55.8 per cent), higher education students (15.9 per cent), apprentices and trainees56 (4.7 per cent) and other VET students (6.1 per cent). This estimate rose from 81.3 per cent in 201357.
55 ABS, Cat. No. 6227.0, Education and Work, May 2015
56 Excluding school-based traineeships and apprenticeships.
57 NCVER, Australian Vocational Education and Training Statistics: young people in education and training 2014.
0
10
20
30
40
50
60
70
80
90
100
Full-time participation ratesfor 15-19-year-olds
Full-time participation ratesfor 20-24year-olds
201420132012201120102009
Courtesy of the WA Department of Education

110
National Report on Schooling in Australia 2014
3.4.3 Senior schooling and youth transitions – student attainment
The attainment key performance measures (KPMs) specified in the Measurement Framework for Schooling in Australia 2012 measure the level of educational attainment achieved by young Australians by the time they have reached their early to mid-twenties. These measures reflect the COAG targets for youth attainment in education and training:
Key performance measure 7 (a)
Proportion of the 20 to 24-year-old population having attained at least Year 12 or equivalent or AQF Certificate II or above
Key performance measure 7 (b)
Proportion of the 20 to 24-year-old population having attained at least Year 12 or equivalent or AQF Certificate III or above
Table 3.18 reports KPMs 7(a) and 7(b) at the national level for the period 2009–2014.
For comparison purposes, the table also reports the proportion of the 20–24-year-old population in each of these years, that had completed Year 12 or equivalent. This is not, by itself a KPM for schooling, but is the main component of both KPMs 7 (a) and 7 (b).
Courtesy of the WA Department of Education
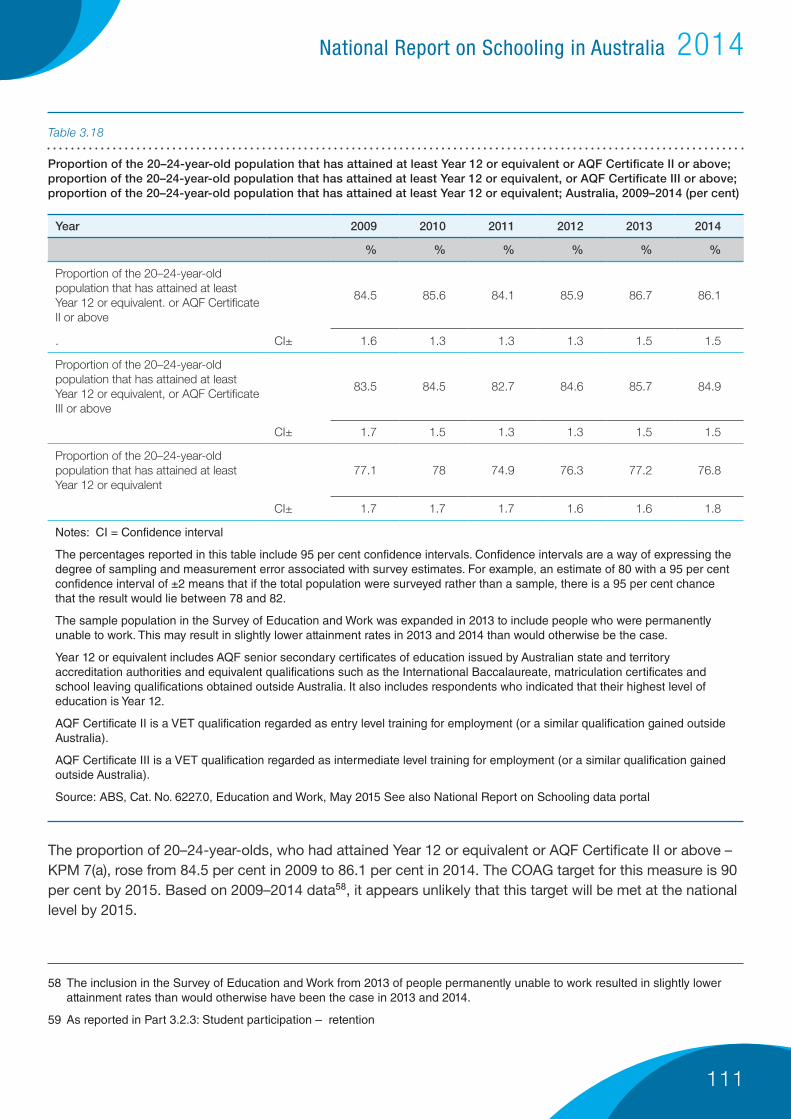
111
National Report on Schooling in Australia 2014
Proportion of the 20–24-year-old population that has attained at least Year 12 or equivalent or AQF Certificate II or above; proportion of the 20–24-year-old population that has attained at least Year 12 or equivalent, or AQF Certificate III or above; proportion of the 20–24-year-old population that has attained at least Year 12 or equivalent; Australia, 2009–2014 (per cent)
Table 3.18
Year 2009 2010 2011 2012 2013 2014
% % % % % %
Proportion of the 20–24-year-old population that has attained at least Year 12 or equivalent. or AQF Certificate II or above
84.5 85.6 84.1 85.9 86.7 86.1
. CI± 1.6 1.3 1.3 1.3 1.5 1.5
Proportion of the 20–24-year-old population that has attained at least Year 12 or equivalent, or AQF Certificate III or above
83.5 84.5 82.7 84.6 85.7 84.9
CI± 1.7 1.5 1.3 1.3 1.5 1.5
Proportion of the 20–24-year-old population that has attained at least Year 12 or equivalent
77.1 78 74.9 76.3 77.2 76.8
CI± 1.7 1.7 1.7 1.6 1.6 1.8
Notes: CI = Confidence interval
The percentages reported in this table include 95 per cent confidence intervals. Confidence intervals are a way of expressing the degree of sampling and measurement error associated with survey estimates. For example, an estimate of 80 with a 95 per cent confidence interval of ±2 means that if the total population were surveyed rather than a sample, there is a 95 per cent chance that the result would lie between 78 and 82.
The sample population in the Survey of Education and Work was expanded in 2013 to include people who were permanently unable to work. This may result in slightly lower attainment rates in 2013 and 2014 than would otherwise be the case.
Year 12 or equivalent includes AQF senior secondary certificates of education issued by Australian state and territory accreditation authorities and equivalent qualifications such as the International Baccalaureate, matriculation certificates and school leaving qualifications obtained outside Australia. It also includes respondents who indicated that their highest level of education is Year 12.
AQF Certificate II is a VET qualification regarded as entry level training for employment (or a similar qualification gained outside Australia).
AQF Certificate III is a VET qualification regarded as intermediate level training for employment (or a similar qualification gained outside Australia).
Source: ABS, Cat. No. 6227.0, Education and Work, May 2015 See also National Report on Schooling data portal
The proportion of 20–24-year-olds, who had attained Year 12 or equivalent or AQF Certificate II or above – KPM 7(a), rose from 84.5 per cent in 2009 to 86.1 per cent in 2014. The COAG target for this measure is 90 per cent by 2015. Based on 2009–2014 data58, it appears unlikely that this target will be met at the national level by 2015.
58 The inclusion in the Survey of Education and Work from 2013 of people permanently unable to work resulted in slightly lower attainment rates than would otherwise have been the case in 2013 and 2014.
59 As reported in Part 3.2.3: Student participation – retention

112
National Report on Schooling in Australia 2014
In each of the years 2009–2014, there is little difference between the two attainment KPMs (a maximum difference of 1.4 percentage points), and there is parallel movement of the KPMs over the period61.
Both KPMs closely parallel changes in the proportion of the 20–24-year-olds that has attained at least Year 12 or equivalent, which forms the major component of both measures. In 2014, 77.2 per cent of 20–24-year-olds had attained at least Year 12 or equivalent. A further 8.5 per cent, who had not attained Year 12, had attained Certificate III or above, and a further 1.0 per cent had attained Certificate II or above, but not Year 12 or Certificate III.
However, since 2009, rises have occurred in both retention to Year 1259 and in participation in education, training and work by 15–19-year-olds60. These rises may translate to increased attainment levels for these students as they move into the 20–24-year-old age bracket from 2015.
The proportion of 20–24-year-olds, who had attained Year 12 or equivalent, or AQF Certificate III or above – KPM 7(b), rose from 83.5 per cent to 84.9 per cent between 2009 and 2014.
The COAG target for this measure is 90 per cent by 2020. Based on 2009–2014 data, it is not clear whether this target will be achieved at the national level by 2020. However, it is likely that increased retention to Year 12, and increased participation in education and training by 15–19-year-olds since 2009 will lead to higher levels of attainment for these students as 20–24 year-olds in 2020. This would have a positive impact on this measure, enhancing the likelihood that the target is achieved by 2020.
Figure 3.5 depicts the movement in the two attainment measures from 2009 to 2014, along with the proportion of 20–24-year-olds having attained at least Year 12 or equivalent.
60 As reported in Part 3.4.2: Senior schooling and youth transitions – participation in education and work.
61 For the three data sets shown in table 3.17 and figure 3.5 the falls in 2011 data are not statistically significant and may reflect sampling variability in the Survey of Education and Work. Decreases in KPMs 7a and 7b in 2014 are not statistically significant.
Proportions of 20–24-year-olds having attained at least Year 12 or equivalent, or AQF Certificate II or above; 20–24-year-olds having attained at least Year 12 or equivalent, or AQF Certificate III or above; and proportion of the 20–24-year-olds having attained at least Year 12 or equivalent; Australia, 2009–2014 (per cent)
Figure 3.5
0
10
20
30
40
50
60
70
80
90
100
Proportion of the 20–24-year-old populationthat has attained at least Year 12 or equivalent
Proportion of the 20–24-year-old populationthat has attained at least Year 12 or equivalent,or AQF Certi�cate III or above
Proportion of the 20–24-year-old populationthat has attained at least Year 12 or equivalent,or AQF Certi�cate II or above
201420132012201120102009

113
National Report on Schooling in Australia 2014
62 Source: Indigenous data are from the Australian Aboriginal and Torres Strait Islander Health Survey 2012-13 and the National Aboriginal and Torres Strait Islander Social Survey 2008. Non-Indigenous data are from the Survey of Education and Work.
63 The volume of learning required to attain an AQF Certificate II is typically 0.5–1 year; for Certificate III it is typically 1–2 years, and for a Senior Secondary Certificate of Education it is typically 2 years (AQF Second edition p. 14). In some instances, VET in Schools students have the opportunity to complete several Certificate II qualifications as a part of their Senior Secondary Certificate of Education.
The proportion of young people completing Year 12 or equivalent is not itself a KPM for schooling, as pursuing a VET qualification post-Year 10 is a legitimate alternative to Years 11 and 12 as a pathway to further education and work.
However, as shown in figure 3.5, it is not only the major component of KPMs 7(a) and 7(b), but is also a determining component, with variations in the two KPMs closely following variations in Year 12 or equivalent attainment.
This has implications for predicting and influencing the COAG measures, as the rate of Year 12 completion for current secondary students can be used as an indicator for the future attainment rates for Year 12, or Certificate II/Certificate III, or above among 20–24-year-olds.
Data for KPMs 7(a) and 7(b) by state and territory are provided on the National Report on Schooling data portal. However, because of sample size and other factors, SEW data for particular age groups (such as 20–24-year-olds) are less reliable when disaggregated by state and territory, especially for smaller jurisdictions.
SEW data cannot be disaggregated by Indigenous status, so cannot be used to report on the COAG target to at least halve the gap in Year 12 or equivalent attainment between Aboriginal and Torres Strait Islander and non-Indigenous 20–24 year olds by 2020.
Using other data sources to supplement SEW data, the Closing the Gap – Prime Minister’s Report 2015 reports that:
This target is on track. Nationally, the proportion of Indigenous 20 24-year-olds who had achieved Year 12 or equivalent increased from 45.4 per cent in 2008 to 58.5 per cent in 2012 13. Between 2008 and 2012 13, the gap narrowed by 11.6 percentage points (from 39.6 percentage points in 2008 to 28 percentage points in 2012 13). For non Indigenous Australians, the proportion rose slightly (85.0 per cent in 2008 to 86.5 per cent in 2012)62.
While the attainment KPMs 7(a) and 7(b) refer to the completion of Year 12 or equivalent or an AQF VET Certificate, this does not imply equivalence between the award of a Senior Secondary Certificate of Education on the completion of Year 12 and either AQF Certificate II or AQF Certificate III. The AQF does not specify equivalence between Senior Secondary Certificates and other AQF qualification63.
Part 4 Glossary

National Report on Schooling in Australia 2014
Glossary
Note on data sources and terms: A main source of data reported in the National Report on
Schooling in Australia 2014 and through the National Report on Schooling Data Portal is the
National Schools Statistics Collection (NSSC) (non-finance). The NSSC includes statistics
on students, schools, and staff involved in the provision or administration of primary and
secondary education, in government and non-government schools, for all Australian states
and territories. The school census date for the collection, for all states and territories and all
school sectors (affiliations), is the first Friday in August each year.
The NSSC is a joint undertaking of the Australian state and territory departments of
education, the Australian Government Department of Education and Training, the Australian
Bureau of Statistics (ABS) and the COAG Education Council.
The methodologies employed in compiling government sector data vary between the
different state and territory departments of education. Data may be accessed from central
administrative records or collected directly from education establishments. Data are provided
to the ABS, generally in aggregated form, for the compilation of statistics. The Australian
Government Department of Education and Training collects data directly from
establishments in the non-government sector for all states and territories for administrative
purposes.
Data from the collection are published by the ABS in Schools, Australia, 2014 (cat. no.
4221.0). Definitions of terms in this glossary are, for the most part, quoted or adapted from
the Schools, Australia glossary and explanatory notes; and from the Notes, Instructions and
Tabulations document, which is available on request from the ABS.
Other major data sources for the 2014 report and the National Report on Schooling Data
Portal include the National Student Attendance Data collection (ACARA), the Survey of
Education and Work (ABS), the NSSC (finance) collection (states and territories), National
Assessment Program (NAP) national reports (ACARA) and National VET Provider and
National VET in Schools collections (National Centre for Vocational Education Research –
NCVER).
Apparent retention rates and apparent progression rates
Apparent retention and progression rates are indicative measures of student progression
through school. To calculate actual rates for all students in a given population, analysis on
the status of every student between years would be required to determine whether they
progressed as expected, progressed but transferred to another state or territory or a school
in a different school sector, repeated or left school entirely. At present, conducting such
analysis of all individuals through linking student enrolment information between different
years and across jurisdictions is not possible. Apparent measures, based on aggregate
student data, have been developed to provide indicative measurements of student
engagement and progress in secondary education.
Apparent retention rates provide an indicative measure of the number of full-time school
students who have stayed at school, as at a designated year level and calendar year. It is
calculated by dividing the number of students in a cohort in a specific calendar year by the
number of students in the same cohort in a previous reference year and is expressed as a
percentage. For example, an apparent retention rate for Years 10 to 12 in 2014 measures
115
National Report on Schooling in Australia 2014
the proportion of Year 10 students in 2012 that continued to Year 12 in 2014. See Schools,
Australia explanatory notes for further information.
Apparent progression rates measure the proportion of a cohort of full-time students that
moves from one grade to the next at an expected rate of progression of one grade per year.
Apparent progression rates are adjusted to factor in changes in the population. See Schools,
Australia explanatory notes for further information.
Schools, Australia also publishes data on apparent continuation rates and school
participation rates.
Estimated resident population
The Estimated Resident Population (ERP) series is used as a denominator to calculate
students as a proportion of the population. The ERP is an estimate of the population of
Australia, based on data from the quinquennial ABS Census of Population and Housing, and
is updated quarterly using information on births, deaths, and overseas and interstate
migration provided by state, territory and Australian government departments. For further
details see ABS, Cat. No. 3101.0, Australian Demographic Statistics, June 2015.
Full-time equivalent student
A full-time student is one who undertakes a workload equivalent to, or greater than, what is
prescribed for a full-time student of that year level. This may vary between states and
territories and from year to year. The prescribed minimum workload for a full-time student
would ensure that a student could complete a given year level in a calendar year.
A part-time student is one who undertakes a workload less than that specified as full-time.
The full-time equivalent (FTE) value of a part-time student is calculated by dividing a
student's workload into what is prescribed by the state or territory to be the minimum full
workload for a full-time student. Methods for estimating the FTE value of part-time students
vary between states and territories due to different policy and administrative arrangements.
The recorded FTE value for a student is capped at 1. The FTE of students is calculated by
adding the number of full-time students and the FTE value of part-time students.
Full-time equivalent student teacher ratios
Full-time equivalent (FTE) student/teacher ratios are calculated by dividing the FTE student
figure by the FTE teaching staff figure. Student/teacher ratios are an indicator of the level of
staffing resources used and should not be used as a measure of class size. They do not
take account of teacher aides and other non-teaching staff who may also assist in the
delivery of school education or of non-teaching duties of teaching staff.
Full-time equivalent teaching staff
The full-time equivalent (FTE) value of staff is a measure of the level of staffing resources.
Staff who are employed full-time and engaged solely on activities that fall within the scope of
the NSSC have an FTE value of 1.0. All FTE values are rounded to one decimal place.
For staff not employed on a full-time basis, and/or engaged in a combination of in-scope and
out-of-scope activities, the FTE value is calculated on the basis of the proportion of time
spent on in-scope activities compared with staff who would be considered full-time.
116

National Report on Schooling in Australia 2014
Indigenous/Aboriginal and/or Torres Strait Islander status
For the purposes of the NSSC, a student is classified as being of Aboriginal and/or Torres
Strait Islander origin, based on information provided by the student, or their parent/guardian,
on the school enrolment form. The Melbourne Declaration uses the term ‘Indigenous’ to refer
to Australia’s Aboriginal and Torres Strait Islander peoples. Where possible, this report uses
‘Aboriginal and Torres Strait Islander’ in preference to ‘Indigenous’ in the text but uses the
classification Indigenous/non-Indigenous in tables and graphs.
The Measurement Framework for Schooling in Australia
The Measurement Framework for Schooling in Australia 2012 , as agreed by education
ministers, provides the basis for national reporting on the performance of schooling in
2014, and is the main focus of the statistical data included in this report.
The measurement framework defines national key performance measures (KPMs) for
schooling, specifies the data sources for these KPMs and outlines the reporting cycle for
the period 2012–2017.
The framework is maintained by the Australian Curriculum, Assessment and Reporting
Authority (ACARA) on behalf of the Education Council and is published on the ACARA
website. It is periodically revised by ACARA in consultation with jurisdictions and sectors
National Assessment Program (NAP)
The NAP, as specified in the Measurement Framework for Schooling in Australia,
encompasses all assessments endorsed by education ministers for participation by students
nationally:
the National Assessment Program – Literacy and Numeracy (NAPLAN) – annual, full
student cohort literacy and numeracy assessments in Years 3, 5, 7 and 9
NAP sample assessments – triennial domestic sample student population
assessments in science literacy (Year 6), information and communication technology
literacy (Years 6 and 10) and civics and citizenship (Years 6 and 10) (to 2017)
Australia's participation in international sample student population assessments, the
Programme for International Student Assessment (PISA) and the Trends in
International Mathematics and Science Study (TIMSS).
ACARA is delegated to manage the development and oversee the delivery of assessments
and reporting for NAPLAN, and for domestic NAP sample assessments, as directed by the
Education Council. PISA is conducted by the Organisation for Economic Co-operation and
Development (OECD). TIMSS is conducted by the International Association for the
Evaluation of Educational Achievement (IEA).
National Schools Statistics Collection
The scope of the National Schools Statistics Collection (NSSC) consists of all
establishments that have as their major activity the administration or provision of full-time
day primary, secondary and/or special education, or primary or secondary education by
distance education. Major activity is based on the activity of students, or where this is not
appropriate, for example, in administrative offices, on the activity of staff. The statistics in this
publication do not include establishments, students or staff engaged in school-level
117

National Report on Schooling in Australia 2014
education conducted by other institutions, in particular Technical and Further Education
(TAFE) establishments.
The NSSC consists of government and non-government statistics. Government comprises
all establishments (as defined), administered by departments/ministries of education under
directors-general of education (or equivalent). Non-government comprises all such
establishments not administered by the departments of education, including those
establishments administered by any other government authority.
The two main sections of the NSSC are:
• non-finance statistics (numbers of schools, students and staff) collected for bothgovernment and non-government schools and published by the Australian Bureau ofStatistics in its annual Schools, Australia (Cat. No. 4221.0) publication
• finance statistics (expenditure on salaries and non-salary costs collected for governmentschools) and published by ACARA in this report.
Primary education
See School level and school year.
School
A school is an education establishment that satisfies all of the following criteria:
Its major activity is the provision of full-time day primary or secondary education or theprovision of primary or secondary distance education.
It is headed by a principal (or equivalent) responsible for its internal operation.
It is possible for students to enrol and be active in a course of study for a minimum of fourcontinuous weeks, excluding breaks for school vacations.
The term ‘school’ in this publication includes schools in institutions and hospitals, mission
schools and similar establishments.
The term 'school' in this publication excludes preschools, kindergarten centres, pre-primary
schools or pre-primary classes in, or attached to, non-special schools, senior technical and
agricultural colleges, evening schools, continuation classes and institutions such as business
or coaching colleges.
Multi-campus arrangements are counted as one school. Changes to school counts in this
publication can occur when multiple schools amalgamate into a single multi-campus school,
or multi-campus schools divide into separate schools.
School level and school year
All states and territories provide for 13 years of formal school education. Typically, schooling
commences at age five, is compulsory from age six until at least the completion of Year 10,
and is completed at age 17 or 18. Primary education, including a preparatory year1, lasts for
1 The preparatory year (first year of full-time schooling) is known as Preparatory in Victoria, Queensland and Tasmania,
Kindergarten in New South Wales and the Australian Capital Territory, Reception in South Australia, Pre-primary in
Western Australia and Transition in the Northern Territory. In some jurisdictions, part-time programs that precede the
preparatory year are conducted in primary schools (for example, Kindergarten in Western Australia). However, these
programs are outside the scope of the NSSC; data on them are not, in general, included in this report.
118
National Report on Schooling in Australia 2014
either seven or eight years and is followed by secondary education of six or five years
respectively.
For national reporting purposes, primary education comprises a pre-Year 1 year followed by
Years 1–6 in New South Wales, Victoria, Tasmania, the Northern Territory and the
Australian Capital Territory. For national reporting purposes, primary education comprises a
pre-Year 1 year followed by Years 1–7 in Queensland, South Australia and Western
Australia.2
Junior secondary education includes the years from commencement of secondary schooling
to Year 10, including ungraded secondary.
Senior secondary education comprises Years 11 and 12 in all states and territories.
Categories used in tables and graphs showing ‘School level’ are ‘Primary’ and ‘Secondary’.
In some tables, the categories ‘Primary’, ‘Junior secondary’, ‘Senior secondary’ and ‘Total
secondary’ are used.
Students attending special schools are allocated to either primary or secondary education on
the basis of school year or school level where identified. Where the school year or school
level is not identified, students are allocated to primary or secondary level of education
according to the typical age level in each state or territory.
See also Special School.
Schools Australia uses the term ‘grade’ to denote school year. Ungraded students (ungraded
primary and ungraded secondary) are those who have not been placed in a specific year
level.
See also School type
School sector
This report and the National Report on Schooling Data Portal use the term ‘school sector’ to
distinguish between government schools, which are established and administered by state
and territory governments through their education departments or authorities, and non-
government schools, usually with some religious affiliation, which are established and
operated under conditions determined by state and territory governments through their
registration authorities.
‘School sector’ is also used to further distinguish between non-government schools as
Catholic or independent. Catholic schools make up the largest group of non-government
schools. Independent schools may be associated with other religions, other denominations,
particular educational philosophies, or operate as single entities.
Schools, Australia uses the term ‘affiliation’ rather than the term ‘school sector’ to make these
distinctions.
A further distinction is sometimes made between systemic and non-systemic non-
government schools. Systemic schools are formally affiliated with a group or system of
schools. Non-systemic non-government schools do not belong to a system.
2 Year 7 will become part of secondary education in Queensland and Western Australia from 2015.
119

National Report on Schooling in Australia 2014
In Schools, Australia and in this report, Catholic non-systemic schools are counted as
Catholic rather than as independent.
Categories used in tables and graphs showing ‘School sector’ are ‘Government’, ‘Catholic’
and ‘Independent’. In some tables, the category ‘Total non-government’ (total of Catholic and
independent data) is also used.
School type
Categories used in tables and graphs showing ‘School type’ are:
‘Primary’ – school delivers primary education
‘Secondary’ – school delivers secondary education
‘Combined’ – school delivers both primary and secondary education
‘Special’ – students may include primary students, secondary students, ungradedstudents or a combination of primary, secondary and ungraded students.
See also Special School
Secondary education
See School level and school year.
Special school
A special school satisfies the definition of a school and requires one or more of the following
characteristics to be exhibited by the student before enrolment is allowed:
mental or physical disability or impairment
slow learning ability
social or emotional problems
in custody, on remand or in hospital.
Special schools include special assistance schools, as defined under the Australian
Education Act, 2013.
Staff
Staff are people engaged in the administration and/or provision of day primary, secondary or
special school education, or primary or secondary education by distance education at in-
scope education establishments.
The functional categories for school staff are as follows:
(a) Teaching staff are staff who spend the majority of their time in contact with students.
They support students either by direct class contact or on an individual basis, and are
engaged to impart school curriculum. For the purposes of this report, teaching staff includes
principals, deputy principals, campus principals and senior teachers mainly involved in
administration.
120

National Report on Schooling in Australia 2014
(b) Specialist support staff are staff who perform functions to support students or teaching
staff. While these staff may spend the majority of their time in contact with students, they are
not employed or engaged to impart the school curriculum.
(c) Administrative and clerical staff are staff whose main duties are generally of a
clerical/administrative nature. Teacher aides and assistants are included in this category, as
they are seen to provide services to teaching staff rather than directly to students.
(d) Building operations, general maintenance and other staff are staff involved in the
maintenance of buildings and grounds. Also included are staff providing associated technical
services, other janitorial staff and staff who service equipment. School cleaners, whether
salaried or employed on contract, are excluded.
For further details on the definition of staff, see Schools, Australia 2014 – Glossary
States and territories
Australia has a federal system of government comprising a national government, and the
governments of the six states and two territories. In this report, the national government is
generally referred to as ‘the Australian Government’. In tables and graphs in this report and
the National Report on Schooling Data Portal, states and territories are listed in the order of
New South Wales (NSW), Victoria (Vic.), Queensland (Qld), South Australia (SA), Western
Australia (WA), Tasmania (Tas.), the Northern Territory (NT) and the Australian Capital
Territory (ACT). This is the order used in ABS publications, including Schools Australia.
Student
A student is a person who, on the school census date, is formally enrolled at a school and is
active in a primary, secondary and/or special education program at that school. Students may
be enrolled at more than one school; however, jurisdictions employ strategies that ensure
that, as far as possible, students are reported only once in this collection.
Persons not present at a school on the NSSC census date are included as students if they
were expected to be absent for less than four continuous weeks (excluding school
vacations).
Students undertaking VET in Schools (including through TAFE), school-based
apprenticeships or traineeships, work placements or tertiary extension studies as a part of
the student’s school enrolment are in scope for the NSSC. The workload of these
subjects/programs (which may take place outside the school premises) is included in a
student’s aggregate workload to determine whether a student is classified as full-time or
part-time, and in calculating the full-time equivalent for part-time students.
Student attendance
The National Student Attendance Data Collection is undertaken by ACARA in collaboration
with state and territory education departments (which collect and collate attendance data
from government schools in each jurisdiction), the non-government school sectors and the
Australian Department of Education (which collects and collates attendance data from non-
government schools). The collection is conducted for students in Years 1–10 over the
Semester 1 period in each school year.
The agreed national key performance measure (KPM) in 2014 for the rate of student
attendance is:
121
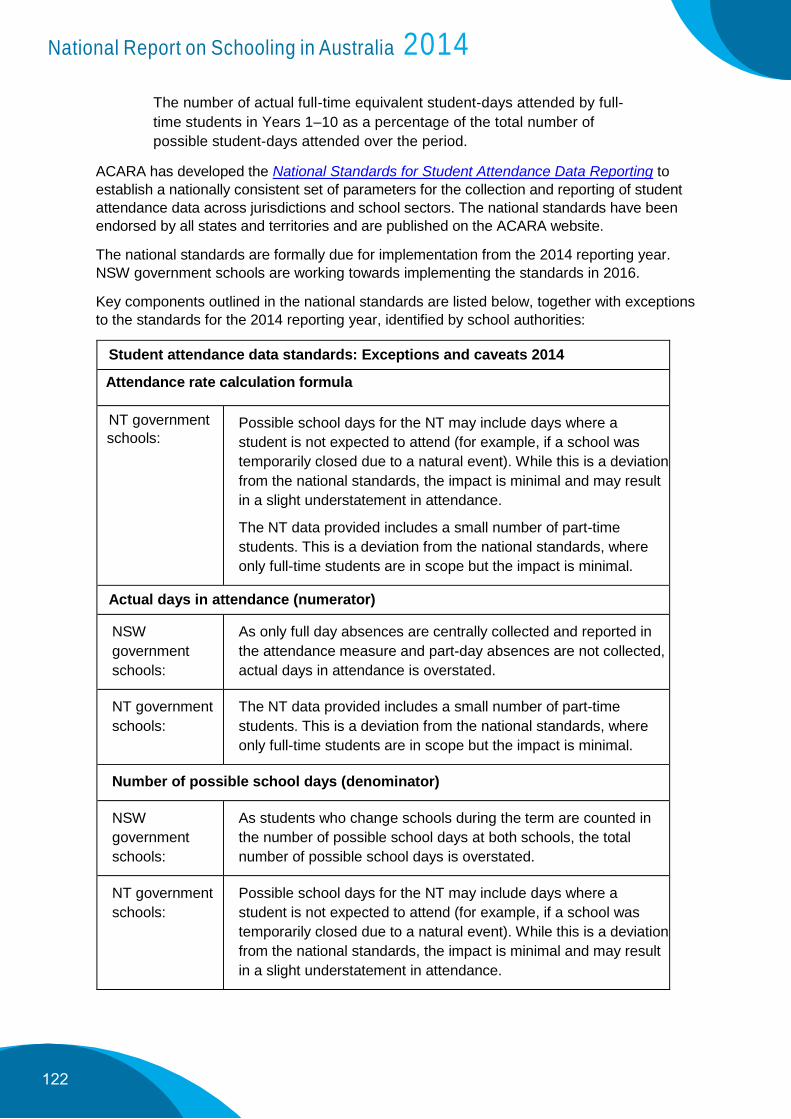
National Report on Schooling in Australia 2014
The number of actual full-time equivalent student-days attended by full-
time students in Years 1–10 as a percentage of the total number of
possible student-days attended over the period.
ACARA has developed the National Standards for Student Attendance Data Reporting to
establish a nationally consistent set of parameters for the collection and reporting of student
attendance data across jurisdictions and school sectors. The national standards have been
endorsed by all states and territories and are published on the ACARA website.
The national standards are formally due for implementation from the 2014 reporting year.
NSW government schools are working towards implementing the standards in 2016.
Key components outlined in the national standards are listed below, together with exceptions
to the standards for the 2014 reporting year, identified by school authorities:
Student attendance data standards: Exceptions and caveats 2014
Attendance rate calculation formula
NT government
schools: Possible school days for the NT may include days where a
student is not expected to attend (for example, if a school was
temporarily closed due to a natural event). While this is a deviation
from the national standards, the impact is minimal and may result
in a slight understatement in attendance.
The NT data provided includes a small number of part-time
students. This is a deviation from the national standards, where
only full-time students are in scope but the impact is minimal.
Actual days in attendance (numerator)
NSW
government
schools:
As only full day absences are centrally collected and reported in
the attendance measure and part-day absences are not collected,
actual days in attendance is overstated.
NT government
schools:
The NT data provided includes a small number of part-time
students. This is a deviation from the national standards, where
only full-time students are in scope but the impact is minimal.
Number of possible school days (denominator)
NSW
government
schools:
As students who change schools during the term are counted in
the number of possible school days at both schools, the total
number of possible school days is overstated.
NT government
schools:
Possible school days for the NT may include days where a
student is not expected to attend (for example, if a school was
temporarily closed due to a natural event). While this is a deviation
from the national standards, the impact is minimal and may result
in a slight understatement in attendance.
122
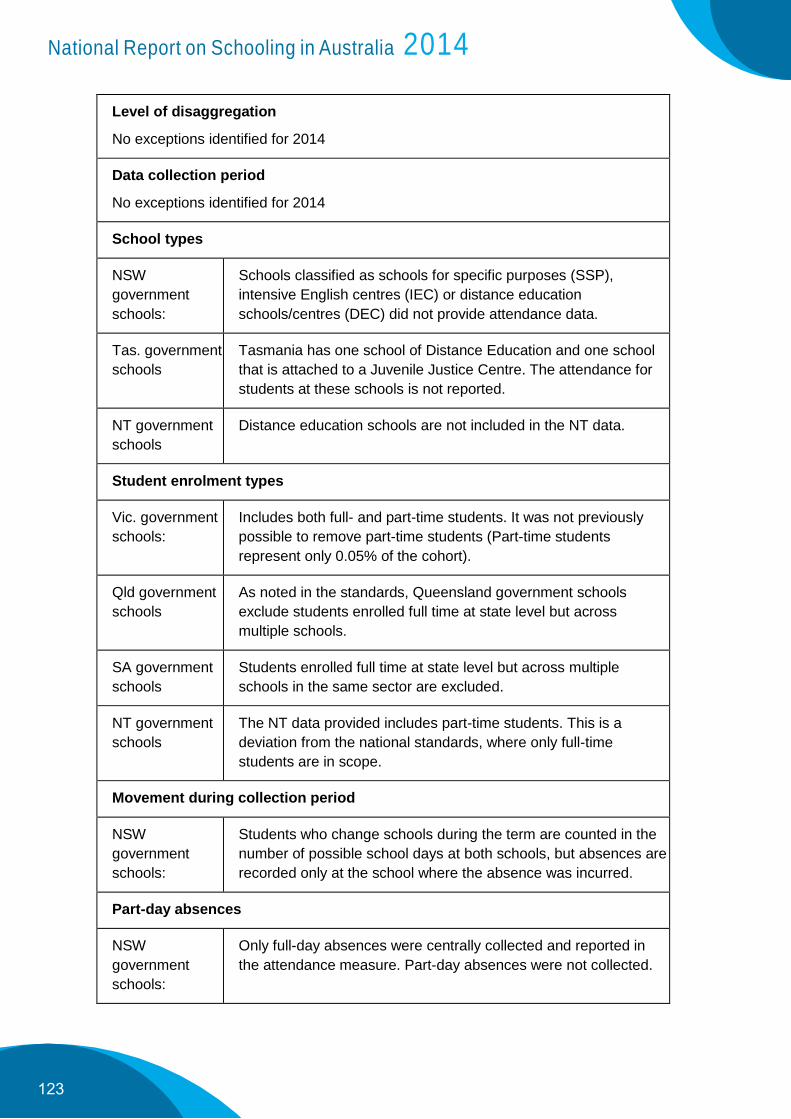
National Report on Schooling in Australia 2014
Level of disaggregation
No exceptions identified for 2014
Data collection period
No exceptions identified for 2014
School types
NSW
government
schools:
Schools classified as schools for specific purposes (SSP),
intensive English centres (IEC) or distance education
schools/centres (DEC) did not provide attendance data.
Tas. government
schools
Tasmania has one school of Distance Education and one school
that is attached to a Juvenile Justice Centre. The attendance for
students at these schools is not reported.
NT government
schools
Distance education schools are not included in the NT data.
Student enrolment types
Vic. government
schools:
Includes both full- and part-time students. It was not previously
possible to remove part-time students (Part-time students
represent only 0.05% of the cohort).
Qld government
schools
As noted in the standards, Queensland government schools
exclude students enrolled full time at state level but across
multiple schools.
SA government
schools
Students enrolled full time at state level but across multiple
schools in the same sector are excluded.
NT government
schools
The NT data provided includes part-time students. This is a
deviation from the national standards, where only full-time
students are in scope.
Movement during collection period
NSW
government
schools:
Students who change schools during the term are counted in the
number of possible school days at both schools, but absences are
recorded only at the school where the absence was incurred.
Part-day absences
NSW
government
schools:
Only full-day absences were centrally collected and reported in
the attendance measure. Part-day absences were not collected.
123

National Report on Schooling in Australia 2014
NT government
schools
Students attending less than half a day are not included in the
numerator.
Ungraded students
NSW
government
schools:
Ungraded students enrolled in schools for specific purposes were
not included in the absence collections.
Qld government
schools
Queensland government schools reported ungraded students in
2014.
Treatment of incidents/absences
NSW
government
schools:
Extended holidays where students were granted an exemption
from attendance were not included in absence counts.
Vic. government
schools
Accept school coding for absence reason.
NT government
schools:
Possible school days may include days where a student is not
expected to attend. For example, student attendance may not be
expected if the school is closed due to a natural event; a student
is being held at a remand centre; or a student has a dual
enrolment at another school.
Survey of Education and Work
The Survey of Education and Work (SEW), conducted annually by the ABS, provides
selected information on participation in education, highest educational attainment, transition
from education to work, and current labour force and demographic characteristics for the
population aged 15–74 years. Data from Education and Work are used to report participation
and attainment data, including key performance measures for schooling, in this report.
See ABS, Category 6227.0, Education and Work, May 2015, Explanatory Notes for further
information.
Teaching staff
Teaching staff are staff who spend the majority of their time in contact with students. They
support students either by direct class contact or on an individual basis, and are engaged to
impart school curriculum.
For the purposes of this report, teaching staff includes principals, deputy principals, campus
principals and senior teachers mainly involved in administration. Teacher aides and
assistants, and specialist support staff are excluded, except assistant teachers working in
homeland learning centres and community schools in the Northern Territory.
User cost of capital
124
National Report on Schooling in Australia 2014
In the government budget context, the user cost of capital is usually defined as the
opportunity cost of funds tied up in capital assets used to deliver government services.
Capital charging is the actual procedure used for applying this cost of capital to the asset
management process. As such, it is a means of representing the cost of capital used in the
provision of government budgetary outputs.
VET in Schools
Data on VET in Schools students were derived from the NCVER National VET in Schools
Collection. From 2014, this collection is compiled under the Australian Vocational Education
and Training Management Information Statistical Standard (AVETMISS), release 7.0. The
collection includes activity from 1 January to 31 December of the reference year. The scope
is all activity undertaken as part of a student’s senior secondary certificate that provides
credit towards a nationally recognised VET qualification.
125