national & florida hispanic mobile poll
TRANSCRIPT

National & Florida
Hispanic Mobile Tracker
July 26 - July 31, 2016
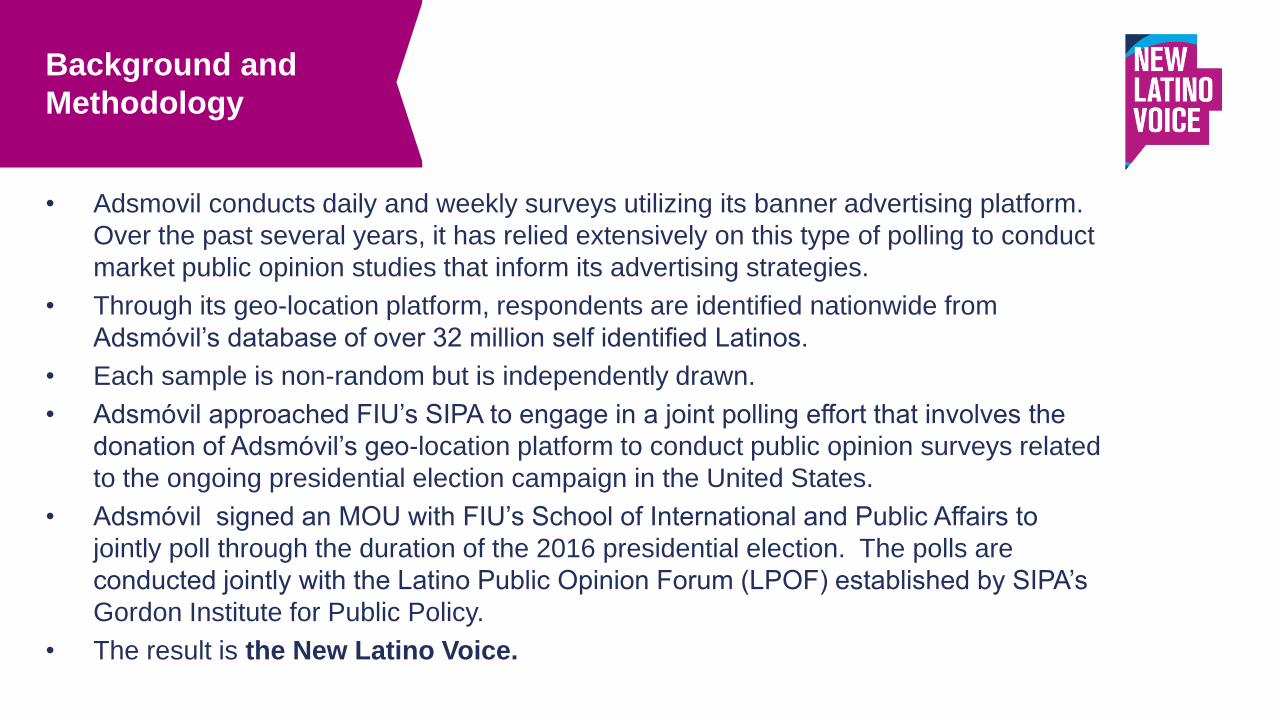
• Adsmovil conducts daily and weekly surveys utilizing its banner advertising platform.
Over the past several years, it has relied extensively on this type of polling to conduct
market public opinion studies that inform its advertising strategies.
• Through its geo-location platform, respondents are identified nationwide from
Adsmóvil’s database of over 32 million self identified Latinos.
• Each sample is non-random but is independently drawn.
• Adsmóvil approached FIU’s SIPA to engage in a joint polling effort that involves the
donation of Adsmóvil’s geo-location platform to conduct public opinion surveys related
to the ongoing presidential election campaign in the United States.
• Adsmóvil signed an MOU with FIU’s School of International and Public Affairs to
jointly poll through the duration of the 2016 presidential election. The polls are
conducted jointly with the Latino Public Opinion Forum (LPOF) established by SIPA’s
Gordon Institute for Public Policy.
• The result is the New Latino Voice.
Background and
Methodology
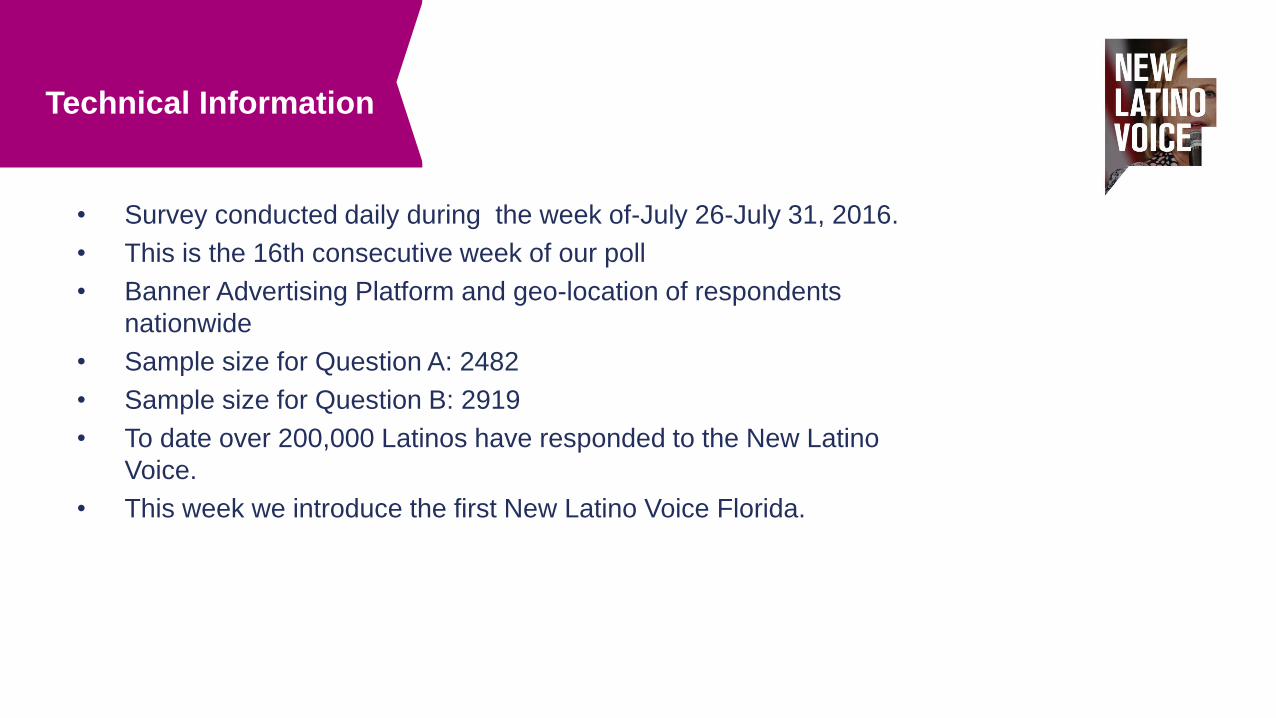
• Survey conducted daily during the week of-July 26-July 31, 2016.
• This is the 16th consecutive week of our poll
• Banner Advertising Platform and geo-location of respondents
nationwide
• Sample size for Question A: 2482
• Sample size for Question B: 2919
• To date over 200,000 Latinos have responded to the New Latino
Voice.
• This week we introduce the first New Latino Voice Florida.
Technical Information
QUESTION ONE
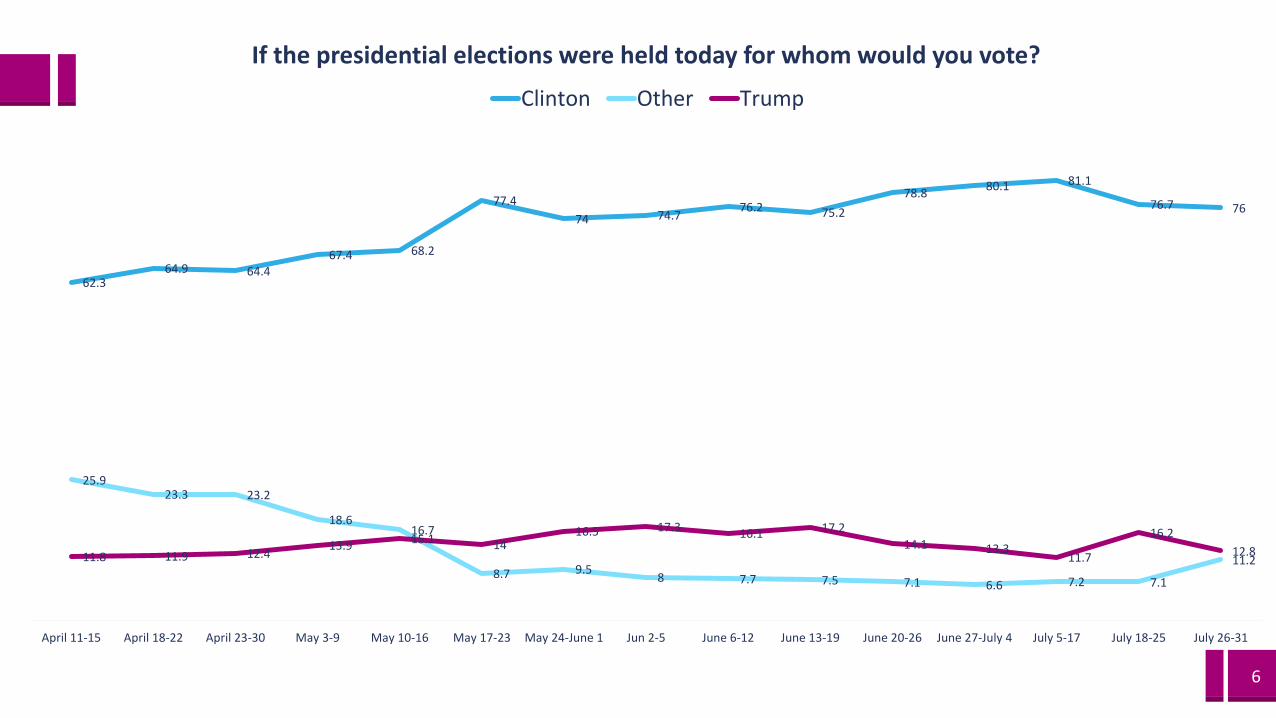
If the elections were held today for whom would you vote?
5
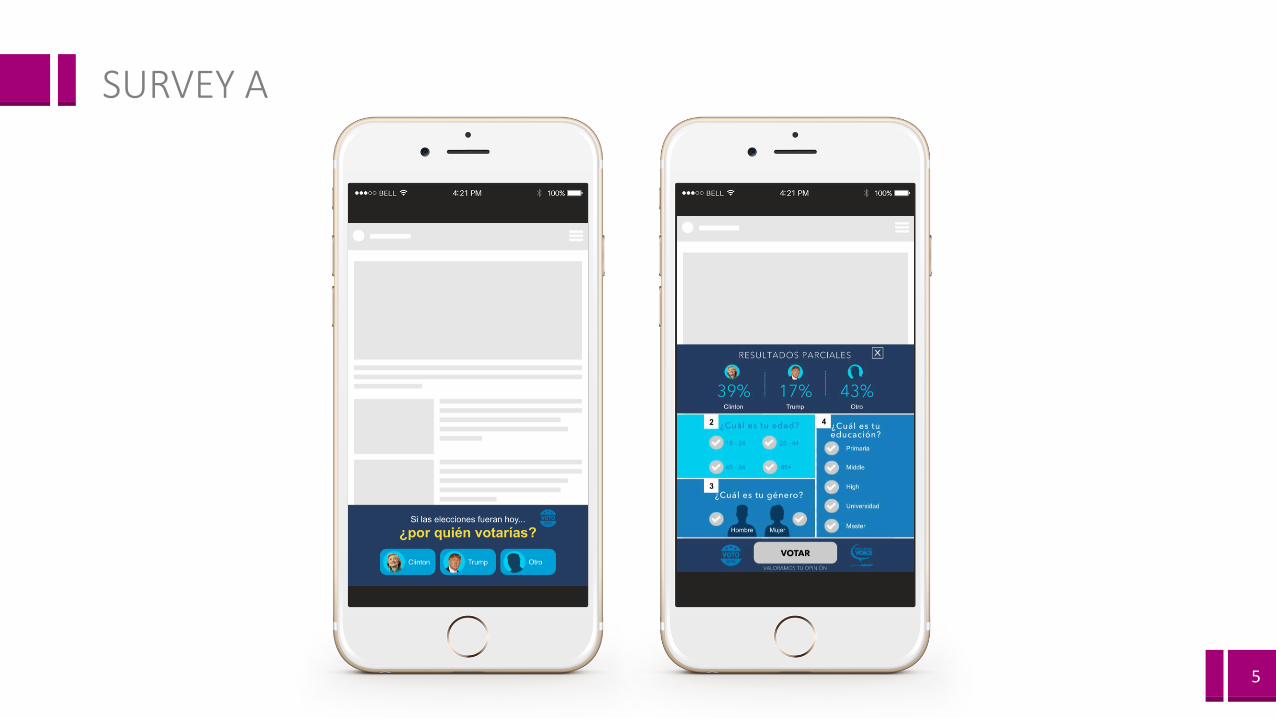
SURVEY A
6
4521
62.364.9 64.4
67.4 68.2
77.4
74 74.776.2 75.2
78.880.1 81.1
76.7 76
25.923.3 23.2
18.616.7
8.7 9.58 7.7 7.5 7.1 6.6 7.2 7.1
11.211.8 11.9 12.413.9 15.1 14
16.5 17.3 16.1 17.2
14.1 13.311.7
16.2
12.8
April 11-15 April 18-22 April 23-30 May 3-9 May 10-16 May 17-23 May 24-June 1 Jun 2-5 June 6-12 June 13-19 June 20-26 June 27-July 4 July 5-17 July 18-25 July 26-31
If the presidential elections were held today for whom would you vote?
Clinton Other Trump
7
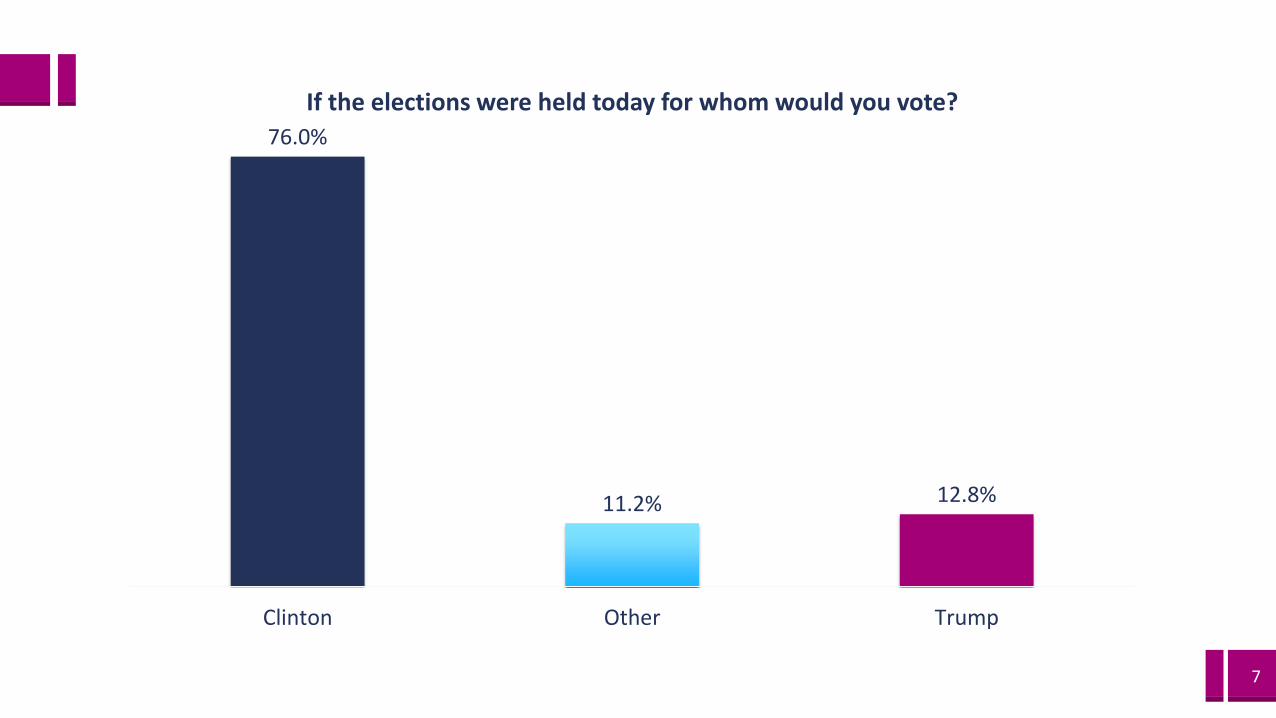
76.0%
11.2% 12.8%
Clinton Other Trump
If the elections were held today for whom would you vote?
8
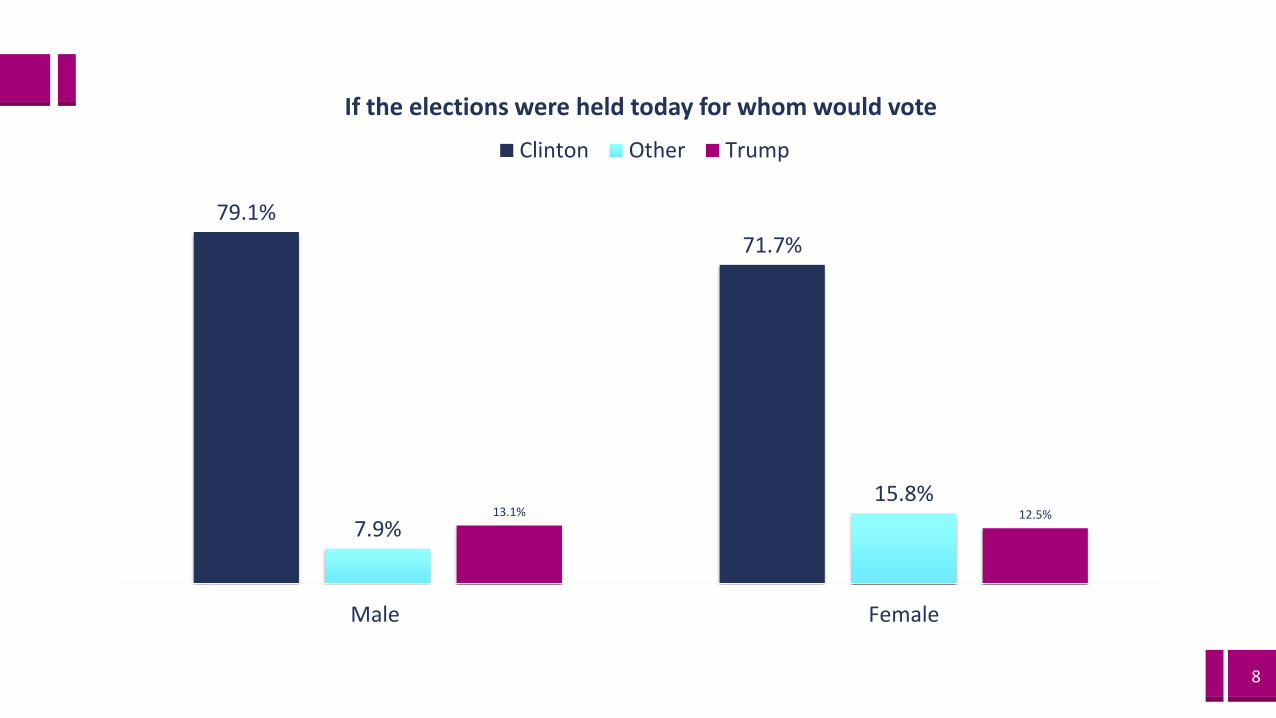
79.1%
71.7%
7.9%
15.8%13.1% 12.5%
Male Female
If the elections were held today for whom would vote
Clinton Other Trump
9
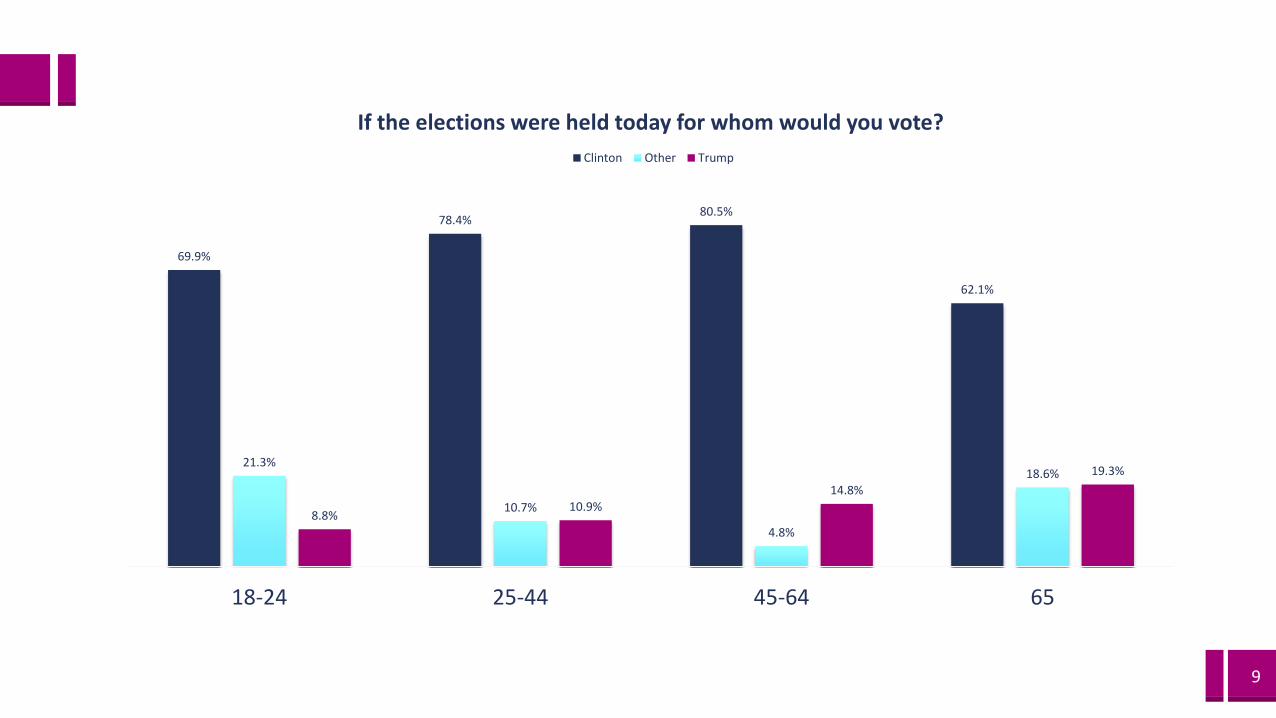
69.9%
78.4%80.5%
62.1%
21.3%
10.7%
4.8%
18.6%
8.8%10.9%
14.8%
19.3%
18-24 25-44 45-64 65
If the elections were held today for whom would you vote?
Clinton Other Trump
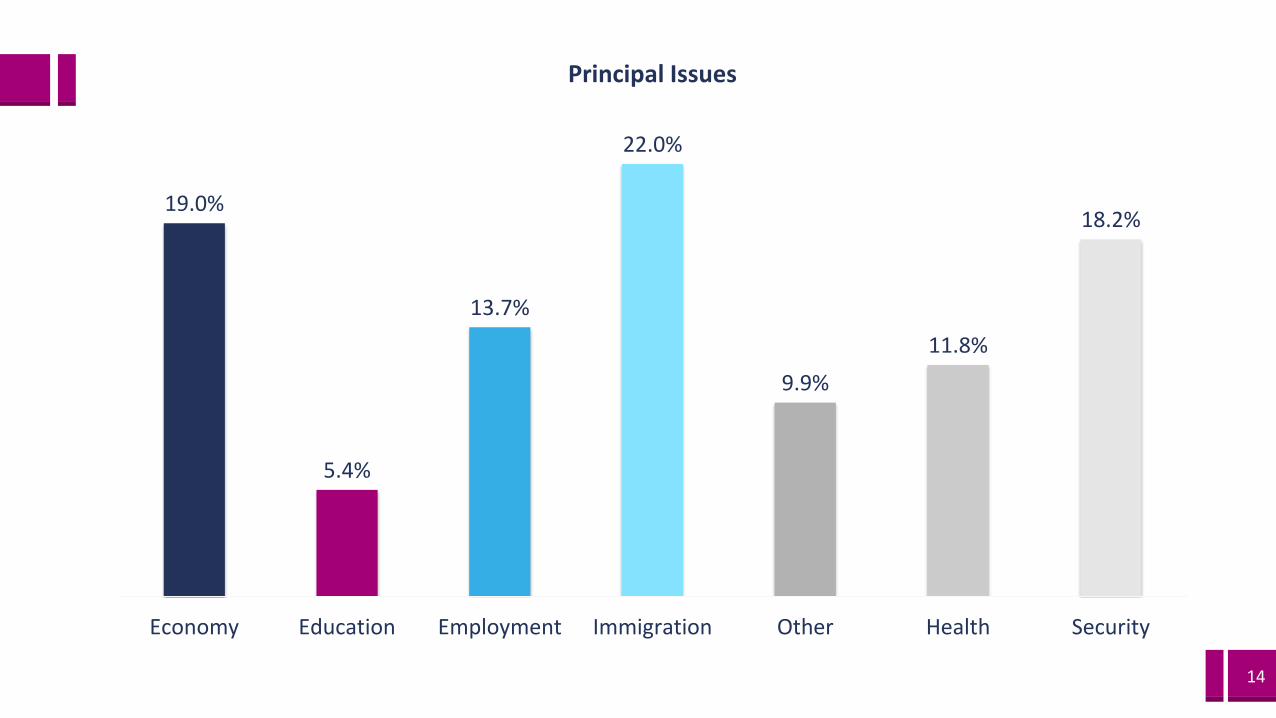
What are the principal issues facing the
USA?
QUESTION TWO
11
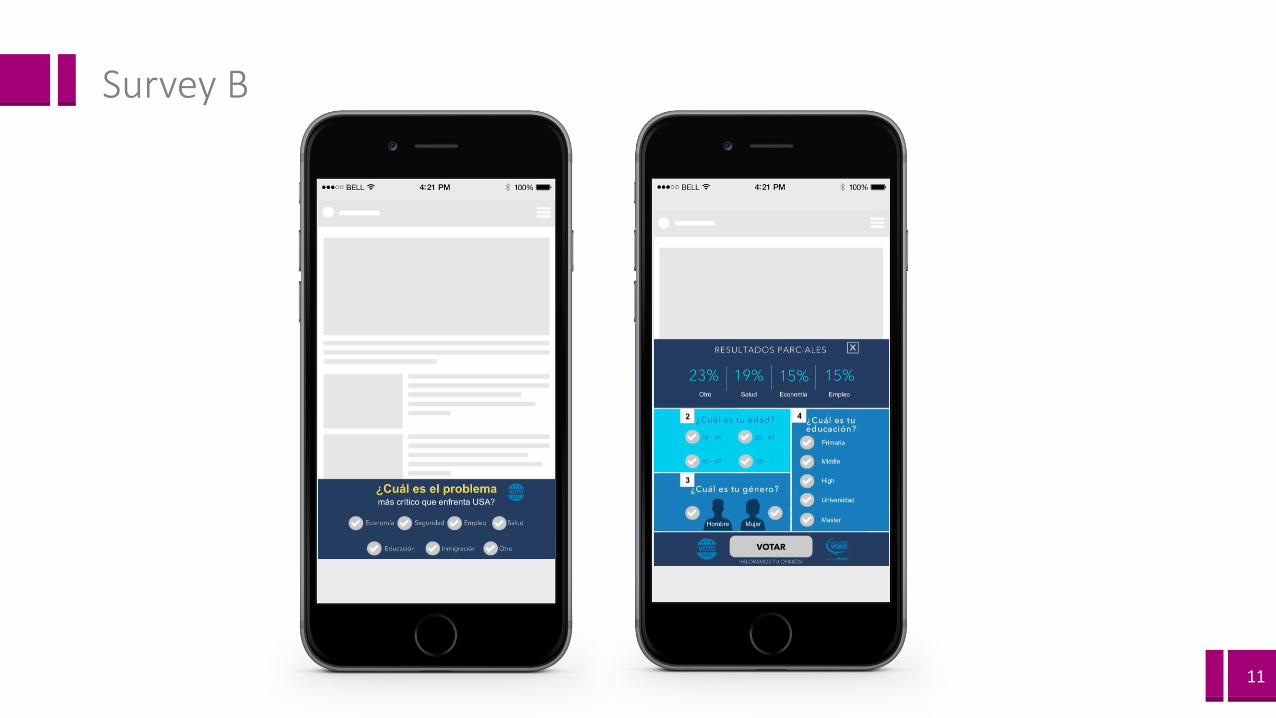
Survey B
12
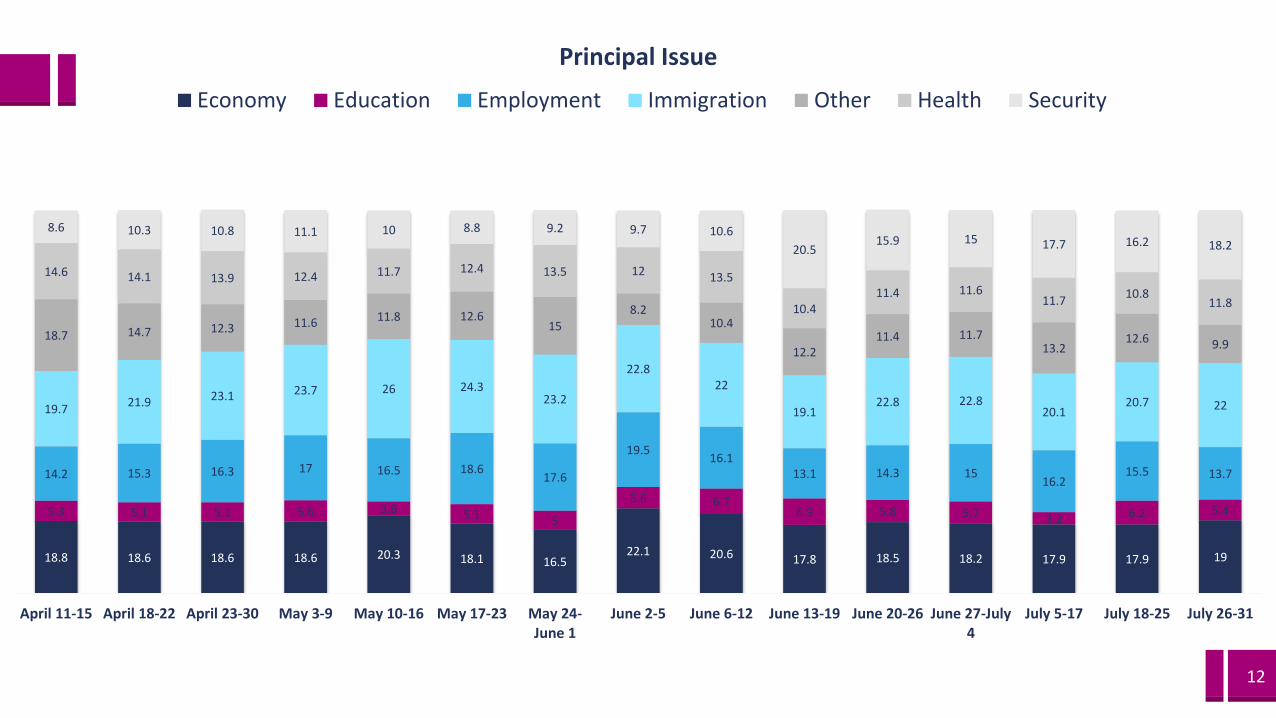
18.8 18.6 18.6 18.6 20.3 18.1 16.522.1 20.6 17.8 18.5 18.2 17.9 17.9 19
5.3 5.1 5.1 5.6 3.6 5.1 5
5.6 6.76.9 5.8 5.7 3.2 6.2 5.4
14.2 15.3 16.3 17 16.5 18.617.6
19.516.1
13.1 14.3 1516.2
15.5 13.7
19.721.9 23.1 23.7 26 24.3
23.2
22.822
19.122.8 22.8
20.120.7 22
18.7 14.7 12.3 11.6 11.8 12.615
8.210.4
12.211.4 11.7
13.212.6 9.9
14.6 14.1 13.9 12.4 11.7 12.4 13.5 12 13.5
10.411.4 11.6
11.710.8
11.8
8.6 10.3 10.8 11.1 10 8.8 9.2 9.7 10.6
20.515.9 15 17.7 16.2 18.2
April 11-15 April 18-22 April 23-30 May 3-9 May 10-16 May 17-23 May 24-June 1
June 2-5 June 6-12 June 13-19 June 20-26 June 27-July4
July 5-17 July 18-25 July 26-31
Principal Issue
Economy Education Employment Immigration Other Health Security
13
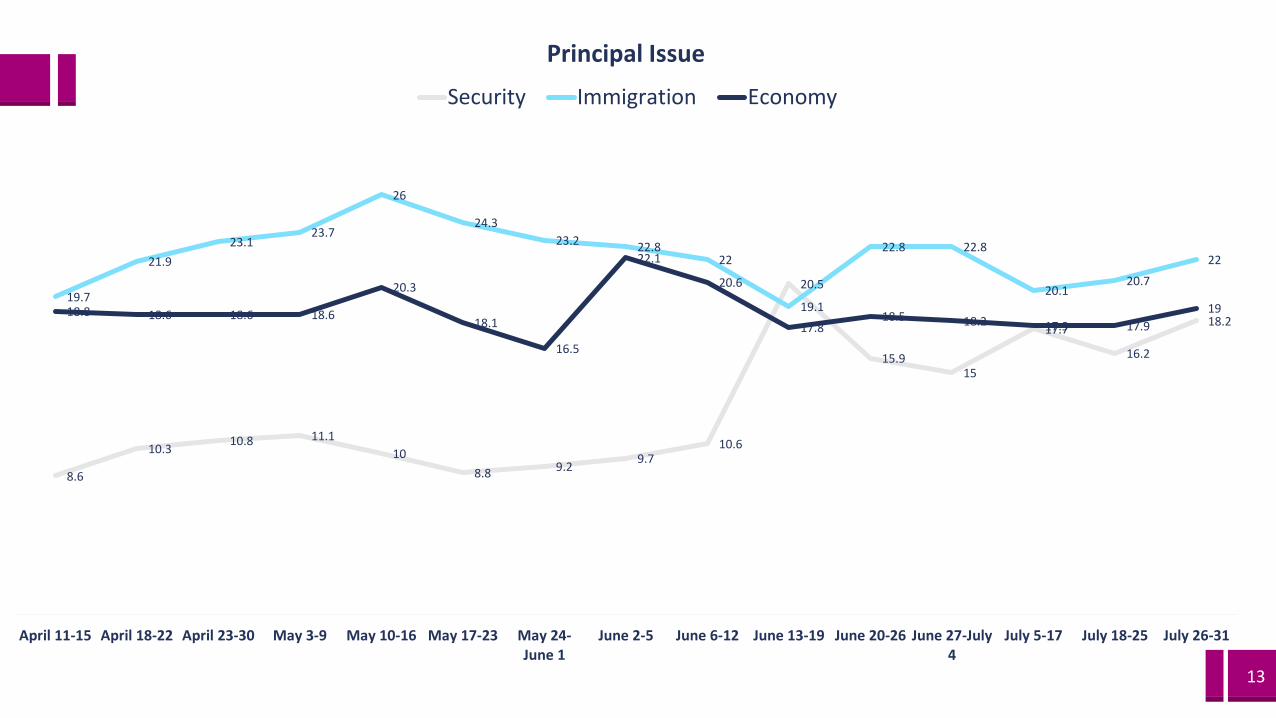
8.6
10.310.8 11.1
10
8.8 9.29.7
10.6
20.5
15.915
17.7
16.2
18.2
19.7
21.9
23.123.7
26
24.3
23.2 22.822
19.1
22.8 22.8
20.120.7
22
18.8 18.6 18.6 18.6
20.3
18.1
16.5
22.1
20.6
17.818.5 18.2 17.9 17.9
19
April 11-15 April 18-22 April 23-30 May 3-9 May 10-16 May 17-23 May 24-June 1
June 2-5 June 6-12 June 13-19 June 20-26 June 27-July4
July 5-17 July 18-25 July 26-31
Principal Issue
Security Immigration Economy
14
19.0%
5.4%
13.7%
22.0%
9.9%
11.8%
18.2%
Economy Education Employment Immigration Other Health Security
Principal Issues
15
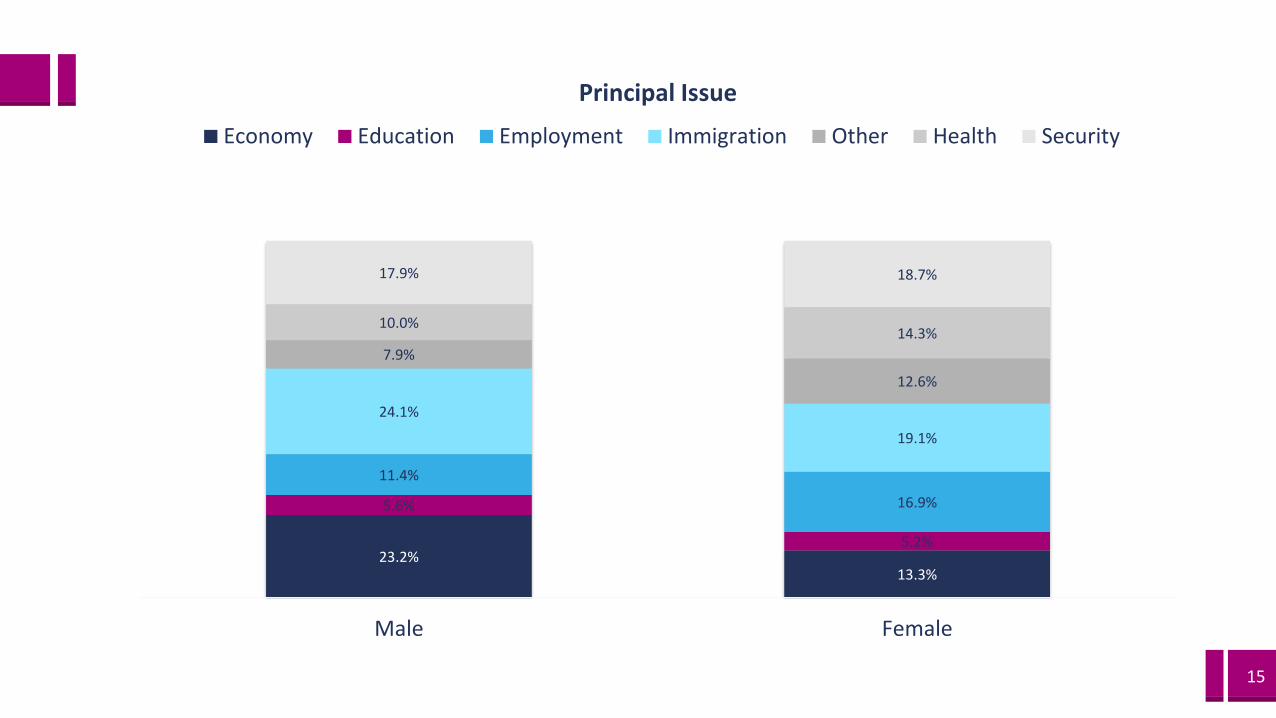
23.2%13.3%
5.6%
5.2%
11.4%
16.9%
24.1%
19.1%
7.9%
12.6%
10.0%14.3%
17.9% 18.7%
Male Female
Principal Issue
Economy Education Employment Immigration Other Health Security
16
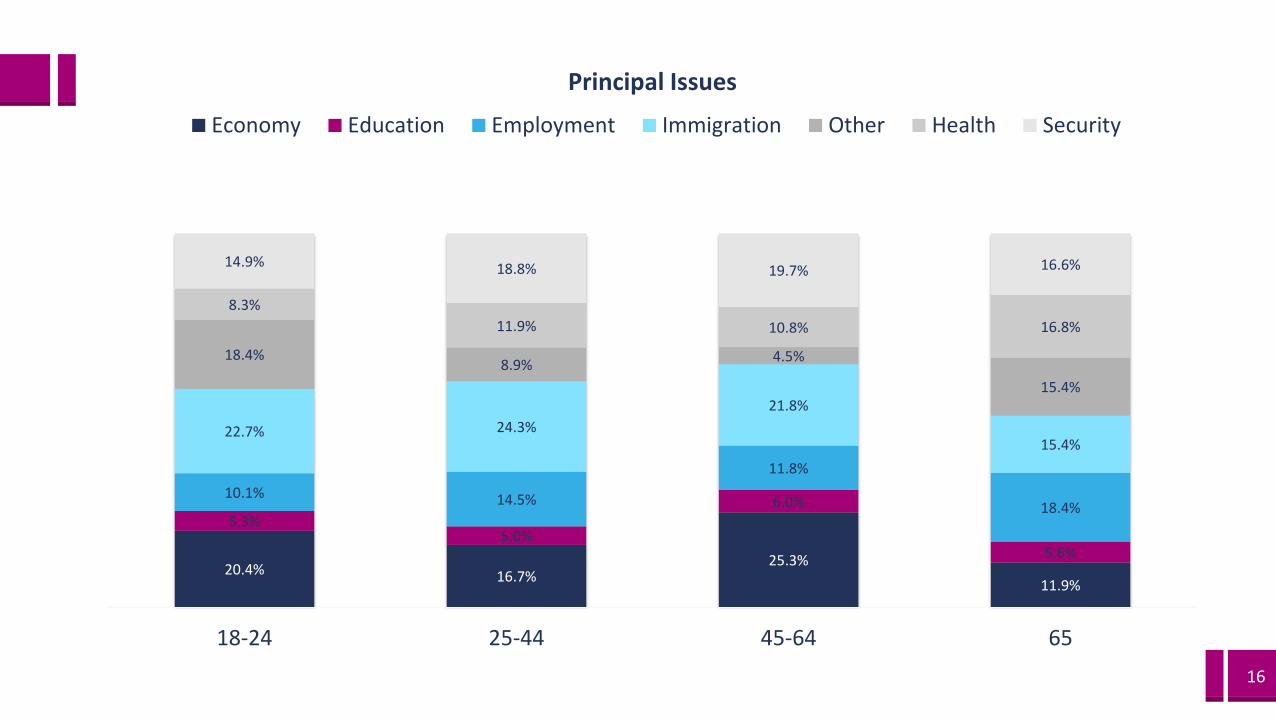
20.4% 16.7%25.3%
11.9%
5.3%5.0%
6.0%
5.6%
10.1% 14.5%
11.8%
18.4%
22.7% 24.3%
21.8%
15.4%
18.4%8.9%
4.5%
15.4%
8.3%
11.9% 10.8% 16.8%
14.9% 18.8% 19.7% 16.6%
18-24 25-44 45-64 65
Principal Issues
Economy Education Employment Immigration Other Health Security
17
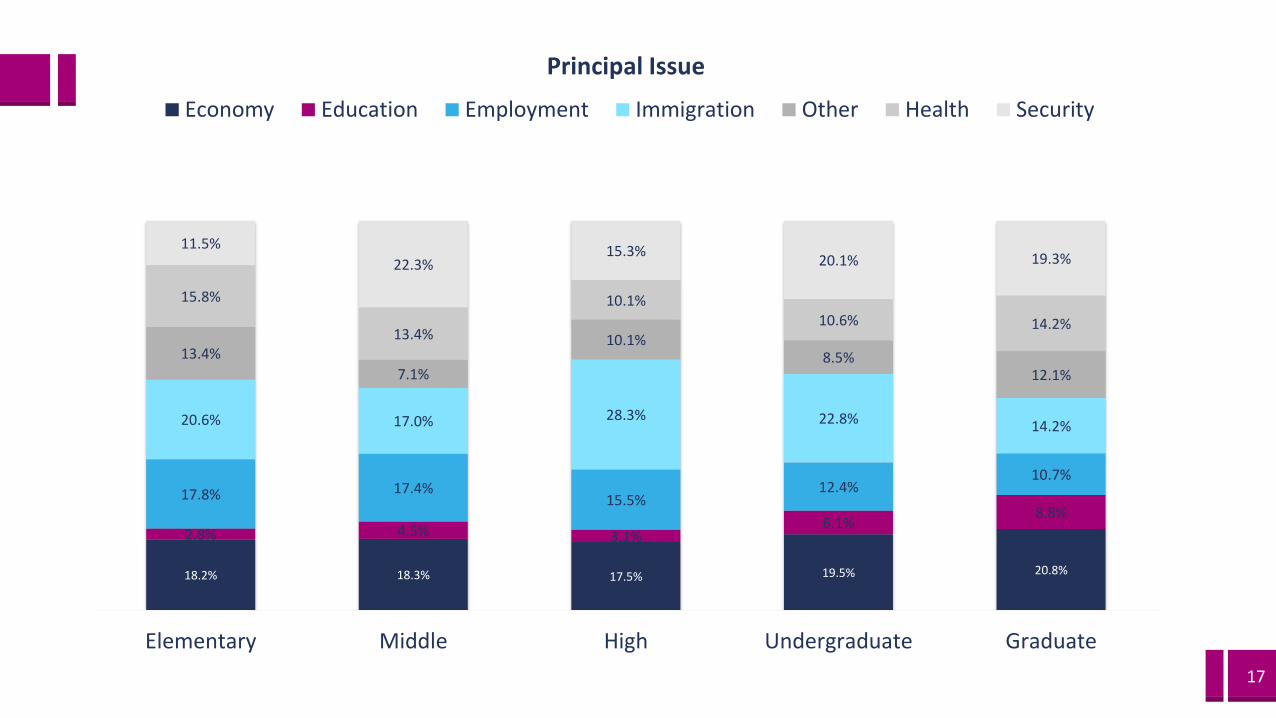
18.2% 18.3% 17.5% 19.5% 20.8%
2.8% 4.5% 3.1%6.1%
8.8%17.8% 17.4%
15.5%12.4%
10.7%
20.6% 17.0% 28.3% 22.8% 14.2%
13.4%
7.1%
10.1%8.5%
12.1%
15.8%
13.4%
10.1%10.6% 14.2%
11.5%
22.3%15.3%
20.1% 19.3%
Elementary Middle High Undergraduate Graduate
Principal Issue
Economy Education Employment Immigration Other Health Security
Florida
Week of July 26-31, 2016
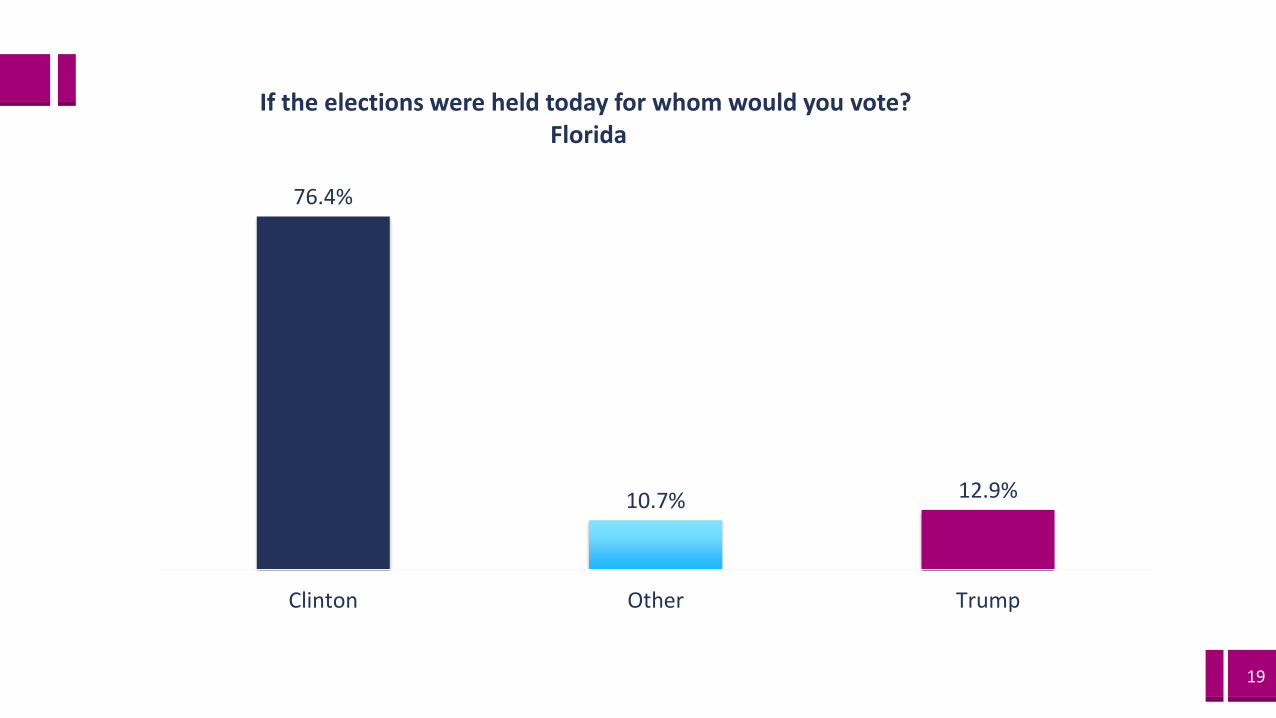
19
76.4%
10.7% 12.9%
Clinton Other Trump
If the elections were held today for whom would you vote? Florida
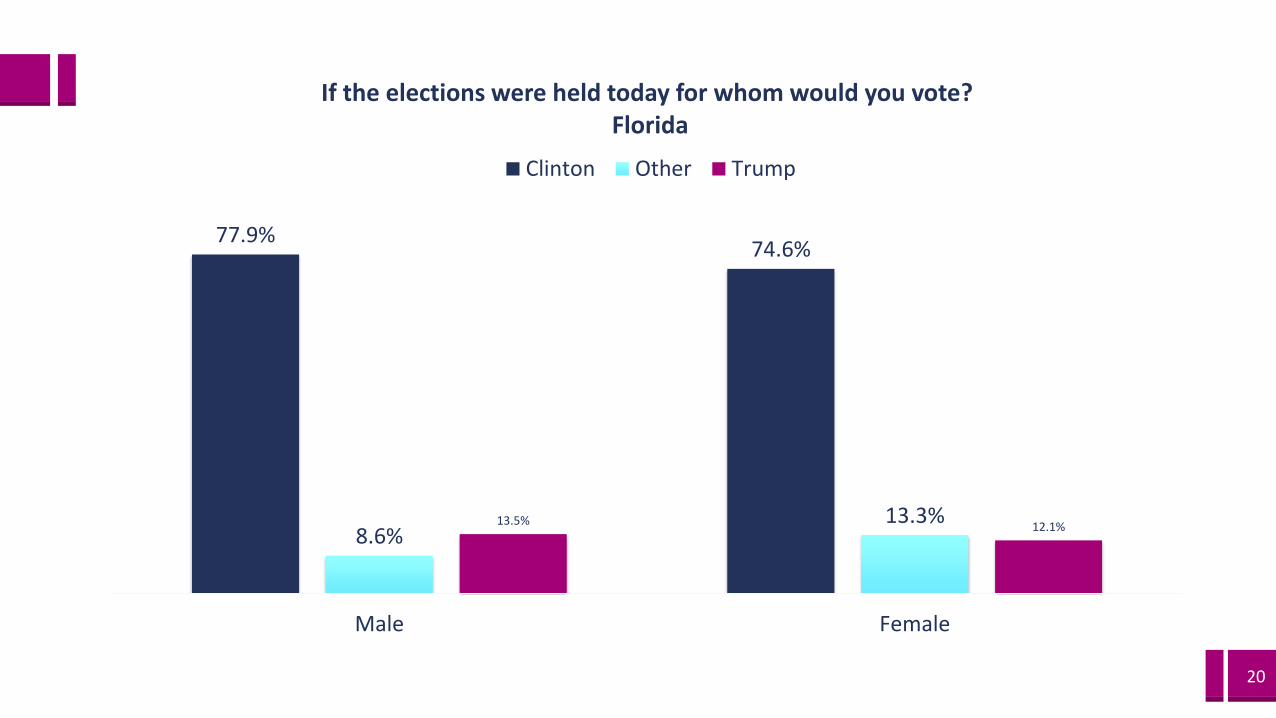
20
77.9%74.6%
8.6%13.3%13.5% 12.1%
Male Female
If the elections were held today for whom would you vote?Florida
Clinton Other Trump
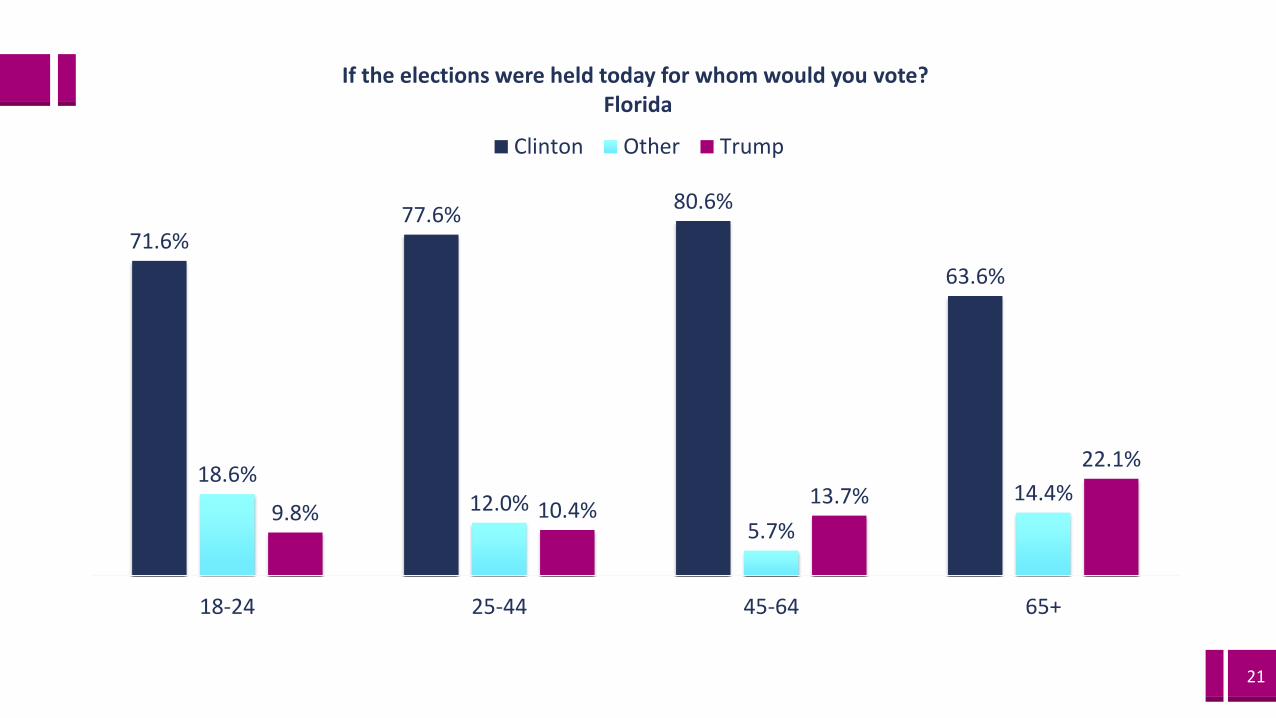
21
71.6%77.6%
80.6%
63.6%
18.6%12.0%
5.7%
14.4%9.8% 10.4%
13.7%
22.1%
18-24 25-44 45-64 65+
If the elections were held today for whom would you vote?Florida
Clinton Other Trump
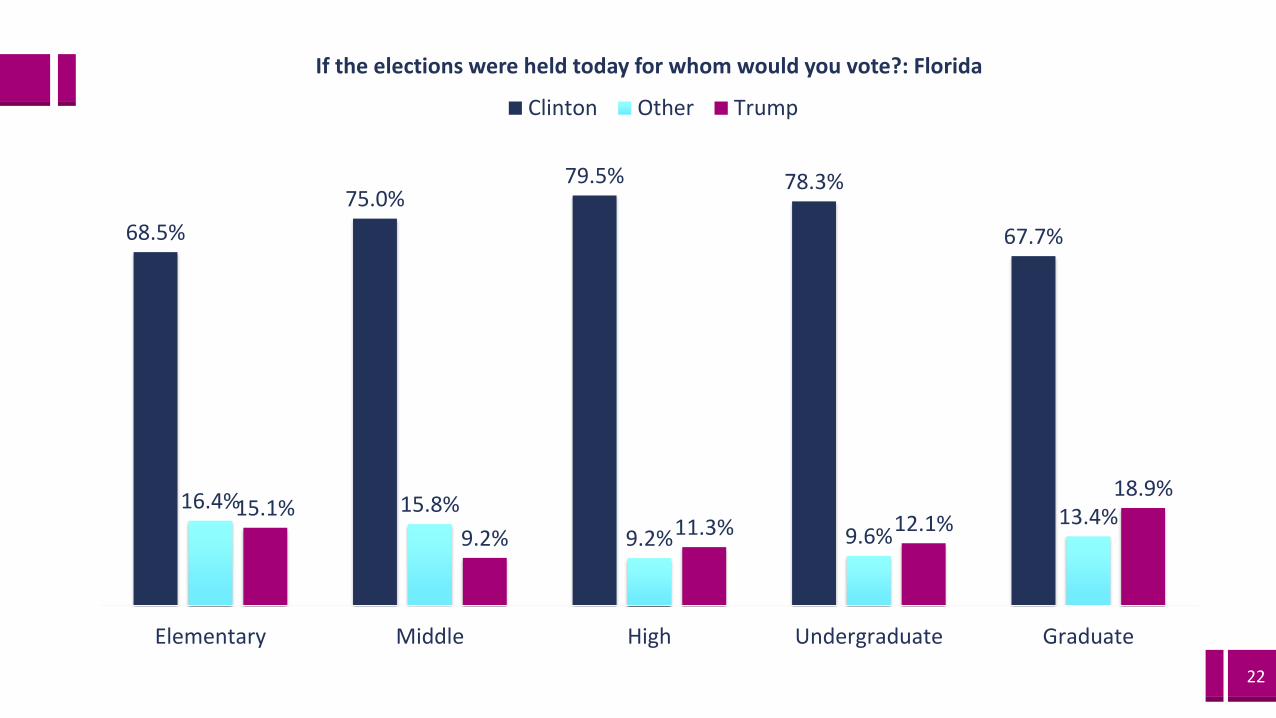
22
68.5%
75.0%79.5% 78.3%
67.7%
16.4% 15.8%
9.2% 9.6%13.4%15.1%
9.2% 11.3% 12.1%
18.9%
Elementary Middle High Undergraduate Graduate
If the elections were held today for whom would you vote?: Florida
Clinton Other Trump

23

24

25

adsmovil.com [email protected] @adsmovil