national cooperative highway research...
TRANSCRIPT

322
HIGHWAY RESEARCH PROGRAM REPORT 322 NATIONAL COOPERATIVE
DESIGN OF PRECAST PRESTRESSED BRIDGE GIRDERS MADE CONTINUOUS
IN ~~ ~~ ui ~,o M DEC 14.1989
MPT. LP•
TRANSPORTATION RESEARCH BOARD NATIONAL RESEARCH COUNCIL

TRANSPORTATION RESEARCH BOARD EXECUTIVE COMMITTEE 1989
Officers
Chairman
LOUIS J. GAMBACCINI, General Manager, Southeastern Pennsylvania Transportation Authority
Vice Chairman
WAYNE MURI, Chief Engineer, Missouri Highway & Transportation Department
Secretary
THOMAS B. DEEN, Executive Director, Transportation Research Board
Members
ADMIRAL JAMES B. BUSEY IV, Federal Aviation Administrator, US. Department of Transportation (ex officio)
GILBERT E. CARMICHAEL, Federal Railroad Administrator, US Department of Transportation, (ex officio)
BRIAN W. CLYMER, Urban Mass Transportation Administrator, U.S. Department of Transportation (ex officio)
JERRY R. CURRY, National Highway Traffic Safety Administrator, U.S. Department of Transportation (ex officio)
FRANCIS B. FRANCOIS, Executive Director, American Association of State Highway and Transportation Officials (ex officio)
JOHN GRAY, President, National Asphalt Pavement Association (ex officio)
THOMAS H. HANNA, President and Chief Executive Officer, Motor Vehicle Manufacturers Association of the United States, Inc. (ex officio)
LT. GENERAL HENRY J. HATCH, Chief of Engineers and Commander, US. Army Corps of Engineers (ex officio)
THOMAS D. LARSON, Federal Highway Administrator, US. Department of Transportation (ex officio)
GEORGE H. WAY, JR., Vice President for Research and Test Departments. Association of American Railroads (ex officio)
ROBERT J. AARONSON, President, Air Transport Association of America
ROBERT N. BOTHMAN, Director, Oregon Department of Transportation
J. RON BRINSON, President and Chief Executive Officer, Board of Commissioners of The Port of New Orleans
L. GARY BYRD, Consultant Engineer, Alexandria Virginia
JOHN A. CLEMENTS, Vice President, Parsons Brinckerhoff Quade and Douglas, Inc. (Past Chairman, 1985)
L. STANLEY CRANE, Retired, Former Chairman and Chief Executive Officer, Consolidated Rail Corporation, Philadelphia
RANDY DOl, Director, JVHS Systems, Motorola Incorporated
EARL DOVE, Chairman of the Board, AAA Cooper Transportation
WILLIAM J. HARRIS, E. B. Snead Professor of Transportation & Distinguished Professor of Civil Engineering, Associate Director of Texas Transportation Institute
LOWELL B. JACKSON, Vice President for Transportation, Greenhorne & O'Mara, Inc.
DENMAN K. McNEAR, Vice Chairman, Rio Grande Industries
LENO MENGHINI, Superintendent and Chief Engineer, Wyoming Highway Department
WILLIAM W. MILLAR, Executive Director, Port Authority of Allegheny County
ROBERT E. PAASWELL, Professor, Urban Transportation Center, University of Illinois
RAY D. PETHTEL, Commissioner, Virginia Department of Transportation
JAMES P. PITZ, Director, Michigan Department of Transportation
HERBERT H. RICHARDSON, Deputy Chancellor and Dean of Engineering, Texas A&M University System (Past Chairman, 1988)
JOE G. RIDEOUTTE, Executive Director, South Carolina Department of Highways and Public Transportation
TED TEDESCO, Vice President, Corporate Affairs, American Airlines, Inc., Dallas/Fort Worth Airport
CARMEN E. TURNER, General Manager, Washington Metropolitan Area Transit Authority
C. MICHAEL WALTON, Bess Harris Jones Centennial Professor and Chairman, College of Engineering, The University of Texas
FRANKLIN E. WHITE, Commissioner, New York State Department of Transportation
.IULIAN WOLPERT, Henry G. Bryant Professor of Geography, Public Affairs and Urban Planning, Woodrow Wilson School of Public and International Affairs, Princeton
University
PAUL ZIA, Distinguished University Professor, Department of Civil Engineering, North Carolina State University
NATIONAL COOPERATIVE HIGHWAY RESEARCH PROGRAM Transportation Research Board Executive Committee Subcommittee for NCHRP
LOUIS J. GAMBACCINI, Southeastern Pennsylvania Transportation Authority THOMAS D. LARSON, U.S. Department of Transportation
(Chairman) L. GARY BYRD, Consulting Engineer
WAYNE MURI, Missouri Highway & Transportation Department THOMAS B. DEEN, Transportation Research Board
FRANCIS B. FRANCOIS, American Association of State Highway and Trans-
portation Officials
Field of Design
Area of Bridges
Project Panel C12-29
GEORGE A. HOOD, JR., Consultant (Chairman)
ALEX AS WAD, Pennsylvania State University
GEORGE A. CHRISTIAN, New York State Department of Transportation
RICHARD D. ELLIOTT, Kansas Department of Transportation
Program Staff
ROBERT J. REILLY, Director, Cooperative Research Programs
LOUIS M. MACGREGOR, Program Officer
DANIEL W. DEARASAUGH, JR., Senior Program Officer
IAN M. FRIEDLAND, Senior Program Officer
ALEX C. SCORDELIS, University of California
BENNIE D. VERELL, Mississippi State Highway Department
ROBERT NICKERSON, FHWA Liaison Representative
GEORGE W. RING III, TRB Liaison Representative
CRAWFORD F. JENCKS, Senior Program Officer
FRANK N. LISLE, Senior Program Officer
DAN A. ROSEN, Senior Program Officer
HELEN MACK, Editor

NATIONAL COOPERATIVE HIGHWAY RESEARCH PROGRAM 322 REPORT
DESIGN OF PRECAST PRESTRESSED BRIDGE GIRDERS
MADE CONTINUOUS
R. G. OESTERLE, J. D. GLIKIN and S. C. LARSON Construction Technology Laboratories, Inc..
Skokie, Illinois
RESEARCH SPONSORED BY THE AMERICAN ASSOCIATION OF STATE HIGHWAY AND TRANSPORTATION OFFICIALS IN COOPERATION WITH THE FEDERAL HIGHWAY ADMINISTRATION
AREAS OF INTEREST
Structures Design and Performance
Construction (Highway Transportation, Public Transit)
TRANSPORTATION RESEARCH BOARD NATIONAL RESEARCH COUNCIL WASHINGTON, D.C. NOVEMBER 1989

NATIONAL COOPERATIVE HIGHWAY RESEARCH PROGRAM
Systematic, well-designed research provides the most ffec-tive approach to the solution of many problems facing high-way administrators and engineers. Often, highway problems are of local interest and can best be studied by highway de-partments individually or in cooperation with their state universities and others. However, the accelerating growth of highway transportation develops increasingly complex problems of wide interest to highway authorities. These problems are best studied through a coordinated program of cooperative research.
In recognition of these needs, the highway administrators of the American Association of State Highway and Transpor-tation Officials initiated in 1962 an objective national high-way research program employing modern scientific tech-niques. This program is supported on a continuing basis by funds from participating member states of the Association and it receives the full cooperation and support of the Fed-eral Highway Administration, United States Department of Transportation.
The Transportation Research Board of the National Re-search Council was requested by the Association to admin-ister the research program because of the Board's recognized objectivity and understanding of modern research practices. The Board is uniquely suited for this purpose as: it maintains an extensive committee structure from which authorities on any highway transportation subject may be drawn; it possesses avenues of communications and cooper-ation with federal, state, and 4cal governmental agencies, universities, and industry; its relationship to the National Research Council is an insurance of objectivity; it maintains a full-time research correlation staff of specialists in high-way transportation matters to bring the findings of research directly to those who are, in a position to use them.
The program is developed on the basis of research needs identified by chief administrators of the highway and trans-portation departments and by committees of AASHTO. Each year, specific areas of research needs to be included in the program are proposed to the National Research Council and the Board by the American Association of State High-way and Transportation Officials. Research projects to fulfill these needs are defined by the Board, and qualified research agencies are selected from those that have submitted pro-posals. Administration and surveillance of research contracts are the responsibilities of the National Research Council and the Transportation Research Board.
The needs for highway research are many, and the National Cooperative Highway Research Program can make signifi-cant contributions to the solution of highway transportation problems of mutual concern to many responsible groups. The program, however, is intended to complement rather than to substitute for or duplicate other highway research programs.
NCHRP REPORT 322
Project 12-29 FY '85
ISSN 0077-5614
ISBN 0-309-04619-X
L. C. Catalog Card No. 89-5 1238
PrIce $11.00
NOTICE The project that is the subject of this report was a part of the National Co-operative Highway Research Program conducted by the Transportation Re-search Board with the approval of the Governing Board of the National Research Council. Such approval reflects the Governing Board's judgment that the program concerned is of national importance and appropriate with respect to both the purpoaes and resources of the National Research Council.
The members of the technical committee selected to monitor this project and to review this report were chosen for recognized acholarly competence and with due consideration for the balance of disciplines appropriate to the proj-ect. The opinions and conclusions expressed or implied are those of the re-search agency that performed the research, and, while they have been accepted as appropriate by the technical committee, they are not necessarily those of the Transportation Research Board, the National Research Council, the American Association of State Highway and Transportation officials, or the Federal Highway Administration, U.S. Department of Transportation.
Each report is reviewed and accepted for publication by the technical com-mittee according to procedures established and monitored by the Transpor-tation Research Board Executive Committee and the Governing Board of the National Research Council.
SpecIal Notice, The Transportation Research Board, the National Research Council, the Fed-eral Highway Administration, the American Association of State Highway and Transportation Officials, and the individual states participating in the National Cooperative Highway Research Program do not endorse products or manufacturers. Trade or manufacturers' names appear herein solely because they are considered essential to the object of this report.
Published reports of the
NATIONAL COOPERATIVE HIGHWAY RESEARCH PROGRAM
are available from:
Transportation Research Board National Research Council 2101 Constitution Avenue, N.W. Washington, D.C. 20418
Printed in the United Slates of America

FOREWORD This report contains the findings of a study that was performed to develop procedures for the computation of design moments in precast prestressed bridge girders
By Staff made continuous through connections in cast-in-place slabs and diaphragms at bridge Transportation piers. Based on these procedures, recommended specification provisions have been
Research Board developed that can ensure more rational design and economical construction for simple-span precast prestressed bridge girders made continuous. The recommended procedures and specifications are based on a comprehensive experimental and ana-lytical research program. The contents of this report will be of immediate interest and use to bridge engineers, researchers, specification writing bodies, and others concerned with the design and performance of precast prestressed bridge girders made continuous.
The design and construction of bridges composed of simple-span, pretensioned girders made continuous for composite dead loads and for live loads has become widespread. In general, the design of these structures has been based on the procedures outlined in "Design of Continuous Highway Bridges with Precast, Prestressed Con-crete Girders," which was published by the Portland Cement Association (PCA) in 1969. Although existing bridges designed by these procedures are generally performing well, it is believed that this method may not accurately predict the true behavior of these structures in light of new knowledge regarding material properties and behavior, new methods of analysis, and expansion of this concept to longer spans and wider girder spacings.
One of the major uncertainties in the design of these structures is the prediction of the elastic, inelastic, time-dependent, and ultimate positive and negative moments at the cast-in-place connections at bridge piers. This uncertainty is caused by a number of different loading and construction stages, time-dependent effects, and the details used to 'make connections. Because of these uncertainties and the lack of guidance in the AASHTO Standard Specifications for Highway Bridges, widespread differences exist in applying the results of the PCA procedure for selecting the continuity moments used for the connection design at the piers.
NCHRP Project 12-29, "Design of Simple-Span Precast Prestressed Bridge Gir-ders Made Continuous," was initiated with the objective of resolving the uncertainties in the prediction of positive and negative moments for the design of the connections in precast prestressed bridge girders made continuous. The research included exper-imental investigations of concrete creep and shrinkage, and analytical investigations of typical bridge designs accounting for the time-dependent nature of the materials

and loading stages. The work was performed by Construction Technology Labora-tories, Inc., in Skokie, Illinois.
This report summarizes the findings from that study. The report contains rec-ommended procedures for determining the positive and negative moments at the cast-in-place connections, recommended specification provisions for incorporation into the AASHTO Standard Specifications for Highway Bridges, and a description of a sim-plified computer program that will calculate the design moments. The recommended specification provisions may be considered for adoption by AASHTO in 1990.
The report notes that time-dependent effects and various construction timing sequences must be considered for service-moment design. Continuity will result in a reduction of midspan positive design moments for the prestressed girder. Recom-mended combinations of girder age at time of deck and diaphragm casting, and age at application of live load for analyses to determine maximum service moment, are also contained in the report. The report also notes that there is no structural advantage in providing positive moment reinforcement at the supports, and it can therefore be omitted, leading to economies in construction. The improved analysis and design procedures developed in this study will provide a more rational design and simplify construction of this type of bridge.
Two computer programs that will calculate service moments were developed during the study. The programs, which are fully described and documented in Ap-pendix E, will operate on an IBM PC or compatible computer. The programs are not included in this report, nor are they available from the Transportation Research Board. They can be obtained from the McTrans Software Center. Interested parties should contact McTrans and ask for computer programs BRIDGERM and BRID-GELL. McTrans can be. reached at: The Center for Microcomputers in Transportation, University of Florida, 512 Weil Hall, Gainesville, Florida 32611(904/392-0378).

2
5
35
39
41
43
43
43
43
44
75
92
CONTENTS
SUMMARY
CHAPTER ONE Introduction and Research Approach Problem Statement and Research Objectives, 2 Scope of Study, 3 Research Approach, 3 Notation, 4
CHAPTER TWO Findings Summary of Literature Review, 5 Results of Questionnaire, 7 Creep and Shrinkage TeSts, 9 Verification of Analytical Procedures, 10 Service Moments, 15 Flexural Strength, 24 Analysis Procedures, 29 Summary of Findings, 34
CHAPTER THREE Interpretation, Appraisal, Applications Design for Service Moments, 35 Strength Design, 38 Construction Sequence, 39 Proposed AASHTO Specifications, 39
CHAPTER FOUR Conclusions and Suggested Research Conclusions, 39 Suggested Research, 40
REFERENCES
APPENDIX A Summary of Responses to Questionnaire
APPENDIX B Results of Creep and Shrinkage Study
APPENDIX C Methods of Analyses
APPENDIX D Results of Parametric Study
APPENDIX E Program Documentation and User's Instructions
APPENDIX F Design Examples
APPENDIX 0 Proposed AASHTO Provisions

ACKNOWLEDGMENTS
The research reported herein was performed under NCHRP Project 12-29 by Construction Technology Laboratories (CTL), Skokie, Illinois. Ralph G. Oesterle, Manager, Structural Analytical Section, served as Principal Investigator. He was assisted by Joseph D. Glikin, Senior Engineer, and Steven C. Larson, Engineer, Structural Analytical Section. Timothy R. Overman, Engineer, Structural Development Section, as-sisted in implementation of the computer programs. Basile G. Rabbat,
Manager, Structural Codes, Portland Cement Association, served as a consultant to CTL.
A special acknowledgment is made to the four precast concrete man-ufacturers who stipplied concrete cylinders for the creep and shrinkage tests. Also sincere appreciation is expressed to the respondents of the questionnaire for their time and efforts.

DESIGN OF PRECAST PRESTRESSED BRIDGE GIRDERS MADE
CONTI NUOUS
SUMMARY This study was carried out to resolve uncertainties associated with behavior and design provisions for bridges constructed with precast prestressed girders and a con-tinuous deck. The girders behave as simple-spans for dead load. However, with the continuous deck providing a negative moment connection at support piers, the bridge girders may behave as a continuous structure for loads applied after casting the deck and diaphragms. The degree of continuity depends on time-dependent material be-havior. Current criteria for design in the AASHTO Standard Specflcations for High-way Bridges is vague. The appropriateness of design methods currently in use are uncertain because of the complexity of time-dependent behavior and construction sequences. Common practice includes design provisions for a positive moment con-nection in the diaphragms. Construction of the positive moment connection is generally cumbersome, time consuming, and costly.
The first task of NCHRP Project 12-29 was a compilation of current knowledge. A literature review was conducted and a questionnaire was distributed to state de-partments of transportation, bridge designers, and precasters. Also, creep and shrink-age tests were performed to provide data on steam-cured concrete loaded at an early age. From this information, analytical techniques capable of simulation of the complex behavior were determined. Also, potential variations in design parameters were selected in order to study the expected range of behavior for this type of bridge.
A series of computer simulations was carried out to study the effects of variation in time-dependent material behavior and variation in bridge design parameters on the resultant service moments in the bridge girders. Results indicated that the positive moment connection in the diaphragms does not provide any structural advantage and is not required. Also, results show that effective continuity can vary from 0 to 100 percent with variation in time-dependent effects. Also, construction timing has a major influence on resulting effective continuity. Maximum potential continuity occurs with a combination of the deck and diaphragms cast on relatively older girders, and relatively early application of live load. This combination, however, also produces the highest potential for transverse cracking in the deck over the supports. Cracking reduces the stiffness of the negative moment connection and limits the effective reliable continuity moment to a value equal to 125 percent of the negative cracking moment.
Maximum potential for loss of continuity occurs with a combination of deck and diaphragms cast on relatively young girders, and late age application of live load. Variations in construction sequencing of casting the deck before the diaphragms, or casting the diaphragms before the deck, have only minor influence on resulting service moments.
A series of computer simulations was carried out to study the influence of the amount of deck reinforcement and the girder cross-sectional shape on the potential for premature crushing of the bottom flange of the girders near the supports. Results indicate that limiting the negative moment reinforcement ratio, p, to a value less than

or equal to 0.5 Pb will ensure ductile behavior and attainment of maximum girder
strength. The balanced reinforcement ratio, Pb' must be calculated considering the
depth-to-neutral axis and bottom flange geometry as described in this report.
Time-dependent effects and various construction timing sequences must be con-
sidered for service moment design. Continuity will result in a reduction of midspan
positive design moments for the prestressed girder. Recommended combinations of
girder age at time of deck and diaphragm casting, and age at application of live load
for analyses to determine service moments, are contained in this report. Computer
programs developed in this project and capable of running on IBM PC and compatible
computers are available to calculate the service moments. Proposed revisions to the
AASHTO Specifications along with a Commentary to define design requirements for
this type of bridge are also included in this report.
CHAPTER ONE
INTRODUCTION AND RESEARCH APPROACH
PROBLEM STATEMENT AND RESEARCH OBJECTIVES
Application of precast, prestressed girders to bridge construc-tion started in the United States in the early 1950's. Use of pretensioned I-girders with cast-in-place concrete decks grew rapidly. Until the early 1960's, bridges built with pretensioned I-girders and cast-in-place concrete decks were designed as sim-ply supported spans. However, longitudinal reinforcement placed in continuous deck slabs above the piers provided neg-ative moment capacity. Therefore, these I-girders could be con-sidered as partially continuous for negative moments at the piers. The degree of continuity depends on the time-dependent effects and the effective stiffness of the moment connection provided at the piers.
In a pretensioned member, prestress will usually cause the member to camber. If the member is simply supported, the ends of the member will tend to rotate, as shown in Figure 1(a). When members are made continuous through positive and neg-ative moment connections at the piers, the ends of the preten-sioned girder are restrained from rotating. As a result, a positive restraint moment, as shown in Figure 1(b), may occur at the pier. Positive moment also occurs at the piers when alternate spans are loaded.
In 1961, the Portland Cement Association (PCA) conducted an experimental research program on this type of bridge. The research program studied the influences of creep in the precast girders and differential shrinkage between the precast girders and the cast-in-place deck slab on continuity behavior after an extended period of time. As a result of these studies, procedures were developed for design of the positive moment connection and the negative moment reinforcement over supporting piers. Reinforcement for positive moment connection is designed for
the summation of positive moment due to time-dependent effects and live load application. Construction of the positive moment connection detail is generally expensive and time consuming.
Although existing. bridges designed by the PCA procedure are generally performing well, it is believed that this method may not accurately predict the true behavior of these structures. Since the PCA research was completed over two decades ago, there have been significant advancements in understanding of the time-dependent effects of creep and shrinkage in concrete. Recent research has also made it possible to refine computations for prestress losses. In addition, inexpensive computers with large capacity are currently available. These advancements make
Prestress
(a) Simply Supported Precast Girders
Deck Reinforcement—,\ M U estroint Moment From
\ / L" - Dependent DeformotionsJ ._;.
Positive Reinforcement
(b) Cast-In-Place Deck Slab and Diaphragm Forn a Continuous Girder for Live-load and Time-Dependent Effects
Figure 1. Two-span bridge with precast, prestressed girders made continuous.

it possible to perform more rigorous analyses of prestressed bridge girders made continuous.
There are several uncertainties associated with the PCA pro-cedures. Some of the uncertainty stems from the simplifying assumptions made in the PCA procedures. One assumption is that girder concrete and deck concrete have the same creep and shrinkage properties. This would not generally be the case, par-ticularly if the sequence of construction results in significantly different ages between the girder, diaphragm, and deck concrete. Different concrete mixes and curing conditions for girder, dia-phragm, and deck concretes also cause differences in creep and shrinkage properties. Also, for the PCA simplified analyses, the continuity connections are considered to have zero length and to be fully rigid. Full continuity is assumed in calculation of live load positive and negative moments. The actual connections have finite lengths and rotational stiffnesses. The moment of inertia of the reinforced concrete section at the connection after cracking from either positive or negative moment will be sig-nificantly lower than the moment of inertia of prestressed girder section. In addition, when positive restraint moment from time-dependent effects causes cracking in the diaphragm concrete, these cracks must close before the full section becomes effective for negative live load moment.
Because of the various design methods, construction se-quences, connection details, and materials in use in different states, the degree of continuity which develops at supports of this type of bridge varies significantly. Because of uncertainty in prediction of the positive and negative moments and because of the lack of guidance in the AASHTO Specifications, wide-spread differences exist in the design approach used for the connections at the piers.
The objectives of this investigation are to: (1) investigate the behavior of precast, prestressed bridge girders made continuous by connections using cast-in-place slabs and diaphragms at the piers; and (2) develop design procedures and guide specifications that can be used to compute elastic, inelastic, time-dependent, and ultimate moments commensurate with the degree of con-tinuity developed by the connections at the piers.
SCOPE OF STUDY
The foregoing objectives were accomplished within the fol-lowing scope:
Current practice in analysis, design, and construction of bridges built of prestressed girders made continuous was inves-tigated.
Analyses were conducted to study the effects of variation in time-dependent material behavior and variation in bridge design parameters on the resultant service moments at continuity connections and girder midspan regions.
Analyses were conducted to study the effects of variation in bridge design parameters on inelastic redistribution of mo-ments and development of the maximum strength of the bridge girders.
Computer programs were developed for simplified analysis methods.
Recommendations were developed for design procedures.
RESEARCH APPROACH
The project was divided into four tasks. This section briefly describes each of these tasks. The results and interpretation of the results are covered in Chapters Two and Three, respectively. The conclusions derived from the study are included in Chapter Four. The material provided in the appendixes consists of further detailed discussion on questionnaire responses (App. A), creep and shrinkage test results (App. B), methods of analysis (App. C), parametric study (App. D), program documentation (App. E), design examples (App. F), and finally the proposed AASHTO Provisions and Commentary (App. G).
Task 1—Review of Existing Data
Task 1 consisted of reviewing current design and construction practices, performance data, and research findings related to simple-span precast, prestressed bridge girders made continuous. This information was assembled from both the technical liter-ature and the unpublished experiences of designers and owners of structures of this type.
A review of published literature was conducted focusing on the following items: (1) creep and shrinkage data for steam- cured concrete loaded at an early age; (2) data on camber or sag of noncomposite and composite members; (3) mathematical formulations to predict creep and shrinkage; and (4) analytical techniques to account for the time-dependent effects of creep, shrinkage, relaxation of strands, and construction sequence on the behavior of continuous prestressed girders.
A questionnaire was prepared to obtain information from members of the AASHTO Subcommittee on Bridges and Struc- tures, bridge designers, and girder fabricators. Respondents were requested to provide information on typical bridge configura-tions, material properties, positive and negative moment rein- forcement details for connections at piers, design procedures for connection details, and bridge construction timing and sequence. Respondents were also requested to provide available unpub- lished data and descriptions of experience with specific bridges. Information gathered from questionnaire responses was used to select parameters for analytical studies of restraint moments and negative moment strength.
Because of the scarcity of published data on creep and shrink-age of steam-cured concrete loaded one or two days after casting, creep and shrinkage tests were conducted at the Construction Technology Laboratories (CTL). Four precasters provided cyl-inders from concrete used in actual bridge girder production. Precasters were selected to represent various regions of the United States. Creep and shrinkage measurements were con-ducted for at least one year. Measured data were compared to the American Concrete Institute (ACI) Committee 209 rec-ommendations and other data. Results of the tests were used to select the range of creep and shrinkage properties used in the analytical study of service moments.
Task 2—Analytical Study of Service Moments
In Task 2, improved procedures were used to determine the degree of continuity and the moments resulting from dead loads, live loads, and time-dependent effects. Advanced analytical tech-niques were applied. Realistic geometry and material properties were used for analyses.

4
Time-dependent deformations and restraint moments induced in multispan bridges built of precast, prestressed girders made continuous were studied using computer analyses. The computer program used is capable of analyzing composite prestressed concrete structures of any cross-sectional shape having one axis of symmetry. The program accounts for the effects of nonlin-earity of stress-strain responses of materials and variations with time of strength, stiffness, creep, and shrinkage of concrete, and relaxation of steel. The program also allows flexibility in ana-lyzing various construction sequences and live load applications.
Initial analyses were conducted for verification of the com-puter program by comparison of analytical results with exper-imental data. Extensive computer analyses were then carried out for a parametric study of the effects of various amounts of continuity reinforcement, different construction sequences, gir-der age at deck casting, and variation in time-dependent material properties for concrete and prestressing steel in bridges with a range of girder types, spans, and spacings. The primary factor used to evaluate and compare results was the response to live load applied at various stages of service life. Time-dependent support restraint moments and live load service moments at supports and midspan were evaluated.
Task 3—Flexural Strength Analysis
Improved analytical procedures were used to predict ultimate strength and inelastic deformation capacity of negative moment regions for this type of bridge. Available flexural strength and ductility were determined using computer analyses. The com-puter program used is capable of determining flexural and shear strengths, inelastic deformation, and failure modes for the hing-ing region of reinforced or prestressed concrete sections sub-jected to combined axial load, moment, and shear.
Initial analyses were conducted for comparison of calculated and measured behavior of negative moment hinging regions of bridge girder sections. A parametric study was then carried out to evaluate effects of girder bottom flange configuration, amount of negative moment deck reinforcement, and material properties on negative moment strength and rotational ductility. Rotation capacities of analyzed sections were compared to required ro-tations for development of full failure mechanisms under ulti-mate load after redistribution of moments.
Task 4—Pier Connection Design
In Task 4, improved procedures to determine the strength and serviceability requirements for the positive and negative moment connections at the piers were developed. Advantages and disadvantages of providing positive moment reinforcement at continuity connections were weighed. Implications of the use of positive moment reinforcement were evaluated. Two com-puter programs were developed to assist in determination of service moments at supports of continuous bridges constructed of precast, prestressed girders and cast-in-place deck. Program BRIDGERM is an improved version of the PCA procedure for calculating time-dependent restraint moments. Results of anal-yses using this program were compared to results of analyses conducted in Task 2 and with results of analyses using the PCA procedure. Program BRIDGELL was developed to calculate
live load moments in a continuous bridge under AASHTO HS loading.
Results of analyses conducted in Tasks 2 and 3 were used to establish recommendations concerning: (1) the need for positive moment reinforcement within the connection at the piers; (2) conditions for determination of design moments; and (3) min-imum and maximum limitations on the amount of deck rein-forcement used in this type of bridge to ensure sufficient strength and ductility.
NOTATION
Ad =cross-sectional area of deck slab A1 = cross-sectional area of bottom flange, up to junction
with web Ag = cross-sectional area of girder A = cross-sectional area of positive moment reinforcement
provided at supports A, = cross-sectional area of reinforcement in the deck slab a = empirical constant used in the age-strength relation-
ship for concrete b = width of bottom flange c = depth from extreme compression fiber to the neutral
axis d = depth from extreme compression fiber to centroid of
deck reinforcement E = modulus of elasticity E, = initial modulus of elasticity of concrete
Ed, = modulus of elasticity of deck concrete at time Ti Eg = modulus of elasticity of girder concrete e = eccentricity between centroid of prestress and centroid
of girder section ec = distance between the top of the girder section and the
centroid of the composite section F = discrete element axial force Fpe = prestress force after losses F 1 = initial prestress force P2 = axial force in girder element AFdi = tension in deck to establish compatibility with the
girder
f =parameter defining the hyperbolic time function for shrinkage
18 = stress at the bottom of the section fc = concrete compressive stress f' c = concrete cylinder compressive strength
= maximum compressive stress in concrete stress-strain curve
(I'C)t = concrete cylinder compressive strength at time
(I'c)28 = concrete cylinder compressive strength at age of 28 days
= ultimate tensile strength of prestressing steel fpy = stress at one percent elongation of prestressing steel
fr = modulus of rupture = stress in prestressing strand at time = stress in prestressing strand at time ti
fT = stress at the top of the section steel yield stress
h1 = depth of bottom flange, up to junction with web I = moment of inertia of cross section Ic = moment of inertia of composite section K = stiffness matrix

L = length of girder span = total transverse length of section = positive moment in midspan region of continuous gir-
der due to restraint, additional dead load and live load plus impact moments
= negative moment at support due to restraint, addi-tional dead load and live load plus impact moments
Mcr = negative cracking moment of composite section M'D = restraint moment due to dead load M' = restraint moment due to creep under prestress M'5 = restraint moment due to differential shrinkage between
deck slab and girder M = restraint moment at time T M = positive moment capacity of composite girder section M' = negative moment capacity of composite girder section M2 = bending moment in girder element AMi = change in restraint moment at time step i
= change in restraint moment at time step i resulting from the difference in deck shrinkage strain and girder shrinkage strain
P = column vector associated with the loading conditions = concentrated load of AASHTO lane load configura-
tion at maximum strength of girder 6P11 = change in load between load step i and i+ 1
equilibrium error at load step i+ 1 SB = section modulus for bottom fiber stress SL = span length ST = section modulus for top fiber stress
= average age of loading from time 1— 1 to time i t = time
= thickness of deck slab = web thickness
V = nominal shear strength provided by concrete
176 = nominal shear strength provided by concrete when diagonal cracking results from combined shear and moment
V = nominal shear strength provided by concrete when diagonal cracking results from excessive principal tensile stress in web
= nominal shear strength provided by shear reinforce-ment
W = displacement vector 6 W11 = change in displacements between load step i and L+ 1 Wb = crack width at interface of girder and diaphragm w,, = crack width in deck within hinging region of com-
posite girder
w, = distributed load of AASHTO lane load configuration at maximum strength of girder
XLD = diaphragm length Xb = depth of compression block
Yb = distance from the bottom to the centroid of the section Yi = distance from the centroid of the cross section to the
centroid of the fiber i a = parameter defining the hyperbolic time function for
shrinkage a = coefficient used to determine modulus of rupture a = ratio of total load to AASHTO lane load a 1 =load ratio at formation of negative moment hinge a2 =load ratio at formation of failure mechanism
= factor defining depth of compression block e = concrete compressive strain Ecom i 'offset strain in fiber i due to composite action Eel = instantaneous elastic strain of fiber i C0 = strain at peak stress in the concrete stress-strain curve Esdi = shrinkage strain in deck at time t, Esgi = shrinkage strain in girder at time t,
= initial strain in fiber i (E5) =shrinkage strain at time t (e) ultimate shrinkage strain Ctime,i = time dependent strain in fiber i e 01 =total strain due to curvature in fiber 1
= ultimate compressive strain of concrete BAEsi = change in differential shrinkage between girder and
deck concrete at time step i 0,, = rotational capacity of hinging region of girder Or = required hinge rotation at support to attain full mech-
anism and maximum flexural strength of continuous girder
v1 = creep coefficient at time T days v 'Ti = creep coefficient at time Ti after prestress release for
time step i v. =creep coefficient at time t where t' is the loading age v,, = ultimate creep coefficient p = ratio of reinforcement area to concrete area
Pb = reinforcement ratio at balanced condition 4) = ratio of creep strain to elastic strain
4>', = change in creep coefficient at time step I
4>., = curvature in girder section at yield of flexural rein- forcement
= curvature in girder section at maximum flexural ca-pacity
'I' = parameter defining hyperbolic time function for creep
CHAPTER TWO
FINDINGS
This chapter presents the results of the research including review of existing data, analyses for service moments, analyses for flexural strength, and development of analysis procedures for design. Interpretation of the results and recommendations for design procedures are presented in Chapter Three.
SUMMARY OF LITERATURE REVIEW
Advantages of Continuous Bridges
The design and construction of bridges composed of simple-span prestressed girders and cast-in-place decks have become widespread. Continuous bridges of this type have several prac-tical, economical benefits. A primary reason for using continuity with precast, prestressed girders is the elimination of the main-tenance costs associated with bridge deck joints and deck drain-

age onto the substructure. To avoid problems that occur at expansion joints, the State of Tennessee designed and con-structed a 2,700-ft long prestressed concrete bridge with pro-vision for expansion at the abutments only (1). Joints at abutments have been eliminated in several states that use girders built integrally with the abutment (2).
A method of bridge construction in Great Britain, utilizing precast, pretensioned concrete beams with cast-in-place concrete decking, is presented in Ref. 3. This paper discusses a number of different methods of eliminating joints in the decks of com-posite bridges. It is shown that an additional advantage of con-tinuity for live loads in the bridge superstructure could be achieved. The same is presented in Ref. 4, where it is reiterated that, in continuous spans, the positive moment due to live loads is decreased at girder midspan. As a result, for a given span, fewer prestressing strands are needed in continuous spans com-pared to simply supported spans. The advantages of continuity were also studied in New Zealand (5). It was concluded that use of continuity will lead to greatly enhanced structural per-formance, particularly in earthquake zones, and will produce savings in the cost of construction. Additional reasons for using continuity with pretensioned girders are to improve the ap-pearance and riding qualities of this type of bridge.
Portland Cement Association Research
An extensive experimental and analytical investigation on long-time behavior of continuous precast, prestressed concrete bridges was reported in a series of Portland Cement Association Research and Development Bulletins (6, 7, 8, 9, 10, 11). Be-havior of structures consisting of two half-scale I-shaped girders connected by a continuous cast-in-place deck slab and a cast-in-place diaphragm at the interior support was investigated. The results of the experimental investigation clearly showed the fea-sibility of establishing continuity between precast girders from span to span. Long-term measurements were made at suitable time intervals after casting the deck slab. Continuity moment at the interior support was studied for the two continuous bridge structures. The structures were identical, except that one in-corporated a positive moment connection at the interior support while the other did not. Restraint moments due to creep and shrinkage of concrete were studied for these two bridges.
It was shown that higher restraint moments were present for the bridge with positive moment connection. On the other hand, when no positive moment connection was provided between the ends of the girders, cracking occurred at the bottom of the diaphragm enclosing the ends of the girders, and continuity between the girders for live loads was reduced. As a result of the theoretical and test studies, a design procedure developed by PCA (12) was published in 1969. This publication offers guidelines for the design of the positive moment connection between adjacent girders and the negative moment reinforce-ment over the piers. For design purposes, it was assumed that the distribution of moments and forces will change toward that which would have occurred if the loads applied to the individual elements before continuity was established had instead been applied to the structure after continuity was present.
As a result of the PCA investigations (6-11), the structural continuity obtained in bridges built with precast, prestressed girders and cast-in-place concrete deck was recognized by in-troducing design guidelines in the 1971 Interim AASHTO Spec-
ifications (13). These guidelines have not been revised and appear in Article 9.7.2 of the 1983 AASHTO Specifications (14), entitled "Bridges Composed of Simple Span Precast, Pre-stressed Girders Made Continuous." That section states that "the effects of creep and shrinkage shall be considered in the design" of this type of bridge. No specific guidance is given as to how these effects should be considered in design. Some general guidelines for design of the positive moment connection as well as the negative moment reinforcement at piers are provided.
Although existing bridges designed by this procedure are gen-erally performing well, it is believed that this method may not accurately predict the true behavior of these structures. This uncertainty is due to different loading and construction stages, time-dependent effects, and details used to make the connec-tions.
Two papers (15, 16) relating portions of the research carried out in this study have been written prior to this report. In the initial paper (15), the PCA analysis method (12) was evaluated by comparison with more sophisticated computer analyses. ACI Committee 209 (17) procedures for the estimation of the time variation of compressive strength, creep, and shrinkage of con-crete were used in the computer analyses. It was concluded that girder restraint moments at pier supports are similar for early age at continuity, say 17 days after girder prestress. However, as the age at continuity increases, so does the difference between the computer analysis and the simplified method. In a second paper (16), the need to consider construction timing in deter-mining design moments, and the effects of providing positive moment reinforcement at the diaphragms are discussed.
Time Dependent Material Properties
Composite members, consisting of precast prestressed bridge girders and cast-in-place deck slabs, are sensitive to creep and shrinkage of concrete and relaxation of prestressing steel. Dif-ferential shrinkage between girder concrete and deck concrete and creep of girder concrete due to combined effects of prestress force and dead load produce secondary forces and deformations in the composite member. A complex interaction exists between concrete aging, creep, and shrinkage and relaxation of pres-tressing steel. In the literature, several state-of-the-art papers exist. Major contributions have been made by Sattler (18), Bran-son and Ozell (19, 20), Branson (21), Roll (22), Birkeland (23), Trost and co-workers (24, 25), and Dilger and Neville (26). The last three references make use of the aging coefficient de-veloped by Trost (27) and later by Bazant (28). This approach has been used by many authors (29, 30, 31)because of its relative simplicity.
Several practical models for predicting mean cross-section creep and shrinkage exist at present. These models (Model of ACI Committee 209 (17), Model of CEB-FIP (32), and Model of Bazant and Panula (33)) differ in their degree of accuracy and simplicity.
The ACI model is the simplest one, while the Bazant and Panula model is the most comprehensive. Experimental creep and shrinkage studies have been performed by many authors. Properties of steam-cured concrete loaded at an early age have been reported by ACI Committee 209 (17), Hanson (34), Klie-ger (35), Gamble (36), and Pfeifer (37).
Various publications (17, 38-41) present prestress loss mea-surements and methods to predict prestress losses due to steel

relaxation, and elastic shortening, creep, and shrinkage of girder concrete over the structure's service life.
Methods of Analysis
The problem of predicting complete time-dependent response of a continuous prestressed concrete bridge is very complex. It depends on time-dependent properties of materials, geometry of the structure, amount of prestressing, methods and sequences of prestressing and construction, loading arrangement, and age at loading. There are a number of mathematical formulations to predict time-dependent effects for prestressed structures. They have been reported by Bazant and Wittmann (42), Aswad (43),
Scordelis (44), and Anderson (45). Various computer programs
(46, 47, 48, 49, 50, 51, 52, 53) use step-by-step procedures to calculate prestress loss and deformations due to loading, creep, shrinkage, and steel relaxation. Since the first application of the finite element method to the analysis of reinforced concrete structures, made by Ngo and Scordelis (54) in 1967, numerous studies have taken place covering all aspects of structural be-havior of concrete structures. A comprehensive review has been made by Bazant, Schnobrich, and Scordelis (55).
Computer Program PBEAM (53), developed by C. Suttikan, is capable of analyzing composite prestressed concrete structures of any cross-sectional shape having one axis of symmetry. The program accounts for the effects of nonlinearity of stress-strain responses of materials and variations with time of strength, stiffness, creep, and shrinkage of concrete, and relaxation of steel. A step-by-step method is used in the time-dependent anal-ysis with a tangent stiffness method implemented for solving nonlinear response. Precast, prestressed bridge girders with com-posite cast-in-place decks are modeled using a discrete element method as developed by Hays and Matlock (56).
In order to study the parameters affecting bridge girder ca-pabilities to attain maximum strength, methods of analyses to determine ductility capacity of girder sections and the ductility demand for hinging regions of bridge girders are required. Pro-gram WALL_HINGE (57) was developed to"analyze rein-forced concrete shear walls and predict failure modes including web crushing and compression zone crushing. The program is used to determine the strength, inelastic deformation capacity, and failure modes for the hinging region of structures subjected to combined axial load, moment, and shear. The analysis con-siders both longitudinal and transverse equilibrium through the hinging region and across the transverse plane near the support. The analysis accounts for important behavioral effects within a hinging region including a nonlinear strain distribution, dowel action, aggregate interlock, and the interaction of compressive stress and shear stress in the compression zone with a strength criteria based on a critical octahedral shear stress.
A general method for calculating required hinge rotations is described by Park and Paulay (58). Using this method, the required plastic rotation at the supports is equal to the discon-tinuity of slope between the ends of adjacent members deter-mined from an elastic analysis of each member supporting the maximum load condition including the external load and mo-ments at support hinges.
Other Research
Time-dependent behavior of noncomposite and composite prestressed concrete structures under field and laboratory con-
ditions was also studied by Mossiossian and Gamble (59, 60).
Instrumentation was installed in three structures and defor-mation data were gathered and interpreted. Also, two 8th-scale models were constructed to simulate portions of the field in-strumented structures. The models were tested to provide data to help confirm some information developed in the field study.
Extensive parametric studies were carried out (46, 47) as part of the project to develop a relatively complete understanding of the factors influencing the growth in camber in bridges, the loss of prestress with time, the development of moments at interior supports, and the various interactions between the time-depen-dent strains in the deck and girder concretes which exist in composite structures. Experimental studies of camber and de-flection of prestressed concrete beams were also presented in Ref. 47, where various mathematical models for creep, camber and deflection are discussed. Studies on camber or sag of non-composite (61, 62, 63) and composite (64, 65, 66) members are
also published.
RESULTS OF QUESTIONNAIRE
Questionnaires were sent to transportation officials, designers, fabricators, and others to obtain knowledge on the current state of practice in design and construction of bridges constructed of precast, prestressed girders made continuous. Information gath-ered from 49 questionnaire responses was used to establish typ-ical ranges for the various parameters used in analytical portions of this project. In this section, the major categories of responses will be discussed. The questionnaire and a detailed summary of responses are included in Appendix A.
Bridge Configuration
Several questions dealt with configuration of bridges con-structed of prestressed girders made continuous. In the expe-rience of the respondents, the maximum number of continuous spans ranged from 2 to 29, with the majority falling between 3 and 7. The most commonly used standard girders were AASHTO-PCI sections (4) particularly Types II, III, and IV. Span lengths and girder spacings for the AASHTO-PCI sections were consistent among the respondents using a particular sec-tion. A large variety of non-AASHTO sections were indicated, none of which were used in a particularly wide area. Non-AASHTO girders were primarily I or Bulb-Tee sections, al-though several box girders were also specified. Twenty respon-dents used a standard profile for draped strands. Forty-two respondents indicated that positive moment connection is used in their continuous bridges.
Material Properties
Specified properties of concrete, prestressing strand, and con-ventional reinforcement used in simple span bridges made con-tinuous were requested of questionnaire recipients. The most common girder concrete strengths at prestress transfer were between 4,000 and 5,500 psi. The most common concrete strengths at 28 days were between 5,000 and 6,500 psi. All respondents indicated that they used grade 270 prestressing strand. The type of strand used was nearly evenly divided be-tween stress-relieved and low-relaxation. The most common strand diameter was '/2 in. with 0.6 in. and Y16 in. the only

exceptions. Nearly all of the specified deck and diaphragm con-crete strengths ranged between 3,000 and 4,500 psi, with most between 4,000 and 4,500 psi. Deck reinforcement used by re-spondents was primarily Grade 60.
Design Procedures
Questionnaire recipients were requested to provide informa-tion on procedures used in design for service loads and long-term effects. Most respondents indicated that provision was made for an additional wearing surface during a bridge's service life. Average magnitude of the additional load was 25 psf, and the average age at which the load is applied was about 15 years. Thirty-eight respondents indicated that they use AASHTO HS20-44 (14) live load alone or in combination with other loads. Several respondents used HS25 or larger design loads.
In order to calculate midspan and support design moments, the degree of continuity for negative and positive moments at supports must be established. A variety of procedures was spec-ified by questionnaire recipients. Current practice includes:
Designing and providing positive moment reinforcement or using standard details at the pier connection and considering negative moment continuity for reduction of live load positive moment near midspan.
Designing and providing moment reinforcement or using standard details, but ignoring negative moment continuity for reduction of live load positive moment near midspan.
Providing no positive moment reinforcement, but consid-ering negative moment continuity for reduction of live load positive moment near midspan.
Providing no positive moment reinforcement and ignoring negative moment continuity for reduction of live load positive moment near midspan.
The most common design method employed by respondents for proportioning positive moment reinforcement at piers was that published by PCA in Ref. 12. Thirty of the 42 respondents who provide positive moment reinforcement indicated that their design process is based on the PCA method, occasionally with supplementary information or procedures. Several respondents indicated that they do not calculate long-term positive moments at piers and provide standard reinforcement based on previous experience with specific girder types, spacings, and span lengths.
Reinforcement Details
Recipients of the questionnaire were requested to provide information on typical details used for positive moment rein-forcement at piers as well as negative moment and deck rein-forcement. The most common positive moment details used by respondents were the embedded bent bar and the extended strand details shown in the questionnaire. Eighteen respondents returned information on the embedded bent bar detail. The area of provided reinforcement ranged from 1.2 to 7.2 sq in. for each girder end for this detail. Twenty-one respondents provided information on the extended strand detail. The area of provided reinforcement ranged from 0.61 to 3.06 sq in. for each girder end for the extended strand detail. Miscellaneous details in-cluded embedded straight bars extending into the diaphragm welded to a steel angle, overlapping U-shaped bars with the legs
embedded in ends of adjacent girders and longitudinal post-tensioning over the pier through bottom flanges of adjacent girders. Thirty-four respondents. provided information on deck reinforcement and negative moment reinforcement at supports in the form of drawings or sketches.
Construction Sequence
Questionnaire recipients were requested to give a brief de-scription of a typical construction sequence based on their ex-perience with simple span bridges made continuous. Thirty-four respondents provided this information. The majority of the re-sponses indicated that girders were between 10 to 90 days old at the time of construction. The sequence of placing concrete in the deék and diaphragms at supports has an influence on the long-time behavior of the bridge. Nine respondents indicated that bridge decks are typically cast before diaphragms at piers. A common variation consists of casting positive moment areas of the deck first and then casting pier diaphragms and negative moment areas of the deck. Sixteen of the respondents typically cast deck and pier diaphragm concrete simultaneously. Ten respondents typically cast pier diaphragms before deck concrete.
Bridge Performance
The questionnaire requested information regarding problems encountered during the service life of simple span bridges made continuous. Specifically, information was requested about con-struction, service, and maintenance problems. Twenty-eight re-spondents returned information on problems encountered in their experience. Most common among the responses were prob-lems encountered during bridge construction. Specific problems in each of the three areas were mentioned by several respondents. Some of these common problems are listed below:
Positive moment reinforcement which required field ad-justment because of poor fit.
Misplacement of reinforcement, such as extended strands inadvertently cut off.
Transverse cracking of the deck in negative moment areas and throughout the bridge.
Excessive girder camber, requiring adjustment of profile grade, etc.
Incorrect construction sequencing. Cracking of pier diaphragms due to long-term creep and
shrinkage. Cracking and spalling of pier diaphragms when diaphragms
are cast before the deck. Spalling of piers and abutments due to poor girder location
or inadequate seat detailing. Movement of girders during construction when deck con-
crete is poured before diaphragms.
Each of these problems was mentioned by at least two re-spondents. In addition, several problems were mentioned indi-vidually, such as brittle fracture of bent reinforcing bars during girder placement, corrosion of deck reinforcement after cracking has taken place, opening of expansion joints due to long-term girder movements, and difficulty in replacing girders when nec-essary.

Miscellaneous
Questionnaire recipients were requested to provide informa-tion on previously conducted measurements of camber or sag of prestressed girders, deflections of composite deck-girders, and creep and shrinkage of concrete used in bridge girders. Nine respondents indicated that they had conducted measurements in these areas or were initiating projects. Six of the nine re-spondents were transportation officials. Two girder fabricators and one designer also had conducted tests. Eight of these re-spondents had conducted or were initiating measurements of camber or sag of prestressed concrete girders. Two respondents returned brief summaries of their measured data and one in-dicated a reference for published data.
The last section of the questionnaire requested information on specific bridges designed or constructed by the respondent. Eleven respondents provided this information.
A detailed summary of questionnaire responses is given in Appendix A.
Table 1 shows the concrete mix designs for cylinders from the four precasters. Precaster A is located in the Eastern U.S., Precasters B and C are located in the Western U.S. Precaster D is located in the Chicago area. Table 2 gives the pretest conditions and concrete properties just prior to the start of creep tests.
Appendix B contains measured values of creep test parameters for the five creep tests. The initial elastic strain was computed by dividing the unit pressure acting on the loaded cylinders by the pretest modulus of elasticity determined from tests on com-panion cylinders. Drying shrinkage strains are measured on unloaded cylinders stored in the same controlled environment (75°F and 50 percent relative humidity) as the loaded cylinders are stored in. Creep strain is determined by measuring total strain of loaded cylinders and subtracting shrinkage strains. Creep strain/psi is determined by dividing creep strains by the
CREEP AND SHRINKAGE TESTS
Creep tests were conducted on concretes obtained from pre-casting plants from different regions of the United States to broaden the knowledge of creep and shrinkage properties of steam-cured concrete loaded at an early age. Prestressed girders are usually steam cured. Transfer of prestress can occur as early as 18 hours after casting. Review of the literature indicates that data on creep of steam-cured concrete loaded at one day are scarce. Within the limited data on steam-cured concrete loaded within the first week, there is a lot of scatter in the test results. Creep and shrinkage tests were conducted at CTL to increase the data base and to compare results with mathematical models. In this section, the creep and shrinkage test data are presented and comparisons are made to coefficients determined using AC! 209 (17) recommendations. Further details of the creep and shrinkage data are included in Appendix B.
One local (Chicago area) and three nonlocal precasting plants were selected for participation. Standard 6-in, by 12-in, cylinders were cast from concrete used in actual bridge girder production. The cylinders were steam cured at the plants. Cylinders from the three nonlocal plants were shipped air freight to CTL as soon as possible after the steam curing was completed. Creep tests conforming to ASTM Standard C 512 (67), "Creep of Concrete in Compression," were begun immediately upon ar-rival.
Initially, two sets of cylinders were obtained from a local precasting plant. For one set, creep tests were initiated following steam curing within a minimum time required to transport the cylinders to the laboratory. This condition simulates cylinders loaded at about the same age as the concrete in girders at transfer of prestress. Creep tests were initiated on the second set from the local plant at a concrete age equivalent to the average age of the cylinders received air freight from the nonlocal plants. Because of unreliable test results, a third and fourth set of cylinders were obtained from the local plant. Creep tests on these cylinders were repeated to duplicate the timing of creep tests on the first two sets of local specimens. Results of tests on the first two sets of cylinders from the local plant are not reported here. A total of five creep and shrinkage tests are included in this report.
Table 1. Concrete mix designs for creep test specimens.
Precaster
Component A
Cement. pcy 750 800 800 660
Sand, pcy 1020 1100 1320 1230
Stone. pcy 1860 1780 1670 1840
Water. pcy 270 240 230 210
W/C Ratio 0.37 0.30 0.29 0.31
Cement Type III III III III
Stone Limestone. Basalt, Volcanic Granite. Limestone.
Description man, size 3/41 man, size 1/2° mao. size 3/81 max. size 3/4°
ASTM C 33 to 5/8°. uniform ASTM C 33 ASTM C 33
Size No. 67 gradation Size No. 8 Size No. 6
Admixtures Air-Entraining High Range ASTM C494 Type ASTM C494 Type
Agent, Water Reducer F High Range 0 High Range
ASTM C494 Water Reducer Water Reducer.
Type0 Water Air-Eotraioing
Reducer - Agent. Retarder, Retarder
ASTM C494 Type F High Range Water Reducer
Table 2. Pretest concrete conditions for creep test specimens.
Precaster
A 8 C 0°
Curing Steam Steam Steam Steam
conditions 12 hr 'overnight' 14-1/2 hr overnight
Time from 54-1/2 hr 51-1/4 hr 48 hr 26 hr (id)
casting to 50 hr (2d)
loading for creep test
Pretest camp. 6570 7510 6800 4770 (id)
strength, psi 4830 (2d)
Pretest Mod. 5850 5310 4500 4640 (id)
of Elasticity, 4650 (2d)
ksi
°Oesignations (ld) and (2d) refer to cylinders loaded for the creep
test at 1 day and 2 days after casting, respectively.

[E
Table 3. Curve fit parameters for creep coefficient data.
Precaster Days of Data Test d
ACI-209
A 635 2.36 0.50 6.8 2.49
B 606 3.42 0.68 23.7 2.12
C 365 1.50 0.56 6.4 2.19
0 (1d)* 334 3.11 0.65 11.1 2.33
0 (2d) 305 3.15 0.60 11.1 2.33
*Designatjons (id) and (2d) refer to creep tests started at 1 day and 2 days after casting, respectively.
Table 4. Curve fit parameters for shrinkage strain data.
Precaster Days of Data Test
(sh)o. mllflonths
f ACI-209
('sh)u, millionths
A 635 514 0.541 11.61 585
8 606 884 0.68f 12.31 593
365 809 0.661 20.2 671
(1d)* 334 710 0.91 22.5 616
(2d) 305 . 660 0.92 21.7 616
Oesignatioss (ld) and (2d) refer to creep tests started at 1 day and 2 days after casting, respectively.
fOutside of ACI-209 Normal Range.
stress acting on the loaded cylinders. The creep coefficient is determined by dividing creep strain by the initial elastic strain.
The forms of equations used to fit the drying shrinkage and creep coefficient data are those given by ACI-209, "Prediction of Creep, Shrinkage, and Temperature Effects in Concrete Struc-tures" (17). For creep coefficient, the standard equation is:
t4, V1VUd+1 (1)
where: v, = creep coefficient at time t days, v = ultimate creep coefficient, and 'I', d = parameters defining the hyperbolic time function.
Normal ranges for v, tII, and d are: v = 1.30 to 4.15, II
= 0.40 to 0.80, and d = 6 to 30. For shrinkage strain, the standard equation is:
(es), = (Cs)uj r (2)
where: (e5), = shrinkage strain at time t days (millionths), (e)0
= ultimate shrinkage strain (millionths), and a,f= parameters defining the hyperbolic time function.
Normal ranges for (e), a, and fare: (e) = 415 to 1,070, a = 0.90 to 1.10, and f = 20 to 130.
Curves were fit to the measured data by applying linear regres-sion analyses to converted data. For creep coefficient, curve fit parameters were determined for t' / v, versus t' data. Similarly, for shrinkage strains, r"/(e), versus t" was analyzed. In each case, a range of exponents was specified for 'F' or a. A least squares regression was performed for each specified exponent. For each resulting curve fit, the sum of squared errors between the fit curve and the actual data was calculated. The exponent which yielded the minimum sum of squared errors was used to determine the best fit curve.
The curve fit parameters for results of the five creep tests are given in Tables 3 and 4. The creep test for Precaster C was terminated after one year. Figures 2 and 3 show plots of creep coefficient and shrinkage strain data for Precasters A, B, C, and D. Also shown on Figures 2 and 3 are ACI-209-recommended equations with upper and lower limits for ultimate values. In all cases, curves for creep coefficient and shrinkage strain are within the range recommended by ACI-209 for later ages. Par-
ticularly for shrinkage strain, the time functions are somewhat different from ACI-209 recommendations. The differences occur primarily in the early age behavior of the time functions. This can be seen in Figures 4 and 5, in which test results for the first 100 days are shown. Creep coefficient results for all spec-imens fall within ACI-209-recommended bounds. For very early age, less than about 15 days, shrinkage strain results for all five specimens were slightly greater than the ACI-209 recommended upper bound.
Also given in Tables 3 and 4 are ACI-209 recommended values for ultimate creep coefficient and shrinkage strains. These values were determined using ACI-209 concrete composition modification factors, which account for variations in slump, percent of fine aggregate, cement content, and air content. These modification factors were applied to the recommended ultimate creep coefficient of 2.35 and the recommended ultimate shrink-age strain of 780 millionths. Generally, the ACI-209 recom-mended values underestimate test results. In Appendix B, ACI-209 recommended time curves are further oompared to test results.
During the work on this study, the measured creep data were also compared to predictions using the simplified Bazant-Panula (BP2) relationship (33). Although the Bazant-Panula approach is significantly more complex than the ACI-209 approach, in general, the results of the BP2 relationships are expected to be more accurate. However, as stated in Ref. 33, the BP2 approach is not intended to be used for concrete loaded earlier than 7 days. The comparisons made in this study indicated that the application of the BP2 relationships to steam-cured concrete loaded at 1 or 2 days resulted in significantly larger errors than with the use of the more simplified ACI-209 relationships. Al-though there is some inaccuracy in the ACI-209 relationships, as shown in Tables 3 and 4, the error for the steam-cured concrete loaded at 1 or 2 days in this study is not any larger than the expected error for concrete loaded, at a later age. The ACI-209 recommended time functions were used for analyses conducted in this study.
VERIFICATION OF ANALYTICAL PROCEDURES
Existing computer programs PBEAM (53) and WALL_HINGE (57), discussed in the summary of literature review, were selected for use in this study because of the direct

II
Precoster: Precoster
A * A * B + . B + c 000 c U ACI-209 Upper Bound
D(Id) 0 D(ld) 0 3.0 D(2d) x ACI-209 Upper Bound D(2d) x
++- - 4,
2.0 - 4
r
o
-' *_—Th — — 500 "
o -
t_ $- 0. 4, II- 0 *
* ACI-209
l-2O9 Lower Bound
/7
0 I I I I I I I I I I I 0 I I I I I I I I I I I I 0 200 400 600
0 200 400 .600 Time, days Time, days
Figure 3. Shrinkage strain test results. Figure 2. Creep coefficient test results.
Precoster Precaster: A * A * B + 000 B + C 2t C
3.0 0(Id) 0 . D(Id) 0
ACI -209 Upper Bound D(2d) x U, D(2d) x
ACI-209 Upper Bound
.9
2.0CL
--- -.--
500
0 4,
* C
1.0 U,
- / ACI-209 Lower Bound ACI-209 Lower Bound
- - - 0 0 I 0 50 100
0 50 100 Time, days
Time, days Figure 5. Shrinkage strain test results—early age.
Figure 4. Creep coefficient test results—early age.
applicability of each of these programs to the analytical tasks. Analyses for Service Moments
Information concerning verification of each of the programs by comparison with experimental data was contained in the liter- Program Description. Time-dependent deformations and re- ature on the programs. However, further verification analyses straint moments induced in multispan bridges built of pre- were carried out in this study. This section presents a description stressed girders made continuous were studied using a modified of the programs along with comparisons between analysis and version of computer program PBEAM (53). A detailed descrip- test results. More detailed descriptions of the programs are tion of the program is given in Appendix C. This program,
included in Appendix C. developed by Suttikan, is capable of analyzing composite pre-

12
stressed concrete structures of any cross-sectional shape having one axis of symmetry. The program accounts for the effects of nonlinearity of stress-strain responses of materials and variations with time of strength, stiffness, creep, and shrinkage of concrete, and relaxation of steel. A step-by-step method is used in the time-dependent analysis with a tangent stiffness method imple-mented for solving nonlinear response.
Precast, prestressed bridge girders with composite cast-in-place decks are modeled using a discrete element method as developed by Hays and Matlock (56). Element deformations and forces are estimated by analyzing stress-strain relationships of a series of rectangular fibers distributed over the depth of the cross section. It is assumed that strain in each fiber is constant at the centroidal axis of the fiber and strain distribution varies linearly through the depth of the section. For each time step, equilibrium at each element is maintained by determining the time dependent Stress corresponding to the level of strain in each fiber. Stress multiplied by area is summed over all fibers and force equilibrium is checked. If necessary, the strain dis-tribution is adjusted and the process is repeated until forces balance.
The ACI Committee 209 (17) procedures to estimate the time variation of compressive strength, creep, and shrinkage of con-crete and relaxation of prestressing steel are used in the PBEAM computer program. The rate of creep method and method of superposition are available in the program to account for the effect of concrete creep on the distribution of stresses in a section. The method of superposition was used for the studies conducted in this project.
The PBEAM computer program allows unlimited flexibility in analyzing various construction sequences and live load ap-plications. The analysis accounts for construction sequence such that the simple span behavior of the girder before casting of deck and diaphragm, and continuous behavior thereafter, are correctly modeled. Casting of deck and diaphragm can be done at any girder age and in any sequence. Live load can also be applied at any stage of service life and in any configuration. The program can therefore be used to investigate behavior under a wide variety of conditions likely to be encountered in actual use of this type of bridge.
The program's capabilities also allow a realistic analysis of the influence of diaphragm cracking on the behavior of this type of bridge. Depending on stress level and time-dependent material properties, the program accounts for cracking of the girder and/ or the deck concrete under positive or negative moments. For each time step of the analysis, the program stores the stress-strain relationship in every fiber of each element. These stored conditions serve as the starting point for the behavior calculated for the succeeding time step. In this way, the program can follow both crack development and crack closing. This analytically models the situation shown experimentally in Ref. 10, in which cracks, which had opened at the bottom of the diaphragm under the influence of positive restraint moments, were closed by the negative moment induced upon application of live load. With initial application of live load, the diaphragm crack is open and girders behave essentially as simply-supported beams. With in-creasing live load and rotation at the diaphragm, the bottom crack closes and negative moment continuity becomes effective. The amount of rotation needed to close the crack is dependent on the creep and shrinkage properties of both the girder and deck concrete, the ages of the two concretes at the time of live load, the amount of restraint provided by the positive moment
reinforcement in the diaphragm, and the girder type, span length and spacing. Therefore, the degree of negative moment conti-nuity is dependent on all these parameters. With proper incre-mental application of live load, PBEAM correctly models the change in negative moment stiffness that accompanies closing of the diaphragm cracks, thereby providing an analytical tool to evaluate the effects of all these parameters.
A "tension stiffened" effective stress-strain relationship for top and bottom reinforcement at supports was also used in PBEAM in order to model behavior of reinforcing steel at cracked sections (57). These features allow application of PBEAM to predict the changes in continuity at supports due to cracking of diaphragm and deck concrete as well as closing of cracks upon reversal of moments from application of live load.
Comparison Between Analysis and Test Results. To confirm the PBEAM analytical methods of predicting the time-depen-dent response of precast, prestressed bridges, results of computer analyses were compared to the PCA test observations conducted by Mattock (10). The test bridges included precast, prestressed girders with continuous cast-in-place deck slab and diaphragm. Long-term behavior of two half-scale model structures, identi-fied as Girder 1/2 and Girder 3%, were recorded by PCA. The two bridge girders were virtually identical except that Girder % incorporated both positive and negative moment connections at the interior support while Girder '/2 had only a negative moment connection.
The precast girders were I-shaped in cross section and 33-ft long. The prestressing force was released when the age of the girders was about 8 days. The girders were positioned on load cells on the top of columns, with their adjacent end faces 3 in. apart. About 13 days after positioning the girders, 800-lb con-crete blocks were hung at points 3 ft apart along the entire length of each girder to compensate for the dead weight of the half-scale model. The continuity reinforcement was placed and the deck slab and diaphragm were then cast when the age of girders was about 28 days.
The girders were monitored for long-term behavior. Also, at intervals throughout the test period, the girders were subject to live load tests by concentrated loads applied at the middle of each span. This was done in order to check continuity moment developed at the center support by service load.
The comparison of test results and computer analysis for long-term variation of the center support reaction is shown in Figure 6. It can be seen that variation of the center support reaction with time as estimated by the program PBEAM and from the test are in a good agreement.
Continuity behavior of the girders with live load applied at various stages of the long term test was compared to the com-puter time-dependent analysis. Results for Girder % at age 45 days are shown in Figure 7. Before cracks were observed in the deck, elastic theory midspan moment and time-dependent mo-ment from PBEAM computer program differed by approxi-mately 5 percent. After cracking of the deck slab, a significantly lower degree of continuity was observed for both the test girder and the PBEAM analysis.
Test observations and results of computer analysis at age 694 days for Girder 1/2 are compared in Figure 8. Time-dependent positive moment had induced a crack in the bottom of dia-phragm concrete over the pier. Girder '/2 did not have any positive moment reinforcement within the diaphragm. With ap-plication of live load, the positive moment crack must close

13
D.cr.os. 1.2
0 100 200 300 400 500 600
Time from Stripping Deck Slab Formwork, days
Figure 6. Variation with time of center support reaction.
Moment, Moment,
kip —ft kip—ft
100 100
Lb
Increos.
1.2
0.6
Variation of
Center Reaction,
kips 0.6
Cracks I
0 observed 8 -
- Slab
60- 1/ I
40
20 ---Elastic Thsory Moment
I f —5—Computs, Analysis
p7 —0—list at ags 45 days
o w 1 1 1 I I I
4 8 12 16 20 24
Total Load , kips
Figure 7. Variation with applied load of center support moment, Girder 3/4.
80 Crock probably j cloud
o. /
40
//.__—Elastic 20 IP.oqy loment ompj$,r Analysis
—o—r.,, of Age 64 days
0 4 8 12 16 20 24
Total Load , kips
Figure & Variation with applied load of center support moment, Girder ',.

14
prior to including negative moment at the continuity connection. The test continuity moment during closing of the crack averaged only about 18 percent of the elastic continuity moment, com-paring with 12 percent from computer analysis. Test results and time-dependent computer analysis showed that stiffness of the connection in Girder 1/2 became fully restored after closing of the crack at the bottom of the diaphragm. However, the negative continuity moment was significantly below the value determined from analysis as a fully continuous beam. Consequently, the positive moment at midspan was larger than that determined from a fully continuous analysis.
The observed correlation between test results and computer analyses indicated that PBEAM is capable of adequately mod-eling the time-dependent and nonlinear behavior of these simple span girders made continuous.
Analyses for Flexural Strength
Program Description. Program WALL_HINGE (57) was developed to analyze reinforced concrete shear walls and predict failure modes including web crushing and compression zone crushing. A detailed description of the program is given in Appendix C. The program is used to determine the strength, inelastic deformation capacity, and failure modes for the hinging region of structures subjected to combined axial load, moment, and shear. The analysis considers both longitudinal and trans-verse equilibrium through the hinging region and across the transverse plane near the support. The analysis accounts for a nonlinear strain distribution within the hinging region using a compatibility relationship between the summation of tensile strain over the hinge length resulting from the "fanned" crack-ing pattern with the summation of compressive strains within
a relatively short length near the tip of the fan as shown in Figure 9. This is an important effect to consider in analyses for flexural-compression or shear-compression failure modes that is not accounted for in typical sectional analyses made assuming a linear strain distribution. The important effects of dowel ac-tion, aggregate interlock, and interaction of compressive stress and shear stress in the compression zone for analysis of trans-verse equilibrium across a plane near the support were included. The program uses a complete tri-axial concrete stress-strain relationship developed by Ahmad and Shah (70), with strength criteria based on a critical octahedral shear stress.
In order to analyze negative moment ductility of composite prestressed girders, the precompression effects of prestressing strand in the bottom flange of the girder were included. The effective prestress in strand was estimated at an assumed critical plane located a distance from the end of the girder equal to the neutral axis depth at ultimate moment. This accounts for ex-perimentally observed behavior in which concrete crushing oc-curs beyond the end of the girder enclosed in the cast-in-place diaphragm.
Comparison Between Analysis and Test Results. In order to verify the applicability of program WALL_HINGE to analysis of negative moment ductility of composite prestressed girders, the program was used to analyze girders tested in Ref. 6. This test program investigated experimentally the feasibility of es-tablishing continuity in a bridge constructed of precast, pre-stressed concrete girders by casting a concrete deck with negative moment reinforcement over supports and a diaphragm between ends of girders. In the experimental program, the girder was a 4-scale model of a 44-in, deep I-girder. Tests were conducted
with varying amounts of prestressing steel and conventional deck reinforcement. Program WALL_HINGE was used to analyze three of the tested girders. The three analyzed girders had 0.9
I'
1)
rv, ,JI,l$JUtiuIlty w .. .. Deformations Within the Fanned Crack Pattern, A Concentration of High Compressive Strains Occur Over a Short Distance Near the Tip of the Fan
Figure 9. Negative moment hinging region.

15
sq in. of prestressing steel and deck reinforcement ratios of 0.83, 1.66, and 2.49 percent. The girders were constructed of two 6-ft long I-girders connected by a diaphragm and a deck slab. The structure was supported at the diaphragm and loaded at the ends of the girders. Program BEAM BUSTER was also used to analyze these girders. This program generates moment-curvature relationships for reinforced and prestressed concrete sections based on equilibrium and linear strain compatibility.
Table 5 summarizes ultimate moments observed during tests and calculated using programs BEAM BUSTER and WALL_HINGE. Table 6 contains measured strains from tests and calculated strains for deck steel. Predictions from program WALL_HINGE are in better agreement with test results than are results from BEAM BUSTER. This is particularly true for Girder 3, which failed by crushing of the bottom flange prior to yielding of the deck reinforcement.
Results from both programs indicate failure modes similar to observed behavior from tests. For Girder 1, failure of the PCA test structure occurred well after yield of deck steel. Program WALL_HINGE predicted failure after high strains are reached in both deck steel and bottom concrete. Crushing of concrete occurred after strain hardening of deck 'steel started. BEAM BUSTER results also show crushing of concrete after large strains developed in the deck steel.
For Girder 2, failure of the PCA test structure occurred in a nearly balanced mode. Experimental and analytical results indicate that crushing of concrete occurred nearly simulta-neously with or just after yielding of steel. In PCA test results, measured strains indicated that deck steel yielding occurred simultaneously with crushing of concrete. Both programs showed failure occurring while steel stress was in the flat region of the stress-strain curve just beyond yield. It should be noted that program WALL_HINGE includes a "tension-stiffened" stress-strain relationship for reinforcement which includes ef-fects of bond and slip between concrete and reinforcement and the effects of concrete cracking. The deck reinforcement strains reported in Table 6 for WALL_HINGE results are the peak calculated strains occurring right at crack locations. The rela-tionships between strain gage locations and crack locations in the PCA test specimens are unknown.
For Girder 3, test results indicate that failure occurred due to crushing of concrete before yielding of steel. BEAM BUSTER results indicate that failure occurred when concrete crushed essentially simultaneously with yielding of the steel. WALL_HINGE results more accurately predicted failure due to concrete crushing before yield of steel.
SERVICE MOMENTS
A primary task of this project was to determine the time-dependent effect on continuity of precast, prestressed girders made continuous. To accomplish this, a parametric study was carried out using PBEAM to examine the range of bridge be-havior as related to ranges of material properties and bridge design parameters. The main emphasis of the parametric study was on the resultant design service moment for the girders. This section presents the results of the parametric study concerning continuity effects for positive'and negative service moments. Further detailed results of computer analyses are included in
Appendix D.
Table S. Negative moment capacities from tests and analyses.
Deck Steel.
PCA Test,
BEAM BUSTER WALL_HINGE
Calculated, Mtest Calculated Mtest
Girder % in.-kip in.-kip Mcalc in-tip Ncalc
1 0.83 -2440 -2060 1.18 -2230 1.09
2 1.66 -3490 -3610 0.91 -3510 0.98
3 2.49 -4000 -4960 0.81 -4290 0.93
Table 6. Deck reinforcement strains near moment capacity from tests and analyses.
Deck Girder Steel. PCA Test BEAM BUSTER WALL_HINGE
0.83 0.0119 0.0195 0.0320
2 1.66 0.0016 0.0065 0.0118
3 2.49 0.0012 0.0020 0.0014
Parametric Study
The program PBEAM was used to evaluate the effects of variations in several parameters on the behavior of bridges con-structed of prestressed girders made continuous. Table 7 pro-vides a summary of the parameters analyzed in the study. The basic model used for the parametric study consisted of a bridge of four equal length spans, as shown in Figure 10(a). Charac-teristics of the model which were varied included:
Girder type. Span length. Girder spacing. Positive moment continuity reinforcement. Time-dependent material properties (a) concrete (com-
pressive strength, creep coefficient, shrinkage strain) and (b) prestressing steel (relaxation characteristics).
Girder age when deck and diaphragm are cast. Girder age at application of live load. Construction sequence.
Values for these parameters were chosen to reflect the range of current practice as indicated by responses to the questionnaire. Following are brief discussions of the variables used in the parametric study.
Four girder types, shown in Figure 10(b), were used in the parametric study, AASHTO Types IV and VI, Modified Bulb Tee BT72/6 (4), and a box section. Questionnaire responses indicated that AASHTO standard sections were most commonly used. The AASHTO-IV and AASHTO-VI sections were chosen to represent girders used for medium to long span bridges. The AASHTO-IV girder was used with span lengths of 70 ft and 100 ft in the parametric study. The AASHTO-VI girder was used with span lengths of 100 ft and 130 ft in the parametric study. These AASHTO standard girders have heavy cross sec-tions for their span length capabilities. Questionnaire responses also indicated that a variety of lighter girder sections are in
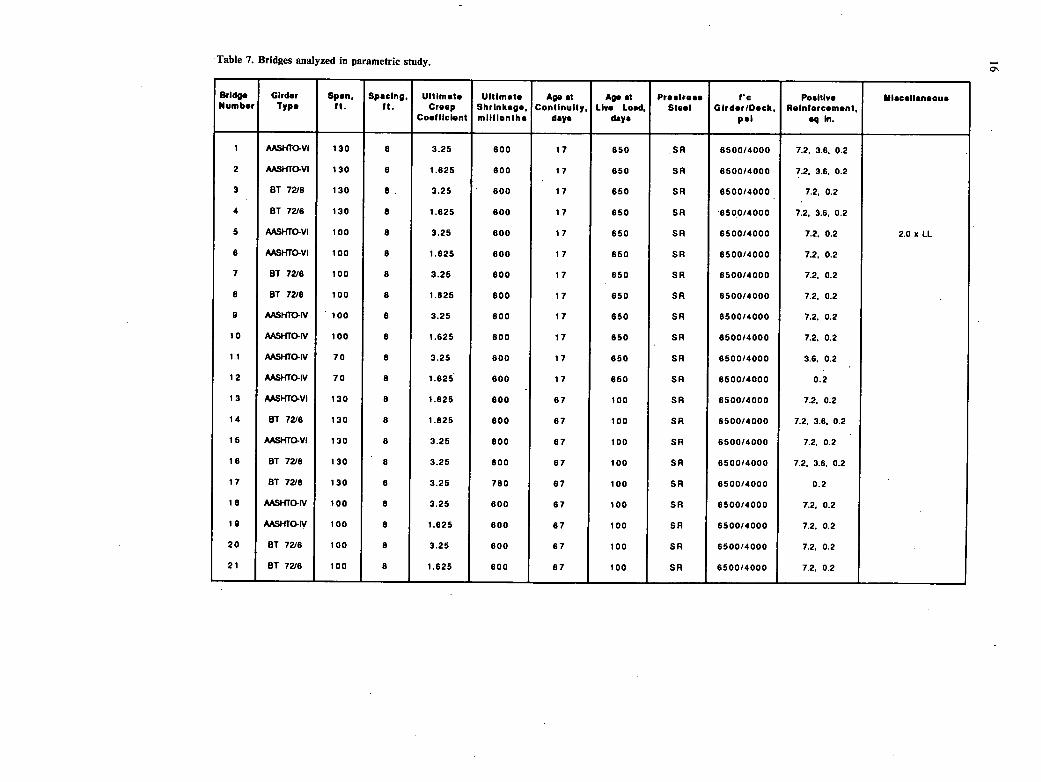
Table 7. Bridges analyzed in parametric study.
BrIdg. Humb.r
Gird., Typ.
Span, It.
Spacing, ft.
Ultimat. Creep
Co.ffici.nt
Uitim.ts Shrinkage, mIllionths
Ag. at Continuity,
days
Ag. at Liv. Load,
days
Preatre.. Ste.i
f'c Gird.r/D.ck,
p.1
Po.iiIv. Reinforc.m.nt,
sq in.
Ulacsiianeou.
I AASHTO-Vi 130 8 3.25 600 17 650 SR 6500/4000 7.2, 3.6. 0.2
2 AASHTO-Vl 130 8 1.825 600 17 650 SR 6500/4000 7.2. 3.6. 0.2
3 ST 7216 130 8 . 3.25 600 17 650 SR 6500/4000 7.2. 0.2
4 ST 7216 130 8 1.825 600 17 650 SR 6500/4000 7.2. 3.6. 0.2
5 AASHTO.VI 100 8 3.25 600 17 650 SR 6500/4000 7.2. 0.2 2.0 x LL
6 MSHTO-VI 100 8 1.625 600 17 650 SR 6500/4000 7.2. 0.2
7 ST 7218 100 8 3.25 800 17 650 SR 6500/4000 7.2. 0.2
8 ST 72/6 100 8 1.625 600 17 650 SR 6500/4000 7.2. 0.2
9 AASHTO.IV 100 8 3.25 800 17 650 SR 6500/4000 7.2, 0.2
10 AASHTO-IV 100 8 1.625 800 17 650 SR 8500/4000 7.2. 0.2
11 AASHTO-IV 70 8 3.25 600 17 650 SR 6500/4000 3.6. 0.2
12 AASHTO-IV 70 8 1.625 600 17 650 SR 6500/4000 0.2
13 AASHTO-VI 130 8 1.825 600 67 100 SR 6500/4000 7.2. 0.2
14 BT 72/6 130 8 1.825 600 67 100 SR 6500/4000 7.2, 3.6, 0.2
15 MSI-fTO-VI 130 8 3.25 600 67 100 SR 6500/4000 7.2. 0.2
18 BI 72/6 130 8 3.25 600 67 100 SR 6500/4000 7.2. 3.6. 0.2
17 ST 72/8 130 8 3.25 780 67 100 SR 6500/4000 0.2
18 AASI-ITO-IV lOU 8 3.25 600 67 100 SR 6500/4000 7.2. 0.2
19 AASfffO.IV 100 8 1.825 600 67 100 SR 6500/4000 7.2. 0.2
20 ST 72/6 100 8 3.25 600 67 100 SR 6500/4000 7.2. 0.2
21 BT 72/6 100 8 1.625 600 67 100 SR 6500/4000 7.2. 0.2

Table 7. Continued.
Bridge Numb.,
Girder Typo
Span. it.
Spacing, It.
Ultimata Creep
Co.fflcient
Ultimate Shrinkage, millionths
Age at Continuity,
days
Ag. at Liv. Load,
days
Preatr.ss Steel
I'c Gird.r/Deck,
pal
Positive Reinforcum.nt,
sq in.
Ulsc.iian.ous
22 AASHTO-IV 70 8 3.25 600 67 100 SR 6500/4000 3.6, 0.2
23 AASHTO-IV 70 8 1.625 600 67 100 SR 6500/4000 3.6. 0.2
24 AASHTO-VI 130 8 3.25 600 67 tOO SR 6500/4000 0.2 2.5 a LL
25 AASHTOVl 130 8 1.625 600 67 100 SR 6500/6500 7.2, 0.2
26 AASHTO.Vl 130 8 1.625 600 67 tOO SR 6500/4000 0.2 Deck Steel 32sqln.. 2.5xLL
27 ST 72/6 130 6 3.25 600 17 650 LA 6500/4000 0.2
28 BT 72/6 130 8 3.25 200 11 650 SR 6500/4000 0.2
29 AASI-ITO-VI 130 8 1.625 600 67 100 SR 6500/4000 0.2 Deck Steel 16 sq In.. 2.5 a U.
30 AASHTO-Vi 130 8 1.625 600 97 130 SR 6500/4000 0.2
31 AASHTO.Vi 130 8 1.625 600 190 230 SR 6500/4000 0.2
32 USI-ITO-Vi 100 8 3.25 600 17 650 SR 4000/4000 0.2
33 AASHTO.Vl 130 8 1.625 800 17 650 SR 4000/4000 0.2
34 BOK 100 11.7 3.25 600 17 650 SR 6500/4000 7.2, 0.2
35 BCK 100 11.7 3.25 600 67 100 SR 6500/4000 7.2. 0.2
36 AASHTO.1V 100 8 1.625 600 10 / 17 650 - SR 6500/4000 7.2, 02 Deck Before Diaphragm
37 MSHTO-IV tOO 8 1.625 600 67 / 74 100 SR 6500/4000 7.2. 0.2 Deck Before Diaphragm
38 AASHTO.-1V 100 8 1.625 600 67 .650 SR 6500/4000 0.2
39 MSI-ITO-1V 100 8 3.25 600 67 650 SR 6500/4000 0.2
40 MSt-ffO.1V 100 8 1.625 600 67 / 74 650 SR 8500/4000 7.2 Diaphragm Before Deck
41 AASHTO-iV 100 8 1.625 600 67 / 74 100 SR 6500/4000 7.2 Diaphragm Before Deck

BT72/6
28
AASHTO-VI
All Oln.n.lons in lnchss I In. = 25.4 mm
rDeck Stab
r15.65 kips r15.65 kips / and Joint Cast
i /-557 lb/ft i /
Simultaneously
••.:
18
c 7
2ft ft 7010 132ft- 70 to l3O I I 0 ft
2ft-
70 to 130 ft 70 to 130 ft
a) Bridge with Four Spans of Various Girder Types
AASHTO-IV BOX
b) Girder Sections for Parametric Study
Figure ia Bridge model for parametric study.

19
current use, particularly for longer spans. The BT72/6 section was chosen to represent girders with a lighter, more efficient cross section. This girder was used with span lengths of 100 ft and 130 ft in the parametric study. The girder spacing used for these three girders throughout the majority of parametric study analyses was 8 ft. Preliminary studies indicated that girder spac-ings varying between 4.5 and 8 ft had a minor influence on bridge behavior. The box girder span length and girder spacing used in the parametric study were 100 ft and 11.7 ft, respectively. For AASHTO-IV, AASHTO-VI, and BT72/6 sections, deck dimensions were 92 in. by 6.5 in. For the box girder section, deck dimensions were 140 in. by 9 in. The dimensions for girder areas, composite section areas, and simple span composite dead load moments at midspan for the four sections are given in Table 8.
One of the main priorities of the parametric study was to determine the effect on bridge behavior of varying amounts of positive moment reinforcement at supports. For each analyzed combination of parameters, positive moment reinforcement was set equal to one or more of 0.2, 3.6, or 7.2 sq in. These values represent a range of reinforcement equivalent to one No. 4 bar up to twelve No. 7 bars and encompass the range of reinforce-ment areas specified by questionnaire respondents. The 0.2-sq in. reinforcement is intended to represent an unreinforced sec-tion. A small amount of reinforcement had to be used in the PBEAM program to obtain a satisfactory numerical solution. Bridges analyzed with 3.6 sq in. or 7.2 sq in. of positive moment steel will be referred to as reinforced. Bridges analyzed with 0.2 sq in. will be referred to as unreinforced.
Preliminary PBEAM results indicated that variations in deck and girder concrete compressive strength had a minor effect on bridge behavior. Therefore, for the majority of parametric study analyses, girder and deck concrete compressive strengths were 6,500 psi and 4,000 psi, respectively. Two ultimate creep coef-ficients were used throughout the parametric study. A value of 3.25 represented the high end of the range and 1.625 was used for the low end value. Three values of ultimate shrinkage strain were used in the parametric study. A value of 200 millionths was used for a low end value and 780 millionths was used to represent a high end of the range. A value of 600 millionths was used for most PBEAM runs. Preliminary PBEAM results indicated that the difference in bridge behavior between stress-relieved and low-relaxation strand was minor. For most para-metric study runs, relaxation characteristics for stress-relieved strand were used.
From responses to the questionnaire, it was learned that cur-rent bridge construction practices include a number of aspects. Girder age at the start of bridge construction varies from about 10 days up to about 300 days. The majority of respondents indicated that construction of deck and diaphragm fell into three general categories: (1) casting the deck and diaphragms simul-taneously at various girder ages; (2) casting the deck approxi-mately 7 to 10 days before the diaphragm at various girder ages; and (3) casting the diaphragm approximately 7 to 10 days before the deck at various girder ages.
For purposes of the parametric study, the majority of PBEAM runs were conducted assuming the deck and diaphragm were constructed simultaneously. The girder age at which continuity was established for these runs was either 17 or 67 days. Ad-ditional runs were conducted with girder age at continuity up to 320 days. Several runs were also done to investigate behavior
Table 8. Girder sections used in parametric study.
Girder Cross composite Midopan Composite Girder Section Area, Section Area, Dead Load
Type in. 2 in. 2 Moment, tip-in.
AASHTO-IV 789 1387 21.700
AASHTO-VI 1085 1683 26,300
8112/6 701 1299 20,300
Box 920 2180 34,100
For simple span length = 100 ft
when the deck was cast 7 days before the diaphragm and vice versa.
To evaluate the behavior of bridges under service conditions, bridge response was analyzed for the live load configuration shown in Figure 10(a). The pattern of live load was chosen because it is symmetrical about the central support and produces the maximum negative moment at the central support. The magnitude of the loads is based on the AASHTO (14) HS20-44 lane load with a girder spacing of 8 ft, two girders per lane of traffic, and an impact factor for span length equal to 130 ft. For purposes of comparison, the magnitude of load was not changed to account for different impact factors for 70-ft and 100-ft spans. For bridges with girder age at continuity of 17 days, live load was applied at 650 days. For bridges with girder age at continuity of 67 days or greater, live loads were generally applied approximately 30 days after continuity was established. However, for several runs with continuity at 67 days, live loads were applied at 650 days.
Appendix D contains the parametric study results for PBEAM analyses of 41 combinations of variables.
Continuity Connection Effects for Positive Moment. The effects of providing varying amounts of positive moment connection steel on typical bridge behavior when positive support restraint moments develop are illustrated in Figures 11 and 12. The results shown are from PBEAM analyses for AASHTO-VI gir-ders with 130-ft span lengths and ultimate creep coefficient of 3.25. The girder age at which continuity was established was 17 days, and live load was applied at 650 days. The results
Moment,
- As = 72 in.2
kip - In.
- - - As = 3.6 in.2 12,000 ...........As = 0.2 in.2
8000
40001
100 200 300 400 500 600 20
Time, days Total Live Load>.<, -4000
Application of percent Live Load P
-8000
12,000
Figure 11. Central support moments for continuity at girder age of 17 days, loading at 650 days.
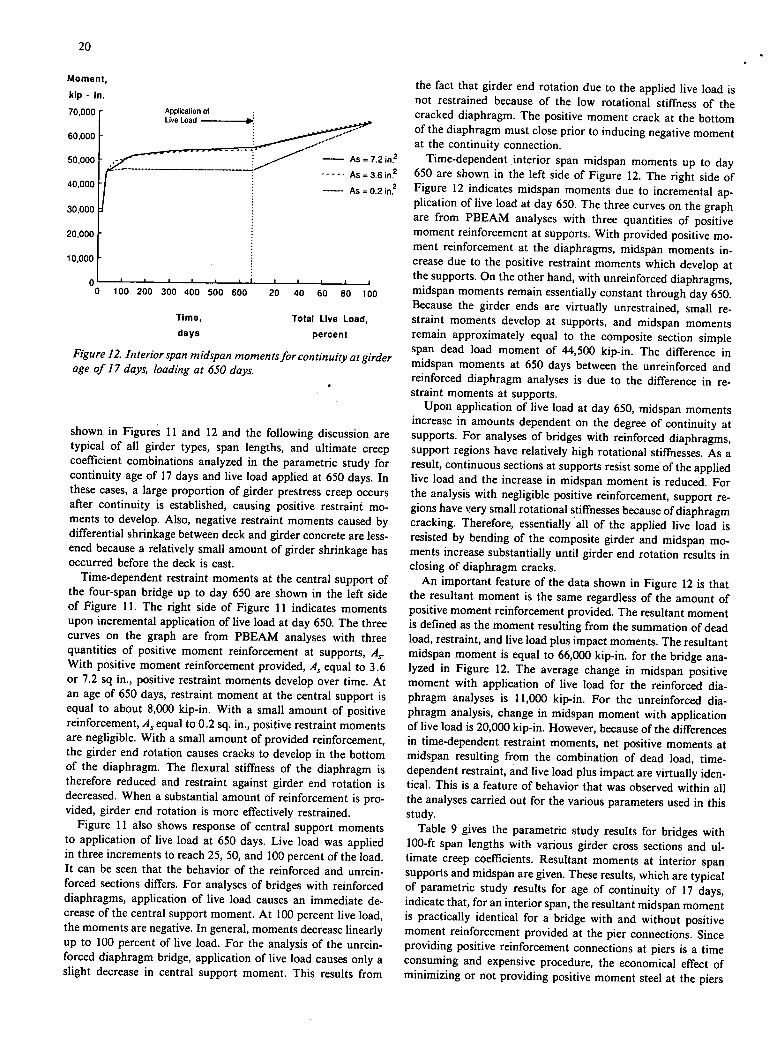
20
Moment,
kip - In.
70,000
60,000
50,000
40,000
30,000
20,000
10,000
0 I p p
0 100 200 300 400 500 600 20 40 60 80 100
Time, Total Live Load,
days percent
Figure 12. Interior span midspan moments for continuity at girder age of 17 days, loading at 650 days.
shown in Figures 11 and 12 and the following discussion are typical of all girder types, span lengths, and ultimate creep coefficient combinations analyzed in the parametric study for continuity age of 17 days and live load applied at 650 days. In these cases, a large proportion of girder prestress creep occurs after continuity is established, causing positive restraint mo- ments to develop. Also, negative restraint moments caused by differential shrinkage between deck and girder concrete are less-ened because a relatively small amount of girder shrinkage has occurred before the deck is cast.
Time-dependent restraint moments at the central support of the four-span bridge up to day 650 are shown in the left side of Figure 11. The right side of Figure 11 indicates moments upon incremental application of live load at day 650. The three curves on the graph are from PBEAM analyses with three quantities of positive moment reinforcement at supports, As. With positive moment reinforcement provided, As equal to 3.6 or 7.2 sq in., positive restraint moments develop over time. At an age of 650 days, restraint moment at the central support is equal to about 8,000 kip-in. With a small amount of positive reinforcement, A. equal to 0.2 sq. in., positive restraint moments are negligible. With a small amount of provided reinforcement, the girder end rotation causes cracks to develop in the bottom of the diaphragm. The flexural stiffness of the diaphragm is therefore reduced and restraint against girder end rotation is decreased. When a substantial amount of reinforcement is pro-vided, girder end rotation is more effectively restrained.
Figure 11 also shows response of central support moments to application of live load at 650 days. Live load was applied in three increments to reach 25, 50, and 100 percent of the load. It can be seen that the behavior of the reinforced and unrein-forced sections differs. For analyses of bridges with reinforced diaphragms, application of live load causes an immediate de-crease of the central support moment. At 100 percent live load, the moments are negative. In general, moments decrease linearly up to 100 percent of live load. For the analysis of the unrein-forced diaphragm bridge, application of live load causes only a slight decrease in central support moment. This results from
the fact that girder end rotation due to the applied live load is not restrained because of the low rotational stiffness of the cracked diaphragm. The positive moment crack at the bottom of the diaphragm must close prior to inducing negative moment at the continuity connection.
Time-dependent interior span midspan moments up to day 650 are shown in the left side of Figure 12. The right side of Figure 12 indicates midspan moments due to incremental ap-plication of live load at day 650. The three curves on the graph are from PBEAM analyses with three quantities of positive moment reinforcement at supports. With provided positive mo-ment reinforcement at the diaphragms, midspan moments in-crease due to the positive restraint moments which develop at the supports. On the other hand, with unreinforced diaphragms, midspan moments remain essentially constant through day 650. Because the girder ends are virtually unrestrained, small re-straint moments develop at supports, and midspan moments remain approximately equal to the composite section simple span dead load moment of 44,500 kip-in. The difference in midspan moments at 650 days between the unreinforced and reinforced diaphragm analyses is due to the difference in re-straint moments at supports.
Upon application of live load at day 650, midspan moments increase in amounts dependent on the degree of continuity at supports. For analyses of bridges with reinforced diaphragms, support regions have relatively high rotational stiffnesses. As a result, continuous sections at supports resist some of the applied live load and the increase in midspan moment is reduced. For the analysis with negligible positive reinforcement, support re-gions have very small rotational stiffnesses because of diaphragm cracking. Therefore, essentially all of the applied live load is resisted by bending of the composite girder and midspan mo-ments increase substantially until girder end rotation results in closing of diaphragm cracks.
An important feature of the data shown in Figure 12 is that the resultant moment is the same regardless of the amount of positive moment reinforcement provided. The resultant moment is defined as the moment resulting from the summation of dead load, restraint, and live load plus impact moments. The resultant midspan moment is equal to 66,000 kip-in. for the bridge ana- lyzed in Figure 12. The average change in midspan positive moment with application of live load for the reinforced dia-phragm analyses is 11,000 kip-in. For the unreinforced dia- phragm analysis, change in midspan moment with application of live load is 20,000 kip-in. However, because of the differences in time-dependent restraint moments, net positive moments at midspan resulting from the combination of dead load, time-dependent restraint, and live load plus impact are virtually iden-tical. This is a feature of behavior that was observed within all the analyses carried out for the various parameters used in this study.
Table 9 gives the parametric study results for bridges with 100-ft span lengths with various girder cross sections and ul-timate creep coefficients. Resultant moments at interior span supports and midspan are given. These results, which are typical of parametric study results for age of continuity of 17 days, indicate that, for an interior span, the resultant midspan moment is practically identical for a bridge with and without positive moment reinforcement provided at the pier connections. Since providing positive reinforcement connections at piers is a time consuming and expensive procedure, the economical effect of minimizing or not providing positive moment steel at the piers
.2 in 2
3.6 in 2
3.2 in

should be considered in the design procedure of multispan bridges consisting of precast, prestressed girders made contin-uous.
The results in Table 8 also show influences of girder type and creep coefficient on behavior of this type of bridge. The four girders used in the parametric study represent a range of cross-sectional areas in use for medium to long span bridges. As may be noted in Table 9, sections with larger areas and as a result, larger dead loads, have larger resultant midspan moments. These range from about 30,000 kip-in. for BT72/6 to about 48,000 kip-in. for the box section. Higher ultimate creep coefficients result in more positive restraint moments at the supports. Also, upon application of live load, the girders with higher creep have more positive resultant moments at supports and midspan.
Continuity Connection Effects for Negative Moment. Results of the analyses indicate that negative restraint moments can develop in the diaphragms at the supports, dependent primarily on the age of the girder when the diaphragm and deck are cast. The maximum resultant negative moment that can develop de-pends on the differential age between the girder and deck, and on the age of the bridge when live load is applied. Figure 13 shows typical time-dependent restraint moments at the center support for a bridge with continuity made by casting the deck and diaphragm at a girder age of 67 days. The data shown in Figure 13 are for AASHTO-IV girders with 100-ft spans and ultimate creep coefficient of 1.625. This figure is typical of parametric study results for a late age of continuity of 67 days with deck and diaphragm cast simultaneously, regardless of girder type, ultimate creep coefficient, and amount of positive reinforcement at supports. High negative restraint moments de-velop initially due to differential shrinkage between the cast-in-place deck and the precast girder. At the age of 67 days, a large portion of girder concrete shrinkage has occurred. Therefore, the difference between deck shrinkage and remaining girder shrinkage is large and dominates restraint moment development immediately after continuity is established. As time progresses, creep reduces the large initial negative restraint moments. Figure 14 shows resultant moments at the center support for live load applied at 100 days and 650 days. It can be seen that negative resultant support moments are higher for the earlier age of loading. At 100 days, resultant moment at the central support
Table 9. Resultant moments from parametric study-100.ft spans, gir-der age at continuity 17 days, age at loading 650 days.
Ultimate Positine Resultant Moment . k%-in. At
Support B At
Midspun At
Support C Girder Type
Creep Coefficient
Reinforcement, in.2
AASHTO-9t 3.25 7.2 2940 39.200 -4750 0.2 490 40,200 - 160
1.625 7.2 -960 36.000 -7150 0.2 -400 36,600 -6500
BT72/6 3.25 7.2 -100 31.100 -6750 0.2 1100 31,900 -6310
1.625 7.2 -3130 28.600 -8700 0.2 -2110 29,200 -8390
AASHTO-IV 3.25 7.2 4370 35.800 -3930 0.2 320 36,000 400
1.625 7.2 1230 33.300 -5900 0.2 230 33.900 -3680
Boo 3.25 7.2 7230 48.800 -5790 0.2 -640 47.700 40
is —15,300 kip-in.; and at 650 days, the resultant moment is - 10,800 kip-in. There is a corresponding difference in resultant midspan moments for live load applied at the different ages.
Table 10 gives parametric study results for an interior span. Support and midspan resultant moments are listed for 100-ft and 130-ft girder lengths for various girder sections and ultimate creep coefficients. It can be seen that different amounts of pos-itive reinforcing steel at supports have a negligible effect on resultant support and midspan moments. Because the positive reinforcing steel is in the compression zone of the section under negative moment, varying amounts of reinforcement have a small effect on bending stiffness. For a given girder type and span length, PBEAM predictions given in Table 9 indicate that resultant moments are independent of ultimate creep coefficient for age of continuity of 67 days and live loading at 100 days. This is because early age restraint moments are dominated by the negative restraint moment contribution of differential shrink-age.
Total Live Load, percent Time, days
0 100 200 300 400 500 600
I I I I I I
0 20 40 60 80 100
0 I I I I
Girder Age at
-4000 Loading 650 days
Moment, Girder Ageat
-8000
kip-in. Loading 1oading 100 days
.12000
— — — — .16000
4000
Moment,
kip-in.
-8000
-12000
Figure 13. Central support restraint moments for continuity at Figure 14. Central support resultant moments for continuity at girder age of 67 days. girder age of 67 days, loading at 100 days and 650 days.

22
Table 10. Resultant moments from parametric study-girder age at Table 11. Resultant moments for various girder ages at establishment continuity 67 days, age at loading 100 days. of continuity.
Span Ultimate Positlee Resultant Moments. kip-in. Girder
Type length,
ft Creep
Coefficient Reinforce- ment, in.2
At Support B
At Mldspan
At Support C
AASHTO-1V 100 3.25 1.2 -16100 19.800 -15,500 0.2 -16.000 20.000 -15,300
1.625 1.2 -16,100 19.800 -15,500 0.2 -16.000 20.000 -15,300
8112/6 100 3.25 1.2 -16.800 18,500 -15,200 0.2 -15,100 19.300 -15.200
1.625 1.2 -16,500 18,700 -15.000 0.2 .14,900 19.500 -15,100
Boo 100 3.25 7.2 -30.300 19,000 -27.900 0.2 -29.400 19,100 -27,200
AASHTO-V1 130 3.25 7.2 -19.200 46,000 -20.400 0.2 -18.700 46.500 -20.000
1.625 7.2 -19.200 46.000 -20.400 0.2 -19,000 46,300 -20.200
8112/6 130 3.25 1.2 -17,100 38.700 .18,400 0.2 -15.200 39,600 -18,500
1.625 1.2 -76,400 38.500 .19,400 0.2 -15.800 39.000 -19.000
Table 11 presents the effects of increasing the girder age prior to casting the diaphragm and deck. These results are for analyses of AASHTO-VI girders of 130-ft span with ultimate creep coef-ficient of 1.625. Each of these runs was made with positive moment reinforcing steel of 0.2 sq in. With increasing girder age at continuity, negative resultant moments at the supports increase by about 50 percent for continuity at 320 days compared to 67 days. The corresponding decrease of the midspan resultant moment is about 20 percent. There is a structural advantage gained for design of the prestressed girders for positive midspan moment by delaying casting of the diaphragms and deck. How-ever, construction of the bridge is then delayed. Also, the design moment for negative reinforcement in the deck over the supports is increased and the potential for transverse cracking in the deck is increased by delaying construction.
If live load is applied relatively soon after continuity is es-tablished for late girder age, high negative service moments at supports will develop. In several of the analyses conducted for the parametric study, the negative cracking moment as defined by AASHTO (14) Eq. 8-2 was exceeded. In this situation, the flexural stiffness at negative moment regions is reduced from the gross section value to a cracked section value, as shown in Figure 15(a). Resultant negative moments at a cracked section are less than the elastic moments determined assuming stiffness of the gross cross section. This can be seen in Figure 15(b), which shows negative moment upon application of live load for a PBEAM analysis of an AASHTO-IV girder. After negative moment cracking occurs, the negative moment does not increase significantly above the cracking moment. Therefore, negative moment continuity is reduced when negative moments exceed the cracking moment. Based on the parametric study results for girders with restraint moment at or above cracking, the resultant moments with application of live load and impact can be ex-pected to reach approximately 125 percent of the cracking mo-ment.
The data in Figures 13 and 14 and Tables 9 and 10 are for girders with a relatively low creep coefficient. As indicated in
Girder Age at Continuity,
Girder Age at Loading,
Resultant Moments, kip-in.
At At At Days Days Support B Midspan Support C
61 100 -19,000 46,300 -20.200
91 130 -21,200 42,900 -24,700
190 230 -25.300 40.200 -26.100
320 350 -29,900 36.000 -29.100
Figure 13, the restraint moment may remain negative for the life of the structure. The response will be as a fully continuous girder for application of live load. As shown in Figure 16, with high creep values and/or earlier age of girder at the time of casting the diaphragm and deck, the restraint moment can be-come positive at late ages. At this time, some degree of effective continuity will be lost either because the positive restraint mo-ment adds to the midspan moment or because of diaphragm cracking that must be closed with application of live load before inducing negative moments at the support.
Effects of Construction Sequence. Restraint moments at sup-ports of bridges constructed of simple span prestressed girders made continuous are highly dependent on the timing of con-struction. The primary factor is girder age at the time continuity is established by construction of the cast-in-place deck and the diaphragm. However, the sequence of deck and diaphragm con-struction, either simultaneous or one before the other, also af-fects the development of restraint moments.
From the responses to the questionnaire, actual construction sequences fell into three general categories: deck and diaphragms
Moment
Mcr
Rotot ion
Uscracked and Cracked Stiffness
500r Time, days Total Live Load, percent
50 20 40 60 80 100
Moment, Alp-ft -500
F\
rApplication of
Live Load
\Computer 24%
I Elastic-'
Typical Results of PBEAM Analyses
Figure 15. NegUtive moment cracking.

23
cast simultaneously, deck cast before diaphragms, and dia-phragms cast before deck. In some cases, respondents indicated that portions of the deck in positive moment regions were cast before the deck in negative moment regions and diaphragms. For purposes of the parametric study, the majority of PBEAM runs were conducted for the deck and diaphragm cast simul-taneously at girder ages of 17 days or 67 days. Resultant mo-ments from PBEAM analyses for the deck cast before the diaphragms and the diaphragms cast before the deck are com-pared to the results for simultaneous casting in Table 12. The girder age at continuity is the age at which the diaphragm is cast. The analyses for the data in Table 12 were made for AASHTO-IV girders of 100-ft span length with ultimate creep coefficient equal to 1.625. For all PBEAM runs, the deck is cast over the full length of the girder at the indicated time.
The results in Table 12 show that for the construction se-quence of the deck cast before the diaphragm compared to simultaneous casting, resultant moments at the supports and midspan have a higher positive value for both 17-day and 67-day continuity. This may be seen by comparing runs 1 and 2 with runs 6 and 7, and by comparing runs 3 and 4 with runs 8 and 9. When the deck is cast before the diaphragm, the two components contributing to negative restraint moments are re-duced. When the deck is cast, girder end rotation due to the additional dead load of the deck is unrestrained. More impor-tantly, end rotation due to differential shrinkage between the deck and girder is unrestrained until the diaphragm is in place. As a result, the negative restraint moment component and the potential for transverse cracking in the deck are reduced. In turn, resultant moments after application of live load have a higher positive value, as shown in Table 12.
C Girder Age at Continuity
4000 r ldaysTIme, days -
100 200 300 ' 500 600
Moment 4000 kip-In.
-8000 Girder Age at Continuity 67 days
-12000 L
Figure 16. Central support restraint moments for continuity at girder age of 37 days and 67 days.
When the diaphragm is cast before the deck, resultant mo-ments are only slightly affected. For run 11 with a girder age at continuity of 67 days and deck cast at 74 days, results for loading at 100 days are virtually identical to run 3 with simul-taneous deck and diaphragm casting. Comparing run 12 with run 5 for loading at 650 days, however, the resultant positive moment at midspan is reduced slightly by casting the diaphragm 7 days before the deck. For early age of continuity with the diaphragm constructed before the deck, run 10, resultant mo-ments have a higher negative value than run 2 with deck and diaphragm cast simultaneously. With the construction sequence of diaphragm before deck, the diaphragm has attained a higher strength at the time the deck is cast. Therefore, the diaphragm
Table 12. Resultant moments for various construction sequences.
Construction Run Girder Age Girder Girder Resultant Moments, kip-In.
Sequence No. at Deck Age at Age at Positive
At At At Casting,
Days Continuity,
Days Loading,
Days Reinforcement,
In.2 Support B Midspan Support C
Deck and 1 11 17 650 1.2 1230 33300 -5900
Diaphragm 2 11 11 650 0.2 230 33900 -3680
Simultaneous 3 67 61 100 7.2 -16100 19800 -15500
4 67 61 100 0.2 -16000 20000 -15300
5 67 61 650 0.2 -11100 24400 -10800
Deck Before 6 10 11 650 7.2 5320 37600 -3400
DIaphragm 7 10 11 650 0.2 390 36000 490
8 67 14 100 1.2 -14200 22700 -11600
9 67 74 100 0.2 -13900 23000 -11300
DIaphragm 10 11 10 650 0.2 -490 31700 -7330
Before Deck 11 74 67 100 1.2 -16300 19800 -15400
12 74 67 650 1.2 -13200 23200 -11700

24
resists some negative moment induced by the deck dead load and develops higher negative restraint moment from differential shrinkage between the newly cast deck and the restrained girder. The end result is that restraint moments and resultant moments after application of live load have a somewhat higher negative value. This sequence increases the probability of establishing full continuity and reducing resultant positive moments at mid-span but only slightly. In turn, the potential for transverse deck cracking is slightly increased.
FLEXURAL STRENGTH
In a continuous bridge structure, the maximum strength is reached when a full mechanism develops after redistribution of moments. When the mechanism forms, the structure theoreti-cally has no resistance to additional load and failure occurs. Ideally, a bridge girder should be designed to be capable of attaining the full mechanism state without premature failure of connections in order to obtain a maximum safety margin against collapse of the bridge.
For an interior span of a continuous bridge, a full mechanism occurs when plastic hinges develop at each support and near midspan. Depending on the configuration of load and relative positive moment and negative moment structural resistance, the first plastic hinge(s) will form at the supports or near midspan. After the occurrence of the first hinge(s), the yielded region(s) must possess adequate ductility to allow the redistribution of moments until the full mechanism is formed.
If the ratio of negative to positive moment capacity is equal to the ratio of negative to positive elastic moment under the given loading, hinges will form simultaneously in positive and negative moment regions at the maximum load. In this case, the required inelastic rotation at the central support will be zero. When the ratio of negative to positive moment capacity is less than the ratio of elastic moments, the negative moment hinge will form first. The required inelastic rotation at the central support will then be dependent on the ratio of negative to positive moment capacity. As the ratio of moment capacities approaches the ratio of elastic moments, the rotational demand decreases. Therefore, for a given continuous bridge configuration in which negative moment hinges form first, a lightly reinforced section at the supports will require more ductility than a heavily rein-forced section to form a full mechanism under the maximum load.
In a bridge constructed of prestressed concrete girders with a composite cast-in-place deck, the positive moment region within the span is inherently much more ductile than the neg-ative moment region at the supports. The large compressive area of the concrete deck in the positive moment region ensures that yielding of prestressing steel occurs before crushing of concrete. As a result, the positive moment region reaches its flexural strength after a large amount of deformation, giving adequate warning of failure. The negative moment region has only the bottom flange area and web of the prestressed girders available for compression. Because of this relatively small compression area, crushing of concrete in the bottom of the girder can occur before yielding of the reinforcement in the deck, particularly for heavily reinforced decks. This type of failure is brittle, with little or no deformation prior to failure. If brittle failure of negative moment regions occurs before the positive moment
capacity is reached, the full mechanism will not form and the maximum strength of the span will not be reached. In order for sufficient redistribution of moments to occur to form the full mechanism and to avoid brittle failures, adequate negative moment ductility must be provided.
The current AASHTO Specifications (14) Article 9.7.2.3.2 implies a critical value for deck reinforcement ratio, p = A51 bd, of 0.015. It appears that this value is based on testing (6) that included 40 ksi deck reinforcement, 5,000 psi to 6,000 psi concrete, and an AASHTO-type girder. Therefore, an investi-gation of negative moment ductility which included effects of variations in deck reinforcement yield strength, concrete com-pressive strength, and relative girder bottom flange area was needed.
This section of the report describes parameters and results of an analytical study conducted to investigate the effects of varying amounts of negative moment reinforcement, various girder bot-tom flange configurations, and varying material properties on the negative moment ductility of composite deck-girder sections. Results of the study are used to establish criteria to limit the amount of reinforcement in the deck to ensure ductile behavior.
Analytical Study
The two main parameters used in the study were size and shape of girder bottom flange and amount of negative moment reinforcement. Figure 17 shows the five girder sections used: California 66, BT72/6, AASHTO-IV, AASHTO-VI, and BIV-48. These girders represent a range of girder bottom flange configurations in current use. The California 66 and BT72/6 girders represent deep girders with a small bottom flange area. The AASHTO-IV, AASHTO-VI, and BIV-48 are girders with large bottom flange areas. Girder bottom flange areas range from 27 percent to 46 percent of the total girder area for BT72/ 6 and AASHTO-IV, respectively. Negative moment reinforce-ment areas of 8, 16, and 24 sq in. were used for each of the girders analyzed. Reinforcement ratios based on width of compression flange and depth to reinforcement ranged from 0.0036 to 0.0109 for BIV-48 up to 0.0060 to 0.0 180 for California 66. All five girders with three amounts of deck reinforcement were analyzed with girder concrete compressive strength of 6,500 psi and deck steel yield stress of 60,000 psi. Analyses were also conducted with 5,000 psi concrete and 40,000 psi deck steel to investigate the influence of material properties on ductility.
Results of Analytical Study
Program WALL_HINGE (57) was used for the study of negative moment ductility. The program generates information about elastic and inelastic behavior of girder sections up to failure. Program results include bending moment, shear force, steel and concrete stresses and strains, neutral axis depth, de-formation and mode of failure. Deformation results include rotation at selected locations. To evaluate rotational ductility of analyzed sections, rotations at a distance equal to d away from the support were used. The distance d is the distance from the bottom of the compression flange to the centroid of deck reinforcement. This length was taken as representative of the length of the post-yield hinging region.

All Dimensions In Inches 1 In. = 25.4 mm
BIV-48
25
10
19 J,.
California 66
An
BT72/6
28
AASHTO—Vl
AASHTO—IV
Figure 17. Girder sections for flexural strength study.
Figure 18 shows typical moment-rotation relationships from WALL_HINGE analyses. Comparisons of WALL_HINGE analyses to test results from Ref. 6 are presented in Chapter Two.
Required Rotations. Calculated rotation capacities from the WALL_HINGE program were compared to required rota-tions developed using an analysis method presented by Park and Paulay (58). Initially, analyses were made with PBEAM to attempt to define required rotations. However, results indi-cated that PBEAM was not reliable in finding convergence at high load levels when flexural hinges were forming and slopes of material stress-strain relationships were relatively flat. There-fore, the analysis method presented by Park and Paulay (58), with a constant effective flexural rigidity calibrated against PBEAM results, was used to define required rotations. This method is further described in the remainder of this section.
7500
5000
Moment, hip-ft
2500
ow I 0 0.005 0.01 0.015
Rotation, rodlons
Figure 18. Moment versus rotation from WALL_HINGE anal-yses.

26
Required rotations were calculated for the central support of a two-span continuous beam. Each span was loaded with uni-form load and a single point load with relative magnitudes conforming to AASHTO-HS lane loading as shown in Figure 19(a). Under these conditions, with typical ratios of negative to positive moment capacity, the first hinge will form at the central support, as shown in Figure 19(b). The required hinge rotation, 8,. in Figure 19(c), is the change in slope at the central support determined from an elastic analysis of the maximum load condition. The maximum load condition causes formation of the failure mechanism. The required rotation is determined by assuming a frictionless hinge at the central support and calculating the rotation at the support under the combination of maximum external load and the negative maximum moment at the interior support hinge. This method is based on the following assumptions. The moment-curvature relationships for positive and negative moment are bilinear, with post-yield mo-ments constant and equal to flexural strength moments. An effective flexural rigidity, El, is assumed to be constant over the entire girder length.
Following is the derivation of the expression used to calculate 0,. for girders analyzed in this study. The rotation at the central support under maximum load is:
L [wu L 2 +
M'EI 24
1 0r=X
16 --i-i (3)
The terms used in Eq. 3 are defined in Figure 19. The ultimate load is assumed to be a multiple of AASHTO lane loading. Therefore, w, is proportional to 0.64 kip/ft and P, is propor-tional to 18 kip, and
wu = F/28.125 (5)
Substituting this into Eq. 3 gives
L X [PuV+PUL— ----]
M'dl 16
x12 (6) El 675
where L is in feet, moment is in kip-ft, and other quantities are in inches and kips. Assuming that the positive moment hinge forms under the point load at midspan:
M PL +
WUL2 MIU -
8 2
= + - 225 2
PL = (M + M'/2)/(L/225 + 1/) (9)
Substituting PL into Eq. 6 gives the expression for required rotation, 0
O = I/Ma 1' (L/675 + '/16) .!] x 12 (10)
El [ic + ) (L/225 + ¼) - 3
It can be seen from the expression for 0r that the required central support rotation depends on the magnitude of the con-stant El, the magnitudes of positive and negative moment strengths, and span length. Where possible, values selected for calculation of °r were chosen to produce a conservative (large) estimate of required rotation. Rotational demand increases with decrease of El and increase of span length.
Values for flexural regidity, El, were calculated using a weighted averaging procedure which gave conservative values compared to results of PBEAM analyses. As suggested by AC! 318-83 (68) Section 9.5, a weighted average of El values from positive and negative moment regions can be used to represent a constant flexural rigidity. Several PBEAM analyses were con-ducted in which girders were loaded to a level well beyond the load producing yielding of support regions. An average value of El was computed from elastic deflection equations using midspan deflection of a loaded interior span, applied external loads, and changes in support moments. This calculated average El was considered an effective constant El for the span.
Based on the PBEAM analyses, a conservative value for the effective El for use in calculating required rotation was deter-mined to be the sum of 80 percent of the gross composite section El and 20 percent of the elastic cracked section negative moment El from WALL_HINGE results.
Span lengths were chosen to be near the upper end of the feasible span range for a particular girder.
Positive moment capacities, M, were calculated using AASHTO procedures for a quantity of prestressing strands con-sistent with the chosen span length. Positive moment capacities used to calculate required rotation were reduced by the service dead load simple span moment due to girder and deck weight. This accounts for the fact that positive live load plus impact moments are superimposed on the simple span dead load mo-ment. The discontinuity in slope at the support due to deck and girder dead load is accommodated in the casting of the dia-phragm.
Negative moment capacities, M's, were calculated using AASHTO procedures for each girder with 8, 16, and 24 sq in. of deck reinforcement. Negative moment capacities calculated using AASHTO procedures agreed well with WALL_HINGE results. Negative moment capacities for use in calculating re-quired rotation were reduced to 80 percent of calculated values. This accounts for a possibility of negative restraint moment equal to 20 percent of the strength existing at the support before application of live load.
Resulting ratios of reduced negative to reduced positive mo-ment capacity used for calculating required rotations ranged from 0.18 to 1.14.
For the two-span bridge with AASHTO-HS lane loading, the ratio of elastic negative support moment to midspan positive moment is about 1.66 for span lengths considered here. There-fore, negative moment hinges form first for all cases analyzed in this study.
Rotation Capacity. Table 13 gives required central support rotation, 0,., and rotation capacities, 0,., calculated at a distance d from the support using Program WALL_HINGE. Calcu-lated required rotations, 0,., averaged 0.007, 0.005, and 0.004 radians for 8, 16, and 24 sq in. of deck reinforcement, respec-tively. Both required rotations and rotation capacities decrease with increasing amounts of deck reinforcement. In only one

x .64 IL ft
a) Two Span Model with AASHTO Lane Load
12 - Load Ratio at Formation of Failure Mechanism
- Ratio of Total Load to AASHTO Lane Load
= Load Ratio at Formation of Negative Moment Hinge
27
I /2 ,f18k Symmetric
Negative Moment Hinge
ft - klp
Forms. Moment,
=1
Mechanism Forms When Positive Moment Hinge Forms, CC 2>
b) Moment Diagram at Various Load Stages
Pu M6 at Negative
ale Or
Shape Mu at Positive Moment Hinge 7
C) Idealized Model at Maximum Load Capacity
Figure 19. Model for negative moment ductility study.
case, BT72/6 with 24 sq in. reinforcement, is required rotation greater than rotation capacity.
Table 14 lists ratios of rotational capacities from WALL_HINGE divided by required rotations; ultimate cur- vature, 4, divided by yield curvature, ; and reinforcement ratio, p, divided by balanced reinforcement ratio, Pb' for each analysis. Rotation ratio is calculated from data in Table 13. The ratio of curvatures or ductility ratio was determined from WALL_HINGE results by dividing rotation at the ultimate moment by rotation at yield of deck reinforcement. Since average curvature can be obtained by dividing rotations at d from the support by the distance d, the ratio of ultimate to yield rotations is equal to the ratio of ultimate to yield curvatures.
The typical failure mode for these analyses was flexural compression, in which yield of deck reinforcement was followed by crushing of compression zone concrete. As can be seen by
examining the data in Table 14 and the example output in Figure 18, girders with larger bottom flange areas, such as AASHTO-VI, are much more ductile than sections with small bottom flange areas, such as BT72/6. The ratio of calculated to required rotation, °c/°r. averages 2.2 for AASHTO-VI and 1.1 for BT72/6. The ductility ratio, 4/4, averages 6.0 for AASHTO-VI and 2.9 for BT72/6.
The data in Table 14 show that for a given area of deck reinforcement, use of lower strength girder concrete reduces ductility. With lower strength girder concrete, a larger compres-sion zone is required to equilibrate the force in the yielded deck reinforcement. For a given area of deck reinforcement, use of Grade 40 deck reinforcement significantly increases ductility, as shown by rotation ratio and ductility ratio values in Table 14. The compression zone is required to equilibrate a signifi-cantly lower force when deck reinforcement yields. As a result,

28
Table 13. Rotation at central support-required and WALL......Hinge results.
Deck Reinforcement, In.2
Span Concrete Deck Reinf. 8 16 24
Length, Strength, YIeld, Girder ft psi pi 0r'
rad. 0, rad. o, rad. 0, rad. 0r' rad. rad.
Cal. 66 100 6500 60000 0.0054 0.0103 0.0035 0.0060 0.0021 0.0039
AASHTO-IV 100 6500 60000 0.0075 0.0116 0.0055 0.0091 0.0039 0.0015
AASHTO-VI 130 6500 60000 0.0016 0.0185 0.0059 0.0126 0.0045 0.0096
8112/6 130 6500 60000 0.0076 0.0097 0.0054 0.0069 0.0037 0.0028
RIV-48 90 6500 60000 0.0080 0.0180 0.0058 0.0131 0.0040 0.0061
Cal. 66 100 5000 60000 0.0061 0.0093 0.0040 0.0045 0.0026 0.0029
AASHTO-IV 100 5000 60000 0.0085 0.0096 0.0062 0.0082 -- --
Cal. 66 100 6500 40000 0.0061 0.0162 0.0049 0.0108 0.0039 0.0060
AASHT0-IV 100 6500 40000 0.0083 0.0186 0.0069 0.0109 0.0058 0.0081
Table 14. Comparison of rotation and ductility ratios.
Concrete Deck Reinf. Deck Reinf. Rotation Ductility Strength. Yield. Area. Ratio. Ratio, P'Pb
Girder psi psi in.2 ec/er u/y - Cal. 66 6500 60,000 8 1.91 5.2 0.27
16 1.71 3.3 0.54 24 1.86 1.4 0.81
AASHTO-IV 6500 60.000 8 1.55 5.4 0.20 16 1.65 4.1 0.41 24 1.92 3.1 0.61
AASHTO-V1 6500 60.000 8 2.43 8.4 0.17 16 2.14 5.5 0.33 24 2.13 4.2 0.50
8172/6 6500 60,000 8 1.27 4.7 0.26 16 1.28 3.0 0.52 24 0.76 1.0 0.78
819-48 6500 60,000 8 2.25 8.3 0.21 16 2.36 6.0 0.41 24 1.68 2.6 0.63
Cal. 66 5000 60,000 8 1.52 4.4 0.33 16 1.13 3.0 0.66 24 1.12 0.9 0.99
AASHTO-IV 5000 60,000 8 1.13 4.5 0.25 16 1.33 3.5 0.50
Cal. 66 6500 40.000 8 2.66 11.6 0.16 16 2.20 6.2 0.33 24 1.54 3.4 0.49
AASHTO-IV 6500 40.000 8 2.24 12.8 0.13 16 1.58 7.5 0.25 24 1.50 5.5 0.38
prior to failure the compression zone can accommodate more deformation and force as strain hardening of deck steel occurs.
Use of the reinforcement ratio p without consideration for cross-sectional shape or material strengths is not a particularly good indicator of ductility. The ratio of p to Pb was considered likely to be a better indicator in that Pb includes the effects of
.f f', and cross-sectional shape as follows. The reinforced concrete section which resists negative moment at supports con-
sists of bottom flange and web concrete in compression and deck reinforcement in tension. In calculating the balanced re-inforcement ratio, the actual compression area of concrete in the bottom flange and web must be used. At the balanced condition, the extreme compression fiber is assumed to reach a strain of 0.003 at the same time as deck reinforcement reaches yield strain. The effects of reinforcement and prestressing strand in the bottom flange are neglected. Using the assumed linear strain distribution, the compression block depth can be deter-mined from the neutral axis depth.
87,000 Xb =
87,000 (11)
where: 81 = factor defining depth of compression block, from ACI 3 18-83 Section 10.2.7.3 (68); f, = steel yield stress, psi; and d = depth from extreme compression fiber to centroid of deck reinforcement, in
The balanced reinforcement ratio, Pb' can then be calculated:
0.85 f' A1 + (Xb-hftW) Pb fbd
where: f',, = girder concrete compressive strength, psi; A1 = cross-section area of bottom flange, up to junction with web, sq in.; Xb = depth of compression block, in.; h1 = depth of bottom flange, up to junction with web, in.; t,,, = web thickness, in.; f = steel yield stress, psi; b = width of bottom flange, in.; and d depth from extreme compression fiber to centroid of deck reinforcement, in.
Design Implications. Requirements of ACI 318-83 Section 8.4.3 (68) limit reinforcement ratio for continuous nonpres-tressed flexural members to 0.5 times the balanced reinforcement ratio if moment redistribution is to be allowed. Therefore, a reinforcement ratio of 0.5 times Pb was investigated as a possible limit to ensure sufficient ductility to form the full failure mech-anism in bridges of the type investigated in this study. In Figure 20, the ratio of rotation from WALL_HINGE results to re-

29
Aotation Duclility Ratio Ratio
California 66 14.0 California 66
3.0 0 AASHTO-IV 0 0 AASHTO-IV
o AASHTO-Vl \ 12.0 , 0 AASHTO.Vf
BT72/6 \ BT72/6
A A BIV-48 10.0 BlV.48 0 \
2.0 . 0 8.0
'I \0
0
1.5 0 0 ' 0 6.0 A
0 • • fl 00
0
...........................................
. S 4.0
P , N
1.0 .......... 0 . S
- .................................................... .
2.0
0.5 00 •
0.0 0.2 0.4 0.6 0.8 1.0
0.0
0.0 0.2 0.4 0.6 0.8 1.0
Figure 20. Rotation ratio versus percentage of balanced rein-forcement ratio.
p/pb
Figure 21. Ductility ratio versus percentage of balanced rein-forcement ratio.
quired rotation, 0C'°r' is plotted versus the reinforcement ratio divided by Pb' The reinforcement ratio is calculated by dividing deck steel area by the product of bottom flange width and depth from extreme compression fiber to centroid of deck steel. No steel in compression zone was included. The single section with rotation less than required has a reinforcement ratio of 0.78 times balanced. The trend of the data is negatively sloped, but there is a large amount of scatter. All analyzed sections with less than 50 percent of the balanced reinforcement ratio theo-retically had adequate rotation to form the failure mechanism.
In Figure 21, the ductility ratio, 4/4 is plotted against the reinforcement ratio divided by Pb' The data show a strong trend of decreasing ductility with increasing percentage of bal-anced reinforcement ratio. The intersection of 0.5 times Pb and the best fit exponential curve occur at a ductility ratio of 3.4. All analyzed sections with reinforcement ratios less than or equal to 50 percent of the balanced reinforcement ratio had ductility ratios greater than or equal to 3.4. All analyzed sections with reinforcement ratios greater than 50 percent of the balanced had ductility ratios less than 3.4. Although all but one of the analyzed sections with reinforcement ratio greater than 50 per-cent of balanced reinforcement ratio theoretically have sufficient ductility to form a full failure mechanism, these failures will occur with a relatively small amount of deformation prior to failure. With deck, reinforcement limited to 50 percent of the balanced reinforcement ratio, composite girder-deck sections will have adequate rotation available to form the failure mech-anism and sufficient ductility to ensure that failure occurs with enough deformation to provide warning.
Table 15 contains limiting reinforcement ratios and deck steel quantities for the girder sections and material properties used in this study. Depth to reinforcement is girder depth plus 4 in.
It can be seen that limiting reinforcement ratios for Grade 60 deck steel are generally less than the limit of 0.015 implied in Section 9.7.2.3.2 of the 1983 AASHTO Code (14).
ANALYSIS PROCEDURES
Results of the questionnaire indicated that the method of design most commonly used was the method published by PCA (12). In this section of the report, the PCA method is described briefly and predicted moments using the PCA method and the computer program PBEAM are compared. New simplified com-puter programs developed in this project and proposed for use in calculating design moments are then presented.
Table 15. Deck reinforcement limits.
Girder
psi
f',. psi
Pmax O.S*pb
Maximum
6st in.2
Cal. 66 6500 60,000 0.0110 14.6
AASHTO-IV 6500 60.000 0.0130 19.6
AASHTO-VI 6500 60,000 0.0113 24.0
8112/6 6500 60.000 0.0084 15.3
81V-48 6500 60,000 0.0081 19.2
Cal. 66 5000 60,000 0.0091 12.1
AASHTO-IV 5000 60.000 0.0105 15.8
Cal. 66 6500 40.000 0.0183 24.3
AASHTO-IV 6500 40,000 0.0209 31.5

30
PCA Method
In current design practice, the PCA method developed by Mattock (12) is generally used for predicting restraint moments at supports. For this analysis, it is assumed that the distribution of moments and forces will change toward that which would have occurred if the loads applied to the individual elements before continuity was established had, instead, been applied to the structure after continuity was established. A similar ap-proach to account for time-dependent forces in continuous struc-tures built in stages is given in Ref. 31.
Using this method, the restraint moments due to dead load, prestress, and differential shrinkage between deck slab and girder are calculated. These moments are calculated for a continuous girder, assuming rigid connections between individual spans at the piers. Any convenient method for the analysis of statically indeterminate structures may be used.
The creep restraint moments are determined by multiplying the dead load and prestress moments by a coefficient ( 1 — e The coefficient 4) is the ratio of creep strain to elastic strain. The resulting restraint moments are those which will be caused eventually by creep of the precast girder after the creation of continuity.
Restraint moments due to differential shrinkage are deter-mined using a multiplier of (l—e)/4).
The restraint moments over piers are calculated as the sum of moments due to creep and differential shrinkage. The max-imum positive and negative moments due to live load and impact are determined from analysis of the girders as a fully continuous beam. The time-dependent restraint moments are superimposed on the live load and impact moments for design of the positive
Table 16. Comparison of restraint moment results using PCA method and PBEAM analysis.
Age at Continuity.
Days
Restraint Moment at 6, tip-ft
Restraint Moment at C, tip-ft
PCA PBEAM PCA PBEAM
11* 849 861 588 933 31* 105 253 491 341 61 302 -333 222 -188
11" 849 658 588 842
'Area of positive reinforcement • 1.2 sq in. "Area of positive reinforcement - 3.6 sq in.
Table 17. Comparison of resultant moments with application of live loads.
Age at Continuity.
Days
Momentat B, tip-ft
Moment at Midspan of BC, tip-ft
Moment at C. tip-ft
PCA PBEAM PCA PBEAM PCA PBEAM
11' 402 -195 5421 5458 -153 136 31' 258 -833 5301 4833 -850 -522 61' -145 -1525 4965 4343 -1119 -809
11** 402 -16 5421 5558 -153 158
'Area of positive reinforcement • 1.2 sq in. Area of positive reinforcement • 3.6 sq in.
moment connections at the supports and for design of the girder for positive midspan moments. The negative moment connec-tions are designed for the full negative moment due to live load and impact without consideration of the time-dependent re-straint moments. The PCA design procedure does not address design implications of situations in which negative restraint moments occur.
Comparison of PCA Method and PBEAM Analyses
The accuracy of the PCA method of design of continuous highway bridges with precast, prestressed concrete girders was evaluated using the computer program PBEAM (53). For the purpose of comparison, a sample calculation was taken from the PCA design procedure publication (12). The positive re-straint moments at piers due to creep and shrinkage, and neg-ative moments from live load plus impact, were calculated for a bridge with four 130-ft spans, shown in Figure 10(a). Degree of continuity was studied, assuming continuity connections are made at 17, 37 or 67 days after girder prestress release. Analyses were also carried out assuming a reduced amount of positive moment reinforcement and reduced tensile capacity of the con-crete in the continuity connection.
The following data from the PCA example were used: ex-posure at 50 percent relative humidity, ultimate shrinkage equal to 0.0006 in./in., ratio of creep strain per psi of stress to elastic strain per psi of stress with a continuity connection made at 28 days, 4) = 1.95, which corresponds to an ultimate 4) = 3.25. All other design criteria for the Type VI AASHTO girder used for this study are given in the PCA example (12). For evaluation of live load response, AASHTO HS20-44 lane load was applied at spans BC and CD only, as shown in Figure 10(a).
Results of the comparison between the PCA method and the time-dependent computer analyses are presented in Tables 16 and 17. Restraint moments at the cast-in-place connections at the Piers B and C are given in Table 16 for 650 days after casting the girder. Resultant moments, including live loads, in the girders at an age of 650 days are presented in Table 17.
As can be seen from Table 16, restraint moments at Support B for both methods are similar for the age at continuity of 17 days. However, as the age at continuity increases, so does the difference between the computer analysis and the PCA method. The same relationship between the restraint moment and the age of continuity can be seen at Support C. Both methods of analysis indicate a tendency of the positive restraint moment to decrease with the increased continuity age. However, the time-dependent computer analysis predicts significantly more change and reversal of sign of the restraint moment at age of continuity of 67 days. The largest absolute difference between the PCA method and time-dependent computer analysis results occurs at support B for the age at continuity of 67 days.
Differential shrinkage induces a negative restraint moment and creep induces a positive restraint moment. Therefore, the data in Table 16 demonstrate that differential shrinkage restraint moment becomes more influential with increasing age at con-tinuity and creep becomes less influential than is predicted by the PCA method. This has the effect of decreasing the proba-bility of positive moment cracking at the connection and avoid-ing the behavior illustrated in Figure 8. However, the probability of negative moment cracking at the connection is increased.
Comparison of resultant moments, including restraint mo-

31
ments and dead load plus live load plus impact moments at Supports B, C, and midspan for different ages at continuity, are shown in Table 17. The PCA method assumes that live load is applied to the elastic continuous structure. This elastic analysis does not consider the finite length of the connection nor does it consider the loss of stiffness with possible cracking in the connections. The negative moments over piers from live load plus impact shown in Figure 10(a) for the fully continuous beam are —447.0 kip-ft at B, and - 1,341 kip-ft at C.
The PBEAM computer analysis for live load plus impact applied at girder age of 650 days accounted for realistic stiffness of girders at this age, including finite length of the connection and the effects of cracking of the concrete in the connections. Comparing results from Table 16, the PCA method predicts the highest negative moment to occur at Support C for conti-nuity age of 67 days with a value of - 1,119 kip-ft. The computer solution shows the highest moment to be - 1,525 kip-ft and to occur at Support B. Even though there is a difference in the relative magnitude of negative moments at Support B and Sup-port C, it is interesting to note that maximum midspan moments are practically the same for two methods for the 17-day age of girder continuity. That may not be the case for a different structure. However, in this example, with increased age of con-tinuity of 37 days and 67 days, the value of midspan moments is higher and, therefore, more conservative when calculated by the PCA method. The data in Table 16 suggest that, although more negative moment reinforcement might be required, there is a potential for more economical design for positive moment in the prestressed girders depending on the age at continuity.
It should be noted, however, that the degree of continuity is not only dependent on the age at continuity but also on the age at application of service load. For age of continuity at 67 days, negative moment at C from PBEAM analyses changes from —809 ft-kip to - 1,225 ft-kip when loaded at 100 days rather than 650 days. This demonstrates that while long-term effects produce the more critical situation for design for positive mo-ments, short-term loading effects are more critical for negative moment.
To examine the effects of joint stiffness, comparable analyses were made assuming only one-half the amount of positive mo-ment reinforcement. The PCA sample calculation resulted in a required 7.20 sq in. of positive reinforcement. The girders were reanalyzed using only 3.60 sq in. of positive reinforcement. The results of PBEAM analysis for restraint moments and resultant moment with application of live loads are given in Tables 16 and 17. The moments predicted using the PCA method are not affected by the amount of positive moment reinforcement and are repeated in Tables 16 and 17 for comparison purposes. These data indicate that, for this example, the long-term positive re-straint moments are sensitive to the amount of positive rein-forcement provided. However, the net effect on the resultant midspan positive moments with live load is not significant.
Some of the factors that contribute to the differences in cal-culated restraint and resultant moments are discussed below. A major difference is that the PCA method assumes full structural continuity for calculation of moments. Supports at piers are considered to be ideal pin supports. The PBEAM analysis con-siders the finite length of the diaphragm between supported ends of adjacent girders. The PBEAM analysis also accounts for cracking of concrete and yielding of reinforcement as critical moment levels are reached. Therefore, a realistic stiffness of support regions is used in the determination of restraint and
resultant moments. The PCA method also has limitations in the handling of time-dependent effects. The design method in Ref. 12 does not incorporate up-to-date models for shrinkage and creep of concrete. PBEAM uses more recent models, such as that of AC! Committee 209 (17), for prediction of time-dependent behavior. Another advantage of PBEAM's analysis is that separate time-dependent functions can be used for deck and girder concrete shrinkage. The PCA method uses the same time-dependent curve for both deck and girder concrete shrink-age. The PBEAM analysis incorporates an incremental analysis using the method of superposition. This allows the time history of behavior to be studied. The PCA method is configured to produce restraint moments at one point in time rather than a complete history. Also, the shrinkage restraint moment com-ponent in the PCA method is defined by an equation which does not correctly account for compatibility between the girder and deck as shrinkage occurs. This is correctly accounted for in the analyses using PBEAM. These factors contribute todif-ferences in moments shown in Tables 16 and 17 for PBEAM and PCA method results. Also, Ref. 12 does not include con-sideration of negative restraint moments in the design procedure.
Computer Programs for Proposed Analysis Procedures
Determination of time-dependent effects for this type of bridge is a necessary part of analyzing behavior of the structure. The degree of continuity to be counted on for reduction of midspan live load plus impact moments can vary from essentially zero to fully continuous, depending on time-dependent effects and construction timing and sequence. In order to determine design moments for service conditions, restraint moments due to creep and shrinkage should be evaluated to determine the appropriate degree of structural continuity. The current restraint moment analysis method from PCA's design procedure (12) has been shown to have shortcomings. The computer program PBEAM is capable of carrying out the complex analyses accounting for the time-dependent effects. However, use of PBEAM is very cumbersome, time consuming, and requires a large amount of computer memory. There was a need for an improved simplified analysis procedure for use in design.
One of the complex time-dependent effects modeled by PBEAM was the opening of cracks in the bottom of the dia-phragm when positive moment reinforcement is not provided. However, based on parametric study results, resultant moments at midspan are nearly identical for a given situation regardless of the amount of positive moment reinforcement in place at the supports. This is illustrated in Figure 22, in which moment diagrams on the left are for an early age of continuity structure with positive moment reinforcement and on the right for the same structure without positive moment reinforcement. Dead load moments are the same. With time-dependent effects, pos-itive restraint moments develop for the structure on the left. Without positive reinforcement, cracks occur and little or no positive restraint moment develops for the structure on the right. With application of additional dead load and live load plus impact, positive midspan moment increments for the continuous structure are less than for the structure in which cracks may have opened because of the lack of positive moment reinforce-ment. However, resultant midspan moments, equal to super-position of dead load, time-dependent, additional dead load, and

32
With Positive Without Positive
Moment Reinf. Moment Reinf.
DL
Restraint
Add'l DL -------__--•- -
LL + I
Resultant
Mid Span Moment
Figure 22. Resultant moments for bridges with and without pos-itive moment reinforcement at supports.
live load plus impact moments, are essentially the same. This results because the loss of stiffness and structural continuity due to opening and closing of the crack at the bottom of the dia-phragm when positive moment reinforcement is not provided is compensated for by the restraint moment that develops if positive moment reinforcement is provided. Therefore, either of the two rutes shown in Figure 22 may be used to determine positive inidspan service moment.
The simplest method is to assume full structural continuity for calculation of both live load plus impact and time-dependent restraint moments. Because development of negative restraint moments occurs with full structural continuity until the deck cracks, this method is appropriate for calculation of positive and negative restraint moments.
A computer program was developed as an improved method to predict restraint moments at redundant supports of bridges constructed of precast, prestressed girders made continuous. The program, called BRIDGERM, is described in detail in Appendix E. A second program, called BRIDGELL, also described in Appendix E, was developed to calculate maximum moments under AASHTO HS live load plus impact specifications (14). Documentation of the programs, user instructions, and source listings are included in Appendix E. Example runs are also included in Appendix E. Descriptions of the programs are given in the following sections.
Calculation of Restraint Moments. Program BkIDGERM was developed based on the PCA restraint moment calculation procedure in Ref. 12. Modifications to the PCA method were made to improve the analysis. Separate time-dependent func-tions are provided for girder concrete creep, deck concrete shrinkage, and girder concrete shrinkage. The time-dependent functions used in BRIDGERM are those suggested by AC! Committee 209 (17) for creep coefficient, shrinkage of moist-cured concrete, and shrinkage of steam-cured concrete, respec-tively. Ultimate values of creep coefficient, deck shrinkage strain, and girder shrinkage strain are provided by the user. Deck concrete compressive strength also varies with time according
to the ACI-209 recommended time curve, assuming moist-cured concrete with Type I cement. Deck concrete modulus of elas-ticity is calculated from the time-dependent compressive strength using the relationship in AASHTO (14). Prestress force is determined as a function of time using the PCI prestress loss calculation procedure in Ref. 41. The stress at the strand cen-troid due to restraint moments is included in the loss calculation.
An additional modification involves use of a simplified bridge model for calculating the elastic distribution of restraint mo-ments. A single interior span is supported by a double pinned support at each end, as shown in Figure 23. The double pinned support accounts for the finite length of the diaphragm. An exterior span is supported by a single pin at one end and a double pinned support at the other end. The distance between the double supports (XLD) should be taken as the distance between the centerline of the support bearings of adjacent girders over a common pier. For purposes of elastic analyses the ratio of sectional stiffness (El) of the girder to the sectional stiffness of the diaphragm between supports was taken to be one. Because of the high stiffness of the double support region (assuming no uplift at either reaction), the influence of adjacent spans on restraint moments in the subject span can be neglected.
The analysis is conducted for typical exterior and interior spans in a multispan continuous bridge. For a two-span bridge, the analysis is modified to account for two adjacent exterior spans. For a three-span bridge, the analysis is conducted for an exterior span and for an interior span with exterior spans ad-jacent to each end. For bridges of four spans and greater, re-straint moments are calculated for exterior spans, interior spans adjacent to an exterior span, and interior spans adjacent to interior spans at each end. The analysis procedure allows for the possibility of uplift at the first interior support region when the change in moment over the support region causes one re-action to become negative. In this case, the model is adjusted to account for the reduced stiffness in the support region and the effect of the adjacent span.
The analysis in BRIDGERM is conducted by superimposing restraint moment increments calculated over a series of time intervals. The user specifies the girder age at which continuity is established and the age at which the deck is in place. In general, these ages should be assumed to be the same unless it is specifically known that there will be a difference of more than several days. The program calculates prestress losses from the user-specified age of prestress release until continuity is estab-lished. When the deck is in place, the strand stress is increased
7
SL J XLD 4 4
Exterior Span
,
XLD I SL I 'l Interior Span
SL = Span Length XLD = Diaphragm Length
Figure 23. Simplified bridge models for BRIDGERM analysis.

33
because of the imposed deck load. Restraint moments are cal-culated over a predetermined sequence of time increments start- ing at the age continuity is established. For each time step, the three components of change in restraint moments, differential shrinkage, dead load creep, and prestress creep, are calculated. The calculated increment of restraint moment is added to the sum from the preceding time step to determine the restraint moment at the end of an interval. The chae in restraint mo- ment within a time step is determined using a modification to the procedure in Ref. 12. The modifi procedure incorporates a time-dependent creep effect factor to account for the age at loading for the change in moment within each time step. Details of this procedure are further discussed in Appendix E.
In order to determine the success of the simplified restraint moment calculation method, a comparison to results of the PBEAM analyses was made. Initial comparisons showed that the simplified method overestimated the effects of differential shrinkage, particularly for late restraint moments in a bridge with a late age of continuity. The formula suggested by Dis-chinger (69) to account for the restraining action of reinforce-ment was used to reduce the ultimate shrinkage strain of the deck when restraint moments were negative. Use of this mod-ification factor is further discussed in Appendix E.
Tables 18 and 19 show comparisons of restraint moments calculated using PBEAM, the CTL method using program BRIDGERM, and the PCA method from Ref. 12. The tables compare restraint moments at the central support of a four-span bridge. Three girder sections are compared, each with two span lengths. Each analysis was done using a low value of 1.625 and a high value of 3.25 for the ultimate creep coefficient. Table 17 shows restraint moments calculated at 650 days for an early age of continuity of 17 days. The CTL moments show signifi-cantly better agreement than moments calculated using the PCA method. The mean absolute error of the PCA method compared to PBEAM results is 334 ft-kip. The mean absolute error of CTL method results is 77 ft-kip.
Table 19 shows the maximum negative restraint moments for bridges with a late age of continuity of 67 days. The improve- ment in predicting the maximum negative moment for late age of continuity using the CTL method is not as significant as for early age of continuity results shown in Table 17. For maximum negative moment, the mean absolute error for the CTL method is 184 ft-kip, compared to 185 ft-kip for the PCA method.
Three typical restraint moment time responses are shown in Figures 24, 25, and 26. Each figure shows restraint moments from PBEAM and CTL method calculations at the central support of a four-span bridge. Analyses were done for low and high ultimate creep coefficients of 1.625 and 3.25, respectively. Figure 24 is for BT72/6 girders with 130-ft spans and age of continuity of 17 days. PBEAM results for both low and high creep give positive restraint moments immediately after conti- nuity is established. Because of the configuration of the girder cross section, dead load is relatively small and the composite centroid is close to the top of the girder. As a result, the two contributors to negative restraint moments, dead load creep and differential shrinkage, are relatively small compared to the pos-itive restraint moment contribution of prestress creep. CTL method restraint moment for the high creep case is close to PBEAM results and converges at a later age. For low creep, the CTL method moment is slightly negative initially, but re-covers and runs parallel, but approximately 270 ft-kip below the PBEAM moment at later ages. This represents the largest
Table 18. Restraint moments at central support of four-span bridge—age of continuity 17 days.
Ultimate Girder Span PBEAM CTL Method PCA Method Creep Type Length. Moment Moment Moment
Coefficient. ft @ 650 days 8 650 days 8 650 days ft-k ft-k ft-k
3.25 AASHTO-IV 70 217 215 40 100 403 392 131
OASH1O-Y1 100 313 340 -83 130 618 711 316
BT72/6 100 215 297 54 130 1011 975 736
1.625 AASHTO-IV 70 • 41 -185 100 226 124 -120
AASHTO-VI 100 96 21 -352 130 385 320 -68
8T12/6 00 130
102 26 -201 691 425 286
PBEAM analyses of girders aith positlae moment reinforcement at the supports as not carried not for this set of parameters.
Table 19. Restraint moments at central support of four-span bridge—age of continuity 67 days.
Ultimate Girder Span Maximom Negative Moment Creep Type Length. ft-k
CoeffIcient ft CTL PCA PBEAM Method Method
3.25 AASHTO-IV 70 -900 -668 -541 100 -900 -655 -518
AASHTO-VI 100 -1160 -916 -778 130 -750 -861 -618
BT72/6 100 .644 -785 -605 130 -519 -706 -435
1.625 AASHTO-IV 70 -900 -738 -680 100 -900 -727 -651
AASHTO-V1 100 -1130 -1009 -979 130 -750 -881 -851
8T12/6 100 -634 -859 -761 130 -566 -801 -622
Restraint Moment,
ft-k 1200
1000
800
600 r/ '.i:.I.:::::: :.i:i:ri
625
400
200
100 200 300 400 500 600 700
-200 1 Time, days
Figure 24. Comparison of CTL method and PBEAM results—BT72/6, early age of continuity.

34
Restraint Moment,
ft-k
400 —CTL V u = 3.25
PBeam \) u = 3.25
200
r- PBeam \) = 1.625
__t_CTL Vu1.625
200 300 .......400 500 600 700
-200
Time, days
-400 1
Figure 25. Comparison of CTL method and PBEAM results—AASHTO- VI, early age of continuity.
Time, days
D 100 200 300 400 500 600 700
V u 1.625
u 1.625
-800
Figure 26. Comparison of CTL method and PBEAM results—AASHTO-VI, late age of continuity.
-200 Restraint Moment,
ft-k -400
-600
difference for the comparisons made in Table 17. The difference of 270 ft-kip is approximately 6 percent of the resultant midspan moment for dead load, restraint moment, and live load plus impact.
Figure 25 represents a common situation for heavier girders with early age of continuity. In this case, the girders are AASHTO Type VI with spans of 100 ft. For heavier girders, dead load creep and differential shrinkage components dominate in early ages and produce negative restraint moments. Prestress levels in heavier girders are often high, particularly for longer spans, and therefore positive restraint moments eventually de-velop as the differential shrinkage contribution decreases. Again, for high creep, the CTL method prediction agrees fairly well with the PBEAM results. For low creep, the CTL method overestimates early age negative moment and then runs parallel but below the PBEAM results.
Figure 26 shows typical behavior of a girder with an age of continuity of 67 days. This bridge consists of 100-ft spans with AASHTO Type IV girders. For later age of continuity the differential shrinkage component dominates the early restraint moments because most of the girder shrinkage has occurred before the deck is in place. High negative restraint moments result. PBEAM analyses generally result in a large negative restraint moment, initially with a strong recovery due to pres-tress creep after 100 days. The CTL method results do not attain the extremes of the PBEAM analyses in that the high early negative restraint moment is generally underestimated and later age negative moments are overestimated.
In general, the CTL method as implemented in program BRIDGERM shows reasonable agreement with PBEAM results for each of the three situations described above. The method is an improvement in ease of use as well as accuracy of results over the PCA method from Ref. 12. The mean absolute error of 77 ft-kip for the CTL method results in Table 17 represents approximately 2 percent of the sum of positive midspan service restraint, dead load, and live load plus impact moments for the six girder/span length combinations studied.
Calculation of Live Load Plus Impact Moments. Program BRIDGELL was developed to calculate maximum live load plus impact moments for a continuous interior bridge girder
loaded by AASHTO standard (14) HS truck and lane loads. An elastic continuous beam analysis program was modified by addition of routines to generate AASHTO HS truck and lane loads. For AASHTO HS truck loads, a single standard truck is placed at a number of positions on each span. The user specifies the number of truck positions per span and the number of axle spacings to be used between the 14 and 30 ft extremes. For each combination of truck position, direction, and axle spacing, the bridge is analyzed. Extreme shears and moments are updated after each analysis. The program is capable of analyzing the structure without positive moment continuity for AASHTO truck load cases. For AASHTO HS lane loading, the program generates combinations of patterned loading to produce maximum positive midspan moments and maximum positive and negative support moments. The AASHTO lane load spec-ifies use of one concentrated load for positive moments and two concentrated loads for negative moments, placed to cause max-imum stress. For each pattern of lane uniform loading, the user specifies the number and locations of different positions for the concentrated load(s). For each combination of uniform and point load(s), the bridge is analyzed. Extreme shears and mo-ments are updated after each analysis. The load magnitudes are based on AASHTO HS20-44 specifications. Loads are adjusted to account for the number of lanes per girder and the lateral distribution of load according to AASHTO recommendations. The user may specify load magnitudes other than HS2044 by entering a multiplication factor, such as 1.25 to analyze for HS25-44 loading.
SUMMARY OF FINDINGS
Chapter Two presented the findings of the research for this project. Based on a review of the literature, existing ana-lytical techniques and computer programs PBEAM and WALL_HINGE were selected for evaluation of time-depen-dent behavior and strength of precast, prestressed girders made continuous. Creep and shrinkage tests were carried out to in-vestigate behavior with early age loadings and to evaluate math-ematical models. Coefficients for time-dependent behavior of

35
concrete based on ACI-209 recommendations were found to be satisfactory.
Respondents to the questionnaire confirmed that current prac-tice for design and construction of the simple-span girders made continuous varies considerably. The responses to the question-naire were used to determine ranges of design parameters for this type of bridge.
A parametric study for time-dependent effects on continuity indicates that effective continuity for live load can range from o to 100 percent. The presence of positive moment connection in the diaphragms has negligible effect on reduction of resultant midspan service moments. Construction timing has a major influence on effective continuity. Maximum loss of effective continuity, resulting either from positive restraint moments or opening of cracks in the bottom of diaphragms, occurs with a combination of young girders at the time of casting the deck and diaphragm with late age application of live load plus impact. Maximum negative moment and probability of transverse crack-ing in the deck over the supports occur with older girders at
the time of casting the deck and diaphragm combined with early age application of live load.
A parametric study of the effect of amount of deck reinforce-ment and cross-sectional shape of girders was carried out. Re-sults were used to determine a limit for the negative moment reinforcement ratio, p equal to 0.5 Pb' in order to ensure re-distribution of moments and attainment of maximum strength of the girders.
A comparison of the analytical results was made using the existing PCA method and the computer program PBEAM. The comparison indicated that, using moments determined from PBEAM, there is a potential for more economical design for positive midspan moment in the prestressed girder. A new sim-plified computer program, BRIDGERM, was developed using modifications to the PCA method to calculate time-dependent behavior. Another program, BRIDGELL, was developed to calculate the continuous moments due to live load plus impact.
Based on the findings discussed in Chapter Two, Chapter Three presents recommendations for analysis and design.
CHAPTER THREE
INTERPRETATION, APPRAISAL, AND APPLICATION
DESIGN FOR SERVICE MOMENTS
Current AASHTO provisions for the design of bridges con-structed of prestressed girders made continuous do not specify how to consider the effects of creep and shrinkage. The following recommendations for the design for service moments are based on the findings of the analytical studies of the long-term behavior of this type of bridge presented in Chapter Two.
Positive Moment at Supports
Results of the parametric study of time-dependent restraint moments and service load moments at supports of bridges con-structed of prestressed concrete girders made continuous indi-cate that there is no structural advantage for providing positive moment reinforcement at supports. With continuity established at an early girder age, positive restraint moments and the ap-parent degree of continuity with application of live load are highly dependent on the amount of positive reinforcement pro-vided in the girder connections at the supports. The time-de-pendent positive restraint moment generally induces a crack in the bottom of the diaphragm concrete. With the application of live load, the positive moment crack must close prior to inducing negative moment at the continuity connection. The presence of positive moment reinforcement helps to maintain relatively small cracks, thereby increasing apparent live load continuity. However, the positive restraint moment resulting from the pres-ence of the reinforcement in the support connection increases
the positive midspan resultant moment. The effect of the lack of full continuity caused by not providing positive reinforcement in the diaphragm and allowing the bottom diaphragm crack to open is virtually balanced by the increased positive restraint moment. Therefore, the resultant midspan moments, which in-clude moments due to dead load, restraint moments due to creep and shrinkage, and live load moments, are independent of the area of positive reinforcement provided in the diaphragm connections at the supports. Therefore, providing positive mo-ment reinforcement has no benefit for flexural behavior of this type of bridge.
The primary advantage of positive moment reinforcement is in maintaining a smaller crack near the bottom of the diaphragm. However, questionnaires returned by four state departments of transportation (California, Florida, Minnesota, and Wisconsin) reported using continuous decks over the supports without any positive moment connection. There were no serviceability prob-lems associated with the lack of positive moment connections. Because construction of this detail is expensive, time-consuming, and difficult, the provision of positive moment reinforcement at the supports is not recommended.
Positive Moment at Midspan
Positive service moments at midspan consist of simple span moments due to girder and deck weight and moments acting on the continuous structure, including those due to additional dead load, live load plus impact, and time-dependent restraint

36
moments at supports. AASHTO Specifications require that al-lowable stresses of Article 9.15.2.2 (14) not be exceeded under the critical combination of service loads. Results of this study indicate that the time-dependent behavior influences the con-tinuous behavior such that the effective continuity for live load plus impact can vary from 0 to 100 percent. Therefore, the time-dependent effects must be considered in design if continuity is to be counted on to reduce positive service moments at midspan.
To account for the effects of time-dependent restraint mo-ments on midspan positive service moments, the first step is to determine restraint moments assuming full structural continuity. Calculated restraint moments, support moments for the service load case which causes maximum midspan moment, and support moments due to additional dead load are then added. The sum-mation of support moments governs the amount of positive midspan moment reduction due to the effects of structural con-tinuity.
Time-Dependent Restraint Moments. Restraint moments can be determined using the program BRIDGERM developed in this study. The analysis in BRIDGERM to determine restraint moments assumes full structural continuity. As discussed in Chapter Two and illustrated in Figure 22, this applies whether or not positive moment connections are provided at supports. Additional dead load applied shortly after establishment of con-tinuity, such as for parapet or median strip loads, should be included in the restraint moment analysis.
For calculating support restraint moments for use in deter-mining positive midspan service moments, the following time factors should be considered. The earliest likely girder age at
Hinge for Positive Moment
77 717 747 7 147 Truck Load on lrttenor Spans - Three Span Continuity
Hinge for Positive
i i ~ f Moment
747 A7 ih 77 77 747 Truck Load on End Span - Two Span Continuity
C) Additional Dead Load - Full Continuity
PMM= MAM 77 77
d) Patterned Lane Load - Full Continuity
Figure 27 Continuity for determining design moments from ex-ternal loads.
which continuity would be established in the bridge based on expected construction schedule should be used. Results of the questionnaire indicated that girders are generally between 10 and 90 days old at the time of construction. An age of continuity of 17 days was used for early age analyses in the parametric study. Along with the early age of continuity, a late age at which live load is applied, 2 years or greater, should be used.
An additional consideration that could be used to calculate more conservative design moments is to include factors to ac-count for the variability of creep and shrinkage behavior. As shown by the creep and shrinkage tests carried out in this study, the concrete time-dependent properties can vary significantly from the calculated values from analytical material behavior models. To determine the most conservative positive midspan service moments, the time-dependent analysis with BRIDG-ERM could be carried out with upper-bound values on girder concrete creep and shrinkage and a lower-bound value on the deck shrinkage. Considering that the time-dependent analyses are being carried out to determine service moments, and con-sidering that no major serviceability problems have been re-ported related to midspan flexural behavior for this type of bridge, use of upper-bound and lower-bound time-dependent material properties would add unwarranted conservatism. It is our recommendation that, if the time-dependent material prop-erties of the specific concrete to be used in the construction of the girders and deck are not known, values determined using ACI-209 (17) recommendations should be used for calculating time-dependent restraint moments.
Live Load Plus Impact. One of the main recommendations of this study is that positive moment reinforcement at supports not be provided because its disadvantages in construction out-weigh structural and serviceability advantages. However, if pos-itive moment reinforcement is not provided, no reliable positive moments can develop at supports. Therefore, for determination of live load plus impact moments on the continuous structure, the nature of continuity at supports must be considered for various load configurations. The following discussion presents the recommended procedure for determining design positive midspan live load plus impact service moments acting on the continuous structure with no positive moment reinforcement at supports.
Figure 27 illustrates possible load configurations. As shown in Figure 27(a) and (b) for AASHTO truck load located on one span of a multispan bridge, the continuous structure for resisting the load consists of three spans for a loaded interior span and two spans for a loaded end span. For a loaded interior span of a fully continuous bridge, negative moments occur at the two supports adjacent to the loaded span and positive mo-ments occur at the next support in each direction. When positive moment resistance is not provided, these moments are assumed to be zero, in effect isolating the loaded span and the two adjacent spans from the rest of the bridge, as shown in Figure 27(a). Similarly, for a loaded end span of a fully continuous bridge, negative moment occurs at the first interior support and positive moment occurs at the second interior support. When positive moment resistance is not provided, the moment is as-sumed to be zero at the second interior support. Therefore, the effective continuous structure for an end span loaded with AASHTO truck load consists of the loaded span and the first adjacent span, as shown in Figure 27(b).
For load configurations such as additional dead load over the entire bridge and some patterns of AASHTO lane load, no

ial Dead Load and Live Load Plus Impact Equals M,+I( M —cont -125% Mcr)J When cont.Exceeds 125% Mcr
Mcr 125% M
Design Moment Diagram for Midspan
Service Moment
positive support moments occur. Because no positive support moments occur, the absence of positive moment reinforcement at supports does not affect continuity. Therefore, the entire bridge can be assumed to act as a continuous structure, as shown in Figures 27(c) and 27(d). Calculations of additional dead load and live load plus impact moments can be done using the pro-gram BRIDGELL developed in this study. BRIDGELL in-cludes, as an option, analysis of the partially continuous bridge as described above. A more complete description of Program BRIDGELL can be found in Appendix E.
Midspan Service Moments. The magnitudes of continuity mo-ments at supports of a typical span are used to determine the midspan service moment for checking allowable stresses. Con-tinuity moment is defined as the sum of restraint, additional dead load, and live load plus impact moments at a support. Calculated restraint moments from BRIDGERM for supports of each typical span of the bridge should be added to the sum of negative support moments from two load cases. The first is the live load plus impact load case, which produces maximum positive midspan moment in the corresponding span. The second load case is additional dead load over the entire continuous structure.
If the average of the continuity moments for the two supports is positive, time-dependent effects have reduced effective struc-tural continuity for live load plus impact to 0 percent. In this
37
case, the positive midspan moment should be determined as the sum of simple span moments for additional dead load and live load plus impact.
If the average of the continuity moments for the two supports is negative and does not exceed 125 percent of the negative cracking moment, partial or full structural continuity exists. In this case, the positive midspan moment should be determined by adding (correctly accounting for signs) the average calculated restraint moment from BRIDGERM to the calculated addi-tional dead load, and live load plus impact midspan moment from BRIDGELL for the fully continuous structure.
The recommended maximum negative continuity moment to be used for reduction of midspan positive moment is equal to 125 percent of the negative cracking moment of the section. If the average of the continuity moments for the two supports is greater than 125 percent of the cracking moment, the midspan moment should be taken as the resultant positive midspan mo-ment from the continuous analysis (including restraint, addi-tional dead load, and live load plus impact) plus the amount by which the negative continuity moment exceeds 125 percent of the cracking moment. This provides for the situation when negative moments are redistributed to midspan after deck crack-ing occurs. The summation of moments for a typical symmetrical span is illustrated in Figure 28. It should be noted that the
Moment Diagrams
Restraint - I I
+
Additional -
Dead Load -------
+ +
Live Load Plus Impact
Summation M oont.125% Mcr)
of Moments +
cont.
125%Mcr Exceeded at Supports Irk
Figure 28. Determination of service load design moment.

38
summation of moments illustrated in Figure 28 does not include simple span moments due to girder and deck dead weight.
If no analysis is conducted to determine time-dependent re-straint moments and no positive moment reinforcement is pro-vided at supports, the midspan service moment should be taken as the sum of simple span additional dead load and live load plus impact moments.
Stresses at service load, for comparison to allowable stresses in AASHTO (14) Section 9.15.2.2, should be determined in the following manner. Stresses from the simple span moment due to girder plus deck weight and stresses due to prestress force should be calculated using section properties for the girder only. Stresses from the previously described moment due to the com-bination of time-dependent effects, additional dead load, and live load plus impact should be calculated using section prop-erties for the composite girder and deck section.
Negative Moment at Supports
Negative service moments at supports consists only of mo-ments acting on the continuous structure, including those due to additional dead load, live load plus impact, and time-depen-dent effects. At service load, Article 9.7.2.4 of AASHTO Spec-ifications (14) requires that compressive stress at girder ends not exceed 0.6f. The section specifies consideration of "effects of prestressing and negative live load bending," but effects of possible negative restraint moments should also be included. Because the negative moment region acts essentially as a con-ventional reinforced concrete section, limitations on reinforce-ment stresses given in Chapter 8 of AASHTO Specifications should also be met. Article 8.15.2.2 limits maximum tensile stress. This provision as well as provisions of Article 8.16.8.4 governing distribution of reinforcement should be used to min-imize deck cracking. Article 8.16.8.3 limits stress range to pre-vent fatigue failure of reinforcement in the deck.
Time-Dependent Restraint Moments. Time-dependent support restraint moments can be determined using the program BRIDGERM developed in this study. For calculating restraint moments for use in determining negative service moments at supports, the following time factors should be considered. The latest likely girder age at which continuity would be established in the bridge, based on the expected construction schedule, should be used. Results of the questionnaire indicated that gir-ders are generally less than 90 days old at the time of construc-tion. However, the girders can be significantly older because of construction delays, particularly for girders intended for con- struction in late fall that end up being stored through the winter and erected in the spring. In combination with the late age of continuity, application of live load should be assumed to occur at an early age after establishment of continuity for determi-nation of maximum reinforcement and concrete stresses. Results of the time-dependent analysis with BRIDGERM indicate that maximum negative moment and maximum potential for crack-ing in the deck occurs approximately 50 days after casting the deck and diaphragm. Therefore, use of restraint moments cal-culated at approximately 50 days after establishment of conti-nuity is recommended for checking maximum tensile stress in the deck reinforcement and maximum compressive stress in the girder end.
For checking fatigue limits, the maximum negative moment at early age is essentially a transient condition. Although re-
straint moments can remain negative for the life of the structure, they reach a reduced and relatively constant level after approx-imately 2 years. Therefore, use of restraint moments calculated at a minimum of 700 days after continuity is established is recommended for checking fatigue limits.
Restraint moments at approximately 50 days and 700 days can be determined from the same run of BRIDGERM with a late age of continuity. The user may request output of restraint moments at all time steps for selection of the maximum negative restraint moment.
Live Load Plus Impact and Additional Dead Load Moments. Negative support moments from live load plus impact and ad-ditional dead load can be determined using the program BRID-GELL developed in this study.
In general, maximum negative live load plus impact moments occur for patterns of AASHTO lane loading in which no positive moments occur at supports. Because no positive support mo-ments occur, the absence of positive moment reinforcement at the supports does not affect continuity. As described previously and illustrated in Figures 27(c) and 27(d), the BRIDGELL analysis for these cases is conducted for the fully continuous structure. In some situations, maximum negative live load plus impact moments may occur for AASHTO truck loading. In this case, if no positive moment reinforcement is provided at the supports, maximum moments should be determined using the limited span continuity analysis in BRIDGLL, as illustrated in Figures 27(a) and 27(b).
No positive support moments occur with application of ad-ditional dead load over the entire length of the continuous structure. Therefore, negative support moments for additional dead load can be determined using the fully continuous analysis of BRIDGELL, as indicated by Figure 27(c).
Service Moments at Supports. The service moment to use for checking allowable stress levels at supports should consist of the sum of peak negative restraint moment, additional dead load moment, and maximum live load plus impact moment. If, under the assumed conditions, calculated restraint moments are pos-itive, the sum of additional dead load and maximum live load plus impact moments should be used. Negative service moment stresses in steel and concrete should be calculated using cracked, transformed section properties. Concrete compressive stress should include stress due to prestress force at the girder end acting on the girder section only.
For checking allowable stress range for fatigue of deck re-inforcement, minimum stress occurs due to the sum of restraint moment and additional dead load moment. As discussed pre- viously, use of restraint moment calculated at a minimum of 700 days after continuity is established is recommended for checking fatigue limits. The maximum stress occurs with ap-plication of live load plus impact. Composite cracked, trans-formed section properties should be used for checking both minimum and maximum steel stresses.
STRENGTH DESIGN
Stresses and strains induced in the girders by volume change from creep and shrinkage are self-limited within the girder in that they are relieved by the deformations accompanying crack-ing in the concrete and yielding of reinforcement. As a result, presence or absence of time-dependent restraint moments has no effect on the strength of the structure. This was demonstrated by comparing tests to destruction of girders tested at approxi-

39
mately 2 years of age with a girder tested at 12 days after deck casting in Ref. 10. Therefore, the design of the bridge to meet strength provisions of the AASHTO Code shall not include time-dependent moments.
Positive Moment at Midspan
Girder flexural strength must be greater than the maximum moment from appropriate factored loads. The factored design moment should include the following: dead load of girder and deck acting on the simply supported girder, additional dead load acting on the fully continuous structure, and live load plus impact. The maximum live load plus impact moment for a given span should be determined from the greater of moments from AASHTO truck loads acting on the portion of the structure continuous for negative moments only and moments from AASHTO lane load patterns acting on the fully continuous structure. The program developed in this study for calculation of live load plus impact moments, BRIDGELL, will analyze the structure in this way. Calculated restraint moments are not to be included in the positive midspan moment for strength design. Strength design should be done according to provisions of Section 9, Part C of AASHTO Specifications (14).
Negative Moment at Supports
Negative moment regions near supports must have flexural strength greater than the maximum moment from appropriate factored loads. The factored design moment consists of addi-tional dead load acting on ihe fully continuous structure and live load plus impact. Generally, maximum live load plus impact negative moments occur under patterns of AASHTO lane load in which no positive support moments exist. In these cases, full structural continuity can be used. For short span bridges, AASHTO truck loads produce maximum negative moments. Use of the BRIDGELL program for analyzing AASHTO truck loads resisted by the structure continuous for negative moment only ensures that an appropriate number of continuous spans are analyzed. Design for negative moment strength should meet provisions of AASHTO Article 9.7.2.3 (14) and appropriate parts of Article 8.16 (14) for strength design of reinforced con-crete.
Minimum deck reinforcement shall provide strength equal to 120 percent of the negative cracking moment as required in AASHTO (14) Section 8.17.1. Negative cracking moment shall be calculated using AASHTO (14) Eq. 8-2. To ensure ductile
behavior to develop full strength, the deck reinforcement in negative moment regions shall not exceed 50 percent of Pb as defined in the "Flexural Strength" portion of Chapter Two of this report.
CONSTRUCTION SEQUENCE
Continuity performance is highly dependent on the age of the girder when the diaphragm and deck are cast. High negative restraint moments can occur at the support connections when continuity is established at late girder ages. Full continuity for live load can be established, depending on the age of the girder at time of casting the deck and diaphragm and on the creep coefficient for the girder concrete.
The sequence of deck and diaphragm construction affects the development of restraint moments. Casting of the deck prior to the diaphragm increases resultant positive moments at midspan, but decreases the potential for deck cracking. Casting of the diaphragm before the deck only slightly decreases resultant mid-span positive moments, and increases the potential for deck cracking. There is no major economic or structural advantage to sequencing the casting of the deck and diaphragm. Simul-taneous casting is the simplest construction procedure.
The degree of continuity available in simple-span prestressed girders made "continuous" for live load plus impact by con-nections at the pier diaphragms can vary from zero continuity to full continuity. The degree of continuity is dependent pri-marily on the age of the girder at the time of casting the deck and diaphragm, and on the creep and shrinkage properties of the concrete. Full continuity can be established by delaying casting of the deck and diaphragm. However, delayed casting increases construction time and also increases negative moments required for design of reinforcement in the deck over the sup-ports. The simplified analysis procedure developed in this project enables designers to account for the various parameters involved to find a good balance between construction timing and design moments.
PROPOSED AASHTO SPECIFICATIONS
Findings and design procedures developed in this study have been incorporated into recommended revisions for Article 9.7.2 of the AASHTO "Standard Specifications for Highway Bridges" (14). A draft of the proposed revised Article 9.7.2 and a draft of the accompanying Commentary are presented in Ap-pendix G.
CHAPTER FOUR
CONCLUSIONS AND SUGGESTED RESEARCH
CONCLUSIONS
Based on the results of analyses presented in this report, the following conclusions were reached:
1. Practical advantages of bridges constructed of precast, pre-stressed concrete girders made continuous have made design and construction of bridges of this type commonplace. However, construction of the positive moment connection at supports is difficult, time consuming, and costly.

40
Current practice for analysis, design, and construction of this type of bridge varies widely within the United States. Cur-rent AASHTO Specifications (14) are vague. Most states use the PCA design procedure (12) as the basis for their design of continuity connections. However, that procedure has several uncertainties and does not address some important considera-tions. The PCA procedure does not adequately handle some situations which exist in current practice of construction timing and sequence.
Creep and shrinkage properties of steam-cured concrete were not readily available. Tests conducted in this project have added significantly to that data base. Test results indicate that ACI-209 (17) creep and shrinkage prediction procedures give reasonably accurate predictions.
Computer analyses of time-dependent and live load plus impact service moments and negative moment strengths were conducted using two sophisticated computer programs, PBEAM (53) and WALL_HINGE (57). Analytical results compared well to existing experimental results and, therefore, the programs were used to conduct parametric studies of bridge behavior.
The service moment parametric study results indicated that there is no structural advantage for providing positive moment reinforcement at the supports. With continuity established at an early girder age, positive restraint moments develop, depen-dent on the amount of positive reinforcement provided in the girder connections at the supports. Time-dependent positive re-straint moment generally induces a crack in the bottom of the diaphragm concrete. With application of live load, the positive moment crack must close prior to inducing negative moment at the continuity connection. The presence of positive moment reinforcement helps to maintain relatively small cracks, thereby increasing the apparent live load continuity. However, the pos-itive restraint moment resulting from the presence of the rein-forcement in the support connection increases the positive midspan resultant moment. The effect of the lack of apparent full continuity, caused by not providing positive reinforcement in the diaphragm and allowing the bottom diaphragm. crack to open, is virtually balanced by the increased positive restraint moment that develops when positive reinforcement is provided. When negative restraint moments develop, positive moment re-inforcement is in the compression zone and offers no structural advantage. Therefore, the resultant midspan moments, which include moments due to dead load, restraint moments due to creep and shrinkage, and live load plus impact moments, are virtually independent of the area of positive reinforcement pro-vided in the diaphragm connections at the supports.
Continuity performance is highly dependent on the age of the girder when the diaphragm and deck are cast. There is a structural advantage gained for design of the prestressed girders for positive midspan moment by delaying casting of the deck and diaphragms. High negative restraint moments can occur at the support connections when continuity is established at late girder ages. Full continuity for live load can be established depending on the age of girder at time of casting the deck and diaphragm and on the creep coefficient for the girder concrete. However, delaying casting of deck and diaphragm may require a delay in bridge construction. Also, the design moment for negative reinforcement in the deck over the supports is increased and the potential for transverse cracking in the deck is increased by delaying construction.
Sequence of deck and pier diaphragm construction affects the development of restraint moments. Casting of the deck prior
to diaphragms increases resultant positive moments at midspan. Casting of diaphragms before the deck only slightly decreases resultant midspan positive moments. There is no major eco-nomic or structural advantage to sequencing the casting of the deck and pier diaphragms. Simultaneous casting is the simplest construction procedure.
The parametric study of negative moment strength of com-posite sections indicated that typical sections have adequate rotational ductility to allow formation of a failure mechanism. An upper limit on deck reinforcement equal to 50 percent of
Pb ensures that sections have sufficient ductility to develop the full failure mechanism as well as provide enough deformation to give adequate warning of failure.
Analysis and design procedures were developed to improve the currently used PCA method (12). The improved analysis procedure eliminates some uncertainties of the PCA method and can deal with more practical situations. The improved sim-plified analytical procedures were incorporated into two com-puter programs. The improved and more comprehensive design procedures are described. Proposed revisions to the AASHTO Specifications are outlined to include the improved analysis and design procedures.
The improved analysis and design procedures developed in this study wVl allow for more rational design and simplify construction of this type of bridge.
SUGGESTED RESEARCH
The difficulty and expense of constructing the positive mo-ment connections at the supports was one of the primary prob-lems associated with simple-span precast prestressed bridge girders made continuous. This problem is addressed in this study and a specific recommendation made to eliminate the problem by eliminating the connection. Another typical problem deter-mined from the questionnaire is transverse cracking of the deck in negative moment areas. This problem is addressed in this study by demonstrating the combination of timing of construc-tion and live load application that results in high negative mo-ments. Also, tools are provided for the designer, in the form of computer programs BRIDGERM and BRIDGELL, to quantify the expected negative moments and potential for deck cracking. However, another approach is to provide special details to ac-commodate the potential for cracking with preformed joints over the support and unbonding of the deck reinforcement or unbonding of the deck to girder interface for a certain length on each side of the joint. The effectiveness of these types of details and their effects on continuous behavior should be eval-uated thrnuoh fiirthr ce-4'
Another area for further research is related to design and detailing of methods to increase the effective continuity. Cur- rently, with the usual methods of construction for this type of bridge, the most efficient condition that can be attained is full continuity for additional dead load and live load plus impact. The girders must still be designed for the dead weight of the girder and deck as a simply supported member. However, a hybrid girder with partial post-tensioning in place may be fea-sibly designed to include more of the dead load into the con-tinuous behavior (3). Also, there may be potential benefits of moment connections to the piers for increased continuity and efficiency in both the girder and pier design (3).
Other areas for further research concern the effects of tem-perature and moisture gradients within the deck-girder section
41
and the effects of support settlement on the continuous behavior and design moments. Evaluation of these effects was beyond the scope of the current study. However, they should be con-sidered in the design process.
The work carried out in this study is primarily related to design for flexural behavior. However, there is also a need to improve or at least clarify procedures for design of shear re-inforcement for continuous girders. The current approach for designing for shear in reinforced and prestressed concrete mem-bers is to consider a portion of the shear to be carried by the concrete, V. The remaining shear strength is considered carried by shear reinforcement, V. The 1983 edition of AASHTO Stan-dard Specifications for Highway Bridges contains revised shear design provisions that include use of the smaller of V,, or V ci
as V. The V,,,, strength relates to diagonal cracking strength
of the web from combined shear and prestressing. The Vd strength is related to the potential for diagonal cracking from combined shear and bending. The relationship for V,, was taken from the AC! 318 Building Code. The relationship was devel-oped based on tests of simply-supported girders with no con-sideration for continuous girders and moving loads. It includes a term V,/Mm where Mmax is the maximum factored moment at a section, and V, is the factored shear at the section occurring simultaneously with Mmax. With different concentrated loads for lane loading specified for evaluating moment and shear along with the various combinations of load and placement of load for maximum moment or shear, the determination of V,, is a nebulous and tedious task. There is a need to develop more appropriate and simplified design procedures for shear in con-tinuous prestressed bridge girders.
REFERENCES
PORTLAND CEMENT ASSOCIATION, "Tennessee's Holston River Bridge Jointless for Over 2650 ft." Bridge Report No. SR248.01E, Skokie, Illinois (1982). VIRGINIA HIGHWAY AND TRANSPORTATION COUNCIL,
"Jointless Bridges." Report No. FHWA / VA-81 /48 (Jun. 1981). KUMAR, A., "Continuity in Composite Concrete Bridge Construction." Second International Conference on Short and Medium Span Bridges, Ottawa, Canada, Proc., Vol. 1 (Aug. 1986) pp. 93-107. U.S. DEPARTMENT OF TRANSPORTATION, Federal High-way Administration, "Optimized Sections for Major Pre-stressed Concrete Bridge Girders." Report No. FHWA /RD-82/005 (Feb. 1982) 172 pp. NATIONAL ROADS BOARD, "The Development of Struc-tural Continuity Between Precast Bridge Units." Project No. 47511, Auckland, New Zealand (Jul. 1976) pp. 1-22. KAAR, P. H., KRIZ, L. B., and HOGNESTAD, E., "Precast-Prestressed Concrete Bridges, 1. Pilot Tests of Continuous Girders." J. PCA Res. and Dev. Laboratories, Vol. 2, No. 2 (May 1960). Also reprinted as PCA Bulletin D34, pp. 21-37. HANSON, N. W., "Precast-Prestressed Concrete Bridge, 2. Horizontal Shear Connections." J. PCA Res. and Dev. Lab-oratories, Vol. 2, No. 2 (May 1960). Also reprinted as PCA Bulletin D35, pp. 38-58. MATTOCK, A. H., and KAAR, P. H., "Precast-Prestressed Concrete Bridges, 3. Further Tests of Continuous Girders." J. PCA Res. and Dev. Laboratories, Vol. 2, No. 3 (Sept. 1960). Also reprinted as PCA Bulletin D43, pp. 51-78. KAAR, P. H., and MATTOCK, A. H., "Precast-Prestressed Concrete Bridges, 4. Shear Tests of Continuous Girders." J. PCA Res. and Dev. Laboratories, Vol. 3, No. 1 (Jan. 1961). Also reprinted as PCA Bulletin D45, pp. 19-46. MATTOCK, A. H., "Precast-Prestressed Concrete Bridges, 5. Creep and Shrinkage Studies." J. PCA Res. and Dev.
Laboratories, Vol. 3, No. 2 (May 1961). Also reprinted as PCA Bulletin D46, pp. 32-65.
MATTOCK, A. H., and KAAR, P. H., "Precast-Prestressed Concrete Bridges, 6. Tests of a Half-Scale Highway Bridge Continuous Over Two Spans." J. PCA Res. and Dev. Lab-oratories, Vol. 3, No. 3 (Sept. 1961). Also reprinted as PCA Bulletin D51, pp. 30-70.
FREYERMUTH, C. L., "Design of Continuous Highway Bridges with Precast, Prestressed Concrete Girders." J. Pre-stressed Concrete Institute (Apr. 1969). Also reprinted as PCA Engineering Bulletin No. EB 014. OlE (Aug. 1969) pp. 14-39. AMERICAN ASSOCIATION OF STATE HIGHWAY AND
TRANSPORTATION OFFICIALS, Interim Specifications for Highway Bridges. Eleventh Edition, Washington, D.C. (1971) 268 pp.
AMERICAN ASSOCIATION OF STATE HIGHWAY AND
TRANSPORTATION OFFICIALS, Standard Specifications for Highway Bridges. Thirteenth Edition, Washington, D.C. (1983) 260 pp. GLIKIN, J. D., and OESTERLE, R. G., "Creep and Shrinkage Analyses of Simple-Span Precast, Prestressed Bridge Gir-ders Made Continuous." Four RILEM International Sym-posium on Creep and Shrinkage of Concrete; Mathematical Modeling, Northwestern University, Evanston, Illinois, Proc. (1986) pp. 765-775.
GLIKIN, J. D., LARSON, S. C., and OESTERLE, R. G., "Com-puter Analyses of Time-Dependent Behavior of Continuous Precast, Prestressed Bridges." To be published in American Concrete Institute Special Publication (1987) 37 pp.
AC! COMMITTEE 209, "Prediction of Creep, Shrinkage and Temperature Effects in Concrete Structures." Designing for Creep and Shrinkage in Concrete Structures, American Con-crete Institute, Publication SP-76, Detroit, Michigan (1982) pp. 193-300.

42
SATTLER, K., "Theorie der Verbundkonstruktionen. "Wil-helm Ernst, (2nd edn.), Vol. 1, Vol. 2, Berlin (1959) 241
pp- BRANSON, D. E., and OZELL, A. M., "A Report on Dif-ferential Shrinkage in Composite Prestressed Concrete Beams." J. Prestressed Concrete Institute, Vol. 4, No. 3 (1959) pp. 61-69. BRANSON, D. E., and OZELL, A. M., "Camber of Pre-stressed Concrete Beams." American Concrete Institute J., Vol. 57 (1961) pp. 1549-1574. BRANSON, D. E., "Time-Dependent Effects in Composite Concrete Beams." American Concrete Institute J., Vol. 61 (1964) pp. 213-230. ROLL, F., "Effects of Differential Shrinkage and Creep on a Composite Steel-Concrete Structure." Designing for Ef-fects of Creep, Shrinkage and Temperature in Concrete Structures, American Concrete Institute, Publication SP-27, Detroit, Michigan (1971) pp. 187-214. BIRKELAND, H. W., "Differential Shrinkage in Composite Beams." American Concrete Institute J., Vol. 56 (1960) pp. 1123-1136. TROST, H., "Zur Berechnung von Stahlverbundträgern im Gebrauchszustand auf Grund neuerer Erkenntnisse des Vis-koelastischen Verhaltens des Betons." Stahlbau, Vol. 37, No. 11(1968) pp. 321-331. TROST, H., MAINZ B., and WOLFF, H. J., "Zur Berechnung von Spannbetontragwerken im Gebrauchszustand unter Be-rücksichtigung des Zeitäbhangigen Betonverhaltens." Be-ton- und Stahlbetonbau, Vol. 66, Nos. 9-10 (197 1) pp. 220-225; 241-243. DILGER W., and NEVILLE, A. M., "Effects of Creep and Shrinkage in Composite Members." Second Australasian Conference on the Mechanics of Structures and Materials, Adelaide, Proc. (1969) pp. 1-20. TROST, H., "Auswirkungen des Superpositionsprinzips auf Kriechund Relaxations-problem bei Beton und Spannbe-ton." Beton- und Stahlbetonbau, Vol. 62, No. 10 (1967) pp. 230-238; No. 11(1967) pp. 261-269. BAZANT, Z. P., "Prediction of Concrete Creep Effects Using Age Adjusted Effective Modulus Method." American Con-crete Institute J., Vol. 69 (1972) pp. 212-217. DILGER, W. H., "Creep Analysis Using Creep-Transformed Section Properties." J. Prestressed Concrete Institute, Vol. 27, No. 1(1982) pp. 98-117. RUSCH, H., "Einfluss von Kriechen und Schwinden des Betons auf die Schnittgrössen und Spannungen." Lehrstuhl fur Massivbau, Technische Hochschule Munich (1966) pp. 1-71. NEVILLE, A. M., DILGER, W. H., and BROOKS, J. J., Creep of Plain and Structural Concrete. Construction Press, Lon-don (1983) 361 pp. C.E.B. (European Concrete Committee), Cement and Con-crete Association, "International Recommendations for the Design and Construction of Concrete Structure, Principles and Recommendations." London (1970) 348 pp. BAZANT, Z. P., and PANULA, L., "Creep and Shrinkage Characterization for Analyzing Prestressed Concrete Struc-tures." J. Prestressed Concrete Institute (May-June 1980) pp. 86-122. HANSON, J. A., "Prestress Loss as Affected by Type of Curing." J. Prestressed Concrete Institute (Apr. 1964) pp. 69-93.
KLIEGER, P., and ISBERNER, A.W., "Laboratory Studies of Blended Cements-Portland Blast-Furnace Cements." Re-search Department Bulletin 218, Portland Cement Associ-ation, Skokie, Illinois (1967) pp. 1-22. UNIVERSITY OF ILLINOIS, "Long-Term Behavior of a Pre-stressed Concrete I-Girder Bridge in Champaign County, Illinois." Structural Research Series No. 470, Civil Engi-neering Studies, Urbana (1979) pp. 1-74. PFEIFER, D. W., "Development of the Concrete Technology for a Precast Prestressed Concrete Segmental Bridge." J. Prestressed Concrete Institute, Vol. 27, No. 5 (1982) pp. 78-99. HUANG, T., "Study of Prestress Losses Conducted by Le-high University." J. Prestressed Concrete Institute (Sept.-Oct. 1982) pp. 48-61. ZIA, P., PRESTON, H. K., Scorr, N. L., and WORKMAN, E. B., "Estimating Prestress Losses." Concrete Interna-tional, Vol. 1, No. 6 (Jun. 1979) pp. 32-38. UNIVERSITY OF ILLINOIS, "Time Dependent Behavior of Noncomposite and Composite Post-Tensioned Concrete Girder Bridges." Structural Research Series No. 430, Civil Engineering Studies, Urbana (Oct. 1976). PCI COMMITrEE ON PRESTRESS LOSSES, "Recommenda-tion for Estimating Prestress Losses." J. Prestressed Con-crete Institute, Vol. 20, No. 4 (Jul-Aug. 1975) pp. 44-75. BAZANT, Z., and WIrFMANN, F. H., Creep and Shrinkage in Concrete Structures. John Wiley & Sons, New York (1982) 363 pp. ASWAD, A., "Non-Linear Equations for Prestressed Flex-ural Members." Joint ASME-ASCE Mechanics Conference, Boulder, Colorado, Proc. (Jun. 1981). SCORDELIS, A., "Analytical Models for Nonlinear Matérial, Geometric and Time-Dependent Effects." International Symposium on Nonlinearity and Continuity in Prestressed Concrete, University of Waterloo, Waterloo, Ontario, Can-ada, Proc. (Jul. 1983) pp. 1-25. ANDERSON, C. A., "Finite Element Analysis of Creep and Shrinkage." Fourth RILEM International Symposium on Creep and Shrinkage of Concrete: Mathematical Modeling, Proc., Northwestern University, Evanston (1986) pp. 311-372. MOSSIOSSIAN, V., and GAMBLE, W. L., "Time-Dependent Behavior of Noncomposite and Composite Prestressed Con-crete Structures Under Field and Laboratory Conditions." (PB 212-619), Ph.D. Thesis, University of Illinois, Urbana (1972). UNIVERSITY OF ILLINOIS, "Time-Dependent Prestress Losses in Pretensioned Concrete Construction." Structural Research Series No. 417, Civil Engineering Studies, Urbana (1972). HIGHWAY RESEARCH BOARD, "Time-Dependent Deflec-tions of Prestressed Concrete Beams." Bulletin No. 307, Washington, D.C. (1961). SINN0, R., and FURR, H. L. "Computer Program for Pre-dicting Prestress Loss and Camber." J. Prestressed Concrete Institute, Vol. 17, No. 5 (1972). TADROS, M. K., GHALI, A., and DILGER, W. H., "Time-Dependent Prestress Loss and Deflection in Prestressed Concrete Members." J. Prestressed Concrete Institute, Vol. 20, No. 3 (1975). USNRC, "NONSAP-C: A Nonlinear Stress Analysis Pro-gram for Concrete Containments Under Static, Dynamic

43
and Long-Term Loadings." Report NUREG-CR -0416, Washington, D.C. (1982) 135 pp. SCORDELIS, A. C., Berkeley Computer Programs for the Analysis of Concrete Box Girder Bridges. Martinus-Nijkoff Publishers, The Hague, The Netherlands (1983). SUTrIKAN, C., "A Generalized Solution for Time-Depen-dent Response and Strength of Noncomposite and Com-posite Prestressed Concrete Beams." Ph.D. Thesis, The University of Texas at Austin (1978) 350 pp. NGO, D., and SCORDELIS, A. C., "Finite Element Analysis of Reinforced Concrete Beams." American Concrete Insti-tute J., Vol. 64, No. 3 (Mar. 1967). BAZANT, Z. P., SCHNOBRICH, W. C., and SCORDELIS, A. C., "Finite Element Analysis of Reinforced Concrete Struc-tures." Seminar on the Finite Element Analysis of Rein-forced Concrete Structures, University of Milan, Proc. (Jun. 1978). THE UNIVERSITY OF TEXAS, Austin, Texas, Center of High-way Research, "A Nonlinear Analysis of Statically Loaded Plane Frames Using a Discrete Element Model." Research Report No. 56-23 (May 1972). OESTERLE, R. G., "Inelastic Analysis for In-Plane Strength of Reinforced Concrete Shear Walls." Ph.D. Dissertation, Northwestern University, Evanston, Illinois (Jun. 1986) 328
pp. PARK, R., and PAULAY, T., Reinforced Concrete Structures. John Wiley and Sons, New York (1975) 769 pp. UNIVERSITY OF ILLINOIS, "Time-Dependent Behavior of Noncomposite and Composite Prestressed Concrete Struc-tures Under Field and Laboratory Conditions." Structural Research Series No. 385, Civil Engineering Studies, Urbana (1972) 517 pp. UNIVERSITY OF ILLINOIS, "Summary Report: Field Inves-tigation of Prestressed Reinforced Concrete Highway Bridges." Project IHR-93, Urbana (1980) pp. 1-14. UNIVERSITY OF HAWAII, "Camber and Deflection Behav-ior of Prestressed Concrete Beams." Honolulu (1973) 123
pp. ASWAD, A., "Rational Deformation Prediction of Pre-stressed Members." Deflections of Concrete Structures, American Concrete Institute, Publication SP-86, Detroit (1985) pp. 263-274. NORTH CAROLINA STATE UNIVERSITY, "Camber in Pre-stressed Girders." Report No. FHWA /NC/81 /005, High-way Research Program, Raleigh (Sept. 1981). THE PENNSYLVANIA TRANSPORTATION INSTITUTE, The Pennsylvania State University, "Overload Testing of an Ex-perimental Prestressed Concrete Bridge." Report No.
FHWA-PA-RD-71-8-4, University Park, Pennsylvania (Mar. 1977). UNIVERSITY OF ILLINOIS, "Field Investigation of a Pre-stressed Concrete Highway Bridge Located in Douglas County, Illinois." Structural Research Series No. 375, Civil Engineering Studies, Urbana (1971). TEXAS A&M UNIVERSITY, "Prestress Loss and Creep Camber in a Highway Bridge with Reinforced Concrete Slab on Pretensioned Prestressed Concrete Beams." Texas Transportation Institute, Research Report 69-3 (Final), Study 2-5-63-69, College Station (1968) pp. 1-42.
AMERICAN SOCIETY FOR TESTING AND MATERIALS, 1985 Annual Book of ASTM Standards. Philadelphia (1985).
ACI COMMITTEE 318, Building Code Requirements for Reinforced Concrete. American Concrete Institute, Detroit (1983) 111 pp. DISCHINGER, F., "Investigation on Resistance to Buckling, Elastic Deformation, and Creep of Concrete in Arch Bridges (Untersuchen Uber die Knicksicherheit, die Elastische Ver-formung und das Kriecher des Betons bei Bogen Brucken)." Der Bauingenieur, Berlin, Vol. 18, No. 39/40 (Oct. 1937) and Vol. 20, No. 47/48 (Dec. 1939). AHMAD, S. H., and SHAH, S. P., "Complete Triaxial Stress-Strain Curves for Concrete." ASCE J. Struct. Div., Vol. 109, ST4 (Apr. 1982) pp. 728-742. HOGNESTAD, E., "A Study of Combined Bending and Axial Load in Reinforced Concrete Members." University of Il-linois, Engineering Experiment Station, Bulletin Series No. 399 (Nov. 1951). NEVILLE, A. M., Creep of Concrete: Plain, Reinforced, and Prestressed. North-Holland Publishing Company, Amster-dam (1970). BRANSON, D. E., and CHRISTIASON, M. L., "Time-Depen-dent Concrete Properties Related to Design-Strength and Elastic Properties, Creep and Shrinkage." Designing for Effects of Creep Shrinkage Temperature in Concrete Struc-tures, Publication SP-27, American Concrete Institute, De-troit (1971) pp. 257-277. HILDEBRAND, F. B., Introduction to Numerical Analysis. McGraw-Hill, New York (1956). COLLINS, P., "Toward a Rational Theory for RC Members in Shear." Proc., ASCE, Vol. 104, ST4 (Apr. 1978) pp. 649-666. WALRAVEN, J. C., "Experiments on Shear Transfer in Cracks in Concrete, Part II: Analysis of Results." Report 5-79-10, Stevin Laboratory, Delft University of Technology (Nov. 1979) 132 pp.
APPENDIXES A, B, C, D-UNPUBLISHED MATERIAL
The titles are; Appendix A-Summary of Responses to Questionnaire Appendix B-Results of Creep and Shrinkage Study Appendix C-Methods of Analysis Appendix D-Results of Parametric Study
Appendixes A, B, C, and D contained in the report as sub-mitted by the research agency are not published herein. Their titles are listed here for the convenience of those interested in the subject area. Qualified researchers may obtain loan copies, or microfiche may be purchased by written request to the NCHRP, Transportation Research Board Publications Office, 2101 Constitution Avenue, NW., Washington, D.C., 20418.

APPENDIX E
PROGRAM DOCUMENTATION AND USER'S INSTRUCTIONS
PROGRAM BRIDGERM
Introduction
The purpose of Program BRIDGERM is to calculate restraint moments
at supports of typical spans in continuous bridges constructed of
precast, prestressed concrete girders and cast-in-place concrete
deck. The program's restraint moment calculation method is based on
the PCA method of Ref. (12)'with the following modifications. The
program carries out an incremental time-step solution with the
capability to output the complete time-history of the restraint
moments rather than just one restraint moment at a particular age.
The time-dependent material properties for concrete are determined
using ACI-209 Reconinendations (17) including separate shrinkage
functions for the deck and girder concrete, and time-dependent
functions for the strength and stiffness of deck concrete. Prestress
losses are determined at each time-step. The restraining effects of
reinforcement on deck shrinkage are considered. The analysis is
carried out on a simplified model that considers the finite length of
the support regions. Details of data input and output, analysis
assumptions, capabilities, and limitations of Program BRIDGERM are
discussed below in the solution steps. The program was initially
written in Data General Fortran 77 and implemented on CTL's Data
General MV10000 Computer. The program was then recompiled using
Microsoft Fortran for use on IBM PC compatibles with MS-DOS 3.XX. A
listing of the PC version of Program BRIDGERM is included starting on
page E-23. An Example Problem is also given.
Solution Steps *
Program BRIDGERM is divided into seven solution steps as follows:
1. Input data from girder, strand, material properties, and
timing.
* This and any other numbered references are keyed to References listed following Chapter Four in the main body of the report.
E-1
Determine time steps fer incremental analysis.
Calculate geometric properties of noncomposite and composite
cross sections.
Compute prestress losses up to transfer of prestress.
Compute prestress losses up to age at which continuity is
established.
Calculate restraint moments.
Output results.
Following are detailed descriptions of each solution step.
Step 1 - Data Input *
The program input is designed to be accomplished either
interactively through keyboard input or through an input file. Each
problem requires nine lines of input data. All data must be input.
The program will not assign default values if zeros are entered. Data
are input on unformatted lines. Input values must be separated by
coninas or blank spaces. Input values must correspond to the variable
type, either Integer or Real. Real values may be input with or
without a decimal point, whereas Integer values must be input without
a decimal point.
Line 1 is for identification of the run. A description of up to
20 characters within single quotation marks should be entered on this
line.
Lines 2 and 3 contain information to define the girder
cross-section. Figure E-1 defines required .dimensions for I, T, and
box-girder sections. Line 2 reads horizontal dimensions 61, 62, 63,
and B4. Line 3 reads vertical dimensions Dl, D2, 03, D4, 05, and 06.
All dimensions are in inches. Box sections may be analyzed by
entering zero for B4, D3, 04, and 05. Actual top and bottom flange
dimensions should be entered and the sum of the two web thicknesses
should be entered for 63 to define the box cross section. The effect
on section properties of neglecting keyways and internal fillets is
assumed to be negligible. All values on Lines 2 and 3 are Real
variable types.
E-2

D4 =0 41 D2
D
03
l
84=0
i Os
Ii- I D6
+ L B2 J
(a) I-Section
B4 = 0 D3 = 0 D4 = 0 D5 = 0
82
83/2
(c) Box Section
(b) T-Section Fig. E-1 Dimensions to Define Girder Cross-Section
Fig. E-1 Dimensions to Define Girder Cross-Section
E-3 E-4 LA
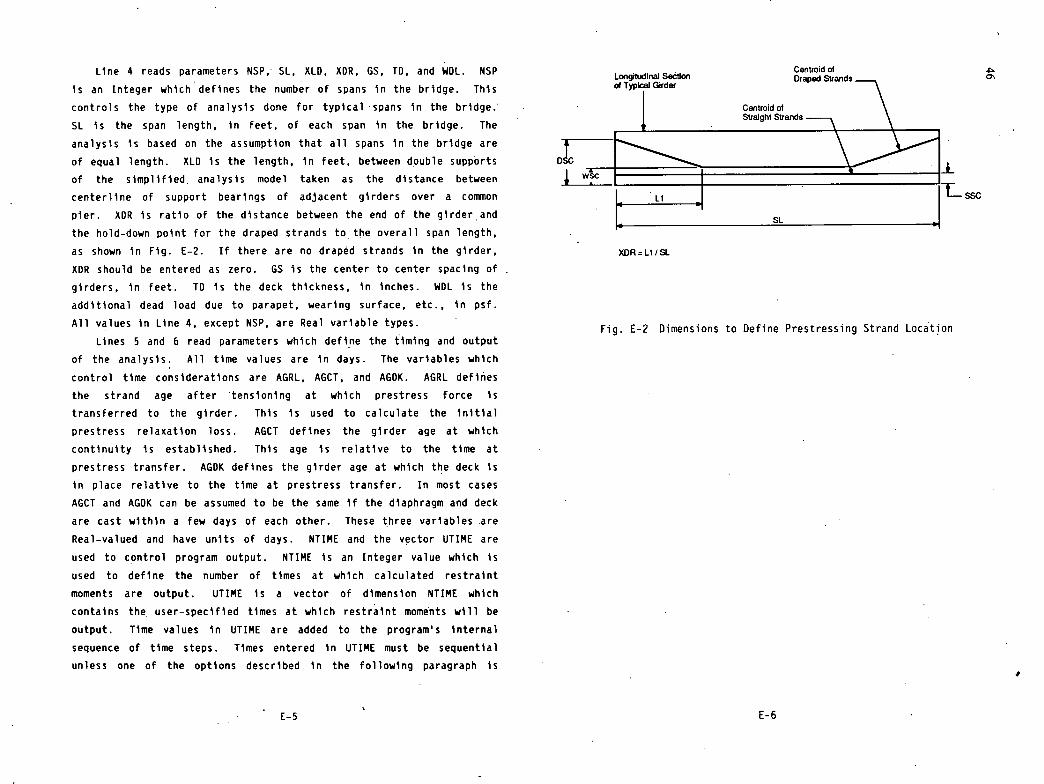
Centroid of Lonaitudinal Section
ssc
XDR=L1 ISL
Line 4 reads parameters NSP,' SL, XLD, XDR, GS, TO, and WDL. NSP
is an Integer which defines the number of spans in the bridge. This
controls the type of analysis done for typical -spans in the bridge:
SL is the span length, in feet, of each span in the bridge. The
analysis is based on the assumption that all spans in the bridge are
of equal length. XLO is the length, in feet, between double supports
of the simplified, analysis model taken as the distance between
centerline of support bearings of adjacent girders over a coniion
pier. XDR is ratio of the distance between the end of the girder and
the hold-down point for the draped strands to the overall span length,
as shown in Fig. E-2. If there are no draped strands in the girder,
XDR should be entered as zero. GS is the center to center spacing of -
girders, in feet. TO is the deck thickness, in inches. WOL is the
additional dead load due to parapet, wearing surface, etc. • in psf.
All values in Line 4, except NSP, are Real variable types.
Lines 5 and 6 read parameters which define the timing and output
of the analysis. All time values are in days. The variables which
control time considerations are AGRL, AGCT, and AGOK. AGRL defines
the strand age after tensioning at which prestress force is
transferred to the girder. This is used to calculate the initial
prestress relaxation loss. AGCT defines the girder age at which
continuity is established. This age is relative to the time at
prestress transfer. AGOK defines the girder age at which the deck is
in place relative to the time at prestress transfer. In most cases
AGCT and AGOK can be assumed to be the same if the diaphragm and deck
are cast within a few days of each other. These three variables are
Real-valued and have units of days. NTIME and the vector UTIME 'are
used to control program output. NTIME is an Integer value which is
used to define the number of times at which calculated restraint
moments are output. UTIME is a vector of dimension NTIME which
contains the user-specified times at which restraint moments will be
output. Time values in UTIME are added to the program's internal
sequence of time steps. Times entered in UTIME must be sequential
unless one of the options described in the following paragraph is
Fig. E-2 Dimensions to Define Prestressing Strand Location
E-5 E-6

employed.
Two additional options are available in the use of NTIME and
UTIME. First, if the user wishes to output all calculated restraint
moments up to a particular time, "1" should be input for NTIME. A
single value should be input for UTIME equal to the negative of the
last day restraint moments are to be output. For example, if the user
wishes all calculated restraint moments to be output until age 650
days, '1° will be input for NTIME, and "-650." will be input for UTIME
on Line 6. The second option allows the user to request output of
maximum negative restraint moments calculated during the analysis. in
this case, the user' enters 11 -1" as one of the values input on Line 6
for the vector UTIME. The program will find the time at which maximum
negative restraint moments, or minimum positive restraint moments,
occur and output these values along with restraint moments calculated
at other times requested in vector UTIME.
Line 7 reads values for the parameters SSC, DSC, WSC, NSL, NSS,
NDS, ASTD, and FST. Parameters SSC, DSC, and WSC define locations of
prestressing strand and are defined in Fig. E-2. SSC is the centroid
of straight strands, measured in inches from the bottom of the
girder. DSC is the centroid of draped strands at the end of the
girder, measured in inches from the bottom of the girder. WSC is the
centroid of draped strands between the hold-down points, measured in
inches from the bottom of the girder. NSL is an Integer of value
equal to either 1 or 2. If NSL is equal to 1, the strand is defined
to be stress-relieved. If NSL is equal to 2, the strand is defined to
be low-relaxation. The value of NSL determines coefficients defined
in Ref. (41) used for calculating prestress losses. NSS is an Integer
which defines the number of strands which are straight throughout the
length of the girder. NDS is an Integer which defines the number of
draped strands. If there are no draped strands, OSC, WSC, and NDS
should be entered as zero. ASTO defines the cross-sectional area of a
single strand in square inches. FST is the initial tensioning stress
in each strand in psi. SSC, DSC, WSC, ASTD, and FST are Real-valued.
Line 8 reads values for the parameters FCI, FCG, FCD, WCG, and
WCD. FCI is girder concrete compressive strength at transfer of
prestress force, in psi. FCG is girder concrete compressive strength
at 28 days, in psi. This value is used throughout the analysis. FCD
is the 28-day compressive strength of deck concrete, in psi. Deck
concrete strength varies with time according to the relationship given
in Ref. (11) for moist-cured concrete with Type I cement. The time
function for deck concrete strength is based on zero equal to the
value specified for AGOK. WCG and WCD are concrete unit weights in
pounds per cubic foot for girder and deck, respectively. All values
in Line 8 are Real-valued.
Line 9 reads values of the parameters VULT, ESHUG, and ESHUD.
VULT is the ultimate creep coefficient for girder concrete. If
possible, the ultimate creep coefficient should be determined from
actual creep tests on the concrete used in the girders. If actual
data is not available, values should be determined using ACI-209
reconynendations (17) using applicable correction factors. The time
function for creep coefficient is that recomended by ACI-209. ESHUG
and ESHUD are ultimate shrinkage strains for girder concrete and deck
concrete, respectively. Values of ESHUG and ESHUD are to be entered
in units of millionths. For example, an ultimate shrinkage strain of
0.000600 in./in. should be entered as "600.'. Values for ESHUG and
ESHUD should, if possible, be taken from actual tests. Otherwise,
ultimate shrinkage strains should be determined from ACI-209
recomendations (17) using applicable correction factors. Time
functions for girder and deck shrinkage strains are those reconriended
by ACI-209 for steam-cured and moist-cured concrete, respectively.
Zero time for girder creep coefficient and shrinkage strain is equal
to the time of prestress transfer. Zero time for deck shrinkage
strain is equal to the age specified by AGDK. No adjustments to
ultimate values are made within the program. Therefore, any
applicable correction factors, such as those recomended by ACI-209
(17), should be applied by the user outside the program to determine
values entered for VULT, ESHUG, and ESHUD.
E-1 E-8
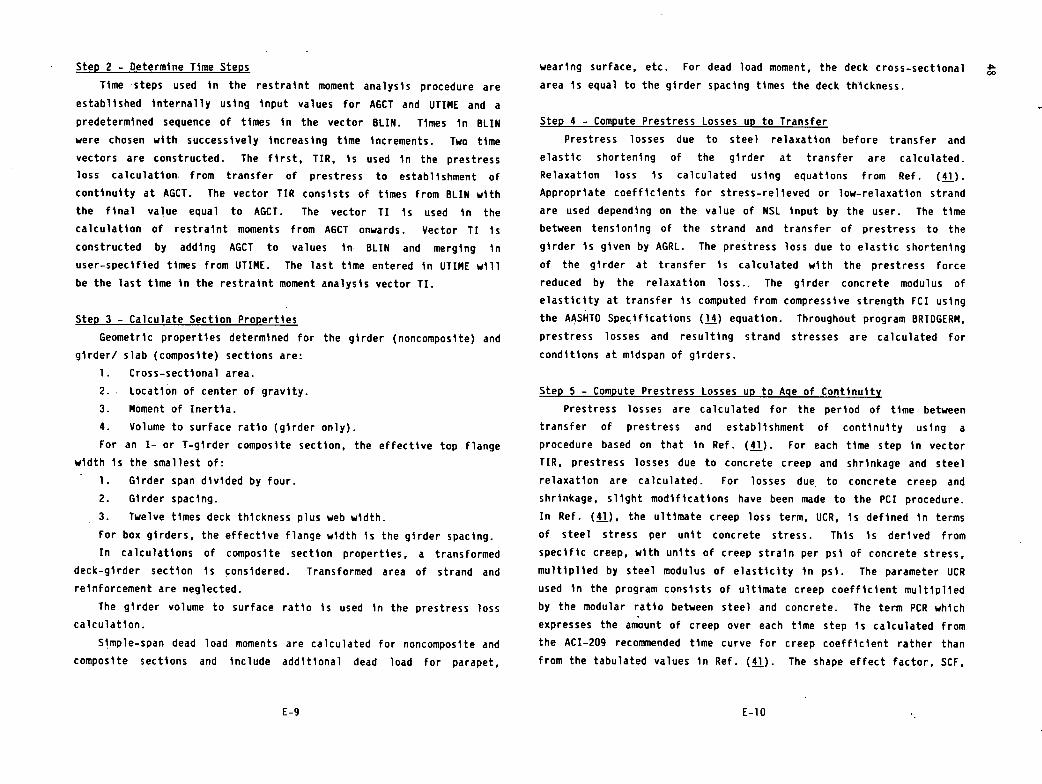
Step 2 - Determine Time Steps
Time •steps used in the restraint moment analysis procedure are
established internally using input values for AGCT and UTIME and a
predetermined sequence of times in the vector BLIN. Times in BLIN
were chosen with successively increasing time increments. Two time
vectors are constructed. The first, TIR, is used in the prestress
loss calculation, from transfer of prestress to establishment of
continuity at AGCT. The vector TIR consists of times from BLIN with
the final value equal to AGCT. The vector TI is used in the
calculation of restraint moments from AGCT onwards. Vector TI is
constructed by adding AGCT to values in BLIN and merging in
user-specified times from UTIME. The last time entered in UTIME will
be the last time in the restraint moment analysis vector TI.
Step 3 - Calculate Section Properties
Geometric properties determined for the girder (noncomposite) and
girder/ slab (composite) sections are:
1. Cross-sectional area.
2.. Location of center of gravity.
Moment of Inertia.
Volume to surface ratio (girder only).
For an I- or 1-girder composite section, the effective top flange
width is the smallest of:
Girder span divided by four.
Girder spacing.
Twelve times deck thickness plus web width.
For box girders, the effective flange width is the girder spacing.
In calculations of composite section properties, a transformed
deck-girder section is considered. Transformed area of strand and
reinforcement are neglected.
The girder volume to surface ratio is used in the prestress loss
calculation.
Simple-span dead load moments are calculated for noncomposite and
composite sections and include additional dead load for parapet,
wearing surface, etc. For dead load moment, the deck cross-sectional
area is equal to the girder spacing times the deck thickness.
Step 4 - Compute Prestress Losses up to Transfer
Prestress losses due to steel relaxation before transfer and
elastic shortening of the girder at transfer are calculated.
Relaxation loss is calculated using equations from Ref. (41).
Appropriate coefficients for stress-relieved or low-relaxation strand
are used depending on the value of NSL input by the user. The time
between tensioning of the strand and transfer of prestress to the
girder is given by AGRL. The prestress loss due to elastic shortening
of the girder at transfer is calculated with the prestress force
reduced by the relaxation loss.. The girder concrete modulus of
elasticity at transfer is computed from compressive strength FCI using
the AASHTO Specifications (14) equation. Throughout program BRIDGERM,
prestress losses and resulting strand stresses are calculated for
conditions at midspan of girders.
Step 5 - Compute Prestress Losses up to Age of Continuity
Prestress losses are calculated for the period of time between
transfer of prestress and establishment of continuity using a
procedure based on that in Ref. (41). For each time step in vector
TIR, prestress losses due to concrete creep and shrinkage and steel
relaxation are calculated. For losses due to concrete creep and
shrinkage, slight modifications have been made to the PCI procedure.
In Ref. (41), the ultimate creep loss term, UCR, is defined In terms
of steel stress per unit concrete stress. This is derived from
specific creep, with units of creep strain per psi of concrete stress,
multiplied by steel modulus of elasticity in psi. The parameter LJCR
used in the program consists of ultimate creep coefficient multiplied
by the modular ratio between steel and concrete. The term PCR which
expresses the amount of creep over each time step is calculated from
the ACI-209 recomended time curve for creep coefficient rather than
from the tabulated values in Ref. (41). The shape effect factor, SCF,
41 00
E-9 E-lO

is the same as in Ref. (41). Concrete stress at the level of the
strand centroid is calculated using the prestressing force from the
preceding time step.
The ultimate loss due to concrete shrinkage, USH, is derived from
ultimate shrinkage strain multiplied by steel modulus of elasticity in
Ref. (41). In the program, USH is equal to ESHUG, with units of
millionths, multiplied by 29.0, which is steel modulus of elasticity
in million psi, which results in units of psi. The amount of
shrinkage over each step, PSH, is calculated from the ACI-209
reconinended time curve for shrinkage of steam-cured concrete rather
than from the tabulated values in Ref. (41). The shape effect factor,
SSF, is the same as in Ref. (41).
The loss of prestress due to relaxation of steel is calculated in
the same manner as in Ref. (41). For each time step, losses are
calculated with the strand stress equal to the value from the end of
the preceding time interval.
When the deck is added at time AGDK, the steel stress is increased
due to the additional dead load stress from the deck weight. The
steel stress is increased by an amount equal to the additional
concrete stress at the level of the strand centroid, multiplied by the
modular ratio. It is assumed that the noncomposite section remains
active until AGCT.
Step 6 - Calculate Restraint Moments
Restraint moments are calculated using the simplified analysis
model shown in Fig. E-3 for three typical spans as shown in Fig. E-4.
Exterior span restraint moments at the first support are calculated in
variable RME. For the first Interior span, restraint moments are
calculated at the supports in variables RMIL and RMIR. The moments in
RMIL are at the support adjacent to the exterior span. RME, RMIL, and
RMIR are adjusted, if necessary, to account for the effect of the
adjacent span when uplift conditions occur. Restraint-moment RMII is
calculated for the supports of an interior span which is adjacent to
two Interior spans. Restraint moment RME is applicable to bridges of
SL IXLDI
Exterior Span
SL = Span Length XLD = Diaphragm Length
XLD I SL 4XLD,] I '1
Interior Span
Fig. E-3 Simplified Analysis Model
E-ll E-l2

RME
Exterior Span Interior or
'797 -97 Exterior Span
(a) Restraint Moment RME
RMIL RMIR
Exterior Interior Span Interior or
Span Exterior Span
(b) Restraint Moments RMIL and RMIR
Interior (
Interior Span Interior
Span xr Span
(c) Restraint Moment RMII
Fig. E-4 Restraint Moments Calculated in BRIDGERM
E-13
two spans or more. Restraint moments RMIL and RMIR are applicable to
bridges of three spans or more. Restraint moment RM11 is applicable
to bridges of five spans or more. Until uplift conditions occur,
RMII, RMIL, and RMIR are equal and RME is approximately 1.5 times as
large. Uplift conditions are assumed to occur when one of the 'two
reactions at the first interior support region becomes negative. This
occurs when one of the reactions induced by the change in restraint
moment in the support region is negative and greater in magnitude than
the dead load reaction.
Preliminary steps include the following. If AGDK is less than or
equal to AGCT, moment of Inertia, cross-sectional area, and strand
eccentricity are set to composite section values. If AGDK is greater
than AGCT, the analysis proceeds using noncomposite section
properties. It is assumed that with the diaphragm cast before the
deck, the support area is continuous for positive moments. Since
differential shrinkage is not active, only positive restraint moments
of relatively small magnitude will result from prestress and dead load
creep acting on the girder section. When the deck is added at AGUK,
the composite section properties are used, dead load moment is
increased, and strand stress is increased due to the additional dead
load stress. At time AGCT, the value of each of the four restraint
moment variables is set to zero. The strand stress for exterior and
interior spans is set to the value from the computation of strand
stress up to age of continuity. Constants used throughout the
analysis are calculated.
Using the PCA method in Ref. (12), restraint moments due to creep
under prestress, M1 , and dead load, M1 , and due to differential
shrinkage between deck slab and girder, M, are first calculated for a
continuous girder assuming rigid connections between individual spans
at the piers. The creep restraint moments are determined by
multiplying the dead load and prestress moments by a coefficient
(1-e1) where:
(OT = 'T - "Ta (El]
E-l4
U, 0

v1 = Creep coefficient at time 1 days, where I is the 0
time after prestress release at which restraint
moments are being calculated, I > I
v 1 0 0
= Creep coefficient at time T days, where I is the 0
time after prestress release at which continuity is
established
Restraint moments due to differential shrinkage are determined using a
multiplier of (l-eT)/ 1.
A series of analyses were made to calculate the time history of
the restraint moment for a number of bridge cross-sections, spans, and
creep coefficients. This was first attempted by calculating the
restraint moment at a series of discrete times, 1, using as
follows:
= (M + M 1)(l-eT) + 1-e_(~T)/40 [E2]
The prestress restraint moment, M 1, is recalculated at each
discrete time I to account for prestress loss in the girder from
relaxation and concrete creep and shrinkage. The relaxation loss time
factor is determined using the equation from Ref. (41). The shrinkage
loss is determined using the ACI-209 time curve for shrinkage of
steam-cured concrete. The restraint moment from differential
shrinkage between the deck slab and girder is also recalculated at
each time T. The shrinkage restraint moment is determined from the
difference in shrinkage in the slab and girder occurring from time
I 0
to time I using the ACI-209 curves for steam-cured and
moist-cured concrete for the girder and deck slab, respectively. Also,
the t,.. was determined using the ACI-209 recommended curve rather
than the data in Ref. (12). This approach did not result in a
significant improvement 1n calculated restraint moments as compared to
results calculated strictly following the PCA method.
As an alternate, the series of analyses were repeated using an
incremental approach. Using this approach, rather than recalculate
at each time T with respect to T, the change in the restraint
moment AMi within each time step is calculated as follows:
AMi = (Mj + MT)(l_ei) AMi(1_ei)/4 [E31
where:
= 'Ti - 'T1-1 (E4J
= Creep coefficient at time Ti after prestress release
for the i-th time step
The incremental differential shrinkage moment, AM'1 is the change in
calculated restraint moment resulting from the difference in deck
shrinkage strain and girder shrinkage strain, 6Ac
occurring
over the time increment, AT1 = T -
Ill as follows:
AMi = AFdi(ec + ) [E5]
where:
AFdi = Tension in the deck to establish compatibility with
the girder
6Ac E A di d si
di 1
gg
6Ac51 = (csdl - Csdi_1)
- (Esgi - c sgi_i)
esdi = Shrinkage strain in deck at time
Csgi = Shrinkage strain in girder at time T
Edi = Modulus of elasticity of deck concrete at time
Eg = Modulus of elasticity of girder concrete (constant)
Ad = Cross-sectional area of deck slab
Ag = Cross-sectional area of girder
(ec + ) = Distance between middepth of deck slab and centroid
of the composite section
In determining the deck shrinkage strain, after an age of 30 days,
the ultimate shrinkage strain is reduced by the Dischinger effect
factor (69) to account for the restraint from the reinforcing steel
E-15 S E-16 LA

within the deck. The creep coefficient v iiis determined from the
ACI-209 recommendations for the girder concrete modified by the ACI-209
recommended correction factor for age of loading for each time Ti as
follows: avg
v.fi = Ti (1.13 Ti °°94) [El] avg
Ti = Ti + Ti_i [E8]
avg 2
Restraint moment increment aMi is used in an elastic analysis
for the simplified model. If induced reactions at the support region
between an exterior and interior span do not cause uplift, the elastic
analysis is done for the unmodified simplified model. If induced
reactions cause uplift, the model is modified by including the full
length of the adjacent span rather than the distance between
supports. Restraint moment increments are then calculated by
distributing the moments from the two spans using the modified model.
RME. RMIL, and RMIR are affected by the uplift analysis. Moment RMII
is calculated for interior spans not adjacent to an exterior span. In
this situation, moments in the support region will not cause uplift.
Therefore, in bridges where uplift cannot occur due to support
details, RMII can be used for interior spans, and 1.5 times RMII can
be used for exterior span restraint moments. Calculated restraint
moment increments are added to the summation from the preceding time
step to determine restraint moments at the end of the current time
step.
If AGDK is greater than AGCT., the adjustment from noncomposite to
composite section described previously is made when the end time of
the time step is greater than or equal to AGDK. Therefore, the
analysis of composite section behavior begins on the succeeding time
step. If output of the minimum restraint moment is called for, the
time at which the minimum RMII occurs is stored for later output.
Using this incremental approach, the resulting calculated
time-dependent restraint moments represented a significant improvement
as compared to the PCA method. The comparisons are presented in
Chapter Two of this report. The incremental approach is incorporated
in BRIOGERM.
Step 1 - Output Results
The program outputs values for RME, RMIL, RMIR, and RMII restraint
moments at user-selected times. If the user requests output of all
calculated restraint moments, values are output at each time step.
Otherwise, values are output at times contained in the user-specified
vector UTIME.
Additional information which may be useful to output. are the
following. Strand stress, in psi, is contained in variables FST up to
age of continuity and FST1 and FST2 after age of continuity for
exterior and interior spans, respectively. Differential shrinkage
restraint moment component is contained in vector XMS. Prestress
creep restraint moment component is contained in vectors XMPS1 and
XMPS2 for exterior and interior spans, respectively.
Users Input Instructions
This section presents instructions for running .Program BRIOGERM.
For each case problem, data input consists of nine lines containing
the information shown in Table El. Each variable is described below.
All variables should be entered as Real values unless otherwise
noted. Character data must be entered within single quotation marks.
Line 1:
TITLE - Identification of case problem (Character)
Line 2:
Bl, B2, B3, and 84 - Horizontal dimensions defining girder profile
as identified in Fig. [-1, in.
Line 3:
Dl, 02, 03, 04, 05, and 06 - Vertical dimensions defining girder
profile as identified in Fig. E-1, in.
E-lB E-ll

Line 4:
NSP - Number of spans in bridge (Integer)
SL - Length of typical span, ft
XLD - Distance between supports, ft
XDR - Ratio defining length of strand draping, ft/ft
GS - Girder spacing, ft
TO - Deck thickness, in.
WDL - Uniform load due to additional dead load, psf
Line 5:
AGRL - Time between tensioning and prestress transfer, days
AGCT - Time between prestress transfer and establishment of
continuity, days
AGDK - Time between prestress transfer and placement of deck,
days
NTIME - Number of user-specified times for output of restraint
moments (Integer)
Line 6:
UTIME - Vector of times for output of restraint moments, days
(NTIME values)
Line 7:
SSC - Centroid of straight strands, in.
DSC - Centroid of draped strands at end of girder, in.
WSC - Centroid of draped strands between hold-down points, in.
NSL - Equal to 1 for stress-relieved strands, equal to 2 for
low-relaxation strands (Integer)
NSS - Number of straight strands (Integer)
NDS - Number of draped strands (Integer)
ASTD - Cross-sectional area of one strand, in.2
FST - Initial strand prestress, psi
Line 8:
FCI - Girder concrete compressive strength at transfer, psi
FCG - Girder concrete compressive strength at 28 days, psi
FCD - Deck concretecompressive strength at 28 days, psi
WCG - Unit weight of girder concrete, pcf
WCD - Unit weight of deck concrete, pcf
Line 9:
VULT - Ultimate creep coefficient for girder concrete,
dimensionless
ESHUG - Ultimate shrinkage strain for girder concrete, millionths
ESHUD - Ultimate shrinkage strain for deck concrete, millionths
The program may be run interactively or in batch mode. To run
interactively, type 'BRIDGERM" and execute. The input prompts will
then appear for each of the nine lines described previously. Input
data for TITLE should be enclosed within single quotation marks. Data
should be separated by connas or blank spaces. To obtain a hard copy
of input and output, while running interactively, use CTRL P to direct
all data to the printer.
In Batch mode, an input file must be set up containing all
required data. Following is example data contained in a file 'DATA2'
on the disc:
'AASNTO—IV 85 FT 20, 26,8,0 54,8,6,0,9,8 4,85.0,2.00.48.0 8.0 30.0 1,14,14,1 —7500.0 3.43,50.0,4.0,1,22,9,0.153,189000.0 5000.,6000.,4000. ,150.,150. 2.3,600.0,600.
To view the data, enter 'TYPE DATA2" and execute. To run this
example, type the name of the batch file, in this case "RUN2.BAT," and
execute. File 'RUN2.BAT" contains the comand "BRIDGERM <DATA2>
OUT2." This coninand runs BRIDGERM with input file "DATA2' and creates
E-19 E-20

TABLE El - DATA INPUT FOR BRIDGERM
Line Number Parameters
TITLE
2 81, 82, 83, B4
3 Dl, D2, 03, 04, 05, 06
4 NSP, SL, XLD, XDR, GS, TO, WDL
5 AGRL, AGCT, AGOK, NTIME
6 UTIME (l ... NTIME)
7 SSC, DSC, WSC, NSL, NSS, NDS, ASTD, FST
8 FCI, FCG, FCO, WCG, WCO
9 VULT, ESHUG, ESHUD
output file "OUT2." To view results enter "TYPE OUT2" and execute.
To obtain a hard copy of the input or output file, use CTRL P when
using the "TYPE" convnand. The output of this example is given on page
E-22. On pages E-23 through E-31 is a listing of Program BRIDGERM.
p
ENTER: TITLE. ENTER: GIRDER HORIZONTAL DIMENSIONS. (in) ENTER' GIRDER VERTICAL DIMENSIONS. (in) ENTER' NUMBER OF SPANS.
SPAN LENGTH. (F t) DISTANCE BETWEEN ADJACENT GIRDER SUPPORTS. (Ft) RATIO OFSTRAND DRAPING LENGTH TO SPAN LENGTH. GIRDER SPACING. (It) DECK THICKNESS. (in) ADDITIONAL DEAD LOAD. (pif)
ENTER: STRAND AGE AT PRESTRESS RELEASE. (days) GIRDER AGE AT CONTINUITY.(davs) GIRDER AGE AT TIME DECK IS IN PLACE. (days) NUMBER OF TIMES FOR OUTPUT OF RESULTS.
ENTER' TIMES FOR OUTPUT OF RESULTS. (days) ENTER: CENTROID OF STRAIGHT STRANDS. (in)
CENTROID OF DRAPED STRANDS AT GIRDER ENDS. (in) CENTROID OF DRAPED STRANDS AT MIDSPAN. (in) I FOR STRESS-RELIEVED 2 FOR LOW-RELAX. NUMBER OF STRAIGHT STRANDS. NUMBER OF DRAPED STRANDS. CROSS-SECTIONAL AREA OF SINGLE STRAND. (q in) INITIAL STRAND TENSION. (psi)
ENTER: GIRDER CONCRETE COMP. STR. AT TRANSFER.(si) GIRDER CONCRETE COMP. STR. AT 28 DAYS. (psi) DECK CONCRETE COMP. STR. AT 28 DAYS. (psi) GIRDER CONCRETE UNIT WEIGHT. (pcF) DECK CONCRETE UNIT WEIGHT. (cF)
ENTER' GIRDER CONCRETE ULTIMATE CREEP COEFFICIENT. GIRDER CONCRETE ULT. SHRINKAGE. (millionths) DECK CONCRETE ULT. SHRINKAGE. (millionths)
STRAND TENSION AT TRANSFER' 170.5 kit TIME MOMENT MOMENT MOMENT MOMENT STRAND
RME RMIL RMIR RMII STRESS (days) (ct-k) (Ft-k) (It-k) (Ft-k) (ksi)
0 0 0 0 165.5 1..7 1..2 1..2 1..2 165.2
17. -24.0 -16.1 -16.1 -16.1 164.7 20. -78.2 -52.5 -52.5 -52.5 163.9 25. -161.9 -108.7 -108.7 -108.7 162.9 32. -245.1 -164.6 -164.6 -164.6 161.6 42. -309.1 -207.7 -207.7 -207.7 160.2 56. -336.7 -226.2 -226.2 -226.2 158.6 60. -310.6 -208.7 -208.7 -208.7 158.3 80. -198.8 -133.7 -133.7 -133.7 156.8 100. -107.3 -72.2 -72.2 -72.2 155.7 123. -15.2 -10.4 -10.4 -10.4 154.7 150. 50.9 39.3 39.3 39.3 153.9 200. 134.5 90.1 90.1 90.1 152.8 250. 191.9 128.6 128.6 128.6 152.0. 300. 236.6. 158.7 158.7 158.7 151.4 400. 301.2 202.1 202.1 202.1 150.6 300. 346.4 232.4 232.4 232.4 150.1 600. 379.9 254.9 254.9 254.9 149.7 800. 426.2 286.0 286.0 286.0 149.1 1000. 457.4 306.9 306.9 306.9 148.7 1250. 481.3 330.9 322.4 325.2 148.4 1500. 498.5 348.1 333.5 338.3 148.1 1800. 513.9 363.4 343.4 350.0 147.9 2100. 525.5 375.0 350.9 358.8 147.7 2300. 537.2 386.8 358.5 367.8 147.5 3000. 548.1 397.6 365.6 376.1 147.3 3500. 556.3 405.8 370.9 382.3 147.2 4000. 562.7 412.3 375..0 387.2 147.1 5000. 572.2 421.7 381.1 394.5 146.9 6000. 578.9 428.5 385.5 399.6 146.7 7500. 586.0 435.6 390.1 405.0 146.5
Stop - Prolram t.,minat.d.
E-21
E-22

PROGRAM BRIDOERM PROGRAM TO COMPUTE RESTRAINT MOMENTS AS FUNCTION OF TIME USING CTL METHOD. NCHRP PROJECT 12-29 CTL PROJECT CR99071821
DIMENSION TI( 100) ,TIR( 100),RME( 100) ,RMIL( 100),RMIR( 100) ,RMII( 100), 1 XMS(100),XMPS1(100),XMPS2(100),FSTI(i00),FST2(100) REAL KV.KSD.KSG DIMENSION A(7),Y(7),XJ(7) .X(3) DIMENSION BLIN(36).UTIME(64),NT(64) CHARACTER*20 TITLE DATA BLIN/1,3,6,11.18.28,42.60.8O.100,125,ISO.200.250.300.400, 1500,600,800,i000,1250.1500, 1800,2100.2500,3000.3500,4000,5000. 26000,8000,10000.15000. 20000,30000.50000/
INPUT DATA
RUN TITLE OF UP TO 20 CHARACTERS: TITLE WRITE(*.*) 'ENTER: TITLE.' READ (e,*) TITLE
GIRDER SECTION HORIZONTAL DIMENSIONS: B1,B2,83.84 (in) WRITE(*,*) 'ENTER: GIRDER HORIZONTAL DIMENSIONS. (in)' READ (*,*) B1.82.B3.B4
GIRDER SECTION VERTICAL DIMENSIONS: D1.02,D3,D4.D5.D6 (in) WRITE(..*)'ENTERS GIRDER VERTICAL DIMENSIONS. (in)' READ (*,*) D1.02,D3.D4.D5.D6
NUMBER OF SPANS: NSP (-) SPAN LENGTH FOR TYPICAL SPAN: SL (*t) LENGTH OF SUPPORT: XLD (ft) RATIO OF DRAPED STRAND LENGTH TO SPAN LENGTH: XDR (-) GIRDER SPACING: GS (ft) DECK THICKNESS: TD (in) ADDITIONAL DEAD LOAD: WDL (es)
WRITE(.,*)'ENTEP: NUMBER OF SPANS.' WRITE(*.*)' SPAN LENGTH. (ft)' WRITE(*,*)' DISTANCE BETWEEN ADJACENT GIRDER SUPPORTS. (ft)' WRITE(*,*)' RATIO OF STRAND DRAPING LENGTH TO SPAN LENGTH.' WRITE(*,*)' GIRDER SPACINO. (ft)' WRITE(*.*)' DECK THICKNESS. (in)' WRITE(*,*)' ADDITIONAL DEAD LOAD. (pf)' READ (*,*) NSP,SL,XLD,XOR.GS,TD.WDL
STRAND AGE AT PRESTRESS RELEASE: AGRL (days) GIRDER AGE AT ESTABLISHMENT OF CONTINUITY: AGCT (days) GIRDER AGE AT TIME DECK IS IN PLACE: AGDK (days) NUMBER OF TIMES FOR OUTPUT OF RESULTS: NTIME (-)
WRITE(*,*)'ENTER: STRAND AGE AT PRESTRESS RELEASE. (days)' WRITE(*,*)' GIRDER AGE AT CONTINUITY.(days)' WRITE(*.*)' GIRDER AGE AT TIME DECK IS IN PLACE. (days)' WRITE(*,*)' NUMBER OF TIMES FOR OUTPUT OF RESULTS.' READ (*,*) AORL,AGCT,AODK.NTIME
TIMES AT WHICH RESULTS ARE OUTPUT: UTIME (days) WRITE(.,*)'ENTER: TIMES FOR OUTPUT OF RESULTS. (days)' READ (*.*) (UTIME(I),I=1,NTIME)
CENTROID OF STRAIGHT STRANDS: SSC (in) CENTROID OF DRAPED STRANDS AT GIRDER END: DSC (in) CENTROID OF DRAPED STRANDS AT MIOSPAN: WSC (in) TYPE OF STRAND: NSL (1=SR,2LR) NUMBER OF STRAIGHT STRANDS: NSS C-) NUMBER OF DRAPED STRANDS: NOS (-) CROSS-SECTION AREA OF STRAND: ASTD (5q in) INITIAL STRAND TENSION: FST (psi)
WRITE(*,e)'ENTER: CENTROID OF STRAIGHT STRANDS. (in)' WRITE(*,*)' CENTROID OF DRAPED STRANDS AT GIRDER ENDS. (in)'
WRITE(*.*)' CENTROID OF DRAPED STRANDS AT MIErE;FAN. (in)' WRITE(*,*)' 1 FOR STRESS-RELIEVED, 2 FOR LOW-RELAX. WRITE(*.*)' NUMBER OF STRAIGHT STRANDS.' WRITE(*.*)' NUMBER OF DRAPED STRANDS.' WRITE(*,*) CROSS-SECTIONAL AREA OF.SINOLE STRAND. (sq in)' WRITE(*,*)' INITIAL STRAND TENSION. (psi)' READ (*,*) SSC,DSC,WSC,NSL,NSS,NDS,ASTD,FST
GIRDER CONCRETE COMPRESSIVE STRENGTH AT TRANSFER: FCI (psi) GIRDER CONCRETE COMPRESSIVE STRENGTH AT 28 DAYS: FCC (psi) DECK CONCRETE COMPRESSIVE STRENGTH AT 28 DAYS: FCD (psi) UNIT WEIGHT OF GIRDER CONCRETE WCG (pcf) UNIT WEIGHT OF DECK CONCRETE: WCD (pcf)
WRITE(.,.)'ENTER: GIRDER CONCRETE COMP. STR. AT TRANSFER.(psi)' WRITE(*.*)' GIRDER CONCRETE COMP. STR. AT 28 DAYS. (psi)' WRITE(*,*)' DECK CONCRETE COMP. STR. AT 28 DAYS. (psi)' WRITE(*.*)' GIRDER CONCRETE UNIT WEIGHT. (pcf)' WRITE(*,*)' DECK CONCRETE UNIT WEIGHT. (pcf)' READ (*,*) FCI.FCG.FCD.WCG.WCD
ULTIMATE CREEP COEFFICIENT FOR GIRDER CONCRETE: VULT C-) ULTIMATE SHRINKAGE STRAIN FOR GIRDER CONCRETE: ESHUG (millionths) ULTIMATE SHRINKAGE STRAIN FOR DECK CONCRETE: ESHUD (millionths) WRITE(*.*)'ENTER: GIRDER CONCRETE ULTIMATE CREEP COEFFICIENT.' WRITE(*,*)' GIRDER CONCRETE ULT. SHRINKAGE. (millionths)' WRITE(*,*)' DECK CONCRETE ULT. SHRINKAGE. (millionths)' READ (e..) VULT,ESHUG.ESHUD
C ESTABLISH VALUES FOR CONSTANTS C C CONSTANTS FOR CREEP COEFFICIENT TIME CURVE
DV= 10 • 0 KV=0. 6
C CONSTANTS FOR GIRDER SHRINKAGE TIME CURVE DSG-55. (<SO- 1.0
C CONSTANTS FOR DECK SHRINKAGE TIME CURVE DSD-35. KSO=1 • 0
C CONSTANTS FOR DECK COMPRESSIVE STRENGTH TIME CURVE ALPHD=4. 0 BETAD-0. 85
C CONSTANTS FOR DISCHINGER ADJUSTMENT DRHO=O. 030 AGDISCH-30.
C RATIO OF DIAPHRAGM TO GIRDER El ALPHA-i • 0
C VARIABLE TO STORE MINIMUM RESTRAINT MOMENT RMI IMIN-I000000.
C TOTAL NUMBER OF STRANDS NS=NDS+NSS
C TOTAL AREA OF STRANDS AST-NS.ASTD
C CENTROID OF STRANDS AT MIDSPAN CE= ( NSS*SSC+NDS*WSC) /NS
C C C 2. DETERMINE TIME STEPS C
OUTALL=0 IF ((NTIME.EQ.1).AND. (UTIME(1).LT.0.0)) THEN UTIME( 1 )=-UTIME( 1) OUTALL= 1 END IF
I-,. E-23 E-24

UP TO CONTINUITY AGE 1=1
8 IF (BLIN(I).OT.AGCT) 00 TO 9 TIR( I)=BLIN( I) 1=1+1 GO TO 8
9 NAOESR=I TIR(NAOESR)-AOCT
AFTER CONTINUITY AOE I BL= 1 I CT-i 1=1 TI( I)=AOCT ITMIN=0
C 10 1=1+1
ADAO=AGCT IF (IBL.DE.2). THEN IF ((BLIN(IBL-1)+AGCT).LT.BLIN(IBL)) ADAO-0. IF C(BLIN(IBL-i)+AOCT).OE.BLIN(IBL)) ADAO-AOCT END IF
C IF (UTIME(ICT).EQ.-1) THEN ITMIN-ICT ICT=ICT+i END IF
C IF ((BLIN(IBL)+ADAG).LT.UTIME(ICT)) THEN TI (I )BLIN( IBL)+ADAO I 8L= I BL+ 1 GO TO 10 END IF
C IF (UTIME(ICT).LT. (BLIN(IBL)+ADAO)) THEN TI( I )-UTIME( ICT) NT( ICT)-I ICT=ICT+1 IF (ICT.GT.NTIME) GO TO 70 GO TO 10 END IF
C IF (UTIME(ICT).EQ.(BLIN(IBL)+ADAG)) THEN TI(! )-UTIME( ICT) NT( ICT)-I ICTICT+1 I BL- I BL+ 1 IF (ICT.OT.NTIME) 00 TO 70 GO TO 10 END IF
C 70 CONTINUE
NAOES-I C C C 3. CALCULATE GEOMETRIC PROPERTIES OF SECTION C C CIRCUMFERENCE OF GIRDER CROSS-SECTION C I- OR T- SECTION
CIRGB1+B2+2*(D1-D3-04-D5)+2*SQRT( 84**2+D4**2) CIROCIRO+2*SQRT(D5**2+( (B2-83) /2)**2) CIRG-CIRO+2.SQRT(D3*e2+( (Bi-83-2*B4) /2)**2) CIRCCIRG-B1
BOX SECTION IF ((D3.EQ.0.0).AND.(D5.E0.0.0)) THEN CIRG=B1+82+2*Di+( B1-B3) +( 82-83) +2* C 01-02-06 CIRC=CIRG-B1 ENDIF
C C NONCOMPOSITE SECTION C A(7)=AREA OF EACH ELEMENT OF SECTION
A( 1 )=B1*D2 A(2)=(2.*B4+B3)*D3 A(3)=(81-2..84-B3)eD3/2. A(4)=2.*B4*D4/2. A(5)=83*( 01-02-03-Do) A(6)=(82-83)*D5/2. A(7)=B2*D6
C Y(7)=DISTANCE FROM BOTTOM FIBER TO CENTROID OF EACH ELEMENT Y( 1 )=Di-02/2. Y(2)=Di-02-03/2. Y(3)=Di-D2-D3/3. V ( 4) =D1-D2-D3-04/3. Y(5)=(Di-D2-03-06/2.+D6 Y(6)=D5/3.+D6 V(7)=D6/2.
C X,J(7)=MOMENT OF INERTIA OF EACH ELEMENT XJ( 1 )B1*D2**3/12. X.J(2)=(2. *54+83)*03**3/j2. X.J('3)(Bi-2. *94-B3)*03**3/36. XJ (4) =2. *84.04ee3/34. X.J(5)=B3*(D1-D2-03-D6)**3/12. X.J( 6)(82-93)*D5**3/36. X.J(7)82*D6**3/12. AO=0. DO 470 1=1,7
470 AG=A0+A(I) TJ=0. DO 480 1=1.7
480 T.J=TJ+XJ(I) YBB=0. DO 490 1=1,7
490 YBB=YBB+A(I)*Y(I) YB=YB8/AO YT=0 1-YB X 100=0. 00 500 1-1,7
500 XIG0-XI00+A(I)*(Y(I)-YB).*2 X IG-TJ+X 100 VS=AO/CIRO VSC-A0/CIRC E-YB-CE
C C COMPOSITE SECTION C EFFECTIVE TOP FLANGE WIDTH
X( 1 )=SL*12. /4. X(2)=GS*12. X (3) =TD* 12. +83 BE- 10000. DO 520 1=1.3 IF(BE.OT.X(I)) BE-X(I)
520 CONTINUE IF ((D3.EQ.0.0).AND.(D5.EQ.0.0)) BE=C'S*12. XNE=SQRT ( FCD/FCO) A( 1 )=XNE*BE*TD A( 2) -AG
E-25 E- 26
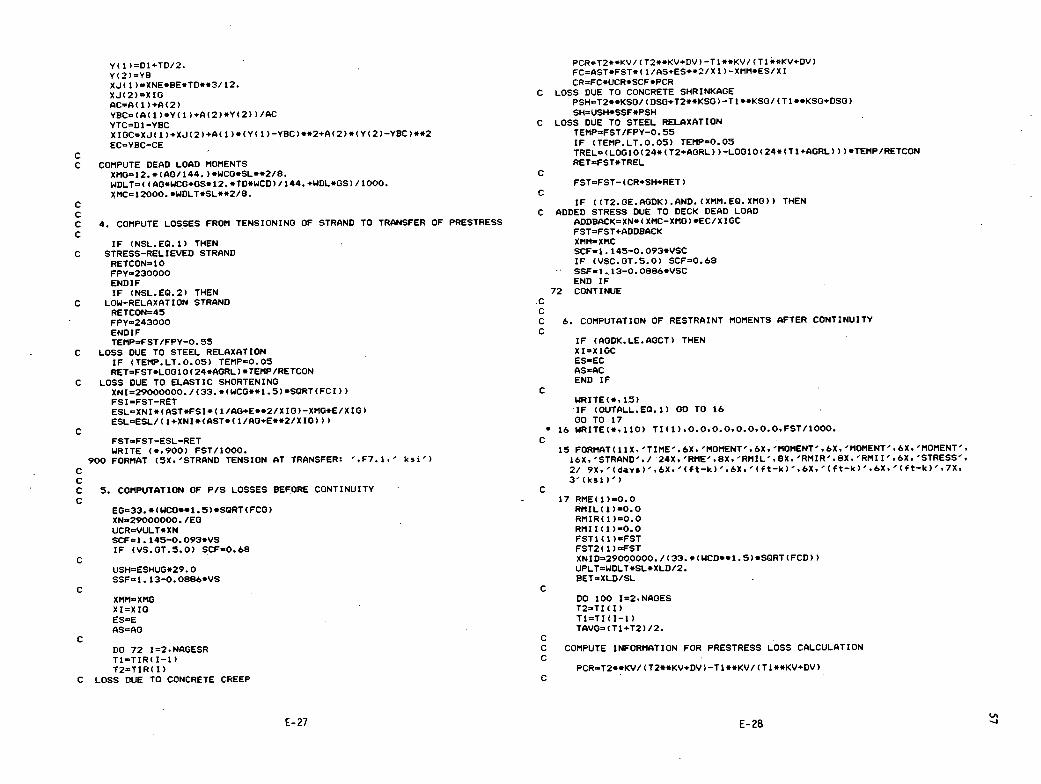
( j )=flj+TD/2. Y(2)Y8 X..J( I )=XNE*BE*T0**3/i2. XJ(2)XIG ACA( 1 )+A(2) YBC(A( 1 )*Y( 1 )+A(2)*Y(2) )/AC YTC=D1-YBC XIGC=XJ(1)+XJ(2)+A(i)*(Y(1)-YBC)4*2+A(2)*(Y(2)-YBC)**2 EC=YBC_CE
C C COMPUTE DEAD LOAD MOMENTS
XMO=12.*(AO/144. ).WCO*SL**2/8. WDLT=( (AO*WCG+OS*12. *TD*WCD) /144. +WDL*GS) /1000. XMC=12000. *WDLT*SL**2/8.
C C
COMPUTE LOSSES FROM TENSIONING OF STRAND TO TRANSFER OF PRESTRESS C
IF (NSL.E0.1) THEN C STRESS-RELIEVED STRAND
RETCON 10 FPY230000 END IF IF (NSL.EQ.2) THEN
C LOW-RELAXATION STRAND RETCON45 FPY243000 END IF TEMPFST/FPY-0. 55
C LOSS DUE TO STEEL RELAXATION IF (TEMP.LT.0.05) TEMP0.05 RET=FST*LOOi0(24*AORL ) eTEMP/RETCON
C LOSS DUE TO ELASTIC SHORTENING XNI=29000000./(33.*(WCO**1.5)*SQRT(FCI)) FSI..FST-RET ESL=XNI*(AST*FSI*( 1/AO+E*e2/XIG)-XMG*E/XIO) ESLESL/(1+XNI*(AST*(1/AG+E**2/XIO)))
C FST=FST-ESL-RET WRITE (e.900) FST/1000.
900 FORMAT (5X.'STRAND TENSION AT TRANSFER ,F7.1.' ksj') C C
COMPUTATION OF P/S LOSSES BEFORE CONTINUITY C
EO33. *(WCO**1.5)*SQRT(FCG) XN-29000000./EO UCRVULT*XN SCF1. 145-.O.093*V5 IF (VS.GT.5.0) SCF-0.68
C USH=ESHUG*29. 0 SSF=1. 13-0. 08$6*VS
C XMMXMG XI=XIO ES=E AS=AO
C DO 72 12.NAOESR T1=TIR( I-i) T2=TIR( I)
C LOSS DUE TO CONCRETE CREEP
PCR=T2**KV/ (T2**KV+OV)-T1**KV/ (T1**KV+DV) FC=ASTCFST*( 1 /AS+ES**2/X I )-XMM*ES/XI CR=FC*UCR*SCF*PCR
C LOSS DUE TO CONCRETE SHRINKAGE PSHT2**KSO/ (DSO+T2**KSG ) -Ti **KSG/ (Ti e*K5G+DSG) SHUSH*SSF*PSH
C LOSS DUE TO STEEL RELAXATION TEMPFST/FPY-O. 55 IF (TEMP.LT.O.05) TEMP0.05 TREL.,(LOO1O(24*(T2+AORL) )-LOG1O(24*(Ti+AGRL) ) )*TMP/RETN RET=FST*TREL
C FSTFST-(CR+SH+RET)
C IF ((T2.GE.AGDK).AND.(XMM.EQ.XMO)) THEN
C ADDED STRESS DUE TO DECK DEAD LOAD ADDBACK=XN* ( XMC-XMO ) *EC/X IOC FST=FST+ADDBACK XMMXMC SCF=i. 145-O.093*VSC IF (VSC.GT.5.0) SCF0.68 5SF-I .13-0. 0886*VSC END IF
72 CONTINUE C C
COMPUTATION OF RESTRAINT MOMENTS AFTER CONTINUITY C
IF (AODK.LE.AOCT) THEN XI-XIGC ES-EC AS=AC END IF
C WRITE(*. 1.5) IF (OUTALL.EQ . 1) 00 TO 16 GO TO 17
16 WRITE(*,110) TI(1),O.O,O.O,0.O,0.0,FST/1000. C
15 FORMAT(11X. 'TIME',oX. 'MOMENT'.óX. 'MOMENT',oX, 'MOMENT',oX. 'MOMENT', 16X,'STRAND'./ 24X,'RME',8X,'RMIL',8X,'RMIR',8X,'RMII',6X,'STRESS'. 2/ 9X,'(d5)',6X,'(ct-k)',6X.'(ft-k)',6X,'(Ftk)',6X,'(ftk)'17X. 3' (ksi)')
C - 17 RME(i)=O.O
RMIL( I )-O.O RMIR( 1 )0.O RMI 1(1 )0.O FSTI (1 )FST FST2( 1 )FST XNID29000000./(33.*(WCD**1.5)*SQRT(FCD)) UPLTWDLT*SL*XLD/2. BET=XLD/SL
C DO 100 I=2.NAGES T2TI (I) Ti=TI (I-i) TAVO=(Ti+T2)/2.
C C COMPUTE INFORMATION FOR PRESTRESS LOSS CALCULATION C
PCRT2**KV/ ( T2*CKV+DV ) -Ti e*KV/ (TI e*KV+DV) C
UI E-27 E-28

PSHT2**KSG/(DSO+T2**KSG)-T1**KSG/(T1**KSO+DSO) L2SL-2.*L1 LA
SH=USH*SSF*PSH C 00
TEMP(0.5*(FSTl(I-1)+FST2(I-1)))/FPY-0.55 IF (TEMP.LT.0.05) TEMP=0.05 TEM2(LO010(24*(T2+AGRL) )-LOG1O(24*(Tl+AORL)) )*TEMP/RETCUN
C C LOADING AGE CORRECTION FACTOR
CLA1. 13*TAVO**(-0.094)
PHI FACTOR PHI VULT*PCR
CREEP EFFECT FACTOR FOR PRESTRESS AND DEAD LOAD CREEP CMFCI-EXP( -PHI*CLA)
CREEP EFFECT FACTOR FOR DIFFERENTIAL SHRINKAGE CMFS=CMFC/ (CLA*PH I)
COMPUTE COMPONENTS FOR RESTRAINT MOMENTS
1.DIFFERENTIAL SHRINKAGE STRAIN IF (T2.LT.AODK) THEN XMS(I)0.O 00 TO 20 END IF T2D=T2-AGDK T1D..Ti-AOOK TAVOD(T2D+T1D) /2. FCDTFCD*TAV0D/ ( ALPHD+BETAD*TAVGD) EDCK-33. *WCD*.1 • 5*5QRT ( FCDT) / 1000. XND-29000. /EDCK
C DISCHINOER MODIFICATION AFTER AGDISCH DAYS IF (TID.OE.AODISCH) THEN XMOD-C l.-EXP(-VULT*XNID*DRHO/( 1+DRHO*XND) ) )/(VULT*XNID*DRHO) IF (RMII(I-1).OT.0.0) XMOD=1.0 ESHUDMESHUD*XMOD ELSE ESHUDMESHUD END IF DSSESHUDM*T2D**KSD/ (DSD+T2D*eKSD) DSSDSS-ESHUDMeT 1 D**KSD/ C DSD+T I D**KSD> DSScDSS-ESHUO*(T2e*KSO/ (DSO+T2**KSO)-Tl**KSO/(T1**KSO+DSG)>
C IF (TID.GT.28) THEN * COMP-1 .+EDCK.TD*OS*12. / (EO*A0/i000.) DSS.DSS/COlP END IF
C XMS( I )DSS*EDCK*TD*OS*(YTC+TD/2. ) /1000000.
C 20 CONTINUE
C C 2.DEAD LOAD CREEP
XMDLXMM/ 12000.
3.PRESTRESS CREEP El -YBC-DSC E2YBC-SSC IF (T2.LE.AODK) THEN E1YB-DSC E2-YB-SSC END IF E3DSC-WSC - LLXDR*SL
3A. END SPANS CALCULATE PRESTRESS LOSS XMRl12000.*RME(I-1 )/2. FSlFSTi-(I-t) FCI=AST*FS1*(1/AS+ES**2/XI)-(XMM+XMR1).ES/XI CRI=FCI*UCR.SCF*PCR RET1=TEM2*FS1 FST1 (I )=FST1 (I-I )-(CR1+SH+RETI)
FPElASTD*(FST1 (I )+FS1 )/2. P1 lNDS*FPEl/1000. P21NSS*FPE1 /1000.
XMPSI( I)=CPI1*(El+E3*(L1+L2)/SL)+P21*E2)/12
C SB. INTERIOR SPANS C CALCULATE PRESTRESS LOSS
XMR212000.*RMII (I-i) FS2=FST2( I-i) FC2AST.FS2* ( 1 /AS+ES**2/X I) - ( XMM+XMR2 ) *ES/X I CR2FC2*UCR*SCFePCR RET2TEM2*FS2 FST2( I )FST2( I-i )-(CR2+SH+RET2)
C FPE2ASTD*(FST2( I )+FS2)/2. P12NDS*FPE2/ 1000. P22NSS.FPE2/ 1000.
C XMPS2(I )(Pi2*CEl+E3*(Ll+L2)/SL>+P22*E2)/i2
C C CALCULATE RESTRAINT MOMENTS C
IF (NSP.EQ.2) BET1.5*XLD/SL CEND--1/( i+BET/ALPHA) TEMPECMFS*1.5*XMS( I )+CMFC*(XMDL-l.5*XMPSI (I)) IF (NSP.EQ.2) THEN RME( I )RME( I-i )+TEMPE*CEND 00 TO 90 END IF
UPLIFT ANALYSIS IF (((XMR1+XMR2)/2.).GE.0.0) SIGNi1.0 IF ((CXMR1+XMR2)/2.).LT.0.0) SIONI=0.0 IF (((j+BET*$IGN1)*ABS(RME(I-1))-AB$(RMIL(I-1))).OE.UPLT) THEN TEMP2-4. *( 1 • +BET/ALPHA)*TEMPE+3. *( 1 • +2. *BET/ALPHA)*TEMPI TEMP2-TEMP2/( 1.-8.*( j+BET/ALPHA)) TEMP3-2. *TEMPE-3. *.TEMPI-4. *TEMP2 IF (NSP.E0.3) THEN TEMP2--( TEMPI+TEMPE) TEMP3-(TEMPI+TEMPE) END IF RMIL(I)RMIL(I-1)+TEMP2 - RMIR(I)=RMIR(I-i)+TEMP3 RME( I )RME( I-i )+TEMP2 ELSE
CINT=(-3.+6.*(1+BET/ALPHA))/(i.-4.*(1.+BET/ALPHA)*(1.+BET/ALPHA)) TEMPI-CMFS*XMS( I)+CMFC*(2. *XMDL/3.-XMPS2( I)) RMII (I )-RMII (I-I )+TEMPI*CINT
E-29 E-30
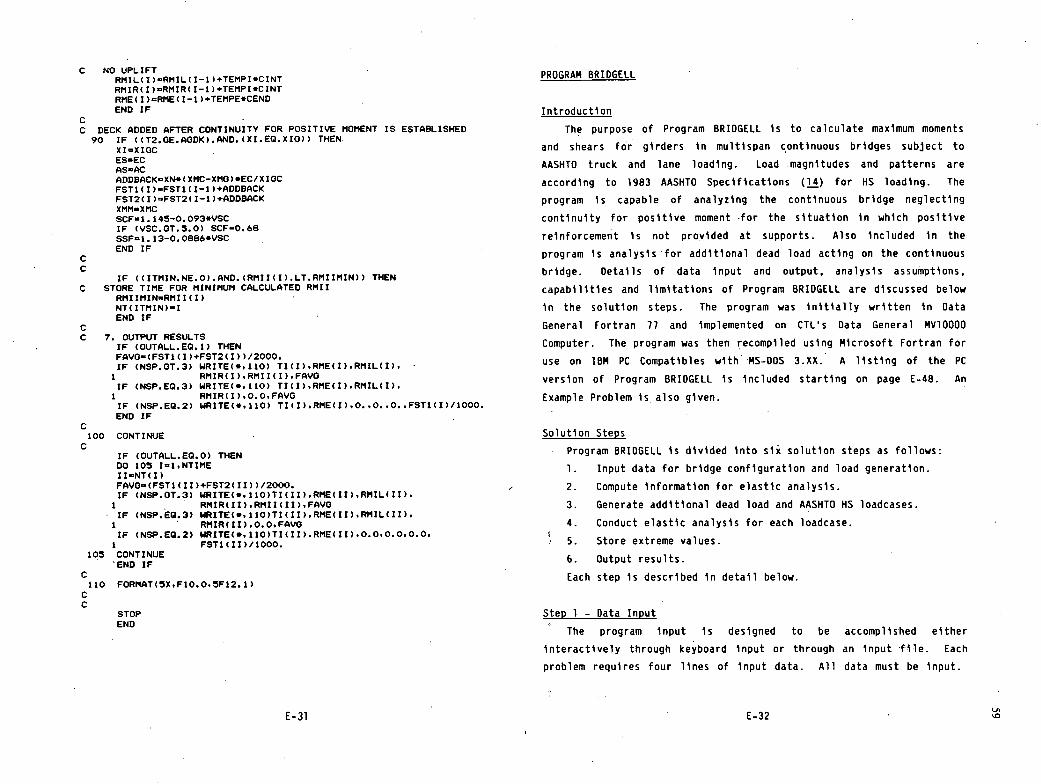
C NO UPLIFT RMIL( I )-RMIL( I-i )+TEMPI*CINT RMIR( I )-RMIR( I-i )+TEMPI'CINT RME( I )=RME( I-i )+TEMPE*CEND END IF
C C DECK ADDED AFTER CONTINUITY FOR POSITIVE MOMENT IS ESTABLISHED 90 IF ((T2.OE.AGDK).AND.(XI.EQ.XIO)) THEN.
xI=xIOC ESEC AS-AC ADDBACK-XN' ( XMC-XMO ) *EC/X bC FST1 (I ).FST1 (-1 )+ADDBACK FST2( I )-FST2( 1-1 )+ADDBACK XMMXMC SCF1. 145-0. 093*VSC IF (VSC.OT.5.0) SCF=0.68 9SF-1. 13-0. 08$6*VSC END IF
C C
IF ((ITMIN.NE.0).AND.(RMII(I).LT.RMIIMIN)) THEN C STORE TIME FOR MINIMUM CALCULATED RMII
RMIIMIN-RMII(I) NT( ITMIN)-b END IF
C C 7. OUTPUT RESULTS
IF (OUTALL.EQ.1) THEN FAVO(FSTI (I )+FST2( I) >/2000. IF (NSP.OT.3) WRITE(,,iiO) TI(I),RME(I),RMIL(I),
RMIR(b),RMII(I).FAVO IF (NSP.EQ.3) WRITE(*,110) TI(I),RME(I).RMIL(I),
RMIR(I),0.O,FAVG IF (NSP.EQ.2) WRITE(e.ilO) TI(I),RME(I),0.,0..0..FST1(I)/1000. END IF
C 100 CONTINUE C
IF (OUTALL.EQ.0) THEN DO 105 I-1,NTIME II-NT( I) FAVO-(FST1(II)+FST2(II) >12000. IF (NSP.OT.3) WRITE(*, i10)TI( II),RME(II),RMIL(II).
1 - RMIR(II).RMII(II).FAVO IF (NSP.EQ.3) WRITE(.,110)TI(II),RME(II),RPIIL(II).
1 RMIR(II).0.0,FAVO IF (NSP.EQ.2) WRITE(*, 110)TI( II ).RME( II ),0.0,0.0,0.0,
1 FST1(II)/1000. 105 CONTINUE
'END IF C 110 FORMAT(5X,F10.0,5F12.1) C C
STOP END
PROGRAM BRIDGELL
Introduction
The purpose of Program BRIDGELL is to calculate maximum moments
and shears for girders in multispan continuous bridges subject to
AASHTO truck and lane loading. Load magnitudes and patterns are
according to 1983 AASHTO Specifications (14) for HS loading. The
program is capable of analyzing the continuous bridge neglecting
continuity for positive moment -for the situation in which positive
reinforcement is not provided at supports. Also included in the
program is analysis for additional dead load acting on the continuous
bridge. Details of data input and output, analysis assumptions,
capabilities and limitations of Program BRIDGELL are discussed below
in the solution steps. The program was initially written in Data
General Fortran 71 and implemented on CTLs Data General MV10000
Computer. The program was then recompiled using Microsoft Fortran for
use on IBM PC Compatibles with MS-DOS 3.XX. A listing of the PC
version of Program BRIDGELL is included starting on page E-48. An
Example Problem is also given.
Solution Steps
Program BRIDGELL is divided into six solution steps as follows:
Input data for bridge configuration and load generation.
Compute information for elastic analysis.
Generate additional dead load and AASHTO HS loadcases.
Conduct elastic analysis for each loadcase.
Store extreme values.
Output results.
Each step is described in detail below.
Step 1 - Data Input
The program input is designed to be accomplished either
interactively through keyboard input or through an input file. Each
problem requires four lines of input data. All data must be input.
E-31 E-32

The program will not assign default values. Data is input on
unformatted lines. Input values must be separated by comas or blank
spaces. Input values must correspond to the variable type, either
Integer or Real. Real values may be input with or without a decimal
point. Integer values must be input without a decimal point.
Line 1 is for identification of the run. A description of up to
20 characters within single quotation marks should be entered on this
line.
Line 2 contains the variables OTCD, GS, NSP, and WDL. Program
output is controlled by the specified value of OTCD. If "1' is
entered, generated loads, shears, and moments for each loadcase,
extreme shears, and moments for live load only, and extreme shears and
moments for live load plus impact are output. If "2" is entered,
extreme shears and moments for both live load and live load plus
impact are output. An input value of "3" results in output of extreme
shears and moments from live load only. An input value of "4" results
in output of extreme shears and moments from live load plus impact
only. OTCD is an Integer variable. The girder spacing in feet is
entered for the Real variable GS. NSP contains the number of spans in
the continuous bridge. NSP is an Integer variable. WDL is the
additional dead load due to parapet, wearing surface, etc. in psf. If
WDL is set equal to zero, the analysis for additional dead load is not
done.
Line 3 contains the vector SL.. The lengths, in feet, of each of
the NSP spans in the bridge are to be entered for this variable. SL
is a Real variable. The number of values entered on Line-3 must equal
NSP.
Line 4 contains the variables XLD, NPTS, NAXSP, NLPTS, NPTINC, and
NPSCON. XLD is a Real variable used to establish the magnitude of the
AASHTO HS truck and lane loads. The live load is. determined by
multiplying AASHTO HS20-44 load magnitudes by XLD. Therefore, with
XLD equal to 1.0, live load will be HS20-44. A multiplier of 1.25
entered for XLD will result in HS25 live load.
The variables NPTS and NAXSP control the quantity and
configuration of HS truck loads applied to each span of the bridge, as
shown in Fig. E-5a. NPTS is the number of locations of the HS truck
within each span. Truck location is controlled by the position of the
truck's central axle. In addition to truck locations within the span,
the central axle is placed at each support. NAXSP controls the number
of axle spacings for variable spacing from 14 to 30 ft of the third
axle, as shown in Fig. E-5b. The minimum value for NAXSP is two. In
this case the HS truck's third axle is placed at 14 and 30 ft. For
each truck location, the bridge is analyzed with NAXSP axle spacings
for both directional orientations of the truck.
The variables NIPTS and NPTINC control the locations of point
loads applied in conjunction with AASHTO HS lane load. For each span
in which a point load is applied in addition to uniform load, NLPTS
specifies the number of locations for the point load, as shown in
Fig. E-6. The locations of point loads are controlled by NPTINC. The
spacing of the point loads is equal to the span length divided by
NPTINC. The loads are arranged such that the distribution of point
loads is centered about midspan of the subject span. NLPTS should be
entered as an odd number in order that an equal number of locations
are provided on each side of midspan. If NLPTS is greater than
NPTINC, the program adjusts the, value of NLPTS such that point* loads
fall within the length of the subject span.
The variable NPSCON controls the 'method of analysis used for
loadcases in which positive moments occur ,at supports of the
continuous bridge. For determination of live load plus impact moments
on the continuous structure, the nature of continuity at supports must
be considered for various load configurations. If 'positive moment
reinforcement is not provided, no reliable positive moments can
develop at supports. For AASHTO truck loads occurring on one span of
a multispan bridge, this implies that the continuous structure for
resisting the load consists of three spans for a loaded interior span
and two spans for a loaded end span. For a loaded interior span of a
fully continuous bridge, negative moments occur at the two supports
adjacent to the loaded span and positive moments occur at the next
E-33 E-34

18k
11' SL
Ex. NPTS = 4 X = Truck locations controlled by NPTS + = Truck locations at supports
(a) Truck Central Axle Locations
Variable spacing of third axle, 32k
8k 32k f Th
14 ¶ 14
f Ex. NAXSP=3
22
30
(b) Variable Axle Spacing
SLJ2 SLJ2
Ex. NLPTS=5
X = Locations for Point Load.
Fig. E-5 AASHTO N520-44 Truck Loading Fig. E-6 AASHTO HS20-44 Lane Loading
E-35 E-36
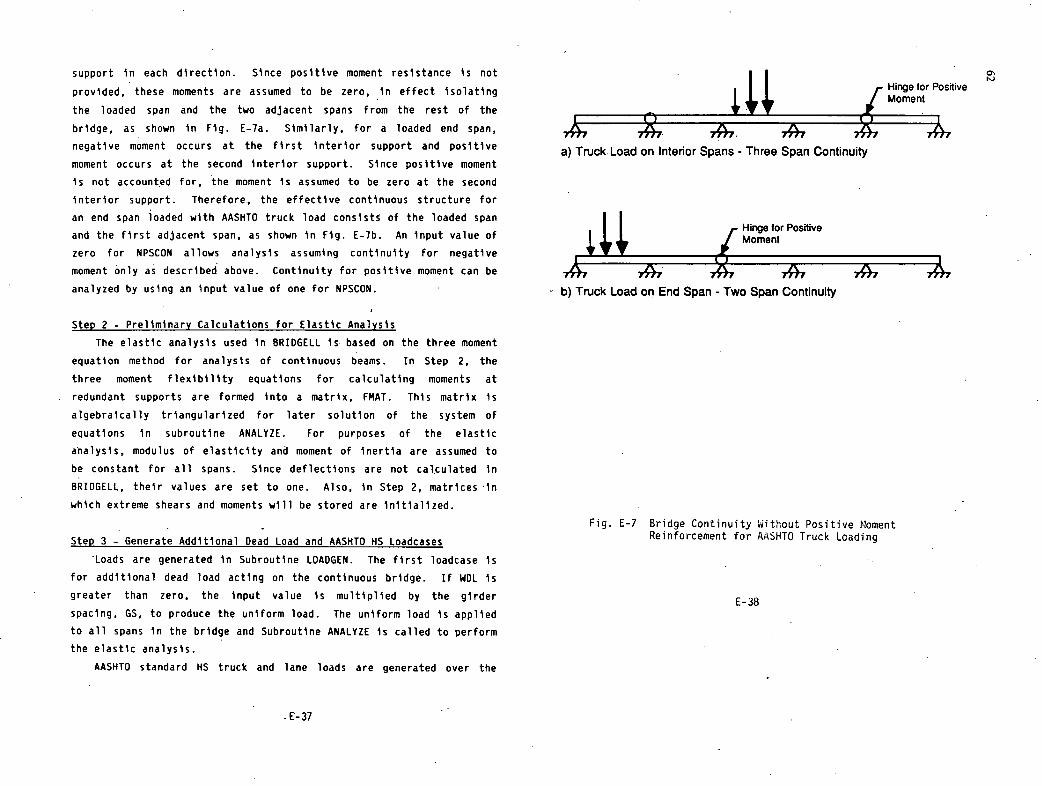
tive
a) Truck Load on Interior Spans - Three Span Continuity
support in each direction. Since positive moment resistance is not
provided, these moments are assumed to be zero, in effect isolating
the loaded span and the two adjacent spans from the rest of the
bridge, as shown in Fig. E-la. Similarly, for a loaded end span,
negative moment occurs at the first interior support and positive
moment occurs at the second interior support. Since positive moment
is not accounted for, the moment is assumed to be zero at the second
interior support. Therefore, the effective continuous structure for
an end span loaded with AASHTO truck load consists of the loaded span
and the first adjacent span, as shown in Fig. E-lb. An input value of
zero for NPSCON allows analysis assuming continuity for negative
moment only as described above. Continuity for positive moment can be
analyzed by using an input value of one for NPSCON.
Step 2 - Preliminary Calculations for Elastic Analysis
The elastic analysis used in BRIDGELL is. based on the three moment
equation method for analysis of continuous beams. In Step 2, the
three moment flexibility equations for calculating moments at
redundant supports are formed into a matrix, FMAT. This matrix is
algebraically triangularized for later solution of the system of
equations in subroutine ANALYZE. For purposes of the elastic
analysis, modulus of elasticity and moment of inertia are assumed to
be constant for all spans. Since deflections are not calculated in
BRIDGELL, their values are set to one. Also, in Step 2, matrices 'in
which extreme shears and moments will be stored are initialized.
Step 3 - Generate Additional Dead Load and AASHTO HS Loadcases
Loads are generated in Subroutine LOADGEN. The first loadcase is
for additional dead load acting on the continuous bridge. If WDL is
greater than zero, the input value is multiplied by the girder
spacing, GS, to produce the uniform load. The uniform load is applied
to all spans in the bridge and Subroutine ANALYZE is called to perform
the elastic analysis.
AASHTO standard HS truck and lane loads are generated over the
Hinge for Positive Moment
b) Truck Load on End Span - Two Span Continuity
Fig. E-7 Bridge Continuity Without Positive Noment Reinforcement for AASHTO Truck Loading
E- 38
£-37 -

f) Maximum Negative Support Moment
Maximum Positive Support Moment
Uniform on AlISpans, Point Near Each Support
Maximum Positive Midspan Moment
length of the continuous bridge. For each loadcase, the bridge is
analyzed and extreme shears, midspan moments, and support moments are
stored if extremes from previous loadcases are exceeded. The analysis
is described in Step 4 below. Generation of truck and lane loads is
done in subroutine LOADGEN. The magnitude of HS20-44 loads are
modified by the factors XLD, described previously, and 0.5 to reduce
axle load to wheel load. The lateral distribution of wheel loads is
accounted for using the fraction of wheel load term for bridges with
two or more lanes of traffic and a concrete deck supported on
prestressed concrete girders.
AASHTO HS truck loads are applied to each span with quantity and
location determined by user input values of NPTS and NAXSP. As shown
in Fig. E-5a, truck loads are placed throughout each span by locating
the central axle at evenly spaced points along the span. For each
location of the central axle, the truck is configured with various
axle spacings for both directional orientations. When the truck is
located over interior supports such that axles are loading separate
spans, the point loads are correctly located by subroutine LOCATE.
Point loads which fall outside the length of the bridge when the truck
is near either end are ignored.
Lane loadcases are applied in various patterns over the length of
the bridge. For most lane load patterns, the lane load is made up of
uniform load plus a single point load applied in different patterns.
For patterns configured to produce maximum negative moments at
supports, the lane load consists of uniform load plus two point loads
applied to selected spans. For each span in which a point load is
applied, the number of point load applications and their locations are
controlled by the variables NLPTS and NPTINC, as described
previously. Six categories of lane* load patterns shown in Fig. E-8
are used in the program.
The first load pattern shown in Fig. E-Ba, involves loading each
individual span with uniform load plus point load. For the second and
third patterns, shown in Figs. E-8b and c, the entire bridge is loaded
with uniform load and point loads are placed sequentially in each span
Hinge for Positive Moment
Uniform Plus Point on Individual Spans
Uniform on All Spans, Point on Each Individual Span
Fig. E-8 AASHTO Lane Load Patterns Analyzed in BRIDGELL
E-39 E-40

and near each support, respectively. The fourth pattern, shown in
Fig. E-Bd, produces maximum positive midspan moments. The span in
which maximum midspan moment is to be induced is loaded with uniform
and point loads and alternate spans are loaded with uniform load. The
fifth pattern, shown in Fig. E-8e, causes maximum positive moment to
occur at an interior support. The two spans imediately adjacent to
the support are not loaded. The second span away from the support and
alternate spans in each direction are loaded with uniform load. The
point load is placed separately in each of the loaded spans nearest
the support. The last load pattern, shown in Fig. E-8f, causes
maximum negative moment to occur at an interior support. The two
spans adjacent to the support are loaded with both uniform and point
loads. Alternate spans are also loaded with uniform load.
Lane load patterns are generated to produce maximum positive
midspan moments in each of the spans as well as maximum negative and
positive moments at each interior support. For the third loadcase, in
which point loads are placed near supports to produce maximum shear
forces, the heavier point load specified by AASHTO Section 3.7.1.3 is
applied. For each lane load configuration in which a point load is
applied within a span, the pattern of uniform load is repeated for
each point load location specified by the variables NLPTS and NPTINC.
For the sixth load pattern, two point loads are applied as given in
AASHTO specifications and the locations of both point loads are varied
for each pattern of uniform loading. For each application of uniform
load, the entire span length is loaded.
Step 4 - Elastic Analysis
For each loadcase generated in subroutine LOADGEN, subroutine
ANALYZE is called to conduct an elastic analysis of the continuous
beam under the applied loads. The first step of the analysis is to
calculate simple span end rotations under the applied loads. The
moments at redundant supports which result from restoring continuity
of adjacent spans are calculated using the information generated in
Step 2. Shear forces for each span due to imposed loads and redundant
moments are then calculated. Reactions at each support are calculated
a.'
from shear forces and the overall equilibrium of the bridge is
checked. The next step is to determine maximum midspan moments for
each span. If a span is not loaded or has end shears of the same
sign, the average of end moments is stored. If the span has end
shears of opposite sign, the location of maximum midspan moment is
found by locating the point within the span where shear is zero. The
magnitude of maximum midspan moment is then calculated from support
moment, shear, and applied loads.
For AASHTO truck load cases and AASHTO lane load on an individual
span, the elastic analysis is conducted for the reduced continuous
structure if the user enters zero for NPSCON. For a loaded exterior
span, the loaded span and adjacent span are analyzed. For a loaded
interior span, the loaded span and the two adjacent spans are
analyzed. If the user enters one for NPSCON, the full structure is
analyzed for all load cases. Regardless of the value of NPSCON, the
full structure is analyzed for the AASHTO lane loadcases shown in
Fig. E-8 b through f.
Step 5 - Store Extreme Moments and Shears
After the elastic analysis in subroutine ANALYZE is completed for -
a loadcase, resulting shears and moments are compared to extreme
values from preceding loadcases. Maximum end shears, maximum midspan
moments, and maximum and minimum support moments are updated after
each analysis. Locations of maximum midspan moments are also stored.
Step 6 - Output Results
Depending on the user-specified value of OTCD, varying amounts of
information are output by Program BRIDGELL. If OTCD is entered as 1,
all information generated by the program is output. During load
generation, subroutine OUTPUT2 outputs each loadcase. Loads are
specified by loaded span, load magnitude in kips or kips per ft. and
load location. Point load locations are in feet from the left support
of the loaded span. Uniform loads are indicated by -l' output for
E-41 E-42

load location. After a set of loads is output, results of the elastic
analysis for those loads are output at the end of subroutine ANALYZE.
Support reactions and moments, span lengths, end shears, maximum
midspan moments, and locations of maximum midspan moments are output
for the entire bridge.
After all loadcases have been analyzed, maximum and minimum
support moments, maximum shears, and maximum midspan moments and
locations are output for each support and each span. Extreme values
are output for live load only and live load plus impact. Impact
factors for shears and midspan moments are calculated from the length
of the subject span. Impact factors for support moments are
calculated from the average of the lengths of the two adjacent spans.
If 2 is entered for OTCD, extreme values for live load and live load
plus impact are output. For OTCD equal to 3, extreme results for live
load only are output. For OTCD equal to 4, extreme results for live
load plus impact are output.
If WDL is greater than zero, results of the analysis for
additional dead load are output. Included in this output are
reaction, shear, and moment for each support, and maximum moment and
location for each span.
Support moments and midspan moments are output for each span for
the loadcase which causes maximum midspan moment. The support moments
are for use in determining the degree of continuity for the bridge as
described in Chapter Three of this report.
Users Input Instructions
This section contains instruction for running Program BRIDGELL.
For each case problem, data input consists of four lines containing
the Information in Table E2. Each variable is described below. All
variables should be entered as Integer values unless otherwise noted.
Character data must be entered within single quotation marks.
Line 1:
TITLE - Identification of case problem (Character)
Line 2:
OTCD - Control for program output, equal to 1, 2, 3, or 4
GS - Girder spacing, ft (Real)
NSP - Number of spans in bridge
WDL - Uniform load due to additional dead load, psf
Line 3:
SL - Vector of span lengths, ft (NSP Real values)
Line 4:
XLD - Multiplier for magnitude of HS loads (Real)
NPTS - Number of central axle locations per span for HS truck
NAXSP - Number of axle spacings for HS truck
NLPTS - Number of point load locations for HS lane load
NPTINC - Control for spacing of point loads for HS lane load
NPSCON - Control for continuity analysis, equal to zero for
negative continuity only, equal to one for positive and
negative continuity
The program may be run interactively or in Batch mode. To run
interactively, type 'BRIDGELL" and execute. The input prompts will
then appear for each of the four lines described previously. Input
data for TITLE should be enclosed within single quotation marks. Data
should be separated by comas or blank spaces. To obtain a hard copy
of input and output while running interactively, use CTRL P to direct
all data to the printer.
In Batch mode, an input file must be set up containing all
required data. Following is data contained in a file "DATAl" on the
disc:
1100 FT. 4 SPAN' 2 8.0 4,30. 100. 100. 100. , 100 1,14,7,7, 10.0
E-43 E-44 ON tJ.

To view the data enter TYPE DATA1" and execute. To run.the example,
type the name of the batch file, in this •case 'RUNl.BAT', and
execute. File "RUNl.BAT" contains the comand "BRIDGELL <DATA1>
OUT1." This cormuand runs BRIDGELL with input file 'DATAl" and creates
output file "OUTi.' To view results enter UTYPE OUT1" and execute.
The output of this example is given- on page E-46. On pages E-48
through E-62 is a listing of Program BRIDGELL.
TABLE E2 - DATA INPUT FOR BRIDGELL
Line Number Parameters
1 - TITLE
2 OTCD, GS, NSP, WDL
3 SL (1 ... NSP)
4 . XLD, NPTS, NAXSP, NLPTS, NPTINC, NPSCON
C.
ENTER: TITLE. ENTER: 1: TO OUTPUT ALL RESULTS
TO OUTPUT EXTREMES FOR LL AND LL.-I TO OUTPUT EXTREMES FOR LL ONLY TO OUTPUT EXTREMES FOR LL+I ONLY
GIRDER SPACING. (ft) NUMBER OF SPANS. ADDITIONAL DEAD LOAD. (sfl
ENTER: SPAN LENGTHS. (ft) ENTER: MULTIPLIER FOR HS20-44 LOAD.
FOR HS TRUCK LOAD' NUMBER OF CENTRAL AXLE LOCATIONS PER SPAN. NUMBER OF AXLE SPACINGS. (NAXSP GE 2) FOR HS LANE LOAD: NUMBER OF POINT LOAD LOCATIONS PER SPAN. LOCATION INCREMENT. 1 FOR • -. . 0 FOR - ONLY CONTINUITY.
... ADDITIONAL DEAD LOAD' 30.00 psf U..
SPAN SPRT SPAN REACTION LEFT RIGHT SUPPORT MAX SPAN LOCATION
LENGTH SHEAR SHEAR MOMENT MOMENT
ft kip kip kip ft-kip ft-kip ft
1 9.43
00 1 100.00 9.43 -14.57
185.20 39.29
2 27.43 -257.14 2 100.00 12.86 -11.14
87.24 53.57
3 22.29 -171.43 3 100.00 11.14 -12.86
87.24 46.43
4 27.43 -257.14 4 100.00 14.57 -9.43
185.20 60.71
5 9.43 .00
4ASHTO HS TRUCK LOAD CASES BEING ANALYZED. NUMBER OF TRUCK LOADCASES I 854 AASHTO HS LANE LOAD CASES BEING ANALYZED. NUMBER OF LANE LOADCASES : 269 TOTAL NUMBER OF LOADCASES : 1123
CALCULATED EXTREME SHEARS AND MOMENTS FOR LL. -
SPAN SPRT MAXIMUM MAXIMUM MAXIMUM MINIMUM MAXIMUM LEFT RIGHT SUPPORT SUPPORT MIDSPAN LOCATION SHEAR SHEAR MOMENT MOMENT MOMENT
kip, kip ft-kip ft-tip ft-kip ft
1 .00 .00 1 43.98 -47.87 $96.20 40.00
2 90.39 -798.92 2 46.51 -46.51 729.41 46.67
3 202.14 -723.12 3 46.51 -46.51 729.41 46.67
4 90.39 -798.92 4 47.87 -43.98 896.20 60.00
5 .00 .00
- E-46 E-45

SUPPORT MOMENTS FOR MAXIMUM MIDSPAN MOMENTS.
SPAN LEFT SPT MIDSPAN RIGHT SPT
MOMENT MOMENT MOMENT
It-Rip It-Rip It-kip
1 .00 - $96.20 -453.32
2 -372.85 729.41 -384.68
3 -372.85 729.41 -334.68
4 -453.31 896.20 .00
CALCULATED EXTREME SHEARS AND MOMENTS FOR LLI.
SPAN SPRT MAXIMUM MAXIMUM MAXIMUM MINIMUM
LEFT RIGHT SUPPORT SUPPORT
SHEAR SHEAR MOMENT MOMENT
kip Rip 1t-kip ct-Rip
1 .00 .00
53.76 -58.51
2 110.48 -976.46
2 56.85 -56.85
3 247.06 -883.81
3 56.85 -56.85
4 110.48 -976.46
4 58.51 -53.76
5 .00 .00
SUPPORT MOMENTS FOR MAXIMUM MIDSPAN MOMENTS.
SPAN LEFT SPT MIDSPAN RIGHT SPT
MOMENT MOMENT MOMENT
It-kip It-Ri. ct-Rip
1 .00 1095.35 -554.06
2 -455.70 891.50 -470.16
3 -455.70 891.50 -470.16
4 -554.05 1095.35 .00 Stop - ProlraIh termint.d.
PROGRAM BRIDGELL C C PROGRAM FOR ANALYSIS OF CONTINUOUS BEAM WITH HS LOADING FOR USE IN C NCHRP PRO,JECT 12-29 CTL PROJECT CR9907/821 C
REAL MAXPM(30),MXPMLOC(30),MINPM30),MNPMLOC(30),MOMT(30). 1 MAXNM(30),MINNM(30).MAXSHR(30.2).LDMAIS(30).LDL0C(30), 2 MAXPMI-(30),MAIPM2(30)
DIMENSION SL(30).FACT(30) .THETO(31 ) FMAT(30.2) ,REACT(31 ),LDSP(30). 1 PMOMT(30) • XMLOC(30) .SHEAR(30,2) .PTLD(20) .PTLO':2o) CHARACTER.20 TITLE COMMON/BLK1/ NSP,SL.GS,WDL, XIQC.EC.CITCD,NSPT,NRED,NIMP COMMON/BLK2/ MAXSHR.MAXPM,MXPMLOC.MINPrI,MNPMLOC.iAXNM,
MAXIMUM 1 MINNM, Si. 52, MAXPM1 ,MAXPM2 MIDSPAN LOCATION COMMON/BLK3/ KLD. NLD. LOSP. LDMAO. LDL'DC. NPTS.NAXSP,
MOMENT I XLD,NLPTS.NPTINC,NSPNZ,FACT.FMAT ct-Rip 1t - COMMON/BLK4/ N1,N2.NSPTR.NPSCON
1095.35 40.00 WRITE(.,*)'ENTER: TITLE.'
991.50 46.67 READ(...) TITLE C OTCD CONTROLS PROGRAM OUTPUT'
891.50 46.67 WRITE(.,*)'ENTERI 11 TO OUTPUT ALL RESULTS' - WRITE('.*)' 2: TO OUTPUT EXTREMES FOR LL AND LLI'
1095.35 60.00 WRITE(*.*)' :3: TO OUTPUT EXTREMES FOR LL ONLY' WRITE(*.*)' 4: TO OUTPUT EXTREMES FOR LLI ONLY'
C GIRDER SPACING, OS WRITE(*.*) , GIRDER SPACING. (It)'
C NUMBER OF SPANS, NSP WRITE(*.*)' NUMBER OF SPANS.'
C ADDITIONAL DEAD LOAD, WDL WRITE(*,*)' ADDITIONAL DEAD LOAD. (.sc)' READ(*,*) OTCD.GS.NSP.WDL
C SPAN LENGTHS. SL WRITE(...)'ENTER: SPAN LENOTHS. (It)'
- READ(..e) (SL(I),I1,NSP)
C ILD IS MULTIPLIER APPLIED TO HS20-44 (EX. ILD1.25 FOR H525) C FOR HS TRUCK LOAD: NPTS IS NUMBER OF LOCATIONS FOR TRUCK'S CENTRAL C AXLE PER SPAN. NAXSP IS NUMBER OF AXLE SPAcINGS BETWEEN 14' AND 30' C FOR EACH CENTRAL AXLE LOCATION. NAXSP SHOULD BE GREATER THAN OR C EQUAL TO 2. C FOR HS LANE LOAD: NLPTS IS NUMBER OF POINT LOAD LOCATIONS FOR EACH C SPAN. SL DIVIDED BY NPTINC IS THE SPACING BETWEEN DIFFERENT POINT C LOAD APPLICATIONS. THE NLPTS LOCATIONS FOR POINT LOAD APPLICATION C ARE CENTERED ABOUT MIDSPAN OF THE LOADED SPAN. AN ODD NUMBER SHOULD C BE ENTERED FOR NLPTS. C FOR CONTINUOUS BEAM ANALYSIS: NPSCON CONTROLS POSITI'1E MOMENT C CONTINUITY AT SUPPORTS. NPSCON EQUAL TO 1 IMPLIES BEAM IS C CONTINUOUS FOR NEGATIVE AND PCISITIVE MOMENTS. NPSCON EQUAL TO C ZERO IMPLIES BEAM IS CONTINUOUS FOR NEGATIVE MOMENT ONLY. C
WRITE(...)'ENTER: MULTIPLIER FOR HS20-44 LOAD.' FOR HS TRUCK LOAD:'
WRITE(*,*) , NUMBER OF CENTRAL AXLE LOCATIONS PER SPAN.' WRITE(*.*)' NUMBER OF AXLE SPACINGS. (NAXSP GE 2)' WRITE(*..)' FOR HS LANE LOAD:' WRITE(*.*)' NUMBER OF POINT LOAD LOCATIONS PER SPAN.' WRITE(*,*)' LOCATION INCREMENT.' WRITE(*.*)' I FOR + - . 0 FOR - ONLY CONTINUITY.'
C READ(*. *) XLD,NPTS.NAXSP.NLPTS. NPTINC.NP$(ON
E-47 E-48 011 -
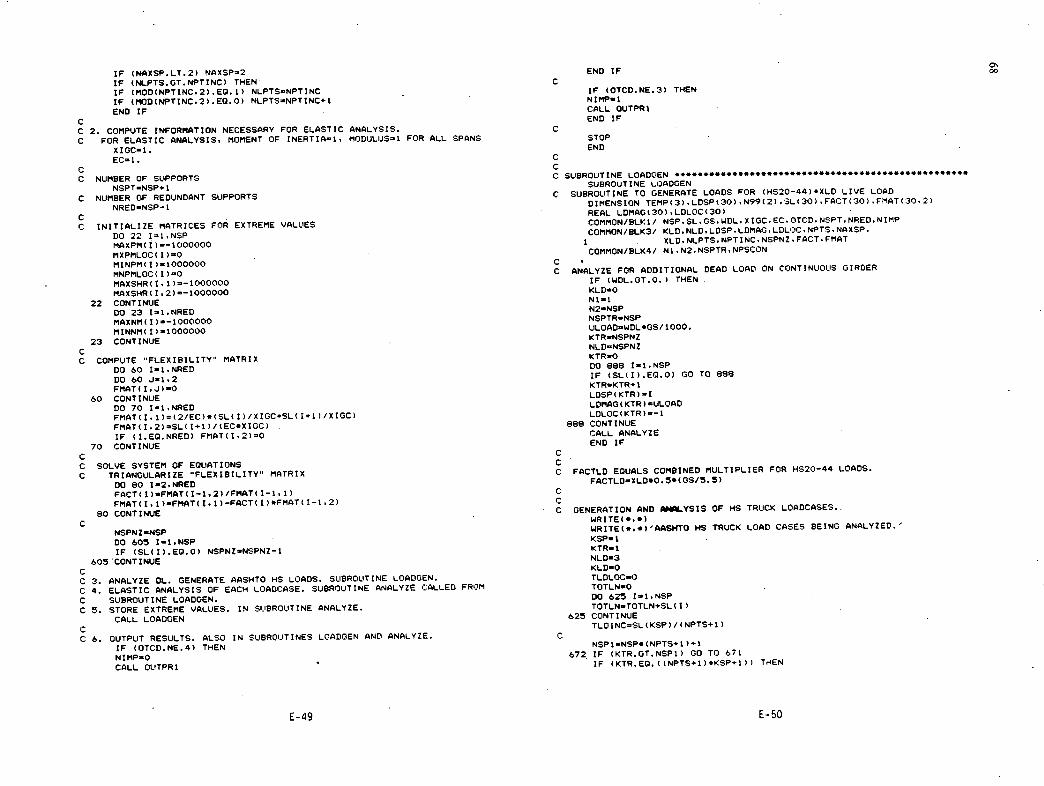
ON 00 IF (NAXSP.LT.2) NAXSP2
IF (NLPTS.GT.NPTINC) THEN IF (MOD(NPTINC.2).EQ.t) NLPTSNPTINC IF (MOD(NPTINC,2).EQ.0) NLPTSNPTINC+l END IF
C C 2. COMPUTE INFORMATION NECESSARY FOR ELASTIC ANALYSIS. C FOR ELASTIC ANALYSIS, MOMENT OF INERTIA=l, MODULUS-1 FOR ALL SPANS
XIGC1. EC1.
C C NUMBER OF SUPPORTS
NSPTNSP+ 1 C NUMBER OF REDUNDANT SUPPORTS
NREDNSP- 1 C C INITIALIZE MATRICES FOR EXTREME VALUES
DO 22 I=1.NSP MAXPM(I)-1000000 MXPMLOC(I)0 MINPM( I )-1000000 MNPMLOC( I )O MAXSHR( 1.1 )-1000000 MAXSHR( I ,2)-1O00O00
22 CONTINUE DO 23 I1.NRED MAXNM( I )-1000000 MINNM( I )1O0O000
23 CONTINUE C C COMPUTE "FLEXIBILITY MATRIX
DO 60 I-i.NRED DO 60 J=1.2 FMAT( t,.J)•O
60 CONTINUE DO 70 I=1.NRED FMAT(I,1)(2/EC)4(SL(I)/XtGC+SL(I''1)IXIGC) FMAT(I.2)SL( 1+1 )/(EC*XIGC) IF (I.EQ.NRED) FMAT(I,2)0
70 CONTINUE C C SOLVE SYSTEM OF EQUATIONS C TRIANOULARIZE FLEXIBILITY MATRIX
DO 80 I-2,NRED FACT( I )FMAT( t-i,2)/FMAT( I-i • 1) FMAT( 1.1 )FMAT( 1.1 )-FACT( I )*FMAT( 1-1,2)
SO CONTINUE C
NSPNZ.NSP DO 605 11,NSP IF (SL(I).EQ.0) NSPNZNSPNZ-1
605 'CONTINUE C C 3. ANALYZE DL. GENERATE AASHTO HS LOADS. SUBROUTINE LOADGEN. C 4. ELASTIC ANALYSIS OF EACH LOADCASE. SUBROUTINE ANALYZE CALLED FROM C SUBROUTINE LOADGEN. C 5. STORE EXTREME VALUES. IN SUBROUTINE ANALYZE.
CALL LOADGEN C C 6. OUTPUT RESULTS. ALSO IN SUBROUTINES LOADGEN AND ANALYZE.
IF (OTCD.NE.4) THEN NIMP0 CALL OUTPRI
END IF C
IF (OTCD.NE.3) THEN NIMPI CALL OUTPR1 END IF
C STOP END
C C C SUBROUTINE LOADGEN •ee*e*ee**e•********.*....*......••"
SUBROUTINE LOADGEN C SUBROUTINE TO GENERATE LOADS FOR (HS20-44)*XLD LIVE LOAD
DIMENSION TEMP(3).LDSP(30).N99(2) ,SL(30) ,FACT(30) ,FMAT(30.2) REAL LDMAO(30),LDLOC(30) COMMON/BLK1/ NSP,SL,GS.WDL, XIGC.EC,OTCD.NSPT,NRED,NIMP COMMON/BLK3/ KLD,NLO,LDSP,LDMAG. LDLOC. NPTS.NAXSP,
1 XLD,NLPTS,NPTINC. NSPNZ. FACT.FMAT COMMON/BLK4/ NI • N2,NSPTR, NPSCON
C C ANALYZE FOR ADDITIONAL DEAD LOAD ON CONTINUOUS GIRDER
IF (WDL.GT.O.) THEN KLD.0 N1.1 N2.NSP NSPTRNSP ULOADWDL*GS/ 1000. KTRNSPNZ NLDNSPN Z KTRO DO 908 I-1,NSP IF (SL(I).EQ.0) GO TO 888 KTRKTR+1 LDSP(KTR)I LDMAG ( KTR) ULOAD LDLOC (KTR ) - 1
88$ CONTINUE CALL ANALYZE END IF
C C C FACTLD EQUALS COMBINED MULTIPLIER FOR HS20-44 LOADS.
FACTLDXLD'O. 5.(GS/5. 5) C C C GENERATION AND ANALYSIS OF HS TRUCK LOADCASES..
WRITE(*.*) WRITE(*.*)'AASMTO HS TRUCK LOAD CASES BEING ANALYZED. KSP.t KTR-i NLD3 KLDO TLDLOCt) TOTLN-0 DO 625 Ii.NSP TOTLNTOTLN+SL( I)
625 CONTINUE TLOINCSL(KSP)/(NPTS+1)
C NSPI.NSP*(NPTS+1 )l
672IF (KTR.GT.NSP1) GO TO 671 IF (KTR.EQ.((NPTS+1)*KSP+1)) THEN
E-49 E-50

KSPKSP+ TLDINC-SL(KSP) / (NPTS1) KLDKLD+1 ENDIF NLD.2 DO 660 11.NAXSP LDSP(1),I KLDKLO+1 LDMAO( 1 )UNILD LDLOC(2)-TLDLOC LDLOC(l)-i LDPIAG(1)-9.ØFACTLD LDSP(2)-I LOMAG (2) -32. *FACTLD LDMAG (2) -PTLDM LDMAO(3)32.*FACTLD LDLOC(2)-SLW.(0.5-U..J-(INT(NLPTS,2. )1. ) )/NPTINC) TEMP(i)=TLDLOC-14.0 IF (OTCD.EO.i) CALL OUTPR2(KLD,NLD,LDSP,LDMAO.LDLOC) TEMP(3)-TLDLOC+14.0+30.-14.)e(I-1)/(NAXSp-1) IF (NPSCON.EQ.i) THEN 00 640 J-1.3.2 N11 IF ((TEMP(J).QT.TOTLN).OR.(TEMP(.j).LT.O.0)) THEN N2NSP LDLOC ( J ) -O NSPTRNSP LDMAG(J)0 GO TO 742 GO TO 640 END IF ELSE IF (LEQ.1) THEN LDLOC(J)-TEMP(J) NSPTR-2 ENDIF N1l
640 CONTINUE N2=2 CALL LOCATE(NSP,SL,LDSP,LDLDC,LDMAO) GD TO 742 IF (OTCD.EQ.1) CALL OUTPR2(KLD,NLD,LDSP.LOMAG.LDLCIC) END IF CALL ANALYZE IF (I.EQ.NSP) THEN
645 KLD-KLD+i NSPTR-2 LDLOC(2)-TLDLOC N1NSP-1 LOrIAGI 1 )-32.*FACTLD N2=NSP LDMAG(2)-32.*FACTLD GO TO 742 LOMAO(3)-8.*FACTLD END IF TEMP(1)TLDL0C-)4.0-30.-14.)*(I-i)/(NAxsp-1) NSPTR-3 TEMP(3)-TLDLQC#14.0 Ni-I-i DO 650 13' N2-I+l IF UTEMPLI.GT.TOTLN).OR.(TEMP(J).LT.O.0)) THEN 742 CALL ANALYZE LDLDC(J)0 745 CONTINUE LDMAG(J)0 746 CONTINUE 0010650 C ELSE C LtILOC(J)TEMP(J) Ni-I ENDIF N2NSP
650 CONTINUE NSPTR-NSP CALL LOCATE(NSP.SL,LDSP.LDLOC,LDPIAG) C UNIFORM ON ALL SPANS PLUS CONCENTRATED LOAD IN EACH SPAN IF (OTCO.EQ.i) CALL OUTPR2(KLD,NLD,LDSP,LDMAG,LDLIDC) 00 761 11.NSP CALL ANALYZE IF (SL(I).EQ.0) GO TO 761
660 CONTINUE DO 760 I1-1,NLPTS KTRKTR+1 KLD-KLD+l TLDLOC-TLDLOC+TLD I NLDNSPNZ+ 1
670 00 TO 672 KTR-O 671 CONTINUE 00 750 J-i,NSP
IF (SL(J).EQ.0) GO TO 750 NTRLDKLD - KTR-KTR4I WRITE(.,*) NUMBER OF TRUCK LOADCASES • .NTRLD LDSP(KTR)-J
LDMAO(KTR)-UNILD 999 CONTINUE LDLOC(KTR)--1
750 CONTINUE GENERATION AND ANALYSIS OF HS LANE LQADCASES. LDSP(NSPNZ+I)-I
WRITE).,.) 'AASNTO HS LANE LOAD CASES BEING ANALYZED. LDMAO(NSPNZ+1=PTLDM L'NILD.O.64*FACTLD PTLDM1.0'FACTLD IF (OTCD.EQ. 1) CALL 0UTPR2(KLD,NLD,LDSP,LDriAG,LDLC) PTLDS-26.0.FACTLD CALL ANALYZE
760 CONTINUE UNIFORM AND POINT ON INDIVIDUAL SPANS 761 CONTINUE DO 746 11.NSP C - - IF (SL(I).EQ.0) 00 TO 746 C UNIFORM ON ALL SPANS, CONCENTRATED LOAD AT EACH SIJPPORT 00 745 J1.NLPTS 00 790 11=1,2
DO 780 I=i,NSP+1
E-51 E-52
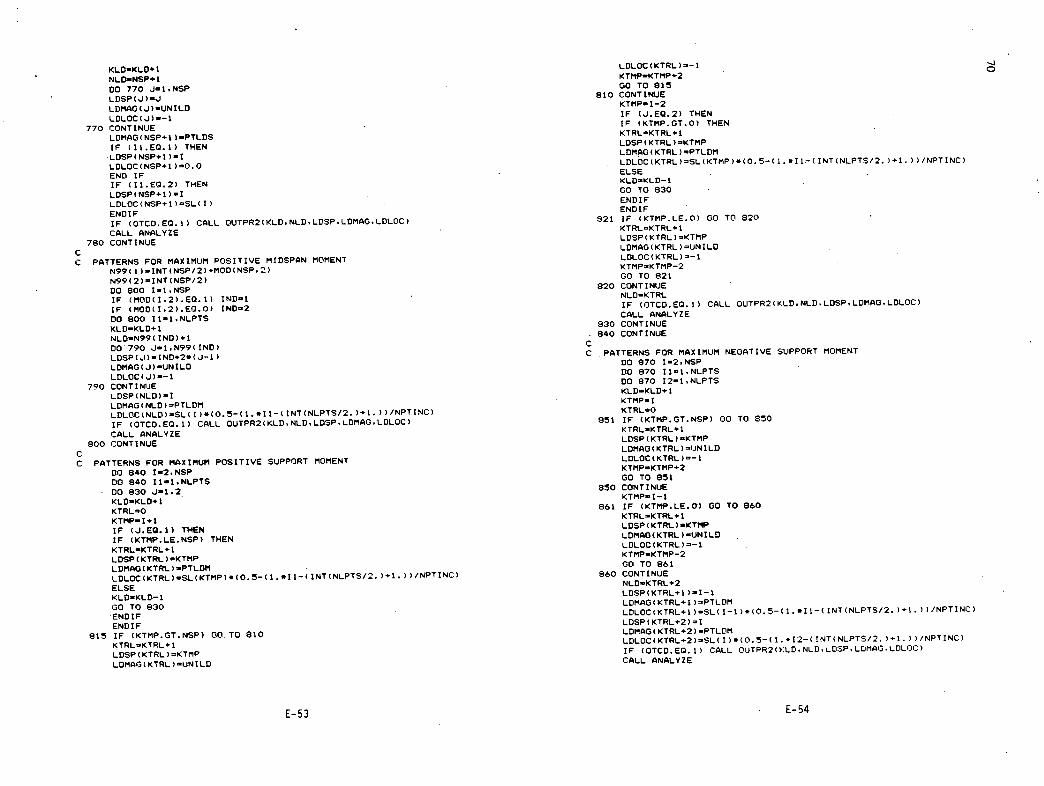
KLDKL0 1 NLD.NSP+ I 00 770 J-1.NSP LDSP(.J).J LDMAG(U)UNILD LDLOC(J)-1
770 CONTINUE LDMAG ( NSP+-I ) .PTLDS IF (II.EQ.l) THEN LDSP(NSP+l )I LDLOC(NSP+1 )O.0 END IF IF (I1.EQ.2) THEN LDSP(NSPI )I LDL0C(NSP1 )SL( I) ENDIF IF (OTCD.EQ.1) CALL 0UTPR2(KLD NLD. LDSP. LDMAG LDLOC) CALL ANALYZE
780 CONTINUE
PATTERNS FOR MAXIMUM POSITIVE MIDSPAN MOMENT N99( 1 ),INT(NSP/2)+MOD(NSP.2) N99(2)INT(NSP/2) DO 800 I-i.NSP IF (MOD(I,2).EQ.I) INDI IF (MOD(I,2).EO.0) IND2 DO 800 I1-1.NLPTS KLDKLD+ 1 NLDN99( IND)+1 00790 J-1,N99(IND) LDSP(J)IND2*(J-1) LDMAG(J)UNILD LDLOC(J)-1
790 CONTINUE LDSP(NLD)I LDMAG ( NLD ) PTLDM LDL0C(NLD)SL(I)*C0.5_(1.*I1_(INTCNLPTS/2.IT IF (OTCD.EQ.1) CALL OUTPR2(KLD,NLD,LDSP,LDMAG.LDLOC) CALL ANALYZE
800 CONTINUE
PATTERNS FOR MAXIMUM POSITIVE DO 840 12,NSP DO 840 I1.1.NLPTS DO 830 J-1.2 KLDKLD+t KTRLO KTMPI+1 IF (J.EQ.1) THEN IF (KTPIP.LE.NSP) THEN KTRL.KTRL+ 1 LDSP(KTRL).KTMP LDMAO C KTRL C -PTLDM LDLOC(KTRL)SL(KTMP)*C0.5-( ELSE KLDKLD-1 GO TO 830 'ENDIF ENDIF
915 IF (KTMP.GT.NSP) GO.TO 810 KTRLKTRL* 1 LDSP ( KTRL) KTMP LDMAG(KTRL )IJNILD
LOLOC ( KTRL) 1 KTMPKTMP#2 GO TO 815
810 CONTINUE KTMP.I-2 IF (J.EQ.2) THEN IF (KTMP.GT.0) THEN KTRLKTRL+1 LDSP C KTRL C KTMP LOMAG ( KTRL) .PTLDM LDLOC(KTRL)SL(KTMP)*CO. 5-Cl *11-( INTCNLPTS/2. 1+1. ) C /NPTINC) ELSE KLDKLD- 1 GO TO 830 ENDIF ENDIF
921 IF (KTMP.LE.0) GO TO 920 KTRLKTRL+ I LDSP ( KTRL) KTMP LDMAG(KTRL ) =IJNILD LDLOC ( KTRL) - 1 KTMPKTMP-2 00 TO 821
920 CONTINUE NLDKTRL IF (OTCD.EQ.1) CALL OUTPR2(KLD,NLD,LDSP,LDMAG.LDLOC) CALL ANALYZE
830 CONTINUE 840 CONTINUE
C C PATTERNS FOR MAXIMUM NEGATIVE SUPPORT MOMENT
DO 870 I-2.NSP DO 870 I11,NLPTS DO 970 I21.NLPTS KLDKLD+ 1 KTMP I KTRL0
851 IF (KTMP.OT.NSP) GO TO 850 KTRLKTRL4 1 LDSP C KTRL C KTPIP LDMAGCKTRL>.'JNILD LDLOC ( KTRL ) 1 KTMPKTMP+2 GO TO 851
850 CONTINUE KTMPI-1
861 IF (KTMP.LE.0) GO TO 860 KTRLKTRL+ I LDSP C KTRL C KTMP LDMAO(KTRL)UNILD LDLOC(KTRL)-1 KTMPKTMP-2 00 TO 961
860 CONTINUE NLDKTRL+2 LDSP(KTRL+I )I-1 LDMAGCKTRL+1 CPTL0M LDLOC(KTRL+1 ).SL( I-i )*10.5-11 *11_( INT(NLPTS/2.)+1.))/NPTINC) LDSP C KTRL+2 I LOMAD C KTRL.2 C -PTLDM LDLOCCKTRL,2C.SLCIC*(0.5_(1.*I2_CINT(NLPT5/2.)1./NPTfl IF (OTCD.EQ. 1) CALL OIJTpR2(KLD,NLD,Lrusp.LDMAG.LDLOCC CALL ANALYZE
SUPPORT MOMENT
.11_( INTCNLPTS/2.)+1.))/NPTINC)
C
E-53 E- 54

870 CONTINUE NLDCSKLD NLANE-NLDCS-NTRLD WRITE('..) 'NUMBER OF LANE LOADCASES '.NLANE WRITE(.*) 'TOTAL NUMBER OF LOADCASES - ,NLDCS WRITE(e,e) RETURN
C END
C C C SUBROUTINE LOCATE •e*eeee*e*e**eee..*.e.e..ee...........*..........e.
SUBROUTINE LOCATE(NSP. IL, LDSP.LDLOC.LDMAG) C SUBROUTINE FOR CORRECTLY PLACINO TRUCK LOADS ON SPANS.
DIMENSION SL(30).LDSP(30) REAL LOLOC(30) .LDMAO(30) COMMON/BLK4/ Ni ,N2,NSPTR.NPSCON
C DO 700 )-1.3 TEMLEN=0 DO 680 I11.NSP TEMP ITEMLEN TEMLENTEMLEN+SL( Ii) KSPII IF ((LDLOC(J).GE.TEMP1).AND.(LDLOC(J).LT.TEMLEN)) 00 TO 690
680 CONTINUE 690 LDLOC(J)-LDLOC(.J)-TEMPI
LDSP(J)KSP 700 CONTINUE
C IF (NPSCON.E0.1) THEN Ni-i N2.NSP NSPTRNSP RETURN END IF
C IF (LDMAG(3).OT.LOMAG(1)) ILDM-3 IF (LDMAO(1).GT.LDMAO(3)) ILDM=1
C IF (((LDSP(2).EQ.2).AND.(LDLOC(2).EQ.O.).AND.(LDSP(ILDM).EQ.1))
1.OR.(LDSP(2).EQ.1)) THEN NSPTR2 N11 N2.2 RETURN END IF
C IF (LDSP(2).EQ.NSP) THEN IF ((LDSP(ILDM).EQ.NSP-1).AND. (LDLOC(2).EQ.0)) THEN NSPTR3 Nt-NSP-2 N2NSP RETURN END IF NSPTR2 NiNSP-1 N2NSP RETURN END IF
C IF (LDLOC(2).EQ.O.) THEN NSPTR3
N1LOSP( ILDM)-1 N2.LDSP( ILOM).1 RETURN END IF
C NSPTR3 N ILDSP ( 2)-I N2LDSP (2)+1 RETURN
C END
C C C SUBROUTINE OUTPR2 *.**.*.............*..*....***.*.*..**,.*.........e
SUBROUTINE OUTPR2(KLD.NLD,LDSP. LDMAG.LDLQC) C SUBROUTINE TO OUTPUT LOAD CONFIC.URATICJN FOR LOADCASES.
DIMENSION LDSP(30) REAL LDLOC(30) .LOrIAO(30)
C WRITE(...) - LOAD CASE ,KLD WRITE(*,.) SPAN MAONITUDE LOCATION' DO 720 ,Ji,NLD WRITE(.,730) LDSP(.J),LDMAG(J) .LDLOC(J)
720 CONTINUE 730 FORMAT(5X, I4SXF10.2.5x.FiO.2)
RETURN END
C C C SUBROUTINE ANALYZE
SUBROUTINE ANALYZE C SUBROUTINE TO PERFORM ELASTIC CONTINUOUS BEAM ANALYSIS.
REAL MAXPM(30) .MXPMLOCC3O>,MINPM(3O) ,MNPMLOC(30).MOMT(3O), 1 MAXNM(30),MINNM(30),MAXSHR(30,2),LDMAG(30),LDLOC(30), 2 MAXPMI(30),MAXPM2(30) DIMENSION SL(30),FACT(30),THETO(31),FMAT(30,2),REACT(31 ).LD$P(30).
1 PMOMT(30), XMLOC(30) .SHEAR(30,2) .PTLD2O .PTLOC(20) COMMON/BLK1/ NSP,SL,GS,WDL, XICC,EC,OTCD.NSPT,NRED.NIriP COMMON/BLK2/ MAXSHR,MAXPM,MXPMLOC,MINPM,MNPMLOC,MAXNM,
1 MINNM.51,52.MAXPMI,IIAXPM2 COMMON/BLK3/ KLD.NLD.LDSPLDMAG,LDLOC,NPTS.NAxSP,
1 XLD, NLPTS.NPTINC.NSPNZ. FACT, FMAT COMMON/BLK4/ Ni, N2, NSPTR, NPSCON
C IF (NSP.EQ.1) 00 TO 91
C C INITIALIZE VARIAaLES
DO 30 J1.NSPT THETO ( ,J) -o REACT(J)-0 MOMT ( J )0
30 CONTINUE DO 35 J1,NSP SHEAR(J, 1)-0 SHEAR C J. 2 1 =0 PMOMT C J 1=0
35 CONTINUE C C COMPUTE SIMPLE SPAN END ROTATIONS
00 42 I=Ni.N2 LSL(I) IF (L.EQ.0.0) 00 TO 42 DO 40 .Ji.NLD
E-55 E-56

IF (I.NE.LDSP(J)) 00 TO 40 IF (LDLOC(U).EQ.-1) THEN TEMP-LOMAG (,J) 'L**3/ (24.EC*X IOC) THETO( I )-THETO( I )+TEMP THETO(I+1)-THETO(I+1)+TEMP ELSE PLDMAG(J) A=LDLOC(,J) B-L-LDLOC(.J) THETO( I )-THETO( I )+P*A*Be(LB)/(6*L*EC*XIOC) THETO(I#1)THETO(I#1)+P.AeB.(L+A)/(6*L.EC*XI13C) ENDIF
40 CONTINUE 42 CONTINUE
C IF (NSPTR.EQ.NSP) THEN
COMPUTE -6.THETO MATRIX 00 50 11.NRED THETO(I)--6*THETO(I+1)
50 CONTINUE
MODIFY THETO MATRIX TO SOLVE EQUATIONS 00 85 I-1.NRED THETO( I )-THETO( I )-FACT( I )*THETO( I-i)
85 CONTINUE
SACK SUBSTITUTE TO OBTAIN REDUNDANT MOMENTS MDMT(NRED)-THETO(NRED)/FMAT(NRED. 1) DO 90 I-NRED-1,1.-1 MOMT( I )-(THETO( I )-FMAT( I ,2)*MOMT( 1*1) )/FMAT( 1,1)
90 CONTINUE - END IF
IF ((NSPTR.EQ.2).AND.(NSPTR.NE.NSP)) THEN MOMT(N2-1)--3*THETO(N2)/(SL(N1)+SL(N2)) END IF
IF ((NSPTR.EQ.3).AND.(NSPTR.NE.NSP)) THEN MOMT(N1)-12.THETO(N1*1).(SL(N1+1)+SL(N2)/SL(N1+1)-6*THETO(N2) TEMPM-SL(N1+1)-4*(SL(N1)+SL(N1+i))*(SL(N1+1).SL(N2))/SL(N1+1) MOMT(N1 )-MOPIT(Nt )/TEMPN MOMT(N2-1)-6.THETO(N1+1)-2.(SL(N1)+SL(N1.1) ).MOMT(Nj) MOMT(N2-1)-PI0T(N2-t)/SL(N1+t) ENDIF
COMPUTE SHEARS, REACTIONS AND CHECK EQUILIBRIUM 91 DO 162 ,JN1.N2
LSL(J) IF (L.EQ.0) 00 TO 162
SHEARS FROM EXTERNAL LOADS 00 160 11,NLD IF J.NE.LDSPI) GO TO 160 IF (LDLOC(I).EQ.-1) THEN TEMPLDMAG( I )*L/2 SHEAR(J, 1 )=SHEAR(,J. 1 )+TEMP SHEAR(J. 2)=SHEAR(J. 2)-TEMP
ELSE P-LDMAG( I) A-LDLOC( I) B-L-LDLOC( I) SHEAR),.), I ).SHEAR(U. 1 )+P*9/) SHEAR(.J, 2)-SHEAR(J. 2)-P*A/L ENDIF
160 CONTINUE
SHEARS FROM REDUNDANT MOMENTS IF (J.EQ.N1) THEN XMTIO ELSE XMTIMOMT(J-t) ENDIF IF (,J.EQ.N2) THEN XMT2O ELSE XMT2MOMT (,.)) ENDIF SHEAR (i,1)=SHEAR(U,1)+(XMT2-XMT1)/L SHEAR(.J,2)=SNEAR(J.2)+(IMT2-XMTI )/L
162 CONTINUE
COMPUTE REACTIONS REACT) Ni )-SHEAR(NI • 1) DO 164 11N1+i.N2 REACT(II)=SHEAR(I1.1)-SHEAR(I1-1,2)
164 CONTINUE REACT(N2+1 )--SHEAR(N2,2)
CHECK EQUILIBRIUM TREACT-O TLOAD-0 00 166 IN1,N2+1 TREACT-TREACT+REACT( I)
166 CONTINUE DO 168 I1,NLD IF (LDLOC(I).EQ.-1) THEN TLOAD-TLOAD+LDMAO( I ).SL(LDSP( I)) ELSE TLOAD-TLOAD+LDMAO( I) ENDIF
168 CONTINUE IF (TREACT-TLOAD.OT.O.1) WRITE(*,170) KLO
170 FORMATC5X,-'*... EQUILIBRIUM NOT SATISFIED FOR LOADCASE:',I:3, 1 -
CALCULATE MAXIPft POSITIVE MOMENTS DO 270 INI.N2 IF (SL(I).EQ.0) GO TO 270 JNILD.0 KTRO DO 190 I1-110 PTLD(It)0 PTLOC(I1)-O
190 CONTINUE DO 200 J1.NLC) IF (I.NE.LDSP(J)) GO TO 200 IF (LDLOC(U).EQ.-1) THEN UN I LDUN I LD+LDMAG ( J) ELSE KTR-KTR. I
E-57 E-58

PTLD(KTR) LDMAG(J) PTLOC(KTR)LDLOC(J) ENDIF
200 CONTINUE
IF (I.EQ.N1) THEN XMT 1 0 ELSE - XMT1=MOMT( I-I) ENDIF IF (I.EQ.N2) THEN XMT2O ELSE XMT2MOMT( I) ENDIF
SPAN NOT LOADED OR END SHEARS 0 SANE SIGN ASIGN( 1. 0.SHEAR( I • I)) B-SION( 1.0,SHEAR( 1,2)) IF (UUNILD.EQ.0).AND.(KTR.EQ. 0)'(.OR.(A.EQ.B)) THEN PMOMT( I ).(XMTI+XMT2)/2. XMLOC( I )SL( 1)12. GO TO 270 ENDIF
UNIFORM LOAD ONLY IF ((UNILD.NE.0).AND.(KTR.EQ.0)) THEN XMLOC(I)-SHEAR(I. 1)/UNILO PMOMT(I)SHEAR(I,1)*XMLOC(I)-UNILD.XMLOC(I)**2/2*XMT1
POINT LOAD(S) ONLY ELSE IF ((UNILD.E0.0).ANO.(KTR.OE.1)) THEN TEMPSHEAR( I • 1) DO 210 I1I,KTR TEMP 1-TEMP TEMP-TEMP-PTLO( Ii) IF (SION(1.O.TEMP1).NE.SION(1.0.TEMP)) THEN XMLOC( I )-PTLOC( II) KTRSTI-1 GO TO 220 ENDIF
210 CONTINUE 220 PMOMT(I)àSHEAR(I,1)*XMLOC(I)+XMT1
DO 230 I1-1.KTRST PMOMT( I )-PPIOPIT( I )-PTLD( Ii ).(XML0C( I )-PTLOC(I 1))
230 CONTINUE
UNIFORM LOAD NIO POINT LOAD(S) ELSE IF ((UNILD.NE.0).AND.(KTR.OE.1)) THEN TEMP-SHEAR( 1.1) DO 240 I1-1,XTR+1 IF (I1.EQ.1) THEN XSTART-0 ELSE XSTART-PTLOC( Il-i) ENDIF IF (I1.EQ.KTR+1*) THEN XDIST=SL( I )-XSTART ELSE XDIST-PTLOC( II )-XSTART END-IF TEMP-I TEMP TEMP-TEMP-UNILD*XDIST
IF (SION(1.0.TEMP1).NE.SION(I.0,Tip)) THEN XNLOC( I )-XSTARTTEMP1/IJNILD KTRSTI1-1 GO TO 250 ENDIF TEMP 1-TEMP TENP-TEMP-PTLD( Ii) IF (SIGN(10.TEMP1).NE.SION(1.0.TEMP)) THEN XNLOC( I )PTLOC( Il) KTRST=I 1 GO TO 250 ENDIF
240 CONTINUE 250 PMOMT(I)SHEAR(I,1)*XMLOC(I)-LINILD*XMLOC(I)*.3,2+XMTI
IF (KTRST.EQ.0) 30 TO 265 DO 260I1=1,KTRST PMOMT( I )=PMOMT( I )-PTLD( It )*( XMLUC( I )-PTLOC( I 1))
260 CONTINUE 265 ENDIF 270 CONTINUE
IF (KLD.GT.0) THEN STORE EXTREME VALUES FOR SHEARS AND MOMENTS
DO 300 I=NI,N2 IF (PMOMT(I).GT.MAXPM(I)) THEN MAXPPI( I )PMOMT( I) MXPMLOC( I )XMLOC( I) MAXPRI (I )MOMT( I-I) IF (I.EQ.1) MAXPM1(I)=0. MAXPM2( I )MOMT( I) IF (I.EQ.NSP) MAXPM2(I)-0. ENDIF IF ((PMOMT(I).LT.MINPM(I)).AND. (XMLOC(I).NE.0.0).AND.
(XMLOC(I).NE.SL(I))) THEN MINPM( I )-PMOMT( I) MNPMLOC( I )'XMLOC( I) ELSE IF (SL(I).EO.0.0) THEN MINPM(I)0.0 MNPMLOC( I ENDIF IF (ABS(SHEAR( I • 1)) .GT.MAXSHR( 1.1)) THEN MAXSHR( I I )ABS(SHEAR( I • 1)) Sl-SIGN( 1 • 0,SHEAR( 1,1)) ENDIF IF (ABS(SHEAR(I,2)).GT.PIAXSHR(I.2)) THEN MAXSHR( I.2)=A(SI4EAA( 1,2)) S2SIGN( 1 .0.SPEAR( 1,2)) ENDIF
300 CONTINUE DO 310 1N1.N2-1 IF (MONT(I).GT.MAXNM(I)) MAXNM(I)=MOMT(I) IF (MOMT( I) .LT.MINNM( 1)) MINNM( I )-MOMT( I)
310 CONTINUE END IF
OUTPUT RESLILTS IF ((OTCD.EO.1).CIR.(KLD.EQ.0)) THEN IF (KLD.GT.0) WRITE(*,450) KLD IF (KLO.EO.0) WRITE(e,454) WOL
- WRITE(*.460) DO 430 IN1,N2. - IF (I.EQ.N1) THEN XMT.0.
E-59 - E-60 W.

ELSE DO 555 I.1,NSP XMT-MOPIT(I-1) IF (NIMP.EQ.1) XIMPP-1.+50./(SL(I)+125.) ENDIF IF (NIMP.EQ.0) XIMPP-1. WRITE(*.490) I,REACT( I). XMT WRITE(..550) I.MAXPM1( I )*XIMPP.MAXPM( I)*XIMPP,MAXPM2(I).XII1PP WRITE(*.490) I.SL( I),SHEAR(I, 1).SHEAR(I.2).PMOMT( I). SSS CONTINUE
1 XMLOC(I) C 430 CONTINUE c
WRITE(*.480) N21.REACT(N2+1).O.O 500 FORMAT(SX,'CALCULATED EXTREME SHEARS AND MOMENTS FOR LL. '.1) ENDIF sos FORMAT(SX. 'CALCULATED EXTREME SHEARS AND MOMENTS FOR LL.I. ',/)
C 510 FQRMAT(1X. 'SPAN'.2X. 'SPRT'.3X. 'PIAXIMUM'.SX. 'MAXIMUM'.SX, 450 FORMAT(SX. '..e.* LOAOCASE -, 13. - •****', I) 1 MAXIMUPV .51. 'MINIMUM' .51. 'MAXIMIJM',/ 434 FORMAT(SX. '.** ADDITIONAL DEAD LOAD: '.F6.2.' pss •**',/) 2 171. 'LEFT'.7X. RIGHT'.SX. 'SUPPORT',5X. 'SUPPORT'.SX. 460 FORMAT(IX. 'SP6N',2X. 'SPRT'.ÔX.'SPAN'.2X. 'REACTION'.oX,'LEFT'. 3 'MIDSPAN',4X.'LOCATION'./
1 SI, 'RIGHT' 31. 'SUPPORT'. 21. 'MAX SPAN' .2X. 'LOCATION' • / 4 ióX. SHEAR' • 7X. 'SHEAR' .6X. 'MOMENT' .61. 'MOMENT' .61. 2 15X. 'LENGTH'. 15X. 'SHEAR' • SX, 'SHEAR' • 41, 'MCJMENT' , 41, 5 'MOMENT'. / 3 'MOMENT'. / 191. 'Ft' . 7X. 'ki',7X, 'kip' • 7X. 'kip' , 4X. 'ft-kjp', 4 17X,' kjp',7X.' kjp',5X. ' t-kjp' .51.' pt-kip',SX. 4 4X. 't-kip'.8X. 'ft',/) 7 - ft-kjp',4X, - ft',SX,/)
480 FORMAT(8X.I3,1OX.F0.2.20X.F1O.2) 515 FORMAT(5X.'SUPPORT MOMENTS FOR MAXIMUM MIDSPAN MOMENTS.'.!! 490 FORMAT(2X,13.6X.F1O.2.10X.F10.2.FiO.2.1OX.Fi0.2.F1O.2) 1 1X,'SPAN'.4X.'LEFT SPT'.5X.'MIDSPAN',3X.'RIOHTSPT'./
C 2 11X. 'MOMENT'.ÔX. 'PIOMENT'.6X. 'MOMENT'. I RETURN 3 lix, 't-kip'.6X. 'Ft-kip'.6X. 'ft-kp', I) END 540 FORMAT(BX.I3.22X.F12.2,F12.2)
C 545 FORMAT(2X.13.4X.F12.2,Fi2.2.24X,F12.2.F12.2) C 550 FORMAT(2X.13.F12.2.F12.2,F12.2) C SUBROUTINE OUTPR1 .*****************e******....*...*..**************. C
SUBROUTINE OUTPR1 RETURN C OUTPUT EXTREME VALUES FOR LIVE LOAD ONLY OR END C LIVE LOAD MULTIPLIED BY APPROPRIATE IMPACT FACTOR.
REAL MAXPM(30) .MXPMLOC(3O) .MINPM(30) ,MNPMLOC(3O). 1 MAXNM(30).MINNM(30).MAXSHR(30.2).MAXPMI(30).MAXPM2(30) DIMENSION SL(30) COMMON/BLK1/ NSP.SL.GS.WDL. XIGC.EC.OTCD,NSPT.NRED.NIMP COMMON/BLK2I MAXSHR.MAXPM.MXPMLOC.MINPM.MNPMLOC.MAXNM,
1 MINNM.51.S2,MAXPM1.MAXPM2
WRITE(*.*) IF (NIMP.EQ.0) WRITE(e.SOO) IF (NIMP.EQ.1) WRITE(*.505) WRITE(e.510) DO 495 I-1.NSP IF (NIMP.E0.1) THEN XIMPN-1.+50./USL(I-1)+SL(I))/2.+125.) XIMPP-t.+5O./(SL(1)+125.) END IF IF (NIMP.EO.0) THEN XIMPN-i. XIMPP1. END IF IF (I.EQ.l) THEN XMTO XMT1O ELSE XMTMAXNM( 1-1 )*IIMPN XMTI.MINNM( I-1)*XIMPN ENDIF SHRiSi*MAXSNR( 1.1 )*XIMPP SHR2S2.MAXSHR( I.2)*XIMPP WRITE(*.540) I.XMT.XMT1 WRITE(4.545) I.SHR1.SNR2.MAXPM( I )4XIMPP.MXPMLOC( I)
495 CONTINUE WRITE(*,540) NSPT. 0.0.0.0 WRITE(*,.) WRITE(..SiS)
E-61 E-62

APPENDIX F
DESIGN EXAMPLES
Two design examples are presented in this Appendix. Calculations
for service and strength design are performed according to procedures
outlined in Chapter Three. These design examples are Intended to
illustrate application of results of this project to bridge design.
They do not necessarily set out all the conditions which may need to
be considered by the designer, but are presented as a guide to
proposed design procedures.
DESIGN EXAMPLE 1
This design example is for an interior girder of a bridge with
four equal 100-ft spans as shown in Fig. F-l. The girder type is
chosen to be AASHTO Type IV with girder spacing equal to 8 ft. Design
criteria are listed below:
30'
Two Lanes of Traffic
Precast
7/2 25 psf Wearing Surface J r-I (,— Parapet
¼ / Interior
( R'
AASHTO -IV Section
—( typ.)
Material Properties:
Girder Concrete (Normal weight: 150 pcf)
f 1 (at transfer) 5000 psi
f (at 28 days) 6500 psi
(Creep Coefficient) 2.70
(c) (Shrinkage) 600 millIonths
Deck and Diaphragm Concrete (Normal weight: 150 pcf)
f (at 28 days) 4500 psi
(c) (Shrinkage) 600 millionths
*Time_dependent concrete properties may be determined either from
testing of the specific concrete mixes to be used in construction
or from coefficients determined using ACI-209 Reconriendations
(17).
ICfl h
Iflfls 1001
A B C B A
Elevation
Fig. F-i Four Span Bridge for Design Example 1
F-i F-2 .1I

Prestressing Strand:
1/2" •, 270 ksi, Area = 0.153 in.2
Stress-Relieved
Initial Strand Tension = 189,000 psi
Loading:
25 psf uniform load for wearing surface, parapet, etc.
AASHTO HS 20-4 live load
Construction Schedule:
As an example, based on expected construction schedule, it is
estimated that the continuity could be established by casting the
diaphragms and deck during a period ranging from 17 to 67 days
after prestress transfer. Live load could be applied at the
earliest 30 days after casting deck and diaphragm. Therefore:
- For determination of maximum positive design moments within
the spans, use 17 day age at continuity combined with
application of live load at 1800 days (5 years).
- For determination of maximum negative design moments at the
supports, use 67 day age at continuity combined with
application of live load at the earliest 30 days after
establishment of continuity. Live load should be applied at
the time maximum negative, restraint moment occurs, as
determined from the time-dependent analysis using BRIDGERM.
Preliminary Design
A preliminary design was done disregarding restraint moments.
Simple span moments were used for girder plus deck dead load. Full
continuity was assumed for determination of live load plus impact and
additional dead load moments. This step is not documented here.
Details of results of the preliminary.design are given below:
Deck thickness: 7.5 in.
Section properties:
Girder Composite*
Area = 789 in.2 1,388 in.2
= 24.73 in. . 38.98 in.
ST = 8,909 in.3 42,269 in.3 (girder),
28,186 in.3 (deck)
SB = 10,542 in.3 16,282 in.3
I = 260,741 in.4 634,741 in.4
*properties for girder plus deck transformed by the modular
ratio of deck and girder concretes.
Prestressing Strand:
38 strands in four rows
No. of Strands Centroid from Bottom
2 8.0 in.
12 6.0 in.
12 4.0 in.
12 2.0 in.
30 Straight Strands: at 4.00 in.
8 Draped Strands: at 5.0 in. (midspan)
at 49.0 in. (girder ends)
Hold-down Points at 40 and 60 'ft
Service Moments in ft-kips:
Deck plus girder dead load moments are for the simply supported
structure. Additional dead load moments are for the fully continuous
structure. Live load plus impact moments are computed for the
structure continuous for negative moment only using Program BRIDGELL.
End Span Support A Midspan Support B
Deck plus Girder DL 0 1965 0
Additional DL 0 154 -214
LL+I* 0 1095 -554
F-3 F-4

Interior Span Support B Midspan Support C
Deck plus Girder DL 0 1965 0
Additional DL -214 73 -143
LL+I* -456 892 -470
*For loadcase producing maximum positive moment in given span.
Design for Positive Midspan Moments
Using results of the preliminary design, time-dependent restraint
moments are calculated for the fully continuous structure using
BRIDGERM. For 17 day continuity and assuming no uplift, the following
moments (ft-kip) are obtained. Restraint moment at B is • obtained by
multiplying restraint moment at C (RMII from BRIDGERM) by 1.5 to give
restraint moment at the first interior support. The factor 1.5 is
related to the relative stiffness of end and interior spans. This
factor is to be used to determine end span restraint moments when
uplift cannot occur as discussed on page E-17 of Appendix E of this
report.
Support 8* Support C*
Restraint Moment at 1800 days 629 419
Service Moments - Trial 1
1. End Span
Continuity Moments Support B
Additional DL -214 ft-kip
LL+I -554 ft-kip
Restraint 629 ft-kb
-139 ft-kip
Negative service moment is less than 125% of Mr. Midspan service
moment from full continuity is increased by 1/2 x 629 = 315 ft-kip to
obtain time-dependent service moment.
Girder Midspan Moments
Deck plus Girder DL 1965 ft-kip (girder section only)
Additional DL 154 ft-kip
LL+I 1095 ft-kip
Restraint 315 ft-kip
1564 ft-kip (composite section)
*Although reinforcement need not be provided to resist the positive 2. Interior Span restraint moments, the rotations and cracks opening at the ends of a. Continuity Moments Support B Support C the girder from time-dependent deformations have the same effect on Additional DL -214 ft-kip -143 the resultant midspan moment as if the positive reinforcement had been
ft-kip
LL+I -456 ft-kip -470 ft-kip present. This behavior is illustrated in Fig. 22 of this report. Restraint 629 ft-kip 419 ft-kip
-41 ft-kip The negative cracking moment is calculated next:
-194 ft-kip
=I x 7.5 1fl/y Cr c cd Negative service moments at Supports B and C are less than 125% of
= 634,741 x 7.5 x J70/(54 + 7.5 - 38.98)/12,000 Mcr. Midspan service moment from full continuity is increased
= 1182 ft-kip by (629 + 419)/2 = 524 ft-kip to obtain time-dependent service moment.
1.2 x M =cr 1418 ft-kip
b. Girder Midspan Moments
Deck plus Girder DL
1-965 ft-kip (girder section)
F-S F-6 -I -4

Additional DL 73 ft-kip
LL+I 892 ft-kip
Restraint 524 ft-kip
1489 ft-kip (composite section)
3. Check service stresses after losses have occurred for end span.
At 1800 days, prestress is 145,000 psi (from BRIDGERM).
Fpe = 38 x 0.153 x 145,000
= 843,000 lb
e = 24.73 - (30 x 4.00 + 8 x 5.00)/38
= 20.52 in.
Bottom Stress for Midspan Moment in End Span:
843,000 843,000 x 20.52 1,965 x 12,000 1.564 x 12,000 = 789 ~ 10,542 - 10,542 - 16,282
-680 psi (tension)
Allowable tension = - 6 vT (AASHTO 9.15.2.2)
=-6,
= -484 psi
Bottom tension is greater than allowable.
Trial 2
More prestress force is required to reduce bOttom tension under
service moments. Therefore, add six strands to Row 4.
No. Strands Centroid
8 8.0 in.
12 6.0 in.
12 4.0 in.
12 2.0 in.
36 Straight Strands: at (30 x 4 + 6 x 8)/36 4.67 in.
8 Draped Strands: at 5.0 in. (midspan)
at 49.0 in. (girder ends)
Recheck Initial Stresses:
Initial Strand Stress = 167,000 psi (from BRIDGERM)
F i
= 44 x .153 x 167,000
1,124,000 lb
For Mldspan Stresses: -
MDL (girder only) = (789/144) x 0.150 x 1002/8 = 1028 ft-kip
e = 24.73 - (36 x 4.67 + 8 x 5.00)/44
= 20.00 in.
Bottom Stress:
1.124.000 1.124,000 x 20.00 1,028 x 12.000
= 789 + 10,542 - 10,542
= 2387 psi (compression)
Allowable Compression = 0.6 f (AASHTO 9.15.2.1) ci
= 0.6 x 5000
= 3000 psi >B
OK
Top Stress:
f1.124.000 1.124,000 x 20.00 + 1.028 x 12.000
T = 789 - 8,909 8,909
= 286 psi (compression) OK
For End Stresses*:
e = 24.73 - (36 x '4.67 + 8 x 49.0)/44
= 12.00 in.
*Note: These computations conservatively assume transfer length is zero.
Bottom Stress: '
f 1.124.000 1.124.000 x 12.00
B 789 + 10,542
2704 psi (compression) < 3000 psi OK
Top Stress:
f1,124.000 1,124.000 x 12.00
T = 789 - 8,909
= -89 psi (tension)
-1 00
F-I F-8
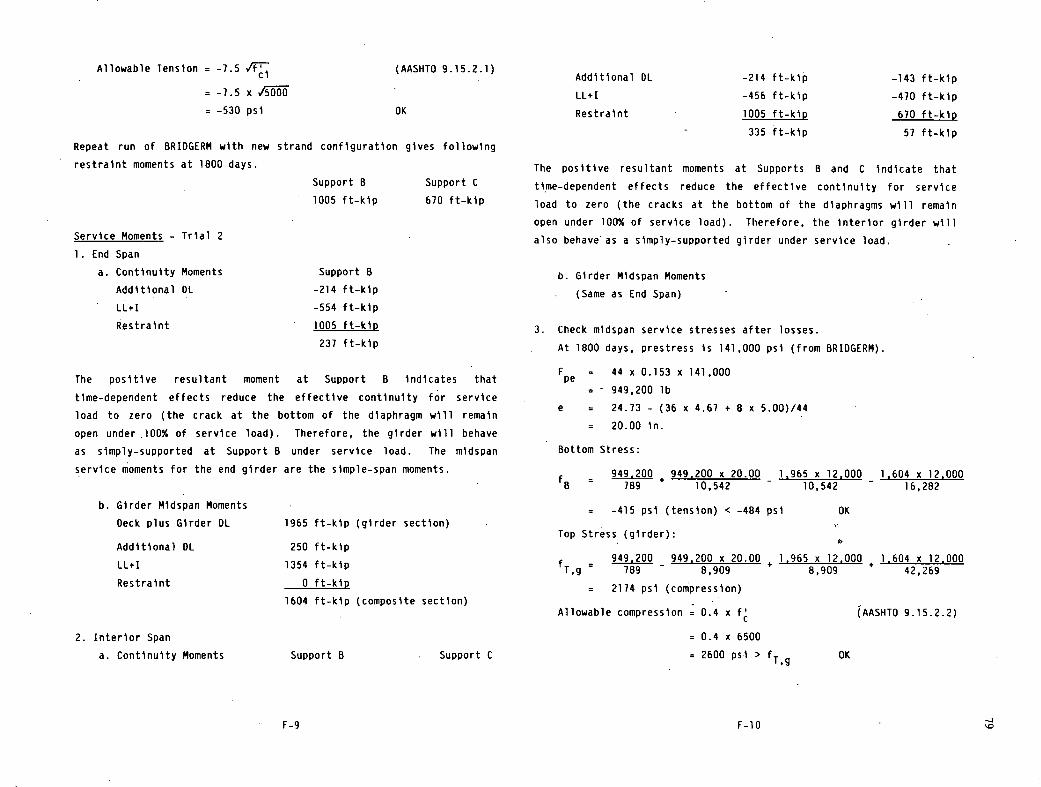
Allowable Tension -7.5 (AASHT0 9.15.2.1)
= - 7 . 5 x
= -530 psi OK
Additional DL
LL+I
Restraint
-214 ft-kip
-456 ft-kip
1005 ft-kip
335 ft-kip
-143 ft-kip
-470 ft-kip
670 ft-kip
57 ft-kip
Repeat run of BRIDGERM with new strand configuration gives following
restraint moments at 1800 days.
Support B Support C
1005 ft-kip 670 ft-kip
Service Moments - Trial 2
End Span
Continuity Moments Support B
Additional DL -214 ft-kip
LL+I -554 ft-kip
Restraint 1005 ft-kip
237 ft-kip
The positive resultant moment at Support B indicates that
time-dependent effects reduce the effective continuity for service
load to zero (the crack at the bottom of the diaphragm will remain
open under .100% of service load). Therefore, the girder will behave
as simply-supported at Support B under service load. The midspan
service moments for the end girder are the simple-span moments.
Girder Midspan Moments
Deck plus Girder DL
1965 ft-kip (girder section)
Additional DL
250 ft-kip
LL+I
1354 ft-kip
Restraint
0 ft-kip
1604 ft-kip (composite section)
2. InterIor Span
a. Continuity Moments Support B Support C
The positive resultant moments at Supports B and C indicate that
time-dependent effects reduce the effective continuity for service
load to zero (the cracks at the bottom of the diaphragms will remain
open under 100% of service load). Therefore, the interior girder will
also behave as a simply-supported girder under service load.
b. Girder Midspan Moments
(Same as End Span)
3. Check mldspan service stresses after losses.
At 1800 days, prestress is 141,000 psi (from BRIDGERM).
F = pe
44 x 0.153 x 141,000
= 949,200 lb
e = 24.73 - (36 x 4.67 + 8 x 5.00)144
= 20.00 in.
Bottom Stress:
949.200 949.200 x 20.00 1.965 x 12.000 1,604 x 12,000 = 789 + 10,542 - 10,542 - 16,282
= -415 psi (tension) < -484 psi OK
Top Stress, (girder):
949.200 949.200 x 20.00 1,965 x 12,000 1.604 x 12.000 i,g = 789 - 8,909 + 8,909 + 42,269
= 2174 psi (compression)
Allowable compression = 0.4 x f (AASHTO 9.15.2.2)
= 0.4 x 6500
= 2600 psi > T,g OK
F-9
F-iD

Top Stress (deck):
1,604 x 12.000
T,d = 28,186
= 683 psi (compression)
Allowable compression = 0.4 x f' (AASHTO 9.15.2.2)
= 0.4 x 4500
= 1800 psi > T,d
OK
Design is OK for Midspan Service Moments
Flexural Strength
Required Strength at Midspan: Using LL+1 Moments from BRIDGELL for
full continuity.
= 270 (1 - .5 x .00124 x 4.5
= 260 ksl
For rectangular section:
=•A fd (1 - 0.6 p* f*/f) su
= 1.0 x 6.73 x 260 x 56.77 x
(1 - 0.6 x 0.00124 x 260/4.5)/12
= 7922 ft-kip > 5132 ft-kip
= 1.0 for factory produced girder
Check depth of compression zone, a:
a = A '085 fb
= 6.73 x 260/0.85 x 4.5 x 96
(AASHTO 9.17.2)
(AASHTO 9.14)
End Span:
= 1.3 x (1965 + 154 + 1.67 x 1095)
= 5132 ft-kip
Interior Span:
M u = 1.3 x (1965 + 73 + 1.67 x 892)
= 4586 ft-kip
End span governs, assuming one prestress design applies for all
spans
Provided Strength:
= (1 - 0.5 P f1') (AASHTO 9.17.4)
p* = 44 x .153/(96 x 56.77)
= 0.00124
b = 8 x 12 = 96 in.
d 54 - (36 x 4.67 + 8 x 5.0)/44 + 7.5 = 56.77 in.
f = 4500 psi = 4.5 ksi for deck
= 2lOksi
= 4.77 in. < 7.5 in. (Neutral AxIs is in the Deck)
Check Maximum Steel: (AASHTO 9.18.1)
Reinforcement Index = p f/f < 0.3
= 0.00124 x 260/4.5
= 0.072 < 0.3 OK
Check Minimum Steel: (AASHTO 9.18.2)
>1.2 II
F xe + se
F se ) SB- MDL(58c - 1) SB SB
g 1cr =7.5 /0i1000 = 0.605 ksl
Fse = 949.2 klps.
MDL = 1,965 ft-kip
SB = 10,542 in.3
SBc = 16,282 in.3
F-il F-l2

949.2 949.2 x 20.00 16.282 16.282 LL+I . -976 ft-kip
Mr = (O.6O5+—jj-+ 10,542 )x 12
- 1,965x(10542_l) Restraint (Maximum) -1245 ft-kip
= 3827 ft-kip -2435 ft-kip
1.2 x M = 4592 ft-kip cr
Mn = 7922 > 4592 ft-kip
Design is OK for Positive Midspan Flexural Strength
Design for Negative Support Moments
Using resulting girder section from the design for positive
midspan moment, time-dependent restraint moments are calculated for
the fully continuous structure using BRIDGERM. For '67 day continuity
and 'assuming no uplift, the following restraint moments (ft-kip) are
obtained. Restraint moment at B is obtained by multiplying restraint
moment at C (RMII from BRIDGERM) by 1.5 to give restraint moment at
the first interior support. The factor 1.5 is related to the relative
stiffness of end and interior spans. This factor is to be used to
determine end span restraint moments when uplift cannot occur as
discussed on page E-11 of Appendix E of this report.
Support B Support C
Maximum Negative (109 days) -1245 -830
1800 days -483 -322
From BRIDGELL analysis, the following support moments (ft-kip)
were obtained:
Support B Support C
Additional Dead Load -214 -143
Maximum LL+I* -976 -884
*For loadcases producing maximum negative moments.
Service Moments
Support B:
Additional DL , -214 ft-kip
Support C:
Additional DL -143 ft-kip
LL+I -884 ft-kip
Restraint (Maximum) -830 ft-kip
-1857 ft-kip
An area of reinforcement must be determined to limit service load
stresses to below allowable:
Compression: 0.6 x f (Current AASHTO 9.7.2.4)
Tension: 24,000 psi for Grade 60 (AASHTO 8.15.2.2)
Try maximum reinforcement = 0.5 Pb (New Requirement)
Pb = 0.85 f (Af + (xb - hf) tw)
f bd
87.000 xb = 8 81,000 +
d
y
131 = .85 - 2.5 x 0.05 for f = 6500 psi
= .725
Xb = .725 x 87 +60 87
x 57.75
= 24.78 in.
.85x6.5x(26x8+ 826 x9+(24.78-l7)x8)
60 x 26 x 57.75
= 0.0260
0.5 Pb = 0.0130
max = .0130 x 26 x 57.15
= 19.5 in.2
OK
F-l3 F-14 22

Calculate cracked section moment of inertia with 19.5 in.2 deck
reinforcement.
nA st = 6.3 x 19.5
= 122.85 In.2
Assume neutral axis in web.
8 2 122.85 (57.75 - x) = 2 (x - 8) + 26 x 8 (x - 4) + 92 (x
x = 20.01 in. > 9 + 8 = 17 in. Neutral Axis is in Web
1cr = 122.85 (57.75 - 20.01)2 1 x 8 x (20.01 - 8)
+ 1 26x8+26X8(20.01-4)2 Tx
+2 x 9/36 + 92(20.01 - 11)2
= 240,959.7 in.4
SB = Icrx = 240,959.7/20.01
= 12,042 in.3
Scr T = cr' - x)
= 240,959.7/(57.75 - 20.01)
= 6385 in.3
Check Concrete Stress*:
At 109 days, f pe = 148,000 psi (from BRIDGERI4)
F = 44x0.153x148000 se
996,300 lb
996,300 996.300 x 12.00 2.435 x 12.000
= 789 10,542 12,042
= 4823 psi > 0.6 f' = 3900 psi exceeds limit
*Note: These computations conservatively assume transfer length is zero.
Check Steel Stress:
= 6.3 x 2,435 x 12,000/6,385
= 28,800 psi > 24,000 psi exceeds limit
Therefore, for this section, span, spacing, and timing
combination, negative service moments are excessive. In this
situation, transverse deck cracking is likely. The bridge
configuration must be adjusted to reduce these high negative moments.
If this combination had been satisfactory, the calculation would have
been continued to check reinforcement stress range limits of AASHTO
8.16.8.3 and check strength design criteria. See Example 2 in this
Appendix for sample strength calculations.
A span of 100 ft with a girder spacing of 8 ft is near the upper
limit for which an AASHTO Type IV girder might be used. The bridge
was redesigned with girder spacing of six feet and all other
parameters identical. With the smaller girder spacing, the negative
service moment is reduced. Further calculations showed that the
allowable stresses for concrete compression and reinforcement tension
under maximum negative service moment could be satisfied with a
reinforcement ratio less than 0.5 Pb• Also, the stress range from
application of maximum live load plus Impact moment is within the
permissible stress range of AASHTO 8.16.8.3. Although the resulting
design meets current and proposed specifications, a large amount of
deck reinforcement, approximately 18 sq in. over each girder, is
required. This may be an impractical design. Therefore, a further
trial with a deeper girder section may be needed to improve the design.
F-l6 F-1 5

DESIGN EXAMPLE 2
This design example is for an interior girder of a bridge with
four spans of 90, 110, 110, and 90 ft. as shown in Fig. F-2. The
girder type is chosen to be 8172/6 (cross-section shown in Fig. 17 of
the report) with girder spacing equal to 6 ft. Design criteria are
listed below:
30' Two Lanes of Traffic
7" 20 psf WearinQ Surface
Precast Parooet
Material Properties:
Girder Concrete (Normal weight: 150 pcf)
(at transfer) 5000 psi
f (at 28 days) 6500 psi
v (CreepCqef1clent) 2.85
(c5 ) (Shrinkage) 550 millionths
Deck and Diaphragm Concrete (Normal weight: 150 pcf)
V (at 28 days) 3500 psi
(c) (Shrinkage) 550 millionths
/ *Time_dependent concrete properties may be determined either from
testing of the specific concrete mixes to be used in construction
or from coefficients determined using ACI-209 Recormendations
(11).
Prestressing Strand
1/2" •, 270 ksi, Area = 0.153 in
Low-Relaxation
Initial Strand Tension 189.000 osi
Loading:
20 psf uniform load for wearing surface,,parapet, etc.
AASHTO HS 20-44 live load
/ U
'--interior Girder L
BT72/6 I. 46'24'
IJ (typ.) 1.1
Section
A B B A
Elevation
Construction Schedule:
Fig. F-2 Four Span Bridge for Design Example 2
As an example, based on expected construction schedule, It is
F-il F-18 00

estimated that the continuity could be established by casting the
diaphragms and deck during period ranging from 15 to 40 days after
prestress transfer. Live load could be applied at the earliest 30
days after casting deck and diaphragm. Therefore:
- For determination of maximum positive design moments within
the spans, use 15 day age at continuity combined with
application of live load at 1800 days (5 years).
- For determination of maximum negative design moments at the
supports, use 40 day age at continuity combined with
application of live load at the earliest 30 days after
establishment of continuity. Live load should be applied at
the time maximum negative restraint moment occurs, as
determined from the time-dependent analysis using BRIDGERM.
Preliminary Design
A preliminary design was done- disregarding restraint moments.
Simple span moments were used for girder plus deck dead load. Full
continuity was assumed for determination of live load plus impact and
additional dead load moments. Thi.s step is not documented here.
Details of results of the preliminary design are given below:
Deck thickness: 7.0 in.
Section properties:
Girder
Area = 701 in.2
Yb 36.36 in.
ST = 13,606 in.3
SB = 13,340 in.3
I = 484,993 in.4
Compos ite*
1,071 in.2
49.87 in.
38,756 in.3 (girder),
29,436 in.3 (deck)
17,193 in.3
857,484 in.4
*properties for girder plus deck transformed by the modular ratio 00
of deck and girder concretes.
Prestressing Strand:
End Span (90 ft):
18 strands in two rows
No. of Strands
Centroid from Bottom
8
4.0 in.
10
2.0 in.
16 Straight Strands: at 3.00 in.
2 Draped Strands: at 2.0 in. (midspan)
at 70.0 in. (girder ends)
Hold-down Points at 27 and 63 ft
Interior Span (110 ft):
20 Strands in two rows
No. of Strands Centroid from Bottom
10
4.0 in.
10
2.0 in.
16 Straight Strands: at 3.00 in.
4 Draped Strands: at 3.00 in. (midspan)
at 69.0 in. (girder ends)
Hold-down Points at 44 and 66.ft
Service Moments in ft-kips:
Deck plus girder dead load moments are for the simply supported
structure. Additional dead load moments are for the fully continuous
structure. Live load plus impact moments are computed for the
structure continuous for negative moment only using Program BRIOGELL.
End Span Support A Midspan Support B
Deck plus Girder DL 0 1271 0
Additional DL 0 68 -121
LL+I* - 0 744 -339
F-l9 F-20

Interior Span Support B Midspan Support C
Deck plus Girder DL 0 1899 0
Additional DL -121 60 -121
LL+I* -427 731 -367
*For loadcase producing maximum positive moment in given span.
Design for Positive Midspan Moments
Using results of the preliminary design, time-dependent restraint
moments are calculated for the fully continuous structure using
BRIDGERM. Restraint moment at B is obtained by analyzing a 90-ft span
and using 1.5 times restraint moment RMII for the first interior
support. Restraint moment at B is obtained by multiplying restraint
moment at C (RMII from BRIDGERM) by 1.5 to give restraint moment at
the first interior support. The factor 1.5 is related to the relative
stiffnesses of end and interior spans. This factor is to be used to
determine end span restraint moments when uplift cannot occur as
discussed on Page E-17 of Appendix E of this report. Restraint moment
at C is obtained by analyzing a 110-ft span and using restraint moment
RHII for the central support. For 15 day continuity and assuming no
uplift, the following moments (ft-kip) are obtained.
Support 8* Support C*
Restraint Moment at 1800 days 792 214
*Although reinforcement need not be provided to resist the positive
restraint moments, the rotations and cracks opening at the ends of the
girder from time-dependent deformations have the same effect on the
resultant midspan moment as if the positive reinforcement had been
present. This behavior is Illustrated in Fig. 22 of this report.
The negative cracking moment is calculated next:
Mr = 'c x 7.5
= 857,484 x 7.5 x J0/(72 + 7.0 - 49.87)/12,000
= 1088 ft-kip
1.2 x Mr = 1306 ft-kip
Service.Moments - Trial 1
1. End Span
Continuity Moments Support B
Additional DL -121 ft-kip
LL+I -339 ft-kip
Restraint 792 ft-kb
332 ft-kip
The positive resultant moment at Support B indicates that
time-dependent effects reduce the effective continuity for service
load to zero (the crack at the bottom of the diaphragm will remain
open under 100% of service load). Therefore, the girder will behave
as simply-supported at Support B under service load. The midspan
service moments for the end girder are the simple-span moments.
Girder Midspan Moments
Deck plus Girder DL 1271 ft-kip (girder section)
Additional DL 122 ft-kip
LL+I 904 ft-kip
Restraint 0 ft-kip
1026 ft-kip (composite section)
2. Interior Span
a. Continuity Moments Support B Support C
Additional DL -121 ft-kip -121 ft-kip
LL+I -427 ft-kip -367 ft-kip
Restraint 792 ft-kip 214 ft-kip
244 ft-kip -274 ft-kip
Negative service moment at Support C' is less than 125% of Mcr The
positive resultant moment at Support B indicates that time-dependent
F-21 F-22 00

effects reduce the effective continuity for service load to zero at
Support B (the cracks at the bottom of the diaphragms will remain open
under 100% of service load). Therefore, the design moments for the
interior span will consist of the simple span moments for additional
dead load and live load plus impact reduced by 274/2 = 137 ft-kip to
account for remaining continuity at Support C.
Allowable Compression = 0.4 f (AASHTO 9.15.2.2)
0.4 x 6500
=2600psi OK
Top Stress (deck):
1.026 x 12,000 T,d = 29,436
= 418 psi
b. Girder Midspan Moments
Deck plus Girder DL
Additional DL
LL+I
Restraint
1899 ft-kip (girder section)
182 ft-kip
1128 ft-kip
-137 ft-kip
1173 ft-kip (composite section)
3. Check service stresses after losses have occurred.
a. End Span
At 1800 days, prestress is 158,000 psi (from BRIDGERM).
Fpe
= 18 x 0.153 x 158,000
= 435,000 lb
e = 36.36 - (16 x 3.00 + 2 x 2.00)/18
= 33.47 in.
Bottom Stress for Midspan Moment in End Span:
435,000 435,000 x 33.47 1.271 x 12,000 1,026 x 12,000 B 701 13,340 - 13,340 - 17,193
Allowable Compression = 0.4 f* (AASHTO 9.15.2.2)
= 0.4 x 3500
= 1400 psi OK
b. Interior Span
At 1800 days, prestress is 161,000 psi (from BRIDGERM).
F = pe
20 x 0.153 x 161,000
= 492,700 lb
e = 36.36 - 3.00
33.36 in.
Bottom Stress for Midspan Moment in Interior Span:
492,700 492.700 x 33.36 1,271 x 12.000 1,173 x 12,000 = 701 13,340 - 13,340 - 17,193
= -27 psi (tension) < -484 psi OK
Top Stress (girder):
492.700 492,700 x 33.36 1.211 x 12.0001,173 x 12.000
T,9 701 - 13,606 13,606 + 38,756
= 979 psi (compression) < 2600 psi OK
= -147 psi (tension) Top Stress (deck):
Allowable tension = -6 /T' (AASHTO 9.15.2.2) 1.173 x 12,000
C T,d = 29,436
=-61U
= 478 psi (compression) < 1400 psi OK = -484 psi OK
Top Stress (girder): Design is OK for Midspan Service Moments
435.000 435.000 x 33.47 1,271 x 12,000 1.026 x 12.000
T,g = 701 - 13,606 + 13,606 38,756
= 989 psi (compression)
F-23 F-24
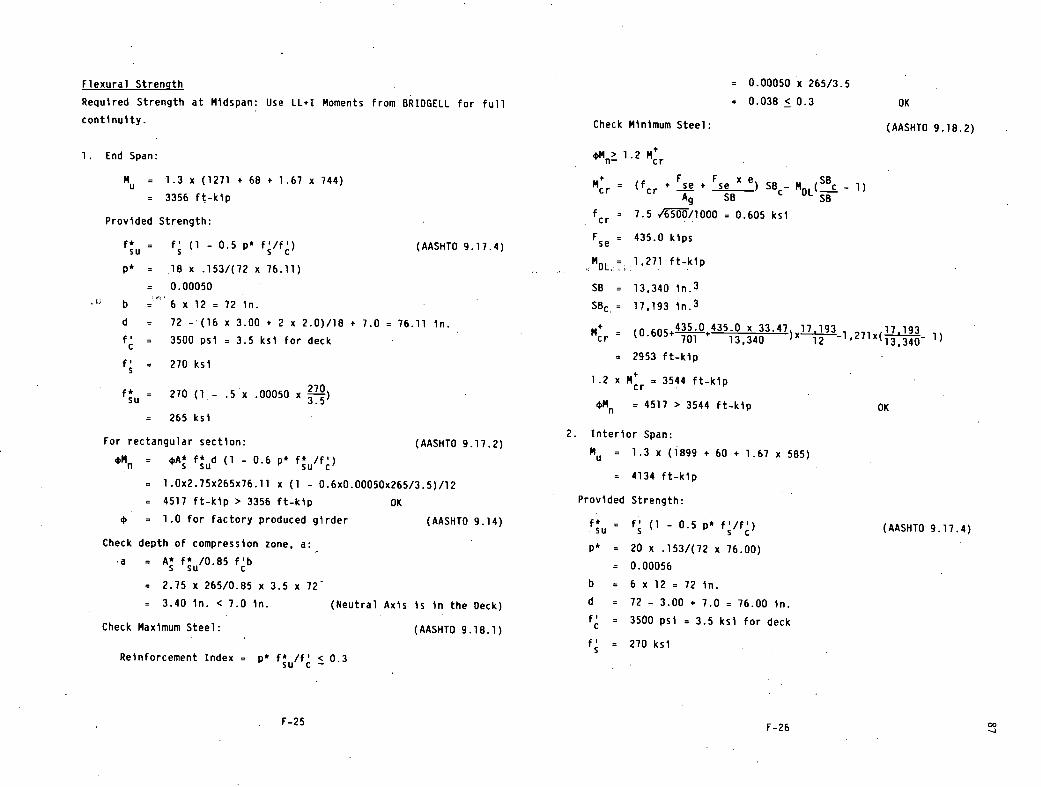
Flexural Strength
= 0.00050 x 265/3.5
Required Strength at Midspan: Use LL+I Moments from BRIDGELL for full = 0.038 < 0.3 OK
continuity. Check Minimum Steel: (AASHTO 9.18.2)
1. End Span:
Mu = 1.3 x (1271 + 68 + 1.67 x 744)
= 3356 ft-kip
Provided Strength:
= V (10su s
.5 P 1/) (AASHTO 9.17.4)
p* = 18 x .153/(72 x 76.11)
= 0.00050
b = 6 x 12 = 72 in.
d = 72 -. (16 x 3.00 + 2 x 2.0)/18 + 7.0 = 76.11 in.
= 3500 psi = 3.5 ksi for deck
f = 2lOksi
= 270 (1. - .5 x .00050 x 2)
= 265 ksi
For rectangular section: (AASHTO 9.17.2)
OM = A (1 - 0.6 p* su
= 1.0x2.75x265x76.11 x (1 - 0.6x0.00050x265/3.5)/12
= 4517 ft-kip > 3356 ft-kip OK
= 1.0 for factory produced girder (AASHTO 9.14)
Check depth of compression zone, a:
a = A* f* /0.85 f'b 5 su C
= - 2.75 x 265/0.85 x 3.5 x 72
= 3.40 in. < 7.0 in. (Neutral Axis is in the Deck)
Check Maximum Steel: (AASHTO 9.18.1)
Reinforcement Index = p f* /fl < 0.3 su c
M> 1.2 I1
F F xe = (f + se + se ) SBc_ MDL(SB r cr c - 1)
Ag SB SB
f = 7.5 v'55/1000 = 0.605 ksi cr
F se = 435.0 kips
1,271 ft-kip
SB = 13,340 in.3
SBc = 17,193 in.3
= (0.605 435.0 435.0 x 33.47 17.193 (13,340_ 1) cr 13,340 )x 12 -1,271x
= 2953 ft-kip
1.2 x M = 3544 ft-kip cr
4M = 4517 > 3544 ft-kip OK
2. Interior Span:
Mu = 1.3 x (1899 + 60 + 1.67 x 585)
= 4134 ft-kip
Provided Strength:
fsu s* =f (1 - 0.5 p* f/f) (AASHTO 9.17.4)
p* = 20 x .153/(72 x 76.00)
= 0.00056
b = 6 x 12 = 72 in.
d = 72 - 3.00 + 7.0 = 76.00 in.
f = 3500 psI = 3.5 ksi for deck
f = 2lOksi
F-25 1-26 00

= 270 (1 - .5 x .00056 x 270 3.5
= 264 ksi
For rectangular section: (AASHTO 9.17.2)
=•A (1 - 0.6 p f/f) su
= 1.0 x 3.06 x 264 x 76.00 (1 - 0.6 x 0.00056 x 264/3.5)/12
= 4987 ft-kip > 4134 ft-kip OK
= 1.0 for factory produced girder (AASHTO 9.14)
Check depth of compression zone, a:
a = A SU'085 fb
= 3.06 x 264/0.85 x 3.5 x 72
= 4.77 in. < 7.5 in. (Neutral Axis is in the Deck)
Check Maximum Steel: (AASHTO 9.18.1)
Reinforcement Index = p f J/f < 0.3
= 0.00056 x 264/3.5
= 0.042 < 0.3 OK
Check Minimum Steel: (AASHTO 9.18.2)
> 1.2
F F xe =
cr + se + se ) SBc_ MDL( SB
C - 1) Ag SB SB
f = 7.5 iöUii000 = 0.605 ksi cr
F se = 492.7 kips
MDL = 1,899 ft-kip
SB = 13,340 in.3
SBc = 17,193 in.3
Mr = (0.60 492.7 492.7 x 33.36 17.193 17.193
1) 701 13,340
)x 12 - 1.899(13340 -
= 3091 ft-kip
1.2 x M = 3709 ft-kip cr
n = 4987 > 3709 ft-kip OK
Design is OK for Positive Mldspan Flexural Strength
Design for Negative Support Moments
Using resulting girder section from the design for positive
mldspan moment, time-dependent restraint moments are calculated for
the fully continuous structure using BRIDGERM. Restraint moment at B
is obtained by analyzing a 90-ft span and using 1.5 times restraint
moment RMII for the first interior support. Restraint moment at B is
obtained by multiplying restraint moment at C (RMII from BRIDGERM) by
1.5 to give restraint moment at the first interior support. The
factor 1.5 is related to the relative stiffnesses of end and interior
spans. This factor is to be used to determine end span restraint
moments when uplift cannot occur as discussed on page E-ll of
Appendix E of this report. Restraint moment at C is obtained by
analyzing a 110-ft span and using restraint moment RMII for the
central support. For 40 day continuity and assuming no uplift, the
following restraint moments (ft-kip) are obtained:
Support B Support C
Maximum Negative (82 days) -696 -550
1800 days +109 -213
From BRIDGELL analysis, the following support moments (ft-kip)
were obtained:
Support B Support C
Additional Dead Load -121 -121
Maximum LL+I* -722 -760
*For loadcases producing maximum negative moments.
Service Moments
Support B:
Additional DL -121 ft-kip
00 00
F-27 F-28

LL+t
Restraint (Maximum)
Support C:
Additional DL
LL+i
Restraint (Maximum)
-122 ft-kip Check Concrete Stress:*
-696 ft-kip a. End Span
-1539 ft-kip At 82 days, f pe = 165.000 psi (from BRIDGERM)
e = 36.36 - (16 x 3.0 + 2 x 10.0)/18 = 25.92 in.
-121 ft-kip Fse = 18 x 0.153 x 165,000
-760 ft-kip = 454,400 lb
-550 ft-kip 454 400454,400 x 25.92 1,539 x 12.000
-1431 ft-kip .701 + 13.340 + 10,701
= 3251 psi < 0.6 f = 3900 psi OK
Try A = 6.00 in.2 for deck reinforcement. Check if service
load stresses are within allowable.
Stress limits:
Compression: 0.6 x f (Current AASHTO 9.7.2.4)
Tension: 24,000 psi for Grade 60 (AASHTO 8.15.2.2)
Calculate cracked section moment of inertia with 6.0 in.2 deck
reinforcement.
n = 29,000/57 /6500 = 6.3
nA5 = 6.3 .x 6.00
= 37.8 in.2
Assume neutral axis in web.
37.8(75.5-x)=(x-6)2 +24x6(x-3)+3x9(x-7)
x = 15.38 in. > 6 + 3 = 9 in. Neutral Axis is in Web
'cr = 164,582 in.2
5cr,B IcrX = 164,582/15.38
= 10,701 in.3
Scr T = 1cr" - x)
= 164,582/(75.5 - 15.38)
= 2738 in.3
b. Interior Span
At 82 days, f pe = 167.000 psi (from BRIDGERM)
e = 36.36 -, (16 x 3.0 + 4 x 69.0)/20 = 20.16 in.
Fse = 20 x 0.153 x 167,000
= 511,000 lb
511.000 5110O0 x 20.16 1.539 x 12.000 = /01 + 13,340 + 10,701
= 3227 psi < 3900 psi . OK
*Note: These computations conservatively assume transfer length is
zero.
Check Steel Stress:
= 6.3 x 1,539 x 12,000/2,738
= 42,500 psi > 24,000 psi exceeds limit
Service load steel stresses are greater than allowable. A new area of
reinforcement must be determined to reduce steel stress to below
24,000 psi.
Try: A5t = 10.80 in.2 (18 - #7 bars)
nA5t= 6.3 x 10.8
= 68.04 in.2
Co F-29 F-30 10

Calculate section properties.
x = 21.19 in. > 9.00 Neutral Axis is in Web
'Cr = 266,665 In.4
S cr,B
= 266,665/21.19
= 12,584 in.3
Scri = 266,665/(75.5 - 21.19)
4910 in.3
By inspection, concrete stress is OK
Check Steel Stress:
f5 = 6.3 x 1,539 x 12,000/4,910
= 23,700 psI < 24,000 psi OK
Use 18 = #7 bars in deck over each girder.
Check stress range for Support C.
Minimum stress occurs under restraint moment plus additional dead load
moment. Maximum stress occurs with application of live load. Use
restraint moment at 1800 days.
M ml n
= -213 -121
= -334 ft-kip
< M = -1088 ft-kip (from p. F-22)
Calculate stress using cracked section properties.
5steel = 4,910 in.3
f ml n
= 6.3 x 334 x 12,000/4,910
= 5,100 psI
M = -213 - 121 - 760 max
= -1094 ft-kip
M = cr
-1088 ft-kip (from p. F-22)
f max
= 6.3 x 1094 x 12,000/4,910
0 = 16,800 psI
ff = (16,800 - 5,100)/100
= 11.7 ksi
Maximum allowable stress range (ksi)
ff = 21 - 0.33 f min + 8 x 0.3 (AASHTO 8.16.8.3)
= 21 - 0.33 x 5.1 + 8 x 0.3
= 21.7 ksi > 11.7 ksi OK
By Inspection Support B is also OK.
Design is OK for Negative Service Moments
Flexural Strength
Use Grade 60 deformed reinforcing bars.
Required Strength:
Support B:
Mu = 1.3 x (121 + 1.67 x 722)
= 1725 ft-kip
Support C:
Mu = 1.3 x (121 + 1.67 x760)
= 1807 ft-kip
Check capacity for Support C with 10.8 in.2 deck steel.
For rectangular sections:
4M = 4(A5 fy(d_a/2)) (AASHTO 8.16.3.2) -
a = Asfy/(O8S b)
= 10.8 x 60/(0.85 x 6.5 x 24)
= 4.89 in. < 6.0 in. (Compression Area is in the
Bottom Flange)
F-31 F-32

Provided Flexural Strength:
= 0.9 x (10.8 x 60 (75.5 - 4.89/2))/12
= 3550 ft-kip > 1807 ft-kip OK
1.20 x Ncr = 1306 ft-kip < 3550 ft-kip OK
Provided reinforcement gives flexural strength greater than required
strength, Mu and greater than 120% of Mcr. (New Requirement)
Check maximum reinforcement, pmax=0•5pb (New Requirement)
Xb = 0.725 x 87 x 75.5/(87 + 60)
= .85x6.5x(24x6+ 624 x3+(32.40-9)x6)
60 x 24 x75.5
= 0.0167
0.5 Pb = 0.0084
At, max = .0084 x 24 x 75.5
= 15.2 in.2 > 10.8 in.2 OK
Design is OK for Negative Moment Flexural Strength
F-33

92
APPENDIX G
PROPOSED AASHTO PROVISIONS
NEW DEFINITION
Add the following definition to Article 9.1.3:
Effective Restraint Moments—Moments occurring at continuity supports of bridges composed of simple-span precast, prestressed girders made continuous, due to creep and shrinkage of precast girders and cast-in-place deck concrete. The effective restraint moments shall be computed assuming full structural continuity for negative and positive moments at continuity supports. See Article 9.7.2.
REVISED AASHTO SPECIFICATIONS
Delete current Article 9.7.2 and replace with the following:
9.7.2 Bridges Composed of Simple-Span Precast Prestressed Girders Made Continuous
9.7.2.1 General
When structural continuity is assumed in calculating live load plus impact and composite dead load moments, the effects of creep and shrinkage shall be considered in the design of bridges incorporating simple-span precast, prestressed girders and deck slabs continuous over two or more spans.
9.7.2.2 Positive Moment Connection at Supports
9.7.2.2.1. Provision of a positive moment connection at con-tinuity supports to resist effective restraint moments that may develop shall be optional.
9.7.2.2.2. If positive moment reinforcement is not provided at supports, live load plus impact moments for positive moment within the span and negative moment at or near continuity supports shall be determined from an analysis that accounts for lack of positive moment continuity.
9.7.2.2.3. If positive moment reinforcement is provided for structural continuity, such reinforcement shall be designed for the combination of effective restraint moments, and moments due to composite dead loads, and live load plus impact in remote spans. Shrinkage and elastic shortening of the piers shall also be considered when significant. Calculated service load stress in nonprestressed positive moment connection reinforcement at continuity supports shall not exceed 0.64 or 36 ksi. The limiting stress of 36 ksi applies to both deformed reinforcing bars and unstressed prestressing strand reinforcement.
9.72.2.4. Irrespective of whether or not positive moment re-inforcement is provided at supports, effective restraint moments required in Articles 9.7.2.3 and 9.7.2.5 shall be computed as-suming full structural continuity for negative and positive mo-ments at continuity supports.
9. 7.2.3 Positive Moments Within Span—Service Load Design
9.7.2.3.1. Restraint moments shall be considered in order to determine effective structural continuity and to compute service moments within the span due to live load plus impact and com-posite dead load.
9.7.2.3.2. Positive service moments within the span shall be determined from superposition of moments from analyses of the girders as continuous structures for live load plus impact, com-posite dead load, and effective restraint moments.
9.72.3.3. The contribution to positive service moments from live load plus impact shall be determined from an analysis of the girders as continuous structures for the load case that pro-duces maximum positive midspan moment in the span under consideration.
9.72.3.4. The contribution to positive service moments from restraint moments shall be determined from conditions that pro-duce maximum positive or least negative effective restraint mo-ment. The effects of shrinkage and elastic shortening of the piers shall also be considered in the analysis for effective restraint moment when significant.
9.7.2.3.5. The effective continuity moment at a support shall Consist of the sum of support moments from continuous analyses for live load plus impact and composite dead load, and the effective restraint moment. If positive moment reinforcement is not provided at supports, only negative effective continuity mo-ments shall be considered.
9.7.2.3.6. Magnitude of the maximum negative effective con-tinuity moment at a support, used to determine the positive service moments within the span, shall be limited to 125 percent of the calculated negative cracking moment of the composite section at the face of the support.
9.72.3. 7. Concrete stresses due to minimum and maximum service moments shall not exceed the allowable stresses of Article 9.15.2.2. Calculation of maximum and minimum concrete stresses shall include effects of prestressing and simple span moment due to girder and deck weight acting on the girder section alone. The effects of live load plus impact and composite dead load moments, adjusted to account for effective structural continuity, shall be determined from analyses of the composite girder and deck section.
9.7.2.4 Positive Moments Within Span—Strength Design
Strength design of prestressed girders for positive moments within the span shall be done in accordance with appropriate Articles of Part C of Section 9. Time-dependent effects of creep and shrinkage of deck and girder concrete shall not be considered for strength design of girders even if positive moment reinforce-ment is provided at supports.
9. 7.2.5 Negative Moments At Supports—Service Load Design
9. 7.2.5.1. Negative service moments at supports shall be de-termined from superposition of moments from analyses of the girders as continuous structures for live load plus impact, com-posite dead load, and effective restraint moments.
9. 72.5.2. The contribution to negative service moments from live load plus impact shall be determined from an analysis of the girders as continuous structures for the load case that pro-duces maximum negative moment at the support under consid-eration.
9.7.2.5.3. The contribution to negative service moments from restraint moments shall be determined from conditions that pro-duce the maximum negative or least positive effective restraint moment, except as required for determination of fatigue stress range in Article 9.7.2.5.6.
9.7.2.5.4. Compressive stress in ends of girders at piers re-suIting from summation of effects of prestressing, composite dead

93
load moment, negative live load plus impact moment, and max-imum negative time-dependent restraint moment shall not exceed O.6Of'.
9.7.2.5.5. Tensile stresses in deck reinforcement resulting from the maximum negative service moment shall not exceed values given in Article 8.15.2.2.
9.7.2.5.6. The fatigue stress range for deck reinforcement in the negative moment region shall be limited by provisions of Article 8.16.8.3. The upper value for the fatigue stress range shall be calculated for conditions causing maximum negative moment from live load plus impact at continuity supports. The lower value for the fatigue stress range shall be determined using composite dead load moments plus restraint moments computed for a time after construction at which essentially all of the effects of creep and shrinkage have occurred.
9. Z2. 6 Negative Moments At Supports—Strength Design
9. 72.6.1. Strength design of the reinforced concrete girder cross section for negative moments in the region of continuity supports shall be in accordance with appropriate requirements of Article 8.16. Restraint moments shall not be considered for strength design of negative moment regions at supports even if positive moment reinforcement is provided at supports.
9.7.2.6.2. The effect of initial precompression due to prestress in the girders may be neglected in the calculation of negative moment strength.
9.7.2.6.3. The negative moment strength shall be calculated using the compressive strength of the girder concrete regardless of the strength of the diaphragm concrete.
9. 72 7 Deck Reinforcement
9.7.2. 71. Reinforcement provided in the deck for negative moment design of the composite girders shall conform to the provisions of Articles 8.16.8.4, 8.17.1, and 8.17.2.
9. 72.Z2. The ratio of longitudinal reinforcement, p = bd, provided in the deck in the negative moment region shall not exceed 0.5 of the ratio p, that would produce balanced Strain conditions for the composite section where
0.85f'A - Pb fbd
and A is the actual concrete compression area in the bottom of the girder at the balanced condition. The effect of compressive strain due to prestress may be neglected in calculation of Pb
COMMENTARY ON REVISED AASHTO SPECIFICATIONS—DRAFT
9.7.2 Bridges Composed of Simple-Span Precast Prestressed Girders Made Continuous
9.72.1 General
Article 9.7.2 is applicable to the type of bridge construction consisting of precast prestressed girders, designed as simply supported spans for girder and deck slab dead load, and made continuous for live load plus impact and composite dead load moments. The continuity is accomplished by use of the longi-tudinal reinforcement placed in the deck slabs above the sup-ports, and diaphragm concrete placed between the ends of the girders to effect a negative moment connection at the support. The degree of continuity attained depends on time-dependent factors and the effective stiffness of the moment connection. The presence of negative moment connections at supports pro-motes continuous structural behavior in the girders for load applied after construction of the composite girders. Negative
continuity moments at the supports reduce the positive moments within the spans for live load plus impact and composite dead load. However, time-dependent effects from creep and shrinkage produce restraint moments that either subtract from or add to the continuity moments. Therefore, the term effective continuity moments is used in the provisions of Article 9.7.2 to denote the moments resulting from the combined effects of live load plus impact, composite dead load, and restraint moment.
Analytical studies (G-1) indicate that effective continuity for this type of bridge can range between 0 and 100 percent of full continuity. An effective continuity of 0 percent means that the composite girders are behaving essentially as simple spans for all loads. An effective continuity of 100 percent indicates that the composite girders are acting together as a fully continuous elastic structure for live load plus impact and composite dead load moments.
The relative influences of concrete creep and shrinkage on effective continuity are highly dependent on the construction timing of the bridge. If the prestressed girders are relatively new at the time that the deck and diaphragms are cast, creep will predominate the behavior, causing positive restraint moments and a probable reduction of full continuity at late ages. If the girders are relatively old at the time of casting the deck and diaphragm, differential shrinkage between the deck and girder concrete will predominate the behavior. Differential shrinkage between the deck and girder concretes causes negative restraint moments to occur at the supports and thereby tends to increase effective continuity. However, differential shrinkage also in-creases the potential for negative moment cracking of the deck concrete over the supports. With deck cracking over the support, the rotational stiffness in the negative moment region is signif-icantly reduced and effective continuity decreases. Therefore, in order to take advantage of structural continuity in this type of bridge for live load plus impact and composite dead load mo-ments, the effects of creep and shrinkage must be considered in the design. If no analysis is conducted to determine time-de-pendent restraint moments at supports, and no positive moment reinforcement is provided at supports, as further discussed in Article 9.7.2.2, the midspan service moment should be taken as the sum of simple span additional dead load and live load plus impact moments.
9. 72.2 Positive Moment Connection at Supports
9.7.2.2.1. Results of an analytical study (G-1) of time-depen-dent restraint moments and service load moments at supports in prestressed concrete girders made continuous indicate that there is little structural advantage gained by providing positive moment reinforcement at supports. With the deck and dia-phragm concrete cast at an early girder age, time-dependent creep deformations cause positive restraint moments at supports that will generally induce a crack in the bottom of the diaphragm concrete. With application of live load, the positive moment crack must close prior to inducing negative moment at the continuity connection. There is a loss of negative continuity moment associated with the closing of cracks in the bottom of the diaphragm. The presence of positive moment reinforcement in the diaphragm helps to maintain a relatively small crack, thereby increasing apparent live load continuity. However, the positive restraint moment resulting from the presence of the reinforcement in the bottom of the diaphragm increases the

94
,
Hinge for Positive Moment
707 707 47 Truck Load on Interior Spans - Three Span Continuity
Hinge for Positive
I i ~ / Moment
7 747
Truck Load on End Span - Two Span Continuity
Additional Dead Load - Full Continuity
Patterned Lane Load- Full Continuity
Figure G-1. Continuity for determining design moments from external loads.
positive moments within the span. This increase in positive moment when bottom reinforcement is used at supports is vir-tually equal to the loss of negative moment continuity if the positive reinforcement is not used. The net result on the effective continuity moment is the same, irrespective of whether or not positive moment reinforcement is provided at supports. There-fore, providing positive moment reinforcement has no significant benefit for reducing service load moments for this type of bridge. Also, a survey of State Departments of Transportation (G-1) indicated several states allow construction of bridges with con-tinuous decks without requiring positive reinforcement in dia-phragms. No serviceability problems associated with the practice of not using the positive moment reinforcement were reported by these states. Therefore, the use of positive moment reinforce-ment is optional.
9. 7.2.2.2. In addition to positive restraint moments from ef-fects of girder creep, positive moments at supports can occur in continuous bridges due to loading on remote spans. If positive moment reinforcement is not provided at supports, the connec-tion at supports will act as a hinged connection for positive moments. This limits the nature of the continuity of the bridges for some load cases. As illustrated in Figure G-1 for AASHTO truck load occurring in one span of a multispan bridge, the continuous structure for resisting load consists of three spans for a loaded interior span, as shown in Figure G-1(a), and two spans for a loaded end span, as shown in Figure G-1(b). For load configurations in which no positive moments occur at sup-ports, such as composite dead load over the entire bridge and
some patterns of AASHTO lane loads, the entire bridge can be assumed to act as a continuous structure, as shown in Figures G-l(c) and G-l(d).
9. 7.2.2.3. There is a minor structural advantage for transfer of positive moments resulting from the effects of loads in remote spans if positive moment reinforcement is provided at supports. If the designer wants to take advantage of this increased struc-tural continuity, the positive moment reinforcement must be designed for all of the load effects contributing to positive mo-ments in the connection. The 36-ksi allowable stress corresponds with an approximate slip of 0.01 in. in the reinforcement at the ends of the girders. This allowable stress is recommended to maintain a small crack width at the interface of the diaphragm and girder concrete. The amount of slip is approximately the same whether mild steel reinforcing bars or unstressed pres-tressing strand is used for the positive moment reinforcement. Therefore, the limiting stress of 36 ksi applies to both mild steel reinforcement and unstressed prestressing strand reinforcement.
9. 7.2.2.4. While the nature of continuity is affected to a small degree for some cases of live load plus impact, research has indicated that the presence or absence of positive moment re-inforcement at supports does not affect the nature of continuity for determination of time-dependent restraint moments. As pre-viously stated, the loss of some effective continuity due to crack-ing in the bottom of the diaphragm, when positive reinforcement is not provided, is virtually balanced by the increased positive restraint moment when the reinforcement is provided. Analyses made to determine the resultant service load moment, which include moments due to dead load, restraint moments due to creep and shrinkage;' and live loads, are independent of the presence or absence of positive moment connection in the dia-phragm. This behavior is shown in Figure G-2. With positive moment reinforcement provided at supports, the inclusion of a positive restraint moment is required in the summation of mo-ments to determine the resultant moment diagram. Without positive reinforcement provided at supports, no positive restraint
With Positive Without Positive Moment Reint. Moment Reinf.
DL
+
Restraint '—
Add'I DL -
LL + I
Resultant
Mid Span Moment
Figure G-2. Resultant moments for bridges with and without positive moment reinforcement at supports.

95
moment develops from time-dependent effects because of dia-phragm cracking. However, the continuity moments at supports for live load plus impact are reduced because the diaphragm cracks must close before continuity is established at the negative moment connection. The lack of full continuity for live load plus impact without positive reinforcement at the supports is balanced by the need to include a restraint moment when pos-itive moment reinforcement is provided at the supports. There-fore, the resultant mid-span moments, as shown in Figure G-2, are virtually identical whether or not positive moment re-inforcement is provided at the supports.
The analyses to determine design moments assuming full structural continuity for both negative and positive moments at supports, as illustrated in the left-hand summation of moments in Figure G-2, are more straightforward than calculations to determine the effects of crack opening and closing when positive moment reinforcement is not provided, as illustrated in the summation of moments on the right hand-side of Figure G-2. It is therefore recommended that analyses to determine restraint moments be carried out assuming full continuity for both pos-itive and negative moments whether or not the positive moment reinforcement is provided at the support. The calculated positive restraint moment is not an actual restraint moment when the positive moment reinforcement is not used. For this case, cal-culation of a restraint moment is simply a method to account for the opening of the cracks in the bottom of the diaphragm. Therefore, the calculated restraint moments are defined as ef-fective restraint moments.
9. Z2.3 Positive Moment Within Span—Service Load Design
9.7.2.3.1. A main structural advantage for this type of bridge with negative continuity at supports as compared to bridges consisting of simply supported girders is the reduction in positive moments within the span for service live load plus impact and composite dead load. However, time-dependent behavior influ-ences the continuity of this type of bridge such that the effective continuity for live load plus impact can vary from 0 to 100 percent. Therefore, the effeclive continuity moments must in-clude the restraint moments that result from creep and shrinkage of the composite structure.
9.7.2.3.4. Analysis for positive moments within the span for service design should be carried out for conditions including time-dependent effects that produce the maximum positive or least negative restraint moment. The maximum positive or least negative restraint moment occurs after 2 to 5 years in bridges that were constructed with girders that were relatively young when the deck and diaphragms were cast. Therefore, the design should be based on a time-dependent analysis using the youngest likely girder age at casting of the deck and diaphragm. The time-dependent analysis should be carried out to determine re-straint moments when bridges are at least 2 years old.
9. 7.2.3.5. If no positive reinforcement is provided at supports, only negative effective continuity moments need be considered. That is, if the calculated restraint moments are positive and larger than the summation of negative moments from continuous analyses for live load plus impact and composite dead load, the cracks in the bottom of the diaphragm resulting from creep in the girder will remain open under full service design loads. Under this condition, the girders are effectively simply supported
girders for all loading and the effective continuity is essentially o percent. Therefore, any net positive effective continuity mo-ment at a support, calculated from the summation of support moments due to live load plus impact, composite dead load, and the effective restraint moment, need not be added to the resultant moment diagram. However, if positive reinforcement is used at the supports, net positive effective continuity moments shall be included in the resultant moments.
9.7.2.3.6. If time-dependent analyses predict negative restraint moments, the girders may behave as fully continuous for live load plus impact and composite dead load. However, the max-imum negative effective continuity moment, for determination of positive service load moments within the span, is limited to a value of 125 percent of the calculated negative cracking mo-ment of the composite section. This limit provides for a situation when negative moments cause deck cracking over the supports. Deck cracking reduces effective continuity. The reduction in continuity results from the softening of the negative moment region after cracking, along with an accompanying redistribu-tion of moments to the mid-span region. Figure G-3 illustrates that the amount by which the calculated effective continuity moments at the supports exceeds 125 percent of the cracking moment should be redistributed to the positive moment region for design of the girders for service loads.
9. Z2. 4 Positive Moments Within Span—Strength Design
Stresses and strains induced in the girders by volume change from creep and shrinkage are self-limiting within the girder in that they are relieved by the deformations accompanying crack-ing in the concrete and yielding of reinforcement. As a result, presence or absence of time-dependent restraint moments has no effect on the flexural strength of the structure. This was demonstrated by comparing the results of tests to destruction of continuous composite girders tested at approximately 2 years of age with a continuous composite girder tested at 12 days after deck casting (G-2).
9. 7.2.5 Negative Moments at Supports—Service Load Design
9. Z2. 5.1. Negative moment connections at supports shall be designed for the maximum negative continuity moment includ-ing the continuity moment from live load plus impact and com-posite dead load and the maximum negative or least positive restraint moment from creep and shrinkage effects.
9.7.2.5.3. Dependent on age of girders when deck and dia-phragm concrete is cast, the restraint moment from time-de-pendent effects could increase or decrease the negative continuity moment. The maximum negative or least positive restraint moment occurs with early age loading on bridges con-structed with girders that are relatively old when the deck and diaphragm are cast. Therefore, the design should be based on a time-dependent analysis using the oldest likely girder age at casting of the deck and diaphragm. The time-dependent analyses should be carried out to determine the maximum negative re-straint moment during the time period shortly after casting the deck and diaphragm. If the bridge will be open to traffic within the time period at which the maximum negative restraint mo-

96
Moment Diagrams
Restraint I
+ +
Additional
Dead Load N—___ -------I
+
Live Load - Plus Impact
125% Mer
summation M125% Mcr) of Moments
125% M, Exceeded at Supports
125%Mcr Mcr
Design Moment Diagram for Mldspan
Service Moment COM 25%Mcr)I
Service Load Design Moment for Additional Dead Load and Live Load Plus Impact Equals P.t1 I( M-125% Mcr)I When MExceeds 125% Mer
Figure G-3. Determination of service load design moment.
ment occurs, the maximum service design moment for the sup-port connection is the sum of the maximum negative restraint moment and the continuity moment from live load plus impact and composite dead load. If the bridge will not be open to traffic at the time that the maximum negative restraint moment occurs, the design moment is the more negative of either the maximum negative restraint moment, or the sum of the continuity moment from live load plus impact and composite dead load, and the negative restraint moment calculated at the earliest estimated time that the bridge will be opened to traffic.
9. 7.2.5.5. For checking fatigue limits for deck reinforcement, the maximum negative moment at early age is essentially a transient condition. Although restraint moments can remain negative for the life of the structure, they reach a reduced and relatively constant level after approximately 2 years. Therefore, use of a restraint moment calculated at approximately 700 days after casting of deck and diaphragms is recommended for check-ing fatigue limits.
9.7.2.6 Negative Moments at Supports—Strength Design
9. Z2. 6.1. The composite girder cross section in negative mo-ment regions will behave as a reinforced concrete section rather
than a prestressed concrete section. Therefore, the strength of this cross section should be determined in accordance with the appropriate requirements of Article 8.16 for reinforced concrete. Stresses and strains induced in the girders by volume change from creep and shrinkage are self-limiting within the girder in that they are relieved by deformations accompanying cracking in the concrete and yielding of reinforcement. As a result, pres-ence or absence of time-dependent restraint moment has no effect on the strength of the structure.
9. Z2. 6.2. Effects of prestress in the ends of the girder induce an initial compression in the bottom flange of the girder. How-ever, analytical studies (G-1) indicate that the initial pre-compression has negligible effect on the maximum flexural or shear strength within a hinging region that forms at the support as the bridge girders are loaded to the strength of the structure. Therefore, the initial precompression due to prestress may be neglected in calculation of the negative moment strength at the diaphragm.
9.72.63. The critical section for concrete compression in the girders occurs away from the support pier and diaphragm con-crete. Therefore, the compressive strength of the girder concrete should be used in the strength calculation for the negative mo-ment capacity at the support. This recommendation is made based on use of typical girder design concrete compressive strengths between 5,000 psi to 6,500 psi. If the design concrete

97
strength for a girder is significantly above the typical range, further consideration should be given to the design strength of the diaphragm concrete.
9.7.2.7 Deck Reinforcement
9.7.2.7.1. Reinforcement provided in the. deck for negative moment capacity at the supports should be sized to meet min-imum reinforcement requirements and requirements for ade-quate distribution of reinforcement for crack width control.
9. Z2. Z2. To ensure ductile behavior in the negative moment region and develop full strength of the bridge girders, analytical studies (G-1) indicate that the deck reinforcement ratio shall not exceed 50 percent of Pb as defined in Article 9.7.2.7.2. The bottom flange or bulb of girder cross sections typically used in this type of bridge construction may be relatively small com-pared to the area of reinforcement provided in the deck. There-fore, the neutral axis may be in the web region of the cross
section. The area of compression concrete, A, used in the cal-culations for the balanced condition, must be the actual area of the girder bottom flange and web in compression. As with calculations to determine the negative moment strength of the cross section at the supports, the effect of initial precompression due to prestress may be neglected in determination of the strain conditions for balanced reinforcement.
REFERENCES
G-l. OESTERLE, R. G., GLIKIN, J. D., and LARSON, S. C., "Design of Precast Prestressed Bridge Girders Made Con-tinuous." NCHRP Report 322, Transportation Research Board, Washington D.C. (October 1989) 97 pp.
G-2. MArFOCK, A. H., "Precast-Prestressed Concrete Bridges, 5. Creep and Shrinkage Studies." J. FCA Res. and Dev. Laboratories, Vol. 3, No. 2 (May 1961). Also reprinted as PCA Bulletin D46, pp. 32-65.

THE TRANSPORTATION RESEARCH BOARD is a unit of the National Research Council, which serves the National Academy of Sciences and the National Academy of En-gineering. It evolved in 1974 from the Highway Research Board which was established in 1920. The TRB incorporates all former HRB activities and also performs additional functions under a broader scope involving all modes of transportation and the interactions of transportation with society. The Board's purpose is to stimulate research concerning the nature and performance of transportation systems, to disseminate information that the research produces, and to en-courage the application of appropriate research findings. The Board's program is carried out by more than 270 committees, task forces, and panels composed of more than 3,300 admin-istrators, engineers, social scientists, attorneys, educators, and others concerned with transpor-tation; they serve without compensation. The program is supported by state transportation and highway departments, the modal administrations of the U.S. Department of Transportation, the Association of American Railroads, the National Highway Traffic Safety Administration, and other organizations and individuals interested in the development of transportation.
The National Academy of Sciences is a private, nonprofit, self-perpetuating society of dis-tinguished scholars engaged in scientific and engineering research, dedicated to the furtherance of science and technology and to their use for the general welfare. Upon the authority of the charter granted to it by the Congress in 1863, the Academy has a mandate that requires it to advise the federal government on scientific and technical matters. Dr. Frank Press is president of the National Academy of Sciences.
The National Academy of Engineering was established in 1964, under the charter of the National Academy of Sciences, as a parallel organization of outstanding engineers. It is au-tonomous in its administration and in the selection of its members, sharing with the National Academy of Sciences the responsibility for advising the federal government. The National Academy of Engineering also sponsors engineering programs aimed at meeting national needs, encourages education and research, and recognizes the superior achievements of engineers. Dr. Robert M. White is president of the National Academy of Engineering.
The Institute of Medicine was established in 1970 by the National Academy of Sciences to secure the services of eminent members of appropriate professions in the examination of policy matters pertaining to the health of the public. The Institute acts under the responsibility given to the National Academy of Sciences by its congressional charter to be an adviser to the federal government and, upon its own initiative, to identify issues of medical care, research, and education. Dr. Samuel 0. Thier is president of the Institute of Medicine.
The National Research Council was organized by the National Academy of Sciences in 1916 to associate the broad community of science and technology with the Academy's purpose of furthering knowledge and advising the federal government. Functioning in accordance with general policies determined by the Academy, the Council has become the principal operating agency of both the National Academy of Sciences and the National Academy of Engineering in providing services to the government, the public, and the scientific and engineering com-munities. The Council is administered jointly by both Academies and the Institute of Medicine. Dr. Frank Press and Dr. Robert M. White are chairman and vice chairman, respectively, of the National Research Council.

TRANSPORTATION RESEARCH BOARD National Research Council
2101 ConstItution Avenue, N.W.
Washington, D.C. 20418
ADDRESSCORRECTION REQUESTED
NON-PROFIT ORG. U.S. POSTAGE
PAID WASHINGTON, D.C.
PERMIT NO. 8970
11
00 0015 10O 3, MATERIALS ENçR
IDAIIO'TRANS DEPT DIV:OFHU!S P:.O 801 7129 BOISE ID 83707