nasdaq: hsic - dental supplies, medical supplies ... · nasdaq: hsic q4 2017. safe harbor ......
TRANSCRIPT
NASDAQ: HSIC
Q1 2018

Safe Harbor ProvisionCautionary Note Regarding Forward-Looking Statements and Use of Non-GAAP Financial Information
Forward Looking Statements
In accordance with the "Safe Harbor" provisions of the Private Securities Litigation Reform Act of 1995, we provide the following cautionary remarks regarding important factors that, among others, could cause future results to differ materially from the forward-looking statements, expectations and assumptions expressed or implied herein. All forward-looking statements made by us are subject to risks and uncertainties and are not guarantees of future performance. These forward-looking statements involve known and unknown risks, uncertainties and other factors that may cause our actual results, performance and achievements or industry results to be materially different from any future results, performance or achievements expressed or implied by such forward-looking statements. These statements are identified by the use of such terms as "may," "could," "expect," "intend," "believe," "plan," "estimate," "forecast," "project," "anticipate" or other comparable terms. A full discussion of our operations and financial condition, including factors that may affect our business and future prospects, is contained in documents we have filed with the United States Securities and Exchange Commission, or SEC, and will be contained in all subsequent periodic filings we make with the SEC. These documents identify in detail important risk factors that could cause our actual performance to differ materially from current expectations.
Risk factors and uncertainties that could cause actual results to differ materially from current and historical results include, but are not limited to: effects of a highly competitive and consolidating market; our dependence on third parties for the manufacture and supply of our products; our dependence upon sales personnel, customers, suppliers and manufacturers; our dependence on our senior management; fluctuations in quarterly earnings; risks from expansion of customer purchasing power and multi-tiered costing structures; increases in shipping costs for our products or other service issues with our third-party shippers; general global macro-economic conditions; risks associated with currency fluctuations; risks associated with political and economic uncertainty; disruptions in financial markets; volatility of the market price of our common stock; changes in the health care industry; implementation of health care laws; failure to comply with regulatory requirements and data privacy laws; risks associated with our global operations; transitional challenges associated with acquisitions and joint ventures, including the failure to achieve anticipated synergies; financial risks associated with acquisitions and joint ventures; litigation risks; new or unanticipated litigation developments; the dependence on our continued product development, technical support and successful marketing in the technology segment; our dependence on third parties for certain technologically advanced components; increased competition by third party online commerce sites; risks from disruption to our information systems; cyberattacks or other privacy or data security breaches; certain provisions in our governing documents that may discourage third-party acquisitions of us; changes in tax legislation; and risks associated with the ability to consummate the Henry Schein One joint venture transaction and the spin-off and merger of our Animal Health business with Vets First Choice and the timing of the closing of these transactions, as well as the ability to realize anticipated benefits and synergies of these transactions. The order in which these factors appear should not be construed to indicate their relative importance or priority.
We caution that these factors may not be exhaustive and that many of these factors are beyond our ability to control or predict. Accordingly, any forward-looking statements contained herein should not be relied upon as a prediction of actual results. We undertake no duty and have no obligation to update forward-looking statements.
Additional Information and Where to Find ItIn connection with the proposed transaction, Vets First Corp. plans to file relevant materials with the SEC, including a registration statement on Form S-1/S-4 containing a prospectus, in the coming months. Investors and security holders are urged to carefully read the registration statement/prospectus (including any amendments or supplements thereto and any documents incorporated by reference therein) and any other relevant documents filed with the SEC when they become available, because they will contain important information about the parties and the proposed transaction. The registration statement/prospectus and other relevant documents that are filed with the SEC can be obtained free of charge (when available) from the SEC’s web site at www.sec.gov. These documents can (when available) also be obtained free of charge from Henry Schein, Inc. upon written request to Carolynne Borders at Henry Schein, Inc., 135 Duryea Road, Melville, NY 11747. This communication shall not constitute an offer to sell or the solicitation of an offer to sell or the solicitation of an offer to buy any securities, nor shall there be any sale of securities in any jurisdiction in which such offer, solicitation or sale would be unlawful prior to registration or qualification under the securities laws of any such jurisdiction. No offer of securities shall be made except by means of a prospectus meeting the requirements of Section 10 of the Securities Act of 1933, as amended.
Non-GAAP Financial MeasuresThis presentation contains certain non-GAAP financial measures, including operating income. The non-GAAP financial measures contained herein have limitations as analytical tools and should not be considered in isolation or in lieu of an analysis of our results as reported under U.S. GAAP. These non-GAAP measures should be evaluated only on a supplementary basis in connection with our U.S. GAAP results. A reconciliation of these non-GAAP financial measures to the most directly comparable GAAP financial measures can be found in the back of this presentation.
2
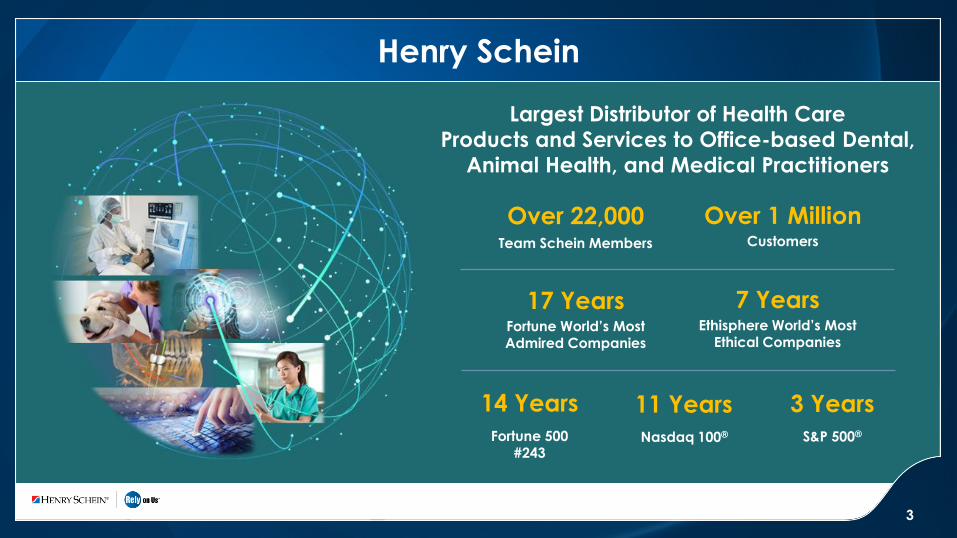
Henry Schein
Over 22,000Team Schein Members
Over 1 MillionCustomers
17 YearsFortune World’s Most Admired Companies
7 YearsEthisphere World’s Most
Ethical Companies
Fortune 500#243
Largest Distributor of Health Care
Products and Services to Office-based Dental,
Animal Health, and Medical Practitioners
14 Years
Nasdaq 100®
11 Years
S&P 500®
3 Years
3
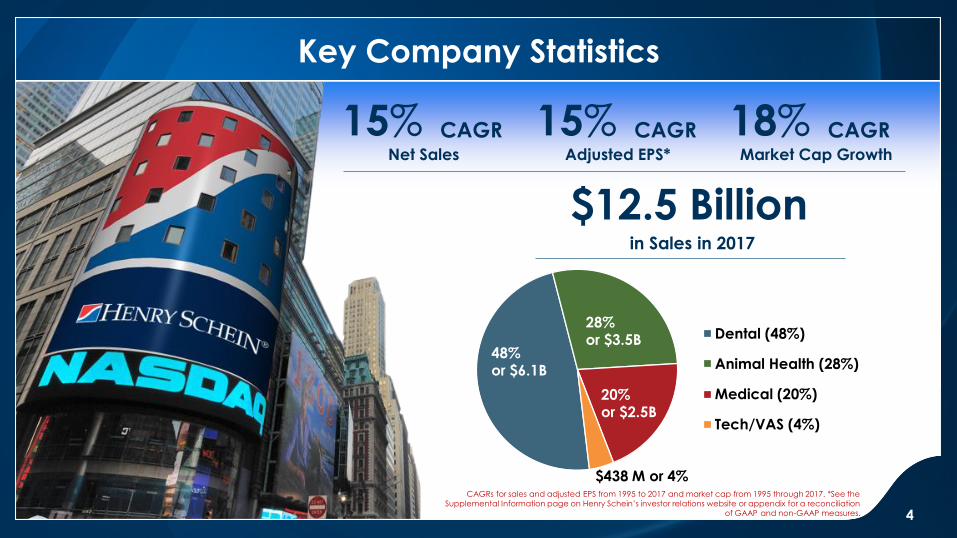
15% CAGRAdjusted EPS*
18% CAGRMarket Cap Growth
$12.5 Billionin Sales in 2017
Dental (48%)
Animal Health (28%)
Medical (20%)
Tech/VAS (4%)
48%or $6.1B
28%or $3.5B
20%or $2.5B
$438 M or 4%CAGRs for sales and adjusted EPS from 1995 to 2017 and market cap from 1995 through 2017. *See the
Supplemental Information page on Henry Schein’s investor relations website or appendix for a reconciliation
of GAAP and non-GAAP measures.
Key Company Statistics
15% CAGRNet Sales
4
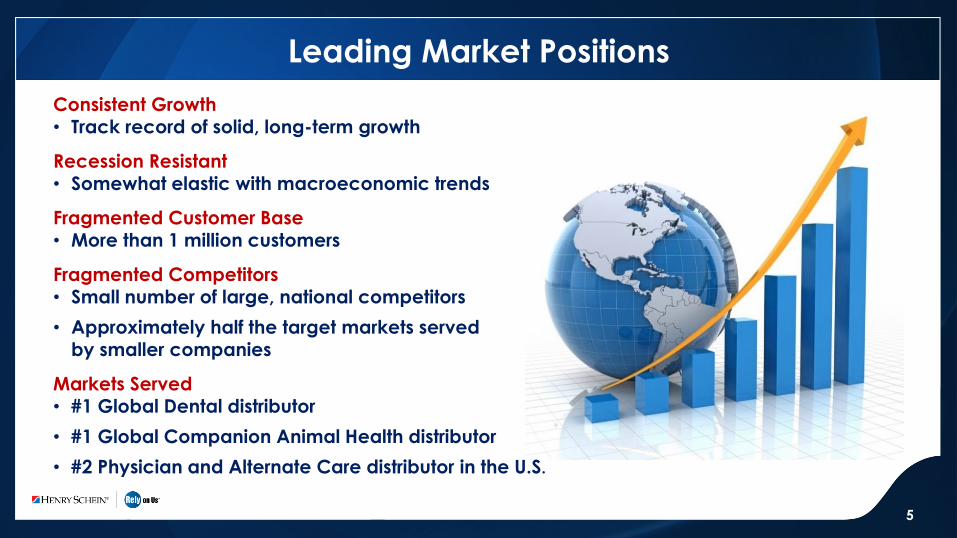
Leading Market Positions
5
Consistent Growth• Track record of solid, long-term growth
Recession Resistant• Somewhat elastic with macroeconomic trends
Fragmented Customer Base• More than 1 million customers
Fragmented Competitors• Small number of large, national competitors
• Approximately half the target markets servedby smaller companies
Markets Served• #1 Global Dental distributor
• #1 Global Companion Animal Health distributor
• #2 Physician and Alternate Care distributor in the U.S.

Positive Demographic Trends
• Aging population represents increasingneed for health care services
• Global middle class is growing
Technological Improvements
• Software and services
• Prosthetic solutions
• Patient communications
Focus on Preventive Care
• Growing awareness of importance of preventative care
• Improving access to care
Consolidation of Practitioners in Dental, Animal Health, and Medical
• Multiple locations under common management
• Movement of procedures from hospital to physician office
6
Positive Market Trends

Our Global Distribution Network
• 9 North American Distribution Centersserving Dental and Medical
• 13 U.S. Distribution Centers servingAnimal Health
• 21 Distribution Centers in Europe serving Dental, Medical, and Animal Health
• 13 Distribution Centers in Australia/New Zealand serving Dental and Animal Health
• 7 Distribution Centers in Asia/Rest of World serving Dental and Animal Health
• Approximately 90% utilization with capacity for growth
• 63 warehouses worldwide with over 4.5 million square feet of warehouse for storage and processing
Operations in 34 countries
7

Company Objective
Efficiency
Productivity
Profitability
Allowing our customers to focus on
delivering quality care to their patients
Improve
Practice
Our primary objective is to partner with our customers
8

EDUCATION SERVICE & SUPPORT
RELATIONSHIPSSOFTWARE & INNOVATION
Henry Schein’s High-Touch, Value-Added Market ApproachFull-service provider of supplies, equipment, and services
Our strategy isfocused on delivering solutions that enable
our customers to provide the best
quality patient care while optimizingthe efficiency oftheir practice.
9

Henry Schein’s Model Versus Online-Only Merchants
Unlike online-only merchants, our expertise is built on:
10
1. Education
• Over 4,200 highly trained FSCs
worldwide, supported by over
2,200 telesales representatives.
• We stay abreast of market
developments and the hundreds
of new products, services, and
technologies introduced each
year.
• Through our direct
mail and digital media,
we enable our manufacturing
partners to focus on product
innovation.
2. Service & Support
• More than 200 equipment sales
and service centers worldwide
and more than 2,000 dedicated
field technicians.
• Our customers and sales teams
are supported by over 1,000
customer service reps who assist
with payments, order inquiries,
account maintenance, and
other post sales transactions.
3. Software & Innovation
• We develop integrated
practice management
software innovations that drive
greater business efficiencies as
well as clinical and
operational efficiencies.
• Over 350 knowledgeable
software developers,
programmers, and technicians worldwide.
• Over 800 technical
representatives supporting
customers using our practice
management solutions.
4. Relationships
• We are in the relationship
business, not a transaction
business.
• We make it our business to
understand our customers’ needs so we can advance our
mutual interest of growing a
practice for the ultimate
benefit of the patient.
• Our customers are not
consumers. They are health
care professionals with specific
needs that Henry Schein
uniquely understands
and satisfies.
• High-touch, full-service, value-added approach for supplies, equipment, service, and practice management software
• Delivering the industry’s widest selection of national and private brand products at highly competitive pricing – with a 99%+ fulfillment rate
It is this focus on value-added solutions and support that has enabled Henry Schein to build a leading
position in the markets we serve and it is why our customers RELY ON US.
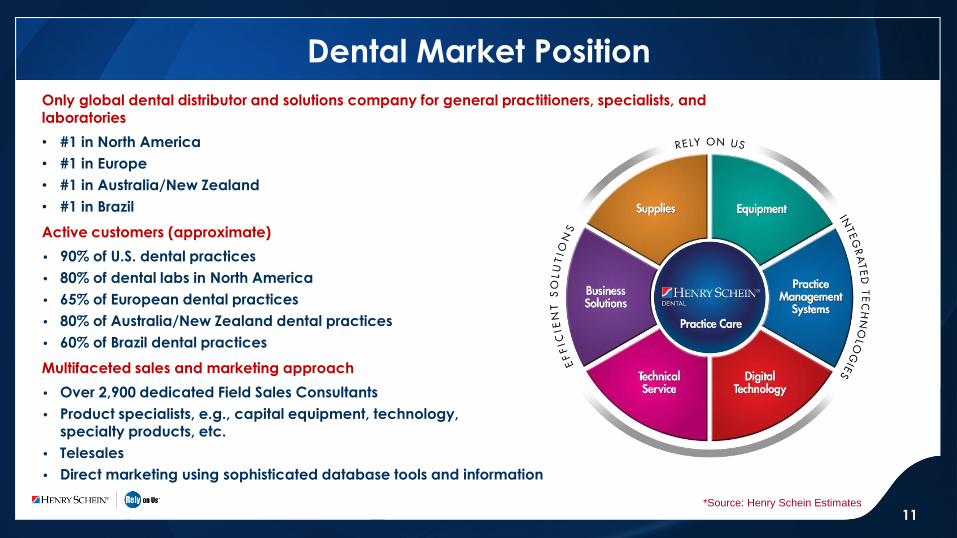
Dental Market Position
Only global dental distributor and solutions company for general practitioners, specialists, and laboratories
• #1 in North America
• #1 in Europe
• #1 in Australia/New Zealand
• #1 in Brazil
Active customers (approximate)
• 90% of U.S. dental practices
• 80% of dental labs in North America
• 65% of European dental practices
• 80% of Australia/New Zealand dental practices
• 60% of Brazil dental practices
Multifaceted sales and marketing approach
• Over 2,900 dedicated Field Sales Consultants
• Product specialists, e.g., capital equipment, technology,specialty products, etc.
• Telesales
• Direct marketing using sophisticated database tools and information
*Source: Henry Schein Estimates
11
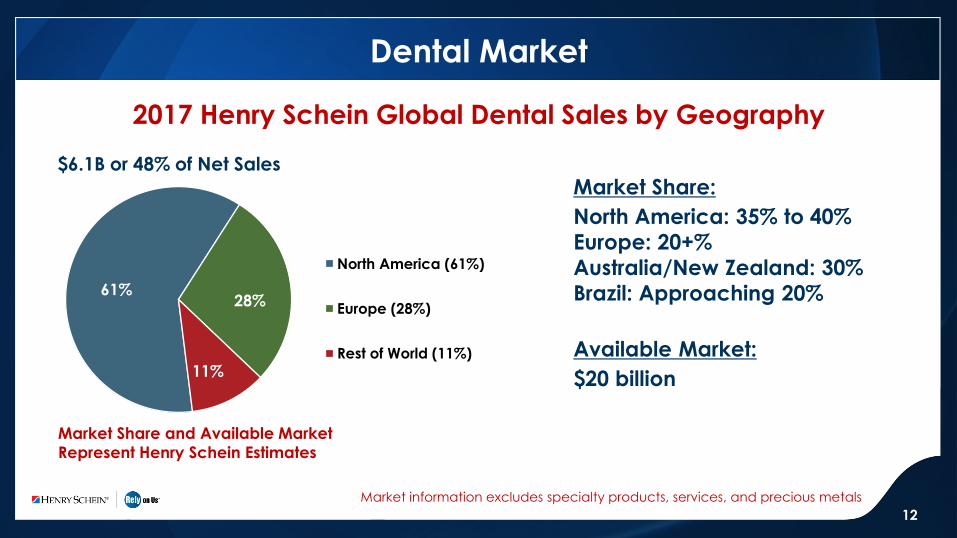
Dental Market
Market Share:
North America: 35% to 40%
Europe: 20+%
Australia/New Zealand: 30%
Brazil: Approaching 20%
Available Market:
$20 billion
2017 Henry Schein Global Dental Sales by Geography
Market information excludes specialty products, services, and precious metals
Market Share and Available Market
Represent Henry Schein Estimates
North America (61%)
Europe (28%)
Rest of World (11%)
61%28%
11%
12
$6.1B or 48% of Net Sales

Dental Specialty Markets
Dental Specialties
• Approximately $700 million in TTM revenue
Implants
• High-margin business
• Traditionally faster growth than core dental market
• Ability to leverage existing relationships with specialty practitioners
• General practitioners increasingly performing specialty procedures
Orthodontics
• Focus on orthodontic specialist
• Opportunity to expand product offering
• Specialist and general practitioner education
Endodontics
• Up to 25 million root canal treatments performed in the U.S. each year
• General Practitioners perform approximately 80% of root canal treatments in the U.S.
• The U.S. market accounts for approximately 30% of the worldwide endodontic market
• Aging population retaining more teeth and electing root canal treatments
Available Market: $7.8 billion
Source: Henry Schein Estimates
Market Share: 6%Market Share: 9%
13

Dental Market – Growth Opportunities
• Increasing penetration withexisting customers
• Geographic expansion
• Advancing technology solutions,centered on practice management software
• Greater penetration of specialty markets
• Continued focus on large group practices
• Digitalization of prosthetic solutions
14

Key Acquisitions Description LTM Revenue*
Ortho2** (2018) Advanced PMS for orthodontists $14M
Edge Endo (2017) Expands our line of Endodontic Solutions $17M
SAS (2017) Enhances Dental Surgical Supply offering $72M
Marrodent (2016) Entry into Poland Dental Market $32M
CAP (2016) Expands Lab Supply Business in the U.S. $30M
One Piece (2016)* * Expands our Dental Business in Japan $125M
Dental Cremer (2016) Expands our Dental Business in Brazil $145M
Dental Trey (2015) Builds on our Dental Business in Italy $49M
Iwase (2014) )** Entry into Japan Dental Market $190M
Dental Speed Graph (2014) Entry into Brazilian Dental Market $28M
Arseus (2014) Strengthened our European Dental Lab Business $97M
BioHorizons (2013) Investment in Dental Implant Manufacturer $115M
Optident (2013) Strengthened Dental Presence in the U.K. $20M
* Last 12 months revenue at time of acquisition in USD** Not consolidated
Dental Market – Key Acquisitions
15

Planned Henry Schein Animal Health Spin-off/Merger
16
Unlocks Shareholder Value for Vets First Corp. and Henry Schein
• Positions each company for above market growth
• Streamlined focus and enhanced capital allocation
• Grows available market for veterinarians and manufacturers
• Expected year three synergies will be in excess of $100M in operating income
Vets First Corp.
• Animal health:
• Assist veterinarians in managing their practices through a
multi-channel platform
• Harness the power of insights and analytics
• Henry Schein Animal Health’s practice management solutions
combined with Vets First Choice platform to drive differentiated level of
service and support to veterinarians
• Help clinicians achieve better outcomes for pets through increased
compliance
• Positions Vets First Corp. to achieve a premium valuation
Henry Schein
Dental and medical:
• Increase focus in helping dentists and physicians in operating a more
efficient practice so practitioners can deliver quality clinical care
• High-touch, full-service, value-added approach for supplies,
equipment, service, and practice management software
• Provide innovative solutions for global dental and medical practitioners
• Opportunity for increased investment
• Expected to be between $1.0 billion and $1.25 billion in cash
on a tax-free basis
• Expect to buy out the minority interest in our U.S. Animal
Health business for approximately $365 million
Announced April 23, 2018; expected to close by end of 2018

Vets First Corp.: Creating a Win for Stakeholders
17
Vet Pet Owner Manufacturer
• Enhanced medical compliance
• Improved practice economics
• Improved pet health• Multi-channel
healthcare• Enhanced client
experience
• Driver of category growth • Global partner
A new value chain connecting veterinarians, pet owners, and manufacturers
to improve the delivery of care and increase value for shareholders
Internal Teams
• Collaborative growth with focused missions
• Exciting growth opportunities for both companies

Animal Health Market Position
Source: Henry Schein Estimates
Only global Animal Health distributor and solutions company
• #1 in North America (Companion Animal Health)
• #1 in Europe
• #1 in Australia/New Zealand
Active customers of Henry Schein (approximate)
• 75% of veterinarians in the U.S.
• 70% of veterinarians in Europe
• 70% of veterinarians in Australia/New Zealand
Approximately 680 dedicated Field Sales Consultants
18

Animal Health Market
$3.5B or 28% of Net Sales
Market Share:
North America: 35%
Europe: 20%
Australia/New Zealand: 20%
Brazil: <5%
Available Market:
$10 billion
Sales on U.S. GAAP basis not
grossed up for agency sales
Market Share and Available MarketRepresent Henry Schein Estimates
North America (52%)
Europe (39%)
Rest of World (10%)
52%
39%
10%
19
2017 Henry Schein Global Animal Health Sales by Geography

Animal Health Growth Opportunities
• Increasing penetration
with existing customers
• Geographic expansion
• Advancing technology solutions,
including practice management
• Continued focus on large group practices
• Focus on practice-building products
and services
20

21
* Last 12 months revenue at time of acquisition in USD** Not consolidated
Animal Health Key Acquisitions
Key Acquisitions Description LTM Revenue*
Abase (2018) Expands Animal Health Business in Brazil $27M
Merritt Veterinary Supplies (2017) Expanded Companion Business in Eastern U.S. $115M
Tecnew (2017) Entry into Animal Health Market in Brazil $24M
Jorgen Kruuse A/S (2015) Entry into Animal Health Market in Nordic Region $90M
Maravet (2015)** Expanded Animal Health Presence in Eastern Europe $23M
scil (2015) Added Lab and Imaging Diagnostic Products $83M
SmartPak (2014) Added Equine Products Portfolio $105M
Medivet (2014) Expanded Animal Health Business to Poland $86M
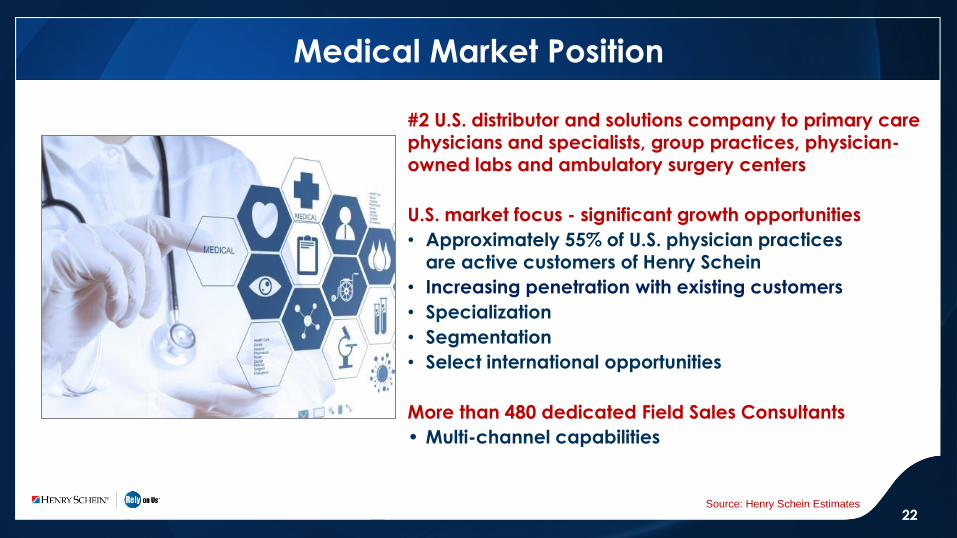
Medical Market Position
#2 U.S. distributor and solutions company to primary care physicians and specialists, group practices, physician-owned labs and ambulatory surgery centers
U.S. market focus - significant growth opportunities
• Approximately 55% of U.S. physician practicesare active customers of Henry Schein
• Increasing penetration with existing customers
• Specialization
• Segmentation
• Select international opportunities
More than 480 dedicated Field Sales Consultants
• Multi-channel capabilities
Source: Henry Schein Estimates22

Medical Market
$2.5B or 20% of Net Sales
U.S. Market Share:
Approximately 20%
Available Market:
$9 to $10 billion
Market information excludes certain specialty and oncology pharmaceutical products, software, and certain other services
North America (97%)
Europe (3%)
97%
3%
Source: Henry Schein Estimates23
2017 Henry Schein Global Medical Sales by Geography

Henry Schein One – New Global Company
• Henry Schein forms joint venture, named Henry Schein One, to deliver a greater level of integrated dental technology
• Henry Schein brings an installed base of practice management solutions that cater to over 40% of N.A. dental practices today
• Internet Brands delivers expanded marketing and patient communications to the robust Henry Schein software offering
• Henry Schein will have majority ownership (over 70%).
• Mission: to deliver a new platform of enhanced dental software and services that work together seamlessly to share data and streamline the digital workflow for dental teams.
• Having end-to-end management and marketing systems will enable dental team members to be better business managers, clinicians to be more efficient, and build patient loyalty.
• The combined entity had pro-forma 2017 sales of ~$400M.
• Expect transaction to be neutral to balance of HSIC 2018 EPS, excluding impact of one-time transfer taxes of ~$4.5M, or $0.03 per share; accretive thereafter. Expected to close in Q2 2018.
• Potential for $20M to $30M in annual synergies by the end of year three.
24

Technology & Value-Added Services Market Position
Practice Management Solutions• Two-thirds of revenue is recurring
- Technical support
- E-claims and credit card processing
• U.S. penetration (approximate)
- 40% Dental practices
- 50% Animal Health practices
- Growing physician presence
• A leader in servicing large practices in
Dental and Animal Health
• Approximately 100 dedicated Field Sales Consultants
• Direct access to more than 90% of dental schools
in North America
• In 11 countries outside the U.S.
• Synergies with broader
distribution business
• Leveraging R&D, marketing,
and technology across
business units
• Technology development
for a “global” business
Source: Henry Schein Estimates25
Financial Services• Full-service provider of financial services
• Providing Value-Added Services to clients

Technology & Value-Added Solutions
$438M or 4% of Net Sales
Approximately 15% of
Company Operating Income**
* Last 12 months revenue at time of acquisition in USD
North America (83%)
Europe (13%)
Rest of World (4%)
83%
13%
4%
26
Key Acquisitions/JVs Description LTM Revenue*
Henry Schein One (2018) JV delivering integrated dental technology $400M (pro forma)
eVetPractice (2017) Adds cloud-based software for vet clinics Not disclosed
Vetstreet (2016) SaaS solutions and health analytics $43M
Logiciel Julie (2014) Leading dental PMS company in France $10M
2017 Henry Schein Global Technology & Value-Added Services by Geography

Financial Performance
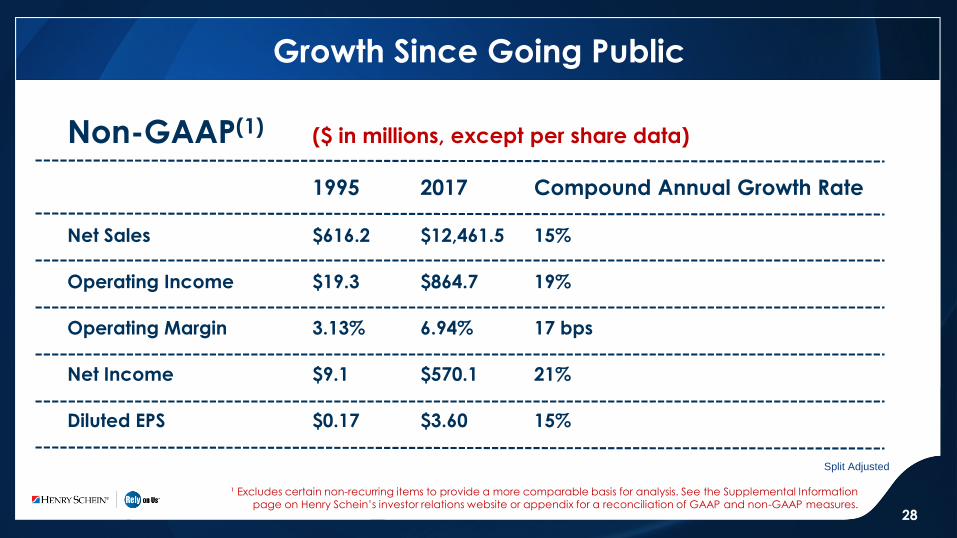
Growth Since Going Public
¹ Excludes certain non-recurring items to provide a more comparable basis for analysis. See the Supplemental Information page on Henry Schein’s investor relations website or appendix for a reconciliation of GAAP and non-GAAP measures.
Non-GAAP(1) ($ in millions, except per share data)
1995 2017 Compound Annual Growth Rate
Net Sales $616.2 $12,461.5 15%
Operating Income $19.3 $864.7 19%
Operating Margin 3.13% 6.94% 17 bps
Net Income $9.1 $570.1 21%
Diluted EPS $0.17 $3.60 15%
Split Adjusted
28
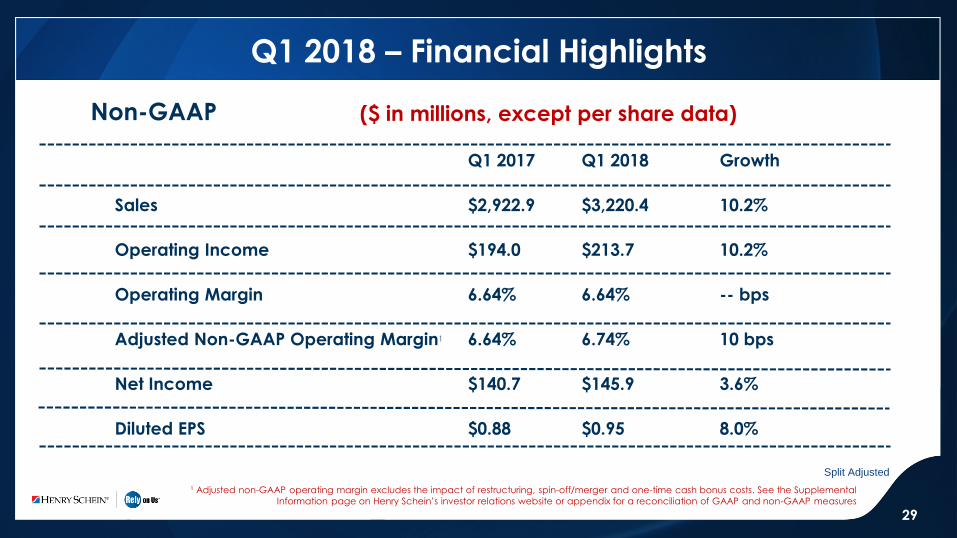
Q1 2018 – Financial Highlights
($ in millions, except per share data)
Q1 2017 Q1 2018 Growth
Sales $2,922.9 $3,220.4 10.2%
Operating Income $194.0 $213.7 10.2%
Operating Margin 6.64% 6.64% -- bps
Adjusted Non-GAAP Operating Margin1 6.64% 6.74% 10 bps
Net Income $140.7 $145.9 3.6%
Diluted EPS $0.88 $0.95 8.0%
¹ Adjusted non-GAAP operating margin excludes the impact of restructuring, spin-off/merger and one-time cash bonus costs. See the Supplemental
Information page on Henry Schein’s investor relations website or appendix for a reconciliation of GAAP and non-GAAP measures
Split Adjusted
29
Non-GAAP
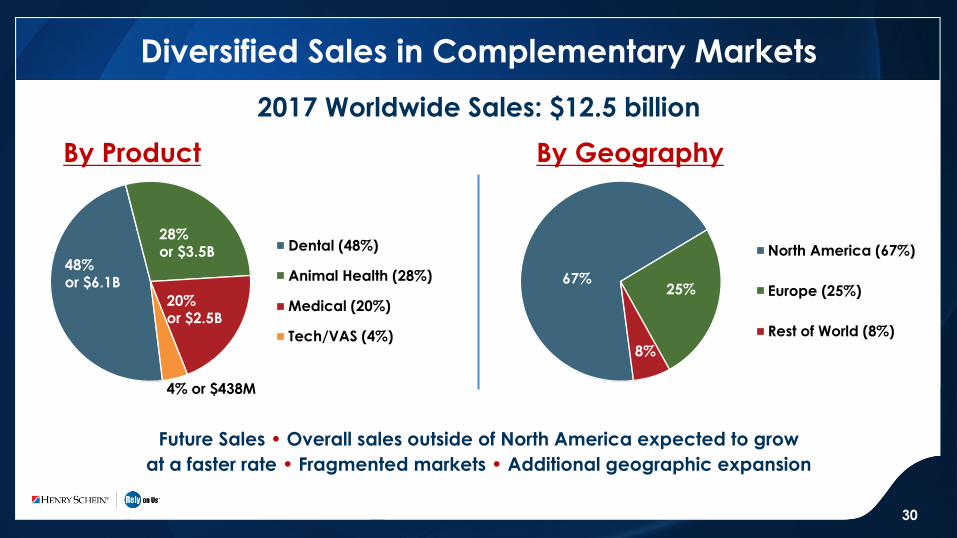
Diversified Sales in Complementary Markets
Future Sales • Overall sales outside of North America expected to grow
at a faster rate • Fragmented markets • Additional geographic expansion
By Product By Geography
2017 Worldwide Sales: $12.5 billion
Dental (48%)
Animal Health (28%)
Medical (20%)
Tech/VAS (4%)
48%or $6.1B
28%or $3.5B
20%or $2.5B
4% or $438M
North America (67%)
Europe (25%)
Rest of World (8%)
67%25%
8%
30
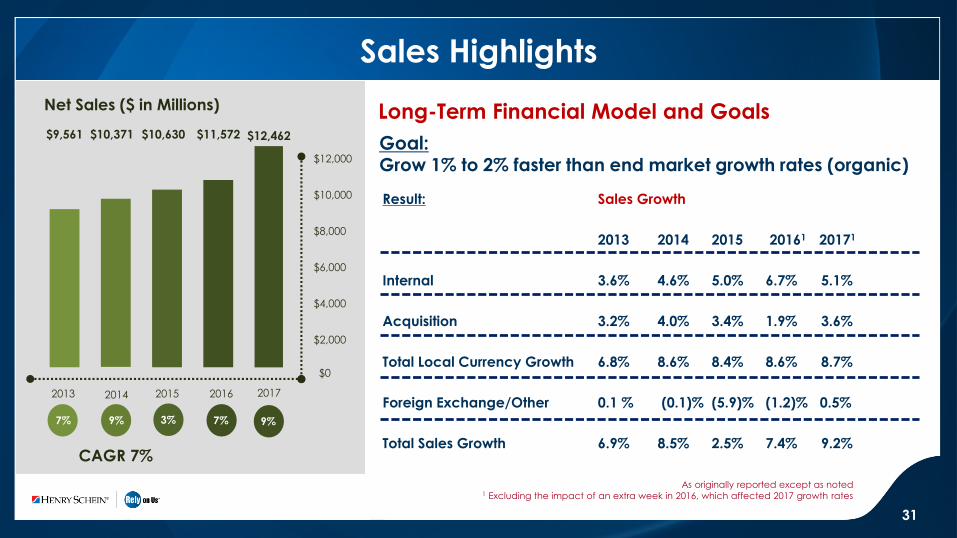
Sales Highlights
Long-Term Financial Model and Goals
Goal:Grow 1% to 2% faster than end market growth rates (organic)
As originally reported except as noted1 Excluding the impact of an extra week in 2016, which affected 2017 growth rates
Result: Sales Growth
2013 2014 2015 20161 20171
Internal 3.6% 4.6% 5.0% 6.7% 5.1%
Acquisition 3.2% 4.0% 3.4% 1.9% 3.6%
Total Local Currency Growth 6.8% 8.6% 8.4% 8.6% 8.7%
Foreign Exchange/Other 0.1 % (0.1)% (5.9)% (1.2)% 0.5%
Total Sales Growth 6.9% 8.5% 2.5% 7.4% 9.2%
Net Sales ($ in Millions)
31
CAGR 7%
2016201520142013
$10,371$9,561 $10,630 $11,572
7% 9% 3% 7%
$0
$2,000
$4,000
$6,000
$8,000
$10,000
$12,000
$12,462
2017
9%
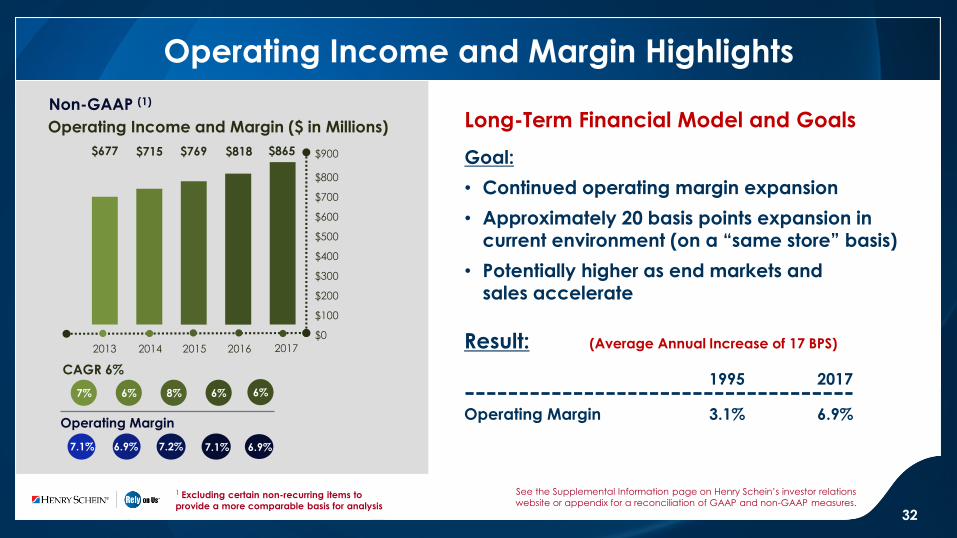
Operating Income and Margin Highlights
Long-Term Financial Model and Goals
Goal:
• Continued operating margin expansion
• Approximately 20 basis points expansion incurrent environment (on a “same store” basis)
• Potentially higher as end markets andsales accelerate
See the Supplemental Information page on Henry Schein’s investor relations
website or appendix for a reconciliation of GAAP and non-GAAP measures.
Result: (Average Annual Increase of 17 BPS)
1995 2017
Operating Margin 3.1% 6.9%
1 Excluding certain non-recurring items to
provide a more comparable basis for analysis
Operating Income and Margin ($ in Millions)
Non-GAAP (1)
2016201520142013
$715$677 $769 $818
$0
$300
$400
$500
$600
$700
$800
$200
$100
$900
2017
$865
7% 6% 8% 6%
7.1%7.2%6.9%7.1%
Operating Margin
CAGR 6%
6.9%
6%
32

Earnings Highlights
1 Excluding certain non-recurring items to
provide a more comparable basis for analysis
Long-Term Financial Model and Goals
Goal:High single to low double-digit organic dilutedEPS growth enhanced by share repurchasesand acquisitions
Result:
1995 2017
Adjusted Diluted EPS $0.17 $3.60 (CAGR of 15%)
See the Supplemental Information page on Henry Schein’s investor relations
website or appendix for a reconciliation of GAAP and non-GAAP measures.
Split Adjusted
Split Adjusted
2016201520142013
$2.72$2.47 $2.98 $3.31
$0
$2.00
$3.00
$1.00
$3.60
2017
33
EPS and Net Income
Non-GAAP (1)
11% 10% 10% 11%
$541.2$501.5$466.1$433.4
Net Income Attributable to Henry Schein, Inc.
CAGR 10%
$570.1
9%

Cash Flow Highlights
Long-Term Financial Model and Goals
Goal:
• Cash flow from operations
to exceed net income
Result:
• Annual operating cash flow
has exceeded net income in
excess of $1 billion since
2009*
Operating Cash Flow ($ in Millions)
Operating Cash Flow Capital Expenditures
2016201520142013
$593$664 $616 $643
$0
$300
$400
$500
$600
$700
$800
$200
$100
$60 $82 $72 $70 $82
$546
2017
*From 2009 through 2017
34

Cash Return to Shareholders
Share Repurchases
$300M
2013 2014 2015 2016
$0
$700M
$500M
$400M
$550M
$300M$300M
$200M
$100M
$600M
$300M
$450M
2017
35
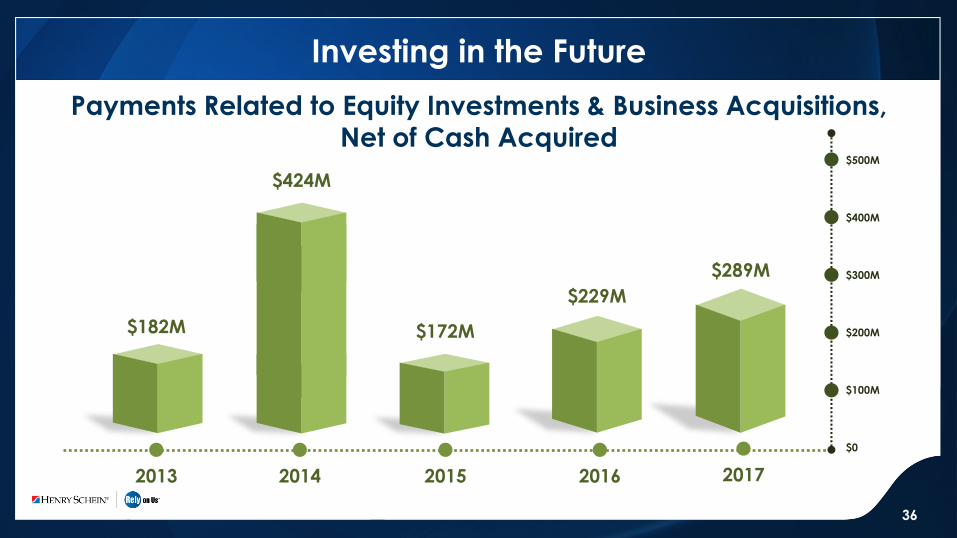
Investing in the Future
Payments Related to Equity Investments & Business Acquisitions,Net of Cash Acquired
$182M
$424M
$172M
2013 2014 2015 2016
$0
$300M
$400M
$500M
$200M
$100M
$229M
2017
$289M
36
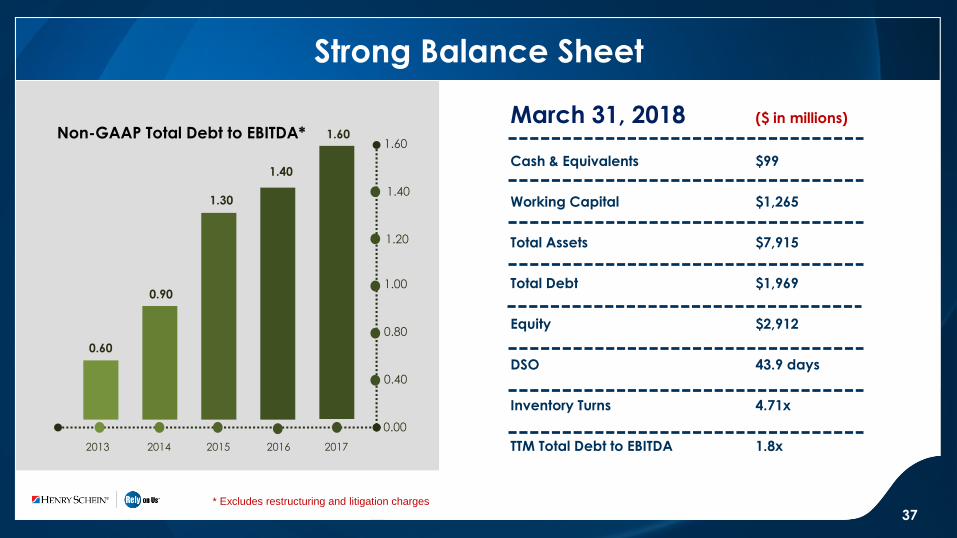
Strong Balance Sheet
March 31, 2018 ($ in millions)
Cash & Equivalents $99
Working Capital $1,265
Total Assets $7,915
Total Debt $1,969
Equity $2,912
DSO 43.9 days
Inventory Turns 4.71x
TTM Total Debt to EBITDA 1.8x
Non-GAAP Total Debt to EBITDA*
2016201520142013
0.60
0.90
1.30
1.40
0.00
0.40
0.80
1.00
1.40
1.60
1.20
* Excludes restructuring and litigation charges
37
2017
1.60
38
Investment Merits
• Multiple organic and strategic
growth opportunities
• Proven financial track record
• Operating model goals
set the stage for attractive
long-term growth
• Experienced Management Team

APPENDIX
39
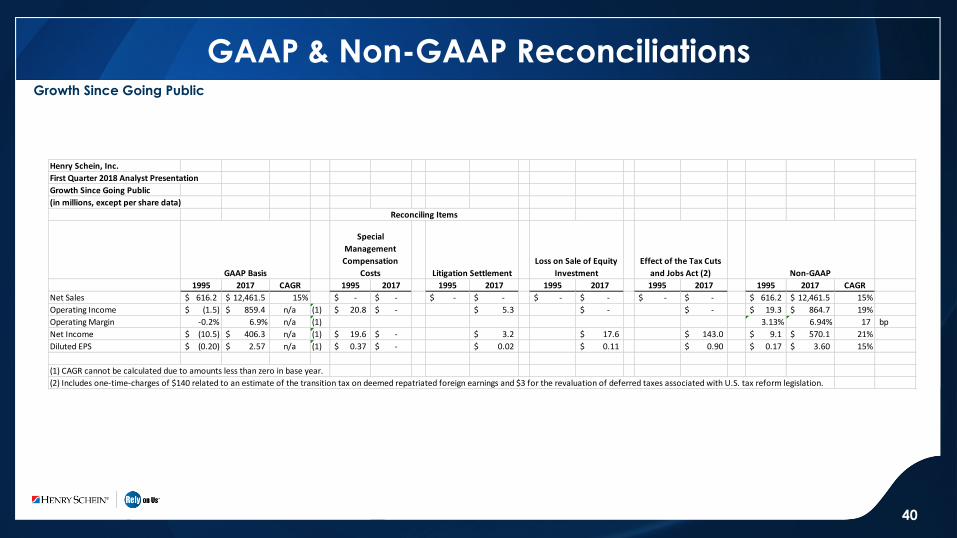
GAAP & Non-GAAP ReconciliationsGrowth Since Going Public
40
Henry Schein, Inc.
First Quarter 2018 Analyst Presentation
Growth Since Going Public
(in millions, except per share data)
1995 2017 CAGR 1995 2017 1995 2017 1995 2017 1995 2017 1995 2017 CAGR
Net Sales 616.2$ 12,461.5$ 15% -$ -$ -$ -$ -$ -$ -$ -$ 616.2$ 12,461.5$ 15%
Operating Income (1.5)$ 859.4$ n/a (1) 20.8$ -$ 5.3$ -$ -$ 19.3$ 864.7$ 19%
Operating Margin -0.2% 6.9% n/a (1) 3.13% 6.94% 17 bp
Net Income (10.5)$ 406.3$ n/a (1) 19.6$ -$ 3.2$ 17.6$ 143.0$ 9.1$ 570.1$ 21%
Diluted EPS (0.20)$ 2.57$ n/a (1) 0.37$ -$ 0.02$ 0.11$ 0.90$ 0.17$ 3.60$ 15%
(1) CAGR cannot be calculated due to amounts less than zero in base year.
(2) Includes one-time-charges of $140 related to an estimate of the transition tax on deemed repatriated foreign earnings and $3 for the revaluation of deferred taxes associated with U.S. tax reform legislation.
Reconciling Items
Non-GAAPGAAP Basis Litigation Settlement
Special
Management
Compensation
Costs
Loss on Sale of Equity
Investment
Effect of the Tax Cuts
and Jobs Act (2)

GAAP & Non-GAAP Reconciliations
Full Year 2017 Financial Highlights
41
Henry Schein, Inc.
First Quarter 2018 Analyst Presentation
Full Year 2017 Financial Highlights
(in millions, except per share data)
2016 2017 Growth 2016 2017 2016 2017 2016 2017 2016 2017 2016 2017 2016 2017 Growth
Net Sales 11,571.7$ 12,461.5$ 7.7% -$ -$ -$ -$ -$ -$ -$ -$ -$ -$ 11,571.7$ 12,461.5$ 7.7%
Operating Income 771.6$ 859.4$ 11.4% 45.9$ -$ -$ 5.3$ -$ -$ 45.9$ 5.3$ 817.5$ 864.7$ 5.8%
Operating Margin 6.67% 6.90% 23 bp 7.06% 6.94% (12) bp
Net Income 506.8$ 406.3$ -19.8% 34.4$ -$ -$ 3.2$ 17.6$ 143.0$ 34.4$ 163.8$ 541.2$ 570.1$ 5.3%
Diluted EPS 3.10$ 2.57$ -17.1% 0.21$ -$ -$ 0.02$ 0.11$ 0.90$ 0.21$ 1.03$ 3.31$ 3.60$ 8.6%
(1) Includes one-time-charges of $140 related to an estimate of the transition tax on deemed repatriated foreign earnings and $3 for the revaluation of deferred taxes associated with U.S. tax reform legislation.
Non-GAAPRestructuring Litigation SettlementGAAP Basis
Reconciling Items
Total Reconciling Items
Loss on Sale of
Equity
Investment
Effect of the Tax Cuts
and Jobs Act (1)
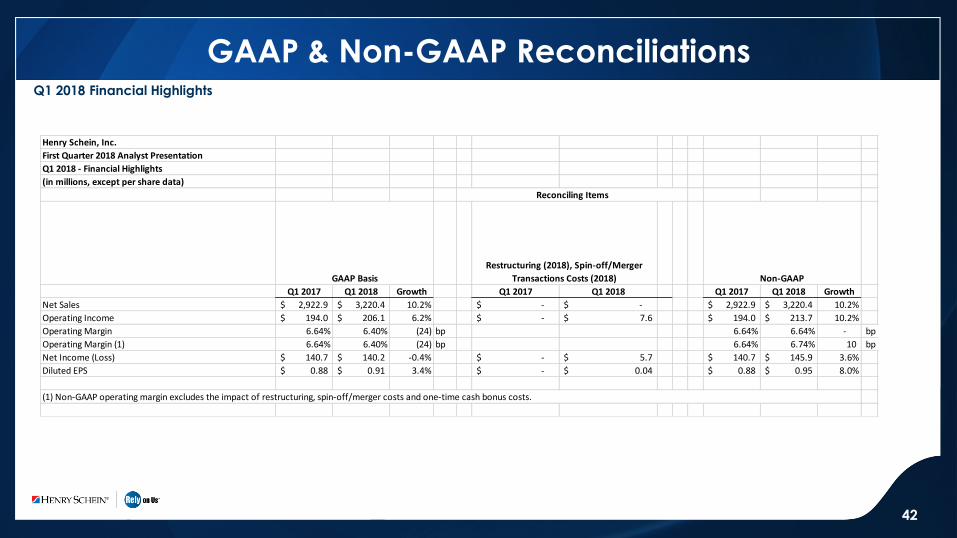
GAAP & Non-GAAP ReconciliationsQ1 2018 Financial Highlights
42
Henry Schein, Inc.
First Quarter 2018 Analyst Presentation
Q1 2018 - Financial Highlights
(in millions, except per share data)
Q1 2017 Q1 2018 Growth Q1 2017 Q1 2018 Q1 2017 Q1 2018 Growth
Net Sales 2,922.9$ 3,220.4$ 10.2% -$ -$ 2,922.9$ 3,220.4$ 10.2%
Operating Income 194.0$ 206.1$ 6.2% -$ 7.6$ 194.0$ 213.7$ 10.2%
Operating Margin 6.64% 6.40% (24) bp 6.64% 6.64% - bp
Operating Margin (1) 6.64% 6.40% (24) bp 6.64% 6.74% 10 bp
Net Income (Loss) 140.7$ 140.2$ -0.4% -$ 5.7$ 140.7$ 145.9$ 3.6%
Diluted EPS 0.88$ 0.91$ 3.4% -$ 0.04$ 0.88$ 0.95$ 8.0%
Reconciling Items
GAAP Basis
Restructuring (2018), Spin-off/Merger
Transactions Costs (2018) Non-GAAP
(1) Non-GAAP operating margin excludes the impact of restructuring, spin-off/merger costs and one-time cash bonus costs.
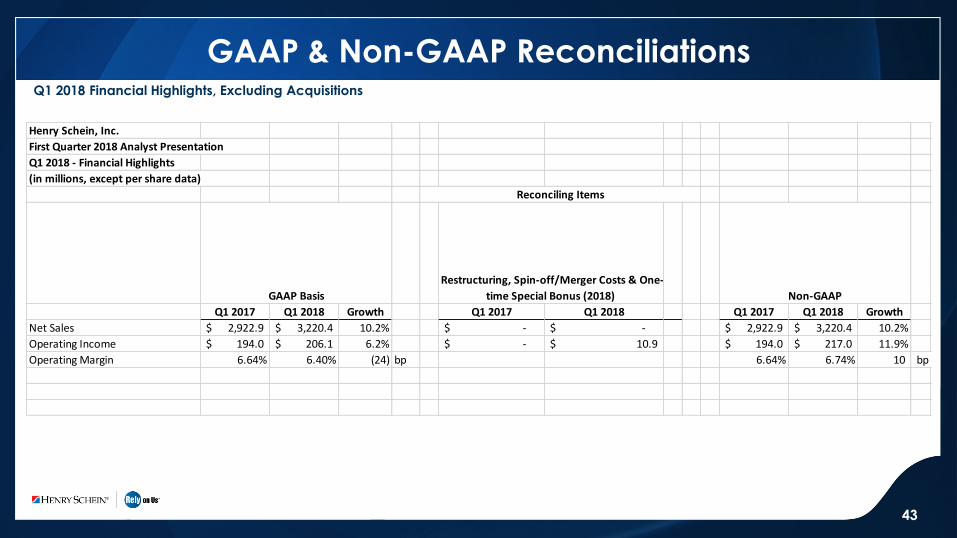
GAAP & Non-GAAP ReconciliationsQ1 2018 Financial Highlights, Excluding Acquisitions
43
Henry Schein, Inc.
First Quarter 2018 Analyst Presentation
Q1 2018 - Financial Highlights
(in millions, except per share data)
Q1 2017 Q1 2018 Growth Q1 2017 Q1 2018 Q1 2017 Q1 2018 Growth
Net Sales 2,922.9$ 3,220.4$ 10.2% -$ -$ 2,922.9$ 3,220.4$ 10.2%
Operating Income 194.0$ 206.1$ 6.2% -$ 10.9$ 194.0$ 217.0$ 11.9%
Operating Margin 6.64% 6.40% (24) bp 6.64% 6.74% 10 bp
Reconciling Items
GAAP Basis
Restructuring, Spin-off/Merger Costs & One-
time Special Bonus (2018) Non-GAAP

GAAP & Non-GAAP ReconciliationsOperating Income
44
Henry Schein, Inc.
First Quarter 2018 Analyst Presentation
Operating Income and Margin Highlights
(in millions, except per share data)
2010 2011 2012 2013 2014 2015 2016 2017 Q1 2017 Q1 2018 2010 2011 2012 2013 2014 2015 2016 2017 Q1 2017 Q1 2018
Net Sales 7,526.8$ 8,530.2$ 8,940.0$ 9,560.6$ 10,371.4$ 10,629.7$ 11,571.7$ 12,461.5$ 2,922.9$ 3,220.4$
Operating Income 521.1$ 582.1$ 619.0$ 677.1$ 715.1$ 734.0$ 771.6$ 859.4$ 194.0$ 206.1$ 12.3$ -$ 15.2$ -$ -$ 34.9$ 45.9$ 5.3$ -$ 7.6$
Operating Margin 6.92% 6.82% 6.92% 7.08% 6.90% 6.90% 6.67% 6.90% 6.64% 6.40%
Operating Income Growth % 12% 6% 9% 6% 3% 5% 11% 6%
Operating Margin % 6.8% 6.9% 7.1% 6.9% 6.9% 6.7% 6.9% 6.4%
CAGR 6% 6% 6%
Reconciling ItemsGAAP
2010 2011 2012 2013 2014 2015 2016 2017 Q1 2017 Q1 2018
Net Sales 7,526.8$ 8,530.2$ 8,940.0$ 9,560.6$ 10,371.4$ 10,629.7$ 11,571.7$ 12,461.5$ 2,922.9$ 3,220.4$
Operating Income 533.4$ 582.1$ 634.2$ 677.1$ 715.1$ 768.9$ 817.5$ 864.7$ 194.0$ 213.7$
Operating Margin 7.1% 6.8% 7.1% 7.1% 6.9% 7.2% 7.1% 6.94% 6.64% 6.64%
Operating Income Growth % 9% 9% 7% 6% 8% 6% 6% 10%
Operating Margin % 6.8% 7.1% 7.1% 6.9% 7.2% 7.1% 6.9% 6.6%
CAGR 7% 7% 6%
Non-GAAP

GAAP & Non-GAAP ReconciliationsEarnings Highlights
45
Henry Schein, Inc.
First Quarter 2018 Analyst Presentation
Earnings Highlights
(in millions, except per share data)
2011 2012 2013 2014 2015 2016 2017 Q1 2017 Q1 2018 2011 2012 2013 2014 2015 2016 2017 Q1 2017 Q1 2018
GAAP Earnings (Loss) per share 1.98$ 2.16$ 2.46$ 2.72$ 2.85$ 3.10$ 2.57$ 0.88$ 0.91$ GAAP Net Income (Loss) 367.7$ 388.1$ 431.6$ 466.1$ 479.1$ 506.8$ 406.3$ 140.7$ 140.2$
GAAP EPS Growth % 14% 9% 14% 11% 5% 9% -17%
GAAP EPS CAGR 10% 9% 1%
2011 2012 2013 2014 2015 2016 2017 Q1 2017 Q1 2018 2011 2012 2013 2014 2015 2016 2017 Q1 2017 Q1 2018
Restructuring 0.06$ 0.15$ 0.21$ -$ 0.02$ Restructuring 10.5$ 26.2$ 34.4$ 2.8$
Accelerated Amortization of Deferred
Financing Costs 0.02$
Accelerated Amortization of
Deferred Financing Costs 2.7$
Foreign Tax Benefit (0.08)$ Foreign Tax Benefit (13.4)$
Tax Benefit (0.02)$ Tax Benefit (3.8)$
Litigation Settlement net of Tax Benefit 0.02$ Litigation Settlement net of Tax Benefit 3.2$
Loss on Sale of Equity Investment 0.07$ 0.11$ Loss on Sale of Equity Investment 12.5$ 17.6$
Transitional Tax on Deemed
Repatriated Foreign Earnings 0.88$
Transitional Tax on Deemed
Repatriated Foreign Earnings 140.0$
Deferred Taxes Associated with U.S.
Tax Reform Legislation 0.02$
Deferred Taxes Associated with
U.S. Tax Reform Legislation 3.0$
Transaction Costs 0.02$ Transaction Costs 2.9$
2011 2012 2013 2014 2015 2016 2017 Q1 2017 Q1 2018 2011 2012 2013 2014 2015 2016 2017 Q1 2017 Q1 2018
Non-GAAP EPS 1.98$ 2.22$ 2.47$ 2.72$ 2.98$ 3.31$ 3.60$ 0.88$ 0.95$ Non-GAAP Net Income 367.7$ 398.6$ 433.4$ 466.1$ 501.5$ 541.2$ 570.1$ 140.7$ 145.9$
Non-GAAP EPS Growth % 11% 12% 11% 10% 10% 11% 9%
Non-GAAP EPS CAGR 11% 11% 10%
EPS Reconciling Items Net Income Reconciling Items
GAAP Net IncomeGAAP EPS
Non-GAAP EPS Non-GAAP Net Income