nasa-dod combined environments testing results · nasa-dod combined environments testing results ....
TRANSCRIPT
NASA-DoD COMBINED ENVIRONMENTS TESTING RESULTS
Cynthia Garcia Raytheon Company
McKinney, TX, USA [email protected]
ABSTRACT As part of the NASA-DoD Lead-Free Electronics project, combined environments testing was performed to validate and demonstrate lead-free solders as potential replacements for conventional tin-lead solders against aerospace and mili-tary electronics industry requirements for circuit card as-semblies. Solder alloys Sn3.0Ag0.5Cu, Sn0.7Cu0.05Ni (≤0.01Ge) and Sn37Pb were used to assemble components on two different printed wiring board test vehicles: manufactured and re-work. The rework test vehicles included BGA-225, CSP-100, PDIP-20, and TSOP-50 components that were removed and replaced.
The test vehicles were subjected to thermal cycling from -55 to 125 degrees Celsius, a ramp rate of 20 degrees Celsius per minute, and dwelling at each temperature extreme for 15 minutes in a HALT (highly accelerated life test) chamber. Pseudorandom vibration was applied continuously through-out the life test beginning at 10 grms and increased by 5 grms after 50 cycles until a maximum of 55 grms was reached. The test vehicles were electrically monitored for 650 cycles us-ing event detectors.
Solder joint failure data of a given component type, compo-nent finish and solder alloy were evaluated using 2-parameter Weibull analysis. The reliability of each lead-free solder alloy tested was compared to the baseline Sn37Pb solder alloy.
Key words: Lead-free, tin-lead, solder, reliability testing INTRODUCTION In November 2006, the NASA-DoD Lead-Free Electronics Project and a consortium formed to build on the results from the 2005 JCAA/JG-PP Lead-Free Solder Project. The new project focused on the rework of tin-lead and lead-free sol-der alloys and includes the mixing of tin-lead and lead-free solder alloys1. The majority of testing mirrored the testing completed for the JCAA/JGPP Lead-Free Solder Project. Combined environments test was one of several tests se-lected by the consortium to determine lead-free solder joint reliability under both thermal cycle and vibration environ-mental exposures, replicating the field environment. METHODS, ASSUMPTIONS AND PROCEDURES Solder Alloys Solder alloys Sn3.0Ag0.5Cu, Sn0.7Cu0.05Ni (≤0.01Ge) and Sn37Pb were selected by the consortia for testing. Tin-Silver-Copper (Sn3.0Ag0.5Cu or SAC305) is the leading
choice of the commercial electronics industry for lead-free solder. Alloys with compositions within the range of Sn3.0-4.0Ag0.5-1.0Cu have a liquidus temperature around 217 degrees Celsius and have similar microstructures and me-chanical properties to that of tin-lead solder1.
Tin-copper (Sn0.7Cu0.05Ni(≤0.01Ge) or SN100C) is com-mercially available and the general industry trend has been to switch to the nickel stabilized tin-copper alloy over stan-dard tin-copper due to its superior performance.
Tin-lead (Sn37Pb) or eutectic tin-lead is the baseline solder alloy. Test Vehicle The test vehicle was a circuit card assembly designed per IPC-SM-785 and IPC-9701 to evaluate solder joint reliabili-ty2,3. The test vehicle printed wiring board was designed and fabricated per IPC-6012, Class 34. The board had six layers and an overall dimension of 12.75 X 9 X 0.09 inches thick1.
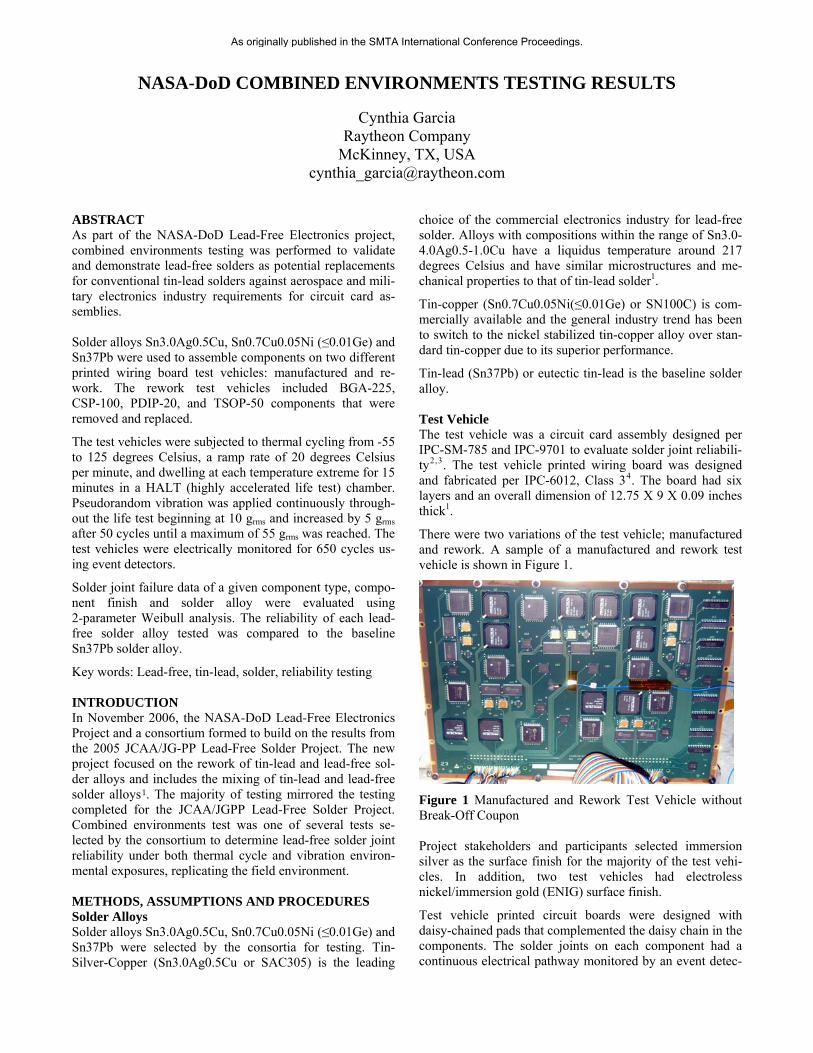
There were two variations of the test vehicle; manufactured and rework. A sample of a manufactured and rework test vehicle is shown in Figure 1.
Figure 1 Manufactured and Rework Test Vehicle without Break-Off Coupon Project stakeholders and participants selected immersion silver as the surface finish for the majority of the test vehi-cles. In addition, two test vehicles had electroless nickel/immersion gold (ENIG) surface finish.
Test vehicle printed circuit boards were designed with daisy-chained pads that complemented the daisy chain in the components. The solder joints on each component had a continuous electrical pathway monitored by an event detec-
As originally published in the SMTA International Conference Proceedings.
tor during the test. Each component had its own distinct pathway (channel). Table 1 lists the test vehicles received from the consortium member that manufactured the test vehicles for testing.
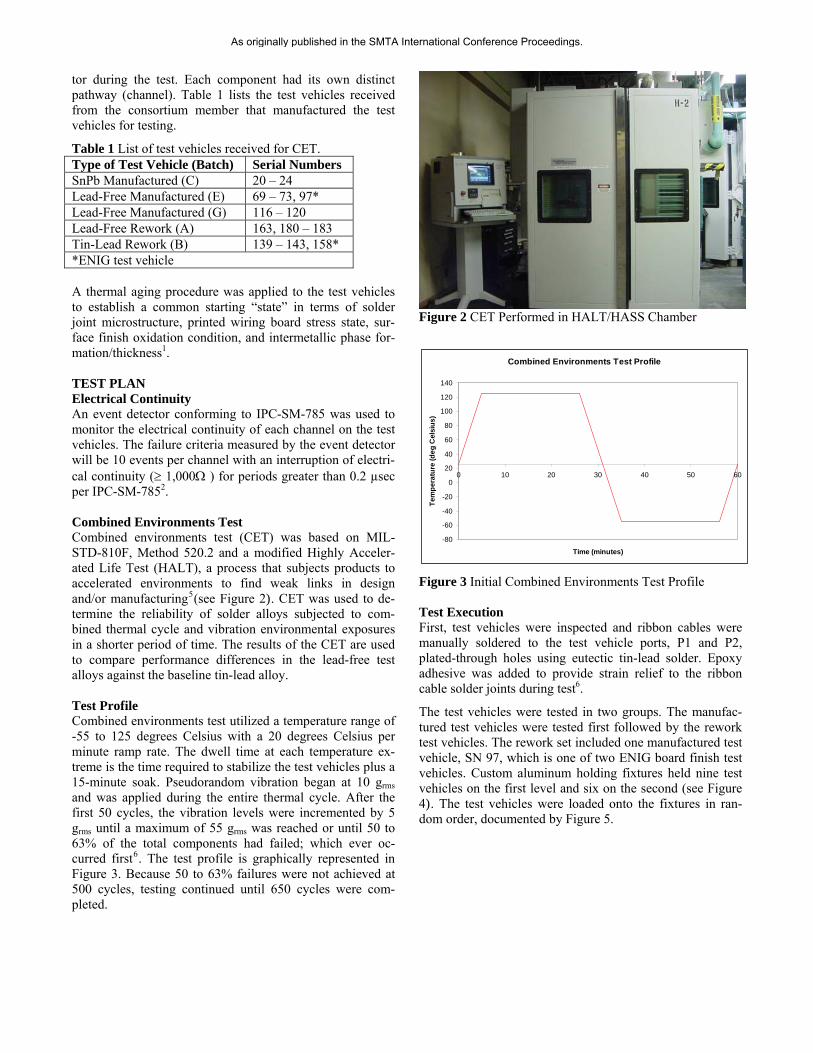
Table 1 List of test vehicles received for CET. Type of Test Vehicle (Batch) Serial Numbers SnPb Manufactured (C) 20 – 24 Lead-Free Manufactured (E) 69 – 73, 97* Lead-Free Manufactured (G) 116 – 120 Lead-Free Rework (A) 163, 180 – 183 Tin-Lead Rework (B) 139 – 143, 158* *ENIG test vehicle A thermal aging procedure was applied to the test vehicles to establish a common starting “state” in terms of solder joint microstructure, printed wiring board stress state, sur-face finish oxidation condition, and intermetallic phase for-mation/thickness1. TEST PLAN Electrical Continuity An event detector conforming to IPC-SM-785 was used to monitor the electrical continuity of each channel on the test vehicles. The failure criteria measured by the event detector will be 10 events per channel with an interruption of electri-cal continuity ( 1,000 ) for periods greater than 0.2 µsec per IPC-SM-7852. Combined Environments Test Combined environments test (CET) was based on MIL-STD-810F, Method 520.2 and a modified Highly Acceler-ated Life Test (HALT), a process that subjects products to accelerated environments to find weak links in design and/or manufacturing5(see Figure 2). CET was used to de-termine the reliability of solder alloys subjected to com-bined thermal cycle and vibration environmental exposures in a shorter period of time. The results of the CET are used to compare performance differences in the lead-free test alloys against the baseline tin-lead alloy. Test Profile Combined environments test utilized a temperature range of -55 to 125 degrees Celsius with a 20 degrees Celsius per minute ramp rate. The dwell time at each temperature ex-treme is the time required to stabilize the test vehicles plus a 15-minute soak. Pseudorandom vibration began at 10 grms and was applied during the entire thermal cycle. After the first 50 cycles, the vibration levels were incremented by 5 grms until a maximum of 55 grms was reached or until 50 to 63% of the total components had failed; which ever oc-curred first6. The test profile is graphically represented in Figure 3. Because 50 to 63% failures were not achieved at 500 cycles, testing continued until 650 cycles were com-pleted.
Figure 2 CET Performed in HALT/HASS Chamber
Combined Environments Test Profile
-80
-60
-40
-20
0
20
40
60
80
100
120
140
0 10 20 30 40 50
Time (minutes)
Te
mp
era
ture
(d
eg
Cel
siu
s)
60
Figure 3 Initial Combined Environments Test Profile Test Execution First, test vehicles were inspected and ribbon cables were manually soldered to the test vehicle ports, P1 and P2, plated-through holes using eutectic tin-lead solder. Epoxy adhesive was added to provide strain relief to the ribbon cable solder joints during test6.
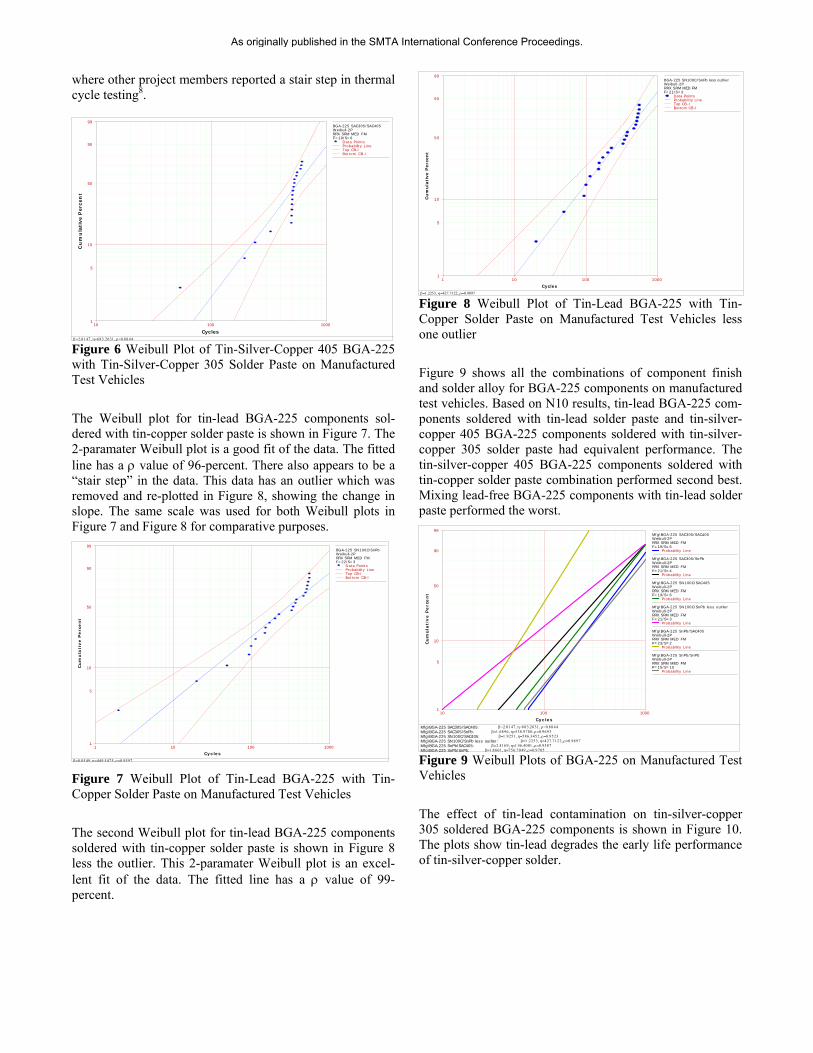
The test vehicles were tested in two groups. The manufac-tured test vehicles were tested first followed by the rework test vehicles. The rework set included one manufactured test vehicle, SN 97, which is one of two ENIG board finish test vehicles. Custom aluminum holding fixtures held nine test vehicles on the first level and six on the second (see Figure 4). The test vehicles were loaded onto the fixtures in ran-dom order, documented by Figure 5.
As originally published in the SMTA International Conference Proceedings.
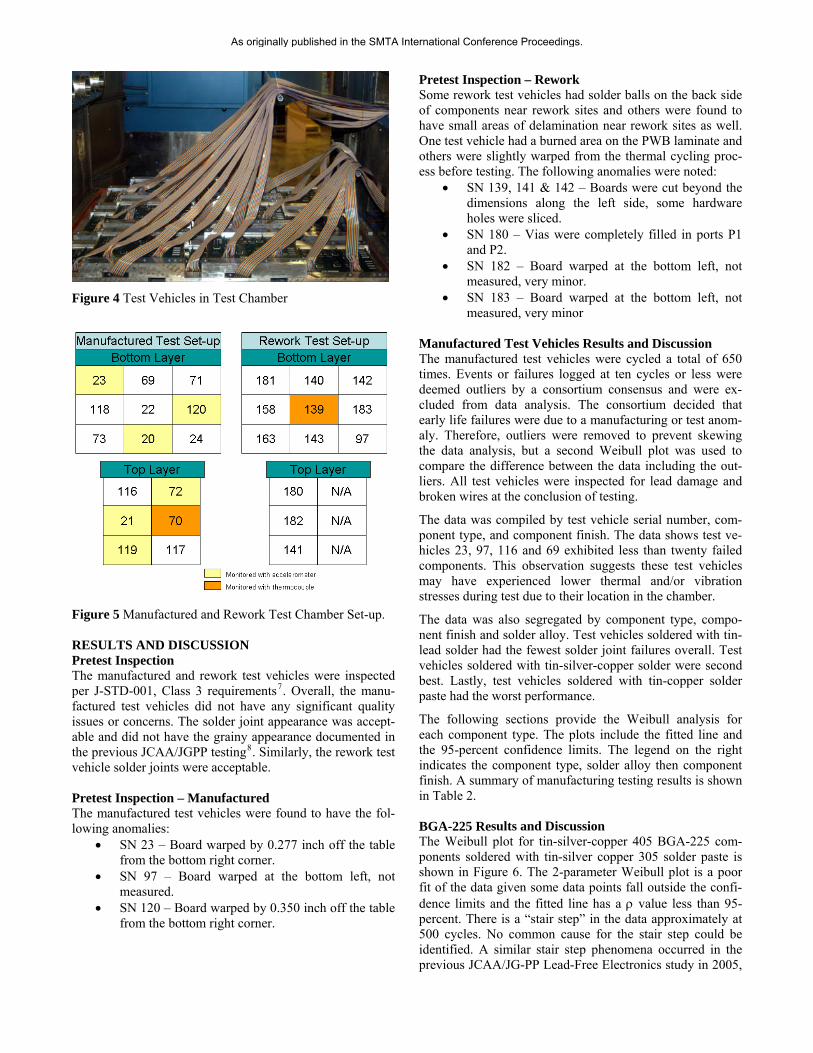
Figure 4 Test Vehicles in Test Chamber
Figure 5 Manufactured and Rework Test Chamber Set-up. RESULTS AND DISCUSSION Pretest Inspection The manufactured and rework test vehicles were inspected per J-STD-001, Class 3 requirements7. Overall, the manu-factured test vehicles did not have any significant quality issues or concerns. The solder joint appearance was accept-able and did not have the grainy appearance documented in the previous JCAA/JGPP testing8. Similarly, the rework test vehicle solder joints were acceptable. Pretest Inspection – Manufactured The manufactured test vehicles were found to have the fol-lowing anomalies:
SN 23 – Board warped by 0.277 inch off the table from the bottom right corner.
SN 97 – Board warped at the bottom left, not measured.
SN 120 – Board warped by 0.350 inch off the table from the bottom right corner.
Pretest Inspection – Rework Some rework test vehicles had solder balls on the back side of components near rework sites and others were found to have small areas of delamination near rework sites as well. One test vehicle had a burned area on the PWB laminate and others were slightly warped from the thermal cycling proc-ess before testing. The following anomalies were noted:
SN 139, 141 & 142 – Boards were cut beyond the dimensions along the left side, some hardware holes were sliced.
SN 180 – Vias were completely filled in ports P1 and P2.
SN 182 – Board warped at the bottom left, not measured, very minor.
SN 183 – Board warped at the bottom left, not measured, very minor
Manufactured Test Vehicles Results and Discussion The manufactured test vehicles were cycled a total of 650 times. Events or failures logged at ten cycles or less were deemed outliers by a consortium consensus and were ex-cluded from data analysis. The consortium decided that early life failures were due to a manufacturing or test anom-aly. Therefore, outliers were removed to prevent skewing the data analysis, but a second Weibull plot was used to compare the difference between the data including the out-liers. All test vehicles were inspected for lead damage and broken wires at the conclusion of testing.
The data was compiled by test vehicle serial number, com-ponent type, and component finish. The data shows test ve-hicles 23, 97, 116 and 69 exhibited less than twenty failed components. This observation suggests these test vehicles may have experienced lower thermal and/or vibration stresses during test due to their location in the chamber.
The data was also segregated by component type, compo-nent finish and solder alloy. Test vehicles soldered with tin-lead solder had the fewest solder joint failures overall. Test vehicles soldered with tin-silver-copper solder were second best. Lastly, test vehicles soldered with tin-copper solder paste had the worst performance.
The following sections provide the Weibull analysis for each component type. The plots include the fitted line and the 95-percent confidence limits. The legend on the right indicates the component type, solder alloy then component finish. A summary of manufacturing testing results is shown in Table 2. BGA-225 Results and Discussion The Weibull plot for tin-silver-copper 405 BGA-225 com-ponents soldered with tin-silver copper 305 solder paste is shown in Figure 6. The 2-parameter Weibull plot is a poor fit of the data given some data points fall outside the confi-dence limits and the fitted line has a value less than 95-percent. There is a “stair step” in the data approximately at 500 cycles. No common cause for the stair step could be identified. A similar stair step phenomena occurred in the previous JCAA/JG-PP Lead-Free Electronics study in 2005,
As originally published in the SMTA International Conference Proceedings.
where other project members reported a stair step in thermal cycle testing8.
Cycles
Cu
mu
lati
ve P
erc
en
t
10 10001001
5
10
50
90
99BGA-225 SAC305/SAC405Weibull-2PRRX SRM MED FMF=19/S=6
Data PointsProbability LineTop CB-IBottom CB-I
Figure 6 Weibull Plot of Tin-Silver-Copper 405 BGA-225 with Tin-Silver-Copper 305 Solder Paste on Manufactured Test Vehicles
The Weibull plot for tin-lead BGA-225 components sol-dered with tin-copper solder paste is shown in Figure 7. The 2-paramater Weibull plot is a good fit of the data. The fitted line has a value of 96-percent. There also appears to be a “stair step” in the data. This data has an outlier which was removed and re-plotted in Figure 8, showing the change in slope. The same scale was used for both Weibull plots in Figure 7 and Figure 8 for comparative purposes.
Cycles
Cu
mu
lati
ve
Pe
rce
nt
1 100010 1001
5
10
50
90
99BGA-225 SN100C/SnPbWeibull-2PRRX SRM MED FMF=22/S=3
Data PointsProbability LineTop CB-IBottom CB-I
Figure 7 Weibull Plot of Tin-Lead BGA-225 with Tin-Copper Solder Paste on Manufactured Test Vehicles
The second Weibull plot for tin-lead BGA-225 components soldered with tin-copper solder paste is shown in Figure 8 less the outlier. This 2-paramater Weibull plot is an excel-lent fit of the data. The fitted line has a value of 99-percent.
Cycles
Cu
mu
lati
ve P
erc
en
t
1 100010 1001
5
10
50
90
99BGA-225 SN100C/SnPb less outlierWeibull-2PRRX SRM MED FMF=21/S=3
Data PointsProbability LineTop CB-IBottom CB-I
Figure 8 Weibull Plot of Tin-Lead BGA-225 with Tin-Copper Solder Paste on Manufactured Test Vehicles less one outlier
Figure 9 shows all the combinations of component finish and solder alloy for BGA-225 components on manufactured test vehicles. Based on N10 results, tin-lead BGA-225 com-ponents soldered with tin-lead solder paste and tin-silver-copper 405 BGA-225 components soldered with tin-silver-copper 305 solder paste had equivalent performance. The tin-silver-copper 405 BGA-225 components soldered with tin-copper solder paste combination performed second best. Mixing lead-free BGA-225 components with tin-lead solder paste performed the worst.
Mfg\BGA-225 SnPb/SnPb: Mfg\BGA-225 SnPb/SAC405: Mfg\BGA-225 SN100C/SnPb less outlier: Mfg\BGA-225 SN100C/SAC405: Mfg\BGA-225 SAC305/SnPb: Mfg\BGA-225 SAC305/SAC405:
Cycles
Cu
mu
lati
ve
Pe
rce
nt
10 10001001
5
10
50
90
99Mfg\BGA-225 SAC305/SAC405Weibull-2PRRX SRM MED FMF=19/S=6
Probability Line
Mfg\BGA-225 SAC305/SnPbWeibull-2PRRX SRM MED FMF=21/S=4
Probability Line
Mfg\BGA-225 SN100C/SAC405Weibull-2PRRX SRM MED FMF=19/S=6
Probability Line
Mfg\BGA-225 SN100C/SnPb less outlierWeibull-2PRRX SRM MED FMF=21/S=3
Probability Line
Mfg\BGA-225 SnPb/SAC405Weibull-2PRRX SRM MED FMF=23/S=2
Probability Line
Mfg\BGA-225 SnPb/SnPbWeibull-2PRRX SRM MED FMF=15/S=10
Probability Line
Figure 9 Weibull Plots of BGA-225 on Manufactured Test Vehicles
The effect of tin-lead contamination on tin-silver-copper 305 soldered BGA-225 components is shown in Figure 10. The plots show tin-lead degrades the early life performance of tin-silver-copper solder.
As originally published in the SMTA International Conference Proceedings.

Mfg\BGA-225 SAC305/SnPb: Mfg\BGA-225 SAC305/SAC405:
Cyc les
Cu
mu
lati
ve
Pe
rce
nt
10 10001001
5
10
50
90
99Mfg\BGA-225 SAC305/SAC405Weibull-2PRRX SRM MED FMF=19/S=6
Probability Line
Mfg\BGA-225 SAC305/SnPbWeibull-2PRRX SRM MED FMF=21/S=4
Probability Line
Figure 10 Effect of Tin-Lead Contamination on Tin-Silver-Copper 305 Soldered BGA-225 on Manufactured Test Ve-hicles CLCC-20 Results and Discussion Figure 11 shows all the combinations of component finish and solder alloy for CLCC-20 components on the manufac-tured test vehicles. Based on N10 results, tin-lead CLCC-20 components soldered with tin-lead solder paste performed the best. Tin-silver-copper 305 CLCC-20 components sol-dered with tin-lead performed second best. Tin-silver-copper 305 CLCC-20 components soldered with tin-copper solder paste performed the worst.
Mfg\CLCC-20 SnPb/SnPb: Mfg\CLCC-20 SnPb/SAC305: Mfg\CLCC-20 SN100C/SnPb: Mfg\CLCC-20 SN100C/SAC305: Mfg\CLCC-20 SAC305/SnPb: Mfg\CLCC-20 SAC305/SAC305:
Cyc les
Cu
mu
lati
ve
Pe
rce
nt
10 10001001
5
10
50
90
99Mfg\CLCC-20 SAC305/SAC305Weibull-2PRRX SRM MED FMF=24/S=1
Probability LineCLCC-20 SAC305
/S=0
Mfg\ /SnPbWeibull-2PRRX SRM MED FMF=25
Probability LineCLCC-20 SN100C
/S=1
Mfg\ /SAC305Weibull-2PRRX SRM MED FMF=24
Probability LineCLCC-20 SN100C
/S=3
Mfg\ /SnPbWeibull-2PRRX SRM MED FMF=22
Probability Line
/S=2
Mfg\CLCC-20 SnPb/SAC305Weibull-2PRRX SRM MED FMF=23
Probability LineCLCC-20 SnPb/S
/S=4
Mfg\ nPbWeibull-2PRRX SRM MED FMF=21
Probability Line
Figure 11 Weibull Plots of CLCC-20 on Manufactured Test Vehicles CSP-100 Results and Discussion Figure 12 shows the combinations of component finish and solder alloy for CSP-100 components on manufactured test vehicles. Based on N10 results, the tin-lead CSP-100 com-ponents soldered with tin-silver-copper 305 solder paste resulted as statistically equivalent and slightly better than tin-lead CSP-100 components soldered with tin-lead solder paste. Tin-silver-copper 105 CSP-100 components soldered with tin-lead solder paste performed the worst.
CSP-100 components exhibited higher than expected cycles to failure due to a PWB layout error. Because of the error, it
took two solder joints from two different hemispheres in the footprint to fail and register as a component failure. CSP-100 components were expected to fail early.
Mfg\CSP-100 SnPb/SnPb: Mfg\CSP-100 SnPb/SAC105: Mfg\CSP-100 SN100C/SnPb: Mfg\CSP-100 SN100C/SAC105: Mfg\CSP-100 SAC305/SnPb: Mfg\CSP-100 SAC305/SAC105:
Cycles
Cu
mu
lati
ve
Pe
rce
nt
10 10001001
5
10
50
90
99Mfg\CSP-100 SAC305/SAC105Weibull-2PRRX SRM MED FMF=8/S=17
Probability Line
Mfg\CSP-100 SAC305/SnPbWeibull-2PRRX SRM MED FMF=5/S=20
Probability Line
Mfg\CSP-100 SN100C/SAC105Weibull-2PRRX SRM MED FMF=11/S=14
Probability Line
Mfg\CSP-100 SN100C/SnPbWeibull-2PRRX SRM MED FMF=12/S=13
Probability Line
Mfg\CSP-100 SnPb/SAC105Weibull-2PRRX SRM MED FMF=17/S=8
Probability Line
Mfg\CSP-100 SnPb/SnPbWeibull-2PRRX SRM MED FMF=4/S=21
Probability Line
Figure 12 Weibull Plots of CSP-110 on Manufactured Test Vehicles PDIP-20 Results and Discussion There is not sufficient data to compare Weibull plots for all other combinations of PDIP-20 components. PDIP-20 re-sults on manufactured test vehicles can be summarized by the chart in Figure 13. Only tin-copper finish PDIP-20 com-ponents recorded failures, 10-percent of the total population. Consortium members performing thermal cycle testing ex-perienced early life failures with PDIP-20 components, but CET did not experience these results. A reason is under in-vestigation.
10
00
2
4
6
8
10
12
SN100C SnPb
Solder Alloy
Per
cen
tag
e (%
)
Figure 13 Percentage of Manufactured PDIP Failures by Wave Solder TQFP-144 Results and Discussion Figure 14 shows all the combinations of component finish and solder alloy for TQFP-144 components on manufac-tured test vehicles. Based on N10 results, matte tin TQFP-144 components soldered with tin-silver-copper 305 solder paste performed the best. Where matte tin TQFP-144 com-ponents soldered with tin-lead performed second best. Matte tin TQFP-144 components soldered with tin-copper solder paste performed the worst.
As originally published in the SMTA International Conference Proceedings.

Mfg\TQFP-144 SnPb/Matte Sn: Mfg\TQFP-144 SN100C/SnPb Dip: Mfg\TQFP-144 SN100C/Matte Sn: Mfg\TQFP-144 SAC305/Matte Sn:
Cycles
Cu
mu
lati
ve
Pe
rce
nt
10 10001001
5
10
50
90
99Mfg\TQFP-144 SAC305/Matte SnWeibull-2PRRX SRM MED FMF=6/S=19
Probability Line
Mfg\TQFP-144 SN100C/Matte SnWeibull-2PRRX SRM MED FMF=13/S=12
Probability Line
Mfg\TQFP-144 SN100C/SnPb DipWeibull-2PRRX SRM MED FMF=15/S=10
Probability Line
Mfg\TQFP-144 SnPb/Matte SnWeibull-2PRRX SRM MED FMF=8/S=17
Probability Line
Figure 14 Weibull Plots of Tin TQFP-144 on Manufactured Test Vehicles TSOP-50 Results and Discussion Figure 15 shows all the combinations of component finish and solder alloy for TSOP-50 components on the manufac-tured test vehicles. Based on N10 results, the tin-bismuth TSOP-50 components soldered with tin-lead solder paste performed the best. Though, the plot shows that tin-lead TSOP-50 components soldered with tin-lead or with tin-silver-copper 305 solder performed equivalently and are more reliable, long term, than the tin-bismuth TSOP-50 components soldered with tin-lead solder paste.
Mfg\TSOP-50 SnPb/SnPb: Mfg\TSOP-50 SnPb/SnBi: Mfg\TSOP-50 SN100C/SnPb: Mfg\TSOP-50 SN100C/SnBi: Mfg\TSOP-50 SAC305/SnPb: Mfg\TSOP-50 SAC305/SnBi:
Cycles
Cu
mu
lati
ve
Pe
rce
nt
10 10001001
5
10
50
90
99Mfg\TSOP-50 SAC305/SnBiWeibull-2PRRX SRM MED FMF=23/S=2
Probability Line
Mfg\TSOP-50 SAC305/SnPbWeibull-2PRRX SRM MED FMF=15/S=10
Probability Line
Mfg\TSOP-50 SN100C/SnBiWeibull-2PRRX SRM MED FMF=23/S=2
Probability Line
Mfg\TSOP-50 SN100C/SnPbWeibull-2PRRX SRM MED FMF=21/S=4
Probability Line
Mfg\TSOP-50 SnPb/SnBiWeibull-2PRRX SRM MED FMF=16/S=9
Probability Line
Mfg\TSOP-50 SnPb/SnPbWeibull-2PRRX SRM MED FMF=16/S=9
Probability Line
Figure 15 Weibull Plots of TSOP-50 on Manufactured Test Vehicles Electroless Nickel Immersion Gold (ENIG) Manufac-tured Test Vehicle Results and Discussion The Weibull plot comparing ENIG and immersion silver board finish for tin-lead BGA-225 components soldered with tin-silver-copper 305 solder paste is shown in Figure 16. The probability that manufactured tin-lead BGA-225 components soldered with tin-silver-copper 305 solder paste onto immersion silver board finish will last longer than tin-lead BGA-225 components soldered onto an ENIG board finish is 70%.
Mfg\ENIG BGA-225 SAC305/SnPb: Mfg\BGA-225 SAC305/SnPb:
Cycles
Cu
mu
lati
ve
Pe
rce
nt
10 10001001
5
10
50
90
99Mfg\BGA-225 SAC305/SnPbWeibull-2PRRX SRM MED FMF=21/S=4
Probability Line
Mfg\ENIG BGA-225 SAC305/SnPbWeibull-2PRRX SRM MED FMF=5/S=0
Probability Line
Figure 16 Comparison of ENIG and Immersion Silver Board Finish for Tin-Lead BGA-225 with Tin-Silver-Copper 305 Solder Paste
As originally published in the SMTA International Conference Proceedings.
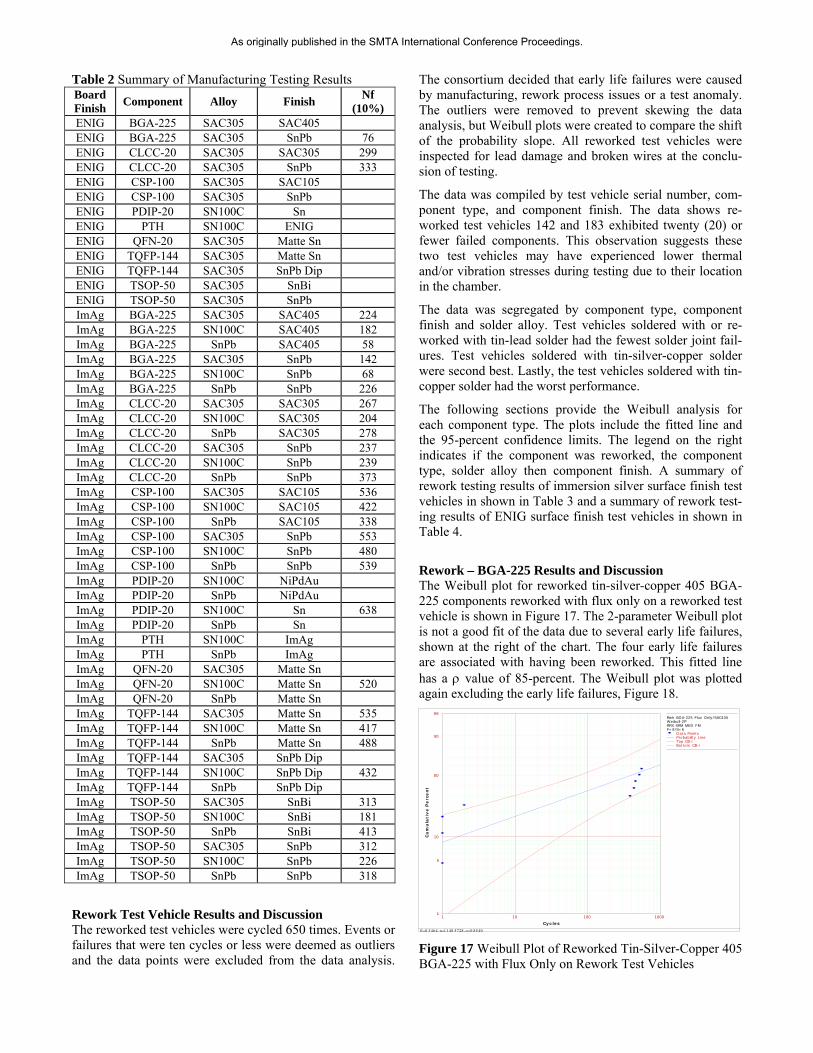
Table 2 Summary of Manufacturing Testing Results Board Finish
Component Alloy Finish Nf
(10%) ENIG BGA-225 SAC305 SAC405 ENIG BGA-225 SAC305 SnPb 76 ENIG CLCC-20 SAC305 SAC305 299 ENIG CLCC-20 SAC305 SnPb 333 ENIG CSP-100 SAC305 SAC105 ENIG CSP-100 SAC305 SnPb ENIG PDIP-20 SN100C Sn ENIG PTH SN100C ENIG ENIG QFN-20 SAC305 Matte Sn ENIG TQFP-144 SAC305 Matte Sn ENIG TQFP-144 SAC305 SnPb Dip ENIG TSOP-50 SAC305 SnBi ENIG TSOP-50 SAC305 SnPb ImAg BGA-225 SAC305 SAC405 224 ImAg BGA-225 SN100C SAC405 182 ImAg BGA-225 SnPb SAC405 58 ImAg BGA-225 SAC305 SnPb 142 ImAg BGA-225 SN100C SnPb 68 ImAg BGA-225 SnPb SnPb 226 ImAg CLCC-20 SAC305 SAC305 267 ImAg CLCC-20 SN100C SAC305 204 ImAg CLCC-20 SnPb SAC305 278 ImAg CLCC-20 SAC305 SnPb 237 ImAg CLCC-20 SN100C SnPb 239 ImAg CLCC-20 SnPb SnPb 373 ImAg CSP-100 SAC305 SAC105 536 ImAg CSP-100 SN100C SAC105 422 ImAg CSP-100 SnPb SAC105 338 ImAg CSP-100 SAC305 SnPb 553 ImAg CSP-100 SN100C SnPb 480 ImAg CSP-100 SnPb SnPb 539 ImAg PDIP-20 SN100C NiPdAu ImAg PDIP-20 SnPb NiPdAu ImAg PDIP-20 SN100C Sn 638 ImAg PDIP-20 SnPb Sn ImAg PTH SN100C ImAg ImAg PTH SnPb ImAg ImAg QFN-20 SAC305 Matte Sn ImAg QFN-20 SN100C Matte Sn 520 ImAg QFN-20 SnPb Matte Sn ImAg TQFP-144 SAC305 Matte Sn 535 ImAg TQFP-144 SN100C Matte Sn 417 ImAg TQFP-144 SnPb Matte Sn 488 ImAg TQFP-144 SAC305 SnPb Dip ImAg TQFP-144 SN100C SnPb Dip 432 ImAg TQFP-144 SnPb SnPb Dip ImAg TSOP-50 SAC305 SnBi 313 ImAg TSOP-50 SN100C SnBi 181 ImAg TSOP-50 SnPb SnBi 413 ImAg TSOP-50 SAC305 SnPb 312 ImAg TSOP-50 SN100C SnPb 226 ImAg TSOP-50 SnPb SnPb 318
Rework Test Vehicle Results and Discussion The reworked test vehicles were cycled 650 times. Events or failures that were ten cycles or less were deemed as outliers and the data points were excluded from the data analysis.
The consortium decided that early life failures were caused by manufacturing, rework process issues or a test anomaly. The outliers were removed to prevent skewing the data analysis, but Weibull plots were created to compare the shift of the probability slope. All reworked test vehicles were inspected for lead damage and broken wires at the conclu-sion of testing.
The data was compiled by test vehicle serial number, com-ponent type, and component finish. The data shows re-worked test vehicles 142 and 183 exhibited twenty (20) or fewer failed components. This observation suggests these two test vehicles may have experienced lower thermal and/or vibration stresses during testing due to their location in the chamber.
The data was segregated by component type, component finish and solder alloy. Test vehicles soldered with or re-worked with tin-lead solder had the fewest solder joint fail-ures. Test vehicles soldered with tin-silver-copper solder were second best. Lastly, the test vehicles soldered with tin-copper solder had the worst performance.
The following sections provide the Weibull analysis for each component type. The plots include the fitted line and the 95-percent confidence limits. The legend on the right indicates if the component was reworked, the component type, solder alloy then component finish. A summary of rework testing results of immersion silver surface finish test vehicles in shown in Table 3 and a summary of rework test-ing results of ENIG surface finish test vehicles in shown in Table 4.
Rework – BGA-225 Results and Discussion The Weibull plot for reworked tin-silver-copper 405 BGA-225 components reworked with flux only on a reworked test vehicle is shown in Figure 17. The 2-parameter Weibull plot is not a good fit of the data due to several early life failures, shown at the right of the chart. The four early life failures are associated with having been reworked. This fitted line has a value of 85-percent. The Weibull plot was plotted again excluding the early life failures, Figure 18.
Cycles
Cu
mu
lati
ve
Pe
rce
nt
1 100010 1001
5
10
50
90
99Rwk BGA-225 Flux Only/SAC405Weibull-2PRRX SRM MED FMF=9/S=6
Data PointsProbability LineTop CB-IBottom CB-I
Figure 17 Weibull Plot of Reworked Tin-Silver-Copper 405 BGA-225 with Flux Only on Rework Test Vehicles
As originally published in the SMTA International Conference Proceedings.

The Weibull plot for reworked tin-silver-copper 405 BGA-225 components reworked with flux only on a rework test vehicle less outliers is shown in Figure 18. This 2-parameter Weibull plot is an excellent fit of the data. The fitted line has improved to a value of 97-percent. Removing the early life failures improved the probability slope dramati-cally.
Cyc les
Cu
mu
lati
ve
Pe
rce
nt
10 10001001
5
10
50
90
99Rwk BGA-225 Flux Only/SAC405 less outli...Weibull-2PRRX SRM MED FMF=5/S=6
Data PointsProbability LineTop CB-IBottom CB-I
Figure 18 Weibull Plot of Reworked Tin-Silver-Copper 405 BGA-225 with Flux Only on Rework Test Vehicles less outliers Figure 19 shows all the combinations of rework component finish and solder alloy for BGA-225 components on the rework test vehicles. Based on N10 results, the tin-silver-copper 405 BGA-225 components reworked with tin-lead solder paste, Batch A, less the outlier was the most reliable. The chart also shows tin-silver-copper 405 BGA-225 com-ponents soldered with tin-lead solder paste performed statis-tically as good as tin-silver-copper 405 BGA-225 compo-nents reworked with tin-lead solder paste.
Rework\Rwk BGA-225 SnPb/SAC405 B: Rework\Rwk BGA-225 SnPb/SAC405 A less outlier: Rework\Rwk BGA-225 Flux Only/SnPb: Rework\Rwk BGA-225 Flux Only/SAC405 less outliers: Rework\BGA-225 SnPb/SAC405: Rework\BGA-225 SAC305/SnPb:
Cycles
Cu
mu
lati
ve
Pe
rce
nt
1 100010 1001
5
10
50
90
99Rework\BGA-225 SAC305/SnPbWeibull-2PRRX SRM MED FMF=13/S=7
Probability Line
Rework\BGA-225 SnPb/SAC405Weibull-2PRRX SRM MED FMF=10/S=10
Probability Line
Rework\Rwk BGA-225 Flux Only/SAC405 l...Weibull-2PRRX SRM MED FMF=5/S=6
Probability Line
Rework\Rwk BGA-225 Flux Only/SnPbWeibull-2PRRX SRM MED FMF=3/S=12
Probability Line
Rework\Rwk BGA-225 SnPb/SAC405 A les ...Weibull-2PRRX SRM MED FMF=4/S=10
Probability Line
Rework\Rwk BGA-225 SnPb/SAC405 BWeibull-2PRRX SRM MED FMF=12/S=3
Probability Line
Figure 19 Weibull Plots of BGA-225 on Rework Test Vehicle Figure 20 Weibull plot compares reworked BGA-225 com-ponents on rework test vehicles. Based on N10 results, re-worked tin-silver-copper 405 BGA-225 components sol-dered with tin-lead solder paste less the outliers perform the best.
Rework\Rwk BGA-225 SnPb/SAC405 B: Rework\Rwk BGA-225 SnPb/SAC405 A less outlier: Rework\Rwk BGA-225 Flux Only/SnPb: Rework\Rwk BGA-225 Flux Only/SAC405 less outliers:
Cycles
Cu
mu
lati
ve
Pe
rce
nt
1 100010 1001
5
10
50
90
99Rework\Rwk BGA-225 Flux Only/SAC405 l...Weibull-2PRRX SRM MED FMF=5/S=6
Probability Line
Rework\Rwk BGA-225 Flux Only/SnPbWeibull-2PRRX SRM MED FMF=3/S=12
Probability Line
Rework\Rwk BGA-225 SnPb/SAC405 A les ...Weibull-2PRRX SRM MED FMF=4/S=10
Probability Line
Rework\Rwk BGA-225 SnPb/SAC405 BWeibull-2PRRX SRM MED FMF=12/S=3
Probability Line
Figure 20 Weibull Plots of Reworked BGA-225 on Rework Test Vehicle Rework – CLCC-20 Results and Discussion Figure 21 Weibull plot compares the result of CLCC-20 components on reworked test vehicles. Based on N10, tin-silver-copper 305 CLCC-20 components soldered with tin-lead solder paste have better solder joint performance than tin-lead CLCC-20 components soldered with tin-silver-copper 305 solder paste.
Rework\CLCC-20 SnPb/SAC305: Rework\CLCC-20 SAC305/SnPb:
Cycles
Cu
mu
lati
ve
Pe
rce
nt
10 10001001
5
10
50
90
99Rework\CLCC-20 SAC305/SnPbWeibull-2PRRX SRM MED FMF=50/S=0
Probability Line
Rework\CLCC-20 SnPb/SAC305Weibull-2PRRX SRM MED FMF=49/S=1
Probability Line
Figure 21 Weibull Plots of CLCC-20 on Rework Test Ve-hicles Rework – CSP-100 Results and Discussion Figure 22 combines all the rework CSP-100 component Weibull results on rework test vehicles. Based on N10 re-sults, reworked tin-silver-copper 105 CSP-100 components reworked with flux only have the best solder joint reliabil-ity. Tin-silver-copper 105 CSP-100 components soldered with tin-silver-copper 305 solder paste performed second best.
As originally published in the SMTA International Conference Proceedings.

Rework\Rwk CSP-100 SnPb/SAC105 A: Rework\Rwk CSP-100 Flux Only/SAC105: Rework\CSP-100 SnPb/SAC105: Rework\CSP-100 SAC305/SAC105:
Cycles
Cu
mu
lati
ve
Pe
rce
nt
10 10001001
5
10
50
90
99Rework\CSP-100 SAC305/SAC105Weibull-2PRRX SRM MED FMF=3/S=2
Probability Line
Rework\CSP-100 SnPb/SAC105Weibull-2PRRX SRM MED FMF=11/S=9
Probability Line
Rework\Rwk CSP-100 Flux Only/SAC105Weibull-2PRRX SRM MED FMF=3/S=12
Probability Line
Rework\Rwk CSP-100 SnPb/SAC105 AWeibull-2PRRX SRM MED FMF=14/S=1
Probability Line
Figure 22 Weibull Plot of CSP-100 on Rework Test Vehi-cles Rework – PDIP-20 Results and Discussion The Weibull plot for reworked tin PDIP-20 components soldered with tin-lead solder on rework test vehicles is shown in Figure 23. The 2-parameter Weibull plot is a fair fit of the data where the fitted line has a value of 89-percent. No other failures occurred to create additional Weibull plots for PDIP-20 components on reworked test vehicles.
Cycles
Cu
mu
lati
ve
Pe
rce
nt
10 10001001
5
10
50
90
99Rwk PDIP-20 SnPb/SnWeibull-2PRRX SRM MED FMF=4/S=6
Data PointsProbability LineTop CB-IBottom CB-I
Figure 23 Weibull Plot of Reworked Tin PDIP-20 with Tin-Lead Solder on Rework Test Vehicles Rework – TSOP-50 Results and Discussion Figure 24 shows all the different Weibull plots generated for the TSOP-50 component on reworked test vehicles. It can be determined that tin-lead TSOP-50 components soldered with tin-lead solder paste on rework test vehicles performed better than any other combination of solder alloy and re-work.
Rework\TSOP-50 SnPb/SnBi: Rework\TSOP-50 SnPb/Sn: Rework\TSOP-50 SAC305/SnPb: Rework\TSOP-50 SAC305/SnBi: Rework\Rwk TSOP-50 SnPb/SnPb: Rework\Rwk TSOP-50 SnPb/Sn B: Rework\Rwk TSOP-50 SnPb/Sn A less outlier: Rework\Rwk TSOP-50 SAC305/SnBi:
Cycles
Cu
mu
lati
ve
Pe
rce
nt
100 10001
5
10
50
90
99Rework\Rwk TSOP-50 SAC305/SnBiWeibull-2PRRX SRM MED FMF=9/S=1
Probability Line
Rework\Rwk TSOP-50 SnPb/Sn A less outl...Weibull-2PRRX SRM MED FMF=5/S=4
Probability Line
Rework\Rwk TSOP-50 SnPb/Sn BWeibull-2PRRX SRM MED FMF=5/S=5
Probability Line
Rework\Rwk TSOP-50 SnPb/SnPbWeibull-2PRRX SRM MED FMF=6/S=4
Probability Line
Rework\TSOP-50 SAC305/SnBiWeibull-2PRRX SRM MED FMF=10/S=5
Probability Line
Rework\TSOP-50 SAC305/SnPbWeibull-2PRRX SRM MED FMF=5/S=10
Probability Line
Rework\TSOP-50 SnPb/SnWeibull-2PRRX SRM MED FMF=3/S=12
Probability Line
Figure 24 Weibull Plots of TSOP-50 on Rework Test Vehi-cles Figure 25 shows the different Weibull plots generated for different combinations of reworked TSOP-50 components. It can be determined that reworked tin TSOP-50 compo-nents reworked with tin-lead solder paste, Batch B, per-formed better than the other combinations.
Rework\Rwk TSOP-50 SnPb/SnPb: Rework\Rwk TSOP-50 SnPb/Sn B: Rework\Rwk TSOP-50 SnPb/Sn A less outlier: Rework\Rwk TSOP-50 SAC305/SnBi:
Cycles
Cu
mu
lati
ve
Pe
rce
nt
100 10001
5
10
50
90
99Rework\Rwk TSOP-50 SAC305/SnBiWeibull-2PRRX SRM MED FMF=9/S=1
Probability Line
Rework\Rwk TSOP-50 SnPb/Sn A less outl...Weibull-2PRRX SRM MED FMF=5/S=4
Probability Line
Rework\Rwk TSOP-50 SnPb/Sn BWeibull-2PRRX SRM MED FMF=5/S=5
Probability Line
Rework\Rwk TSOP-50 SnPb/SnPbWeibull-2PRRX SRM MED FMF=6/S=4
Probability Line
Figure 25 Weibull Plots of Reworked TSOP-50 on Rework Test Vehicles Electroless Nickel Immersion Gold (ENIG) Rework Test Vehicle Results and Discussion The Weibull plots comparing ENIG and immersion silver test vehicle board finishes for tin-silver-copper 405 BGA-225 components soldered with tin-lead solder paste is shown in Figure 26. Overall, the probability that immersion silver board finish performs better than the ENIG board finish is 72-precent.
As originally published in the SMTA International Conference Proceedings.
Rework\ENIG BGA-225 SnPb/SAC405: Rework\BGA-225 SnPb/SAC405:
Cycles
Cu
mu
lati
ve
Pe
rce
nt
10 10001001
5
10
50
90
99Rework\BGA-225 SnPb/SAC405Weibull-2PRRX SRM MED FMF=10/S=10
Probability Line
Rework\ENIG BGA-225 SnPb/SAC405Weibull-2PRRX SRM MED FMF=3/S=1
Probability Line
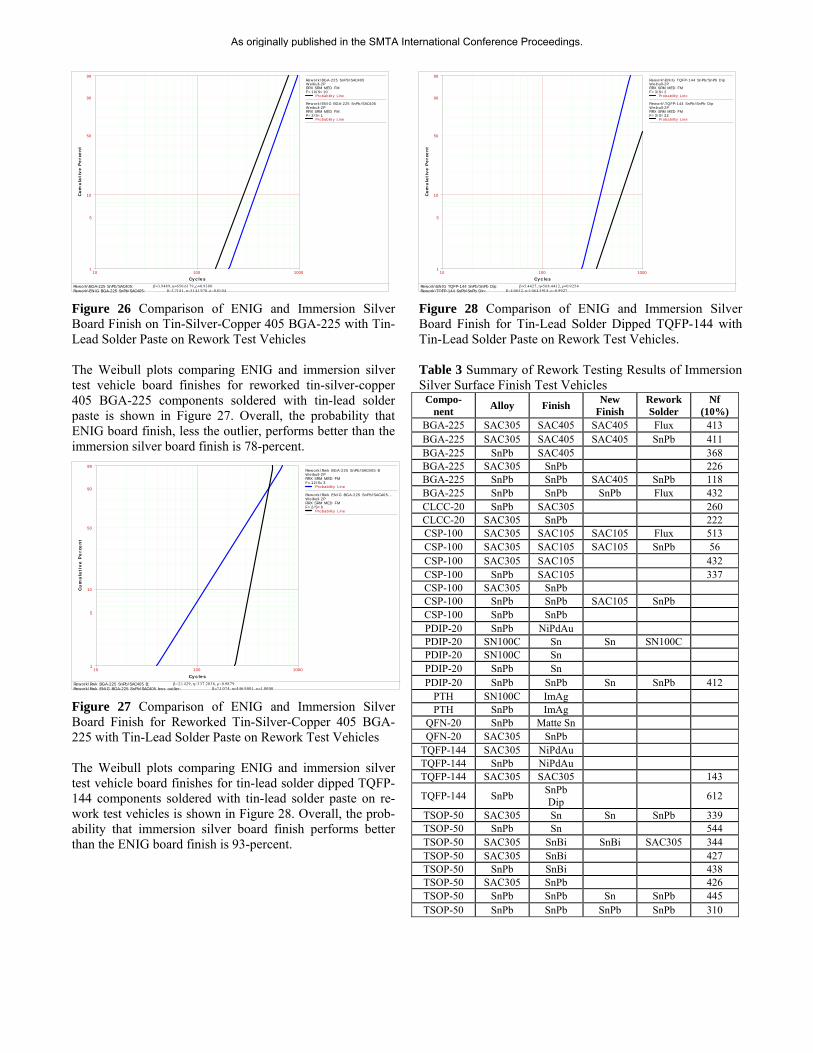
Figure 26 Comparison of ENIG and Immersion Silver Board Finish on Tin-Silver-Copper 405 BGA-225 with Tin-Lead Solder Paste on Rework Test Vehicles The Weibull plots comparing ENIG and immersion silver test vehicle board finishes for reworked tin-silver-copper 405 BGA-225 components soldered with tin-lead solder paste is shown in Figure 27. Overall, the probability that ENIG board finish, less the outlier, performs better than the immersion silver board finish is 78-percent.
Rework\Rwk ENIG BGA-225 SnPb/SAC405 less outlier: Rework\Rwk BGA-225 SnPb/SAC405 B:
Cycles
Cu
mu
lati
ve
Pe
rce
nt
10 10001001
5
10
50
90
99Rework\Rwk BGA-225 SnPb/SAC405 BWeibull-2PRRX SRM MED FMF=12/S=3
Probability Line
Rework\Rwk ENIG BGA-225 SnPb/SAC405...Weibull-2PRRX SRM MED FMF=2/S=0
Probability Line
Figure 27 Comparison of ENIG and Immersion Silver Board Finish for Reworked Tin-Silver-Copper 405 BGA-225 with Tin-Lead Solder Paste on Rework Test Vehicles The Weibull plots comparing ENIG and immersion silver test vehicle board finishes for tin-lead solder dipped TQFP-144 components soldered with tin-lead solder paste on re-work test vehicles is shown in Figure 28. Overall, the prob-ability that immersion silver board finish performs better than the ENIG board finish is 93-percent.
Rework\TQFP-144 SnPb/SnPb Dip: Rework\ENIG TQFP-144 SnPb/SnPb Dip:
Cycles
Cu
mu
lati
ve
Pe
rce
nt
10 10001001
5
10
50
90
99Rework\ENIG TQFP-144 SnPb/SnPb DipWeibull-2PRRX SRM MED FMF=3/S=2
Probability Line
Rework\TQFP-144 SnPb/SnPb DipWeibull-2PRRX SRM MED FMF=3/S=22
Probability Line
Figure 28 Comparison of ENIG and Immersion Silver Board Finish for Tin-Lead Solder Dipped TQFP-144 with Tin-Lead Solder Paste on Rework Test Vehicles. Table 3 Summary of Rework Testing Results of Immersion Silver Surface Finish Test Vehicles
Compo-nent
Alloy Finish New
Finish Rework Solder
Nf (10%)
BGA-225 SAC305 SAC405 SAC405 Flux 413 BGA-225 SAC305 SAC405 SAC405 SnPb 411 BGA-225 SnPb SAC405 368 BGA-225 SAC305 SnPb 226 BGA-225 SnPb SnPb SAC405 SnPb 118 BGA-225 SnPb SnPb SnPb Flux 432 CLCC-20 SnPb SAC305 260 CLCC-20 SAC305 SnPb 222 CSP-100 SAC305 SAC105 SAC105 Flux 513 CSP-100 SAC305 SAC105 SAC105 SnPb 56 CSP-100 SAC305 SAC105 432 CSP-100 SnPb SAC105 337 CSP-100 SAC305 SnPb CSP-100 SnPb SnPb SAC105 SnPb CSP-100 SnPb SnPb PDIP-20 SnPb NiPdAu PDIP-20 SN100C Sn Sn SN100C PDIP-20 SN100C Sn PDIP-20 SnPb Sn PDIP-20 SnPb SnPb Sn SnPb 412
PTH SN100C ImAg PTH SnPb ImAg
QFN-20 SnPb Matte Sn QFN-20 SAC305 SnPb
TQFP-144 SAC305 NiPdAu TQFP-144 SnPb NiPdAu TQFP-144 SAC305 SAC305 143
TQFP-144 SnPb SnPb Dip
612
TSOP-50 SAC305 Sn Sn SnPb 339 TSOP-50 SnPb Sn 544 TSOP-50 SAC305 SnBi SnBi SAC305 344 TSOP-50 SAC305 SnBi 427 TSOP-50 SnPb SnBi 438 TSOP-50 SAC305 SnPb 426 TSOP-50 SnPb SnPb Sn SnPb 445 TSOP-50 SnPb SnPb SnPb SnPb 310
As originally published in the SMTA International Conference Proceedings.
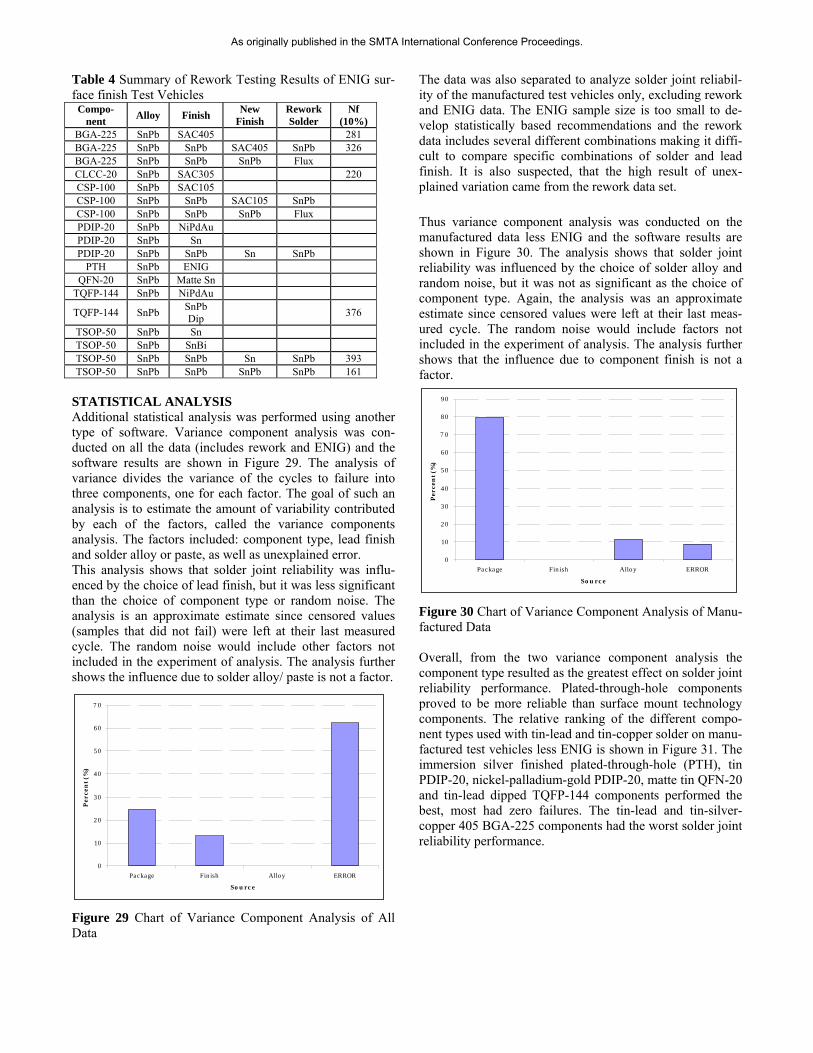
Table 4 Summary of Rework Testing Results of ENIG sur-face finish Test Vehicles
Compo-nent
Alloy Finish New
Finish Rework Solder
Nf (10%)
BGA-225 SnPb SAC405 281 BGA-225 SnPb SnPb SAC405 SnPb 326 BGA-225 SnPb SnPb SnPb Flux CLCC-20 SnPb SAC305 220 CSP-100 SnPb SAC105 CSP-100 SnPb SnPb SAC105 SnPb CSP-100 SnPb SnPb SnPb Flux PDIP-20 SnPb NiPdAu PDIP-20 SnPb Sn PDIP-20 SnPb SnPb Sn SnPb
PTH SnPb ENIG QFN-20 SnPb Matte Sn
TQFP-144 SnPb NiPdAu
TQFP-144 SnPb SnPb Dip
376
TSOP-50 SnPb Sn TSOP-50 SnPb SnBi TSOP-50 SnPb SnPb Sn SnPb 393 TSOP-50 SnPb SnPb SnPb SnPb 161
STATISTICAL ANALYSIS Additional statistical analysis was performed using another type of software. Variance component analysis was con-ducted on all the data (includes rework and ENIG) and the software results are shown in Figure 29. The analysis of variance divides the variance of the cycles to failure into three components, one for each factor. The goal of such an analysis is to estimate the amount of variability contributed by each of the factors, called the variance components analysis. The factors included: component type, lead finish and solder alloy or paste, as well as unexplained error. This analysis shows that solder joint reliability was influ-enced by the choice of lead finish, but it was less significant than the choice of component type or random noise. The analysis is an approximate estimate since censored values (samples that did not fail) were left at their last measured cycle. The random noise would include other factors not included in the experiment of analysis. The analysis further shows the influence due to solder alloy/ paste is not a factor.
0
10
20
30
40
50
60
7 0
Package Finish Alloy ERROR
Source
Per
cen
t (%
)
Figure 29 Chart of Variance Component Analysis of All Data
The data was also separated to analyze solder joint reliabil-ity of the manufactured test vehicles only, excluding rework and ENIG data. The ENIG sample size is too small to de-velop statistically based recommendations and the rework data includes several different combinations making it diffi-cult to compare specific combinations of solder and lead finish. It is also suspected, that the high result of unex-plained variation came from the rework data set.
Thus variance component analysis was conducted on the manufactured data less ENIG and the software results are shown in Figure 30. The analysis shows that solder joint reliability was influenced by the choice of solder alloy and random noise, but it was not as significant as the choice of component type. Again, the analysis was an approximate estimate since censored values were left at their last meas-ured cycle. The random noise would include factors not included in the experiment of analysis. The analysis further shows that the influence due to component finish is not a factor.
0
10
20
30
40
50
60
7 0
80
90
Package Finish Alloy ERROR
Source
Per
cen
t (%
)
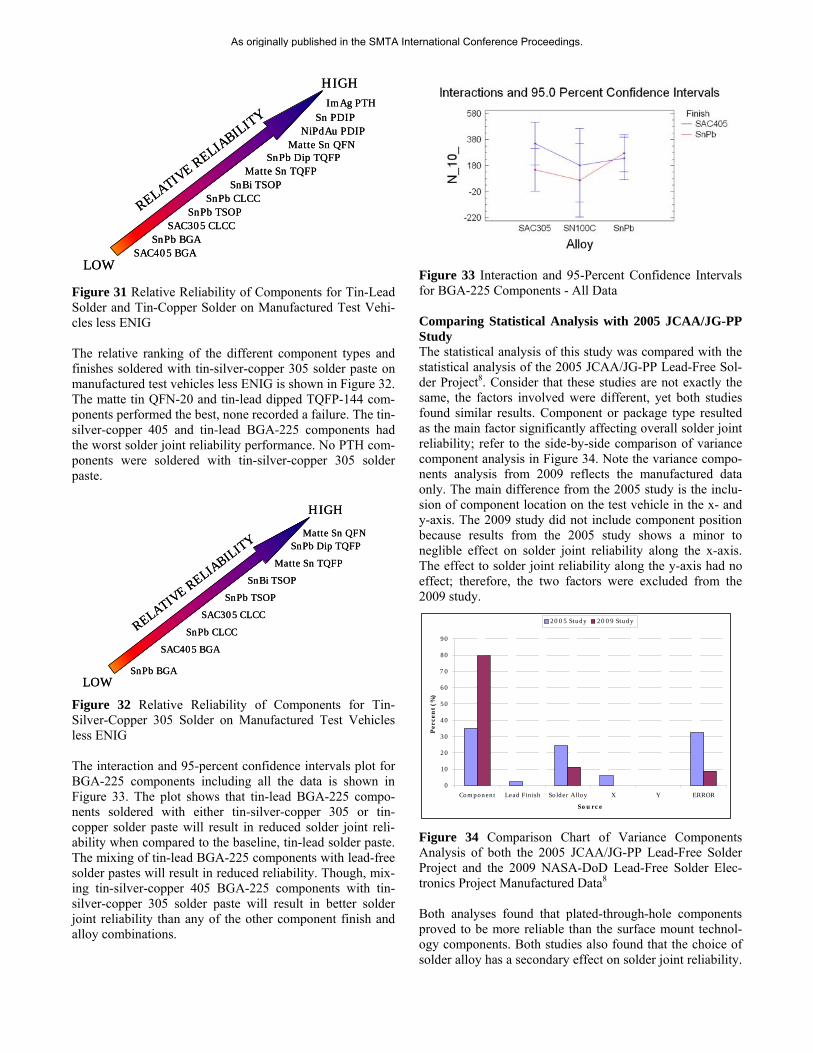
Figure 30 Chart of Variance Component Analysis of Manu-factured Data Overall, from the two variance component analysis the component type resulted as the greatest effect on solder joint reliability performance. Plated-through-hole components proved to be more reliable than surface mount technology components. The relative ranking of the different compo-nent types used with tin-lead and tin-copper solder on manu-factured test vehicles less ENIG is shown in Figure 31. The immersion silver finished plated-through-hole (PTH), tin PDIP-20, nickel-palladium-gold PDIP-20, matte tin QFN-20 and tin-lead dipped TQFP-144 components performed the best, most had zero failures. The tin-lead and tin-silver-copper 405 BGA-225 components had the worst solder joint reliability performance.
As originally published in the SMTA International Conference Proceedings.
RELATIVE R
ELIABIL
ITY
LOW
HIGHImAg PTH
Sn PDIP
Matte Sn QFNSnPb Dip TQFP
SnBi TSOPSnPb CLCC
SnPb BGA
NiPdAu PDIP
Matte Sn TQFP
SnPb TSOPSAC305 CLCC
SAC405 BGA
RELATIVE R
ELIABIL
ITY
LOW
HIGHImAg PTH
Sn PDIP
Matte Sn QFNSnPb Dip TQFP
SnBi TSOPSnPb CLCC
SnPb BGA
NiPdAu PDIP
Matte Sn TQFP
SnPb TSOPSAC305 CLCC
SAC405 BGA
Figure 31 Relative Reliability of Components for Tin-Lead Solder and Tin-Copper Solder on Manufactured Test Vehi-cles less ENIG The relative ranking of the different component types and finishes soldered with tin-silver-copper 305 solder paste on manufactured test vehicles less ENIG is shown in Figure 32. The matte tin QFN-20 and tin-lead dipped TQFP-144 com-ponents performed the best, none recorded a failure. The tin-silver-copper 405 and tin-lead BGA-225 components had the worst solder joint reliability performance. No PTH com-ponents were soldered with tin-silver-copper 305 solder paste.
RELATIVE R
ELIABIL
ITY
LOW
HIGH
Matte Sn QFNSnPb Dip TQFP
SnBi TSOP
SnPb CLCC
SnPb BGA
Matte Sn TQFP
SnPb TSOP
SAC305 CLCC
SAC405 BGA
RELATIVE R
ELIABIL
ITY
LOW
HIGH
Matte Sn QFNSnPb Dip TQFP
SnBi TSOP
SnPb CLCC
SnPb BGA
Matte Sn TQFP
SnPb TSOP
SAC305 CLCC
SAC405 BGA
Figure 32 Relative Reliability of Components for Tin-Silver-Copper 305 Solder on Manufactured Test Vehicles less ENIG The interaction and 95-percent confidence intervals plot for BGA-225 components including all the data is shown in Figure 33. The plot shows that tin-lead BGA-225 compo-nents soldered with either tin-silver-copper 305 or tin-copper solder paste will result in reduced solder joint reli-ability when compared to the baseline, tin-lead solder paste. The mixing of tin-lead BGA-225 components with lead-free solder pastes will result in reduced reliability. Though, mix-ing tin-silver-copper 405 BGA-225 components with tin-silver-copper 305 solder paste will result in better solder joint reliability than any of the other component finish and alloy combinations.
Figure 33 Interaction and 95-Percent Confidence Intervals for BGA-225 Components - All Data Comparing Statistical Analysis with 2005 JCAA/JG-PP Study The statistical analysis of this study was compared with the statistical analysis of the 2005 JCAA/JG-PP Lead-Free Sol-der Project8. Consider that these studies are not exactly the same, the factors involved were different, yet both studies found similar results. Component or package type resulted as the main factor significantly affecting overall solder joint reliability; refer to the side-by-side comparison of variance component analysis in Figure 34. Note the variance compo-nents analysis from 2009 reflects the manufactured data only. The main difference from the 2005 study is the inclu-sion of component location on the test vehicle in the x- and y-axis. The 2009 study did not include component position because results from the 2005 study shows a minor to neglible effect on solder joint reliability along the x-axis. The effect to solder joint reliability along the y-axis had no effect; therefore, the two factors were excluded from the 2009 study.
0
10
20
30
40
50
60
7 0
80
90
Component Lead Finish Solder Alloy X Y ERROR
Source
Per
cen
t (%
)
2005 Study 2009 Study
Figure 34 Comparison Chart of Variance Components Analysis of both the 2005 JCAA/JG-PP Lead-Free Solder Project and the 2009 NASA-DoD Lead-Free Solder Elec-tronics Project Manufactured Data8 Both analyses found that plated-through-hole components proved to be more reliable than the surface mount technol-ogy components. Both studies also found that the choice of solder alloy has a secondary effect on solder joint reliability.
As originally published in the SMTA International Conference Proceedings.
In general, tin-silver-copper soldered components were less reliable than the tin-lead soldered controls. In general, re-worked components were less reliable than the manufac-tured (unreworked) components. CONCLUSIONS Overall, component type has the greatest effect on solder joint reliability performance. The plated-through-hole com-ponents proved to be more reliable than the surface mount technology components. The plated-through-holes, PDIP-20, TQFP-144 and QFN-20 components performed the best. The BGA-225 components performed the worst.
Solder alloy had a secondary effect on solder joint reliabil-ity. In general, tin-lead finished components soldered with tin-lead solder paste were the most reliable. In general, tin-silver-copper soldered components were less reliable than tin-lead soldered controls. Though, the lower reliability of the tin-silver-copper 305 solder joints does not necessarily rule out the use of tin-silver copper solder alloy on military electronics. In several cases, tin-silver-copper 305 solder performed statistically as good as or equal to the baseline, tin-lead solder.
The effect of tin-lead contamination on BGA-225 compo-nents degrades early life performance of tin-copper solder paste, but it can also degrade early life performance of tin-silver-copper 305 solder paste. The effect of tin-lead con-tamination on BGA-225 components soldered with tin-silver-copper 305 solder paste was less than the effect on tin-lead contamination on tin-copper solder.
CSP-100 components are the exception, where tin-lead CSP-100 components soldered with tin-silver-copper 305 solder paste performed better than or equal to tin-lead CSP-100 components soldered with tin-lead solder paste. The chip scale package components were not drafted correctly during the design stage, therefore CSP-100 component re-sults can only be used to compare within the chip scale package type.
The probability plots of soldering tin-lead and tin-silver-copper 305 solder components onto electroless nickel im-mersion gold (ENIG) finished test vehicles were compared using BGA-225 and CLCC-20 components. In general, tin-lead components soldered with tin-silver-copper 305 solder paste onto immersion gold surface finish performs better than tin-silver-copper 305 components soldered onto ENIG surface finish test vehicles. One exception is the perform-ance of tin-lead CLCC-20 components soldered with tin-silver-copper 305 solder paste onto an ENIG surface fin-ished test vehicle which performed better than the immer-sion gold test vehicle. Keep in mind, the ENIG sample size consisted of two.
In general, reworked components are less reliable than un-reworked components. This is especially true with reworked lead-free CSP-100, reworked lead-free BGA-225 and unre-worked lead-free TQFP-144 components; these components did not survive beyond 200 cycles. About 40-percent of the outliers were early life failures from lead-free BAG-225
components reworked with flux only. Another 30-percent of early life failures came from lead-free TQFP-144 compo-nents that were not reworked but were adjacent to rework sites. The exceptions were the immersion gold plated-through-hole components, nickel-palladium-gold TQFP-144, matte tin and tin-lead QFN-20, and tin PDIP-20 com-ponents, where a majority of these components were sol-dered with tin-lead solder and did not fail. Approximately, 37-percent of rework test vehicle components soldered with tin-lead solder paste failed, whereas, 53-percent of rework test vehicle components soldered with tin-silver-copper 305 solder paste failed. This suggests that reworking surface mount technology components with lead-free solder contin-ues to pose processing challenges.
When comparing the performance of components on manu-factured and rework test vehicles, the immersion silver sur-face finish of the manufactured test vehicles appears to en-hance the reliability of the solder joints.
ACKNOWLEDGEMENTS The author wants to thank Bill Beair, Bill Vuono and Gary Eiland with McKinney Circuit Card Assembly for providing the event detectors and Mark Taylor, Larry Taylor and Bob Sparks with the Raytheon Environmental Test Laboratory for executing the test.
We also want to thank consortia members Jelena Bradic, Linda Woody and Keith Howell for volunteering in provid-ing the failure analysis studies of the selected components from our CET test vehicles.
Special thanks to Kurt Kessel from the NASA Technology Evaluation for Environmental Risk Mitigation (TEERM) Principle Center for managing the NASA-DoD Lead-Free Electronics Project.
REFERENCES 1 Kessel, Kurt R., et al. NASA-DoD Lead-Free Electronics Project Plan. 2009. 2 IPC-SM-785: Guidelines for Accelerated Reliability Test-ing of Surface Mount Solder Attachments. January 2009. 3 IPC-9701: Performance Test Methods and Qualification Requirements for Surface Mount Solder Attachments. Feb-ruary 2009. 4 IPC-6012A: Qualification and Performance Specification for Rigid Printed Boards. October 2009. 5 MIL-STD-810F, Method 520.2: Temperature, Humidity, Vibration, and Altitude. 6 Raytheon Systems Company, Test Procedure, Combined Environments Test. 2009. 7 IPC/EIA J-STD-001: Requirements for Soldered Electrical and Electronic Assemblies. January 2009. 8 Jeff Bradford, Felty, Russell, JCAA/JG-PP Lead-Free Sol-der Project: Combined Environments Test. Raytheon Com-pany, August 2005.
As originally published in the SMTA International Conference Proceedings.