naosite: nagasaki university's academic output site · to demonstrate the efficacy of fbts for...
TRANSCRIPT

This document is downloaded at: 2017-12-21T10:47:19Z
Title Two-Dimensional Time-Domain Inverse Scattering for QuantitativeAnalysis of Breast Composition
Author(s) Johnson, Jessi E.; Takenaka, Takashi; Tanaka, Toshiyuki
Citation IEEE Transactions on Biomedical Engineering, 55(8), pp.1941-1945; 2008
Issue Date 2008-08
URL http://hdl.handle.net/10069/19223
Right
(c)2008 IEEE. Personal use of this material is permitted. However,permission to reprint/republish this material for advertising or promotionalpurposes or for creating new collective works for resale or redistribution toservers or lists, or to reuse any copyrighted component of this work in otherworks must be obtained from the IEEE.
NAOSITE: Nagasaki University's Academic Output SITE
http://naosite.lb.nagasaki-u.ac.jp
IEEE TRANSACTIONS ON BIOMEDICAL ENGINEERING, VOL. 55, NO.8, AUGUST 2008 1941
Two-Dimensional Time-Domain Inverse Scatteringfor Quantitative Analysis of Breast Composition
Jessi E. Johnson*, Member, IEEE, Takashi Takenaka, Member, IEEE, and Toshiyuki Tanaka, Member, IEEE
II. METHODS
T M N
Q(p) = 1J;[;IVm(p;rn,t)-vm(rn,tWdt (I)
technique [8]-[11], broadband microwave signals are utilizedto solve the inverse scattering problem in the time-domain. Byutilizing a tomographic approach, the FBTS technique has thepotential to generate images that provide useful quantitativeinformation about the internal structure of the breast, such asthe shape and composition of fibroglandular tissue regions.Additionally, the use of a broadband signal provides a largeamount of scattering information about the breast and shouldallow for stable reconstructions of relatively high-resolution images. Previous investigations of the FBTS technique presentedby the authors [8]-[11], as well as similar studies by Fhageret al. [12] have demonstrated the efficacy of time-domain inversescattering for reconstructing simple objects such as cylindersand spheres in a breast-like configuration. An investigation byWinters et al. [13] demonstrated that a similar time-domainapproach could be utilized to predict average electrical propertyparameters of the skin and normal tissue regions of a realistic,MRI-derived breast model in 2-D (as a preprocessing techniquefor radar-based imaging). In this paper, the 2-D FBTS techniquedescribed in [9] is extended to a similarly realistic breast modelto demonstrate the efficacy of FBTS for tumor detection andquantitative analysis of the breast's internal composition.
A. FBTS Imaging
In the FBTS technique, errors between measured and simulated microwave scattering measurements are compared in thetime-domain and minimized utilizing conjugate gradient optimization. For nonmagnetic inverse scattering problems, the errorfunctional for an assumed set of electrical property parameterspis
where V m (p; rn, t) describes the calculated time-domain electric field at receiving position n due to a pulse radiated by atransmitter m, and vm (rn , t) describes the corresponding measured field. Errors between simulation and measurement aresummed for multiple transmitter/receiver combinations and areintegrated over a time period from t = 0 to t = T. It can beshown that the gradient of this error functional with respect top can be calculated utilizing a forward finite-difference timedomain (FDTD) computation followed by a corresponding adjoint FDTD computation in which residual received signals[vm (p; r n , t) - vm (rn , t)] are reversed in time and utilized assources. Note that, although not utilized in this study, a regular-ization term can be added to (1) to improve the stability of the
0018-9294/$25.00 © 2008 IEEE
Abstract-Forward-backward time-stepping is a unique approach for solving electromagnetic inverse scattering problems inthe time domain. In this paper, the technique is applied to a realistic, heterogeneous breast model. The ability to detect a 5-mmdiameter malignancy and provide substantial quantitative information about the breast's composition is demonstrated.
Index Terms-Cancer, electromagnetic scattering inverse problems, medical diagnosis, microwave imaging.
I. INTRODUCTION
SHORTCOMINGS in conventional X-ray mammographyfor breast cancer screening, such as lack of sensitivity
(missing up to 15% of tumors) and an unreasonably largeamount of false positive readings [1] have led to the search forviable complementary and/or alternative approaches for breastimaging. Although positive clinical results have been shownfor imaging modalities such as magnetic resonance imaging(MRI) and ultrasound [1], microwave-based methods have beengaining increasing attention as an advantageous approach tobreast cancer detection and analysis [2]. The large contrast inthe microwave properties of normal and malignant breast tissue [3], the relatively low-cost of microwave equipment, theuse of safe, low-level microwave signals [4], and successful preliminary clinical studies [5] are all reasons suggestingthat microwave-based imaging has the potential to make thedifficult transition from the laboratory to successful clinicaluse.
Although a variety of microwave approaches exist forbreast cancer detection, arguably the most successful to datehave been tomographic, frequency-domain inverse scatteringapproaches [5] and ultrawideband, radar-based techniques [6],[7]. While the former approach can boast the ability to generatequantitative images in which the internal permittivity (lOr) andconductivity (a) composition of the breast is reconstructed,the latter has demonstrated the ability to create relativelyhigh-resolution images to detect tumors as small as 2 mm in diameter [3]. In this paper, a technique for breast cancer detectionand analysis that combines advantages of these two approachesis presented. In the forward-backward time-stepping (FBTS)
Manuscript received February 14,2007; revised AprilS, 2007. Asterisk indicates corresponding author. This work was supported by the Japan Society forthe Promotion of Science (1SPS) through a Postdoctoral Fellowship for ForeignResearchers.. *J. E. Johnson is with the Department of Electrical and Electronic Engineering, Nagasaki University, Nagasaki 852-8521 Japan (e-mail: [email protected].
T. Takenaka and T. Tanaka are with the Department of Electrical and Electronic Engineering, Nagasaki University, Nagasaki 852-8521 Japan (e-mail:[email protected]; [email protected]).
Digital Object Identifier 10.1109/TBME.2007.899364
1942 [EEE TRANSACTIONS ON BIOMEDICAL ENGINEERING, VOL. 55, NO.8, AUGUST 2008
49.5 1.4
16045.0
1.2
40.5140
1.036.0 120
31.5 elOO0.8
27.0,5>.
800.6
22.5
60 0.418.0
13.5 40 0.2
9.0 0.060 80 100 120 140 60 80 100 120 140
x (mm) x (mm)
(a) (b) (c)
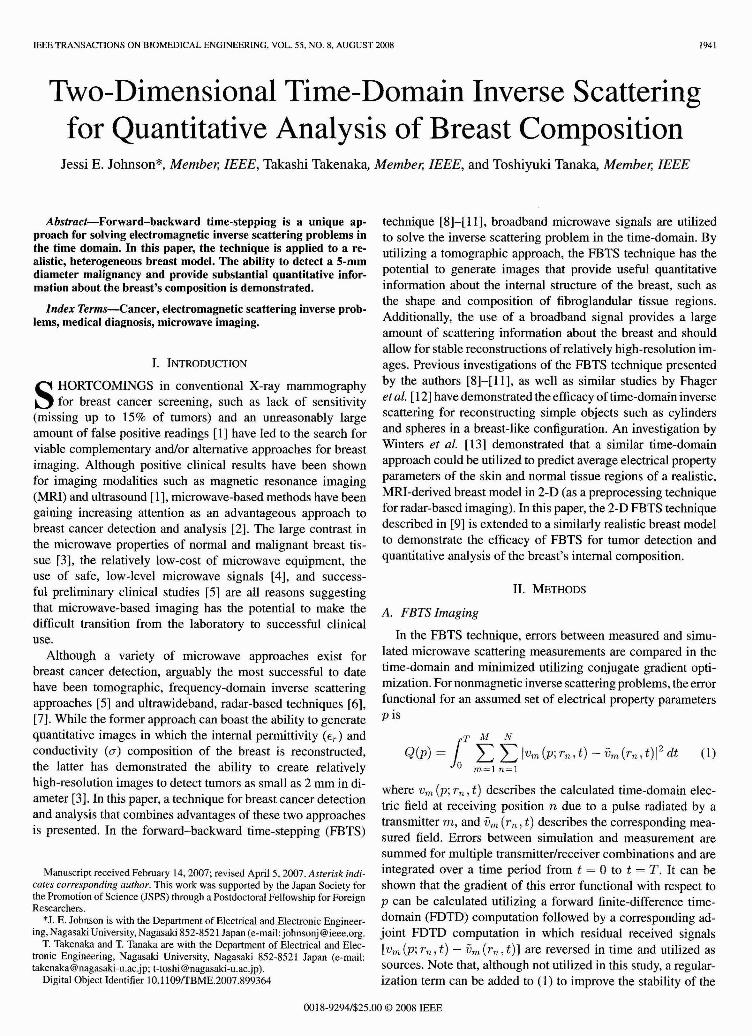
Fig. 1. MRI-derived breast model utilized in this research: (a) original MR image. (b) permittivity model with 2-mm-thick skin layer and 5-mm-diameter tumorin fibroglandular region. (c) corresponding conductivity model.
algorithm, particularly when. dealing with noisy measurementdata [9]. For more details on the FBTS method, please referto [8]-[10].
B. Breast Modeling
A 0.39 mm x 0.39-mm-resolution MR image ofthe left breastof a volunteer in the prone position was taken at Nagasaki University Hospital, as shown in Fig. lea). The histogram of the MRimage pixel intensities was utilized to segment the image intodistinct fibroglandular and fat tissue regions, with a transitionregion between the two. First-order Debye model parameterswere then mapped to each pixel value using the piecewise-linearmapping procedure described in [14] . Using this method, darkerintensity pixels were mapped to ±1O% of the nominal Debyeparameters for fibroglandular tissue and lighter pixels mappedto ±10% of the nominal parameters for fat tissue. A simplelinear map was then utilized to span between these two regions.The model was resized to a resolution of 1 mm x 1 mm, anda 2-mm-thick skin layer was added. A 5-mm-diameter tumorwas then added to the model, inside the fibroglandular region.Finally, since the following analysis was conducted assumingdispersionless media, all of the Debye parameters for the modelwere evaluated at a frequency Ie = 2 GHz. This procedure resulted in the realistic heterogeneous model of the permittivityand conductivity of the breast, as shown in Fig. l(b) and (c).The values of the nominal Debye parameters for the varioustissue types were taken from [14] and the resulting permittivityand conductivity values at 2 GHz are as follows: fibroglandular10,. = 21.45 (Y = 0.46; fat 10,. = 9.98 (Y = 0.18; skin 10,. = 36.73(Y = 1.43; tumor 10,. = 53.62 (Y = 1.19.
C. Reconstructions
Two-dimensional FDTD (TM z mode) simulation was utilized to characterize the microwave scattering of the breastmodel at 16 points encircling the breast. Each of the 16 pointswere used sequentially as a transmitter (represented by a simpleline source in the FDTD simulation), with the electric field being
sampled at the remaining 15 points. This set of scattering calculations (representing 240 transmitter/receiver combinations)formed a set of numerical "measured" data that was utilizedfor the vm (rn, t) term of (l). The grid size for the FDTD simulation was 1 mm x 1 mm, and the excitation signal was asinusoidally modulated Gaussian pulse with a center frequencyIe = 2 GHz and a 1.3 GHz bandwidth. This frequency rangewas determined in previous studies [9] to be optimum for simple reconstructions of a breast-like configuration. Although itis possible to use higher frequency signals (fe = 4 GHz orlarger) for obtaining higher resolution images of smaller tumors [12], this leads to a less stable inverse problem that requiresmulti-frequency techniques, as discussed in [9] and [10]. For thispreliminary investigation, it was assumed that the breast was immersed in a lossless ((Y = 0.0) coupling liquid with a permittivitythat roughly matches breast fat (10,. = 9.0); however, a varietyof coupling liquids have been shown to give similar results inother studies [15].
After forming the set of numerical measured data, the FBTStechnique was utilized to reconstruct the breast model. Reconstructions were conducted utilizing a 1 mm x 1 mm FDTDgrid and the optimization was carried out for 250 iterations.The efficacy of the FBTS algorithm was assessed by conductingseveral reconstructions and assuming different, increasingly accurate a priori estimates for the properties of the breast. Theseestimates are described as follows:
Estimate A: The reconstruction region has a shape that estimates the surface ofthe breast as an ellipse, as shown in Fig. l(c).The initial 10,. and (Y values in this entire region are set equal tothe coupling liquid (10,. = 9.0 and (Y = 0.0).
Estimate B: The reconstruction region matches the shape ofthe breast exactly. The initial 10,. and (Y values are set equal tothe coupling liquid in the entire region.
Estimate C: The reconstruction region matches the shape ofthe breast. In this case (only) it is also assumed that the locationof the skin region has been predicted and assigned initial 10,. and (Y
values equal to +10% of the actual values. 10,. and (Y in the remaining "normal" breast region are set equal to the coupling liquid.

JOHNSON et al.: TWO-DIMENSIONAL TIME-DOMAIN INVERSE SCATTERING FOR QUANTITATIVE ANALYSIS OF BREAST COMPOSITION 1943
49.5
45.0
40.5
36.0
31.5
27.0
22.5
18.0
13.5
9.060 80 100 120 140
x (mm)
(c)
1.4
1.2
1.0
0.8
0.6
0.4
0.2
0.060 80 100 120 140
x (mrn)
(f)
40
60
40
120
60
160
140
160
140
120
elOO5'" 80
eloo5'" 80
49.5
45.0
40.5
36.0
31.5
27.0
22.5
18.0
13.5
9.060 80 100 120 140
x (mm)
(b)
1.4
1.2
1.0
0.8
0.6
0.4
02
0.060 80 100 120 140
x (mm)
(e)
49.5
45.0
40.5
36.0
31.5
27.0
22.5
18.0
13.5
9.060 80 100 120 140
x (mrn)
(a)
1.4
1.2
1.0
0.8
0.6
0.4
0.2
0.060 80 100 120 140
x (mrn)
(d)
40
80
60
60
80
40
160
120
140
160
120
140
eloo5'"
e lOO5'"
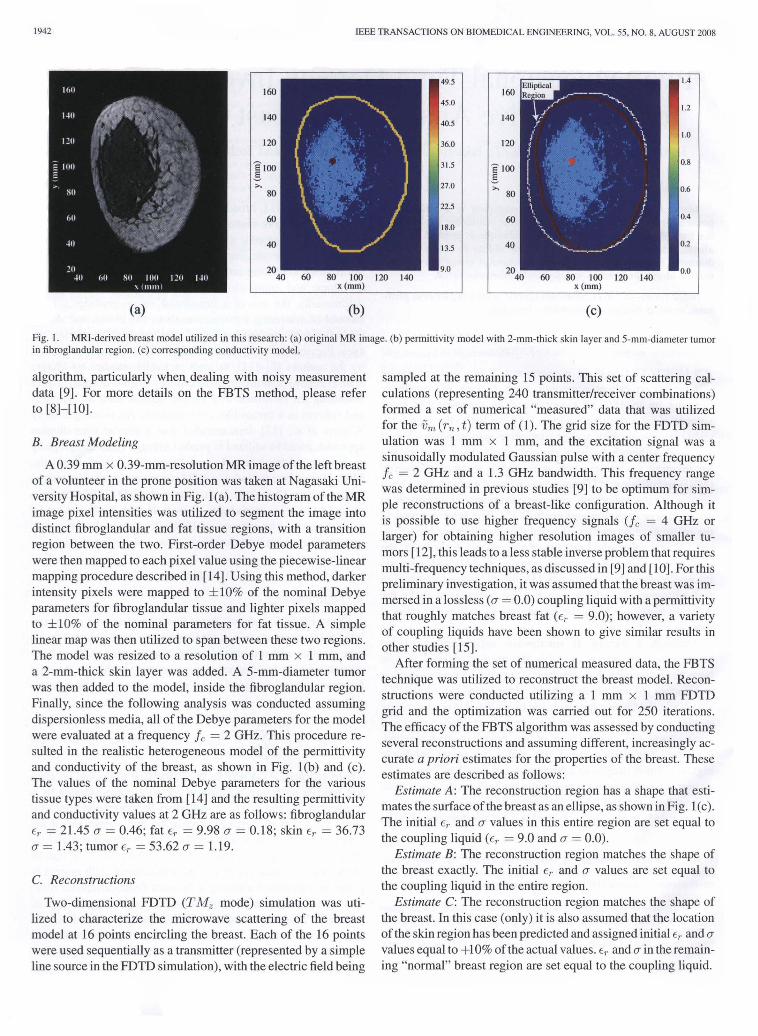
Fig. 2. FBTS images of breast model with 5-mm lesion in the fibroglandular region. Parts (a)-(c) show permittivity reconstructions for initial estimates A, B,and C. respectively. Parts (d)-(f) show the corresponding conductivity reconstructions.
Although estimates Band C assume that a fairly large amountof a priori information can be obtained about the breast,microwave-based techniques for breast surface identification(BSID) [16], skin thickness prediction [17], and the aforementioned approach for estimating average tissue properties [13]should make it feasible in the future to form such accurate,patient-specific initial estimates for FBTS imaging.
III. RESULTS AND DISCUSSION
Fig. 2 shows the reconstructed images utilizing the FBTStechnique and compares the results for the three initial estimatesA-C. Observing the images for which the elliptical reconstruction region was utilized [Estimate A. shown in Fig. 2(a) and(d)], it is clear that both the permittivity and conductivity reconstructions distinctly show the presence of the lesion in thebreast. The center position of the tumor is x = 80 rnrn, y =105 mm for both images, corresponding exactly to the actualtumor position. The peak values for the tumor are lOmax = 43.6and (Jmax = 0.92, which are significantly lower than the actualvalues of lOmax = 53.6 and (Jmax = 1.19. In comparing Fig. 2(a)and (d) it is evident that the permittivity image is more accurate. This is particularly noticeable in the skin region, with thereconstructed skin layer being wider and more blurry in the
conductivity image. The estimated skin thickness, calculatedusing the full-width half-maximum permittivity (conductivity)span over several I-D lines tracing through the skin region, is4.6 mm for the permittivity image and 5.3 mm for the conductivity image. The fibroglandular region is also more well definedin the permittivity image, which is evident by the area on the leftside of the image where a thin strip of fat tissue exists betweenthe skin and the fibroglandular region. For the conductivity reconstruction, this strip of fat tissue is indistinguishable from thefibroglandular tissue.
Fig. 2(b) and (e) shows the permittivity and conductivity images when the reconstruction region is constrained to the actualposition of the breast (Estimate B). In this case, the center position of the tumor is also detected exactly and the tumor is moreprominent (lOmax = 45.7 and (Jmax = 1.01) than for EstimateA. Comparison of Fig. 2(a) and (b) demonstrates that either initial estimate results in similar reconstructed permittivity imagequality. However, it is clear that the skin region is much morewell defined when using Estimate B, with an estimated thickness of 2.4 mm using the lOr image (and 2.1 mm using the (J
image). Additionally, when comparing the conductivity images[Fig. 2(d) and (e)], it can be seen that Estimate B results in abetter reconstruction of the fibroglandular region.

1944 IEEE TRANSACTIONS ON BIOMEDICAL ENGINEERING, VOL. 55, NO.8, AUGUST 2008
REFERENCES
with continually increasing computational power, should allowfor future 3-D reconstructions with reasonable speed. In addition to computational speed, frequency dispersion of the breasttissue properties must also be considered. Dispersion can beaddressed by modeling the breast tissues with Debye parameters and reconstructing the Debye parameters directly, using anapproach very similar to that described in [13]. Techniques forovercoming other issues, such as integrating the algorithm withpractical measurements conducted in a tank filled with couplingliquid, are currently under investigation.
[I] Committee on Technologies for the Early Detection of Breast Cancer,Mammography and Beyond: Developing Technologies for the Early Detection of Breast Cancer, S. Nass, 1. Henderson, and 1. Lashof Eds.Washington, DC: National Cancer Policy Board, Institute of Medicine,and Commission on Life Studies, National Research Council, 2001.
[2] E. Fear, S. Hagness, P. Meaney, M. Okoniewski, and M. Stuchly, "Enhancing breast tumor detection with near-field imaging," IEEE Microw.Mag., vol. 3, no. I, pp. 48-56, Mar. 2002.
[3] X. Li, E. Bond, B. Van Veen, and S. Hagness, "An overview of ultrawideband microwave imaging via space-time beamforming for earlystage breast-cancer detection," IEEE Antennas Propag. Mag., vol. 47,no. I,pp. 19-34, Feb. 2005.
[4] J. Johnson and T. Takenaka, "Preliminary assessment of electromagneticabsorption in the breast for cylindrical microwave breast cancer detectionsystems," in Proc. Progress Electromagn. Res. Symp., Tokyo, Japan, 2006,pp. 256-260.
[5] P. Meaney, M. Fanning, D. Li, S. Poplack, and K. Paulsen, "A clinicalprototype for active microwave imaging of the breast," IEEE Trans.Microw. Theory Tech., vol. 48, no. II, pp. 1841-1853, Nov. 2000.
[6] E. Fear, X. Li, S. Hagness, and M. Stuchly, "Confocal microwave imaging for breast cancer detection: Localization of tumors in three dimensions," IEEE Trans. Biomed. Eng., vol. 49, no. 8, pp. 812-822, Aug.2002.
[7] X. Li, S. Davis, S. Hagness, D. van der Weide, and B. Van Veen, "Microwave imaging via space-time beamforming: Experimental investigation of tumor detection in multilayer breast phantoms," IEEE Trans.Microw. Theory Tech., vol. 52, no. 8, pp. 1856-1865, Aug. 2004.
[8] T. Takenaka, T. Tanaka, H. Harada, and S. He, "FDTD approach to timedomain inverse scattering problem for stratified lossy media," Microw.Opt. Technol. Lett., vol. 16, no. 5, pp. 292-296, 1997.
[9] T. Takenaka, H. Jia, and T. Tanaka, "Microwave imaging of electrical property distributions by a forward-backward time-steppingmethod," J. Electromagll. Waves Appl., vol. 14, no. 12, pp. 1609-1626,2000.
[10] T. Tanaka, N. Kuroki, and T. Takenaka, "Filtered forward-backward timestepping method applied to reconstruction of dielectric cylinders," 1.Electromagll. Waves Appl., vol. 17, no. 2, pp. 253-270, 2003.
ACKNOWLEDGMENT
The authors would like to thank Dr. I. Isomoto of the NagasakiUniversity School of Medicine for his assistance with acquiringand processing the MR images. They would also like to thankthe reviewers for their thoughtful suggestions.
IV. CONCLUSION
The FBTS technique was used to successfully detect a5-mm-diameter malignancy embedded in a realistic breastmodel. Going beyond detection of the tumor, the FBTS images quantify the fibroglandular, skin and fat tissue regions withsignificant accuracy. The results from this research demonstratethe potential of the FBTS approach to be useful not just fordetection but also to assess the breast's internal composition.
nonnal region mcludes the fat, fibroglandular, and transItion regIOns
Tumor Fibroglandular Nonnal* SkinEstimate €ma:c (11n6% €avQ (TaVQ €avQ (TaVQ €avQ (TaVQ
A 43.6 0.92 20.1 0.42 14.5 0.31 24.6 0.68B 45.7 1.01 20.1 0.43 14.2 0.29 32.6 1.21C 51.4 0.98 20.2 0.43 13.9 0.27 36.6 1.47Model 53.6 1.19 21.6 0.46 13.8 0.27 36.7 1.43* ..
TABLE ICHARACfERISTlCS OF RECONSTRUCfED IMAGES
Estimate C represents the most precise initial estimate, withthe assumption that both the shape of the breast and the thicknessof the skin can be detected. Thus, as might be expected, thereconstructed images for this case [Fig. 2(c) and (0] are of thehighest quality. In this case the tumor is very prominent (Emax =51.4 and U max = 0.98), and again, the center position of thetumor is determined precisely. It is of particular interest in thiscase that the skin region, after a priori estimation of Er andU to within 10%, remains very well defined (with an estimatedthickness of 2.3 mm for both images) even though Er and u in theskin region are allowed to vary freely in the FBTS optimizationprocess.
Comparison of all three permittivity images [Fig. 2(a)-(c)] reveals that regardless of the choice of initial estimate, the tumoris clearly detected and the shape of the fibroglandular region isdistinct from the surrounding fat tissue. In contrast, Fig. 2(d)(0 shows that the accuracy of the initial estimate has a muchmore significant influence over the conductivity image quality.The lower quality of the conductivity images is somewhat tobe expected due to the fact that the error function (1) is usuallymore sensitive to permittivity variations than conductivity variations in this reconstruction problem. Although not shown in thispaper, this difference in sensitivity is evident when comparingthe effects of changes in the shape of scattered waveforms forvariations in conductivity with variations in permittivity.
In order to further assess the quality of the images in Fig. 2, theaverage Er and u values of the fibroglandular, skin, and normaltissue regions (determined using the proper sets of pixels asidentified during the breast modeling step) were calculated (seeTable I). Observing these results, it is striking how closely theaverage values in the different tissue regions are reproduced,particularly for the most precise initial estimate (C). However,even for the least precise estimate (A), the average Er valuesof the fibroglandular and normal tissue regions are predictedto within 7% of the actual values. Similarly, the u values inthis case are predicted to within 14%. Thus, although the skinregion reconstruction quality is poor for Estimate A, the internalcomposition of the breast is still reconstructed with reasonableaccuracy.
Finally, there are some practical issues in the future development of the FBTS technique that warrant some discussion. Inthis 2-D study, imaging times were reasonable (2.6 min/iterationon a personal computer (PC) with an AMD Athalon 4000+ 64bit processor and 4 GB RAM); however, 3D reconstructions willbe significantly slower. Fortunately it is possible to implementthe FBTS algorithm in a parallel process, with gradients foreach transmitter calculated individually on separate processors.Techniques such as this, combined with the availability of PCs

JOHNSON et al.: TWO-DIMENSIONAL TIME-DOMAIN INVERSE SCATrERING FOR QUANTITATIVE ANALYSIS OF BREAST COMPOSITION 1945
[11] J. Johnson, H. Zhou, and T. Takenaka, "Experimental three-dimensionaltime-domain reconstruction of dielectric objects for breast cancerdetection," in Proc. Mediterr. Microw. Symp., 2006, pp. 423-426.
[12] A. Fhager, P. Hashernzadeh, and M. Persson, "Reconstruction quality andspectral content of an electromagnetic time-domain inversion algorithm,"IEEE Trans. Biomed. Eng., vol. 53, no. 8, pp. 1594-1604, Aug. 2006.
[13] D. W. Winters, E. J. Bond, B. D. Van Veen, and S. C. Hagness, "Estimationof the frequency-dependent average dielectric properties of breast tissueusing a time-domain inverse scattering technique," IEEE Trans. AntennasPropag., vol. 54, no. ll, pp. 3517-3528, Nov. 2006.
[14] M. Converse, E. Bond, B. Veen, and S. Hagness, "A computational studyof ultra-wideband versus narrowband microwave hyperthermia for breast
cancer treatment," IEEE Trans. Microw. Theory Tech., vol. 54, no. 5,pp. 2169-2180, May 2006.
[15] P. Kosmas, C. Rappaport, and E. Bishop, "Modeling with the FDTDmethod for microwave breast cancer detection," IEEE Trans. Microw.Theory Tech., vol. 52, no. 8, pp. 1890-1897, Aug. 2004.
[16] D. Winters, B. Van Veen, and S. Hagness, "UWB microwave imaging forbreast cancer detection: An algorithm for estimating the breast surface,"in Proc. IEEE Antennas Propag. Soc. Int. Synrp., Jul. 2006, pp. 267-270.
[17] T. Williams, E. Fear, and D. Westwick, "Tissue sensing adaptive radarfor breast cancer detection-Investigations of an improved skin-sensingmethod," IEEE Trans. Microw. Theory Tech., vol. 54, no. 4, pp. 13081314, Jun. 2006.