nanotribological surface characterization by frequency ... · nanotribological surface...
TRANSCRIPT
Nanotribological surface characterization by frequency modulated torsional resonance mode AFM
Dissertation der Fakultät für Geowissenschaften
der Ludwig-Maximilians-Universität München
Ayhan Yurtsever
27. March 2008
Disputation: 04. July 2008
Referees: PD Dr. Robert W. Stark Prof. Dr. Wolfgang W. Schmahl
2
Abstract The aim of this work is to develop an experimental method to measure in-plane surface
properties on the nanometer scale by torsional resonance mode atomic force microscopy and
to understand the underlying system dynamics. The invention of the atomic force microscope
(AFM) and the advances in development of new AFM based techniques have significantly
enhanced the capability to probe surface properties with nanometer resolution. However, most
of these techniques are based on a flexural oscillation of the force sensing cantilever which
are sensitive to forces perpendicular to the surface. Therefore, there is a need for highly
sensitive measurement methods for the characterization of in-plane properties. To this end,
scanning shear force measurements with an AFM provide access to surface properties such as
friction, shear stiffness, and other tribological surface properties with nanometer resolution.
Dynamic atomic force microscopy utilizes the frequency response of the cantilever-probe
assembly to reveal nanomechanical properties of the surface. The frequency response function
of a cantilever in torsional motion was investigated by using a numerical model based on the
finite element method (FEM). We demonstrated that the vibration of the cantilever in a
torsional oscillation mode is highly sensitive to lateral elastic (conservative) and visco-elastic
(non-conservative) in-plane material properties, thus, mapping of these properties is possible
in the so-called torsional resonance mode AFM (TR-mode).
The theoretical results were then validated by implementing a frequency modulation (FM)
detection technique to torsion mode AFM. This method allows for measuring both
conservative and non-conservative interactions. By monitoring changes of the resonant
frequency and the oscillation amplitude, we were able to map elastic properties and
dissipation caused by the tip-sample interaction. During approach and retract cycles, we
observed a slight negative detuning of the torsional resonance frequency, depending on the tilt
angle between the oscillation plane and the surface before contact to the HOPG surface. This
angle leads to a mixing of in-plane (horizontal) and out-of-plane (vertical) sample properties.
These findings have a significant implication for the imaging process and the adjustment of
the microscope and may not be ignored when interpreting frequency shift or energy
dissipation measurements.
To elucidate the sensitivity of the frequency modulated torsional resonance mode AFM (FM-
TR-AFM) for the energy dissipation measurement, different types of samples such as a
compliant material (block copolymer), a mineral (chlorite) and a macromolecule (DNA) were
investigated. The measurement of energy dissipation on these specimens indicated that the
3

TR-AFM images reveal a clear difference for the domains which have different mechanical
properties. Simultaneously a topographic and a chemical contrast are obtained by recording
the detuning and the dissipation signal caused by the tip-surface interaction. Using FM-TR-
AFM spectroscopically, we investigated frequency shift versus distance curves on the
homopolymer polystyrene (PS). Depending on the molecular weight, the frequency detuning
curve displayed two distinct regions. Firstly, a rather compliant surface layer was probed;
secondly, the less mobile bulk of the polymer was sensed by the oscillatory motion of the tip.
The high sensitivity of this technique to mechanical in-plane properties suggests that it can be
used to discriminate different chemical properties (e.g. wetting) of the material by
simultaneously measuring energy dissipation and surface topography.
4

Contents 1. Introduction 8 2. The Atomic Force Microscope 11 2.1. Principle of the atomic force microscope………………………………….. 11 2.1.1. Imaging Modes…………………………………………………... 11 2.2. Tip-surface interaction forces………………………………….................... 15 2.2.1. Long-range attractive interactions……………………………….. 15 2.2.2. Contact forces…………………………………………................. 16 2.3. Frequency modulation atomic force microscopy…………………………... 19 2.4. Lateral modulation methods…………………………………...................... 22 3. Torsional Resonance Mode AFM 25 3.1. Theory of the torsional resonance mode…………………………………… 29 3.2. Numerical simulation (FEM)………………………………………………. 31
3.3. Simulation Results…………………………………………………………. 35 4. Experimental Results (Abstracts of the Manuscripts) 37 4.1. Frequency modulated torsional resonance mode AFM……………………. 37 4.2. Response of a laterally vibrating nanotip to surface forces………………... 39 4.3. Frequency modulation torsional resonance mode AFM on chlorite …………………………………………………………………. 40
4.4. Frequency modulated torsional resonance mode atomic force microscopy on polymers…………………………………………………… 43 4.5. Acoustical force nanolithography of thin polymer films…………………... 46 4.6. Torsional mode atomic force microscopy and image processing
for the analysis of protein-DNA complex binding site……………………. 48
4.7. Amplitude modulation torsional resonance mode AFM (TR-mode) on Graphite …………………………………………………………………50
5. Conclusion 52
5

References 54 Appendix 57
1. Manuscripts………………………………………………………………… 57 2. Acknowledgements ……………………………………………………….. 100
3. CV………………………………………………………………………….. 102
6

List of Abbreviations AFM Atomic Force Microscope TR-AFM Torsional Resonance Mode AFM TM-Mode Tapping Mode IC-AFM Intermittent Contact Mode AFM FM-TR-AFM Frequency Modulated Torsional Resonance Mode AFM UHV Ultra High Vacuum LFM Lateral Force Microscopy nc-AFM Non-Contact AFM FM Frequency Modulation FFM Friction Force Microscopy HOPG Highly Oriented Pyrolytic Graphite CE-Mode Constant Excitation Mode CA-Mode Constant Amplitude Mode KPM Kelvin Probe Microscopy SCM Scanning Capacitance Microscopy PS Polystyrene AGC Automatic Gain Control PSD Position-Sensitive Photo Detector PI Proportional Integral RMS Root Mean Square
7
1. Introduction The Atomic force microscope (AFM) was invented as a tool for nano-, and atomic-scale
surface topography imaging. In addition to topographic imaging, there has been great interest
in using the AFM as a nanoscale characterization tool, probing a rich variety of information
related to mechanical properties of the surface such as elasticity, hardness and tribological
properties. The measurement of these properties provides additional information which helps
to differentiate between distinct materials. Several techniques have been developed to extract
the surface mechanical properties with nanometer resolution. Typically, an AFM tip in close
contact to the surface is used as a sensor to probe the tip-sample interaction. The tip-sample
interaction is usually measured perpendicular to the sample surface. Conventional methods
based on flexural oscillations (in vertical direction) of the AFM sensor lack information on
the in-plane properties. Usually, only information in vertical direction is measured neglecting
in-plane properties. However, many material properties are described by vectors (e.g.
magnetization) or tensors (e.g. elasticity). Thus, surface characterization methods are needed
which allow for the determination of both in-plane and out-of-plane components of the
interaction between the AFM tip and the sample.
A precise measurement of the in-plane mechanical properties depends on the mode of
operation. The AFM methods cover the entire range from contact over intermittent contact, to
non-contact modes. Researchers have explored many effects related to in-plane surface
properties by dynamic AFM. Different modulation techniques have been used such as
torsional or lateral modulation AFM. The observation of force gradients on hard magnetic
coatings, anisotropy of lateral stiffness and friction, are some examples for the measurement
of in-plane mechanical properties. Lateral force microscopy (LFM) [1, 2] was introduced to
access frictional properties. In order to measure the lateral deflection signal, several methods
have been implemented to the AFM. These are for instance optical beam deflection [3], two
capacitance methods [4], or a dual fiber interferometer [5]. The first friction force
measurement on the atomic scale was carried out by Mate et al. [6] who used a tungsten tip to
characterize a graphite surface. This experiment helped to explain important phenomena of
friction such as the stick-slip or the dependence of friction on the normal load. In addition to
LFM, other techniques have been developed where a lateral or torsional excitation of the
AFM cantilever was used for the measurements. The excitation can be provided by a dither
piezo on the cantilever holder (both in thickness or in shear mode) or by an ultrasonic shear
wave transducer below the sample [7].
8

An accurate measurement of friction requires exact knowledge of the contact area between tip
and sample. Unfortunately, this parameter is not directly accessible. Thus, approximate
models based on continuum elasticity theories such as Hertz, Derjaguin-Muller-Toporov
(DMT) [8], Johnson-Kendall-Roberts (JKR) [9], or Maguis-Dugdale (MD) [10] , can be used
to estimate the contact area. In particular, Pethica [11] suggested a method based on the Hertz
model where the contact area can be determined from contact stiffness measurements. If the
elastic properties of tip and sample are known, the contact area can be calculated. In order to
increase the accuracy of the contact area determination, the lateral stiffness of the contact can
be used as an additional parameter [12, 13]. Lateral stiffness measurements reveal the reduced
shear modulus of the materials. In addition to elastic property measurements, also other
properties of the materials can be probed by lateral excitation of the AFM cantilever.
Examples are measurements of the glass transition temperature (Tg) of polymers [14], [15], of
friction on nanoscale [16], and the discrimination of different chemical properties [17].
An example for the importance of in-plane properties for conventional AFM methods is the
characterization of organic monolayers. The anisotropy of the in-plane elasticity is an
important factor to explain the phase contrast in intermittent contact mode AFM (IC-AFM) on
such structures. The phase shift in atomic force microscopy is related to the energy dissipation
between tip and specimen. On organic monolayers, an in-plane anisotropy can cause an
additional phase shift. Marcus et al. [18] showed that energy dissipation caused by the in-
plane anisotropy accounts for 10% of the total energy dissipation [19].
Another example for the importance of lateral forces is an experiment by Pfeiffer et al. [20]
who measured energy dissipation on a Cu (100) single crystal surface in UHV. Lateral forces
were probed by shaking the cantilever base at the torsional resonance frequency, in non-
contact AFM mode. The excitation of torsional vibrations enabled force sensitivity in the
piconewton range.
Despite to the importance of the results obtained by lateral or torsional modulation AFM, the
above mentioned techniques are limited in sensitivity for several reasons; firstly, the
excitation of the cantilever in lateral oscillation is also coupled to flexural vibrations. Thus,
the lateral deflection channel includes several resonances which are not torsional vibrations.
Secondly some of the mentioned techniques can only be used in ultra high vacuum (UHV)
which is not suitable for biological applications. To overcome these limitations an accurate
measurement of surface properties requires the measurement of forces in perpendicular and in
lateral direction simultaneously. Towards this end, a special cantilever holder was introduced
recently, which allows for the direct excitation of torsional resonances in a standard AFM
9

setup under ambient conditions. In the so-called torsional resonance mode (TR-mode), the
torsional resonance of the cantilever is excited by two piezoelectric elements which are driven
out of phase in thickness mode. This excitation forces the tip into an oscillatory motion
parallel to the sample surface with a minimum of vertical movement. This technique increases
the signal level in ambient air and decreases coupling or cross talk between torsional and
flexural vibrations.
In this thesis, our main contribution is to understand the principle dynamics of the TR-Mode
AFM in amplitude and frequency modulation feedback. The goal is to improve the sensitivity
of in-plane measurements as they are needed for the characterization of nano-materials.
Application examples include biological objects (DNA protein interaction), mineralogical
specimen (surface heterogeneity of chlorite) and polymers. First, the response of the
torsionaly vibrated cantilever to the surface forces is investigated and the resulting insight is
used to experimentally implement the first demonstrator of a frequency modulation torsional
resonance mode AFM (FM-TR-AFM). Understanding the manner in which the feedback
mechanisms of this novel mode are related to the dynamics of the cantilever is crucial to
extend the current capabilities of AFM used in nanotribology. In contrast to other lateral
modulation techniques, this novel method measures conservative and dissipative interaction
forces simultaneously with the surface topography.
The thesis is organized into 5 chapters. Chapter 1 provides an introduction to the background
and the motivation of this work. Chapter 2 reviews the principle of atomic force microscopy
and provides a brief explanation of the different methods used to model the tip-sample
interaction in AFM. Also the frequency modulation technique (FM) is discussed. Chapter 3
describes torsional resonance mode atomic force microscopy (TR-mode) and its dynamics in
the case of visco-elastic interaction. Additionally the setup of the frequency modulation
torsional resonance mode AFM is described. Chapter 4 presents a short summary of the
published papers. Conclusions and an outlook to future work are presented in Chapter 5.
10
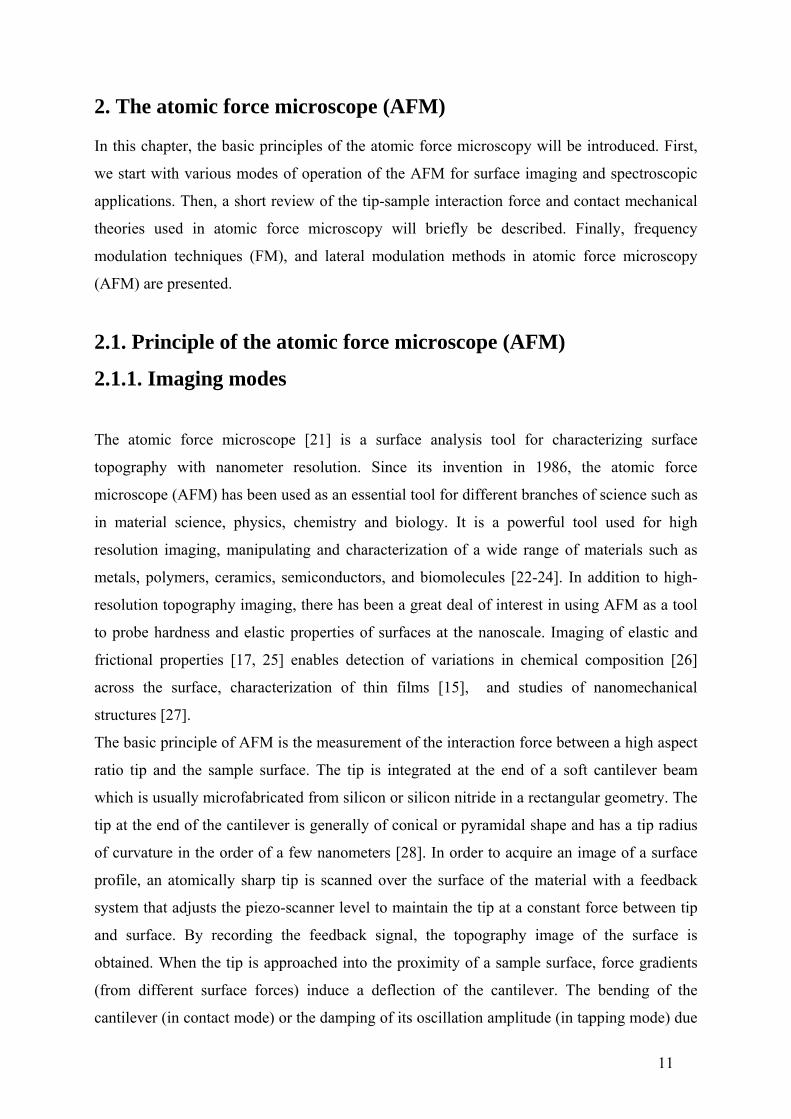
2. The atomic force microscope (AFM) In this chapter, the basic principles of the atomic force microscopy will be introduced. First,
we start with various modes of operation of the AFM for surface imaging and spectroscopic
applications. Then, a short review of the tip-sample interaction force and contact mechanical
theories used in atomic force microscopy will briefly be described. Finally, frequency
modulation techniques (FM), and lateral modulation methods in atomic force microscopy
(AFM) are presented.
2.1. Principle of the atomic force microscope (AFM)
2.1.1. Imaging modes
The atomic force microscope [21] is a surface analysis tool for characterizing surface
topography with nanometer resolution. Since its invention in 1986, the atomic force
microscope (AFM) has been used as an essential tool for different branches of science such as
in material science, physics, chemistry and biology. It is a powerful tool used for high
resolution imaging, manipulating and characterization of a wide range of materials such as
metals, polymers, ceramics, semiconductors, and biomolecules [22-24]. In addition to high-
resolution topography imaging, there has been a great deal of interest in using AFM as a tool
to probe hardness and elastic properties of surfaces at the nanoscale. Imaging of elastic and
frictional properties [17, 25] enables detection of variations in chemical composition [26]
across the surface, characterization of thin films [15], and studies of nanomechanical
structures [27].
The basic principle of AFM is the measurement of the interaction force between a high aspect
ratio tip and the sample surface. The tip is integrated at the end of a soft cantilever beam
which is usually microfabricated from silicon or silicon nitride in a rectangular geometry. The
tip at the end of the cantilever is generally of conical or pyramidal shape and has a tip radius
of curvature in the order of a few nanometers [28]. In order to acquire an image of a surface
profile, an atomically sharp tip is scanned over the surface of the material with a feedback
system that adjusts the piezo-scanner level to maintain the tip at a constant force between tip
and surface. By recording the feedback signal, the topography image of the surface is
obtained. When the tip is approached into the proximity of a sample surface, force gradients
(from different surface forces) induce a deflection of the cantilever. The bending of the
cantilever (in contact mode) or the damping of its oscillation amplitude (in tapping mode) due
11

to the response of the attractive or the repulsive force gradient is monitored by an optical lever
system [29, 30]. The laser beam of a laser diode (LD) is focused on the back side of the
microfabricated cantilever, and the reflected beam is projected onto the position-sensitive
photo detector (PSD). For optical sensing of the cantilever motion, the back side of the
cantilever is coated with a metallic film to increase the reflectivity. The channels in the
quadrant-photodiode are arranged to detect the bending and the torsion signal of the cantilever
beam (Fig.1a). The signal changes on the photodetector are monitored by a feedback system
and the output is displayed on the computer, which gives quantitative topographical and
frictional information of the surface. The detector used to sense the movement of the
cantilever deflection is a crucial component for determining the performance of the
microscope. There are various other methods to sense the cantilever deflection signal such as
capacitance sensor and interferometry with fiber optics as described in [4, 31-33]. AFMs can
be operated in a variety of modes, such as contact mode (quasi-static), flexural or tapping
mode and non-contact mode (nc-AFM) (dynamically).
Dither Piezo
Cantilever &Tip
LD
Laser
Sample surface
AB
CD
PZTscanner
Feedback Control
Electronics
Photodiode
Dither Piezo
Cantilever &Tip
LD
Laser
Sample surface
AB
CD
PZTscanner
Feedback Control
Electronics
Photodiode
Force (nN)
Lever-sampledisplacement
Pull-
offF
orce
1
4
5
6
Force (nN)
Lever-sampledisplacement
Pull-
offF
orce
12
3
4
5
6
(a) (b)
Figure 1: (a) AFM setup with an optical beam deflection system. (b) Typical AFM force-distance
curve. At large distance to the sample surface, there is no force between tip and sample (1). The
AFM tip is approached to the surface (2). Then the tip is being pushed to the surface resulting in a
bending to the cantilever in downward direction. The jump into contact occurs due to attraction of
the van der Waals force (3). Approaching more closely to the surface, the tip is in repulsive contact
to the sample surface; then the cantilever is bent in upward direction (4). Retraction part of the
force-distance curve (5) the motion of the tip is reversed. (6) the cantilever stiffness overcomes the
pull-off force and the tip snaps out of contact (Figure 1 (b) adapted from reference [34]).
12

In contact mode operation, the tip stays in close contact with the sample surface (i.e., the
repulsive interaction regime in the force-distance curve) during the entire imaging process.
The vertical deflection of the cantilever, which is related to the tip loading force on the sample
surface by the cantilever-tip system, is used as a control signal in the feedback loop. The
feedback moves either the sample or the probe assembly vertically to the surface of the
sample in response to the cantilever deflection, as it is sensed by the deflection system while
the probe is scanned across the surface. By recording the change of the z-level of the piezo-
scanner, a surface topography image is obtained. The contact mode AFM is usually preferred
if high-speed scanning capabilities are required. However, the high tip-to-sample force is an
important issue in contact mode AFM imaging. The presence of the lateral forces leads to a
mechanical deformation of the surface. Undesired material modification can occur for a soft
material such as biological materials or compliant samples. Therefore, very soft cantilevers
are employed to reduce the tip and surface damage [35]. Most of the contact mode levers have
a spring constant of less than 1 N/m.
The needs to avoid surface deformation and to probe surface properties dynamically were the
main motivations for the development of other techniques in atomic force microscopy. One
advanced technique is tapping mode [32] also known as intermittent contact mode AFM (IC-
AFM). In tapping mode AFM, the cantilever is excited mechanically to oscillate at its
fundamental flexural resonant frequency. The excitation of a dither piezo causes the cantilever
to oscillate with an amplitude of typically 20 nm which is used as the control signal in
feedback circuitry and is kept constant during imaging. Therefore, it is also called amplitude
modulation AFM (AM-AFM). The oscillating tip is approached close to the surface until it
starts to lightly touch or tap the surface at a small portion of its oscillation period. As the
vibrating cantilever starts to periodically contact the surface, the cantilever oscillation
amplitude, frequency, and the phase are changed due to the tip-sample interaction. These
changes in the amplitude and the phase with respect to the reference values provide
information about surface elastic and frictional properties. The oscillation amplitude is
reduced due to damping and energy dissipation caused by the tip-surface interaction. The
phase shift between the driving signal and the cantilever beam gives additional information
about the material properties. Imaging of a large range of soft materials, especially biological
samples [36], became possible by the advent of the tapping mode AFM.
13

Another important method in dynamic force microscopy is non-contact AFM (nc-AFM) [32].
In this mode, the system is operated in the attractive force region. In order to maintain stable
imaging in the attractive regime, usually a frequency modulation feedback is used. Similar to
amplitude modulation in tapping mode AFM, the atomic force microscope can be operated in
non-contact in ambient air. However, in ambient conditions, water molecules adsorb to
hydrophilic surfaces and a water layer forms. This water layer creates a capillary force
between tip and surface. This force also prevents the tip from coming close enough in order to
measure the short range repulsive forces. In such a case, the AFM tip usually snaps into
contact with the sample surface. The short range repulsive force, which occurs when the
electron orbitals of the tip and sample overlap, is the main source of the atomic resolution
contrast in nc-AFM. In order to get the atomic resolution, the long range part of the tip-
sample interaction force has to be filtered out. For this reason, the non-contact mode operation
is usually employed in an ultrahigh vacuum environment (UHV) for true atomic resolution
imaging [37]. Due to the increased quality factor of the oscillation of the cantilever in UHV,
the sensitivity of the force measurement is increased significantly. However, the scanning
speed is reduced compared to the normal operation in ambient air. The time constant in
amplitude modulation is proportional to the quality factor of the cantilever where a higher
quality factor cantilever has a longer time constant. To overcome this deficiency Albrecht
[38] used the frequency modulation detection technique (FM) to increase the scan speed in
ultrahigh vacuum (UHV). With this approach, the response time of the frequency change is
shortened. By taking advantage of this increased sensitivity the FM technique allows for the
measurement of much weaker force gradients. Since 1995, the non-contact atomic force
microscope (nc-AFM) has achieved remarkable progress especially in imaging with true
atomic resolution [39], manipulation of atoms [23] and in the creation of artificial atomic
structures on surfaces [40]. More detailed information on the frequency modulation detection
system will be given in section 3.3.
As we can see in Figure 1 (b) the force-distance dependence of the interaction between an
AFM tip and a sample surface typically shows an attractive and a repulsive part. While the tip
is far away from the sample, the tip deflection remains on an almost constant level (1).
Approaching further, the attractive tip-sample force pulls the cantilever downward (2).
Finally, the tip-sample contact occurs where the tip is in repulsive regime (3) and the
cantilever is deflected to the upward direction (4). During the retract part of the force-distance
curve, the cantilever deflection is reduced until the tip is separated from the surface. When the
gradient of the restoring force of the cantilever exceed the attractive force gradient, the tip
14

will snap-out of the surface contact (6). The attractive or the adhesive force of the cantilever is
calculated by multiplying the spring constant of the cantilever with the downward deflection.
The meniscus force can be eliminated by controlling the humidity, such as imaging in a dry
environment, in ultra high vacuum (UHV) or working in liquids.
2.2. Tip-surface interaction forces
There are many types of forces between the atoms at the tip and the sample in close proximity
to each other [41-43] with different properties and distance dependencies. The atomic force
microscopes (AFM) typically respond to three types of force, namely, attractive, repulsive,
and adhesion. These forces can be classified into attractive and repulsive forces. Van der
Waals interactions, short-range repulsive interactions, chemical, adhesion, electrostatic and
capillary forces are the dominant interactions in an atomic force microscope experiment in
ambient air. In order to interpret AFM force curves and to understand the mechanism of the
contrast formation in atomic resolution imaging, researchers try to model the tip-sample
interaction by using several approximations [42]. The analysis of the force curves incorporate
many valuable information regarding surface chemical, mechanical and adhesive properties.
Here, we will follow some of these most widely used approximations in tip-sample interaction
modelling.
2.2.1. Long-range attractive interactions
The most important long-range interaction is the van der Waals (vdW) force that affects the tip
motion when the tip is approached to the sample surface. The van der Waals force represents
the electromagnetic field fluctuation of the dipoles in the atoms of the tip and the sample
surface. Charge fluctuations in the tip or the surface induce dipoles in the other component
generating a force between both. The van der Waals force originates from three different
forces with the same distance dependencies; (i) dipole-dipole interaction (orientation), (ii)
dipole-induced dipole force, (iii) dispersion forces (dipole-instantaneous dipole interaction).
The dispersion force is the dominant component in the van der Waals interaction. Here we
will be concerned about the van der Waals force between the probing tip and a surface. The
vdw forces for a sphere (tip) with a radius R and a flat geometry (sample) can be obtained
15

from the Derjaguin, Müller, and Toporov (DMT) approximation as a function of the tip-
sample distance d,
26vdW
HRFd
= − , (1)
where Η is the Hamaker constant, R the tip radius. Parameter a0 is an intermolecular distance
which is introduced to avoid the divergence of FvdW for d →0. The Hamaker constant is
depending on the physical properties of the materials such as density of the tip and the
sample, and the charge polarizability. The van der Waals forces are significant in the range
between a few Ångstroms and a several hundreds of Ångstroms. Depending on the choice of
the medium and the type of material between the interacting bodies, generally the van der
Waals interaction has three important properties: (i) the vdW forces measured in vacuum are
always attractive; (ii) the forces are always attractive if probe and sample consist of the same
material, while between two different material they can be attractive or repulsive; (iii) the van
der Waals forces are nonadditive properties. These properties can be used to control the
resolution of the AFM images.
2.2.2. Contact forces
The atomic force microscope is the most useful tool for the measurement of surface
mechanical properties on the nanoscale. The imaging of surfaces in the repulsive regime and
probing the surface mechanical properties such as the elastic or the frictional properties
require an understanding of the short range tip-surface interaction force. Especially an
accurate prediction of the contact area is necessary for the analysis of tribological surface
properties. Thus, the appropriate use of these theoretical models will be relevant in the
experimental investigation. The response of two elastically interacting bodies under load is
described by the continuum elastic mechanics. Here a short review is given on the
approximations of relevant tip-sample interactions which are most widely used in continuum
mechanics. When the surfaces of two objects are in mechanical contact with each other, their
surfaces are deformed by the compressing force due to the applied load (see figure.2).
Neglecting the plastic deformation, continuum models describe the contact area and the
adhesion between the bodies under this external load. There are several different elastic-
adhesive contact theories that provide an analytical relation between the applied force and the
indentation depth.
16
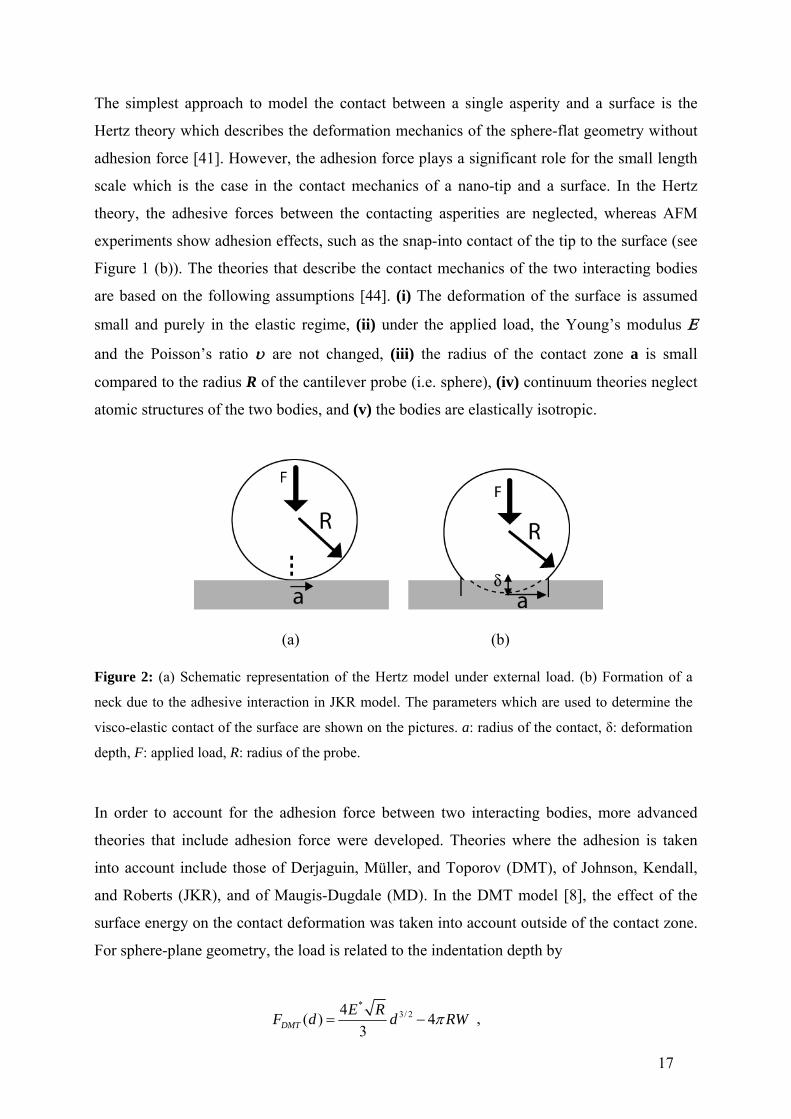
The simplest approach to model the contact between a single asperity and a surface is the
Hertz theory which describes the deformation mechanics of the sphere-flat geometry without
adhesion force [41]. However, the adhesion force plays a significant role for the small length
scale which is the case in the contact mechanics of a nano-tip and a surface. In the Hertz
theory, the adhesive forces between the contacting asperities are neglected, whereas AFM
experiments show adhesion effects, such as the snap-into contact of the tip to the surface (see
Figure 1 (b)). The theories that describe the contact mechanics of the two interacting bodies
are based on the following assumptions [44]. (i) The deformation of the surface is assumed
small and purely in the elastic regime, (ii) under the applied load, the Young’s modulus Ε
and the Poisson’s ratio υ are not changed, (iii) the radius of the contact zone a is small
compared to the radius R of the cantilever probe (i.e. sphere), (iv) continuum theories neglect
atomic structures of the two bodies, and (v) the bodies are elastically isotropic.
(a) (b)
Figure 2: (a) Schematic representation of the Hertz model under external load. (b) Formation of a
neck due to the adhesive interaction in JKR model. The parameters which are used to determine the
visco-elastic contact of the surface are shown on the pictures. a: radius of the contact, δ: deformation
depth, F: applied load, R: radius of the probe.
In order to account for the adhesion force between two interacting bodies, more advanced
theories that include adhesion force were developed. Theories where the adhesion is taken
into account include those of Derjaguin, Müller, and Toporov (DMT), of Johnson, Kendall,
and Roberts (JKR), and of Maugis-Dugdale (MD). In the DMT model [8], the effect of the
surface energy on the contact deformation was taken into account outside of the contact zone.
For sphere-plane geometry, the load is related to the indentation depth by
*
3/ 24( ) 43DMT
E RF d d RWπ= − ,
17

with
12 21 1t s
t s
EE Eυ υ
−
∗ ⎛ ⎞− −= +⎜ ⎟
⎝ ⎠,
where is the reduced Young’s modulus. In most text books and research papers which
cover the simulation of the tip-sample interaction in AFM, the adhesion force is equated to the
van der Waals (vdW) forces at the point of contact where the tip-sample distance is equal to
the intermolecular distance,
E∗
02
3/ 20 02
0
,6
4 ( ) ,6 3
ts
HR aF HR E R a a
a
δδ
δ δ∗
−⎧ >⎪⎪= ⎨−⎪ + −⎪⎩
≤ .
This model is appropriate for tip-surface combinations where the elastic modulus is high and
the radius of curvature and the surface energies are small.
The model of the JKR [9] theory is based on the assumption that the attractive surface forces
cause additional elastic deformation on the surface. In this theory, an adhesive force is
included inside the contact area (Fig. 2 (b)). The JKR model is more suitable for soft samples
with low elastic modulus, and with a large tip radius as used in AFM experiments. The MD
[10] theory provides a interpolation between the DMT and the JKR contact mechanical limits.
The relation between the penetration depth and the contact radius for different contact
mechanic models are summarized in Table 1.
Hertz DMT JKR
a
3
RFE∗ 3 ( 2Ra F R
Eπ∗= + )W 23 ( 3 ) 6 (3 )Ra F WFR WFR WF
E∗= + + + R
δ 2aR
2/ 3
2
23
2( )
a F RWR R E
πδ∗
⎛ ⎞+⎜ ⎟= =⎜ ⎟⎝ ⎠
2 2 63
a WR E
πδ ∗= −a
adF 0 2 RWπ 32
WFR
Table1: Summary of the different theories for the radius of the contact zone a, the sample
deformation depth δ , and the adhesion force for a sphere-flat geometry (Adapted from
reference [41]).
adhF
18

2.3. Frequency modulation atomic force microscopy (FM-AFM)
The frequency modulation (FM) mode was first implemented by Albrecht et al.[38]. It leads
to an increased sensitivity through a higher Q-value. It is classified as a non-contact mode
atomic force microscopy (nc-AFM) technique. The bandwidth of the AFM is described by the
inverse of the time constant (i.e. Q2//1 0ωτ = ). Typically, in vacuum environment, the
quality factor of the cantilever Q is increased up to and the corresponding bandwidth
will be <1 Hz. The long time constant problem in amplitude modulation (AM-AFM) is
overcome by the frequency detection system. Hence, the scan speed, which is the main issue
in non-contact atomic force microscopy (nc-AFM), is significantly increased.
510~
In FM-AFM, the force acting on the tip perturbs the cantilever oscillation only weakly, giving
rise to a small shift Δƒ of the resonant frequency. In comparison to the amplitude modulation
(AM) mode, the cantilever is kept oscillating at its current resonant frequency (f) with a
constant amplitude, A0. The driving signal of the cantilever excitation is generated through a
feedback loop. If the frequency of the driving voltage is close to the cantilever resonance
frequency, the cantilever will be excited to oscillate. The photodiode signal, sensing the
cantilever movement, produces an ac-signal which is amplified with some gain factor. After
the proper phase adjustment thorough a phase shifter, the output signal is used as an excitation
signal (see the block-diagram of the oscillator control amplifier in Figure 3). The frequency
shift is used as a feedback parameter to control the tip-sample gap or to measure the
conservative force interaction between the tip and sample. There are two different submodes
of this technique which are employed in the FM-AFM. The constant excitation mode (CE-
mode) [45, 46] keeps the driving amplitude of the lever constant and therefore results in a
variable oscillation amplitude. The other mode involves a change of the amplitude of the
driving piezo to keep the oscillation amplitude constant and is known as constant amplitude
mode (CA-mode) [47, 48]. Basically the FM-technique has two different feedback loops, the
amplitude control feedback loop and the distance control feedback loop.
The proportional and integral gains of the Phase-Locked-Loop (PLL) allow tracking the
resonant frequency while an automatic gain control (AGC) keeps the oscillation amplitude
constant (CA-Mode). The automatic gain control (AGC) circuit keeps the vibration amplitude
19

at a constant level by variation of the gain of the variable gain amplifier (see the block
diagram of the oscillator control amplifier in FM-AFM detection system in Figure 3).
Photodiode
DCL
Drivingpiezo
Z-piezo
.
Z
X-Y
LD
Phase shifter
AGC
FM Demodulator
ϕBPF
Active Oscillator
( )f tΔ
fΔPhotodiode
DCL
Drivingpiezo
Z-piezo
.
Z
X-Y
LD
Phase shifter
AGC
FM Demodulator
ϕBPF
Active Oscillator
( )f tΔ
fΔ
Figure 3: Schematic representation of the FM-AFM. The commercial AFM component, automatic
gain control (AGC) (that keeps the oscillation amplitude in constant value), FM demodulator (PLL)
(used in order to determine the frequency shift), and the distance control loop (DCL) (maintain the
resonance frequency shift induced by the tip-sample interaction at a preset value Δfset).
Phase detectorInput Limiter
Thresholddetector +
Output filter
Output
LC Resonator
PhotodiodeSignal
Phase detectorInput Limiter
Thresholddetector +
Output filter
Output
LC Resonator
PhotodiodeSignal
Figure 4: Scheme of the frequency demodulator (Adapted from[38]).
This feedback loop is known as amplitude control feedback loop. The amplification in the
amplitude control loop is adjusted by a PI controller to keep the oscillation amplitude
constant. The tip-sample gap is regulated by the distance control loop (DCL) through the PI
controller in the AFM control electronics. The frequency shift caused by the conservative tip-
sample interaction is detected by an frequency modulation (FM) demodulator proposed by
Albrecht [38]. In our measurements, we used a Nanosurf Phase-Lock-Loop controller/detector
20

(PLL)1, which offers a resolution of 4 mHz with 120Hz bandwidth to regulate the AFM in an
FM detection scheme. The cantilever resonance frequency detuning Δƒ is detected by a FM
demodulator and is used as an input for the distance control loop where the error signal of this
Δƒ feedback loop yields the topography Z. It is worth to mention that the spatial dependence
of the frequency shift in tip-sample interaction force is the source of the image contrast in
FM-AFM. If the tip-sample distance regulation feedback is working properly, the tip-sample
distance will be varied in order to keep the frequency shift value to the set value.
In frequency modulation atomic force microscopy, two different operation modes can be used
for the z- feedback regulation depending on the scanning speed and the feedback loop gain. If
the scanning speed is low and the loop gain high, the change in the frequency shift is very
small and the tip follows the topography of the surface in a stable way in feedback loop. The
images generated by the frequency shift show only very small changes at surface steps and a
uniform contrast on surface terraces (only the derivative picture of the topography is
obtained), whereas, the topography images contain the useful information regarding the tip-
sample interaction. However, if the loop gains decreases and the scan speed increases, the tip
is no longer capable of following the surface structure due to the faster response of the
detuning change in the feedback loop. This scanning mode is called constant height mode
[49]. In this case, the detuning images incorporate all useful information which comes from
the tip-sample elastic interaction. The imaging of the surface with constant height mode
increases the image contrast significantly with a well defined lateral structure.
Non-contact atomic force microscopy (nc-AFM) using the frequency modulation detection
method [38] has been one of the most powerful methods for investigating different types of
sample surface in true atomic resolution even on insulating [20] surfaces as well as on
conductive surfaces [50]. Besides providing true atomic resolution, it is also very powerful
tool to measure the tip-sample interaction accurately. Apart from the topographical
measurement, FM-NC-AFM additionally allows for energy dissipation measurements to
probe local surface properties, since the energy dissipation is strongly related with the
mechanical and chemical properties of the surface.
The FM-AFM technique can also distinguish between conservative and dissipative interaction
[51]. The conservative tip-sample interaction results in a distance dependent frequency shift
of the cantilever resonance, without loss of vibration energy. On the other hand, the
1 EasyPLL Digital FM Detectors and Controller made by Nanosurf AG, Liestal, Switzerland CH-8804
21

dissipative force interaction results in loss of the cantilever vibration energy. In order to
compensate the reduction in oscillation amplitude, the power on the excitation piezo has to be
increased. This leads to an increase in the excitation amplitude. The information about the
dissipative interaction (i.e., energy dissipation) can be extracted from the AGC feedback
signal, which shows the ratio Ad/A. [48]
2.4. Lateral modulation in atomic force microscopy
Several approaches have been demonstrated in order to achieve a lateral modulation of the
AFM cantilever to measure the in-plane surface properties. Friction force microscopy (FFM)
is widely used for tribological measurement of the surfaces at the atomic scale. It is a
modification of the atomic force microscope that measures both the normal force as well as
the lateral force simultaneously in contact mode. As the probe is scanned perpendicular to the
long axis of the cantilever across the surface, the friction force between the tip and the surface
causes the cantilever to bend or twist in lateral direction. The cantilever twisting angle (i.e.,
torsional amplitude) is a measure of the lateral force acting on the tip. By recording the lateral
deflection signal of the cantilever twist during a trace-retrace loop, a characteristic friction
loop of the investigated material can be obtained as plotted in Figure 5.
Late
ral s
igna
l[V
]
Late
ral F
orce
[nN
]
Forward
Reverse
klat
Stiffness
Piezo-extension [nm]
Late
ral s
igna
l[V
]
Late
ral F
orce
[nN
]
Forward
Reverse
klat
Stiffness
Piezo-extension [nm]
Figure 5. Schematic representation of a friction loop as measured in friction force microscopy
(FFM). The cantilever twists versus the lateral position of the cantilever. The slope of the friction
loop is a measure of the total stiffness. Adapted from reference [7].
22

At the beginning of the motion, the bending force in the cantilever is not strong enough to
overcome stiction. This is represented as a linear increase of the lateral signal in the friction
loop. Once the restoring force in the cantilever becomes strong enough, the tip starts to slip
over the surface, resulting in a constant lateral signal in the friction loop, due to the effect of
the friction. If the elastic deformations of tip and sample are sufficiently small without sliding
friction contact movement, the slope of the linear part in the friction loop can be used to
measure the surface elastic properties such as lateral contact stiffness and the compliance of
the materials (see Figure 5). The friction loop provides the most convenient method for
acquisition of quantitative data from the FFM. However, the contrast of the frictional image
may include contributions from material properties as well as from topography induced
effects [52, 53]. In order to reduce topography induced effects in the measurement of the
frictional properties, several distinct excitation methods have been developed for the
modulation of the cantilever in lateral or torsional oscillation.
(a) (b) (c)
Figure 6: Different methods to achieve a lateral modulation. (a) Excitation of the cantilever by a
piezo electric tube in thickness mode attached to the cantilever holder. (b) Shear-mode piezo attached
to the cantilever suspension. (c) Shear wave transducer mounted below the cantilever.
The main mechanism of these techniques is based on the excitation of the cantilever by a
dither piezo at the base of the cantilever on the cantilever holder (both in thickness mode (Fig.
6 (a)) and in shear polarized mode (Fig. 6 (b))) or by using a shear-wave piezoelectric
transducer mounted below the sample [54]. As seen in Figure 6 (a), by using the piezo tube
scanner (PZT) in thickness-mode, the flexural vibration of the cantilever can be excited as in
tapping mode AFM. But, due to the asymmetry of the cantilever shape or mass distribution,
the torsional vibration can also be excited at the same time with vertical bending excitation.
Using a piezoelectric tube scanner which is implemented to the sample or the cantilever,
Maivald et al. [55] performed a lateral modulation experiment. In this technique, a modulation
voltage is applied to the x-axis electrode of the scanner without any interference with the
23
conventional imaging system. Several groups used similar techniques to measure frictional or
elastic properties on the nanoscale. The glass transition temperature (Tg) of monodispersed
polystyrene (PS) thin films was investigated by Ge et al. [15] using shear modulation force
microscopy (SFMM). The results obtained by the modulation of the cantilever in lateral or
torsional vibration by using a piezo mounted to the cantilever holder or below the specimen,
explained the frictional or the mechanical properties of the surface at some level. However,
due to coupling of the torsional and the flexural vibration in this type of excitation [56], the
frictional images generated by these measurement system consist of superimposed material
and topography induced effects. Furthermore, some of these techniques have limitations
concerning the modulation frequency restricting it to only several kHz. To overcome this
limitation, external sources have been introduced for the torsional or the lateral modulation.
Shear waves in the specimen induced by a piezoelectric transducer may be used as an
excitation source [57, 58]. In this measurement mode, the transducer is oriented perpendicular
to the long-axis of the cantilever. Acoustic waves are transmitted through the air to the tip, so
that the lateral force couple into the tip-cantilever system and excite torsional vibrations in the
cantilever. With this measurement technique, Reinstadtler at al. [58] presented a new
approach for the investigation of the stick-slip phenomena by analyzing the torsional
amplitude and the phase signals.
24
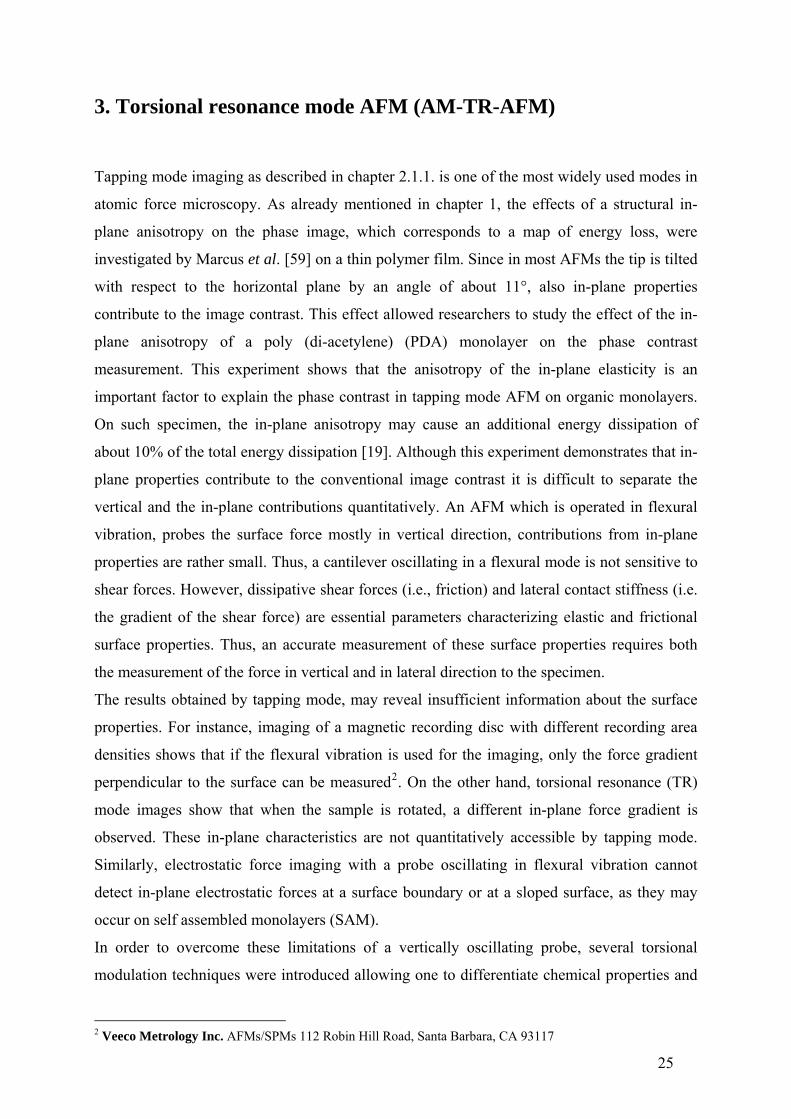
3. Torsional resonance mode AFM (AM-TR-AFM)
Tapping mode imaging as described in chapter 2.1.1. is one of the most widely used modes in
atomic force microscopy. As already mentioned in chapter 1, the effects of a structural in-
plane anisotropy on the phase image, which corresponds to a map of energy loss, were
investigated by Marcus et al. [59] on a thin polymer film. Since in most AFMs the tip is tilted
with respect to the horizontal plane by an angle of about 11°, also in-plane properties
contribute to the image contrast. This effect allowed researchers to study the effect of the in-
plane anisotropy of a poly (di-acetylene) (PDA) monolayer on the phase contrast
measurement. This experiment shows that the anisotropy of the in-plane elasticity is an
important factor to explain the phase contrast in tapping mode AFM on organic monolayers.
On such specimen, the in-plane anisotropy may cause an additional energy dissipation of
about 10% of the total energy dissipation [19]. Although this experiment demonstrates that in-
plane properties contribute to the conventional image contrast it is difficult to separate the
vertical and the in-plane contributions quantitatively. An AFM which is operated in flexural
vibration, probes the surface force mostly in vertical direction, contributions from in-plane
properties are rather small. Thus, a cantilever oscillating in a flexural mode is not sensitive to
shear forces. However, dissipative shear forces (i.e., friction) and lateral contact stiffness (i.e.
the gradient of the shear force) are essential parameters characterizing elastic and frictional
surface properties. Thus, an accurate measurement of these surface properties requires both
the measurement of the force in vertical and in lateral direction to the specimen.
The results obtained by tapping mode, may reveal insufficient information about the surface
properties. For instance, imaging of a magnetic recording disc with different recording area
densities shows that if the flexural vibration is used for the imaging, only the force gradient
perpendicular to the surface can be measured2. On the other hand, torsional resonance (TR)
mode images show that when the sample is rotated, a different in-plane force gradient is
observed. These in-plane characteristics are not quantitatively accessible by tapping mode.
Similarly, electrostatic force imaging with a probe oscillating in flexural vibration cannot
detect in-plane electrostatic forces at a surface boundary or at a sloped surface, as they may
occur on self assembled monolayers (SAM).
In order to overcome these limitations of a vertically oscillating probe, several torsional
modulation techniques were introduced allowing one to differentiate chemical properties and
2 Veeco Metrology Inc. AFMs/SPMs 112 Robin Hill Road, Santa Barbara, CA 93117
25
to map friction and topography simultaneously. In contact mode, the excitation and analysis
of torsional resonances of AFM cantilevers allows the experimentalist to characterize in-plane
properties of metals or semiconductors. For example, Drobek et al. [60] measured the relation
between lateral sample stiffness and load using torsional overtone microscopy. The tip was in
contact with the sample surface without external excitation. In their technique, the
thermomechanical noise spectra of the surface coupled cantilever were analyzed. By using the
finite element method (FEM), an empirical relation between the frequency shift of the first
eigenmode and the shear stiffness was derived. The resonance frequency shifts were measured
from the power spectral density of the photodiode signal, and used to measure the lateral
contact stiffness of the sample. By using the Johnson-Kendall-Roberts theory (JKR) [9] , they
extracted a reduced shear modulus from the lateral stiffness versus load curve. In this way, the
shear modulus of different samples such as metal and semiconductor surfaces was measured.
A similar concept is used in atomic force acoustic microscopy (AFAM). In this mode the
cantilever is actively vibrated in torsional oscillation by an ultrasonic transducer attached
under the sample [61] [57, 58]. By analyzing the resonance spectra, the lateral contact
stiffness could be measured from detuning of the torsional resonance due to the tip-sample
contact.
By combining vertical and horizontal oscillations, i.e. by shaking the cantilever at the
torsional resonant frequency during non-contact AFM imaging Pfeiffer et al. [20], measured
frequency shift (elastic interaction) and frictional energy dissipation on a Cu (100) surface in
UHV. The excitation of a torsional vibration enabled a lateral force sensitivity in the
piconewton range for the measurement of the friction force between the tip and a sulphur
impurity. In a similar approach, Jarvis et al. [62], used a magnetically actuated force sensor,
to measure lateral forces independently from vertical forces. These results demonstrate that it
is possible to measure the lateral force between an AFM tip and atoms on the surface
accurately. The precise determination of lateral forces is essential to understand
nanomanipulation experiments. In nanomanipulation experiments, a mechanical lateral force
is used to move atoms, molecules, and nanostructures on the surface using atomic force
microscopy (AFM) [63].
Besides the methods mentioned above, several other methods based on different force sensors
were invented in order to achieve a laterally oscillating nanotip. In order to achieve high-
resolution non-contact imaging in shear force mode, an STM tip [64, 65] or an AFM sensor
[66] can be mounted to the prong of a tuning fork. However, all these techniques require
26
special modifications of the cantilever sensors or a special transducer (mounted below the
sample or the cantilever support) to excite the lateral motion.
Mode coupling between the torsional and the flexural vibration can occur due to small
asymmetries of conventional AFM sensors. Especially if the horizontal force is parallel to the
axis of the cantilever, the mode coupling is enhanced. Mode coupling due to an asymmetry of
the force distribution on the cantilever can lead to additional resonances. This coupling
complicates the analysis of the image contrast regarding the surface frictional properties in
dynamic AFM measurements. To reduce topography induced effects in dynamic friction
measurements the torsional vibration should be perfectly aligned to the surface. This
alignment eliminates surface slope effects in the friction force measurement. Especially, for
an unambiguous determination of in-plane properties (i.e. friction, heterogeneity) a pure
torsional or lateral vibration mode is needed.
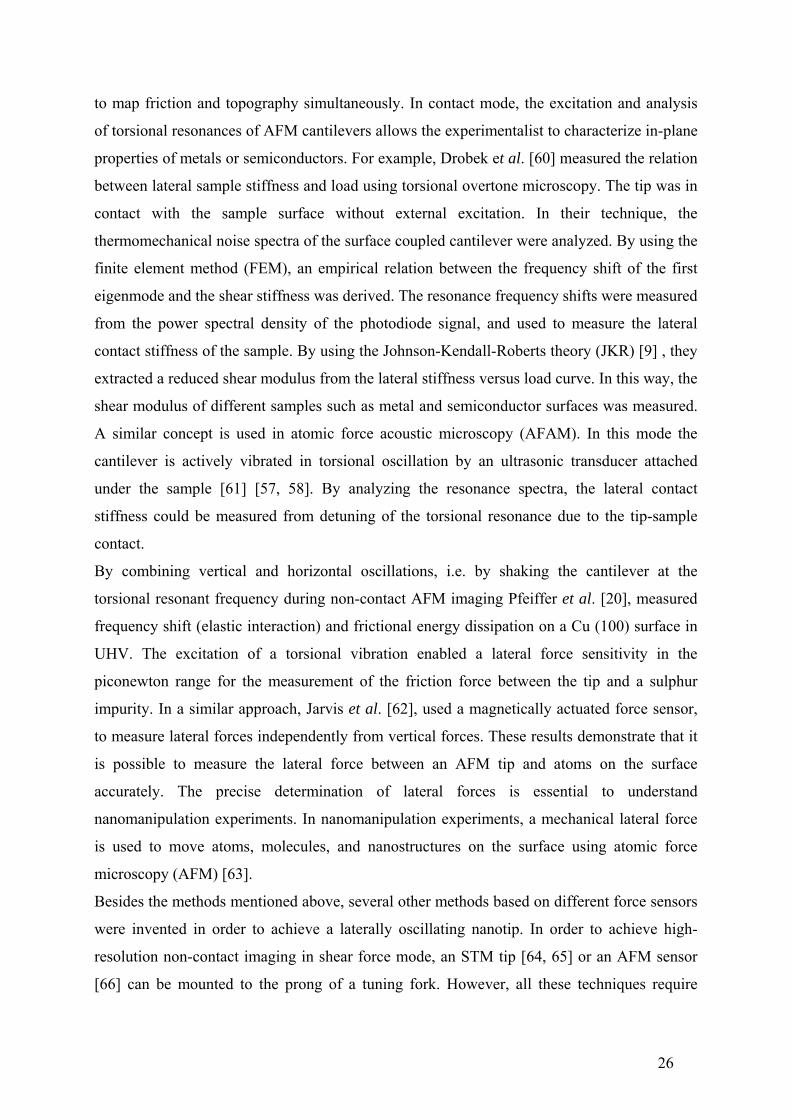
Figure 7: Experimental setup of the TR mode imaging system. The two piezos oscillating out of
phase are necessary to promote a torsional vibration of the tip. The lateral deflection of the
cantilever is detected by a high bandwidth optical deflection detection system. The feedback loop
electronics in the controller work together with the Z piezo in the scanner to maintain constant TR
amplitude or phase while the tip scans over the sample surface.
To reduce mode coupling and other difficulties described above, the torsional resonance mode
(TR mode) was introduced recently, which allows for shear force microscopy with standard
cantilevers [67]. In this mode, the cantilever is driven near its fundamental torsional
resonance frequency by a split piezo actuator, typically in the range of 1MHz (Figure 7). In
27

order to generate a torsional oscillation in the cantilever probe system, experimentalists
usually create an asymmetry in the cantilever-tip (i.e., putting the tip at an offset position
relative to the cantilever axis) or in the transducer which is used to excite the cantilever.
Figure 8: The original design of the setup3. Transducer 114 includes 2 piezo electric elements
115, 116 that are symmetrically attached to the base of the probe assembly 72. Two drive signals
117, 118 are 180 degrees out of phase with respect to each other. Therefore, as one of the piezo
expands the other one contracts. As a result of this motion, with high frequency, the cantilever 74
and, hence the tip start to oscillate as a pendulum like motion.
In the original design of the torsional mode probe holder, the asymmetry was created by
applying two signal sources with different polarity to the symmetrically attached piezoelectric
elements as shown in Figure 8. As one of the piezos starts to oscillate in vertical direction
(i.e., extension) the other one start to oscillate in opposite direction (i.e., contraction). This
design of the cantilever holder leads to a direct excitation of the cantilever in torsion
oscillation and also improves the signal to noise level and reduces possible cross talk between
flexural and torsional vibrations in ambient air. Both piezoelectric elements drive the
cantilever to a small torsional oscillation with a high Q-factor (Q > 1000). The torsion along
the cantilever long axis promotes a small pendulum-like oscillation of the tip apex (typically
0.2 to 2.0 nm rms). Since the tip moves along the width axis of the cantilever beam, in TR
mode the amplitude and phase of the vibration can only be affected by the force and its
gradient in that particular direction. As a result, the phase and amplitude changes which are
detected by the AFM, reflect the tribologic properties of the sample.
3 US patent no:6,945,099 B1(2005)
28

3.1. Theory of the torsional resonance mode (TR-mode)
The equation of motion of a rectangular cantilever corresponds to that of a beam which is
clamped on one side and free on the other side. The cantilever has different types of
vibrational modes such as flexural, torsional, and lateral vibrations. The resonance
characteristics of each mode depend on the material properties, i.e. Young’s modulus, Poisson
ratio, density, shear modulus, and the dimension of the cantilever beam. By means of
continuum elasticity theory, the frequency response of the cantilever beam can be calculated.
We assume that the cantilever is oriented along the x-axis and the z-axis is the out-of-plane
component. The boundary conditions are set to accordingly for the point where the cantilever
is actuated by a sinusoidal displacement (Figure 10). The equation of motion in torsional
resonance mode is governed by the following partial differential equation
2 2
2 2
( , ) ( , ) ( , )p air
x t x tGJ I x tx t
θ θρ γ∂ ∂ ∂= +
∂ ∂ tθ
∂ . (1)
Here, θ is the twist angle of the torsion, G is the shear modulus, ρ is the mass density, Ip is the
polar area moment of inertia, and γair is the viscous damping coefficient of the surrounding
air. Since the cantilever is harmonically vibrated by a chip under the holder, we assume that
θ(x,t)=Θ(x)exp(iΩt). Putting this into equation (1) leads to [68]
22
2
( ) ( /( ) /( )) ( )p aird x I GJ i GJ x
dxρ γΘ
+ Ω − Ω Θ = 0 . (2)
Due to the lateral visco-elastic force at the end of the sensor tip, the boundary condition can
be written as,
0 0
' 2
( )
( ) ( ) ) ( )
x
x L lat lat
x
x k i l x
θ
η ω
=
=
Θ =
Θ = − + Ω Θ . (3)
Using the boundary conditions of equation (3), we can solve equation (2) in order to calculate
the torsional angle of the cantilever by using the frequency response function of the cantilever
at the end of the cantilever where the tip is located
29

0( ) ( )x L H θΘ = = Ω (4)
2 2
2 2 2 2
2 exp( )( )
(1 exp(2 )) ( 1 exp(2 )) ( )lat lat
i i L GJH
i i L GJ i L l k i
α β α βω
α β α β α β
− + − +=
− + + − + + − + − + + η ω
J
,
where and2 2 /( )pI Gα ρ= Ω /( )air GJβ γ= Ω .
The torsional amplitude and phase of the cantilever are given as [68]
0hA H θ= and [ ])(Ω= HArgumentϕ .
Figure 9: The calculated amplitude of the torsional oscillation for the free and surface coupled
interaction for klat=60N/m, 120N/m with ηlat=2.5e-7 Ns/m.
Dynamic atomic force microscopy utilizes changes of the cantilever frequency response
(oscillation amplitude, resonance frequency, and phase) to reveal surface properties.
Therefore, numerical simulations and analytical calculations are needed to interpret the
measured surface properties quantitatively.
Figure 9 shows the calculated amplitude of the torsional vibration for the free and the surface
coupled case. The amplitude of the torsional vibration decreases with an increase of the lateral
stiffness of the tip-sample contact (i.e. stiffer interaction). A large in-plane stiffness leads to a
large frequency shift. In order to extract in-plane surface mechanical properties such as lateral
contact stiffness, the resonance shift can be used as an experimental parameter. However, in
30
the analytical formulae discussed in this section, the torsion axis has been assumed to be
constant. The effect of the shift of the torsional axis due to surface coupling has not been
included. Nevertheless, the parametric calculation of the frequency response of the cantilever
in torsional vibration gives us a quantitative understanding of the dynamics and the changes
due to the tip-surface interaction. In the next section, we model the system by a finite element
method (FEM) to calculate the frequency response in a more accurate way.
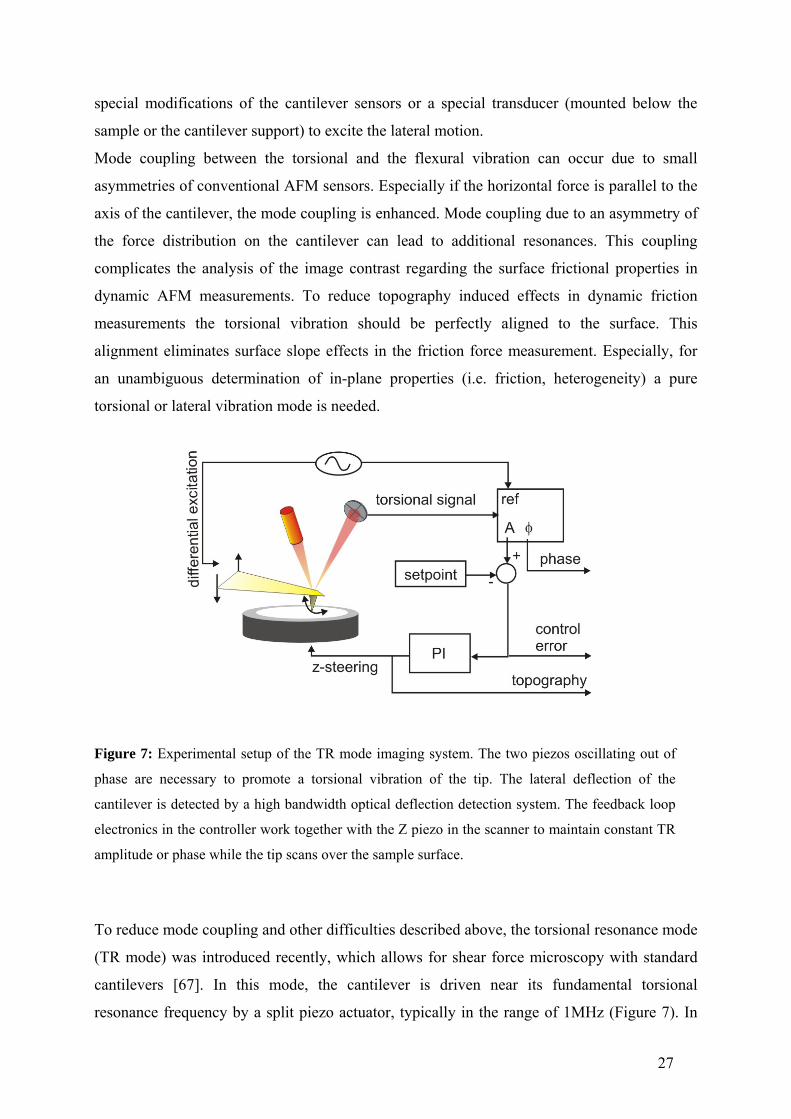
3.2. Numerical Simulations In order to account for the real cantilever shape and the distributed force used to excite the
vibration, we employed a numerical model. To evaluate the torsional frequency response of
the cantilever, a finite element (FE) model of a typical cantilever was implemented using
tetrahedral mesh elements (COMSOL 3.2 / FemLab 3.2 (FEMLAB GmbH, Göttingen,
Germany) with the parameters: length L=250μm, with b=40μm, thickness h = 3µm, tip length
l=15µm, Young’s modulus =169 GPa, Poisson’s ratio vTE t = 28, and density ρ = 2330kg/m3.
)(*0 φω += tCosFF
Cantilever HolderChip
( )tx,θ
ηKlat
Piezo
)(*0 φω += tCosFF
Cantilever HolderChip
( )tx,θ
ηKlat
Piezo
Cantilever HolderChip
Cantilever HolderChip
( )tx,θ
ηKlat
Piezo
Figure.10: Schematic diagram of the torsionally excited cantilever in visco-elastic interaction.
Two piezo actuators oscillating out of phase are necessary to promote a torsional vibration of the
tip. The torsional movement of the piezos are transferred into the cantilever by the chip below the
holder.
31
A rectangular cross section of the beam was assumed. The rectangular flexure of the
cantilever ends in a triangle at the very end of the cantilever, which resembles the actual shape
of the cantilever used in experiments. The conical tip was located at the connection of the
rectangular beam and the triangular end (at =220L mμ ). A mesh refinement was performed
in order to check the convergence of the solution. The interaction related parameters of the
silicon tip and the graphite sample are: H=2.96x10⁻¹⁹J, Re (G*) =4.2 GPa, Re (E*) =10.2 GPa,
η = 8 x10⁻⁷ Ns/m and a0=0.38 nm. The beam was assumed to be under a forced interaction at
the probe end and clamped at the other end (see Figure 10). Dynamic frequency response
analyses were performed in the frequency range 1<ƒ<7 MHz to obtain the relation between
the TR excitation frequency and the displacement amplitude in transverse and perpendicular
direction. In order to make the model more realistic, Rayleigh damping is used for the modal
analysis which includes mass-proportional and stiffness-proportional viscous damping. The
matrix of the Rayleigh damping is given as
C M Kη δ= + .
In the mode superposition analysis the damping matrix should have following properties in
order to lead to uncoupled modes:
2 Tn n n nCω ξ ϕ ϕ= , 22 n n nω ξ η δω= + .
Due to the orthogonality of the mass and stiffness matrices, this equation can be written as
1
1 1
22
2
12 21
2 2
ωω ξη
ξω δω
⎡ ⎤⎢ ⎥ ⎡ ⎤⎡ ⎤⎢ ⎥ = ⎢ ⎥⎢ ⎥⎢ ⎥ ⎣ ⎦ ⎣ ⎦⎢ ⎥⎣ ⎦
.
Only two frequencies are necessary in order to solve the equation for η and δ . We choose two
frequencies around each eigenmode for the frequency response simulation of the cantilever
(as shown in Figure 11).
32
0 1·10106 1.51.5·10106 2·10106 2.52.5·10106 3·101060
0.00010.0001
0.00020.0002
0.00030.0003
0.00040.0004
0.00050.0005
0.00060.0006
0.00070.0007
eigenfrequency (Hz)
Dam
pin
g ra
tio
δ=0
η=0
1ω 2ω0.50.5·10106
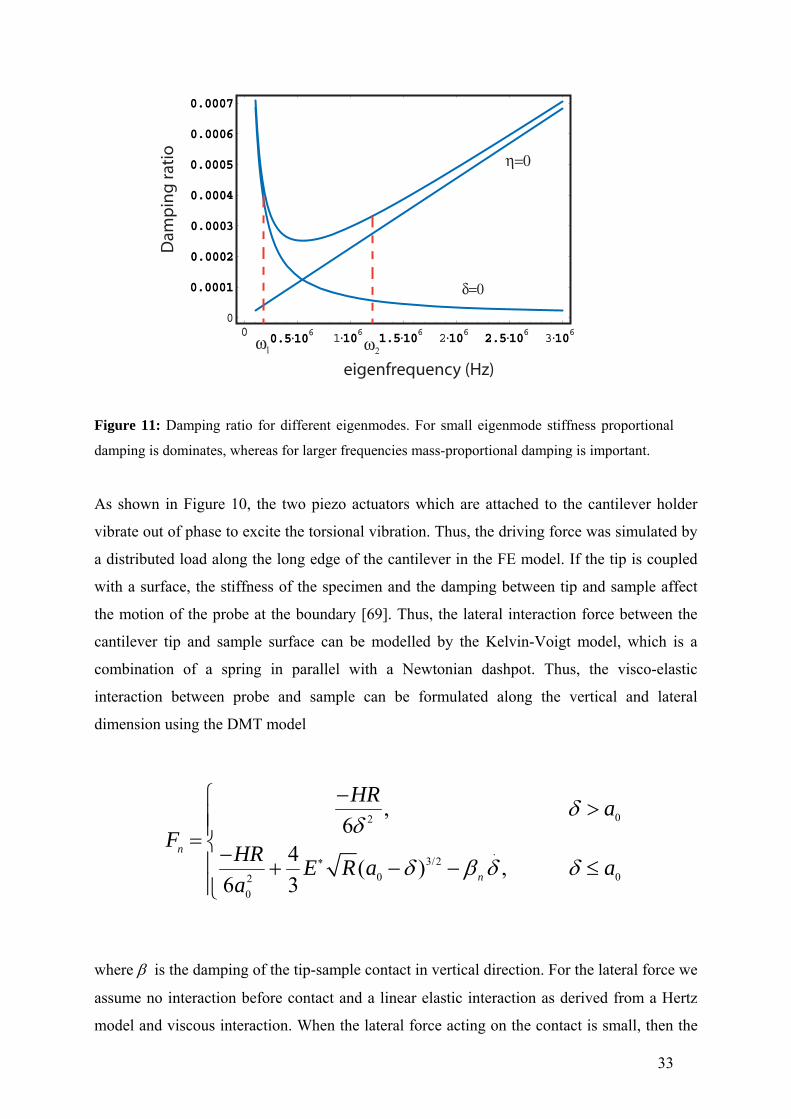
Figure 11: Damping ratio for different eigenmodes. For small eigenmode stiffness proportional
damping is dominates, whereas for larger frequencies mass-proportional damping is important.
As shown in Figure 10, the two piezo actuators which are attached to the cantilever holder
vibrate out of phase to excite the torsional vibration. Thus, the driving force was simulated by
a distributed load along the long edge of the cantilever in the FE model. If the tip is coupled
with a surface, the stiffness of the specimen and the damping between tip and sample affect
the motion of the probe at the boundary [69]. Thus, the lateral interaction force between the
cantilever tip and sample surface can be modelled by the Kelvin-Voigt model, which is a
combination of a spring in parallel with a Newtonian dashpot. Thus, the visco-elastic
interaction between probe and sample can be formulated along the vertical and lateral
dimension using the DMT model
02
.3/2
0 020
,6
4 ( ) ,6 3
n
n
HR aF HR E R a a
a
δδ
δ β δ δ∗
−⎧ >⎪⎪= ⎨−⎪ + − −⎪⎩
≤
where β is the damping of the tip-sample contact in vertical direction. For the lateral force we
assume no interaction before contact and a linear elastic interaction as derived from a Hertz
model and viscous interaction. When the lateral force acting on the contact is small, then the
33

contact lateral stiffness can be approximated as [12, 13] 8latk aG∗= , where a is the contact
radius, and G* is the effective shear modulus. This equation is independent of the nature of the
tip-sample interaction forces and is valid for different continuum elasticity models. This is a
reasonable approximation, since the contact area does not change with the lateral force for a
constant normal load. In the lateral direction, a modified damping model can be employed to
account for the energy dissipation due to the lateral tip-sample interaction
0
.
0
0,
8 ( ) ,lat
latlat lat
aF
G R a
δ
δ β δ∗
>⎧⎪= ⎨− Δ − Δ⎪⎩ ≤
with [ ] 1(2 ) (2 ) )t t s sG v G v G −∗ = − + − . Here, Gt and Gs are the shear moduli of tip and
sample, respectively. The lateral interaction force is a nonlinear function of the normal contact
force [68]. In the linearized approximation, where the tip is oscillating about an equilibrium
position above the sample surface, the interaction force can be written as
.
n n n nF k β n= − Δ − Δ , .
lat latlat lat latF k β= − Δ − Δ .
The dissipative tip-sample force is modelled by considering the damping of the medium and
the indentation rate (or strain rate in lateral motion) as used in Ref. [70]. In the attractive
(δ0>a0) and the repulsive (δ0<a0) regimes, the normal, and the lateral contact stiffness are
derived as
0
0 030
0 0 0
,3
2 ( ),
nn
HR afkE R a aδ δ
δδ
δδ δ= ∗
−⎧ >∂ ⎪= − = ⎨∂ ⎪0− ≤⎩
and
0
0 0
0 0
0
8lat
lat
aFkG R aδ δ
δ
δ δ δ∗=
>⎧∂ ⎪= − = ⎨∂ 0≤⎪⎩.
34

3.3. Simulation Results The results of the finite element simulation shown in Figure 12 reveals that in contrast to the
other imaging modes, such as vertical bending mode AFM, the neutral axis of the cantilever is
mainly parallel to the sample surface. This means that the vertical tip-sample distance remains
constant during the torsional oscillation cycle. The non-linear tip-sample interaction has no
significant effect on the torsional oscillation of the cantilever. Therefore, torsion mode AFM
is highly sensitive to the in-plane surface properties.
(a)
(b)
Figure 12: Finite element simulation of the amplitude (a) and the phase (b) distribution of the first
eigenmode of a rectangular cantilever beam in torsional oscillation. The finite-element simulations
were carried out for a rectangular cantilever with a thickness of 3μm and a length of 250μm. The
first torsional resonance frequency is 1.178 MHz. The colours correspond to the displacement
amplitude. The finite-element simulations were processed with FemLab3.2 by using
approximately 7600 tetrahedral mesh elements.
Figure 13: Simulated resonant frequency of the first torsional vibration mode versus the lateral spring
constant of the tip-surface contact. The inset shows the motion of the cantilever-tip system for the
weak and strong interaction region.
35

In order to investigate the sensitivity of the torsional mode AFM to the in-plane elasticity, we
plot the resonance of the first torsional eigenmode of the cantilever as a function of the shear
stiffness klat (Figure 13). A change in tip-sample stiffness leads to a shift of the resonant
frequency together with a change in oscillation amplitude. In the case of a weak interaction
(i.e. small klat), the tip can be assumed as freely vibrating. In the range of klat = 10 N/m
to 104 N/m the eigenfrequency of the lateral vibration is highly sensitive (slope of the curve
increases) to the shear stiffness. The resonant frequency of the first mode shows an increase in
the range klat = 10 N/m to 104 N/m. Consequently, the resonant frequency of the first mode is
useful for characterizing samples with klat = 10 N/m to 104 N/m. By increasing the tip-sample
stiffness to a higher value, the tip of the cantilever is increasingly pinned to the sample
surface. Here, the tip of the cantilever cannot move anymore, and the cantilever has to
laterally bend back and forth. The frequency shift can be used to image the elastic properties
of the sample surface [71]. Thus, in order to measure this frequency shift caused by
conservative tip-sample interaction, we operate the torsional resonance mode in frequency
modulation feedback.
36
4. Experimental Results In chapters 4.2, 4.3, 4.4, and 4.5 results that have already been published are briefly
described. Chapters 4.6 and 4.7 show recent results which have been submitted to peer
reviewed journals together with additional data which could not be included in the papers.
The complete manuscripts are attached in appendix 1.
4.1. Frequency modulated torsional resonance mode AFM
(FM-TR-AFM) In this section, we demonstrate the implementation of a frequency modulation feedback to a
torsional resonance mode AFM. A Dimension 3100 atomic force microscope with a
NanoScope IV controller was used for the experiments. The instrument was equipped with a
cantilever holder for torsional resonance mode (Veeco Metrology Inc., Santa Barbara, CA). A
TR-mode cantilever holder contains two dither piezos driven out of phase in order to induce
torsional oscillations of the cantilever. Using an external phase-locked-loop unit (Easy PLL
plus detector and controller, Nanosurf AG, Liestal, Switzerland) through a signal access
module (SAM), a frequency modulation feedback was realized. All functionality of the FM-
detector is controlled through the easyPLL plus software, which is installed on a PC. The FM
unit was connected to the microscope controller via a signal access module (SAM), as shown
in Figure 14 and Figure 15. The microscope controller was set to ‘contact mode’ operation,
while the excitation of the cantilever and the feedback signal were provided by the external
electronics. Tracking of the resonant frequency was achieved by the PLL unit, while an
automatic gain control (AGC) kept the oscillation amplitude constant (CA-Mode). The
frequency shift was used as control signal for the z-feedback loop in constant frequency shift
mode. Using the FM technique, both frequency shift and energy dissipation can be mapped to
topographic surface features under ambient conditions. Typically, in FM AFM, the oscillation
amplitude of the cantilever is maintained by an automatic gain control (AGC). The shift in
resonance frequency is used for topographic feedback regulation, while the output of the AGC
provides a measure for energy dissipation. Silicon cantilevers with a flexural resonance
frequency of 117 kHz were used for the measurements (ZEIHR Nanosensors, Neuchatel,
Switzerland). The spring constant obtained by standard calibration procedures was 19 N/m
[72]. The resonance frequency of the first torsional eigenmode was typically around 910 kHz.
37

Due to the limited bandwidth of the controller, only cantilevers with a torsional resonant
frequency smaller than 1MHz can be used with this set up.
Figure 14: Scheme of the feedback circuit for torsional resonance mode in frequency modulation.
The torsional vibration of the cantilever was measured as the lateral deflection signal of the
segmented photodiode. The signal was amplified, phase shifted, and connected to the dither piezos
for positive feedback. The frequency shift – mainly induced by conservative tip-sample interaction
– is used for distance regulation. An automatic gain control (AGC) keeps the oscillation amplitude
constant. Thus, the AGC error output corresponds to the local energy dissipation.
Figure 15: The laboratory pictures of the frequency modulated torsional resonance mode AFM.
The instruments used in the experimental setup are shown.
38

4.2. Response of a laterally vibrating nanotip to surface forces4
In this work we try to understand the frequency response of the laterally vibrating nanotip to
visco-elastic interaction forces at the surface. We studied the effect of viscosity and lateral
contact stiffness on the detuning (frequency shift), amplitude, and phase response
numerically. Figure 16 shows the calculated frequency response of the amplitude of a freely
oscillating AFM cantilever. For small oscillations, the amplitude is proportional to the twist
angle. The phase shift remains in the range between 0° and 360°. A lateral bending mode can
also be excited (asterisk). Due to symmetry breaking by the tip, the torsional vibration of the
cantilever can be coupled to the bending mode. To verify the theoretical considerations, a
torsion mode AFM was operated in frequency modulation feedback scheme. We perform an
experiment to measure the correlation of the surface tilt-angle with the detuning of the
torsional oscillation. Depending on the tilt angle between the specimen and the torsional
oscillation plane, the approach and the retract cycles reveal a negative detuning of the
torsional resonant frequency at close approach to the surface. The numerical simulation based
on the finite element method (FEM) together with the experimental results explain the
fundamental mechanism of the z feedback in frequency modulated torsional resonance mode
AFM (FM-TR-Mode).
*
Figure 16: Frequency response of the torsionally vibrated rectangular cantilever beam. Torsional
frequency response of the freely vibrating cantilever as obtained by finite element analysis.
Amplitude response (red, solid) and phase response (black, dash). The asterisk indicates the lateral
bending resonance.
4 A. Yurtsever et al., Applied Physics Letters (APL), 91, 253120 (2007)
39
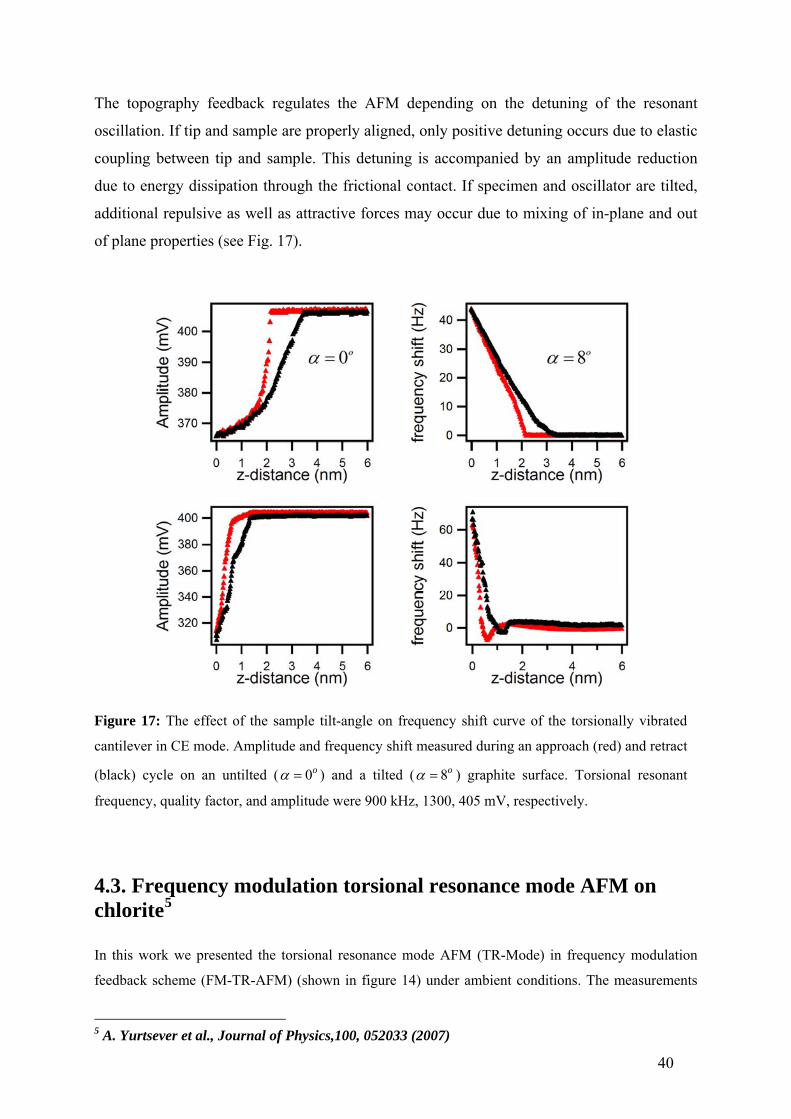
The topography feedback regulates the AFM depending on the detuning of the resonant
oscillation. If tip and sample are properly aligned, only positive detuning occurs due to elastic
coupling between tip and sample. This detuning is accompanied by an amplitude reduction
due to energy dissipation through the frictional contact. If specimen and oscillator are tilted,
additional repulsive as well as attractive forces may occur due to mixing of in-plane and out
of plane properties (see Fig. 17).
Figure 17: The effect of the sample tilt-angle on frequency shift curve of the torsionally vibrated
cantilever in CE mode. Amplitude and frequency shift measured during an approach (red) and retract
(black) cycle on an untilted ( ) and a tilted (0oα = 8oα = ) graphite surface. Torsional resonant
frequency, quality factor, and amplitude were 900 kHz, 1300, 405 mV, respectively.
4.3. Frequency modulation torsional resonance mode AFM on chlorite5
In this work we presented the torsional resonance mode AFM (TR-Mode) in frequency modulation
feedback scheme (FM-TR-AFM) (shown in figure 14) under ambient conditions. The measurements
5 A. Yurtsever et al., Journal of Physics,100, 052033 (2007)
40
in frequency modulation allow the characterization of both dissipative (frictional) and elastic
(conservative) properties of the specimen. In order to test the capabilities of the system a clinochlore
(pennine) specimen (Mg,Fe2+)5Al[(OH)8|AlSi3O10] from Rimpfischwäng, Zermatt, Switzerland
(Sample #17984 of the Bavarian Mineralogical State Collection, Munich) was cleaved for the
investigation. The mineral belongs to the chlorite group of phyllosilicates. It consists of alternating T-
O-T (tetrahedral-octahedral-tetrahedral) and brucite-like layers. The T-O-T layer corresponds to
phlogopite mica. The brucite-like surface exhibits OH groups and is slightly positively charged as
compared to the mica-like layer which presents oxygen at the surface. The step height is 0.5 nm for a
brucite-like layer and 1 nm for a T-O-T layer.
This structure was investigated in order to demonstrate the dissipation measurement
capabilities of the frequency modulation feedback in torsional mode AFM. The frequency
shift provides information on the conservative interaction, while the dissipation signal also
contains information on energy loss. Figure 18 displays the simultaneously measured maps of
(a) topography, (b) frequency shift, and (c) energy dissipation as measured with the AGC
feedback signal of the PLL on the chlorite surface. The experimental data were obtained in a
constant amplitude (CA-Mode) operation mode of the FM-TR-AFM. A cross-section of the
topographic data shows that the triangular shapes are brucite flakes with a typical step-height
of 0.5nm. As control parameter, the frequency shift has been used. Thus, image (b) only
reveals a uniform contrast with only small changes of the detuning at the surface steps. The
excitation signal of the piezo represents the energy needed to keep the torsional amplitude
constant and, thus, gives a measure for the dissipated energy. The dissipation signal leads to a
clear contrast of the different domains on the chlorite surface. In addition to the different
mechanical properties of the brucite and T-O-T layers of the crystal, these are also charged
differently.
The combination of atomic force microscopy and the Kelvin probe force microscopy (KPFM)
[73] is a useful tool to obtain a high resolution map of the electrical surface potential. The
measurements of surface potential distribution show a clear chemical contrast for the region
of the chlorite surface which has a different charge density (see the image of the surface
potential in Figure 19 (b)). This surface charge density also influences the interaction between
the tip and the surface due to the corresponding change in surface potential.
41

(a) (b) (c)
Figure 18: (a) A topographic image acquired using the frequency shift detuning feedback loop for the
z-control. Image (b) shows the frequency shift. Image (c) shows the lateral mapping of the excitation
amplitude of the piezo which measured simultaneously with topography on a chlorite surface in
ambient air. Below the images, cross sections extracted from the images along the line drawn on the
images are shown.
From the dissipation line trace, it is obvious that the oscillator loses more energy on the
brucite flakes than on the T-O-T layer. This dissipative contrast might be due to different
wetting properties of the respective surfaces or due to differences in the elemental friction
processes at the atomic scale. The experimental results show that surfaces with different
chemical properties or different surface charge densities can be discriminated in the
dissipation signal while measuring the surface topography under ambient conditions.
42

(a) (b)
Figure 19: (a) The topography of the chlorite surface in Kelvin probe force microscopy (KPFM). (b)
The surface potential image of the same surface. Corresponding profiles of the line drawn on the
images are shown below the corresponding image.
4.4. Frequency modulated torsional resonance mode AFM on polymers6
Polymers are very important materials and have many applications, especially as protective
coatings, for lubrication, or as biocompatible materials. Thermal properties of the polymer
thin films such as the glass transition temperature (Tg), and the visco-elastic behaviour of the
interface are the main parameters determining functionality and performance of such surfaces.
Since structural properties of interfaces and surfaces determine the functionality of polymer
films, the investigation of surface and bulk mechanical properties is of great importance.
Hence, one needs to understand precisely how the surface differs from the bulk, both
structurally and dynamically.
Here, we apply the FM-TR-mode AFM to study the surface nanomechanics of thin polymer
films using displacement curves in AFM spectroscopy. In contrast to classical resonant
6A. Yurtsever et al., Applied Physics Letters (APL), 92, 143103 (2008)
43
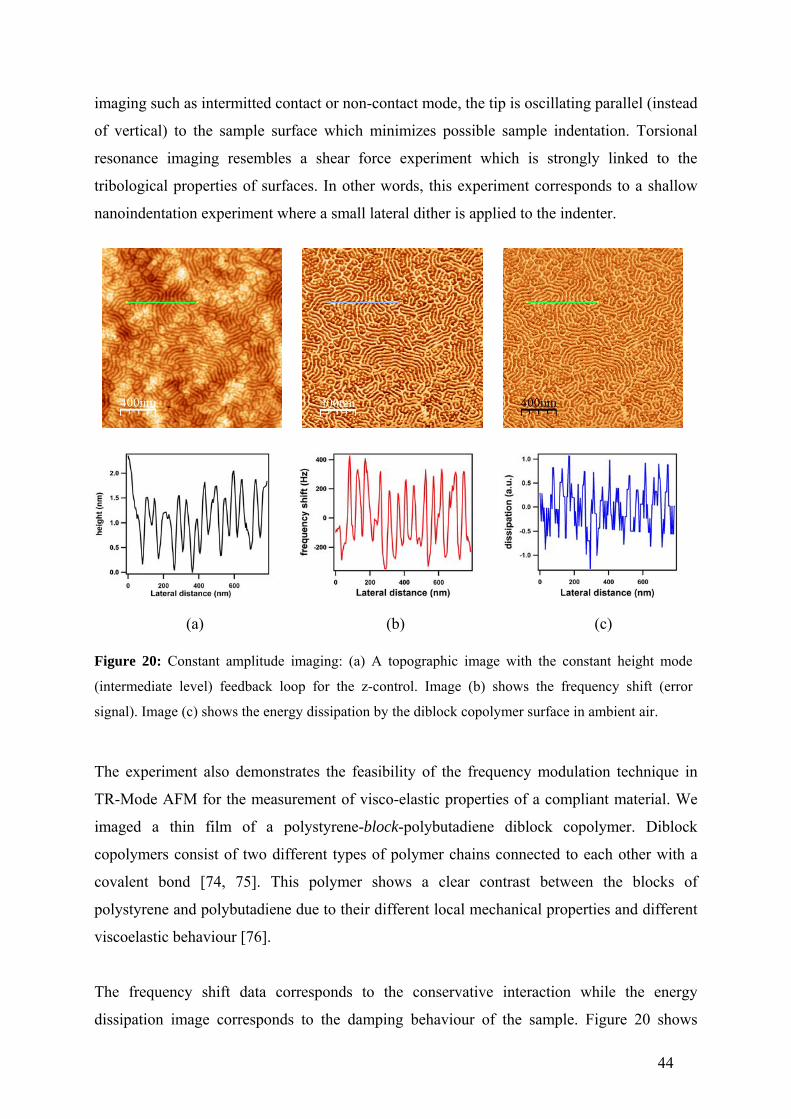
imaging such as intermitted contact or non-contact mode, the tip is oscillating parallel (instead
of vertical) to the sample surface which minimizes possible sample indentation. Torsional
resonance imaging resembles a shear force experiment which is strongly linked to the
tribological properties of surfaces. In other words, this experiment corresponds to a shallow
nanoindentation experiment where a small lateral dither is applied to the indenter.
(a)
(b)
(c)
Figure 20: Constant amplitude imaging: (a) A topographic image with the constant height mode
(intermediate level) feedback loop for the z-control. Image (b) shows the frequency shift (error
signal). Image (c) shows the energy dissipation by the diblock copolymer surface in ambient air.
The experiment also demonstrates the feasibility of the frequency modulation technique in
TR-Mode AFM for the measurement of visco-elastic properties of a compliant material. We
imaged a thin film of a polystyrene-block-polybutadiene diblock copolymer. Diblock
copolymers consist of two different types of polymer chains connected to each other with a
covalent bond [74, 75]. This polymer shows a clear contrast between the blocks of
polystyrene and polybutadiene due to their different local mechanical properties and different
viscoelastic behaviour [76].
The frequency shift data corresponds to the conservative interaction while the energy
dissipation image corresponds to the damping behaviour of the sample. Figure 20 shows
44

simultaneously measured maps of (a) topography, (b) frequency shift, and (c) energy
dissipation on the diblock copolymer surface. Data were obtained in a constant amplitude
(CA-mode) operation of the setup with a small loop gain (constant height mode), so that the
frequency shift image also gives information for the surface properties. Measurements of the
frequency shift and energy dissipation for compliant samples such as the diblock copolymer
reveal highly detailed contrast between the different polymer phases. Since the cantilever is
oscillating with a small amplitude (below 2 nm), a parallel motion above the surface is a
reasonable assumption. Thus, the map of energy dissipation is directly related with the in-
plane frictional properties. Since the polystyrene (PS) part of the diblock copolymer is the
stiffer segment compared to the polybutadiene block, it appears higher in the topography
image. In the dissipation image the contrast is inverted with respect to the topography images.
Since the PBd block is more viscoelastic compared to the PS block, more mechanic
deformation energy is turned into heat. Thus, the PBd domains appear brighter in this image.
In order to assess the nature of the tip-surface interaction and effect of the polymer chain
length, distance curves were measured for different PS homopolymers (Mw = 34.3 kg/mol,
119.6 kg/mol, and 354.0 kg/mol) as shown in Fig. 21. For all specimens, two regimes were
observed in the displacement curves: Firstly, a rather compliant surface layer was probed;
secondly, the less mobile bulk of the polymer was sensed by the oscillatory motion of the tip.
The position of the kink between the two regimes strongly correlates with the molecular
weight of the homopolymer.
We investigated frequency shift versus distance curves on polystyrene, which revealed two
different interaction regimes. Depending on the molecular weight, we observed a distinct
change in the signature of the distance curves. Hence, we propose a stratified structure due to
the segregation of shorter chains and, thus, the resulting two layer behavior. Our findings
show that FM-TR-mode spectroscopy enables discerning of polymer samples by their
different molecular weight. Frequency modulation in torsional resonance mode atomic force
microscopy (FM-TR-AFM) is a powerful tool for imaging polymeric samples with spatially
varying mechanical properties. The indentation experiments clearly show that the tip is
oscillating within the motile top layer of the polymer surface even for detuning on the order of
ten Hertz. For the diblock copolymer, this means that while imaging in FM-TR-AFM the tip
is also compressing the different polymer blocks according to their compliance.
45

Figure 21: Detuning versus distance plots of the torsional oscillation acquired in CE-mode on PS
homopolymers with Mw = 34.3 kg/mol (black), 119.6 kg/mol (blue), and 354.0 kg/mol (red). The
inset shows a typical displacement curve on PS (119.6 kg/mol) with frequency shift and amplitude of
the lateral oscillation as a function of z-actuator displacement. Approach (red) and retract (black) are
also indicated by the arrows.
4.5. Acoustical force nanolithography of thin polymer films7
In this work, we discuss ‘acoustic force lithography’, a surface machining method based on
the AFM. Nanomachining of thin polymer films with an atomic force microscope (AFM) is a
promising route for the fabrication of nanoscale devices. In order to enhance the
controllability of the nanomachining process an in-plane acoustic wave is coupled to the
sample support. Thus, in this experiment the sample is excited to a lateral vibration while the
tip remains fixed. This technique enhances the force exerted by the AFM tip. A precise
control can be achieved by tuning the excitation frequency and amplitude of the excitation
acoustic wave. The feasibility of the method along with the characterization of the main
parameters was illustrated by lithography of a thin resist film.
7 Rubio-Sierra, FJ; Yurtsever, A; Hennemeyer, M, et al., PHYSICA STATUS SOLIDI A, 203, 1481 (2006)
46

(a)
(b) (c)
Figure 22: Nanostructures generated by acoustical force nanolithography: (a) lithographed emblem of the Ludwig-Maximilians-Universität. (b) AFM image of four 4 µm long lines lithographed using a signal amplitude of 0.5 V at a frequency of 740 kHz for acoustic wave generation, with an average tip-sample distance of 12.7 nm. Image size (4x4 µm) and z range of 55.6 nm. (c) Line profile along the line in panel b.
Due to the reduced physical dimensions of the AFM tip and precise positioning and force
control provided by acoustic force nanolithography, lateral dimensions of the lithographed
traces are reduced even beyond light diffraction limit. Here, the influences of the main
parameters are studied in detail in acoustic force nanolithography. Figure 22 shows two
lithographed structures demonstrating the feasibility of the method for the generation of
nanostructures. Fig. 22 (a) shows the lithographed emblem of the Ludwig-Maximilians-
Universität. Fig. 22 (b) and (c) show the AFM image and height profile of four lithographed
lines with a length of 4 µm. The average line width at FWHM was 50 nm. The parameters
were chosen to reach a line depth greater than 20 nm. Using an in-plane acoustic wave
coupled to the sample surface decreases the debris on the pattern of the lithographed
structures.
47
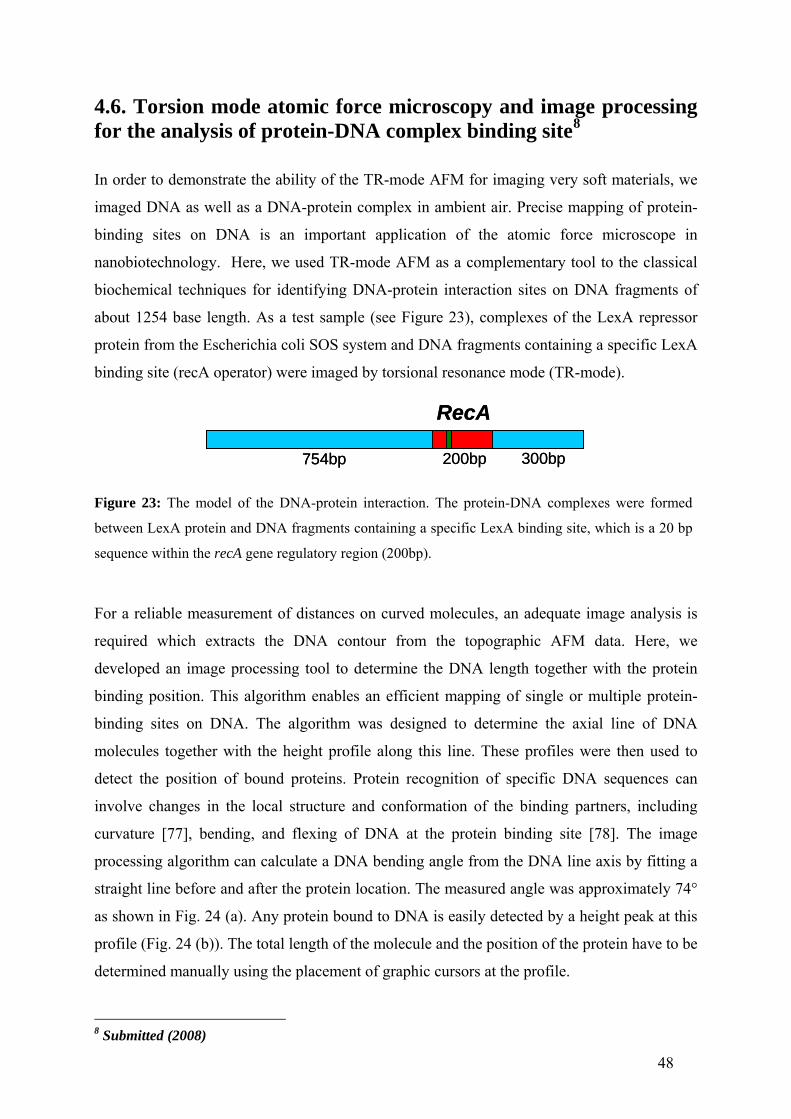
4.6. Torsion mode atomic force microscopy and image processing for the analysis of protein-DNA complex binding site8
In order to demonstrate the ability of the TR-mode AFM for imaging very soft materials, we
imaged DNA as well as a DNA-protein complex in ambient air. Precise mapping of protein-
binding sites on DNA is an important application of the atomic force microscope in
nanobiotechnology. Here, we used TR-mode AFM as a complementary tool to the classical
biochemical techniques for identifying DNA-protein interaction sites on DNA fragments of
about 1254 base length. As a test sample (see Figure 23), complexes of the LexA repressor
protein from the Escherichia coli SOS system and DNA fragments containing a specific LexA
binding site (recA operator) were imaged by torsional resonance mode (TR-mode).
754bp 200bp 300bp
RecA
754bp 200bp 300bp
RecA
Figure 23: The model of the DNA-protein interaction. The protein-DNA complexes were formed
between LexA protein and DNA fragments containing a specific LexA binding site, which is a 20 bp
sequence within the recA gene regulatory region (200bp).
For a reliable measurement of distances on curved molecules, an adequate image analysis is
required which extracts the DNA contour from the topographic AFM data. Here, we
developed an image processing tool to determine the DNA length together with the protein
binding position. This algorithm enables an efficient mapping of single or multiple protein-
binding sites on DNA. The algorithm was designed to determine the axial line of DNA
molecules together with the height profile along this line. These profiles were then used to
detect the position of bound proteins. Protein recognition of specific DNA sequences can
involve changes in the local structure and conformation of the binding partners, including
curvature [77], bending, and flexing of DNA at the protein binding site [78]. The image
processing algorithm can calculate a DNA bending angle from the DNA line axis by fitting a
straight line before and after the protein location. The measured angle was approximately 74°
as shown in Fig. 24 (a). Any protein bound to DNA is easily detected by a height peak at this
profile (Fig. 24 (b)). The total length of the molecule and the position of the protein have to be
determined manually using the placement of graphic cursors at the profile.
8 Submitted (2008)
48

Figure 24: Topographic images of protein-DNA complexes obtained by TR-mode (Full scale:
1.2 nm). (a) Overview. (b) The arrow indicates a LexA protein dimer bound to DNA. The cross
represents the initial custom chosen location which defines the molecule of interest
(a)
470
460
450
440
430
420
410
Pix
el n
umbe
r (y)
240220200180
Pixel number (x)
(b)
Figure 25: Analysis of the DNA in Fig. 24 (b) (a) The bending angle at the protein binding
site is calculated by fitting a line at the protein location (74°). (b) Height profile along the
axis. The arrow delimits the molecule and the dashed line defines the protein at 721 nm.
49
For the molecule shown in Fig. 24, the total length was 812 nm and the protein binding site is
located at 93 nm from the nearest end. Although, the relation between operating conditions
and measured topographic height of DNA remains to be clarified we have proven that the
contrast makes shear force imaging a valuable tool for protein-DNA complex studies
4.7. Amplitude modulation torsional resonance mode AFM (TR-
mode) on Graphite
In order to evaluate the capabilities of an amplitude modulation feedback in torsional
resonance mode AFM (TR-mode) for surface topography imaging and to determine the
sensitivity of phase measurements, we used freshly cleaved highly oriented pyrolytic graphite
(HOPG) surfaces [79-82]. In Fig. 26, the images of topography (a) and TR phase (b) on a
HOPG surface are shown. The HOPG terrace and step structures can be resolved clearly in
the height and phase images. Due to environmental humidity, a water layer can condense on
material surfaces. Atomic step edges are generally covered by contaminants or the adsorbed
water layer [79, 83-85]. In the shear force experiment, the damping forces involved in tip-
sample interaction are strongly depending of the surface and the probe wetting properties
[83]. When an AFM probe is approached close to the sample surface, capillary condensation
can occur and a liquid neck can be formed between tip and surface. The strong decrease in the
lateral oscillation amplitude of the cantilever indicates the effects of this thin water layer.
Confinement of the water layer between an AFM tip and the substrate reveals a solid-like
behaviour. Thus, the high phase contrast in TR phase image may be attributed to the effect of
the condensed water on the atomic steps. The additional damping due to the water meniscus
may lead to a higher dissipation and a higher phase contrast in amplitude modulated torsional
mode AFM. This result demonstrates that the torsional resonance amplitude can be used as a
feedback signal to image the low energy HOPG surface in a stable manner and to investigate
edge effects. Especially, for an edge-enhanced surface imaging, TR-mode AFM can be
employed.
50

(a) (b)
Figure 26: (a) TR mode height image of the freshly cleaved HOPG surface. (b) Phase image. The cross sections along the line drawn on images shown below the each image. The scan size is 2μm with a scan rate of 0.6 Hz.
51

5. Conclusions and Future Work The torsional eigenmodes of atomic force microscope (AFM) cantilevers are highly sensitive
to the in-plane material properties of the sample. Frequency modulation feedback in torsional
resonance mode AFM has significantly enhanced the experimental capabilities to probe the
in-plane mechanical properties. With this method, information on lateral chemical
heterogeneities (e.g. different mechanical properties) and visco-elastic dynamics, which result
in different friction coefficients and the dissipative interaction, can be measured and recorded
at the same time with sample topography.
In this thesis, the dynamics of a torsionally vibrated cantilever under a surface coupled visco-
elastic interaction was investigated. The frequency response (i.e., vibration amplitude,
frequency shift, and phase shift) of the system was calculated by employing a finite element
numerical model (FEM). The model includes attractive forces (adhesion), repulsive forces
(elasticity), and damping. The results of these calculations imply that the torsional vibration
amplitude of the cantilever is coupled to the lateral bending mode due to the symmetry
breaking of the cantilever-tip system. This coupling in the cantilever motion complicates the
derivation of the analytical solution for the cantilever frequency response function. The
amplitude of the torsional vibration decreases in a dissipative interaction due to damping of
the system. However, the response of the amplitude shows an increase with the increase in
tip-sample contact stiffness in a purely elastic medium. This result reveals a different
behaviour as compared to a simple harmonic oscillator where the oscillation amplitude
decreases with stiffness. Actually, the variation of the amplitude depends on the measurement
location on the cantilever. Detecting the spectrum at the end of the cantilever edge as in an
optical lever detection system, the amplitude increases due to the shift in torsional vibration
axis (i.e. the slope of the cantilever increases). The amplitude enhancement of the torsional
vibration can be utilized to map the surface elastic properties both in imaging and
spectroscopic application.
To corroborate the numerical findings experimentally, we implement a frequency modulation
feedback to the torsional resonance mode AFM. Hereafter, we call it frequency modulated
torsional resonance mode AFM (FM-TR-AFM). This mode of operation allows for the
measurement of the frequency shift due to conservative tip-sample interaction and energy
dissipation (i.e. damping behaviour) due to the inelastic interaction, simultaneously. The
frequency shift induced by the conservative tip-sample interaction was utilized as a feedback
52

parameter to control the tip-sample distance. To increase the signal to noise ratio and to
decrease coupling between different modes in ambient, a specially designed cantilever holder
was used to excite the cantilever in a pendulum like motion in ambient air with amplitudes in
the order of 1 nm. At such small amplitudes the motion of the cantilever can be considered to
be perfectly parallel to the sample surface. Therefore, the torsional mode AFM is particularly
suitable for probing the surface lateral or in-plane mechanical properties such as friction,
elasticity, and anisotropy under ambient condition. In order to elucidate the effects of the
cantilever oscillation plane on the feedback mechanism of the frequency modulated torsional
resonance mode AFM, approach and retract curves (i.e. displacement curves) were recorded
on a highly oriented pyrolytic graphite surface (HOPG). By operating the system in constant
excitation mode (CE-Mode), the correlation between the frequency shift (detuning) and tilt
angle between the torsional oscillation plane and the specimen is investigated. Clearly, the tilt
between the torsional oscillation plane and specimen leads to an additional negative detuning.
This means that the analysis of the frequency shift and the dissipation images in (FM-TR-
AFM) requires considering the effects of the surface slope or the alignment of the torsional
vibration axis.
The results of the measurement on a compliant material such as diblock copolymer pointed
out that the dissipation signal clearly resolves the different polymer phases due to their
different mechanical properties. A freshly cleaved chlorite surface was investigated to
examine the effects of the surface charge distribution on the dissipation process. The
measurement of the energy dissipation revealed a slight contrast between the brucite-like and
talc-like surfaces. These experimental results show that surfaces with different surface
properties (i.e. friction, stiffness) can be discriminated in the dissipation signal while
measuring the surface topography in ambient.
In summary, the frequency modulated torsional resonance mode AFM is a powerful technique
to investigate in-plane conservative and non-conservative interaction forces simultaneously.
To improve imaging capabilities further, the bandwidth of the frequency detection system
needs to be extended above 1 MHz. To increase the sensitivity in spectroscopic applications,
specially designed AFM cantilevers such as torsional harmonic cantilever (THC) [86] or
special excitation mechanism should be used. Combining the FM-TR-AFM with a Kelvin
probe microscopy (KPM), could provide a tool to characterize the surface in both ways
mechanically and electrostatically. Such a combined measurement of surface potential and
friction would allows us to characterize the surface chemistry of functionalized surfaces.
53

References [1] G. Meyer, and N. M. Amer, Applied Physics Letters 57, 2089 (1990). [2] L. Howald et al., Applied Physics Letters 63, 117 (1993). [3] O. Marti, J. Colchero, and J. Mlynek Nanotechnology 1, 141 (1990). [4] G. Neubauer et al., Review of Scientific Instruments 61, 2296 (1990). [5] D. Rugar, H. J. Mamin, and P. Guethner, Applied Physics Letters 55, 2588 (1989). [6] C. M. Mate et al., Physical Review Letters 59, 1942 (1987). [7] B. Bhushan, H. Fuchs, and S. Hosaka, Book, Applied Scanning Probe Methods, 75 (2002). [8] B. V. Derjaguin, V. M. Muller, and Y. P. Toporov, Journal of Colloid and Interface Science 53, 314 (1975). [9] K. L. Johnson, K. Kendall, and A. D. Roberts, Proceedings of the Royal Society of London Series a-Mathematical and Physical Sciences 324, 301 (1971). [10] D. Maugis, Journal of Colloid and Interface Science 150, 243 (1992). [11] S. P. Jarvis et al., Review of Scientific Instruments 64, 3515 (1993). [12] R. W. Carpick, D. F. Ogletree, and M. Salmeron, Applied Physics Letters 70, 1548 (1997). [13] M. A. Lantz et al., Applied Physics Letters 70, 970 (1997). [14] Y. Pu et al., Langmuir 17, 5865 (2001). [15] K. B. Crozier et al., Applied Physics Letters 76, 1950 (2000). [16] J. Colchero, M. Luna, and A. M. Baro, Applied Physics Letters 68, 2896 (1996). [17] R. M. Overney. et al., Nature 359, 133 ( 1992). [18] M. S. Marcus et al., Physical Review Letters 88 (2002). [19] M. S. Marcus et al., Ultramicroscopy 97, 145 (2003). [20] O. Pfeiffer et al., Physical Review B 65 (2002). [21] G. Binnig, C. F. Quate, and C. Gerber, Physical Review Letters 56, 930 (1986). [22] S. A. C. Gould et al., Journal of Vacuum Science & Technology a-Vacuum Surfaces and Films 8, 369 (1990). [23] N. Oyabu et al., Physical Review Letters 90 (2003). [24] D. Fotiadis et al., Micron 33, 385 (2002). [25] S. Amelio et al., Thin Solid Films 392, 75 (2001). [26] R. Garcia, R. Magerle, and R. Perez, Nature Materials 6, 405 (2007). [27] C. D. Mao et al., Nature 397, 144 (1999). [28] T. R. Albrecht et al., Journal of Vacuum Science & Technology a-Vacuum Surfaces and Films 8, 3386 (1990). [29] G. Meyer, and N. M. Amer, Applied Physics Letters 53, 1045 (1988). [30] S. Alexander et al., Journal of Applied Physics 65, 164 (1989). [31] T. R. Albrecht, and C. F. Quate, Journal of Vacuum Science & Technology a-Vacuum Surfaces and Films 6, 271 (1988). [32] Y. Martin, C. C. Williams, and H. K. Wickramasinghe, Journal of Applied Physics 61, 4723 (1987). [33] R. Erlandsson et al., Journal of Vacuum Science & Technology a-Vacuum Surfaces and Films 6, 266 (1988). [34] G. V. Dedkov, Physica Status Solidi a-Applied Research 179, 3 (2000). [35] M. Radmacher, M. Fritz, and P. K. Hansma, Biophysical Journal 69, 264 (1995). [36] P. K. Hansma et al., Applied Physics Letters 64, 1738 (1994). [37] F. J. Giessibl, Science 267, 68 (1995). [38] T. R. Albrecht et al., in Journal of Applied Physics1991), pp. 668. [39] F. J. Giessibl, and C. F. Quate, Physics Today 59, 44 (2006).
54

[40] Y. Sugimoto et al., Nature Materials 4, 156 (2005). [41] H. J. Butt, B. Cappella, and M. Kappl, Surface Science Reports 59, 1 (2005). [42] R. Garcia, and R. Perez, Surface Science Reports 47, 197 (2002). [43] R. J. Colton, Journal of Vacuum Science & Technology B 22, 1609 (2004). [44] U. D. Schwarz, Journal of Colloid and Interface Science 261, 99 (2003). [45] S. Kitamura, and M. Iwatsuki, Japanese Journal of Applied Physics Part 2-Letters 34, L145 (1995). [46] H. Ueyama, Y. Sugawara, and S. Morita, Applied Physics a-Materials Science & Processing 66, S295 (1998). [47] Y. Sugawara et al., Science 270, 1646 (1995). [48] U. Durig, O. Zuger, and A. Stalder, Journal of Applied Physics 72, 1778 (1992). [49] C. Barth et al., Nanotechnology 17, S128 (2006). [50] F. J. Giessibl, Reviews of Modern Physics 75, 949 (2003). [51] A. A. Farrell et al., Physical Review B 72 (2005). [52] S. Grafstrom et al., Nanotechnology 4, 143 (1993). [53] C. Ascoli et al., Journal of Vacuum Science & Technology B 12, 1642 (1994). [54] V. Scherer, W. Arnold, and B. Bhushan, Surface and Interface Analysis 27, 578 (1999). [55] P. Maivald, H J Butt, S A C Gould, C B Prater, B Drake, J A Guriey, V B Eiings and P K Hansma, Nanotechnology 2, 103 (1991). [56] M. Reinstaedtler et al., Surface Science 532, 1152 (2003). [57] H. U. Krotil, T. Stifter, and O. Marti, Applied Physics Letters 77, 3857 (2000). [58] M. Reinstadtler et al., Applied Physics Letters 82, 2604 (2003). [59] M. J. D'Amato et al., Applied Physics Letters 85, 4738 (2004). [60] T. Drobek, R. W. Stark, and W. M. Heckl, Physical Review B 6404 (2001). [61] A. Caron et al., Applied Physics Letters 85, 6398 (2004). [62] S. P. Jarvis et al., Applied Surface Science 157, 314 (2000). [63] M. F. Crommie, C. P. Lutz, and D. M. Eigler, Science 262, 218 (1993). [64] K. Karrai, and R. D. Grober, Applied Physics Letters 66, 1842 (1995). [65] K. Karrai, and I. Tiemann, Physical Review B 62, 13174 (2000). [66] H. Gottlich et al., Review of Scientific Instruments 71, 3104 (2000). [67] L. Huang, and C. M. Su, Ultramicroscopy 100, 277 (2004). [68] Y. X. Song, and B. Bhushan, Journal of Applied Physics 99 (2006). [69] T. Drobek et al., NEW JOURNAL OF PHYSICS 1, 15.1 (1999). [70] B. Gotsmann et al., Physical Review B 60, 11051 (1999). [71] M. Reinstadtler et al., Journal of Physics D-Applied Physics 38, R269 (2005). [72] J. E. Sader, J. W. M. Chon, and P. Mulvaney, Review of Scientific Instruments 70, 3967 (1999). [73] M. Nonnenmacher, M. P. Oboyle, and H. K. Wickramasinghe, Applied Physics Letters 58, 2921 (1991). [74] F. S. Bates, Science 251, 898 (1991). [75] F. S. Bates, and G. H. Fredrickson, Annual Review of Physical Chemistry 41, 525 (1990). [76] F. Dubourg et al., European Physical Journal E 6, 387 (2001). [77] J. A. H. Cognet et al., Journal of Molecular Biology 285, 997 (1999). [78] M. A. Dyer et al. [79] S. Davy, M. Spajer, and D. Courjon, Applied Physics Letters 73, 2594 (1998). [80] R. Brunner, O. Marti, and O. Hollricher, Journal of Applied Physics 86, 7100 (1999). [81] P. J. James et al., Langmuir 17, 349 (2001). [82] A. Spychalski-Merle et al., Applied Physics Letters 77, 501 (2000). [83] L. Vaccaro et al., Applied Physics Letters 77, 3110 (2000).
55

[84] L. Vaccaro et al., Journal of Microscopy-Oxford 202, 439 (2001). [85] M. Antognozzi, A. D. L. Humphris, and M. J. Miles, Applied Physics Letters 78, 300 (2001). [86] O. Sahin et al., Nature Nanotechnology 2, 507 (2007).
56
Appendix 1. Manuscripts
Response of a laterally vibrating nanotip to surface forces
Applied Physics Letters (APL), 91, 253120 (2007)
Ayhan Yurtsever, Alexander M. Gigler, Eduardo Macias, and Robert W. Stark
57

Response of a laterally vibrating nanotip to surface forcesAyhan Yurtsever, Alexander M. Gigler, Eduardo Macias, and Robert W. Starka
Center for NanoScience (CeNS) and Department of Earth and Environmental Sciences,Ludwig-Maximilians-Universität München, Theresienstrasse 41, 80333 Munich, Germany
Received 28 August 2007; accepted 29 November 2007; published online 20 December 2007
The torsional eigenmodes of atomic force microscope AFM cantilevers are highly sensitive towardin-plane material properties of the sample. We studied the effect of viscosity and lateral contactstiffness on the detuning, amplitude, and phase response numerically. To verify the theoreticalconsiderations, a torsion mode AFM was operated in frequency modulation. During approach andretract cycles, we observed a negative detuning of the torsional resonant frequency close to thesample surface depending on the tilt angle between the tip and the sample. Thus, the tilt has asignificant effect on the imaging process in torsional resonance mode. © 2007 American Institute ofPhysics. DOI: 10.1063/1.2826285
The tribological characterization of nanomaterials re-quires friction measurements with very high sensitivity andresolution as can be provided by an atomic force microscopeAFM. To this end, scanning shear force microscopy1 is avery valuable tool. Several shear force microscopes for mea-surements with AFM cantilevers but different excitationmechanisms have been reported such as overtonemicroscopy,2 combined dynamic mode,3 ultrasonic torsionalcontact resonance spectroscopy,4 or torsional resonancemode using amplitude modulation.5 The common idea is tomeasure changes in the response of the torsional cantileverresonance. In torsional resonance mode, a split piezoactuatordrives the cantilever at its torsional resonance, typically inthe range of 1–2 MHz. This technical approach greatly fa-cilitates shear force microscopy with standard cantilevers.However, coupling of torsional and flexural modes compli-cates an analytic treatment of torsional cantilever vibrations.Thus, finite element analysis is advantageous for the investi-gation of the system dynamics. A three dimensional simula-tion of the torsional resonances clearly showed that flexuralbending and torsional oscillations are coupled due to tip-sample interaction.6
In the following, we investigate the frequency responseof the torsionally vibrating AFM cantilever in order to clarifythe role of the tilt between specimen and plane of oscillation.Understanding the influence of the tip-sample interaction onfrequency response is essential for a quantitative interpreta-tion of data obtained in torsional resonance mode. The cal-culations are corroborated by an experiment under ambientconditions, demonstrating the influence of the tilt angle.
For a vertically oscillating tip, the attractive surface po-tential and viscoelastic sample properties determine the in-teraction forces. van der Waals forces dominate the interac-tion in the attractive regime 0. In the repulsive regime0, forces can be calculated using a Derjaguin-Muller-Toporov model.7 Thus, the vertical tip-sample forces aregiven by
F = − HR/6 − a02 , 0
− HR/6a02 +
4
3E*R3/2, 0. 1
Parameter H is the Hamaker constant, R is the tip radius, isthe indentation depth into the sample, and a0 is a typicalinteratomic distance. Distance parameters are defined in Fig.1a. The elastic modulus of the tip-sample contact is givenby
E* = 1 − t2/Et + 1 − s
2/Es−1, 2
where Et and Es are the elastic moduli and t and s are thePoisson ratios of tip and sample, respectively. Linearization
aAuthor to whom correspondence should be addressed. Electronic mail:[email protected]. Tel./FAX: 49 89 2180-4329/-4334.
FIG. 1. Color online a Parameters used to describe the indentation. b Alaterally vibrating tip interacting with a tilted specimen. c Experimentalsetup of a frequency modulation torsion mode AFM.
APPLIED PHYSICS LETTERS 91, 253120 2007
0003-6951/2007/9125/253120/3/$23.00 © 2007 American Institute of Physics91, 253120-1Downloaded 02 Jul 2008 to 129.187.254.47. Redistribution subject to AIP license or copyright; see http://apl.aip.org/apl/copyright.jsp

for very small vertical oscillations at a given indentation 0leads to the effective tip-sample stiffness
k = −
F
=0
= − HR/30 − a03 , 0 0
2E*R0, 0 0.3
For the lateral force, we assume no interaction before contact0. Within the repulsive regime, we use an elastic inter-action as derived from the Hertz model.8 Thus, we obtain
k" = 0, 0 0
8G*R0, 0 0 4
for the linearized in-plane stiffness. The shear stiffness isG*= 2−t
2 /Gt+ 2−s2 /Gs−1, where Gt and Gs are the
shear moduli and v" denotes an in-plane velocity due to lat-eral oscillations. We assume that the lateral viscous dampingforce is dependent on the strain rate and the damping coef-
ficient in the dissipation process F=. In the model, wehave neglected friction in the noncontact regime which, forexample, can be caused by a liquid neck due to capillarycondensation.
If the lateral oscillations occur with respect to a tiltedspecimen, the in-plane and out-of plane components bothcontribute to the interaction, as illustrated in Fig. 1b
klat = k" cos + k sin ,
knorm = k" sin + k cos . 5
For small angles , the effective lateral force is given by
klat = k" + k. 6
Notably, an attractive elastic interaction may be introducedto the in-plane component, whereas a dissipative componentis added to the normal component due to interfacial friction.Additionally, the elastic contact stiffens. In other words, in-creasing the tilt angle leads to a transition from a purelyfrictional rubbing the surface to a vibroimpact tapping andsliding on the surface regime.
In order to evaluate the response of the cantilever toin-plane surface properties, a finite element FE model of atypical cantilever was implemented in COMSOL 3.2/FEMLAB
3.2 FEMLAB GmbH, Göttingen, Germany, as illustrated inFig. 2a. Tetrahedral mesh elements and the following ge-ometry parameters were used: length L=250 m, width b=40 m, thickness t=3 m, Young’s modulus Et=169 GPa,Poisson’s ratio t=0.28, and density =2330 kg /m3. A rect-angular cross section of the beam was assumed. The beamends in a triangle, which resembles the actual shape of sucha cantilever. The conical tip was located at L=220 m conebase diameter d=12 m, height h=15 m, semiangle=21.8°. Mesh refinement was performed in order tocheck the convergence of the modal solution. Interaction re-lated parameters of the silicon tip and the graphite samplewere H=2.9610−19 J, G*=4.2 GPa, E*=10.2 GPa, =810−7 Ns /m, and a0=0.38 nm. The boundary conditionswere set according to a clamped end at the cantilever chip. Atthe tip end, the mechanical coupling is described by aKelvin-Voigt model assuming a Hookian spring in parallelwith a Newtonian dash pot. Since the response to verticalforce gradients knorm has been discussed on the basis of nu-merical and analytic models,9 we only investigate the effect
of a lateral stiffness klat on the characteristics of the torsionaloscillator.
The driving force was simulated as a distributed load atthe long cantilever edge in the FE model, because, experi-mentally, a split piezoactuator at the cantilever holder wasused to excite the torsional vibration Fig. 1c. Dynamicfrequency response analyses were carried out between 1 and7 MHz. To account for intrinsic damping, Rayleigh dampingwas included, assuming a mass-proportional and stiffness-proportional viscous damping.
Figure 2b shows the calculated frequency response ofthe amplitude of a freely oscillating AFM cantilever. Forsmall oscillation amplitudes, the amplitude is proportional tothe twist angle. The phase shift remains in the range between0° and 360°. A lateral bending mode can also be excitedasterisk. Furthermore, we calculated antiresonances at 4.92and 5.28 MHz. Figure 2c shows the amplitude response ofthe first torsional eigenmode under purely dissipative inter-action. The oscillation amplitude decreases with increasingdamping parameter . Figure 2d shows the results of thecalculation of the amplitude response of the first torsionaleigenmode for different contact stiffnesses klat. With increas-ing tip-sample stiffness, the resonant frequency increases but
FIG. 2. Color online a Geometry of the cantilever as used for the finiteelement analysis. The colors show the shape of the first torsional eigenmode.The circle indicates the base of the conical tip. b Torsional frequencyresponse of the freely vibrating cantilever as obtained by finite elementanalysis. Amplitude response red, solid and phase response black, dash.The asterisk indicates the lateral bending resonance. c Amplitude changedue to increasing damping: =810−7, 410−6, and 810−6 N s /m. dFrequency shift caused by elastic interaction tip-sample stiffness: k=0, 13,and 26 N /m. The inset illustrates amplitude increase on a linear scale.
253120-2 Yurtsever et al. Appl. Phys. Lett. 91, 253120 2007
Downloaded 02 Jul 2008 to 129.187.254.47. Redistribution subject to AIP license or copyright; see http://apl.aip.org/apl/copyright.jsp

the transmission minima stay at the same frequency. Addi-tionally, the torsion angle increase is leading to an increasedamplitude measured by the light lever inset in Fig. 2d.For resonance detuning on the order of 50 kHz, the increasein amplitude is about 0.15% /kHz. This effect is differentfrom a harmonic oscillator where the oscillation amplitudedecreases for an increased stiffness. The change in amplitudecan be neglected for imaging purposes but becomes relevantin torsional spectroscopy applications, where a detuning onthe order of several kilohertz can occur. The physical reasonfor this amplitude increase is the shift of the torsion axis dueto tip-surface coupling. In the case of the free cantilever, theaxis of torsion is close to the cantilever main axis. By in-creasing the tip-sample stiffness to higher values, the tip ofthe cantilever is increasingly pinned to the sample surfaceand the torsional axis intersects close to the pinpoint. Thus,torsion angle, as measured by the light lever, can increasedepending of the actual laser beam adjustment. Addition-ally, tip mass and tip-sample interactions break the twofoldrotational symmetry of the cantilever beam. Such a reducedsymmetry leads to coupling between closely spaced torsionaland bending modes.10 Thus, geometric effects together withmode coupling can help explain the experimental observa-tion that with increasing load onto the specimen, the powerstored in a torsional resonance eigenmode due to thermome-chanical excitation apparently decreases while the measuredoscillation amplitude increases.11
In order to verify the role of sample tilt on the frequencyresponse experimentally, we used a combination of the Di-mension 3100 setup with a NanoScope IV controller VeecoMetrology Inc., Santa Barbara, CA equipped with torsionalresonance mode adapter and probe holder together with aphase-locked-loop Nanosurf Easy PLL Nanosurf, Liestal,Switzerland/Schaefer Technologie GmbH, Langen, Ger-many Fig. 1c. Silicon cantilevers ZEIHR, Nanosensors,Neuchâtel, Switzerland with a typical flexural resonance fre-quency of 117 kHz and a nominal spring constant of27 N /m were used for the frequency modulated torsionalresonance mode AFM FM-TR-AFM measurements. Thetorsional resonance frequency was 910 kHz. The cantileverwas driven using the constant excitation mode where theresponse time is Q limited. A goniometer GN05/M, Thor-labs GmbH, Dachau, Germany was used to change the anglebetween tip and sample.
Figure 3 shows a typical distance curve of torsional reso-nant frequency shift versus the z piezotravel on highly ori-ented pyrolthic graphite. Adjustment of the tilt angle of thesample surface to zero with respect to the cantilever oscilla-tion i.e., oscillation and the surface are parallel, reveals thatlong-range interaction forces have little effect on the tor-sional vibration. However, if the plane of oscillation and thesurface are tilted with respect to each other, this angle leadsto a mixing of in-plane sample properties with the out-of-plane interaction. In this case, van der Waals forces induce anegative frequency shift of the torsional resonance. This sug-gests that the negative detuning of the torsional resonance, asalso observed by others,12 is due to a slight tilt between theplane of oscillation and the local specimen surface.
The numerical results together with the experiments helpexplain the fundamental mechanisms of z feedback in fre-quency modulated torsional resonance mode AFM Ref. 13FM-TR-AFM. The topography feedback regulates theAFM depending on the detuning of the resonant oscillation.
If tip and sample are properly aligned, positive detuning oc-curs due to elastic coupling between the tip and sample. Thisdetuning is accompanied by an amplitude reduction due toenergy dissipation through the frictional contact. If specimenand oscillator are tilted, additional repulsive as well as attrac-tive forces may occur due to mixing of in-plane and out-ofplane properties.
We gratefully acknowledge financial support by theGerman Federal Ministry of Education and Research, grantNanofutur 03N8706. A.Y. is supported by the Scholarship ofthe Elite Network of Bavaria, International DoctorateProgram Nano-Bio-Technology IDK-NBT.
1K. Karrai and R. D. Grober, Appl. Phys. Lett. 66, 1842 1995; K. Karraiand I. Tiemann, Phys. Rev. B 62, 13174 2000; H. Göttlich, R. W. Stark,J. D. Pedarnig, and W. M. Heckl, Rev. Sci. Instrum. 71, 3104 2000; A.D. L. Humphris, M. Antognozzi, T. J. McMaster, and M. J. Miles,Langmuir 18, 1729 2002.
2T. Drobek, R. W. Stark, M. Gräber, and W. M. Heckl, New J. Phys. 1, 151999.
3H. U. Krotil, T. Stifter, and O. Marti, Appl. Phys. Lett. 77, 3857 2000.4M. Reinstädtler, U. Rabe, V. Scherer, U. Hartmann, A. Goldade, B.Bhushan, and W. Arnold, Appl. Phys. Lett. 82, 2604 2003.
5L. Huang and C. M. Su, Ultramicroscopy 100, 277 2004; M.Reinstädtler, T. Kasai, U. Rabe, B. Bhushan, and W. Arnold, J. Phys. D38, R269 2005.
6Y. X. Song and B. Bhushan, Ultramicroscopy 106, 847 2006.7B. V. Derjaguin, V. M. Muller, and Yu. P. Toporov, J. Colloid InterfaceSci. 53, 314 1975.
8R. W. Carpick, D. F. Ogletree, and M. Salmeron, Appl. Phys. Lett. 70,1548 1997.
9U. Rabe, K. Janser, and W. Arnold, Rev. Sci. Instrum. 67, 3281 1996; R.Vázquez, F. J. Rubio-Sierra, and R. W. Stark, Nanotechnology 18, 1855042007.
10M. Reinstädtler, U. Rabe, V. Scherer, J. A. Turner, and W. Arnold, Surf.Sci. 532-535, 1152 2003; L. B. Sharos, A. Raman, S. Crittenden, and R.Reifenberger, Appl. Phys. Lett. 84, 4638 2004.
11S. Maier, Y. Sang, T. Filleter, M. Grant, R. Bennewitz, E. Gnecco, and E.Meyer, Phys. Rev. B 72, 245418 2005.
12O. Pfeiffer, R. Bennewitz, A. Baratoff, E. Meyer, and P. Grütter, Phys.Rev. B 65, 161403 2002; S. Kawai, S. Kitamura, D. Kobayashi, and H.Kawakatsu, Appl. Phys. Lett. 87, 173105 2005.
13A. Yurtsever, A. M. Gigler, and R. W. Stark, J. Phys.: Conf. Ser. in press.
FIG. 3. Color online Amplitude and frequency shift measured during anapproach red and retract black cycle on an untilted =0° and a tilted=8° graphite sample. Note that a negative frequency shift occurs due toattractive forces on the tilted specimen. In the repulsive regime, the detuningresponse is steeper on the tilted specimen. Free torsional resonant frequency,the quality factor, and the amplitude were 900 kHz, 1300, and 405 mV,respectively.
253120-3 Yurtsever et al. Appl. Phys. Lett. 91, 253120 2007
Downloaded 02 Jul 2008 to 129.187.254.47. Redistribution subject to AIP license or copyright; see http://apl.aip.org/apl/copyright.jsp
Frequency modulation torsional resonance mode AFM on chlorite
Journal of Physics, 100, 052033 (2007)
Ayhan Yurtsever, Alexander M. Gigler, and Robert W. Stark
61

Frequency modulation torsional resonance mode AFM on chlorite (001)
Ayhan Yurtsever, Alexander M. Gigler and Robert W. Stark
Center for NanoScience (CeNS) and Dept. Earth and Environmental Sci., Ludwig-Maximilians-Universität München, Theresienstr. 41, 80333 Munich, Germany
E-mail: [email protected]
Abstract. In this paper, we discuss torsional resonance mode atomic force microscopy in frequency modulation (FM-TR-AFM) under ambient conditions. Freshly cleaved chlorite (001) exhibiting brucite-like and mica-like surface areas was investigated in constant amplitude operation in order to visualize topography and frictional properties. The measurements in frequency modulation allow the characterization of dissipative effects due to changes in the lateral forces between tip and sample.
1. Introduction Mapping in-plane surface properties by atomic force microscopy (AFM) enables the characterization of friction, shear stiffness, and other tribologically relevant properties with nanometer resolution. Torsional resonance imaging resembles an AFM shear force experiment which is strongly linked to these tribological surface properties. In contrast to classical resonant imaging such as intermittent contact or non-contact mode, the tip is oscillating parallel (instead of normal) to the sample surface reducing peak repulsive forces. Several approaches have been demonstrated in order to achieve a laterally oscillating tip. A direct excitation and analysis of torsional resonances in contact mode allows to characterize frictional properties of hard samples [1]. Atomic steps on graphite could be resolved by an AFM sensor attached to the prong of a tuning fork [2].
For standard AFM setups, a special cantilever holder was introduced, which allows for the direct excitation of torsional resonances [3]. This improves the coupling to torsional oscillations and reduces possible cross talk between flexural and torsional vibrations. Two piezoelectric elements drive the cantilever to a small torsional oscillation. Typical Q-factors are on the order of Q = 1000. Since the twisting angle is very small, the tip oscillates nearly parallel to the surface with typical amplitudes smaller than 1 nm. Thus, the torsional resonance mode allows for the quantitative characterization of in-plane sample properties such as friction or shear stiffness [4]. By shaking the cantilever base at the torsional resonance frequency Pfeiffer et al. [5], could measure the energy dissipation on the Cu (100) surface in UHV. Kunstmann et al. [6] used frequency-modulation for a combined flexural and torsional measurement mode. They derived additional information on dissipation from the torsional oscillation response on insulating surfaces in UHV.
Frequency modulation (FM) techniques in non-contact atomic force microscopy are powerful tools to achieve atomic resolution on a great variety of samples, including semiconducting [7] or conductive [8, 9] samples. The imaging process has been investigated extensively by theory [10-12] and
IVC-17/ICSS-13 and ICN+T2007 IOP PublishingJournal of Physics: Conference Series 100 (2008) 052033 doi:10.1088/1742-6596/100/5/052033
c© 2008 IOP Publishing Ltd 1
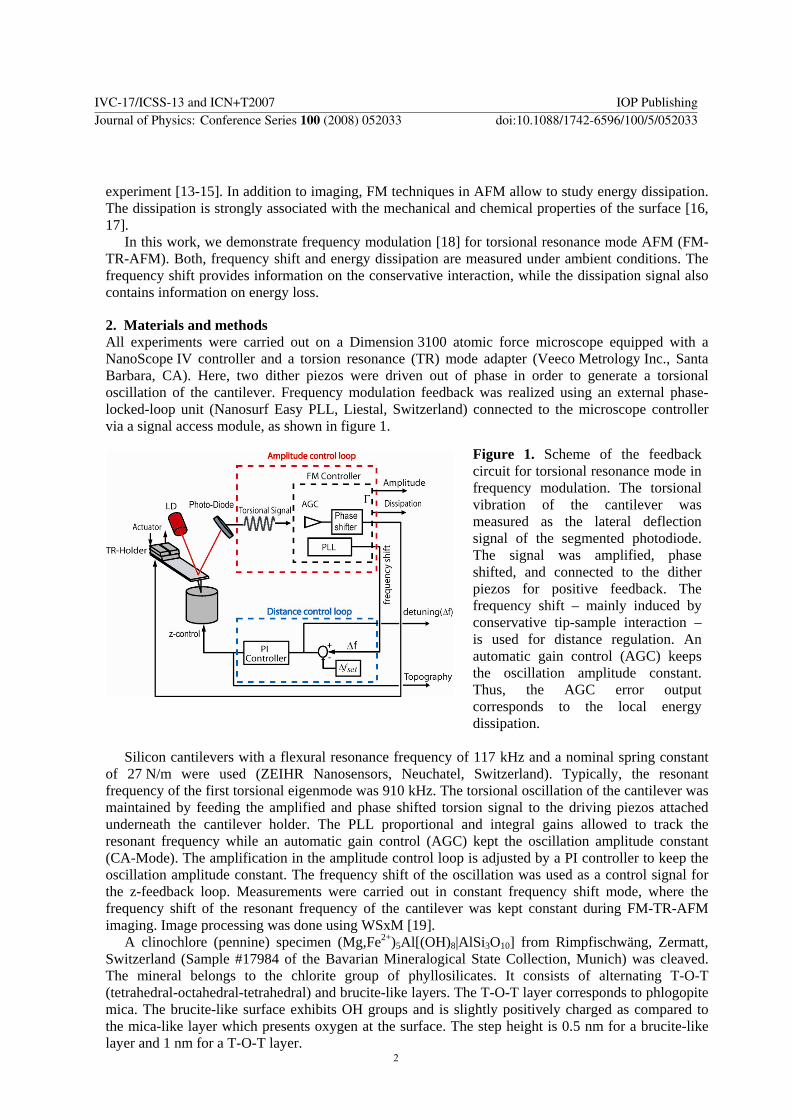
experiment [13-15]. In addition to imaging, FM techniques in AFM allow to study energy dissipation. The dissipation is strongly associated with the mechanical and chemical properties of the surface [16, 17].
In this work, we demonstrate frequency modulation [18] for torsional resonance mode AFM (FM-TR-AFM). Both, frequency shift and energy dissipation are measured under ambient conditions. The frequency shift provides information on the conservative interaction, while the dissipation signal also contains information on energy loss.
2. Materials and methods All experiments were carried out on a Dimension 3100 atomic force microscope equipped with a NanoScope IV controller and a torsion resonance (TR) mode adapter (Veeco Metrology Inc., Santa Barbara, CA). Here, two dither piezos were driven out of phase in order to generate a torsional oscillation of the cantilever. Frequency modulation feedback was realized using an external phase-locked-loop unit (Nanosurf Easy PLL, Liestal, Switzerland) connected to the microscope controller via a signal access module, as shown in figure 1.
Figure 1. Scheme of the feedback circuit for torsional resonance mode in frequency modulation. The torsional vibration of the cantilever was measured as the lateral deflection signal of the segmented photodiode. The signal was amplified, phase shifted, and connected to the dither piezos for positive feedback. The frequency shift – mainly induced by conservative tip-sample interaction – is used for distance regulation. An automatic gain control (AGC) keeps the oscillation amplitude constant. Thus, the AGC error output corresponds to the local energy dissipation.
Silicon cantilevers with a flexural resonance frequency of 117 kHz and a nominal spring constant
of 27 N/m were used (ZEIHR Nanosensors, Neuchatel, Switzerland). Typically, the resonant frequency of the first torsional eigenmode was 910 kHz. The torsional oscillation of the cantilever was maintained by feeding the amplified and phase shifted torsion signal to the driving piezos attached underneath the cantilever holder. The PLL proportional and integral gains allowed to track the resonant frequency while an automatic gain control (AGC) kept the oscillation amplitude constant (CA-Mode). The amplification in the amplitude control loop is adjusted by a PI controller to keep the oscillation amplitude constant. The frequency shift of the oscillation was used as a control signal for the z-feedback loop. Measurements were carried out in constant frequency shift mode, where the frequency shift of the resonant frequency of the cantilever was kept constant during FM-TR-AFM imaging. Image processing was done using WSxM [19].
A clinochlore (pennine) specimen (Mg,Fe2+)5Al[(OH)8|AlSi3O10] from Rimpfischwäng, Zermatt, Switzerland (Sample #17984 of the Bavarian Mineralogical State Collection, Munich) was cleaved. The mineral belongs to the chlorite group of phyllosilicates. It consists of alternating T-O-T (tetrahedral-octahedral-tetrahedral) and brucite-like layers. The T-O-T layer corresponds to phlogopite mica. The brucite-like surface exhibits OH groups and is slightly positively charged as compared to the mica-like layer which presents oxygen at the surface. The step height is 0.5 nm for a brucite-like layer and 1 nm for a T-O-T layer.
IVC-17/ICSS-13 and ICN+T2007 IOP PublishingJournal of Physics: Conference Series 100 (2008) 052033 doi:10.1088/1742-6596/100/5/052033
2

3. Results and Discussion We imaged a freshly cleaved chlorite surface in TR-mode AFM using the frequency modulation technique with constant oscillation amplitude. The frequency shift data corresponds to the conservative interaction due to feedback errors while the energy dissipation image corresponds to the damping or frictional behavior of the sample. The information of the energy dissipation was extracted from the AGC feedback signal, which showed the variation in amplitude of the cantilever excitation signal. The power needed to keep the torsional oscillation amplitude constant is directly proportional to the power dissipated at the tip-sample contact. Figure 2 shows simultaneously measured maps of (a) topography, (b) frequency shift, and (c) energy dissipation as measured with the AGC on the mineral surface. The experimental data were obtained in a constant amplitude operation of the FM-TR-AFM. A cross-section of the topographic data shows that the triangular shapes are brucite flakes with a typical step-height of 0.5 nm.
As feedback control parameter, the frequency shift was used. Thus, image (b) only reveals the control error which results in a derivative picture of the topography. The cross-section shows that despite of edges, the frequency was maintained well. The excitation signal represents the energy needed to keep the torsional amplitude constant. Thus, it gives a direct measure for the dissipated energy, which shows a clear contrast for the different domains of the chlorite surface. In addition to the different mechanical properties of the T-O-T and brucite-like layers of the crystal, these are also charged differently. This surface charge density also influences the interaction between tip and surface due to corresponding changes in the surface potential. From the dissipation cross section, it is obvious that the oscillator loses more energy on the brucite flakes as compared to the T-O-T layer. This dissipative contrast might be due to different wetting properties of the respective surfaces or due to differences in the elemental friction processes at the atomic scale.
a b c
Figure 2. (a) Topographic image of the chlorite (001) surface. Image (b) shows the local detuning (z-feedback error). Image (c) shows the two dimensional mapping of the piezo excitation amplitude which was measured simultaneously with topography in ambient air. The cross sections below the respective images were extracted as indicated by the white lines.
IVC-17/ICSS-13 and ICN+T2007 IOP PublishingJournal of Physics: Conference Series 100 (2008) 052033 doi:10.1088/1742-6596/100/5/052033
3
4. Conclusions We have demonstrated torsional resonance mode atomic force microscopy using the frequency modulation technique under ambient conditions. On a chlorite surface, image contrast between exposed T-O-T and brucite-like layers could be achieved in the dissipation signal. The fundamental mechanism of this contrast still needs to be investigated. Mapping energy dissipation in this mode opens a wide field for quantitative tribological analyses. Thus, frictional properties can be accessed, which so far have not been accessible by conventional dynamic AFM.
Acknowledgments We gratefully acknowledge financial support by the German Federal Ministry of Education and Research (BMBF) Nanofutur grant 03N8706. AY is supported by the Scholarship of the Elite Network of Bavaria, International Doctorate Program Nano-Bio-Technology (IDK-NBT).
References [1] Drobek T, Stark R W, Gräber M and Heckl W M 1999 New J. Phys. 1 15 [2] Göttlich H, Stark R W, Pedarnig J D and Heckl W M 2000 Rev. Sci. Instrum. 71 3104-3107 [3] Huang L and Su C M 2004 Ultramicroscopy 100 277-285 [4] Reinstädtler M, Kasai T, Rabe U, Bhushan B and Arnold W 2005 J. Phys. D-Appl. Phys. 38
R269-R282 [5] Pfeiffer O, Bennewitz R, Baratoff A, Meyer E and Grutter P 2002 Phys. Rev. B 65 [6] Kunstmann T, Schlarb A, Fendrich M, Paulkowski D, Wagner T and Moller R 2006 Appl.
Phys. Lett. 88 [7] Sugawara Y, Ohta M, Ueyama H and Morita S 1995 Science 270 1646-1648 [8] Giessibl F J 1995 Science 267 68-71 [9] Fukui K, Onishi H and Iwasawa Y 1997 Phys. Rev. Lett. 79 4202-4205 [10] Gauthier M and Tsukada M 2000 Phys. Rev. Lett. 85 5348-5351 [11] Gotsmann B, Anczykowski B, Seidel C and Fuchs H 1999 Appl. Surf. Sci. 140 314-319 [12] Kantorovich L N and Trevethan T 2004 Phys. Rev. Lett. 93 236102 [13] Fukuma T, Ichii T, Kobayashi K, Yamada H and Matsushige K 2004 J. Appl. Phys. 95 1222-
1226 [14] Jarvis S P, Yamada H, Kobayashi K, Toda A and Tokumoto H 2000 Appl. Surf. Sci. 157 314-
319 [15] Loppacher C, Bennewitz R, Pfeiffer O, Guggisberg M, Bammerlin M, Schar S, Barwich V,
Baratoff A and Meyer E 2000 Phys. Rev. B 62 13674-13679 [16] Hölscher H, Gotsmann B, Allers W, Schwarz U D, Fuchs H and Wiesendanger R 2001 Phys.
Rev. B 64 075402 [17] Gotsmann B and Fuchs H 2001 Phys. Rev. Lett. 86 2597-2600 [18] Albrecht T R, Grutter P, Horne D and Rugar D 1991 J. Appl. Phys. 69 668-673 [19] Horcas I, Fernandez R, Gomez-Rodriguez J M, Colchero J, Gomez-Herrero J and Baro A M
2007 Rev. Sci. Instrum. 78 013705
IVC-17/ICSS-13 and ICN+T2007 IOP PublishingJournal of Physics: Conference Series 100 (2008) 052033 doi:10.1088/1742-6596/100/5/052033
4
Frequency modulated torsional resonance mode AFM on polymers
Applied Physics Letters (APL), 92, 143103 (2008)
Ayhan Yurtsever, Alexander M. Gigler, Christian Dietz, and Robert W. Stark
66

Frequency modulated torsional resonance mode atomic forcemicroscopy on polymers
Ayhan Yurtsever,1 Alexander M. Gigler,1,a Christian Dietz,2 and Robert W. Stark1,b
1Center for NanoScience (CeNS) and Department of Earth and Environmental Sciences,Ludwig-Maximilians-Universität München, Theresienstraße 41, 80333 Munich, Germany2Chemische Physik, Technische Universität Chemnitz, Reichenhainer Str. 70, 09107 Chemnitz, Germany
Received 26 February 2008; accepted 19 March 2008; published online 8 April 2008
In-plane mechanics of polymers can be probed by integrating frequency modulation and torsionalresonance mode atomic force microscopy. We investigated a thin film of polystyrene-block-polybutadiene diblock copolymer. To gain more insight into image contrast formation, we examineddisplacement curves on polystyrene homopolymer surfaces of different molecular weights focusingon energy dissipation and frequency shift. Data suggest that the transition from a highly motilesurface layer to the bulk material depends on the molecular weight of the polymer. This, in turn,indicates that the tip is slightly oscillating within the sample surface during imaging. © 2008American Institute of Physics. DOI: 10.1063/1.2907498
The atomic force microscope AFM has become a stan-dard instrument for imaging and characterization of poly-mers with nanometer resolution. Various AFM imaging tech-niques allow for mapping material properties to topographicsurface features. Depending on the scheme of excitation,these techniques can be categorized as nonresonant methods,such as pulsed force mode,1,2 or resonant methods such asphase imaging,3 frequency modulation,4,5 and time-resolvedAFM.6,7 All of these techniques are based on a flexural os-cillation of the cantilever sensing forces perpendicular to thesurface. The probe only interacts with the sample at thelower turning point of the cantilever oscillation and, thus, isfar away from the surface for most of the oscillation cycle. Inorder to probe the in-plane mechanical properties of materi-als, the tip can also be driven to a small lateral instead ofvertical oscillation. Such a lateral oscillation is used in im-aging modes where the specimen is characterized by shearforce interactions. Shear force imaging can be realized byapplying a lateral modulation to a tip or sample with anamplitude of a few nanometers either while the tip is scannedacross the specimen8 or during approach retract curves dis-placement curves.9,10 Using higher excitation frequenciesclose to the torsional resonances TR of the cantilever,11
in-plane conservative elasticity under shear as well as dis-sipative friction properties can be determined. Even with-out the need for active driving of the TR, in-plane elasticproperties can be extracted from the thermomechanical os-cillations of the force sensor in contact with the surface.12
In order to achieve a well-defined lateral tip oscillation,the TR mode has been introduced where two piezoelec-tric elements force the cantilever to a torsional oscil-lation.13 To provide high sensitivity together with stableimaging, frequency modulation techniques can be appliedto TR mode.14,15 However, the fundamental mechanisms ofimage formation in this mode demand further investiga-tion. We therefore discuss frequency modulated TR mode
AFM FM-TR-AFM for imaging thin polymer films in thefollowing.
The experiment was set up using a Dimension 3100AFM with a NanoScope IV controller equipped for TR-modeoperation Veeco Metrology Inc., Santa Barbara, CA. Thecontrol loop was extended by a phase-locked loop elec-tronics Easy-PLL, Nanosurf AG, Liestal, Switzerland, asshown in Fig. 1. Silicon cantilevers ZEIHR, Nanosensors,Neuchâtel, Switzerland with torsional resonant frequenciesbelow 1 MHz were used flexural resonance of 117 kHz, TRof 910 kHz, and flexural spring constant 27 N /m. A positivefeedback of the lateral signal of the photodiode together withan automatic gain control was implemented for driving thecantilever into a stable torsional oscillation. The detuningf of the TR was utilized for topographic feedback. Twodifferent modes of operation were used: constant amplitudeCA mode for imaging and constant excitation CE modefor displacement curves. In CA mode, the energy needed tomaintain the torsional oscillation amplitude constant pro-
aAuthor to whom correspondence should be addressed. Electronic mail:[email protected]. Tel.: 49 89 2180 4185. FAX: 49 89 2180 4334.
bElectronic mail: [email protected].
FIG. 1. Color online Scheme of frequency modulated torsional resonancemode AFM. A positive feedback of the photodiode signal is used to drivethe dither piezos for torsional excitation. Frequency shift, energy dissi-pation, and oscillation amplitude can be concurrently measured with thetopography.
APPLIED PHYSICS LETTERS 92, 143103 2008
0003-6951/2008/9214/143103/3/$23.00 © 2008 American Institute of Physics92, 143103-1Downloaded 02 Jul 2008 to 129.187.254.47. Redistribution subject to AIP license or copyright; see http://apl.aip.org/apl/copyright.jsp
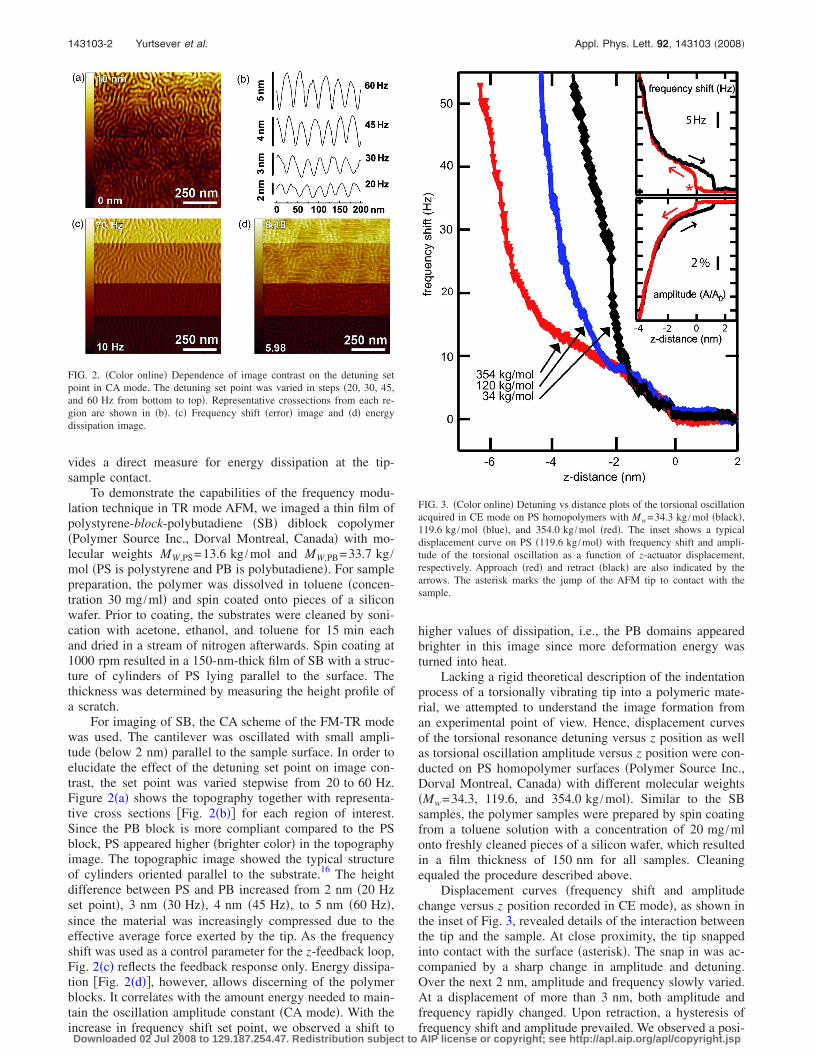
vides a direct measure for energy dissipation at the tip-sample contact.
To demonstrate the capabilities of the frequency modu-lation technique in TR mode AFM, we imaged a thin film ofpolystyrene-block-polybutadiene SB diblock copolymerPolymer Source Inc., Dorval Montreal, Canada with mo-lecular weights MW,PS=13.6 kg /mol and MW,PB=33.7 kg /mol PS is polystyrene and PB is polybutadiene. For samplepreparation, the polymer was dissolved in toluene concen-tration 30 mg /ml and spin coated onto pieces of a siliconwafer. Prior to coating, the substrates were cleaned by soni-cation with acetone, ethanol, and toluene for 15 min eachand dried in a stream of nitrogen afterwards. Spin coating at1000 rpm resulted in a 150-nm-thick film of SB with a struc-ture of cylinders of PS lying parallel to the surface. Thethickness was determined by measuring the height profile ofa scratch.
For imaging of SB, the CA scheme of the FM-TR modewas used. The cantilever was oscillated with small ampli-tude below 2 nm parallel to the sample surface. In order toelucidate the effect of the detuning set point on image con-trast, the set point was varied stepwise from 20 to 60 Hz.Figure 2a shows the topography together with representa-tive cross sections Fig. 2b for each region of interest.Since the PB block is more compliant compared to the PSblock, PS appeared higher brighter color in the topographyimage. The topographic image showed the typical structureof cylinders oriented parallel to the substrate.16 The heightdifference between PS and PB increased from 2 nm 20 Hzset point, 3 nm 30 Hz, 4 nm 45 Hz, to 5 nm 60 Hz,since the material was increasingly compressed due to theeffective average force exerted by the tip. As the frequencyshift was used as a control parameter for the z-feedback loop,Fig. 2c reflects the feedback response only. Energy dissipa-tion Fig. 2d, however, allows discerning of the polymerblocks. It correlates with the amount energy needed to main-tain the oscillation amplitude constant CA mode. With theincrease in frequency shift set point, we observed a shift to
higher values of dissipation, i.e., the PB domains appearedbrighter in this image since more deformation energy wasturned into heat.
Lacking a rigid theoretical description of the indentationprocess of a torsionally vibrating tip into a polymeric mate-rial, we attempted to understand the image formation froman experimental point of view. Hence, displacement curvesof the torsional resonance detuning versus z position as wellas torsional oscillation amplitude versus z position were con-ducted on PS homopolymer surfaces Polymer Source Inc.,Dorval Montreal, Canada with different molecular weightsMw=34.3, 119.6, and 354.0 kg /mol. Similar to the SBsamples, the polymer samples were prepared by spin coatingfrom a toluene solution with a concentration of 20 mg /mlonto freshly cleaned pieces of a silicon wafer, which resultedin a film thickness of 150 nm for all samples. Cleaningequaled the procedure described above.
Displacement curves frequency shift and amplitudechange versus z position recorded in CE mode, as shown inthe inset of Fig. 3, revealed details of the interaction betweenthe tip and the sample. At close proximity, the tip snappedinto contact with the surface asterisk. The snap in was ac-companied by a sharp change in amplitude and detuning.Over the next 2 nm, amplitude and frequency slowly varied.At a displacement of more than 3 nm, both amplitude andfrequency rapidly changed. Upon retraction, a hysteresis offrequency shift and amplitude prevailed. We observed a posi-
FIG. 2. Color online Dependence of image contrast on the detuning setpoint in CA mode. The detuning set point was varied in steps 20, 30, 45,and 60 Hz from bottom to top. Representative crossections from each re-gion are shown in b. c Frequency shift error image and d energydissipation image.
FIG. 3. Color online Detuning vs distance plots of the torsional oscillationacquired in CE mode on PS homopolymers with Mw=34.3 kg /mol black,119.6 kg /mol blue, and 354.0 kg /mol red. The inset shows a typicaldisplacement curve on PS 119.6 kg /mol with frequency shift and ampli-tude of the torsional oscillation as a function of z-actuator displacement,respectively. Approach red and retract black are also indicated by thearrows. The asterisk marks the jump of the AFM tip to contact with thesample.
143103-2 Yurtsever et al. Appl. Phys. Lett. 92, 143103 2008
Downloaded 02 Jul 2008 to 129.187.254.47. Redistribution subject to AIP license or copyright; see http://apl.aip.org/apl/copyright.jsp

tive frequency shift and decreased amplitude due to contactstiffening. The initial slope of the frequency shift plot wasrather linear. This can be explained by mobile polymer coilsclose to the polymer/air interface. Indenting further, the tippenetrated through the first layer exerting shear stress on thebulk polymer. With the increasing indentation, more andmore material was involved in tip-sample interaction. Thislead to an increased frequency shift which may be attributedto polymer entanglements,17,18 limiting the chain mobility inthe bulk.
In order to assess this effect of the polymer chain length,displacement curves focusing on frequency shift were mea-sured on different PS homopolymers Mw=34.3, 119.6, and354.0 kg /mol, as shown in Fig. 3. For all specimens, tworegimes were observed in the displacement curves: Firstly, arather compliant surface layer was probed; secondly, the lessmobile bulk of the polymer was sensed by the oscillatorymotion of the tip. The position of the kink between the tworegimes strongly correlated with the molecular weight of thehomopolymer.
The approach-retract response of amplitude reductionand frequency shift of the torsional oscillation can be relatedto the mechanical properties of the thin film. As we observedtwo distinct regions of different mechanical behavior interms of periodic shear stress, a mobile thin layer followedby a more rigid bulk seems a reasonable assumption. Theapparent stratification of the film may be caused by the seg-regation of short and long chained molecules at the interfacesof a film, since short chains low Mw are repelled from thebulk higher Mw due to entropic forces. Even purified ho-mopolymers yet having a finite polydispersity of 1.05, suchas the polymers used in our experiments, result in a superfi-cial layer consisting of the shorter molecules.
In summary, FM-TR-AFM is a powerful tool for imag-ing polymeric samples with spatially varying mechanicalproperties. The indentation experiments clearly show thatthe tip is oscillating within the motile top layer of thepolymer surface even for detuning on the order of 10 Hz.For the diblock copolymer, this means that while imagingin FM-TR-AFM, the tip is also compressing the differentpolymer blocks according to their compliance. This effectcauses an apparent increase of topography with the detuningset point. Furthermore, we investigated frequency shiftversus distance curves on PS, which revealed two differentinteraction regimes. Depending on the molecular weight, we
observed a distinct change in the signature of the distancecurves. Hence, we propose a stratified structure due to thesegregation of shorter chains from longer chains and, thus, aresulting two layer behavior. Our findings show that FM-TR-mode spectroscopy enables discerning of polymer samplesby their different molecular weight.
We gratefully acknowledge financial support by the Ger-man Federal Ministry of Education and Research BMBFGrant Nanofutur 03N8706 and by the European CommissionFORCETOOL, NMP4-CT-2004-013684. The authors thankRobert Magerle for fruitful discussions. A.Y. was supportedby the Doctorate Program Nano-Bio-Technology IDK-NBT of the Elite Network of Bavaria, International andA.M.G. was financed by the cluster of excellence “Nanosys-tems Initiative Munich NIM.
1H. U. Krotil, T. Stifter, and O. Marti, Rev. Sci. Instrum. 71, 2765 2000.2A. Gigler, C. Gnahm, O. Marti, T. Schimmel, and S. Walheim, J. Phys.:Conf. Ser. 61, 346 2007.
3S. N. Magonov, V. Elings, and M. H. Whangbo, Surf. Sci. 375, L3851997.
4F. Dubourg, G. Couturier, J. P. Aime, S. Marsaudon, P. Leclere, R.Lazzaroni, J. Salardenne, and R. Boisgard, Modell. Simul. Mater. Sci.Eng. 167, 177 2001.
5F. Dubourg, S. Kopp-Marsaudon, P. Leclere, R. Lazzaroni, and J. P. Aime,Eur. Phys. J. E 6, 387 2001.
6M. Stark, R. W. Stark, W. M. Heckl, and R. Guckenberger, Proc. Natl.Acad. Sci. U.S.A. 99, 8473 2002.
7O. Sahin, S. Magonov, C. Su, C. F. Quate, and O. Solgaard, Nat.Nanotechnol. 2, 507 2007.
8H. U. Krotil, E. Weilandt, T. Stifter, O. Marti, and S. Hild, Surf. InterfaceAnal. 27, 341 1999.
9H. U. Krotil, T. Stifter, and O. Marti, Appl. Phys. Lett. 77, 3857 2000.10H. U. Krotil, T. Stifter, and O. Marti, Rev. Sci. Instrum. 72, 150 2001.11M. Reinstädtler, U. Rabe, V. Scherer, U. Hartmann, A. Goldade, B.
Bhushan, and W. Arnold, Appl. Phys. Lett. 82, 2604 2003.12T. Drobek, R. W. Stark, and W. M. Heckl, Phys. Rev. B 64, 045401
2001.13L. Huang and C. M. Su, Ultramicroscopy 100, 277 2004.14A. Yurtsever, A. M. Gigler, E. Macias, and R. W. Stark, Appl. Phys. Lett.
91, 253120 2007.15A. Yurtsever, A. M. Gigler, and R. W. Stark, J. Phys.: Conf. Ser. 100,
052033 2008.16A. Knoll, A. Horvat, K. S. Lyakhova, G. Krausch, G. J. A. Sevink, A. V.
Zvelindovsky, and R. Magerle, Phys. Rev. Lett. 89, 035501 2002.17F. Dubourg, J. P. Aime, S. Marsaudon, G. Couturier, and R. Boisgard, J.
Phys.: Condens. Matter 15, 6167 2003.18H. R. Brown and T. P. Russell, Macromolecules 29, 798 1996.
143103-3 Yurtsever et al. Appl. Phys. Lett. 92, 143103 2008
Downloaded 02 Jul 2008 to 129.187.254.47. Redistribution subject to AIP license or copyright; see http://apl.aip.org/apl/copyright.jsp
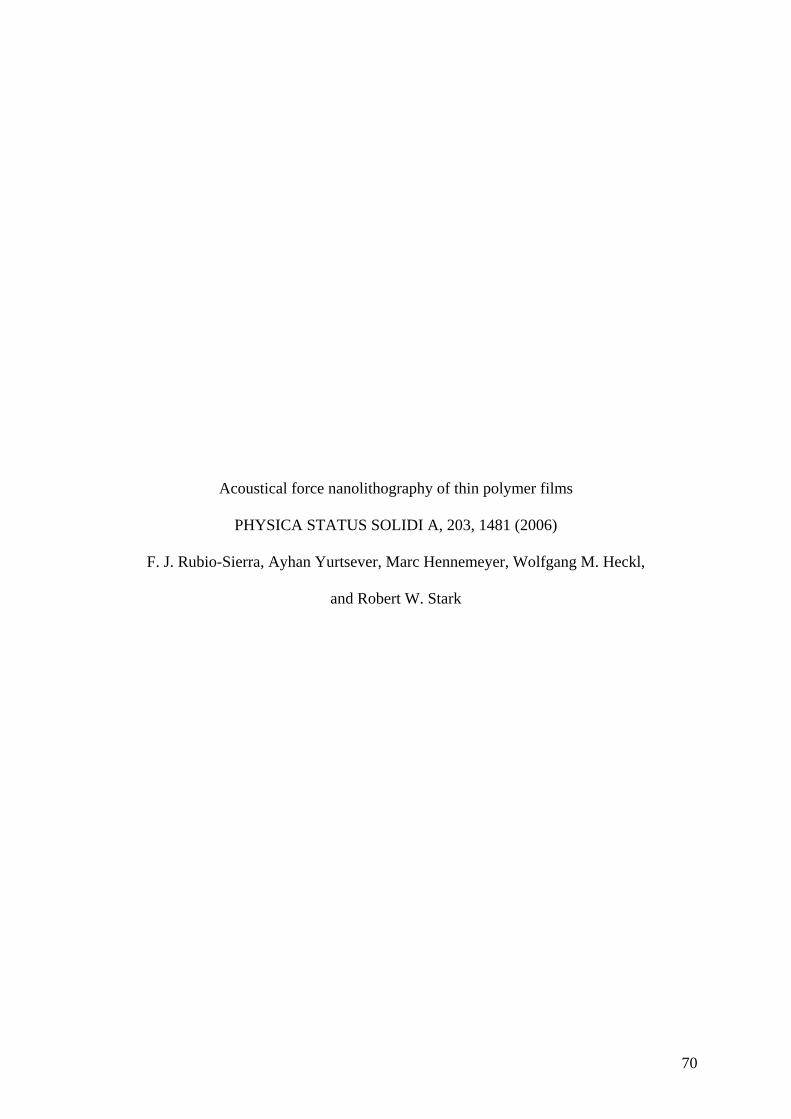
Acoustical force nanolithography of thin polymer films
PHYSICA STATUS SOLIDI A, 203, 1481 (2006)
F. J. Rubio-Sierra, Ayhan Yurtsever, Marc Hennemeyer, Wolfgang M. Heckl,
and Robert W. Stark
70

phys. stat. sol. (a) 203, No. 6, 1481–1486 (2006) / DOI 10.1002/pssa.200566152
© 2006 WILEY-VCH Verlag GmbH & Co. KGaA, Weinheim
Original
Paper
Acoustical force nanolithography of thin polymer films
F. J. Rubio-Sierra1, A. Yurtsever1, M. Hennemeyer1, W. M. Heckl1, 2, and R. W. Stark*, 1
1 CeNS and Crystallography, Department of Earth and Enviromental Sciences,
Ludwig-Maximilians-Universität München, Theresienstr. 41, 80333 München, Germany 2 Deutsches Museum, Museumsinsel 1, 80538 München, Germany
Received 30 September 2005, revised 16 December 2005, accepted 17 December 2005
Published online 4 April 2006
PACS 07.79.Lh, 68.37.Ps, 81.16.Nd
Nanomachining of thin polymer resist films with an atomic force microscope (AFM) is a promising route
for the fabrication of nanoscale devices. In order to enhance the controllability of the nanomachining
process an in-plane acoustic wave is coupled to the sample support. This enhances the intermittent force
exerted by the AFM tip. The lateral resolution reached by this method is only limited by the physical size
of the AFM tip to dimensions far below the light diffraction limit. The main process parameters are the
frequency and magnitude of the acoustic wave, and the preloading force. In this work, the feasibility of
acoustical force lithography and the influence of the relevant parameters are investigated.
© 2006 WILEY-VCH Verlag GmbH & Co. KGaA, Weinheim
1 Introduction
Surface patterning at the smallest scale is a key issue for the further development of technological and
scientific applications that require rapid prototyping of nanostructures. Currently, optical lithography is
the standard technique for the fabrication of structured surfaces. However, the lateral resolution of opti-
cal lithography is limited by diffraction. To overcome this limitation, alternative surface patterning
methods have been developed during the last years, such as e-beam lithography, masked deposition,
scanning probe techniques, or microcontact printing [1]. Scanning probe microscope related techniques
represent the most versatile approach for rapid prototyping of lateral nanoscale structures [2, 3]. Among
the members of the scanning probe family, the atomic force microscope (AFM) has experienced an im-
pressive development for its application to lithography [4, 5]. Essentially, there are three physically dif-
ferent types of AFM lithography: local anodic oxidation [6], surface chemical patterning [7], and me-
chanical machining [8]. Mechanical machining by AFM has the main advantages of being a direct
method – it is not restricted to functional materials. The resolution is only limited by the physical dimen-
sions of the AFM tip, which is much smaller than the light diffraction limit.
Currently, two different approaches are used for mechanical machining by AFM. The quasi-static
approach relies on the application of a static load on the sample to produce plastic deformation while the
AFM tip moves on the surface [9]. The main drawback of the quasi-static method is the poor controlla-
bility of the process due to lateral forces [10]. In the second approach, dynamic mechanical machining,
the AFM cantilever is oscillated with a small amplitude which minimizes unwanted lateral forces during
the lithography process. Typically, the supporting piezo-element is used to generate cantilever oscilla-
tions by the excitation of flexural resonant modes. If the AFM tip is sufficiently close to the sample and
the excitation is strong enough, nanostructures can be lithographed on the surface. This method is also
found in the literature as dynamic plowing lithography [11].
* Corresponding author: e-mail: [email protected], Phone: +49 89 2180 4329, Fax: +49 89 2180 4334

1482 F. J. Rubio-Sierra et al.: Acoustical force nanolithography
© 2006 WILEY-VCH Verlag GmbH & Co. KGaA, Weinheim www.pss-a.com
The controllability of standard dynamic plowing is limited by the fact that the cantilever actuation
depends strongly on the transfer characteristics of the dithering piezo-element and the cantilever: The
fixed end actuation of the cantilever introduces a time-delay in the system between the actuation and the
tip. This can limit the bandwidth of high-speed closed-loop control of the machining process [12]. Addi-
tionally, the non-linear tip-sample interaction produces a strong shift of the cantilever resonant fre-
quency. Thus, a promising method for cantilever excitation is to couple a normal incidence shear acous-
tic wave to the cantilever tip through sample surface. The acoustic wave is generated by an acoustic
transducer below the sample [13, 14].
In the following, we discuss ‘acoustical force nanolithography’, a surface machining method based on
the AFM. In order to avoid the hardly controllable stick-slip oscillations of quasi-static plowing lithogra-
phy, the oscillations are induced by a normal incidence shear acoustic wave. Prior to lithography, the
frequency response of the cantilever is acquired to obtain the optimal frequency of operation. The influ-
ence of the main experimental parameters such as excitation frequency, amplitude, and the preloading
force is investigated in detail.
2 Experimental and methods
The experiments were carried out on a Dimension 3100 Scanning Probe Microscope System (Veeco
Metrology, Santa Barbara, CA). Lithography paths were programmed using the NanoMan II software of
the instrument. For the process parameters characterization, a triangular cantilever with a nominal force
constant of 48 N/m was used (NSC11, MikroMasch, Tallinn, Estonia). For the lithography a rectangular
cantilever with a nominal force constant of 40 N/m was used (NSC16, MikroMasch, Tallinn, Estonia).
As illustrated in Fig. 1, the sample was mounted on a normal incidence shear wave transducer (v153,
Panametrics-NDT, Waltham, MA). For lithography a continuous sinusoidal signal was coupled to the
ultrasonic transducer. To switch between imaging and lithography mode, the sample bias voltage signal
of the AFM controller was used as trigger signal; this signal can be accessed through a signal access
module. In this modified lithography system the sample holder is electrically isolated from the sample
bias voltage signal of the controller.
Samples were prepared on silicon chips with a size of about 1 cm2. Prior to coating, the chips were
cleaned with acetone, isopropanol, and de-ionized water. A thin polymer film was prepared by spin coat-
ing (ω = 500 min–1 for 30 s, ω = 5000 min–1 for 60 s) ma-p 1205® (based on Novolak, naphthoquinone
diazide, and solvents; MicroChem, Newton, MA). After spinning, the samples were dried on a hot plate
at 100 °C for 40 s.
All images were acquired in standard tapping mode where the dither piezo of the cantilever holder is
used for excitation. For image processing a commercial software package was used (SPIP 4.0, Image
Metrology A/S, Lyngby, Denmark). In order to obtain a reliable measurement of the width of the litho-
Fig. 1 (online colour at: www.pss-a.com) Schema of the
experimental setup for acoustical force nanolithography.
The sample holder consists on an acoustic wave trans-
ducer that is used to enhance cantilever flexural vibrations
for lithography.
phys. stat. sol. (a) 203, No. 6 (2006) 1483
www.pss-a.com © 2006 WILEY-VCH Verlag GmbH & Co. KGaA, Weinheim
Original
Paper
graphed structures, the influence of the tip-shape on the measured topography had to be considered. Due
to the geometric ‘convolution’ of the tip shape with the surface profile the width of grooves is underes-
timated in the raw topographic data. Thus, the images were low-pass filtered to remove high frequency
noise. Then, a worst-case tip shape was estimated employing the tip characterization procedure of the
software package [15]. In order to obtain reliable upper limits for the width of the nanomachined lines,
the tip shape was deconvoluted from topographic data [16].
3 Process parameters
3.1 Resonance spectra
In order to tune the excitation frequency for lithography the frequency response of the cantilever to a
continuous single tone excitation of the ultrasonic transducer was analyzed. Two different types of vibra-
tion spectra were acquired: one for the free cantilever and one for the surface-coupled cantilever. The
excitation frequency was swept stepwise in the frequency band from 400 kHz to 1 MHz. The vibration
spectra of the AFM cantilever were measured by demodulation of the deflection signal with an external
lock-in amplifier (7280, Ametek, Oak Ridge, TN). The frequency response of the free cantilever is
shown in Fig. 2(a). The cantilever was placed about 2 µm over the sample surface during the measure-
ment of the frequency response. The out-of plane oscillations of the vibrations of the ultrasonic trans-
ducer couple through the air to the cantilever. Only one resonant peak appears at a frequency of
423.4 kHz within the analyzed frequency band.
In order to acquire the resonance spectra of the surface-coupled cantilever, the vibrating AFM cantile-
ver is brought into intermittent contact by approaching the cantilever to the surface until the AFM cantile-
ver oscillation amplitude was reduced to 20%. Then, the microscope feedback-loop was disconnected and
the vibration spectrum was acquired. Figure 2(b) shows the vibration spectrum with several resonant
peaks. The main resonance peak is shifted and obscured by new resonances in the spectrum. These new
resonances are caused by the strong non-linear character of the tip-sample interaction and resonances in
the frequency response of the acoustic transducer [17, 18]. Six major resonant peaks are located at
f = 477.0, 598.2, 637.8, 777.2, 879.6, and 940.8 kHz. The response of the system close to 1 MHz is en-
hanced due to the frequency response of the acoustic wave transducer which is centered at this frequency.
3.2 Acoustic wave frequency
The frequency response of the surface-coupled cantilever shows that the vibration amplitude depends
strongly on the excitation frequency. Four traces were lithographed at different resonant peaks of the
surface-coupled cantilever frequency response in order to characterize the influence of the excitation
frequency (1 Volt signal amplitude). Figure 3(a) shows the resulting traces and the height profile. All
lines successfully ploughed grooves on the sample surface. Residual material from the plowing process
a)
b)
Fig. 2 Vibration spectra of: a) the freely vibrating cantilever, and b) the surface-coupled cantilever. The numbered
peaks in (b) were used to characterize the influence of the frequency response in the lithography process.

1484 F. J. Rubio-Sierra et al.: Acoustical force nanolithography
© 2006 WILEY-VCH Verlag GmbH & Co. KGaA, Weinheim www.pss-a.com
a) b)
Fig. 3 (online colour at: www.pss-a.com) Variation of lithography depth with the resonant magnitude of the sur-
face-coupled frequency response (Fig. 2). The resonant magnitudes and corresponding excitation frequencies for the
four different traces were: trace 1, 6.0 mV (at 879.4 kHz); trace 2, 3.5 mV (at 774.2 kHz); trace 3, 2.7 mV (at
626 kHz); trace 4, 1.6 mV (at 479.4 kHz). a) 3D-representation and height profile of the patterned area. b) Increase
of lithographed depth with the frequency response magnitude of the resonant peak. A linear fit of the experimental
data is also displayed.
appears at both sides of the grooves. From the results it is clearly seen that the lithographed depth is
directly related to which resonant peak is used to generate the acoustic wave. Figure 3(b) shows that the
lithographed trace depth increases linearly with the magnitude of the resonant peak.
3.3 Acoustic wave amplitude
The vibration amplitude of the surface-coupled cantilever and, consequently, the applied tip-sample
forces, directly depends on the magnitude of the excitation. To characterize the influence of the acoustic
wave amplitude on the lithography process, six lines were lithographed using the same frequency
(940.8 kHz) but at different magnitudes of the excitation signal.
The first trace was performed without acoustic wave excitation. All the lines traced with acoustic
wave excitation resulted in the fabrication of grooves. Figure 4(b) shows a slight deviation from a linear
relation between acoustic wave magnitude and lithographed depth. From Fig. 4(a) it evident that the
sample surface appears raised next to the groove. Raised polymer areas after quasi-static machining for
loads below the yield strength of the polymer have been previously reported [9]. However, the mecha-
nism for this material displacement is not well understood. Morphological changes induced by viscoelas-
tic effects or localized heat have been proposed as origins of this phenomenon.
a) b)
Fig. 4 (online colour at: www.pss-a.com) Increase in lithography depth with the magnitude of the excitation signal.
The signal amplitudes for the five different traces were: trace #1, 0 V; trace #2, 2 V; trace #3, 4 V; trace #4, 6 V;
trace #5, 8 V; trace #6, 10 V. a) 3D-representation and height profile of the patterned area. b) Relation between
lithographed depth and signal magnitude. A linear fit of the experimental data is also displayed.

phys. stat. sol. (a) 203, No. 6 (2006) 1485
www.pss-a.com © 2006 WILEY-VCH Verlag GmbH & Co. KGaA, Weinheim
Original
Paper
a) b)
Fig. 5 (online colour at: www.pss-a.com) Variation of lithography depth with set-point of the topography feed-
back. The corresponding set-points were: trace 1, 0.5 V; trace 2, 0.2 V; trace 3, 0.4 V; trace 4, 0.3 V; trace 5, 0.1 V.
a) 3D-representation and height profile of the patterned area. b) Decrease of lithographed depth with increasing set-
point. A linear fit of the experimental data is also displayed.
3.4 Preloading force
The coupling of the acoustic wave to the AFM tip depends on the cantilever preloading force. The pre-
loading force is determined by the set-point of the topography feedback prior to lithography. A lower set-
point corresponds to a greater preloading force.
Thus, a dependency between the lithographed depth and the preloading force can be expected. To
illustrate this, five lines were lithographed at different set-points while applying an excitation signal of
1 V of amplitude at the main resonant peak of the surface-coupled cantilever frequency response (at
879.4 kHz). As expected, a decrease of lithographed depth with increasing set-point is observed in Fig. 5.
This dependence has a linear character within the investigated range as seen in Fig. 5(b).
Figure 6 shows two lithographed structures demonstrating the feasibility of the method for the genera-
tion of nanostructures. Figure 6(a) shows the lithographed emblem of the Ludwig Maximilians University.
a)
b)
c)
Fig. 6 (online colour at: www.pss-a.com) Nanostructures generated by acoustical force nanolithography: a) litho-
graphed emblem of the Ludwig-Maximilians-University. b) AFM image of three 4 µm long lines lithographed using
a signal amplitude of 0.5 V at a frequency of 740 kHz for acoustic wave generation, with an average tip-sample
distance of 12.7 nm. Image size (4 × 2 µm) and z-range of 55.6 nm. c) Line profile along the white line in panel b.

1486 F. J. Rubio-Sierra et al.: Acoustical force nanolithography
© 2006 WILEY-VCH Verlag GmbH & Co. KGaA, Weinheim www.pss-a.com
Figure 6(b) and (c) show the AFM image and height profile of three lithographed lines with a length of
4 µm. The average line width at FWHM was of 50 nm. The parameters were chosen to reach a line depth
greater than 20 nm. This is relevant for the application of this method as first step in high resolution lift-
off lithography, where thin resist layers with a thickness about 20 nm are used [19].
4 Conclusions
Acoustical force nanolithography is an AFM lithography method providing control on the machining
process by actuation of AFM cantilever through the specimen by an acoustic wave. A precise control can
be achieved by tuning the excitation frequency and amplitude of the excitation to purpose. The feasibility
of the method along with the characterization of the main parameters was illustrated by lithography of a
thin resist film. After initial tuning of the machining forces by fine tuning the excitation frequency, am-
plitude and set point, the nanolithography process is a reliable process.
Due to the reduced physical dimensions of the AFM tip and precise positioning and force control
provided by acoustic force nanolithography, lateral dimensions of the lithographed traces are reduced far
beyond light diffraction limit. The method is easy to implement in probe-scanning AFM configurations
and can be used as a stand-alone method for surface modification or as complement for fine adjustment
of standard mechanical machining of surfaces by AFM.
Acknowledgements Funding by the German Federal Ministry of Education and Research (BMBF) under grant
03N8706 is gratefully acknowledged. F. J. Rubio-Sierra thanks the Elite Network of Bavaria for financial support.
References
[1] M. Geissler and Y. Xia, Adv. Mater. 16, 1249 (2004).
[2] A. A. Tseng, A. Notagiacomo, and T. P. Chen, J. Vac. Sci. Technol. B 23, 877 (2005).
[3] D. Wouters and U. S. Schubert, Angew. Chem. Int. Ed. 43, 2480 (2004).
[4] F. J. Rubio-Sierra, W. M. Heckl, and R. W. Stark, Adv. Eng. Mater. 7, 193 (2005).
[5] D. Fotiadis, S. Scheuring, S. A. Müller, A. Engel, and D. J. Müller, Micron 33, 385 (2002).
[6] R. Garcia, M. Calleja, and H. Rohrer, J. Appl. Phys. 86, 1898 (1999).
[7] S. Krämer, R. R. Fuierer, and C. B. Gorman, Chem. Rev. 103, 4367 (2003).
[8] T. A. Jung, A. Moser, H. J. Hug, D. Brodbeck, R. Hofer, H. R. Hidber, and U. D. Schwarz, Ultramicroscopy
42, 1446 (1992).
[9] X. Jin and W. N. Unertl, Appl. Phys. Lett. 61, 657 (1992).
[10] R. W. Stark, S. Thalhammer, J. Wienberg, and W. M. Heckl, Appl. Phys. A 66, S579 (1998).
[11] M. Heyde, K. Rademann, B. Cappella, M. Geuss, H. Sturm, T. Spangenberg, H. Niehus, Rev. Sci. Instrum. 72,
136 (2001).
[12] F. J. Rubio-Sierra, R. Vázquez, and R. W. Stark, in: Proceedings of IMECE2005 2005, ASME International
Mechanical Engineering Congress and Exposition, November 5–11, 2005, Orlando, Florida, USA.
[13] A. Caron, U. Rabe, M. Reinstädtler, J. A. Turner, and W. Arnold, Appl. Phys. Lett. 85, 6398 (2004).
[14] C. K. Hyon, S. C. Choi, S. W. Hwang, D. Ahn, Y. Kim, and E. K. Kim, Jpn. J. Appl. Phys. 38, 7257 (1999).
[15] J. S. Villarrubia, J. Natl. Inst. Stand. Technol. 102, 435 (1997).
[16] R. W. Stark, F. J. Rubio-Sierra, S. Thalhammer, and W. M. Heckl, Eur. Biophys. J. 32, 33 (2003).
[17] U. Rabe, K. Janser, and W. Arnold, Rev. Sci. Instrum. 67, 3281 (1996).
[18] R. W. Stark, G. Schitter, M. Stark, R. Guckenberger, and A. Stemmer, Phys. Rev. B 69, 085412 (2004).
[19] C. Martin, G. Rius, X. Borrisé, and F. Pérez-Murano, Nanotechnology 16, 1016 (2005).

Torsion mode atomic force microscopy and image processing for the analysis of protein-DNA complex binding site
Submitted (2008)
Gilberto Weissmüller, Ayhan Yurtsever, Lilian T. Costa, Ana B. F. Pacheco,
Paulo M. Bisch, Wolfgang M. Heckl, Robert W. Stark
77
Torsion mode atomic force microscopy and image processing for
the analysis of protein-DNA complexes
Gilberto Weissmüller 1, Ayhan Yurtsever 2, Lilian T. Costa 2,3, Ana B. F. Pacheco 1,
Paulo M. Bisch 1, Wolfgang M. Heckl 2,4, Robert W. Stark2
1 Instituto de Biofísica Carlos Chagas Filho, Universidade Federal do Rio de Janeiro, Rio de
Janeiro, Brazil 2 Ludwig-Maximilians-Universität München, Dept. Earth and Environmental Sciences,
Theresienstr. 41, 80333 Munich, Germany 3 Materials Metrology Division-National Institute of Metrology, Normalization and Industrial
Quality, Duque de Caxias, Brazil; 4 Deutsches Museum, Museumsinsel 1, 80538 Munich, Germany
E-mail: [email protected] , [email protected]
Abstract. Precise mapping of protein-binding sites on DNA is an important application of
imaging by atomic force microscope in nanobiotechnology. For a reliable measurement of
distances on curved molecules an adequate image analysis is required which extracts the DNA
contour from topographic AFM data. To this end we propose an image analysis method which
provides a rapid and efficient way to obtain the DNA contour together with a physical map of
single and/or multiple protein binding sites. This method relies on a calculation of the height
profile along the DNA fragment, which allows for the precise determination of the DNA
length and the relative position of the binding site occupied by a single protein molecule. As a
first test, complexes of the LexA repressor protein from the Escherichia coli SOS system and
DNA fragments containing a specific LexA binding site (recA operator) were imaged by
Torsional Resonance mode (TR-mode) and analysed using the specialized algorithm.
PACS: 68.37.Ps, 07.05.Pj, 87.14.Gg Keywords: atomic force microscope, AFM, torsional resonance, image processing, DNA
1
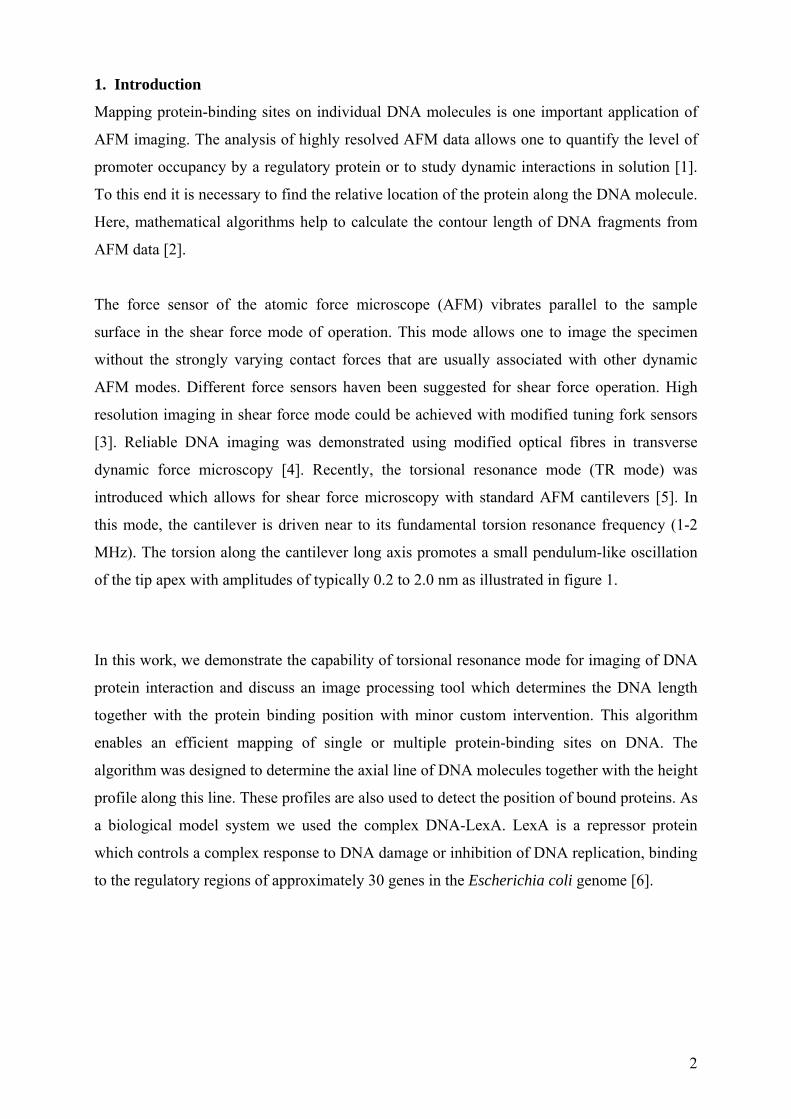
1. Introduction
Mapping protein-binding sites on individual DNA molecules is one important application of
AFM imaging. The analysis of highly resolved AFM data allows one to quantify the level of
promoter occupancy by a regulatory protein or to study dynamic interactions in solution [1].
To this end it is necessary to find the relative location of the protein along the DNA molecule.
Here, mathematical algorithms help to calculate the contour length of DNA fragments from
AFM data [2].
The force sensor of the atomic force microscope (AFM) vibrates parallel to the sample
surface in the shear force mode of operation. This mode allows one to image the specimen
without the strongly varying contact forces that are usually associated with other dynamic
AFM modes. Different force sensors haven been suggested for shear force operation. High
resolution imaging in shear force mode could be achieved with modified tuning fork sensors
[3]. Reliable DNA imaging was demonstrated using modified optical fibres in transverse
dynamic force microscopy [4]. Recently, the torsional resonance mode (TR mode) was
introduced which allows for shear force microscopy with standard AFM cantilevers [5]. In
this mode, the cantilever is driven near to its fundamental torsion resonance frequency (1-2
MHz). The torsion along the cantilever long axis promotes a small pendulum-like oscillation
of the tip apex with amplitudes of typically 0.2 to 2.0 nm as illustrated in figure 1.
In this work, we demonstrate the capability of torsional resonance mode for imaging of DNA
protein interaction and discuss an image processing tool which determines the DNA length
together with the protein binding position with minor custom intervention. This algorithm
enables an efficient mapping of single or multiple protein-binding sites on DNA. The
algorithm was designed to determine the axial line of DNA molecules together with the height
profile along this line. These profiles are also used to detect the position of bound proteins. As
a biological model system we used the complex DNA-LexA. LexA is a repressor protein
which controls a complex response to DNA damage or inhibition of DNA replication, binding
to the regulatory regions of approximately 30 genes in the Escherichia coli genome [6].
2

2. Materials and methods
LexA protein was overexpressed in E. coli strain BL21 (DE3) carrying the plasmid
pJWL228, in which lexA is fused to a T7 RNA polymerase promoter (kindly supplied by J.W.
Little, University of Arizona, Tucson, AZ). Bacteria cultivation, expression, and purification
of LexA were performed as described previously [7]. Purified LexA protein was stored in
buffer (50 mM Tris.HCl pH 7.2, 200 mM NaCl, 0.1 mM EDTA, and 5% glycerol), in liquid
nitrogen.
The LexA binding site (5’-TACTGTATGCTCATACAGTA-3’) located in the regulatory
region of the recA gene of E. coli was inserted in the EcoRI site of plasmid pIC552 (9.3 Kb)
[8]. The recombinant plasmid was digested with HindIII and PstI and DNA fragments,
containing the recA operator were purified from agarose gel using the CONCERT Rapid
Purification System (GIBCO BRL) as recommended by the manufacturer. DNA fragments
(0.7 nM) and LexA (27 nM) were mixed in a buffer containing 10 mM Tris.HCl pH 8.0 and
15 mM MgCl2, and incubated for 30 minutes at room temperature keeping a DNA:LexA
dimer proportion of 10:1. A volume of 10 l of the binding reaction was deposited on freshly
cleaved mica. After 10 min incubation at room temperature, it was rinsed with de-ionised
water (18 MΩ) during a 2 min vortex, dried under vacuum and used for AFM imaging, as
described below.
Figure 1. Scheme of the TR mode imaging system. Two piezos oscillating out of phase are used to
promote a lateral vibration of the tip.
An AFM (Dimension 3100 SPM, DI-Veeco, Santa Barbara, CA) with modifications for the
TR mode was used. Measurement were performed with silicon (NSC35) cantilevers with a
3
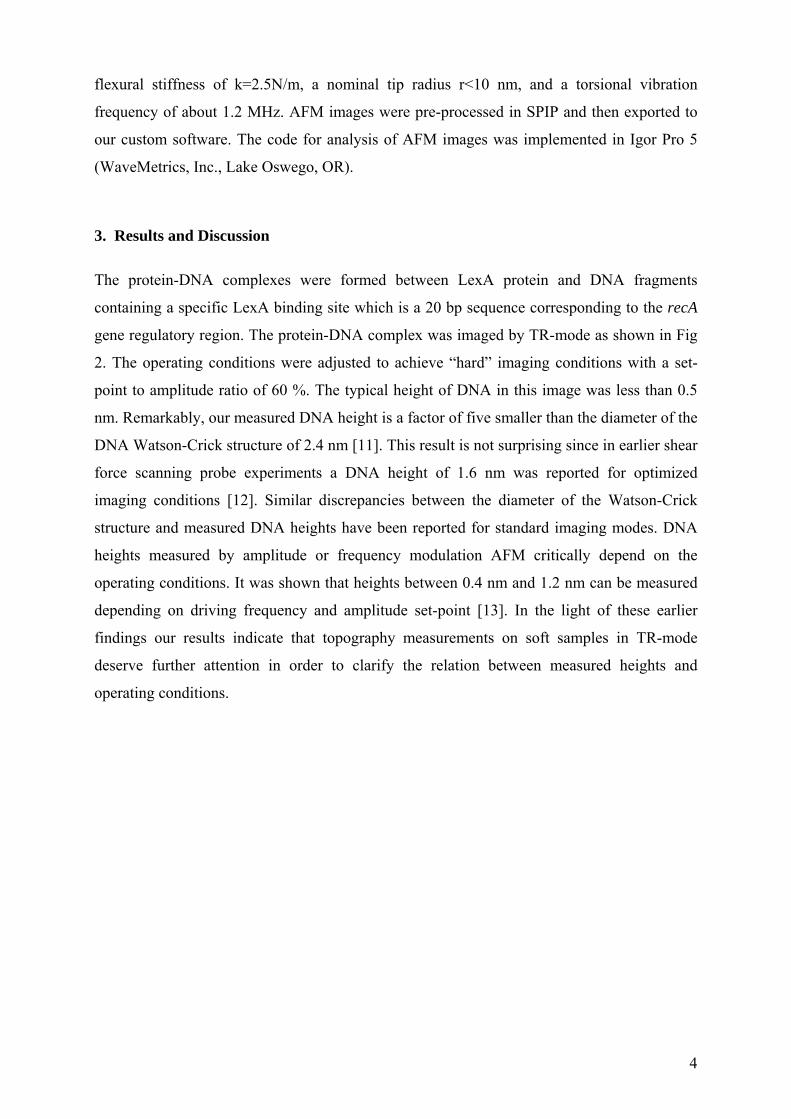
flexural stiffness of k=2.5N/m, a nominal tip radius r<10 nm, and a torsional vibration
frequency of about 1.2 MHz. AFM images were pre-processed in SPIP and then exported to
our custom software. The code for analysis of AFM images was implemented in Igor Pro 5
(WaveMetrics, Inc., Lake Oswego, OR).
3. Results and Discussion The protein-DNA complexes were formed between LexA protein and DNA fragments
containing a specific LexA binding site which is a 20 bp sequence corresponding to the recA
gene regulatory region. The protein-DNA complex was imaged by TR-mode as shown in Fig
2. The operating conditions were adjusted to achieve “hard” imaging conditions with a set-
point to amplitude ratio of 60 %. The typical height of DNA in this image was less than 0.5
nm. Remarkably, our measured DNA height is a factor of five smaller than the diameter of the
DNA Watson-Crick structure of 2.4 nm [11]. This result is not surprising since in earlier shear
force scanning probe experiments a DNA height of 1.6 nm was reported for optimized
imaging conditions [12]. Similar discrepancies between the diameter of the Watson-Crick
structure and measured DNA heights have been reported for standard imaging modes. DNA
heights measured by amplitude or frequency modulation AFM critically depend on the
operating conditions. It was shown that heights between 0.4 nm and 1.2 nm can be measured
depending on driving frequency and amplitude set-point [13]. In the light of these earlier
findings our results indicate that topography measurements on soft samples in TR-mode
deserve further attention in order to clarify the relation between measured heights and
operating conditions.
4
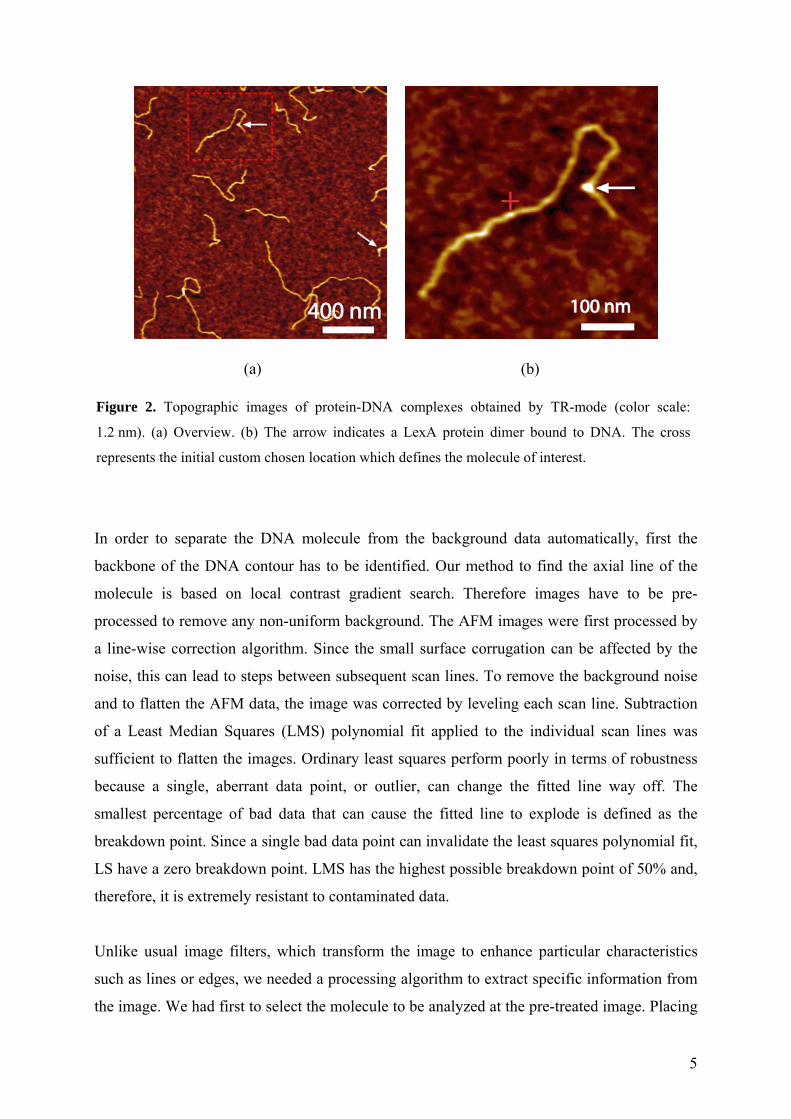
(a) (b)
Figure 2. Topographic images of protein-DNA complexes obtained by TR-mode (color scale:
1.2 nm). (a) Overview. (b) The arrow indicates a LexA protein dimer bound to DNA. The cross
represents the initial custom chosen location which defines the molecule of interest.
In order to separate the DNA molecule from the background data automatically, first the
backbone of the DNA contour has to be identified. Our method to find the axial line of the
molecule is based on local contrast gradient search. Therefore images have to be pre-
processed to remove any non-uniform background. The AFM images were first processed by
a line-wise correction algorithm. Since the small surface corrugation can be affected by the
noise, this can lead to steps between subsequent scan lines. To remove the background noise
and to flatten the AFM data, the image was corrected by leveling each scan line. Subtraction
of a Least Median Squares (LMS) polynomial fit applied to the individual scan lines was
sufficient to flatten the images. Ordinary least squares perform poorly in terms of robustness
because a single, aberrant data point, or outlier, can change the fitted line way off. The
smallest percentage of bad data that can cause the fitted line to explode is defined as the
breakdown point. Since a single bad data point can invalidate the least squares polynomial fit,
LS have a zero breakdown point. LMS has the highest possible breakdown point of 50% and,
therefore, it is extremely resistant to contaminated data.
Unlike usual image filters, which transform the image to enhance particular characteristics
such as lines or edges, we needed a processing algorithm to extract specific information from
the image. We had first to select the molecule to be analyzed at the pre-treated image. Placing
5

a graphic cursor near to a horizontal segment of the DNA molecule (fig. 2), the algorithm first
finds the exact vertical (y) position of the molecule to that chosen x position. Then, in a
similar way to the compass edge detection [9], a set of eight height (z) mean values around
that point are calculated (fig. 3). The next (x,y) point is chosen by taking the higher z mean
value to the right, so that in each step, the gradient is maximized. The process continues until
a custom chosen number of pixels is reached. The same procedure is taken to the left side of
the graphic cursor.
Figure 3. The search of the next pixel i+1, representing the DNA line axis, depends on the pixel i-1.
The only possible candidate as the next (i+1) pixel, among the eight possible directions, is the pixel in
the same direction or the two neighbouring pixels, which correspond to an expected slight bending of
the molecule.
Noise has normally a much higher spatial frequency then the DNA molecule along its axis,
which bends gradually on the surface. Therefore, as shown in Fig. 3, we can constrain the
search for each next pixel, to only three pixels, depending on the last one. This procedure
works like a low-pass filter, stabilizing the search method. In this way, a continuous sequence
of pixels is found along the DNA line, which can be stored in an array, as shown in fig 3a.
The DNA molecule height vs. length profile is automatically found by the convolution of this
array with the original image (fig. 4a). Protein recognition of specific DNA sequences can
involve changes in the local structure and conformation of the binding partners, including
curvature, bending and flexing of DNA at the protein binding site [10]. The image processing
algorithm can calculate a DNA bending angle from the DNA line axis by fitting a straight line
before and after the protein location. The measured angle was approximately 74° as shown in
6

fig. 4 a. Any protein bound to DNA is easily detected by a height peak at this profile (fig. 4b).
The total length of the molecule and the position of the protein have to be manually
determined using the placement of graphic cursors at the profile. For the molecule shown in
fig. 2, the total length was 812 nm and the protein binding site is located at 93 nm from the
nearest end.
(a)
470
460
450
440
430
420
410
Pix
el n
umbe
r (y)
240220200180
Pixel number (x)
(b)
Figure 4. Analysis of the DNA in fig. 2b. (a) The bending angle at the protein binding site is
calculated by fitting a line at the protein location (74°). (b) Height profile along the axis. The arrows
delimits the molecule and the dashed line defines the protein at 721 nm.
7

4. Conclusions
Although, the relation between operating conditions and measured topographic height of
DNA remains to be clarified we have proven that the contrast makes shear force imaging a
valuable tool for protein-DNA complex studies. In this work we also presented an image
analysis method developed to map single or multiple protein-binding sites on DNA. The
algorithm applied to line-wise flattened images could find the DNA contour line in a very
stable way. From the reconstructed line axis, the bending angle at kink sites can be calculated.
The algorithm needs very few user interventions and represents an important step toward a
fully automated analysis of DNA-protein AFM images.
Acknowledgments
We thank Dr. Ronaldo Mohana-Borges and Francisco J. R. Sousa for purification of LexA
protein and also J. Guyer for Igor Pro procedures (JEG NanoLoader). This work was
supported by Fundação Univ. José Bonifácio (FUJB), Conselho Nac. de Desenvolvimento
Científico e Tecnológico (CNPq), Coordenação de Aperfeiçoamento de Pessoal de Nível
Superior (CAPES-PROBAL) and Fundação de Amparo à Pesquisa Carlos Chagas Filho do
Estado do RJ (FAPERJ). LTC was supported by Alexander von Humboldt fellowship. AY
and RWS thank the German Federal Ministry BMBF for financial support (Nanofutur Grant
No. 03N8706).
References
[1] Gaczynska M., Osmulski P A, Jiang Y, Joon-Kyu Lee, Bermudez V and Hurwitz J
2004, Proc. Natl. Acad. Sci. U.S.A., 101:52.
Jiao Y., D.I. Cherny, G. Heim, T.M. Jovin and T.E. Schäffer 2001, J. Mol. Biol.,
314:233-243.
Moreno-Horrero F., P. Herrero, J. Colchero, A.M. Baró and F. Moreno, 2001, Biochem.
Biophys. Res. Co., 280:151-157 .
Pastushenko V. Ph., R. Kaderabek, M. Sip, C. Borken, F. Kienberger and P.
Hinterdorfer 2002, Single Mol. 3, 111-117.
Yokota H., D.A Nickerson., B.J. Trask, G. Van den Engh, M. Hirst, I. Sadowski and R.
Aebersold 1998, Anal. Biochem., 264:158-164.
[2] Y.Fang, T.S. Spisz, T. Wiltshire et al. 1998, Anal.Chem. 70, 2123-2129.
T.S.Spitz, Y. Fang, R.H. Reeves, C.K. Seymour, I.N. Bankman, J.H. Hoh 1998, Med.
Bio. Eng. Comput. 36: 667-672
8

F. Jamitzky, R.W. Stark, G. Morfill, W.M. Heckl 1998, J. Computer-Assisted Micr. 10
(2): 57-62
A.Sanchez-Sevilla, J. Thimonier, M. Marilley, J. Rocca-Serra, J. Barbet, 2002
Ultramicroscopy 92: 151-158.
[3] Göttlich H., R.W. Stark, J.D. Pedarnig, W.M. Heckl 2000, Rev. Sci. Instr., 71:3104-
3107.
[4] Antognozzi M, Szczelkun M D, Round A N and Miles M J 2002 Single Mol. 3:105-110.
[5] Huang L. and C. Su, A 2004, Ultramicroscopy 100:277-285.
[6] Fernandez de Henestrosa A R., Ogi T, Aoyagi S, Chafin D, Hayes J J, Ohmori H and
Woodgate R 2002, Mol. Microbiol., 35:1560-1572.
Little, J. W. and D. W. Mount 1982, Cell, 29:11-22.
[7] Little J.W., B. Kim, K.L. Roland, M.H. Smith, L.L. Lin and S.N. Slilaty 1994, Methods
Enzymol., 244:266-284.
[8] Macian F., I. Perez-Roger and M.E. Armengod 1994, Gene, 145:17-24.
[9] Gonzalez and Woods, Digital Image Processing - 2nd Edition - Prentice Hall (2002).
[10] Harrington R.E., 1992, Mol Microbiol., 6(18):2549-55.
[11] Watson J. D. and F. H. C. Crick 1953 Nature 171: 737–8.
[12] Antognozzi M., Szczelkun M. D., Round A. N. and Miles M. J. 2002 Single Mol. 3
105–10
[13] Nony L., R. Boisgard and J.-P. Aimé 2001, Biomacromolecules 2: 827-835.
Round A.N. and M. J. Miles 2004, Nanotechnology 15: S176-S183.
9
Amplitude and Frequency Modulation Torsional Resonance Mode Atomic Force Microscopy
Submitted (2008)
Ayhan Yurtsever, Alexander M. Gigler, and Robert W. Stark
87

Amplitude and Frequency Modulation Torsional Resonance Mode Atomic Force
Microscopy
Ayhan Yurtsever, Alexander M. Gigler, and Robert W. Stark*
Dept. of Earth and Environmental Sciences, Ludwig-Maximilians-Universität München,
Theresienstr. 41, 80333 Munich, Germany
*corresponding author Tel/Fax: +49 89 2180 4329 / 4334
E-mail: [email protected]
Abstract. Scanning probe imaging in a shear force allows for the characterization of in-plane
surface properties. In a standard AFM shear force imaging can be realize by the torsional
resonance mode. In order to investigate the imaging conditions on mineral surfaces a torsional
resonance mode atomic force microscope was operated in amplitude and frequency
modulation feedback. A freshly cleaved chlorite surface was investigated which showed
brucite-like and talc-like surface areas. In constant amplitude FM mode, a slight variation in
the energy dissipation could be observed for both surfaces. Amplitude and frequency vs.
distance curves revealed that the tip was in repulsive contact with the specimen during
imaging.
PACS: 68.37.Ps, 07.05.Pj, 87.14.Gg
Keywords: atomic force microscope, AFM, torsional resonance, frequency modulation,
chlorite, clinochlore
1
Introduction
Scanning shear force measurements with an atomic force microscope (AFM) provide access
to in-plane surface properties such as friction, shear stiffness, and other tribological surface
properties with nanometer resolution. In a torsional resonance mode AFM 1, the fundamental
torsion mode of the force sensor is used. The excitation of a torsional oscillation is in contrast
to classical resonant imaging methods that are based on flexural resonances. Provided small
oscillation amplitudes, the motion of the tip is parallel to the surface 2. Thus, the strong
nonlinearities encountered by a flexurally vibrated tip due to the vibro-impact dynamics can
be avoided. This implies that the torsional resonance mode is well suited to investigate
tribological surface properties.
Several technical concepts were demonstrated which help to achieve and analyze such a
pendulum-like oscillation of the tip. Excitation and analysis of the torsional resonances of
AFM cantilevers during contact mode experiments allow characterizing in-plane properties of
metals or semiconductors 3. In an inverted scheme, shear waves induced by a piezoelectric
transducer and traveling through the specimen, may also be used as a source of excitation 4.
Furthermore, high-resolution imaging in shear force mode has been achieved by an STM tip 5
or AFM sensor 6 mounted to the prong of a tuning fork. In this case, the tuning fork serves as
a detector for the tip sample interaction. For scanning near-field optical microscopy using
optical fibers, the shear-force distance control is a very common method 7. Based on a similar
concept, transverse dynamic force microscopy provides high sensitivity and high resolution 8.
Most techniques for shear force imaging require a modified force sensor, special substrates, or
tailored sample shakers. To alleviate this, a special cantilever holder was introduced recently,
which allows the direct excitation of torsional cantilever resonances in standard AFM setups 1. This special type of probe fixation improves the signal level while reducing possible cross
talk between flexural and torsional vibrations. In particular, two piezoelectric elements
mounted near the cantilever chip drive the tip to a small torsional oscillation. Typically, the
tip oscillates close to parallel with the surface at amplitudes smaller than 1 nm and high Q-
factors (Q > 1000).
Torsional cantilever resonances allow for the quantitative characterization of in-plane sample
properties such as friction or shear stiffness 9. Using the fundamental torsional resonance,
Pfeiffer et al. 10 could measure friction on the Cu (100) surface in UHV. Kunstmann et al. 11
2

demonstrated a combined normal and torsional measurement mode working in frequency-
modulation. In general, frequency modulation (FM) techniques in atomic force microscopy 12
have proven to be powerful tools to achieve atomic resolution 13. In order to explain the
contrast mechanisms in detail, the imaging dynamics of frequency modulated AFM was
investigated extensively, both in theory 14 and experiment 15. In spectroscopic applications,
FM techniques open the door to study the local energy dissipation which can be related to
mechanical and electrical surface properties 16. Frequency modulation in shear force imaging
was shown to enhance the performance of topographic surface profiling 17,18. The relation
between frequency shift, distance, and amplitude has been determined for optical fibers as
force sensors 19.
In the following, we discuss shear force imaging of a mineral surface with a torsional
resonance mode AFM operated in amplitude and frequency modulation feedback. Using the
FM technique, both frequency shift and energy dissipation can be mapped to topographic
surface features under ambient conditions. In order to clarify the fundamental imaging process
in torsional resonance AFM frequency shift vs. distance curves help to identify the operation
regime non-contact vs. contact.
Materials and methods
A Dimension 3100 atomic force microscope with a NanoScope IV controller was used for the
experiments. The instrument was equipped with a cantilever holder for torsional resonance
mode (Veeco Metrology Inc., Santa Barbara, CA). A torsional resonance mode cantilever
holder contains two dither piezos driven out of phase in order to induce torsional oscillations
of the cantilever. Silicon cantilevers with a nominal spring constant of 20 N/m were used for
the measurements (ZEIHR Nanosensors, Neuchatel, Switzerland). Cantilevers with a flexural
resonance frequency of less than 120 kHz and a torsional resonance frequency below 1 MHz
(typically 910 kHz) were selected. A spring constant of typically 19 (± 4) N/m was found for
these cantilevers by standard calibration procedures 20. Amplitude modulation experiments
were carried out with the system as delivered by the manufacturer (Fig. 1 (a)). A frequency
modulation feedback was realized with an external phase-locked-loop unit (Easy PLL plus
detector and controller, Nanosurf AG, Liestal, Switzerland). The FM unit was connected to
the microscope controller via a signal access module, as sketched in Figure 1 (b). The
microscope controller was set to standard operation, while the signals for feedback were
3

provided by the external electronics. Tracking of the resonant frequency was achieved by the
PLL unit, while an automatic gain control (AGC) kept the oscillation amplitude constant (CA-
Mode). The frequency shift was used as control signal for the z-feedback loop keeping the
frequency shift constant. Note that the tip has to be engaged very carefully since the cantilever
is very stiff and thus the tip can easily destroy the delicate surface structure of the specimen.
Image processing was done using the software package SPIP (Image Metrology, Lyngby,
Denmark).
(a)
(b)
Figure 1. Scheme of the feedback circuitry used for (a) amplitude and (b) frequency modulation of
torsional resonance imaging. The torsion signal is measured by a quadrant photodiode. (a) For AM the
lock-in was used as delivered by the manufacturer. (b) For FM detection the torsion signal (signal left
- right) was pre-amplified and then fed into the FM-controller. The frequency shift signal was used for
feedback the damping was detected as amplitude variation by the automatic gain control (AGC).
A pennine specimen (also known as penninate) was cleaved (origin: Rimpfischwäng, Zermatt,
Switzerland, Sample #17984 of the Bavarian Mineralogical State Collection, Munich). The
mineral pennine is a variety of clinochlore (Mg,Fe2+)5Al[(OH)8|AlSi3O10] and belongs to the
chlorite group. The chlorite clinochlore is a 2:1:1 phyllosilicate consisting of alternating
brucite-like and T-O-T (tetrahedral-octahedral-tetrahedral) layers which correspond to talc 21.
The brucite-like surface exhibits OH groups and is positively charged in the bulk whereas the
talc-like layer presents oxygen and is negatively charged. Compared to muscovite micas,
4
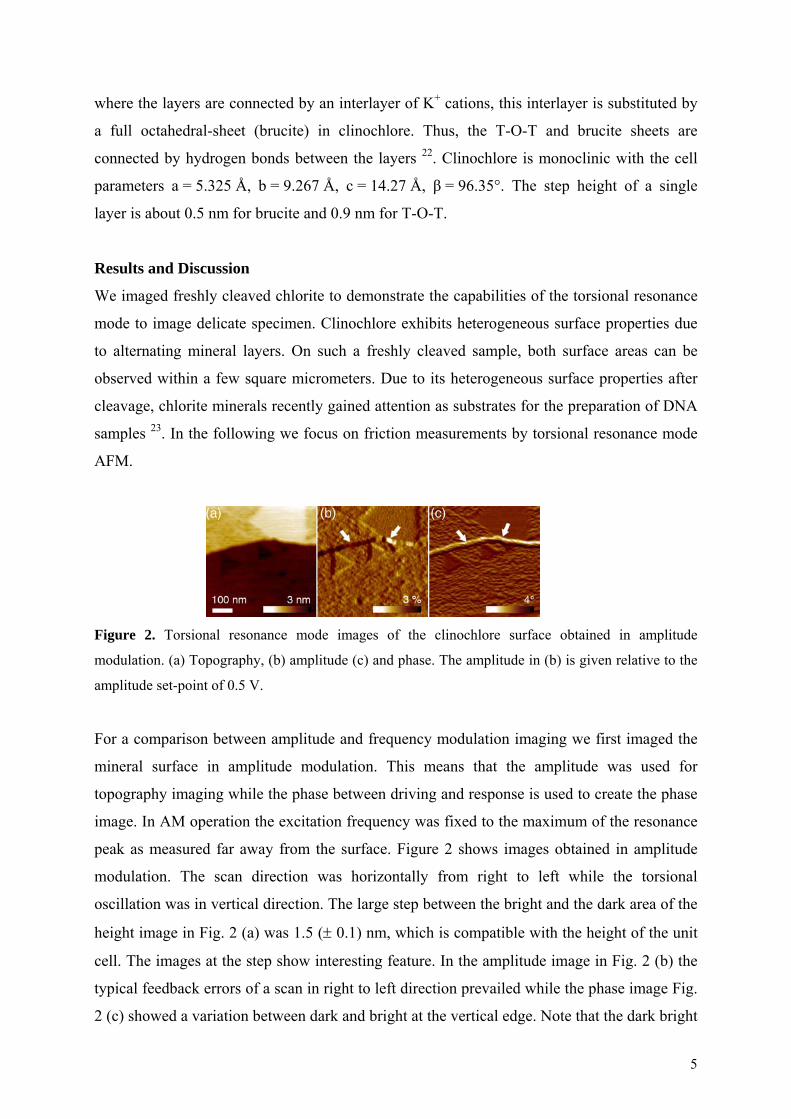
where the layers are connected by an interlayer of K+ cations, this interlayer is substituted by
a full octahedral-sheet (brucite) in clinochlore. Thus, the T-O-T and brucite sheets are
connected by hydrogen bonds between the layers 22. Clinochlore is monoclinic with the cell
parameters a = 5.325 Å, b = 9.267 Å, c = 14.27 Å, β = 96.35°. The step height of a single
layer is about 0.5 nm for brucite and 0.9 nm for T-O-T.
Results and Discussion
We imaged freshly cleaved chlorite to demonstrate the capabilities of the torsional resonance
mode to image delicate specimen. Clinochlore exhibits heterogeneous surface properties due
to alternating mineral layers. On such a freshly cleaved sample, both surface areas can be
observed within a few square micrometers. Due to its heterogeneous surface properties after
cleavage, chlorite minerals recently gained attention as substrates for the preparation of DNA
samples 23. In the following we focus on friction measurements by torsional resonance mode
AFM.
Figure 2. Torsional resonance mode images of the clinochlore surface obtained in amplitude
modulation. (a) Topography, (b) amplitude (c) and phase. The amplitude in (b) is given relative to the
amplitude set-point of 0.5 V.
For a comparison between amplitude and frequency modulation imaging we first imaged the
mineral surface in amplitude modulation. This means that the amplitude was used for
topography imaging while the phase between driving and response is used to create the phase
image. In AM operation the excitation frequency was fixed to the maximum of the resonance
peak as measured far away from the surface. Figure 2 shows images obtained in amplitude
modulation. The scan direction was horizontally from right to left while the torsional
oscillation was in vertical direction. The large step between the bright and the dark area of the
height image in Fig. 2 (a) was 1.5 (± 0.1) nm, which is compatible with the height of the unit
cell. The images at the step show interesting feature. In the amplitude image in Fig. 2 (b) the
typical feedback errors of a scan in right to left direction prevailed while the phase image Fig.
2 (c) showed a variation between dark and bright at the vertical edge. Note that the dark bright
5

contrast remains the same while the feedback control error changes sign (arrows in Fig 2 (b)
and (c)). The phase contrast at the edge is explained by the oscillating tip interacting with the
edge laterally. An attractive lateral interaction can lead to a softening of the lateral interaction
potential. Additionally, a repulsive interaction limits the oscillation when the tip is on the
lower side of the step. The dark rim is less than 10 nm wide (full width at half maximum
depth) which provides an upper boundary for the tip oscillation amplitude in this experiment
(neglecting tip geometry and long range interactions). On the plateau close to the edge, the
effective contact area is reduced decreasing elastic coupling and friction.
The topography image in Fig 2 (a) also showed a bright triangle on the upper right which was
elevated by approximately 0.4 (± 0.1) nm with respect to the upper plateau. This feature may
be explained as a brucite layer lying on top. The triangular holes are about 0.2 (± 0.1) nm
deep. One plausible explanation for this feature is a missing tetrahedral layer in the T-O-T
sheet. However, when discussing feature heights obtained in AM torsional resonance mode
one should keep in mind that the oscillation amplitude can also encode friction. On features
with increased friction, the feedback will retract the tip in order to compensate for the friction
and vice versa. In the case of this mineral surface, the effect will be rather small since the
phase image in Fig 2 (c) only shows a weak contrast, which implies only small frictional
variations. However, in order to assess the influence of friction on the topography imaging in
AM torsional resonance mode more precisely, an additional frequency modulation experiment
is needed.
Figure 3. Images obtained in FM torsional resonance mode on a clinochlore (001) surface. On the
surface brucite-like stripes are visible on a talc-like T-O-T layer. (a) Topographic image with the
frequency error (Δf) z-control. Image (b) shows the frequency shift tracking error. Image (c) shows
AGC output which corresponds to the dissipation. The color scale encodes the deviation from the
mean dissipation in the image.
6
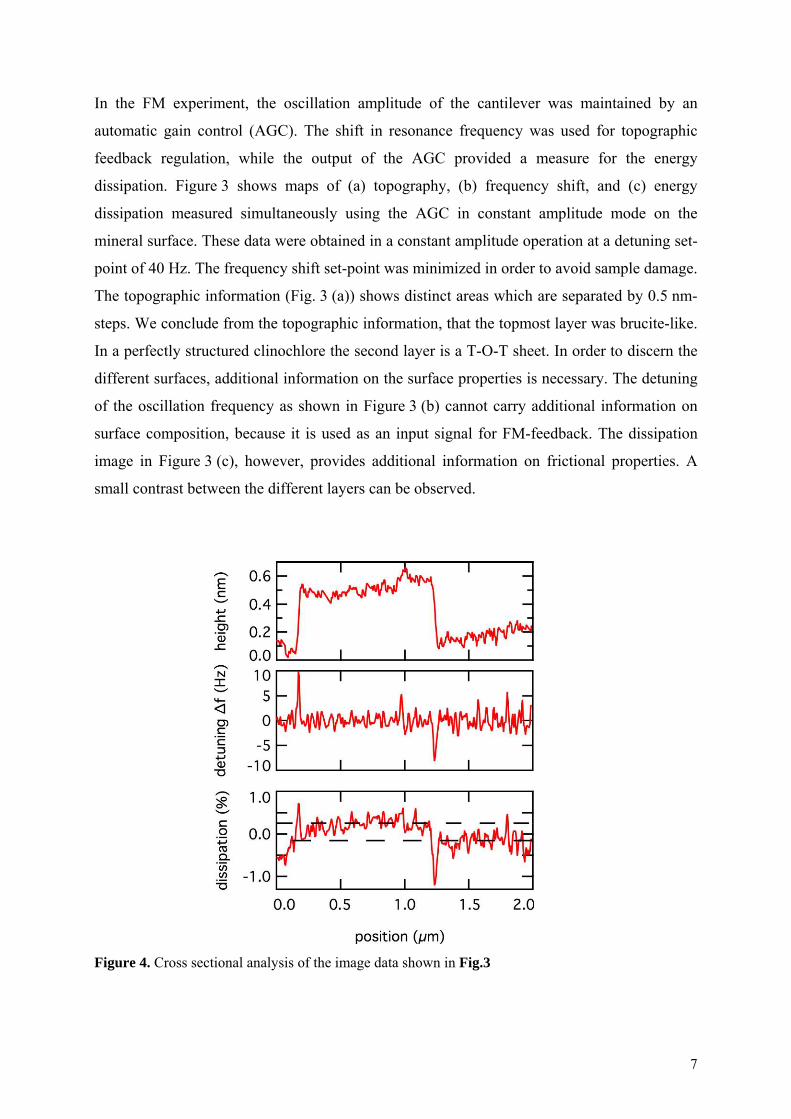
In the FM experiment, the oscillation amplitude of the cantilever was maintained by an
automatic gain control (AGC). The shift in resonance frequency was used for topographic
feedback regulation, while the output of the AGC provided a measure for the energy
dissipation. Figure 3 shows maps of (a) topography, (b) frequency shift, and (c) energy
dissipation measured simultaneously using the AGC in constant amplitude mode on the
mineral surface. These data were obtained in a constant amplitude operation at a detuning set-
point of 40 Hz. The frequency shift set-point was minimized in order to avoid sample damage.
The topographic information (Fig. 3 (a)) shows distinct areas which are separated by 0.5 nm-
steps. We conclude from the topographic information, that the topmost layer was brucite-like.
In a perfectly structured clinochlore the second layer is a T-O-T sheet. In order to discern the
different surfaces, additional information on the surface properties is necessary. The detuning
of the oscillation frequency as shown in Figure 3 (b) cannot carry additional information on
surface composition, because it is used as an input signal for FM-feedback. The dissipation
image in Figure 3 (c), however, provides additional information on frictional properties. A
small contrast between the different layers can be observed.
Figure 4. Cross sectional analysis of the image data shown in Fig.3
7

The cross sectional analysis of Figure 3 reveals a step height of 0.5 nm (Fig. 4). In the cross
section of the detuning signal only a very small tracking error is found, which can be
attributed to the response of the control loop. The contrast in dissipation between both
surfaces is 0.5 % with respect to the dissipation averaged over the entire image. On the
brucite-like surface, we observe less friction than on the talc layer. There are several potential
origins for this friction contrast, since structure and surface chemistry of both layers are quite
different. It is known from high-pressure experiments that the compression of the T-O-T layer
of clinochlore involves the tetrahedra only. The octahedral sheets are not compressed even
under high pressure conditions 22. Thus, one can identify several parameters contributing to a
frictional contrast. Firstly, the mechanical coupling between the tip and the brucite surface
should be slightly stiffer than the contact with the talc-like surface region. Secondly, with
respect to surface chemistry, the brucite-like layer is known to exhibit hydroxyl groups
whereas the talc-like layer presents oxygen. Kelvin probe imaging with the same type of
cantilever reveals a measured contact potential difference of typically 50 mV (data not
shown). Thus, also Joule friction might play a role. Thirdly, both surfaces are structurally
slightly different, which can cause differences in the elemental friction processes on the
atomic scale. Although the atomistic origin of the friction contrast remains to be clarified
several conclusions can be drawn regarding the AM experiment in Fig. 2. On the brucite-like
layer energy dissipation is slightly decreased as compared to the TOT layer. In order to assess
the possible degree of crosstalk between topography and friction in AM experiments the
amplitude vs. distance relation has to be determined.
In order to decouple elastic and dissipative contributions we measured the relation between
amplitude and distance in a constant excitation FM scheme. In this experiment the excitation
frequency follows the detuning of the force sensor due to elastic coupling between tip and
sample. A measured amplitude reduction is thus largely caused by damping 18. A typical
approach and retract cycle is shown in figure 5. During approach, the frequency shift, the
amplitude reduction, and the vertical cantilever deflection remained at a constant level. At
0 nm, the tip snapped into contact with the surface (asterisk in figure 5). After snap-in, the
cantilever deflection was negative, i.e. the cantilever was bent towards the sample by -4 nm (-
80 nN). Coincidently, an increasing detuning and a decrease of the oscillatory amplitude were
observed. Approaching closer, the frequency detuning increases and the cantilever deflection
towards the surface decreases until the cantilever deflection nearly reached zero at a detuning
of 600 Hz. The cantilever deflection was nearly fully balanced at about 5 nm after the snap-in.
8

This snap-in can be explained by strong attractive forces due to van der Waals interaction and
capillary condensation which induced a liquid neck between tip and sample during approach.
The attractive surface forces pulled the cantilever towards the surface causing a frictional
contact between tip and sample. The strong attractive force of about 80 nN at snap-in is
typical for such high energy surfaces such as mica. The signals acquired during the approach-
retract-cycle exhibited a strong hysteresis. Passing the point of snap into contact, the tip
seemed to have gradually detached from the surface, which can be explained by pulling on the
liquid neck. At a z-position of -5 nm, the tip finally detached from the surface.
Figure 5. Dynamic approach and retract curves acquired in constant excitation mode. Torsional
resonance detuning and oscillation amplitude were measured together with the static flexural
cantilever deflection. The arrows indicate the direction of motion during data acquisition. The asterisk
marks the snap-in which is associated with the onset of detuning and energy dissipation.
9

Several conclusions can be drawn from this experiment. At 50 % amplitude - which is a
typical set-point for AM torsional resonance mode - the slope of the amplitude curve was
approximately 0.5/nm. Due to the variation of surface properties, the energy dissipation on the
brucite layer was increased by 0.5 %. In an AM feedback, this damping thus corresponds to a
height difference of 0.1 Å, which is much smaller than the lattice parameters. Thus, on the
clinochlore sample, the height error due to friction was negligible. However, large variations
of the energy dissipation as they can occur e.g. on diblock co-polymers 18 may affect the
height measurements. In general, possible crosstalk between topography and friction in AM
torsional resonance mode can be minimized by choosing an amplitude set-point at the steep
part of the amplitude vs. distance curve.
The detuning vs. distance experiment also helps to answer the question if the tip-sample
interaction was repulsive or attractive. The experimental results clearly show that for imaging
at a frequency-shift set-point on the order of ten Hertz, the tip was in mechanical contact with
the specimen. The contact was established by bending the tip towards the surface. Thus, the
attractive interaction between tip and sample was balanced by the probe stiffness and an
increasingly repulsive interaction as the set-point was increased. Although the image was
taken close to the critical frequency shift for imaging, the experiment of Figure 3 can be
understood as a shear force experiment where the degree of repulsive interaction could be
varied by variation of the detuning set-point. In order to possibly stabilize the probe in the
attractive regime and to avoid a snap to contact on a high-energy surface such as chlorite,
stiffer cantilevers with higher resonant frequencies are needed.
In summary, torsional resonance mode images were obtained on a chlinochlore surface with a
amplitude and frequency modulation feedback. In both modes stable and non-destructive
imaging could be obtained. In FM-mode an image contrast between exposed brucite-like and
T-O-T layers was achieved in the topography and dissipation signals. From the frequency
shift vs. distance curves we conclude that stable imaging can be obtained while the tip is in
repulsive contact with the specimen in both AM and FM mode. This means that the image
contrast observed in the dissipation channel in an FM experiment is a frictional contrast. With
FM torsional resonance mode a wide field of applications in tribology can be addressed. In-
10
plane sample properties such as friction can be addressed dynamically with a very spatial high
resolution.
Acknowledgments
We gratefully acknowledge financial support by the German Federal Ministry of Education
and Research (BMBF) Nanofutur grant 03N8706 and the DFG cluster of excellence
“Nanosystems Initiative Munich”. AY is supported by the scholarship of the Elite Network of
Bavaria, International Doctorate Program Nano-Bio-Technology (IDK-NBT).
References
1 L. Huang and C. M. Su, Ultramicroscopy 100 (3-4), 277 (2004).
2 A. Yurtsever, A. M. Gigler, E. Macias, and R. W. Stark, Appl. Phys. Lett. 91 (25), 253120
(2007).
3 T. Drobek, R.W. Stark, M. Gräber, and W.M. Heckl, New J. Phys. 1, 15 (1999); T. Drobek, R.
W. Stark, and W. M. Heckl, Phys. Rev. B 64 (4), 045401 (2001).
4 H. U. Krotil, T. Stifter, and O. Marti, Appl. Phys. Lett. 77 (23), 3857 (2000); M. Reinstädtler,
U. Rabe, V. Scherer, U. Hartmann, A. Goldade, B. Bhushan, and W. Arnold, Appl. Phys. Lett.
82 (16), 2604 (2003).
5 K. Karrai and R. D. Grober, Appl. Phys. Lett. 66 (14), 1842 (1995); K. Karrai and I. Tiemann,
Phys. Rev. B 62 (19), 13174 (2000).
6 H. Göttlich, R. W. Stark, J. D. Pedarnig, and W. M. Heckl, Rev. Sci. Instrum. 71 (8), 3104
(2000).
7 R. Brunner, O. Marti, and O. Hollricher, Journal of Applied Physics 86 (12), 7100 (1999).
8 M Antognozzi, MD Szczelkun, AN Round, and MJ Miles, Single Molecules 3 (2-3), 105
(2002).
9 M. Reinstädtler, T. Kasai, U. Rabe, B. Bhushan, and W. Arnold, J. Phys. D Appl. Phys. 38
(18), R269 (2005).
10 O. Pfeiffer, R. Bennewitz, A. Baratoff, E. Meyer, and P. Grutter, Phys. Rev. B 65 (16) (2002).
11 T. Kunstmann, A. Schlarb, M. Fendrich, D. Paulkowski, T. Wagner, and R. Moller, Appl.
Phys. Lett. 88 (15) (2006).
11
12 T. R. Albrecht, P. Grutter, D. Horne, and D. Rugar, J. Appl. Phys. 69 (2), 668 (1991).
13 Y. Sugawara, M. Ohta, H. Ueyama, and S. Morita, Science 270 (5242), 1646 (1995); F. J.
Giessibl, Science 267 (5194), 68 (1995); K. Fukui, H. Onishi, and Y. Iwasawa, Phys. Rev.
Lett. 79 (21), 4202 (1997).
14 M. Gauthier and M. Tsukada, Phys. Rev. Lett. 85 (25), 5348 (2000); B. Gotsmann, B.
Anczykowski, C. Seidel, and H. Fuchs, Appl. Surf. Sci. 140 (3-4), 314 (1999); L. N.
Kantorovich and T. Trevethan, Phys. Rev. Lett. 93 (23), 236102 (2004).
15 T. Fukuma, T. Ichii, K. Kobayashi, H. Yamada, and K. Matsushige, J. Appl. Phys. 95 (3),
1222 (2004); S. P. Jarvis, H. Yamada, K. Kobayashi, A. Toda, and H. Tokumoto, Appl. Surf.
Sci. 157 (4), 314 (2000); C. Loppacher, R. Bennewitz, O. Pfeiffer, M. Guggisberg, M.
Bammerlin, S. Schar, V. Barwich, A. Baratoff, and E. Meyer, Phys. Rev. B 62 (20), 13674
(2000).
16 H. Hölscher, B. Gotsmann, W. Allers, U. D. Schwarz, H. Fuchs, and R. Wiesendanger, Phys.
Rev. B 64 (7), 075402 (2001); B. Gotsmann and H. Fuchs, Phys. Rev. Lett. 86 (12), 2597
(2001).
17 W. A. Atia and C. C. Davis, Appl. Phys. Lett. 70 (4), 405 (1997).
18 A. Yurtsever, A. M. Gigler, C. Dietz, and R. W. Stark, Appl. Phys. Lett. 92, 143103 (2008).
19 I. I. Smolyaninov, W. A. Atia, S. Pilevar, and C. C. Davis, Ultramicroscopy 71 (1-4), 177
(1998).
20 J. E. Sader, J. W. M. Chon, and P. Mulvaney, Rev. Sci. Instrum. 70 (10), 3967 (1999).
21 L. Pauling, Proceedings of the National Academy of Sciences of the United States of America
16, 578 (1930); G. W. Brindley, B. M. Oughton, and K. Robinson, Acta Cryst. 3, 408 (1950).
22 M. D. Welch and W. G. Marshall, American Mineralogist 86 (11-12), 1380 (2001).
23 G. Valdre, M. Antognozzi, A. Wotherspoon, and M. J. Miles, Philosophical Magazine Letters
84 (9), 539 (2004); M. Antognozzi, A. Wotherspoon, J. M. Hayes, M. J. Miles, M. D.
Szczelkun, and G. Valdre, Nanotechnology 17 (15), 3897 (2006).
12

2. Acknowledgements This work would not have been possible without the help and support of many people. It is
my pleasure to express my gratitude to all the people supporting me during my PhD.
First of all, I would like to thank my supervisor PD Dr. Robert Walter Stark, for giving me the
opportunity to work in his research group at the Ludwig-Maximilians-Universität (LMU). He
has provided me not only a working position in his group but also accompanied all my work.
Moreover, I thank for his inspiring and encouraging way to guide me to a deeper
understanding of scientific work, and his invaluable comments during the formation of this
dissertation. I wish to thank him for everything he has taught me, and for the friendly
relationship we have had over the years.
I want to thank Prof. Wolfgang Heckl for giving me the opportunity to work in his
NanoScience research Group
Many thanks to Dr. Alexander Gigler for his fruitful scientific discussions about my PhD
work and his advises about writing scientific papers.
This whole thesis could not have looked like it is without my friends, Marc Hennemeyer,
Ferdinand Walther, Michael Bauer and Dr. Javier Rubio Sierra. I more than appreciate for
their help. The technical assistance of Stefan Burghardt is gratefully acknowledged.
I want to thank Christian Dietz from the Technical university of Chemnitz for providing us
polymer samples.
I want to thank Prof. Gilberto Weissmüller from the Instituto de Biofísica Carlos Chagas
Filho, Universidade Federal do Rio de Janeiro, for the collaboration.
I want to express my gratitude to all the group members for their help to improve my
presentation capabilities and their patience during the preparation of the conference talks.
For the financial support I would like to thank the German Federal Ministry of Education and
Research (BMBF) under grant 03N8706. I would like to acknowledge the financial and
100

academic support of LMU and Center for NanoScience (CeNS) for the scholarship through
the international Doctorate Program in "NanoBioTechnology".
I also have thanks to my undergraduate advisor Prof. Meral Aydin and Prof. Salim Ciraci
from the Bilkent University. I would not have been here today without the inspiration of Prof.
Salim Ciraci.
I wish to thank my parents for their constant support and encouragement in my education.
101
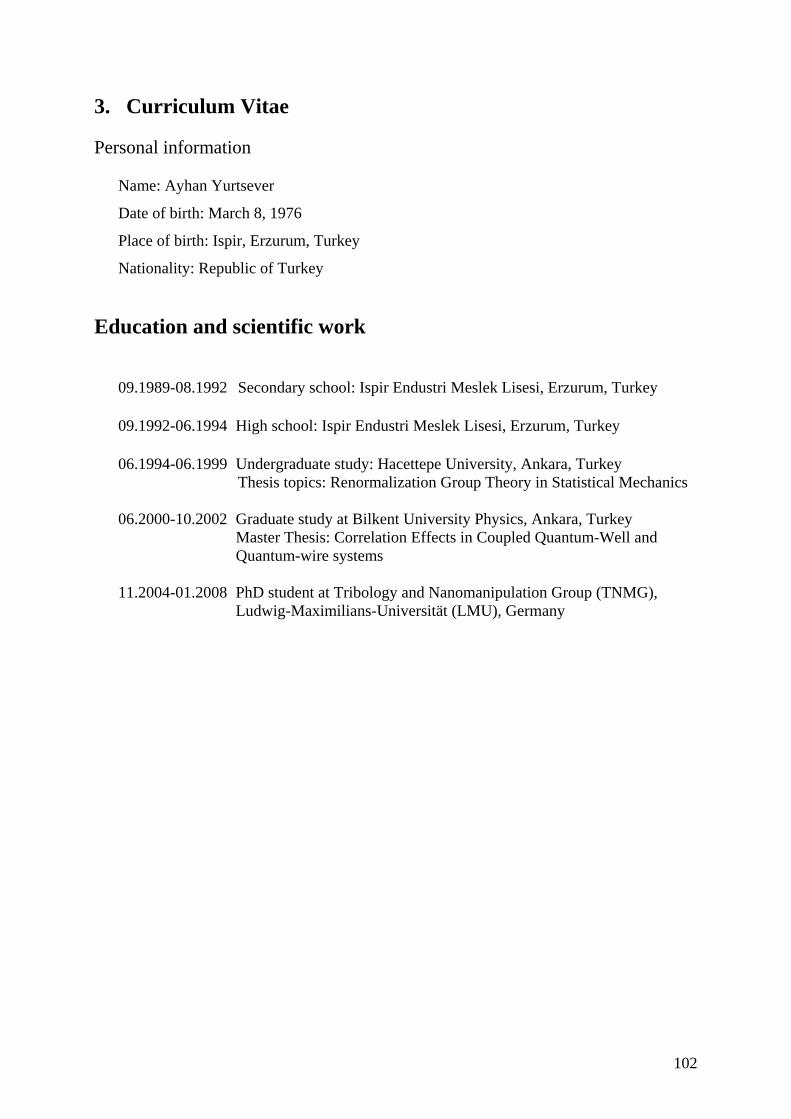
3. Curriculum Vitae Personal information
Name: Ayhan Yurtsever
Date of birth: March 8, 1976
Place of birth: Ispir, Erzurum, Turkey
Nationality: Republic of Turkey
Education and scientific work
09.1989-08.1992 Secondary school: Ispir Endustri Meslek Lisesi, Erzurum, Turkey
09.1992-06.1994 High school: Ispir Endustri Meslek Lisesi, Erzurum, Turkey
06.1994-06.1999 Undergraduate study: Hacettepe University, Ankara, Turkey Thesis topics: Renormalization Group Theory in Statistical Mechanics
06.2000-10.2002 Graduate study at Bilkent University Physics, Ankara, Turkey
Master Thesis: Correlation Effects in Coupled Quantum-Well and Quantum-wire systems
11.2004-01.2008 PhD student at Tribology and Nanomanipulation Group (TNMG),
Ludwig-Maximilians-Universität (LMU), Germany
102

Publications
1) “Frequency modulated torsional resonance mode atomic force microscopy on
polymers’’
Ayhan Yurtsever, Alexander M. Gigler, Christian Dietz, and Robert W. Stark,
Applied Physics Letters (APL) 92, 143103 (2008)
2) “Response of a laterally vibrating nano-tip to surface forces”
Ayhan Yurtsever, Alexander M. Gigler, R. W. Stark, Applied Physics
Letters (APL) 91, 253120 (2007), Selected in Virtual Journal of Nanoscale
Science & Nanotechnology: Vol. 17, 01 (2008)
3) “Amplitude and Frequency Modulation Torsional Resonance Mode Atomic
Force Microscopy”
Ayhan Yurtsever, Alexander M. Gigler, R. W. Stark, Submitted (2008)
4) “Torsion mode atomic force microscopy and image processing for the analysis of
Protein-DNA complex binding site”
Gilberto Weissmüller, Ayhan Yurtsever , Lilian T. Costa, Ana B. F. Pacheco, Paulo
M. Bisch, Wolfgang M. Heckl, Robert W. Stark, Submitted (2008)
5) “Acoustical force nanolithography of thin polymer films”
F. J. Rubio-Sierra , A. Yurtsever , M. Hennemeyer , W. M. Heckl and R. W. Stark,
Physics Status Solidi A, 203 (6), 1481-1486 (2006)
6) “Frequency modulation torsional resonance mode AFM on chlorite (001)
Ayhan Yurtsever, Alexander M. Gigler, R. W. Stark, Journal of Physics, 100,
052033 (2008)
7) “Many-body effects in the Coulomb drag between low density electron layers”
Ayhan Yurtsever, V. Moldaveanu, B. Tanatar, Solid State Com. 125 (2003) 575-579
103

8) “Dynamic correlations effects on the Plasmon dispersion in a two-dimensional
Electron gas”
Ayhan Yurtsever, V. Moldaveanu, B. Tanatar, Physical Review B, 67 115308 (2003)
9) “Ladder Approximation in coupled quantum well systems”
Ayhan Yurtsever, B. Tanatar, Physical Review B, 125320 (2002)
10) “Model boson fluid with disorder in the self-consistent field approximation”
Ayhan Yurtsever, B. Tanatar, Physics Letters A, 286 (2002), 362-368
11) “Short-range Correlations in Coupled Quantum-wire Systems”
Ayhan Yurtsever, B. Tanatar, T. Journal of Physics 26 (2002), 237-242
12) “Dynamics imaging of the single-DNA-protein interaction using the torsional
resonance mode AFM”
Ayhan Yurtsever, G. Weissmüller, Lilian T. Costa, R. W. Stark, Proceedings of the
VII Annual Linz Winter Workshop
Scientific talks and Contributions
Ayhan Yurtsever, A. M. Gigler, and R. W. Stark: Frequency modulation torsional resonance mode AFM, International NC-AFM conference, 16-20 September, Antalya, Turkey (2007)
Ayhan Yurtsever, A. M. Gigler, and R. W. Stark: Energy dissipation measurement with frequency modulated torsional resonance mode AFM (FM-TR-AFM), International Conference on Nano Science and Technology (ICN+T 2007), Stockholm, Sweden Ayhan Yurtsever, A. M. Gigler, R. W. Stark: Shear force imaging with frequency modulation feedback in torsional resonance mode, Scanning Probe Microscopies and Organic materials, 26-28 September 2007, Hamburg, Germany
Ayhan Yurtsever, A. M. Gigler, R. W. Stark: Measuring energy dissipation with torsional
resonance mode atomic force microscopy in frequency modulation, Regensburg, DPG-Spring- Meeting, 2007-03-26.
104
Ayhan Yurtsever, A. M Gigler, C. Dietz, R. Magerle, R. W Stark: Frequency modulation torsional resonance atomic force microscopy (FM-TR-AFM) for in-plane surface properties measurement, Macromolecular Systems for NanoScience - Chemistry, Physics and Engineering Aspects", Irsee September 6th-9th 2007, Germany Ayhan Yurtsever, R. W. Stark: DNA-protein interaction analyzed by shear force AFM, ENNaB-Workshop, BMBF Junior Research Groups in Nanotechnology, April 2006 in München, Germany Ayhan Yurtsever, R. W. Stark: Local Anodic Oxidation by Atomic Force Microscopy ENNaB-Workshop: Excellence Network NaNoBio Technology, Munich, Germany 2005
F.J. Rubio-Sierra, Ayhan Yurtsever, R. Vazquez, W. M. Heckl, R.W. Stark:
Toward controlled surface manipulation at the nanometer scale by atomic force microscopy TNT 2005 "Trends in Nanotechnology", Oviedo, Spain
Ayhan Yurtsever, V. Moldaveanue, B. Tanatar: Coulomb Drag effect on bilayer electron system, Paul Sherere institute (PSI), Switzerland 2003
105