nano-structured cell-adhesive and cell-repulsive plasma-deposited coatings: chemical and...
TRANSCRIPT
Full Paper
540
Nano-Structured Cell-Adhesive andCell-Repulsive Plasma-Deposited Coatings:Chemical and Topographical Effects onKeratinocyte Adhesion
Eloisa Sardella,* Loredana Detomaso, Roberto Gristina, Giorgio S. Senesi,Hossein Agheli, Duncan S. Sutherland, Riccardo d’Agostino, Pietro Favia
Cell-adhesive and cell-repulsive coatings have been plasma-deposited on poly(ethyleneterephthalate) surfaces previously structured with nano-metric conical features by meansof colloidal lithography. Surface analysis revealed that both coatings are conformal on nano-structured substrates, with their wettabilitydepending on the substrate morphology. Theeffect of surface chemistry and surface topogra-phy on cell adhesion has been investigated andclarified. The adhesion of a human keratinocytecell-line was found to be strongly dependent onthe surface topography for plasma-depositedacrylic acid (cell-adhesive), and on the surfacechemistry for poly(ethylene oxide)-like (cell-repul-sive) coatings.
Introduction
Cells respond to micro- and nano-metric surface fea-
tures[1,2] with changes in adhesion, morphology, and gene
E. Sardella, R. Gristina, G. S. SenesiInstitute of Inorganic Methodologies and Plasmas (IMIP) – CNR,70126 Bari, ItalyFax: þ39 80 544 3405; E-mail: [email protected]. Detomaso, R. d’Agostino, P. FaviaDepartment of Chemistry, University of Bari, 70126 Bari, ItalyR. d’Agostino, P. FaviaPlasma Solution Srl, Spin-off of the University of Bari,via Orabona 4, 70126 Bari, ItalyH. Agheli, D. S. SutherlandiNANO Interdisciplinary Research Center, University of Aarhus,Aarhus 8000, Denmark
Plasma Process. Polym. 2008, 5, 540–551
� 2008 WILEY-VCH Verlag GmbH & Co. KGaA, Weinheim
expression.[3–5] In the last decades such knowledge is steering
a trend in biomedical research, aiming to affordable
techniques for producing micro- and nano-patterned
biomedical surfaces and scaffolds with controlled chemical
composition and morphology.[6–8] Such substrates could
possibly drive cell adhesion, growth and physiology in
many applications, including biomaterials, prostheses,
tissue/cell engineering, regenerative medicine, biosensors,
microfluidics and biochips. So far, the development of
nano-structured biointerfaces was limited by the high
production cost of nano-features with advanced precise
methods (e.g. electron beam lithography[9]), by the
difficulty to pattern large area substrates, and by the long
patterning time. Newer approaches to nano-scale patterns,
such as X-ray lithography[10] and nano-imprint lithogra-
phy,[11,12] are thus being developed for obtaining reliable,
DOI: 10.1002/ppap.200800005
Nano-Structured Cell-Adhesive and Cell-Repulsive . . .
fast and cheap fabrication techniques of nano-structured
large area surfaces, as required in cell culture and tissue
engineering applications. Colloidal lithography (CL),
among other techniques, revealed as inexpensive, well
established nano-fabrication technique able to generate
nano-scale features of different shapes on large areas at
reasonable speed and cost.[13,14] CL-structured interfaces
have been often used to produce substrates featured
ad hoc to investigate cell adhesion and morphology.[14,16]
CL exploits the self-assembly of micro/nano-metric
colloidal particles in hexagonal arrays on properly
prepared surfaces; such arrays act as physical masks,
and can be transferred at the surface of the substrate with
lithographic steps, including sputtering and etching
processes. Plasma-enhanced chemical vapor deposition
(PE-CVD)[15] can also be used to modify the substrate
surface through the openings of the sphere array.
Investigating the effects of nano-topography (rough-
ness, shape/size of features, geometric vs. random
distribution, etc.) on cell behavior requires cell-growth
experiments on flat and nano-structured surfaces char-
acterized by same identical chemical composition and
different topography, or vice versa.[16] Studies performed
on surfaces with different topography and identical
chemical properties show that also topography can control
the organization of adsorbed proteins directly involved in
cell adhesion processes.[17,18]
How to use micro/nano-topography, independently
from surface chemistry, to drive the adhesion and growth
of cells, and to which extent cell functions (e.g., production
of certain proteins) could be stimulated/inhibited by
selected chemical/topographic surface features are still
open issues in this field.
Plasma processes are investigated and utilized in a
growing number of applications in life science, from
biomaterials to tissue engineering, from sterilization to
biosensors.[19] Plasma processes can be coupled with CL
techniques[20–24] to promote the self-assembly of the beads
when the substrate is not able to properly support particle
crystallization, to transfer the pattern of the assembled
layer to the substrate by means of PE-CVD or plasma
etching processes and to modify, in a conformal and
homogeneous way, the chemistry of the patterned surface.
PE-CVD of thin organic stable films, in particular, can
functionalize surfaces in a specific and controlled way,
with the aim of tuning adhesion, spreading and prolifera-
tion of cells on surfaces from cell-adhesive to cell-
repulsive.[25–27] Surfaces with different oxygen-containing
functionalities affect adhesion and spreading of different
cell lines;[28–31] in particular, plasma-deposited acrylic acid
(pdAA) films with controlled surface density of carboxyl
groups induce attachment and growth of keratinocytes,
osteoblasts and fibroblasts,[32–34] while plasma-deposited
poly(ethylene oxide)-like (PEO-like) coatings with at least
Plasma Process. Polym. 2008, 5, 540–551
� 2008 WILEY-VCH Verlag GmbH & Co. KGaA, Weinheim
70–80% of ether –CH2CH2O– over all carbon moieties
discourage protein and cell adhesion.[35,36]
For this work pdAA and PEO-like coatings have been
plasma-deposited on flat and conical CL-nano-structured
PET substrates, in order to study simultaneously surface
topographical and chemical effects on adhesion and
morphology of human keratinocytes. This investigation
aims to highlight the role of surface chemistry and of
surface topography in cell adhesion, but also to stress how
surface chemical/morphological properties of materials
can be adjusted to drive the behavior of cells.
Experimental Part
Colloidal Lithography
Poly(ethylene terephthalate), PET, has been utilized. PET-flat and
CL nano-structured (PET-CL) substrates have been plasma coated
with pdAA (PET-flat-pdAA; PET-CL-pdAA) and PEO-like (PET-flat-
PEO; PET-CL-PEO) coatings. The CL technique, described in detail
elsewhere,[10,37,38,39] utilizes electrostatically assembled, dispersed
monolayers of colloidal spherical particles as masks to transfer a
pattern at the surface of a substrate. PET (Goodfellow, UK) substrates
were pretreated with an O2 radio frequency (RF, 13.56 MHz) glow
discharge to improve the electrostatic self-assembly of a multilayer
of polyelectrolytes, i.e., poly(diallyldimethylammonium chloride)
(PDDA, MW 20 000–35 0000 g �mol�1, Aldrich, UK), poly(sodium 4-
styrenesulfonate) (PSS, MW 70 000 g �mol�1, Aldrich, UK), and
aluminum chloride hydroxide (ACH, Reheis). Subsequent assem-
bly of a colloidal mask of sulfate-modified polystyrene (PS) beads
(107�5 nm diameter, IDC, USA) from water solution, followed by
drying, resulted in a dispersed colloidal monolayer with short-
range order. The pattern of the mask was transferred at the PET
surface with a combination of vertical and angled Arþ ion
bombardment. A DC argon ion beam (CAIBE Ion Beam System,
Oxford Ionfab) was used to perform a two-step etching process as
follows: the first step used Arþ ions (250 eV, 0.074 mA � cm�2,
incident angle 158 off normal angle, sample rotation, 560 s) and
3 sccm O2 released at the surface as a chemical etching assistance;
the second step employed Arþ ions (250 V, 0.074 mA � cm�2,
normal incident angle, 240 s) and 3 sccm O2.
The sputter-etching process was performed until the PS beads
were completely removed, resulting in conical pillars and chemical
modifications. More details on the CL step are in ref.[39] PET-CL
samples were blown with N2 to remove any particulate
contamination, and cleaned in 70% ethanol-water. Fabrication
and cleaning were carried out in a class-1000 clean room before
packaging in airtight boxes for transfer.
Plasma Deposition Processes
PdAA coatings were deposited in a stainless steel plasma reactor
with two internal stainless steel ‘‘parallel plate’’ circular (Ø 25 cm)
electrodes; the upper is shielded and connected to a RF (13.56 MHz)
generator through a manual matching network, the lower is
grounded. The reactor was evacuated with a rotary pump
www.plasma-polymers.org 541
E. Sardella et al.
542
equipped with a liquid N2 trap. A mixture of acrylic acid (AA,
Sigma Aldrich, 99%) vapors and argon (Air Liquide) was used as
feed (AA 3 sccm, Ar 5 sccm). The pressure, monitored with a MKS
baratron, was kept constant at 150 mTorr. Discharges were ignited
for 5 min at a power input of 100 W, resulting in pdAA films
30� 5 nm thick on flat silicon samples. PdAA coatings deposited in
such conditions are known to induce good adhesion and growth
of fibroblasts[24] and were used to coat PET-flat and PET-CL
substrates.
PEO-like coatings were deposited in a stainless steel plasma
reactor equipped with two vertical ‘‘parallel plate’’ asymmetric
stainless steel electrodes The small (Ø 8 cm) one is connected to a
RF (1356 MHz) generator trough a matching network, the large (Ø
18 cm) electrode is grounded. The reactor was evacuated with a
rotary/root pump system. A mixture of diethylene glycol dimethyl
ether (DEGDME, Sigma Aldrich) vapors and Ar was used as feed
(0.4 sccm DEGDME, 5 sccm Ar). The pressure, monitored with a
MKS baratron, was kept constant at 400 mTorr. Discharges were
ignited for 30 min at a power input of 5 W, resulting in PEO-like
films 30�5 nm thick on flat silicon samples. Only this set of
experimental conditions was used, in this work, to coat PET-flat
and PET-CL substrates; PEO-like coatings deposited in such
conditions show net protein and cell repulsive ‘‘non fouling’’
properties[25,33,34] on flat surfaces.
AA and DEGDME were degassed with freeze/thaw cycles and
used without further purification; vapors of both liquids were fed
from glass reservoirs with a needle valve, Ar was fed through MKS
mass flow controllers. For both PE-CVD processes samples were
positioned on the ground electrode of the reactors.
Chemical and Morphological Analyses
Processed surfaces were characterized with X-ray photoelectron
spectroscopy (XPS) and water contact angle (WCA) measurements.
XPS analyses were performed with a PHI 5300 ESCA instrument
with non-monochromatized Mg Ka X-rays. Wide scan [0–1000 eV
binding energy (BE)] and high-resolution (C1s, O1s) spectra were
acquired at 458 electron take-off angle within 1 h after the
deposition. Error bars in the graphs are the standard deviations on
3 replicated samples. C1s spectra of pdAA and PEO-like coatings
were best fitted with four peak components corresponding to C-
atoms with zero, one, two and three carbon-oxygen bonds,
namely: C0 (C–H, C–C; 285.0�0.2 eV, BE reference); C1 (C–OH,
C–O–C; 286.6� 0.2 eV); C2 (O–C–O, C––O; 288.1�0.2 eV), C3
(COOH, COOR; 289.1�0.2 eV). For PET-flat and PET-CL surfaces the
following C1s peak components were also used: Ca (aromatic C–H,
C–C, 284.7�0.2eV); C0a (C–H in the terephthalate moiety,
286.2�0.2 eV); C3a (COOR, 288.6� 0.2 eV).[40] The best fitting
procedure was performed with a fixed full width at half maximum
(FWHM) of 2.00 eV and a 80–100% Gaussian for all peak
components. Sample charging was corrected by positioning the
hydrocarbon C1s peak component at 284.7 eV (Ca) for PET-flat and
at 285.0 eV (C0) for the other substrates.
Static and dynamic WCA measurements were performed soon
after each deposition at room temperature, with double distilled
water, using a manual optical goniometer (Rame-Hart mod100-
00). Advancing WCA (ua) measurement were performed by
progressively increasing the volume of the water drop by stepwise
Plasma Process. Polym. 2008, 5, 540–551
� 2008 WILEY-VCH Verlag GmbH & Co. KGaA, Weinheim
addition of �2mL per step until a constant angle, ua, was observed;
the volume was progressively reduced till the last WCA value, the
receding angle ur, could be read before the substrate area wetted
by the drop was reduced. To avoid vibrations and/or deformations,
the needle of the micro-syringe was kept immersed in the drop
during the measurements. WCA values reported are the mean of at
least 5 individual measurements on 3 replicated samples; the
corresponding standard deviations are reported in the graphs as
error bars.
The thickness of the coatings was measured with an Alpha-
Step1 500 (KLA TENCOR) surface profiler with a vertical resolution
of 25 A. The morphological characterization of the nano-structured
surfaces was performed with an Autoprobe CP-Research (CP-R)
scanning probe microscope. Images were acquired in the non-
contact mode of an atomic force microscope (nc-AFM) with
commercial, unmodified silicon nitride tips. Topographical para-
meters such as root mean square roughness (RRMS) and average
height (AH) of the nano-features were calculated with a
ThermoMicroscopes SPMLab NT Ver. 5.01 software on three
different points (3 replicated samples). The frequency of each
measured height of the investigated surface area was represented
with a normalized histogram.
To evaluate the stability in water of the plasma deposited films,
duplicate samples were XPS, WCA and AFM analyzed before and
after 50 h of soaking in 7 mL of doubly distilled, non stirred water,
followed by overnight drying at room temperature.
Cell Culture
Cell culture experiments were performed with NCTC 2544 human
keratinocyte cell lines from stocks routinely grown in Dulbecco’s
modified eagle medium (DMEM) supplemented with 10% fetal
bovine serum, 50 IU �mL�1 penicillin, 50 IU �mL�1 streptomycin
and 200� 10�3M glutamine, under 5% CO2/95% air atmosphere at
37 8C. All samples were placed, modified side up, in 24 well culture
plates (Iwaki 24 wells). Cells were obtained after trypsinization of
confluent or near-confluent culture, seeded (1�104 cells per well)
in suspension on all test materials and incubated at 37 8C under
5%CO2/95% air atmosphere. After different periods of incubation
(30 min, 180 min and 24 h) cells were fixed with formaldehyde
(4 wt.-% in PBS for 15 min, then stained with Comassie blue. Cell
attachment, distribution and morphology on flat and nano-
structured surfaces were measured as a function of culture time
using digital images acquired with a phase contrast light micro-
scope (Leica DM IL). The number of adhered cells was determined
in at least 10 areas of 0.8 mm2 per sample. At least three repeated
samples per experiment were analyzed. The two-way ANOVA and
the Bonferroni post test were used to evaluate statistical
significant differences among samples. Variations were consid-
ered significant when p<0.05 was obtained.
Results and Discussion
PET-Flat and Nano-Structured PET-CL Substrates
Conical nano-features were formed on PET with the CL
technique, as described in ‘Colloidal Lithography’. Figure 1
DOI: 10.1002/ppap.200800005
Nano-Structured Cell-Adhesive and Cell-Repulsive . . .
Figure 1. 3D AFM micrographs and height distribution of PET-flat (a) and of PET-CL (b) surfaces.
Figure 2. Best fitted C1s XPS signal of PET-flat (a) and PET-CL(b) surfaces. Refer to Table 4 for XPS C1s components.
shows the nc-mode AFM 3D topography images of PET-flat
(a) and PET-CL (b) substrates with their normalized height
distribution. Only one height distribution was recorded on
PET-flat surfaces, with AH value of 4� 2 nm. The conical
shape of PET-CL structures is well evident; two height
distributions were observed on PET-CL, the first peak
(lower value) refers to the AH of the background, the
second (higher) value refers to the AH of the conical nano-
features. The distance between the two peaks is the AH
value of the nano-cones, 117� 5 nm in this work. C1s XPS
signals shown in Figure 2 evidence the different surface
composition of PET-flat and PET-CL surfaces, due to the
chemical changes (broken/re-arranged bonds) induced by
the Ar/O2 etching process in the CL procedure. The typical
shake-up feature (292 eV) due to the aromatic rings in PET
disappears from the outer layer of PET-CL surfaces, the
COOR/H (C3) component becomes less intense, and new
components C1 and C2 (ether/alcohol and carbonyl
groups) appear. A slight decrease of the O/C XPS ratio is
also observed, from 0.40� 0.01 (PET-flat) to 0.37� 0.2 (PET-
CL). These results attest for a high crosslinking of the
outermost layers (up to 10 nm) of PET due to the Ar/O2
sputter/etching process.[37,41]
Data in Table 1 show no significant difference of static
WCA values between PET-flat and PET-CL surfaces; a
marked difference is found, instead, for their WCA
hysteresis, i.e. the difference between ua and ur values.
The WCA hysteresis is typical for non-ideal surfaces, due to
Plasma Process. Polym. 2008, 5, 540–551
� 2008 WILEY-VCH Verlag GmbH & Co. KGaA, Weinheim
www.plasma-polymers.org 543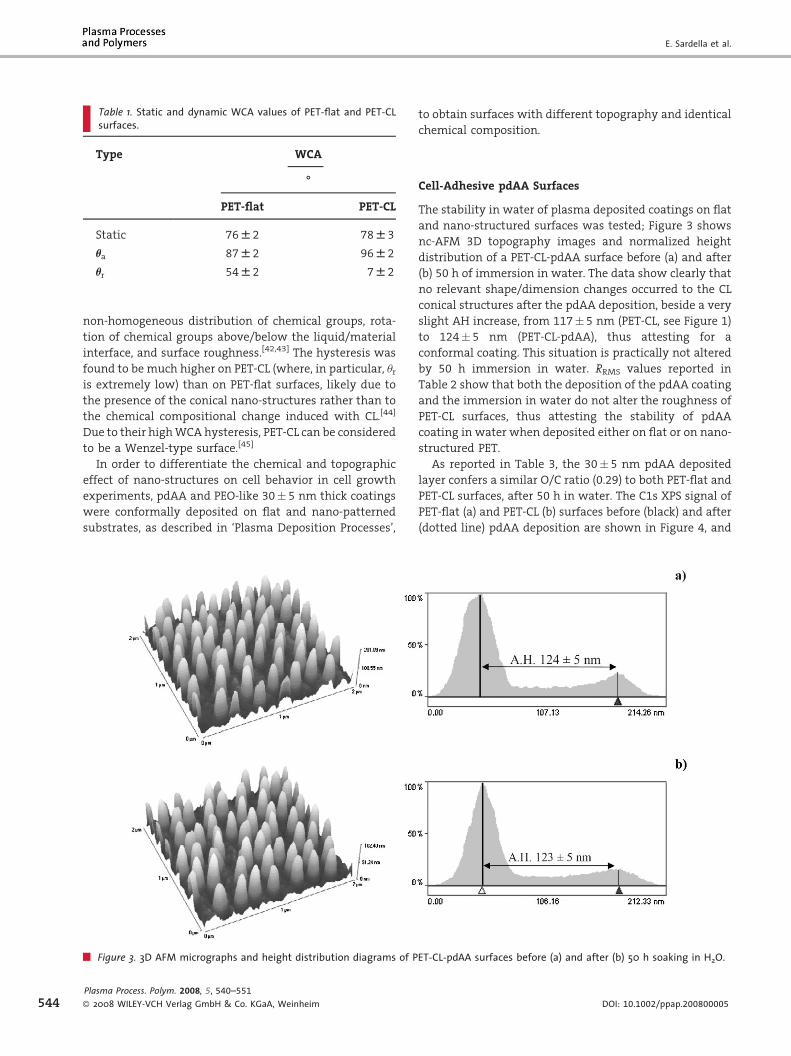
E. Sardella et al.
Table 1. Static and dynamic WCA values of PET-flat and PET-CLsurfaces.
Type WCA
-
PET-flat PET-CL
Static 76W 2 78W 3
ua 87W 2 96W 2
ur 54W 2 7W 2
544
non-homogeneous distribution of chemical groups, rota-
tion of chemical groups above/below the liquid/material
interface, and surface roughness.[42,43] The hysteresis was
found to be much higher on PET-CL (where, in particular, ur
is extremely low) than on PET-flat surfaces, likely due to
the presence of the conical nano-structures rather than to
the chemical compositional change induced with CL.[44]
Due to their high WCA hysteresis, PET-CL can be considered
to be a Wenzel-type surface.[45]
In order to differentiate the chemical and topographic
effect of nano-structures on cell behavior in cell growth
experiments, pdAA and PEO-like 30� 5 nm thick coatings
were conformally deposited on flat and nano-patterned
substrates, as described in ‘Plasma Deposition Processes’,
Figure 3. 3D AFM micrographs and height distribution diagrams of P
Plasma Process. Polym. 2008, 5, 540–551
� 2008 WILEY-VCH Verlag GmbH & Co. KGaA, Weinheim
to obtain surfaces with different topography and identical
chemical composition.
Cell-Adhesive pdAA Surfaces
The stability in water of plasma deposited coatings on flat
and nano-structured surfaces was tested; Figure 3 shows
nc-AFM 3D topography images and normalized height
distribution of a PET-CL-pdAA surface before (a) and after
(b) 50 h of immersion in water. The data show clearly that
no relevant shape/dimension changes occurred to the CL
conical structures after the pdAA deposition, beside a very
slight AH increase, from 117� 5 nm (PET-CL, see Figure 1)
to 124� 5 nm (PET-CL-pdAA), thus attesting for a
conformal coating. This situation is practically not altered
by 50 h immersion in water. RRMS values reported in
Table 2 show that both the deposition of the pdAA coating
and the immersion in water do not alter the roughness of
PET-CL surfaces, thus attesting the stability of pdAA
coating in water when deposited either on flat or on nano-
structured PET.
As reported in Table 3, the 30� 5 nm pdAA deposited
layer confers a similar O/C ratio (0.29) to both PET-flat and
PET-CL surfaces, after 50 h in water. The C1s XPS signal of
PET-flat (a) and PET-CL (b) surfaces before (black) and after
(dotted line) pdAA deposition are shown in Figure 4, and
ET-CL-pdAA surfaces before (a) and after (b) 50 h soaking in H2O.
DOI: 10.1002/ppap.200800005
Nano-Structured Cell-Adhesive and Cell-Repulsive . . .
Table 2. RRMS value of PET-flat and PET-CL surfaces uncoated,pdAA-coated, and after 50 h soaking in H2O.
Surface RRMS
nm
PET-flat PET-CL
Uncoated 1.0W 0.5 42.6W 1.9
pdAA 1.4W 0.5 46.5W 1.9
pdAA/H2O 1.8W 0.5 47.9W 1.9
Table 3. XPS O/C ratio of PET-flat and PET-CL substrates uncoated,pdAA-coated before and after 50 h in H2O.
Surface O/C ratio
PET-flat PET-CL
Uncoated 0.47W 0.03 0.37W 0.03
pdAA 0.29W 0.03 0.29W 0.03
pdAA/H2O 0.30W 0.03 0.29W 0.03
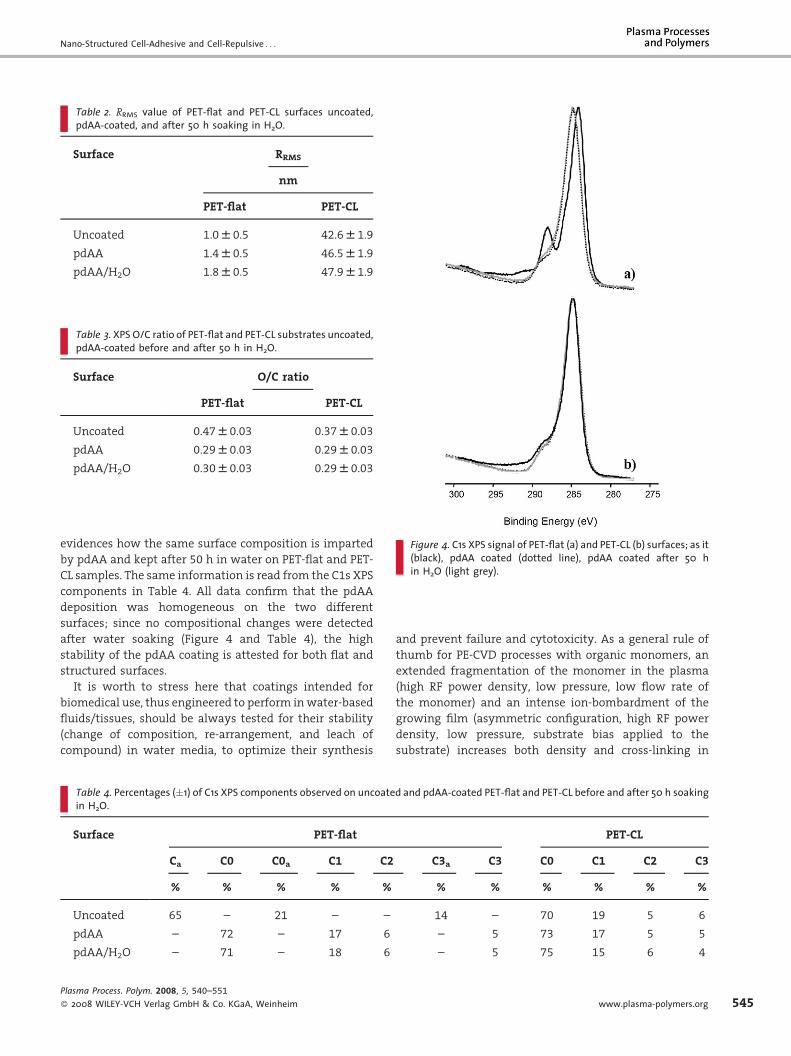
Figure 4. C1s XPS signal of PET-flat (a) and PET-CL (b) surfaces; as it(black), pdAA coated (dotted line), pdAA coated after 50 hin H2O (light grey).
evidences how the same surface composition is imparted
by pdAA and kept after 50 h in water on PET-flat and PET-
CL samples. The same information is read from the C1s XPS
components in Table 4. All data confirm that the pdAA
deposition was homogeneous on the two different
surfaces; since no compositional changes were detected
after water soaking (Figure 4 and Table 4), the high
stability of the pdAA coating is attested for both flat and
structured surfaces.
It is worth to stress here that coatings intended for
biomedical use, thus engineered to perform in water-based
fluids/tissues, should be always tested for their stability
(change of composition, re-arrangement, and leach of
compound) in water media, to optimize their synthesis
Table 4. Percentages (�1) of C1s XPS components observed on uncoatein H2O.
Surface PET-flat
Ca C0 C0a C1 C2
% % % % %
Uncoated 65 – 21 – –
pdAA – 72 – 17 6
pdAA/H2O – 71 – 18 6
Plasma Process. Polym. 2008, 5, 540–551
� 2008 WILEY-VCH Verlag GmbH & Co. KGaA, Weinheim
and prevent failure and cytotoxicity. As a general rule of
thumb for PE-CVD processes with organic monomers, an
extended fragmentation of the monomer in the plasma
(high RF power density, low pressure, low flow rate of
the monomer) and an intense ion-bombardment of the
growing film (asymmetric configuration, high RF power
density, low pressure, substrate bias applied to the
substrate) increases both density and cross-linking in
d and pdAA-coated PET-flat and PET-CL before and after 50 h soaking
PET-CL
C3a C3 C0 C1 C2 C3
% % % % % %
14 – 70 19 5 6
– 5 73 17 5 5
– 5 75 15 6 4
www.plasma-polymers.org 545
E. Sardella et al.
Table 5. Static and dynamic WCA values of PET-flat-pdAA andPET-CL-pdAA substrates.
WCA
-
Static ua ur
PET-flat-PdAA 59W 2 74W 2 38W 2
PET-CL-pdAA 78W 3 96W 2 10W 4
PET-flat-pdAA/H2O 59W 2 74W 2 38W 2
PET-CL-pdAA/H2O 77W 2 95W 2 9W 4
546
the coatings, and lead to solid, reliable coating-substrate
interfaces highly stable in water. As a drawback, a reduced
density of the chemical functionalities of the monomer is
found in the corresponding coating. This is exactly what
happens to the pdAA coating used in this research,[32] with
reduced O/C ratio (Table 3) and density of COOH groups
(%C3, Table 4), but high stability in water.
Static and dynamic WCA values for pdAA-coated
surfaces are reported in Table 5. The static WCA value of
PET-CL-pdAA remained unchanged with respect to
uncoated PET-CL surfaces (see Table 1). On the contrary,
the WCA value of PET-flat-pdAA is lower than PET-flat
surfaces (Table 1), as it occurs also for pdAA coatings
deposited in the same conditions on glass, silicon, PS,[24]
and other substrates. According to the Wenzel equation, in
effect, a flat surface characterized by a WCA value lower
than 908, like our PET-flat-pdAA samples, should become
even more hydrophilic when its roughness increases.[46–48]
The static WCA values show, instead, that PET-CL-pdAA
surfaces become slightly less hydrophilic than correspond-
ing flat surface. Very likely, as also reported in the
literature,[49] this deviation is due to the fact that, besides
chemical composition and roughness, other factors
influence the wettability of a surface, such as shape,
density and distribution of the micro/nano-structures
themselves. In our case, although slight, the change of
wettability of PET-CL-pdAA with respect to PET-flat-pdAA
surfaces goes in the opposite direction with respect to
what is predicted by the Wenzel equation.
The lack of surface homogeneity introduced by conical
nano-structures introduces also WCA hysteresis; a higher
hysteresis value was found (see Table 5) on PET-CL-pdAA
with respect to the corresponding flat surfaces, as observed
(see Table 1) for PET-flat and PET-CL surfaces. These results
suggest a predominant effect of topography on the
wettability of the surfaces investigated, that could likely
influence also the behaviour of cells seeded and grown
there. Static and dynamic WCA values remained
unchanged after water soaking (see Table 5), thus
Plasma Process. Polym. 2008, 5, 540–551
� 2008 WILEY-VCH Verlag GmbH & Co. KGaA, Weinheim
confirming once more the stability of all pdAA-coated
surfaces.
Cell-Repulsive PEO-Like Surfaces
Also the stability in water of flat and nano-structured
surfaces coated with the PEO-like film (PET-flat-PEO and
PET-CL-PEO, respectively) was tested; Figure 5 shows
nc-AFM 3D surface topography images and the related
normalized height distribution of 30� 5 nm thin non-
fouling PEO-like coatings deposited on conical PET-CL
surfaces before (a) and after (b) 50 h of soaking in distilled
water. After a comparison with Figure 1, it can be stated
that, also in this case, no shape change occurred on the
conical nano-structures after the deposition of the PEO-like
coating. The average height of PET-CL (117� 5 nm) and of
PET-CL-PEO (125� 5 nm) surfaces practically remained
unchanged after the PEO-like deposition, as it occurs for
the pdAA layer. The RRMS values of PEO-like coated
substrates, shown in Table 6, were found to be very
similar to those measured on uncoated PET-CL. Further, as
the conformal pdAA layers described previously, also the
PEO-like coating resisted unaltered in shape and roughness
after 50 h of immersion in water, both on flat and on nano-
structured surfaces.
After the PEO-like deposition, the XPS O/C ratio of PET-
flat and PET-CL surfaces was found increased to the same
value (0.43� 0.03), as shown in Table 7, with respect to the
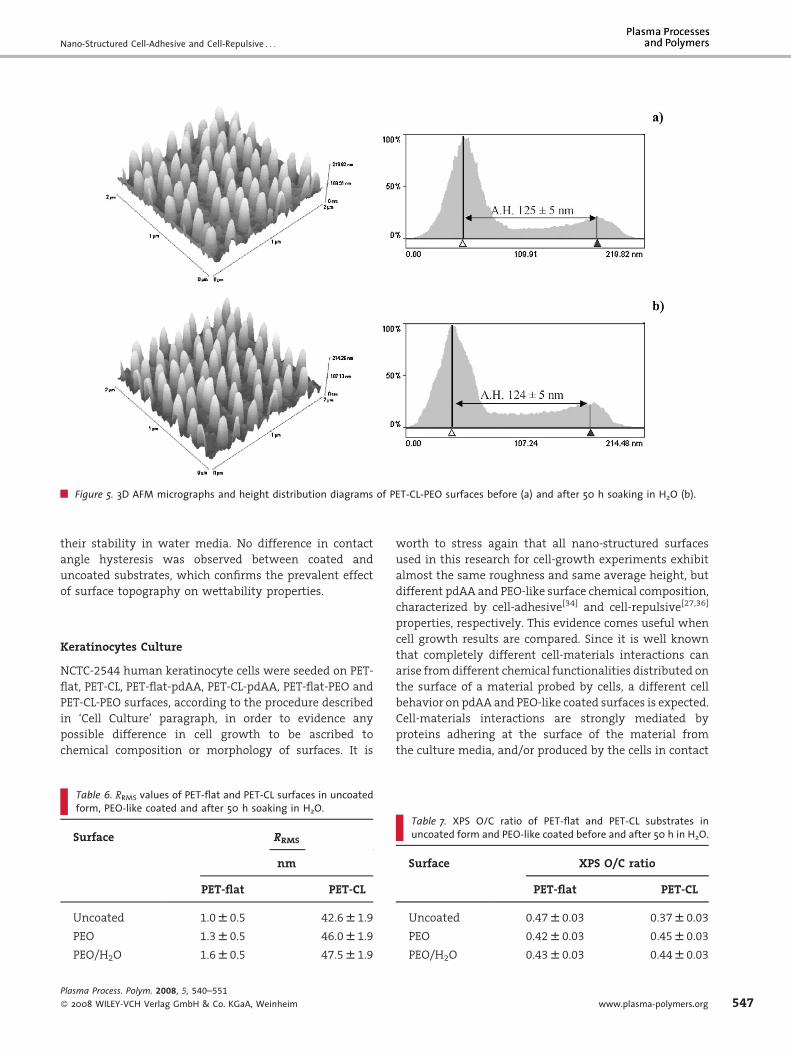
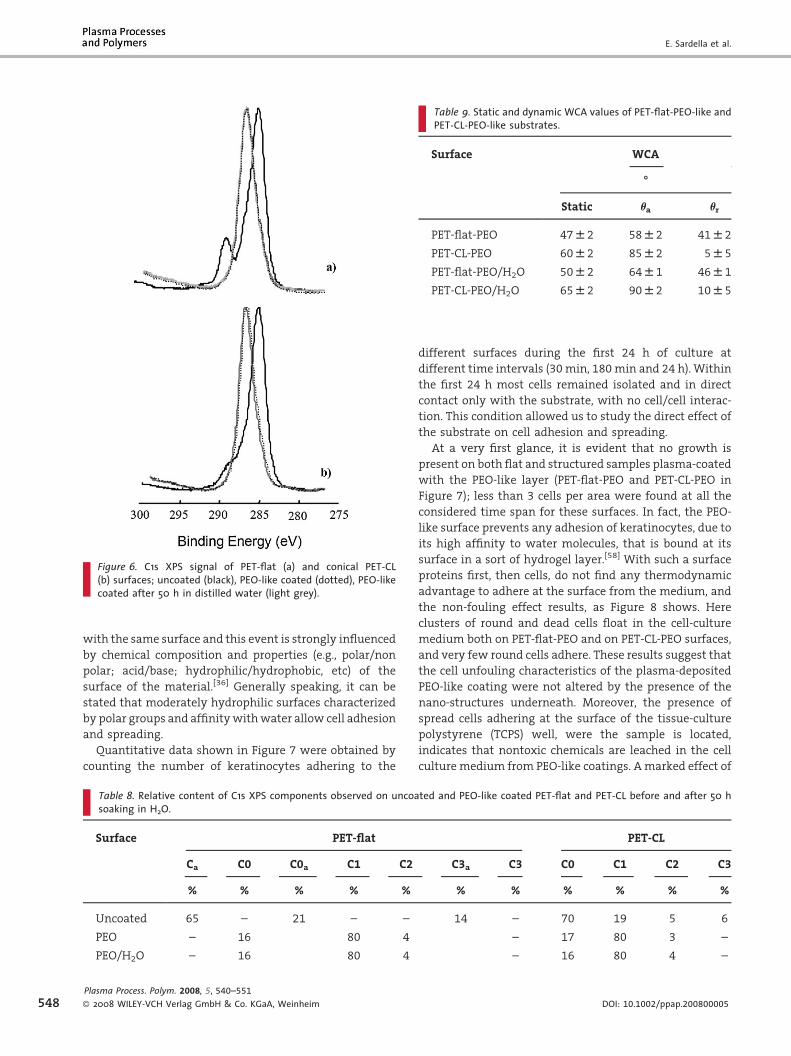
uncoated substrates. Figure 6 shows the C1s XPS signals of
(a) PET-flat and of (b) conical PET-CL surfaces before (black)
and after (dark grey) the deposition of 30� 5 nm PEO-like
coating; from these spectra and from the best-fitting C1s
data in Table 8 we can state that flat and structured PET
surfaces exhibit the same PEO-like composition, very
different from the uncoated substrates. Eighty percent of
PEO character (i.e., the relative importance of the C1 ether
component at 286.5 eV in the C1s spectrum) was measured
on both coated surfaces, that is a marker of non-fouling
character for protein and cells for plasma-deposited PEO-
like coatings.[50–52]
No alteration in the shape of the C1s signal (see Figure 6,
and Table 8) was detected after water soaking, attesting for
the resistance of also PEO-like coatings to water.
Static and dynamic WCA data of PEO-like films on flat
and conical structured surfaces before and after immersion
in water are shown in Table 9; PET-CL-PEO exhibited a
higher static WCA value than that found on PET-flat-PEO
surfaces. A higher WCA hysteresis value was measured on
PET-CL-PEO substrates with respect to PET-flat-PEO ones,
due to the very low value of the receding ur angle, as found
also for PET-CL-pdAA surfaces (see previous section), which
can be ascribed also in this case to the nano-topography.
Also for PEO-like surfaces static and dynamic WCA values
remained unchanged after water soaking, attesting for
DOI: 10.1002/ppap.200800005
Nano-Structured Cell-Adhesive and Cell-Repulsive . . .
Figure 5. 3D AFM micrographs and height distribution diagrams of PET-CL-PEO surfaces before (a) and after 50 h soaking in H2O (b).
their stability in water media. No difference in contact
angle hysteresis was observed between coated and
uncoated substrates, which confirms the prevalent effect
of surface topography on wettability properties.
Keratinocytes Culture
NCTC-2544 human keratinocyte cells were seeded on PET-
flat, PET-CL, PET-flat-pdAA, PET-CL-pdAA, PET-flat-PEO and
PET-CL-PEO surfaces, according to the procedure described
in ‘Cell Culture’ paragraph, in order to evidence any
possible difference in cell growth to be ascribed to
chemical composition or morphology of surfaces. It is
Table 6. RRMS values of PET-flat and PET-CL surfaces in uncoatedform, PEO-like coated and after 50 h soaking in H2O.
Surface RRMS
nm
PET-flat PET-CL
Uncoated 1.0W 0.5 42.6W 1.9
PEO 1.3W 0.5 46.0W 1.9
PEO/H2O 1.6W 0.5 47.5W 1.9
Plasma Process. Polym. 2008, 5, 540–551
� 2008 WILEY-VCH Verlag GmbH & Co. KGaA, Weinheim
worth to stress again that all nano-structured surfaces
used in this research for cell-growth experiments exhibit
almost the same roughness and same average height, but
different pdAA and PEO-like surface chemical composition,
characterized by cell-adhesive[34] and cell-repulsive[27,36]
properties, respectively. This evidence comes useful when
cell growth results are compared. Since it is well known
that completely different cell-materials interactions can
arise from different chemical functionalities distributed on
the surface of a material probed by cells, a different cell
behavior on pdAA and PEO-like coated surfaces is expected.
Cell-materials interactions are strongly mediated by
proteins adhering at the surface of the material from
the culture media, and/or produced by the cells in contact
Table 7. XPS O/C ratio of PET-flat and PET-CL substrates inuncoated form and PEO-like coated before and after 50 h in H2O.
Surface XPS O/C ratio
PET-flat PET-CL
Uncoated 0.47W 0.03 0.37W 0.03
PEO 0.42W 0.03 0.45W 0.03
PEO/H2O 0.43W 0.03 0.44W 0.03
www.plasma-polymers.org 547
E. Sardella et al.
Figure 6. C1s XPS signal of PET-flat (a) and conical PET-CL(b) surfaces; uncoated (black), PEO-like coated (dotted), PEO-likecoated after 50 h in distilled water (light grey).
Table 9. Static and dynamic WCA values of PET-flat-PEO-like andPET-CL-PEO-like substrates.
Surface WCA
-
Static ua ur
PET-flat-PEO 47W 2 58W 2 41W 2
PET-CL-PEO 60W 2 85W 2 5W 5
PET-flat-PEO/H2O 50W 2 64W 1 46W 1
PET-CL-PEO/H2O 65W 2 90W 2 10W 5
548
with the same surface and this event is strongly influenced
by chemical composition and properties (e.g., polar/non
polar; acid/base; hydrophilic/hydrophobic, etc) of the
surface of the material.[36] Generally speaking, it can be
stated that moderately hydrophilic surfaces characterized
by polar groups and affinity with water allow cell adhesion
and spreading.
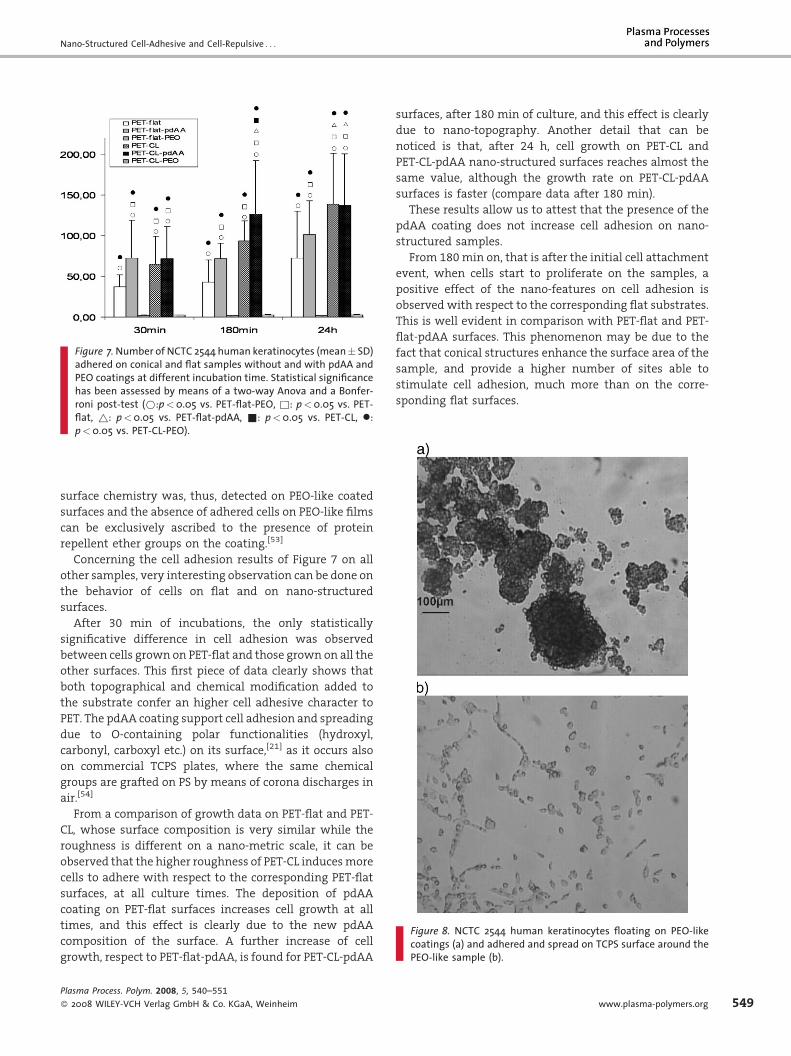
Quantitative data shown in Figure 7 were obtained by
counting the number of keratinocytes adhering to the
Table 8. Relative content of C1s XPS components observed on uncoated and PEO-like coated PET-flat and PET-CL before and after 50 hsoaking in H2O.
Surface PET-flat PET-CL
Ca C0 C0a C1 C2 C3a C3 C0 C1 C2 C3
% % % % % % % % % % %
Uncoated 65 – 21 – – 14 – 70 19 5 6
PEO – 16 80 4 – 17 80 3 –
PEO/H2O – 16 80 4 – 16 80 4 –
Plasma Process. Polym. 2008, 5, 540–551
� 2008 WILEY-VCH Verlag GmbH & Co. KGaA, Weinheim
different surfaces during the first 24 h of culture at
different time intervals (30 min, 180 min and 24 h). Within
the first 24 h most cells remained isolated and in direct
contact only with the substrate, with no cell/cell interac-
tion. This condition allowed us to study the direct effect of
the substrate on cell adhesion and spreading.
At a very first glance, it is evident that no growth is
present on both flat and structured samples plasma-coated
with the PEO-like layer (PET-flat-PEO and PET-CL-PEO in
Figure 7); less than 3 cells per area were found at all the
considered time span for these surfaces. In fact, the PEO-
like surface prevents any adhesion of keratinocytes, due to
its high affinity to water molecules, that is bound at its
surface in a sort of hydrogel layer.[58] With such a surface
proteins first, then cells, do not find any thermodynamic
advantage to adhere at the surface from the medium, and
the non-fouling effect results, as Figure 8 shows. Here
clusters of round and dead cells float in the cell-culture
medium both on PET-flat-PEO and on PET-CL-PEO surfaces,
and very few round cells adhere. These results suggest that
the cell unfouling characteristics of the plasma-deposited
PEO-like coating were not altered by the presence of the
nano-structures underneath. Moreover, the presence of
spread cells adhering at the surface of the tissue-culture
polystyrene (TCPS) well, were the sample is located,
indicates that nontoxic chemicals are leached in the cell
culture medium from PEO-like coatings. A marked effect of
DOI: 10.1002/ppap.200800005
Nano-Structured Cell-Adhesive and Cell-Repulsive . . .
Figure 7. Number of NCTC 2544 human keratinocytes (mean� SD)adhered on conical and flat samples without and with pdAA andPEO coatings at different incubation time. Statistical significancehas been assessed by means of a two-way Anova and a Bonfer-roni post-test (*:p<0.05 vs. PET-flat-PEO, &: p<0.05 vs. PET-flat, ~: p<0.05 vs. PET-flat-pdAA, &: p<0.05 vs. PET-CL, �:p<0.05 vs. PET-CL-PEO).
Figure 8. NCTC 2544 human keratinocytes floating on PEO-likecoatings (a) and adhered and spread on TCPS surface around thePEO-like sample (b).
surface chemistry was, thus, detected on PEO-like coated
surfaces and the absence of adhered cells on PEO-like films
can be exclusively ascribed to the presence of protein
repellent ether groups on the coating.[53]
Concerning the cell adhesion results of Figure 7 on all
other samples, very interesting observation can be done on
the behavior of cells on flat and on nano-structured
surfaces.
After 30 min of incubations, the only statistically
significative difference in cell adhesion was observed
between cells grown on PET-flat and those grown on all the
other surfaces. This first piece of data clearly shows that
both topographical and chemical modification added to
the substrate confer an higher cell adhesive character to
PET. The pdAA coating support cell adhesion and spreading
due to O-containing polar functionalities (hydroxyl,
carbonyl, carboxyl etc.) on its surface,[21] as it occurs also
on commercial TCPS plates, where the same chemical
groups are grafted on PS by means of corona discharges in
air.[54]
From a comparison of growth data on PET-flat and PET-
CL, whose surface composition is very similar while the
roughness is different on a nano-metric scale, it can be
observed that the higher roughness of PET-CL induces more
cells to adhere with respect to the corresponding PET-flat
surfaces, at all culture times. The deposition of pdAA
coating on PET-flat surfaces increases cell growth at all
times, and this effect is clearly due to the new pdAA
composition of the surface. A further increase of cell
growth, respect to PET-flat-pdAA, is found for PET-CL-pdAA
Plasma Process. Polym. 2008, 5, 540–551
� 2008 WILEY-VCH Verlag GmbH & Co. KGaA, Weinheim
surfaces, after 180 min of culture, and this effect is clearly
due to nano-topography. Another detail that can be
noticed is that, after 24 h, cell growth on PET-CL and
PET-CL-pdAA nano-structured surfaces reaches almost the
same value, although the growth rate on PET-CL-pdAA
surfaces is faster (compare data after 180 min).
These results allow us to attest that the presence of the
pdAA coating does not increase cell adhesion on nano-
structured samples.
From 180 min on, that is after the initial cell attachment
event, when cells start to proliferate on the samples, a
positive effect of the nano-features on cell adhesion is
observed with respect to the corresponding flat substrates.
This is well evident in comparison with PET-flat and PET-
flat-pdAA surfaces. This phenomenon may be due to the
fact that conical structures enhance the surface area of the
sample, and provide a higher number of sites able to
stimulate cell adhesion, much more than on the corre-
sponding flat surfaces.
www.plasma-polymers.org 549
E. Sardella et al.
550
Conclusion
When a material is in contact with a physiological cell
culture medium, surface chemistry and topography play
an important synergistic role in controlling all events
occurring at the interface between the material and the
biological milieu. For this reason, the fabrication of
differently shaped surfaces having the same chemistry,
or vice versa, is of great importance to understand the
fundamentals of cell-material interactions. Many nano-
structuring procedures can produce chemically and
topographically different substrates where it is almost
impossible, though, to discriminate the effect of chemical
composition from that of topography on cell behavior. In
this paper, a simple and cost effective method is described,
which allows to tune the chemical composition of
topographically different surfaces. Plasma deposition
processes are used to deposit thin conformal layers
without alteration of the substrates nano-topography; in
this way chemical and topographical effects on cell
behavior can be discriminated.
It is worth to state here that the approach followed in
this work with one topography and two different plasma
deposited coatings, pdAA and PEO-like, can be easily
extended to other topographies and other coatings of
many different properties, that plasma chemistry can
easily produce, provided that a conformal deposition is
achieved.[55–57]
For pdAA coated surfaces an improvement of cell-
adhesion was observed on nano-patterned substrates with
respect to the flat ones. Further, the inertness of PEO-like
coatings to protein adsorption and cell adhesion[28]
was confirmed, on flat and nano-patterned substrates.
We can conclude that surface conical nano-topography
plays an important role only when the surface chemistry is
suitable for supporting protein adhesion, cell adhesion and
spreading.
Acknowledgements: The EC project Nanobiotechnology andMedicine ‘‘NANOMED’’ EC 5thFP Quality of Life, and the MIUR-FIRB RBNE012B2K and RBNE01458S projects are acknowledged forfinancially supporting this research. A special acknowledgementis dedicated to S. Cosmai for his technical support. Prof. A. Curtisand Dr. M. J. Dalby (University of Glasgow, UK) are gratefullyacknowledged for a fruitful collaboration and for stimulatingdiscussions.
Received: January 15, 2008; Revised: May 2, 2008; Accepted: May16, 2008; DOI: 10.1002/ppap.200800005
Keywords: acrylic acid; cell adhesion; nanostructures; poly(ethyl-ene oxide); plasma deposition; soft lithography
[1] A. S. G. Curtis, N. Gadegaard, M. J. Dalby, M. O. Riehle, C. D. W.Wilkinson, G. Aitchison, IEE Trans. Nanobiosci. 2004, 3, 6.
Plasma Process. Polym. 2008, 5, 540–551
� 2008 WILEY-VCH Verlag GmbH & Co. KGaA, Weinheim
[2] M. J. Dalby, N. Gadegaard, M. O. Riehle, C. D. W.Wilkinson, A. S. G. Curtis, Int. J. Biochem. Cell Bio. 2004, 36,2015.
[3] A. S. G. Curtis, B. Casey, J. O. Gallagher, D. Pasqui, M. A. Wood,C. D. W. Wilkinson, Biophys. Chem. 2001, 94, 275.
[4] M. J. Dalby, S. J. Yarwood, M. O. Riehle, H. H. Johnstone, S.Affrossman, A. S. G. Curtis, Exp. Cell Res. 2002, 276, 1.
[5] M. J. Dalby, S. J. Yarwood, H. H. Johnstone, S. Affrossman, M.Fiehle, IEE Trans. Nanobiosci. 2002, 1, 12.
[6] A. S. Anderson, P. Olsson, U. Lidberg, D. S. Sutherland, Exp. CellRes. 2003, 288, 177.
[7] N. J. Sniadecki, R. A. Desai, S. A. Ruiz, C. Chen, Ann. Biomed.Eng. 2006, 34, 59.
[8] M. J. Dalby, M. O. Riehle, H. H. Johnstone, S. Affrossman,A. S. G. Curtis, Cell Bio. Int. 2004, 28, 229.
[9] M. McCord, M. Rooks, in: Handbook of Microlithography,Micromatching, and Microfabrication, P. Rai-Choudhury,Ed., SPIE Press, Bellingham, 1997, p. 2.
[10] W. M. Moreau, ‘‘Semiconductor Lithography: Principles andMaterials’’, Plenum Publishing, New York 1988.
[11] L. P. Li, Y. F. Lu, D. W. Doerr, D. R. Alexander, Nanotechnology2004, 15, 1655.
[12] K. Pfeiffer, M. Fink, G. Ahrens, G. Gruetzner, F. Reuther,J. Seekamp, S. Zankovych, C. M. Sotomayor Torres, I.Maximov, M. Beck, M. Graczyk, L. Montelius, H. Schulz,H.-C. Scheer, F. Steingrueber, Microelectr. Eng. 2002, 61–62,393.
[13] P. Hanarp, D. Sutherland, J. Gold, B. Kasemo, J. Colloids Surf. A2003, 2, 1423.
[14] Y. Xia, G. Whitesides, Angew. Chem. Int. Ed. 1998, 37, 550.[15] N. A. Bullett, R. D. Short, T. O’Leary, A. J. Beck, C. W. I. Douglas,
M. Cambray-Deakin, I. M. Fletcher, A. Roberts, C. Blomfield,Surf. Interface Anal. 2001, 31, 1074.
[16] M. J. Dalby, M. O. Riehle, D. S. Sutherland, H. Agheli, A. S. G.Curtis, Biomaterials 2004, 25, 5415.
[17] D. S. Sutherland, M. Broberg, H. Nygren, B. Kasemo, Macromol.Biosci. 1, 1, 270.
[18] F. A. Denis, P. Hanarp, D. Sutherland, J. Gold, C. Mustin, P. G.Rouxhet, Y. F. Dufrene, Langmuir 2002, 18, 819.
[19] Special issue on Biomedical Applications of Plasma Processes.Plasma Process. Polym. 2006, 3(6/7), P. Favia, Ed.
[20] B. D. Ratner, A. Chilkoti, G. P. Lopez, in: Plasma Deposition,Treatment and Etching of Polymers, R. d’Agostino, Ed., Aca-demic Press, San Diego 1990, p. 463.
[21] E. Sardella, P. Favia, R. Gristina, M. Nardulli, R. d’Agostino,Plasma Process. Polym. 2006, 3, 456.
[22] F. Bretagnol, A. Valsesia, G. Ceccone, P. Colpo, D. Gilliland, L.Ceriotti, M. Hasiwa, F. Rossi, Plasma Process. Polym. 2006, 3,443.
[23] A. Valsesia, P. Colpo, M. Manso, T. Meziani, G. Ceccone, F.Rossi, Nanoletters 2004, 4, 1047.
[24] A. Valsesia, P. Colpo, T. Meziani, F. Bretagnol, M. Lejeune, F.Rossi, A. Bouma, M. Garcia-Parajo, Adv. Funct. Mater. 2006, 16,1242.
[25] P. Favia, E. Sardella, R. Gristina, A. Milella, R. d’Agostino,J. Photopolym. Sci. Tech. 2002, 15, 341.
[26] P. Favia, E. Sardella, R. Gristina, R. d’Agostino, Surf. Coat.Technol. 2003, 169, 707.
[27] E. Sardella, R. Gristina, G. Ceccone, D. Gilliland, A.Papadopoulou-Bouraoui, F. Rossi, G. S. Senesi, L. Detomaso,P. Favia, R. d’Agostino, Surf. Coat. Technol. 2005, 200, 51.
[28] S. I. Ertel, A. Chilkoti, T. A. Horbett, B. D. Ratner, J. Biomater. Sci.Polym. 1991, 3, 163.
DOI: 10.1002/ppap.200800005
Nano-Structured Cell-Adhesive and Cell-Repulsive . . .
[29] C. D. Tidwell, S. I. Ertel, B. D. Ratner, B. J. Tarasevich, S. Atre,D. L. Allara, Langmuir 1997, 13, 3404.
[30] K. S. Siow, L. Britcher, S. Kumar, H. J. Griesser, Plasma Process.Polym. 2006, 3, 392.
[31] L. De Bartolo, S. Morelli, L. C. Lopez, L. Giorno, C. Campana, S.Salerno, M. Rende, P. Favia, L. Detomaso, R. Gristina, R.d’Agostino, E. Drioli, Biomaterials 2005, 26, 4432.
[32] R. M. France, R. D. Short, R. A. Dawson, S. Macneil, J. Mater.Chem. 1998, 8, 37.
[33] G. P. Lopez, B. D. Ratner, C. D. Tidwell, C. L. Haycox, R. J. Rapoza,T. A. Horbett, J. Biomed. Mater. Res. 1992, 26, 415.
[34] L. Detomaso, R. Gristina, G. S. Senesi, R. d’Agostino, P. Favia,Biomaterials 2005, 26, 3831.
[35] J. Ho Lee, H. Bang Lee, J. D. Andrade, Prog. Polym. Sci 1995, 20,1043.
[36] E. Sardella, R. Gristina, G. S. Senesi, R. d’Agostino, P. Favia,Plasma Process. Polym 2004, 1, 63.
[37] F. A. Denis, P. Hanarp, D. S. Sutherland, Y. Dufrene, Nanoletters2002, 2, 1419.
[38] M. A. Wood, M. O. Riehle, C. D. W. Wilkinson, Nanotechnology2002, 13, 605.
[39] H. Agheli, D. S. Sutherland, Nanobiosci. IEEE Trans. 2006, 5, 9.[40] G. Beamson, D. Briggs, ‘‘High Resolution XPS of Organic Poly-
emrs: The Scienta ESCA 300 Database’’, VCH, Weinheim 1992.[41] E. Sardella, S. Lovascio, P. Favia, R. d’Agostino, Plasma Process.
Polym. 2007, 4, S887.[42] J. D. Andrade, L. M. Smith, D. E. Gregonis, Surface and Inter-
facial Aspects of Biomedical Polymers, Plenum Press, NewYork 1985.
Plasma Process. Polym. 2008, 5, 540–551
� 2008 WILEY-VCH Verlag GmbH & Co. KGaA, Weinheim
[43] R. E. Johnson, R. H. Dettre, Adv. Chem. Ser. 1964, 43, 112.[44] A. R. Lee, J. Soc. Chem. Ind. 1936, 55, 23T.[45] R. N. Wenzel, J. Phys. Colloid Chem. 1949, 53, 1466.[46] G. Palasantzas, J. T. M. De Hosson, Acta Mater. 2001, 49, 3533.[47] H. Nakae, R. Inui, Y. Hirata, H. Saito, Acta Mater. 1998, 46,
2313.[48] Th. Uelzen, Thin Solid Films 2003, 434, 311.[49] Y. Y. Chen, J. G. Duh, J. Mater. Sci. Mater. El. 2000, 11, 279.[50] M. Morra, in: Water in Biomaterials Surface Science, M. Morra,
Ed., J. Wiley and Sons, New York 2001, p. 307.[51] R. d’Agostino, L. Martinu, V. Pische, Plasma Chem. Plasma
Proc. 1991, 11, 1.[52] E. E. Johnston, B. D. Ratner, J. D. Bryers, Plasma Processing of
Polymers, NATO ASI Series E: Applied Sciences, R. d’Agostino, P.Favia, F. Fracassi, Eds., Kluwer Academic, Dordrecht 1997,p. 346.
[53] K. J. Kitching, V. Pan, B. D. Ratner, in: Plasma Polymer Films, H.Biederman, Ed., Imperial College Press, London 2004, p. 325.
[54] L. E. Ambroski, US 3.274.090 (1996).[55] E. Sardella, Advanced Plasma Technology, R. d’Agostino, P.
Favia, Y. Kawai, H. Ikegami, N. Sato, F. Arefi-Khonsari, Eds.,Weinheim 2008, p. 243.
[56] F. Rosso, G. Marino, L. Muscariello, G. Cafiero, P. Favia, E.D’Aloia, R. d’Agostino, A. Barbarisi, J. Cell Physiol. 2006, 207,636.
[57] G. S. Senesi, E. D’Aloia, R. Gristina, P. Favia, R. d’Agostino, Surf.Sci. 2007, 601, 1019.
[58] P. Kingshott, H. J. Griesser, Curr. Opin. Solid State Mater. Sci.1999, 4, 403.
www.plasma-polymers.org 551