najam final
DESCRIPTION
DASFADFTRANSCRIPT
Vision & Mission Statements
VisionTo be a leading national enterprise with global aspirations, effectivelyPursuing multiple growth opportunities, maximizing returns to the stakeholders, remaining socially and ethically responsible.MissionTo provide our customers with premium quality products in a safe, reliable, Efficient and environmentally sound manner, deliver exceptional services and customer support, maximizing returns to the shareholders through core business and diversification, providing a dynamic and challenging environment for our employees.
Introduction to prtoject
Pakistan‟s economy is an agricultural based and its importance is well established in the country. It plays an important
and vital role in the growth of the economy, its activity, generating revenues/foreign exchange and in the development of
the industrial sector of the country. It provides raw material to the industrial sector of the country like sugar, cotton,
textile, foods, jute, tobacco and other industries and regarded as a backbone of the Pakistan‟s economic activity. It is
contributed almost 21% of the Pakistan‟s GDP and employs about 41% of the total labor force. Fertilizers have played an
important role in the growth and development of the agricultural sector especially to meet the growing demand of the food
and to achieve the self sufficiency level. Keeping the importance of fertilizer sector in my mind, I have choosen fuiji
fertilizer company for my project of financial Ratio Analysis.
Introduction of the company:
FAUJI FERTILIZER CO. LTD. Fauji Fertilizer Company Limited (FFC) is Pakistan's leading urea manufacturing
company with over 60% market share. It is principally engaged in the production, purchasing, and marketing of fertilizers
and chemicals. It offers ammonia/urea under the brand name „Sona‟, as well as nitrogen, phosphate, and potash based
fertilizers with a vision to acquire self - sufficiency in fertilizer production in the country, FFC was incorporated in 1978
as a private limited company. This was a joint venture between Fauji Foundation (a leading charitable trust in Pakistan)
and Haldor Topsoe A/S of Denmark. The initial share capital of the company was 813.9 Million Rupees. The present
share capital of the company stands above Rs. 8.48 Billion.
Introduction to Problem:
Stock investing and consistency in financial performance requires careful analysis of financial data to find out the
company's true worth. This is generally done by examining the company's profit and loss account, balance sheet and cash
flow statement. This can be time-consuming and cumbersome. An easier way to find out about a company's performance
is to look at its financial ratios.
Research question
Whether company’s performance is consistent to make investment in the company?
Objective:
Ratio analysis is an integral part of the financial statement analysis and it is most widely and powerful tool used to analyze
the company’s financial statements. The main objective of ratio analysis is to deeply analyze the information provided in
the financial statements and present meaningful results in terms of liquidity, solvency, activity and profitability of the
company in a relative form.
Hence, the main objective of the project is to facilitate all the stakeholders especially the investors and bankers to evaluate
the ability that how effectively and efficiently it manages its operations and resources/assets and to know the activity
position of the selected company. This Project will also state the reasons that why the company are able and not able to
manage their assets effectively. The Project will also enable the investors and the other stakeholders to make the decision
to invest.
Significance
The project will provide very significant, rich and valuable information for all the stakeholders, financial analysts and the
students as well. Study of the project will become enable to identify the company‟ past and current performance with
respect to the management of their resources and further will lead them to paint the future growth of the company on the
bases of the facts, figures and analysis provided in the project within the limit of financial ratio. This project will give
them solid analysis in a graphical and tabular form with an interpretation and conclusion drawn on bases of facts and
figures and allow them to take decision whether it is better to invest.
Data Source
Data Collection Sources
This project is based upon the primary sources of data and logic is that annual reports or company statements are treated
as secondary source of data and the whole project is based on company’s annual reports and financial statements.
Secondary Sources Company’s annual accounts report and their official sites has been consulted and used as a secondary
source to collect the basic and necessary information like financial statements, company profile, introduction, business
activity, and their vision and mission statements. Articles, books, stock exchange, brokers and different sites has also been
considered as secondary source available on the internet or in a physical form to collect the raw data and information as
much as possible on the topic selected in order to get a nice and comprehensive shape of the project.
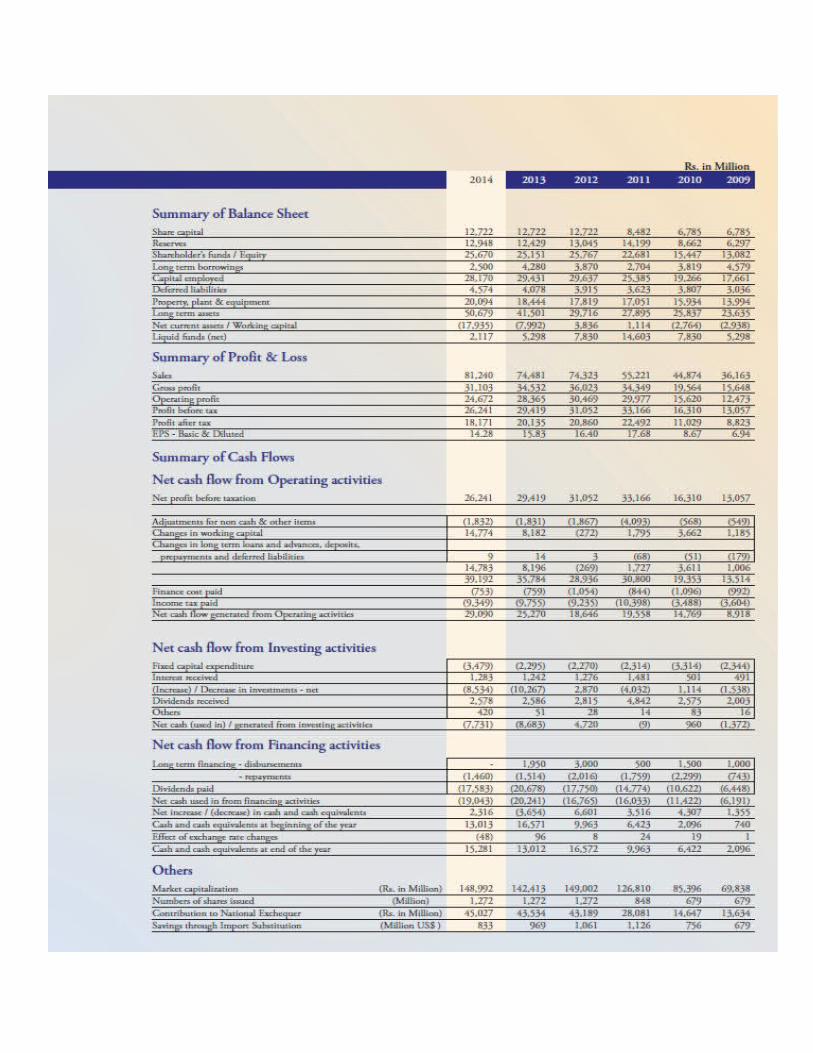
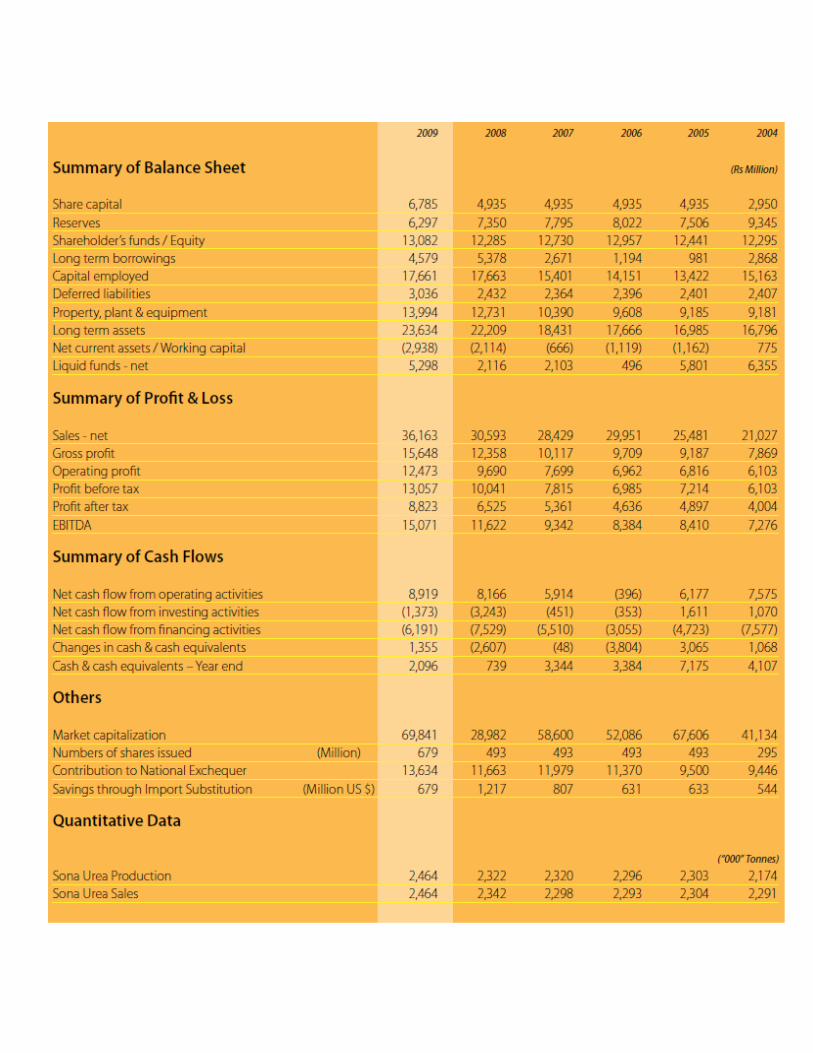
Increase in Assets Current assets include trade debts, stock,short term investments and cash & bank balances. With an aggregate balance of Rs.35.88 billion at the end of 2014, the assets recorded an increase of Rs. 20.97 billion since 2009, mainly on account of increase in short term investments, under Company policy for placement of surplus funds in term deposits for generation of incremental.
Current liabilities
Current liabilities of the Company increased from Rs. 17.86 billion in 2009 to Rs. 53.82billion in 2014, primarily on account of retained GIDC obligations, increase in short term borrowings and customer advances which is fairly in line with the Company’s growth and changes in its operating cycle.
Non-current liabilities
Total non-current liabilities comprising of long term loans, deferred taxation and long term portion of compensated leave absences, have remained fairly constant during the past 6 years. Long term loans reduced by Rs. 1.78 billion during the year on account of repayment ,while deferred liabilities increased by 12% compared to 2013. Long term financing has been utilized for asset
.

Methodology
Ratios simply mean a number expressed in terms of another. A ratio is a statistical yardstick by mean of which relationship between two or various figures can be compared or measured. Thus Ratio Analysis shows the relationship between accounting data. Ratio can be found out by dividing on number by another number. Ratio analysis is an important and age old technique of financial analysis. Following are some of the advantages of ratio analysis.
Advantages:· It simplifies the comprehension of financial statements.· Ratios tell the whole story of changes in the financial condition of the business.· It provides data for inter-company comparison. Makes inter-company comparison possible· Ratio analysis also makes possible comparison of the performance of different divisions of the company. The ratios are helpful in deciding about their efficiency or otherwise in the past and likely performance in the future.· Ratios highlight the factors associated with successful and unsuccessful company. They also reveal strong companies and weak company’s, over-valued under-valued companies.· It helps in planning and forecasting. Ratios can assist management, in its function of forecasting, planning, co-ordination, control and communications.· It helps in investment decisions in the case of investors and lending decisions in the case of investors and lending decisions in the case of bankers’ etc.
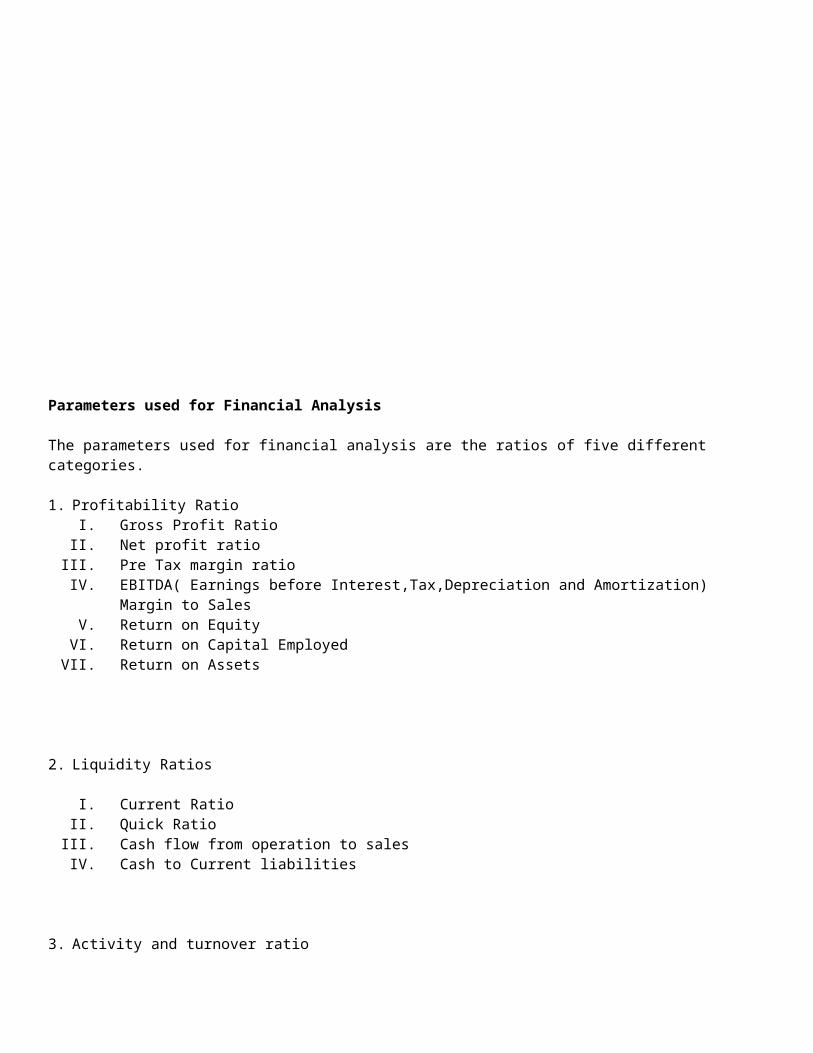
Parameters used for Financial Analysis
The parameters used for financial analysis are the ratios of five different categories.
1. Profitability Ratio I. Gross Profit Ratio
II. Net profit ratioIII. Pre Tax margin ratioIV. EBITDA( Earnings before Interest,Tax,Depreciation and Amortization) Margin to SalesV. Return on Equity
VI. Return on Capital EmployedVII. Return on Assets
2. Liquidity Ratios
I. Current RatioII. Quick Ratio
III. Cash flow from operation to salesIV. Cash to Current liabilities
3. Activity and turnover ratioI. Inventory turnover ratios
II. No of days in inventoryIII. Debtors to turn over ratiosIV. No of Days in receivableV. Creditors Turnover Ratios
VI. No of Days in payablesVII. Fixed Asset Turnover ratio
4. Investment Ratio/Market RatioI. Earnings per Share Ratio
II. Dividend yield RatioIII. Market Value per shareIV. Breakup value per shareV. Cash dividend per Share
VI. Bonus shares issued
5. Capital Structure RatiosI. Debt to equity Ratio
II. Interest coverage Ratio
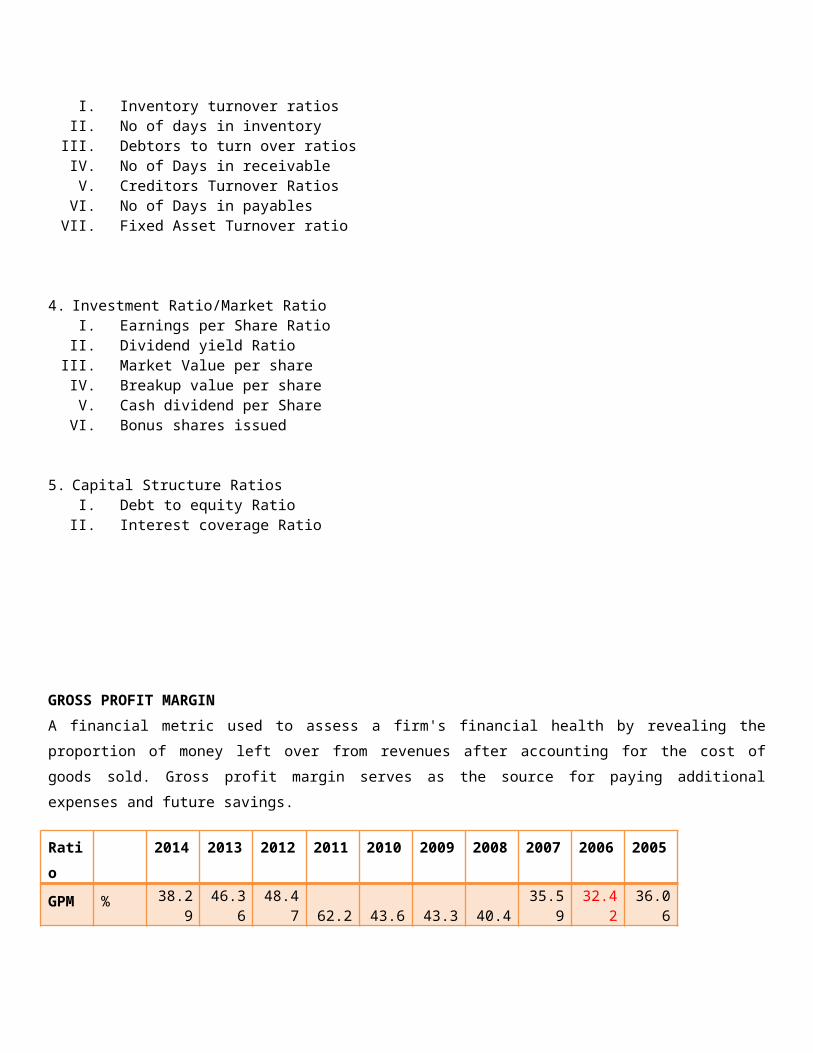
GROSS PROFIT MARGIN
A financial metric used to assess a firm's financial health by revealing the proportion of money left over from revenues
after accounting for the cost of goods sold. Gross profit margin serves as the source for paying additional expenses and
future savings.
Ratio 2014 2013 2012 2011 2010 2009 2008 2007 2006 2005
GPM % 38.29 46.36 48.47 62.2 43.6 43.3 40.4 35.59 32.42 36.06
2014 2013 2012 2011 2010 2009 2008 2007 2006 20050
10
20
30
40
50
60
70
38.29
46.3648.47
62.2
43.6 43.2740.4
35.5932.42
36.06
Series1
The gross margin is not an exact estimate of the company's pricing strategy but it does give a good indication of financial
health. Without an adequate gross margin, a company will be unable to pay its operating and other expenses and build for
the future. In general, a company's gross profit margin should be stable. It should not fluctuate much from one period to
another, unless the industry it is in has been undergoing drastic changes which will affect the costs of goods sold or
pricing policies.
Ways to improve Gross Profit Margin Ratio
Reducing Cost of Goods Sold
Cheaper Raw material
Selecting low price suppliers
Modern technology to reduce Labour cost
Increase selling price
Net Profit Margin (NPM)
A ratio of profitability calculated as net income divided by revenues, or net profits divided by sales. It measures how
much out of every dollar of sales a company actually keeps in earnings.
Net Profit Margin =Net ProfitNet Sales
Ratio 2014 2013 2012 2011 2010 2009 2008 2007 2006 2005
NPM % 22.37 27.03 28.07 40.73 24.58 24.4 21.33 18.86 15.48 19.22
2014 2013 2012 2011 2010 2009 2008 2007 2006 20050
5
10
15
20
25
30
35
40
45
22.37
27.03 28.07
40.73
24.58 24.421.33
18.86
15.48
19.22 Series1
Net Profit margin is very useful when comparing companies in similar industries. A higher profit margin indicates a more
profitable company that has better control over its costs compared to its competitors.
Ways to improve Net Profit Margin Ratio
Reducing Cost of Goods Sold

Cheaper Raw material
Selecting low price suppliers
Modern technology to reduce Labour cost
Increase selling price
Reduce unnecessary administrative expenses
Reducing finance cost
Rise in cost of sales owing to increased raw material cost and GIDC resulted in a reduction in gross and net profit margins for2014, depicting a decrease of 8% and 5% respectively from last year. Consequently, return on equity (post tax) and capital employed were also lower by 9% and 4% respectively in comparison with 2013.
Pre Tax Margin
The financial ratio pretax margin is a measure of the operating efficiency of a company. Pretax margin only requires two
inputs from the income statement: revenues and income before taxes.
Pretax Margin (%) = (Income before Taxes / Revenues) x 100
Ratio 2014 2013 2012 2011 2010 2009 2008 2007 2006 2005
PTM % 32.3 39.5 41.78 60.06 36.35 36.11 32.82 27.49 23.26 28.31
Higher pretax margins are desirable and indicative of management's ability to keep operating costs low. Investors and analysts typically evaluate a company's pretax margin over time, looking for an increase in the measure. When drawing conclusions about the relative performance of a company, benchmark comparisons should be made with competitors in the same industry.

2014 2013 2012 2011 2010 2009 2008 2007 2006 20050
10
20
30
40
50
60
70
PTM
PTM
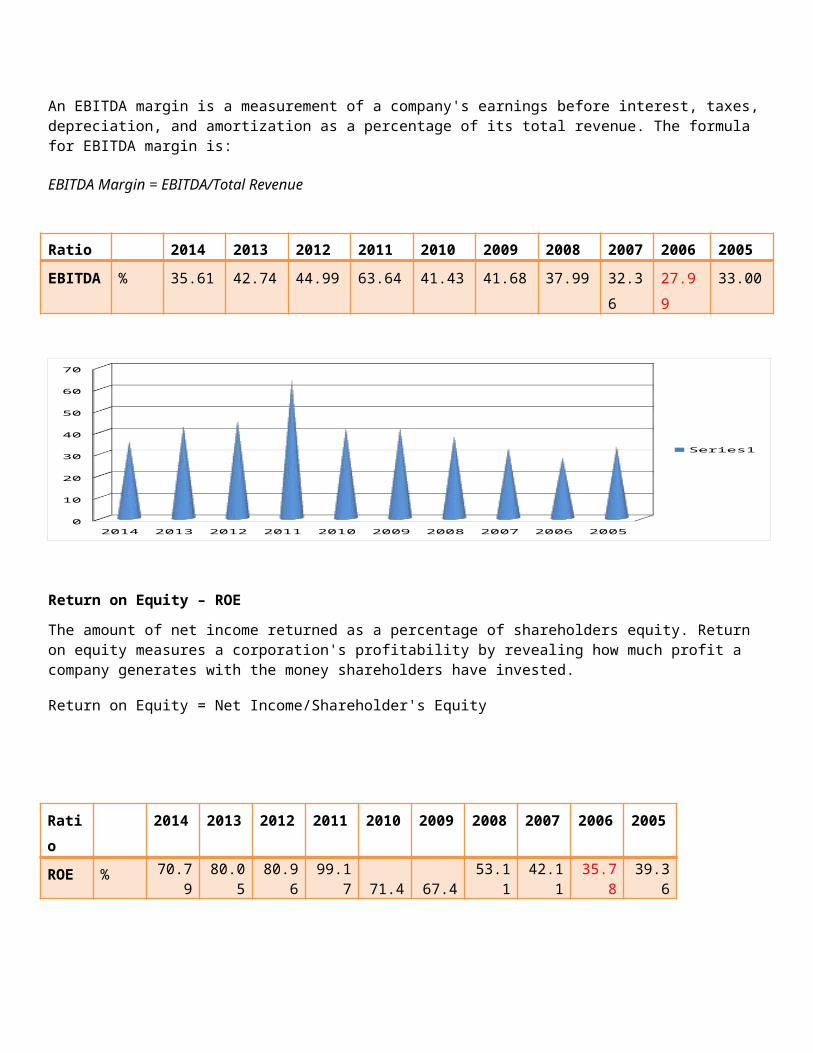
Earnings before Interest, Tax, Depreciation and Amortization margin to sales
An EBITDA margin is a measurement of a company's earnings before interest, taxes, depreciation, and amortization as a percentage of its total revenue. The formula for EBITDA margin is:
EBITDA Margin = EBITDA/Total Revenue
Ratio 2014 2013 2012 2011 2010 2009 2008 2007 2006 2005
EBITDA % 35.61 42.74 44.99 63.64 41.43 41.68 37.99 32.36 27.99 33.00
2014 2013 2012 2011 2010 2009 2008 2007 2006 20050
10
20
30
40
50
60
70
Series1

Return on Equity – ROE
The amount of net income returned as a percentage of shareholders equity. Return on equity measures a corporation's profitability by revealing how much profit a company generates with the money shareholders have invested.
Return on Equity = Net Income/Shareholder's Equity
2014 2013 2012 2011 2010 2009 2008 2007 2006 20050
20
40
60
80
100
120
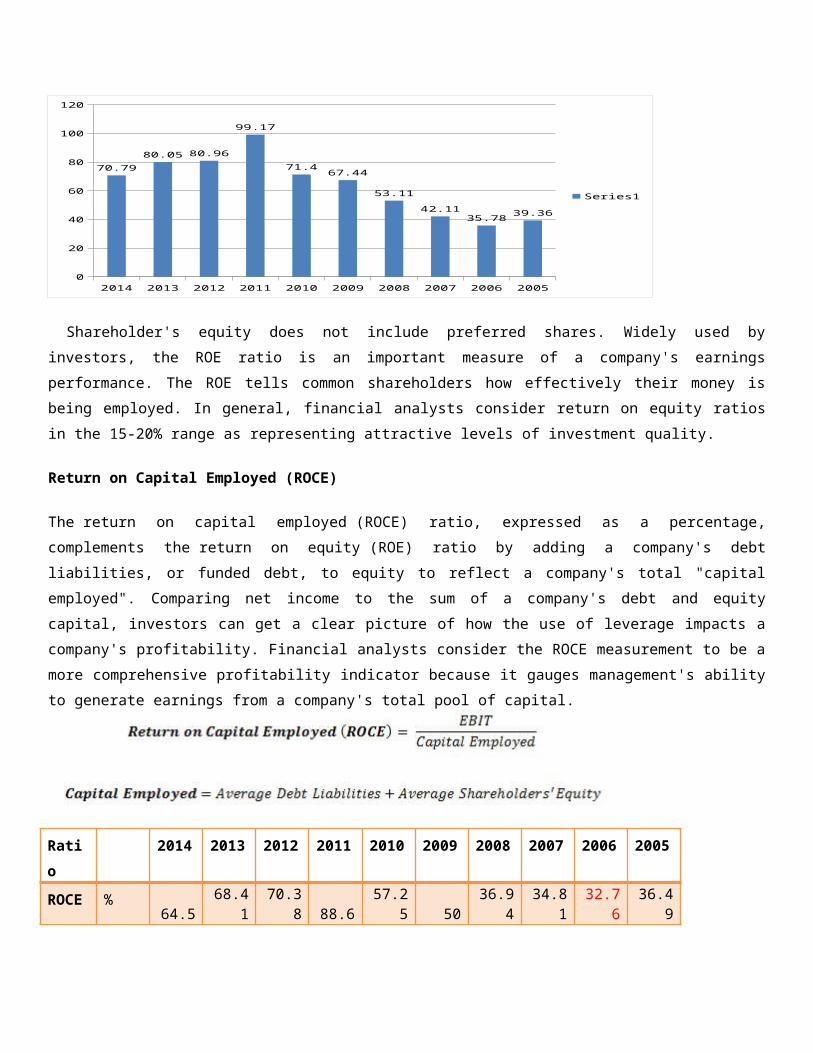
70.79
80.05 80.96
99.17
71.467.44
53.11
42.1135.78
39.36
Series1
Shareholder's equity does not include preferred shares. Widely used by investors, the ROE ratio is an important measure
of a company's earnings performance. The ROE tells common shareholders how effectively their money is being
employed. In general, financial analysts consider return on equity ratios in the 15-20% range as representing attractive
levels of investment quality.
Return on Capital Employed (ROCE)
The return on capital employed (ROCE) ratio, expressed as a percentage, complements the return on equity (ROE) ratio
by adding a company's debt liabilities, or funded debt, to equity to reflect a company's total "capital employed".
Comparing net income to the sum of a company's debt and equity capital, investors can get a clear picture of how the use
of leverage impacts a company's profitability. Financial analysts consider the ROCE measurement to be a more
comprehensive profitability indicator because it gauges management's ability to generate earnings from a company's total
pool of capital.
Ratio 2014 2013 2012 2011 2010 2009 2008 2007 2006 2005
ROE % 70.79 80.05 80.96 99.17 71.4 67.4 53.11 42.11 35.78 39.36
2014 2013 2012 2011 2010 2009 2008 2007 2006 20050
10
20
30
40
50
60
70
80
90
Series1
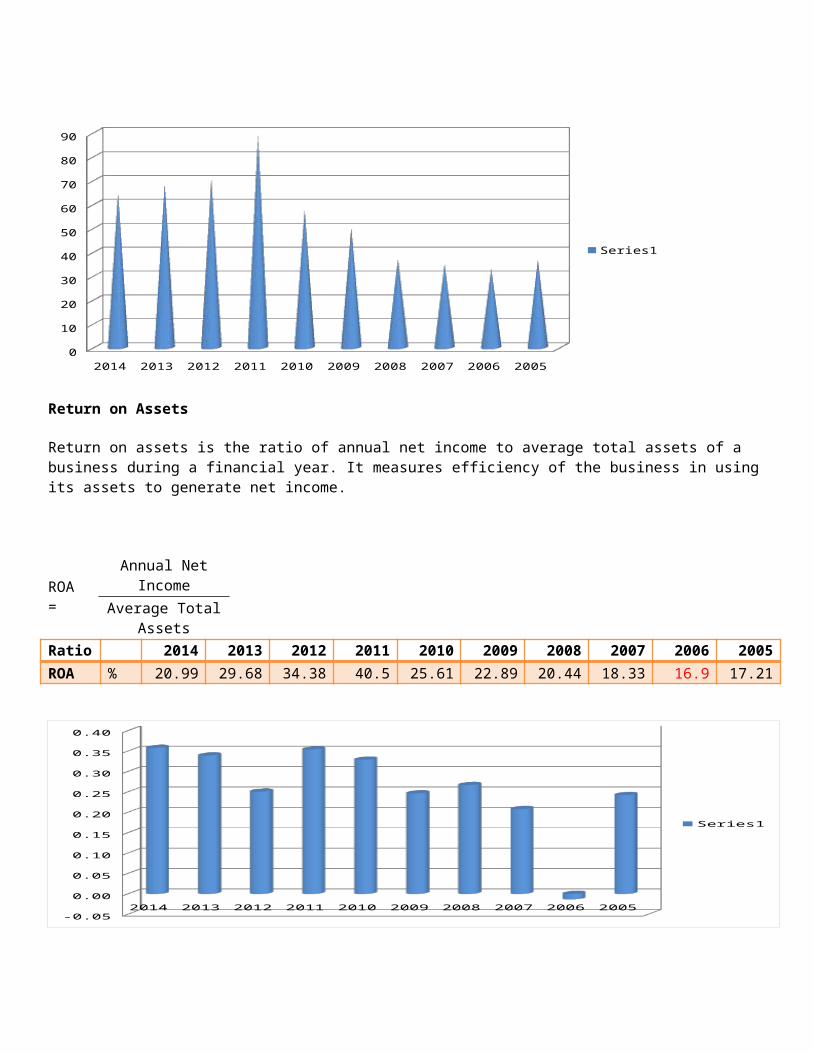
Return on Assets
Return on assets is the ratio of annual net income to average total assets of a business during a financial year. It measures efficiency of the business in using its assets to generate net income.
Ratio 2014 2013 2012 2011 2010 2009 2008 2007 2006 2005
ROA % 20.99 29.68 34.38 40.5 25.61 22.89 20.44 18.33 16.9 17.21
Ratio 2014 2013 2012 2011 2010 2009 2008 2007 2006 2005
ROCE % 64.5 68.41 70.38 88.6 57.25 50 36.94 34.81 32.76 36.49
ROA = Annual Net Income
Average Total Assets
2014 2013 2012 2011 2010 2009 2008 2007 2006 2005-0.05
0.00
0.05
0.10
0.15
0.20
0.25
0.30
0.35
0.40
Series1
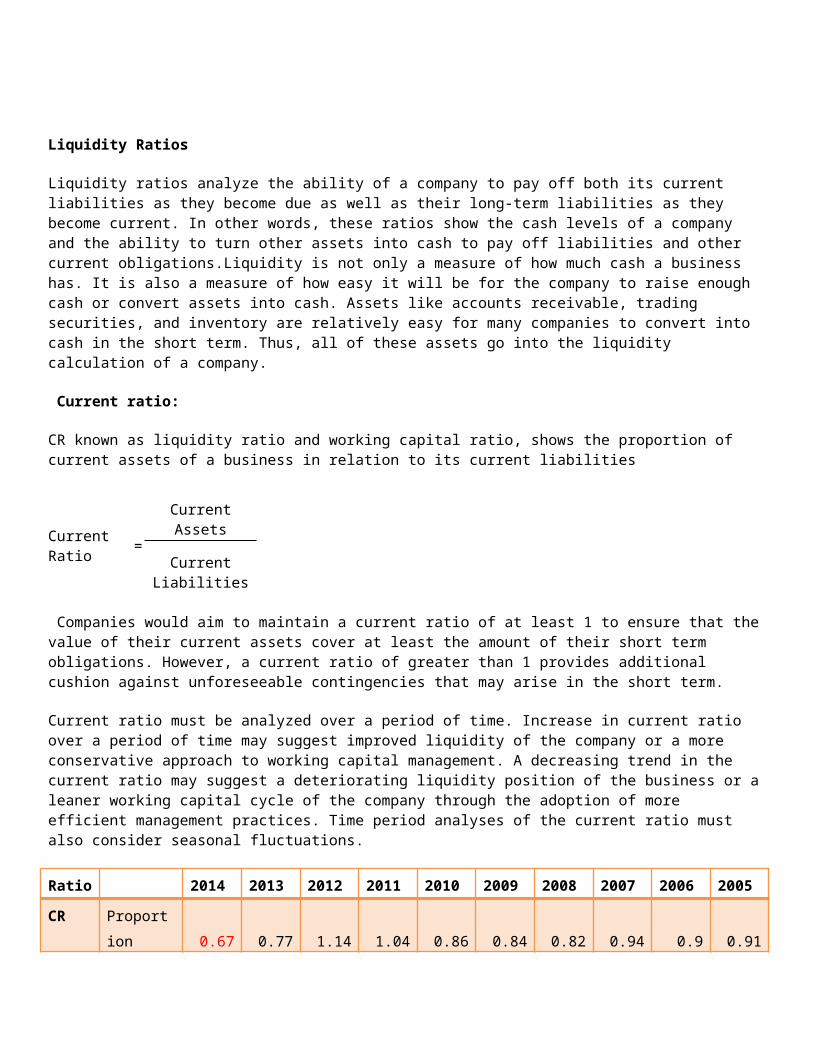
Liquidity Ratios
Liquidity ratios analyze the ability of a company to pay off both its current liabilities as they become due as well as their long-term liabilities as they become current. In other words, these ratios show the cash levels of a company and the ability to turn other assets into cash to pay off liabilities and other current obligations.Liquidity is not only a measure of how much cash a business has. It is also a measure of how easy it will be for the company to raise enough cash or convert assets into cash. Assets like accounts receivable, trading securities, and inventory are relatively easy for many companies to convert into cash in the short term. Thus, all of these assets go into the liquidity calculation of a company.
Current ratio:
CR known as liquidity ratio and working capital ratio, shows the proportion of current assets of a business in relation to its current liabilities
Current Ratio =Current Assets
Current Liabilities
Companies would aim to maintain a current ratio of at least 1 to ensure that the value of their current assets cover at least the amount of their short term obligations. However, a current ratio of greater than 1 provides additional cushion against unforeseeable contingencies that may arise in the short term.
Current ratio must be analyzed over a period of time. Increase in current ratio over a period of time may suggest improved liquidity of the company or a more conservative approach to working capital management. A decreasing trend in the current ratio may suggest a deteriorating liquidity position of the business or a leaner working capital cycle of the company through the adoption of more efficient management practices. Time period analyses of the current ratio must also consider seasonal fluctuations.
Ratio 2014 2013 2012 2011 2010 2009 2008 2007 2006 2005
CR Proportion 0.67 0.77 1.14 1.04 0.86 0.84 0.82 0.94 0.9 0.91
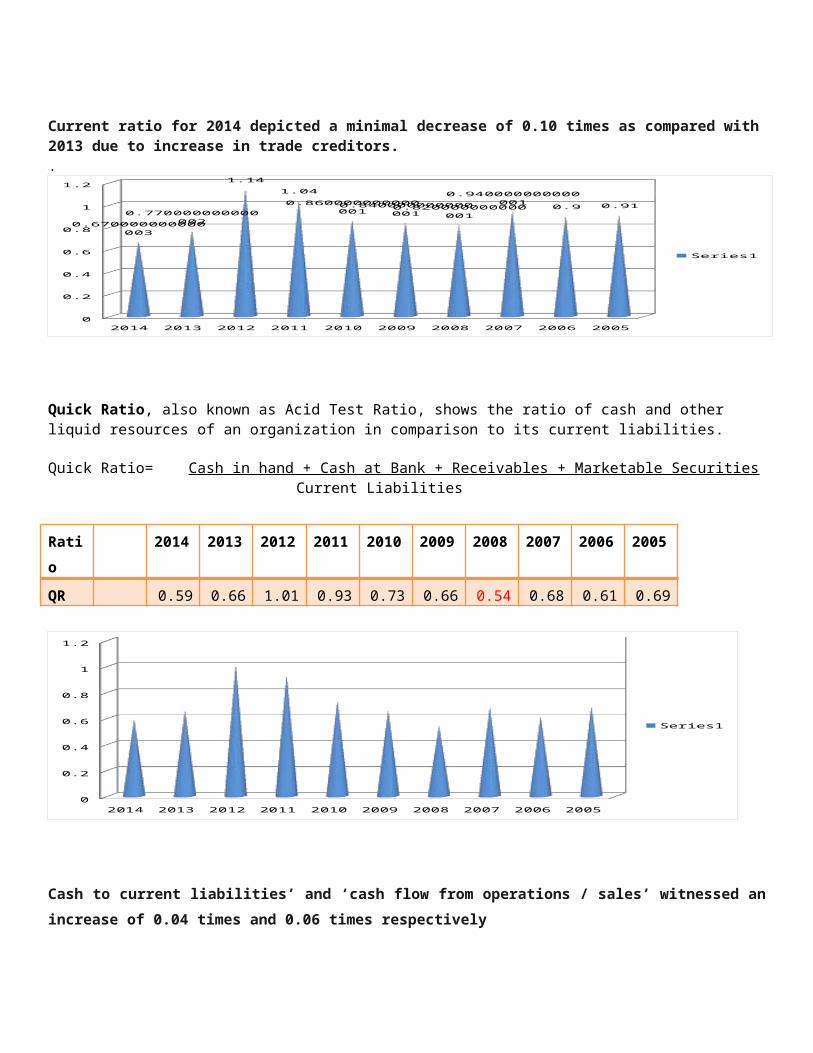
Current ratio for 2014 depicted a minimal decrease of 0.10 times as compared with 2013 due to increase in trade creditors..
2014 2013 2012 2011 2010 2009 2008 2007 2006 20050
0.2
0.4
0.6
0.8
1
1.2
0.670000000000003
0.770000000000002
1.14
1.04
0.860000000000001
0.840000000000001
0.820000000000001
0.940000000000001
0.9 0.91
Series1
Quick Ratio, also known as Acid Test Ratio, shows the ratio of cash and other liquid resources of an organization in comparison to its current liabilities.
Quick Ratio= Cash in hand + Cash at Bank + Receivables + Marketable Securities Current Liabilities
Ratio 2014 2013 2012 2011 2010 2009 2008 2007 2006 2005
QR 0.59 0.66 1.01 0.93 0.73 0.66 0.54 0.68 0.61 0.69
2014 2013 2012 2011 2010 2009 2008 2007 2006 20050
0.2
0.4
0.6
0.8
1
1.2
Series1
Cash to current liabilities’ and ‘cash flow from operations / sales’ witnessed an increase of 0.04 times and 0.06
times respectively
Quick ratio is a measure of a company's ability to settle its current liabilities on a very short notice. Current ratio may provide a misleading indication of a company's liquidity position when a considerable portion of its current assets is
illiquid. Quick ratio is therefore a more reliable measure of liquidity for manufacturing companies and construction firms that have relatively high levels of inventory, work in progress and receivables.
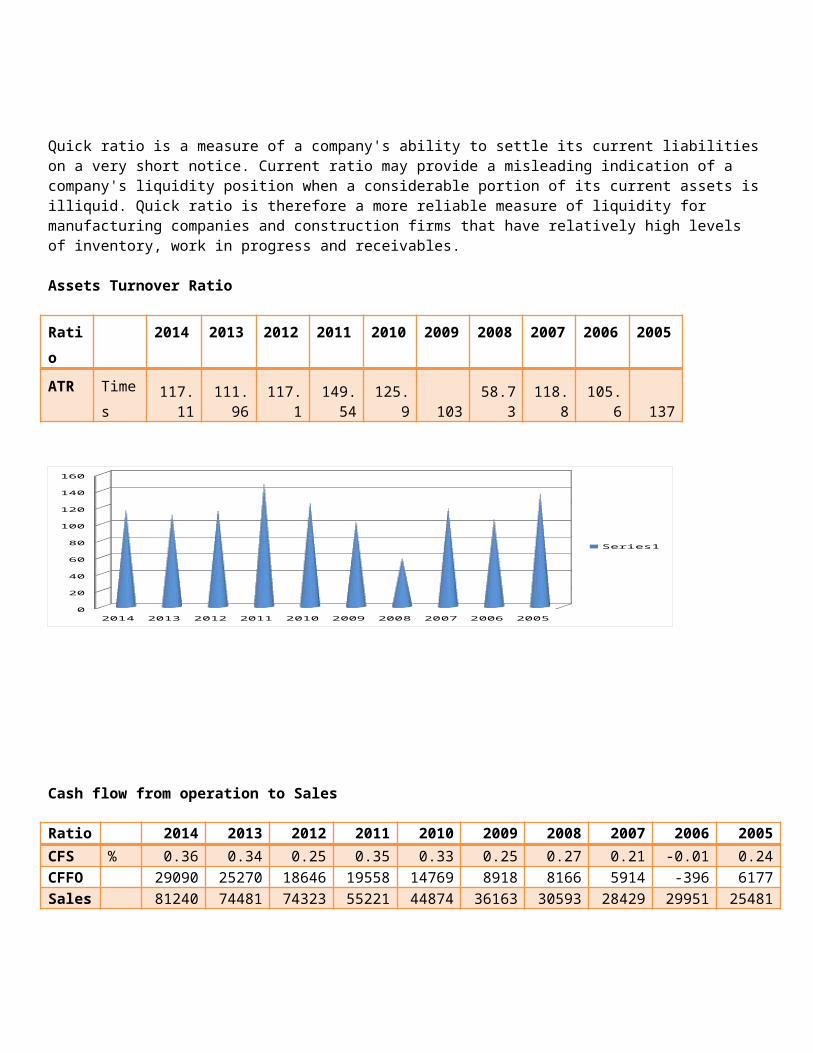
Assets Turnover Ratio
Ratio 2014 2013 2012 2011 2010 2009 2008 2007 2006 2005
ATR Times117.11
111.96 117.1 149.54 125.9 103 58.73 118.8 105.6 137
2014 2013 2012 2011 2010 2009 2008 2007 2006 20050
20
40
60
80
100
120
140
160
Series1
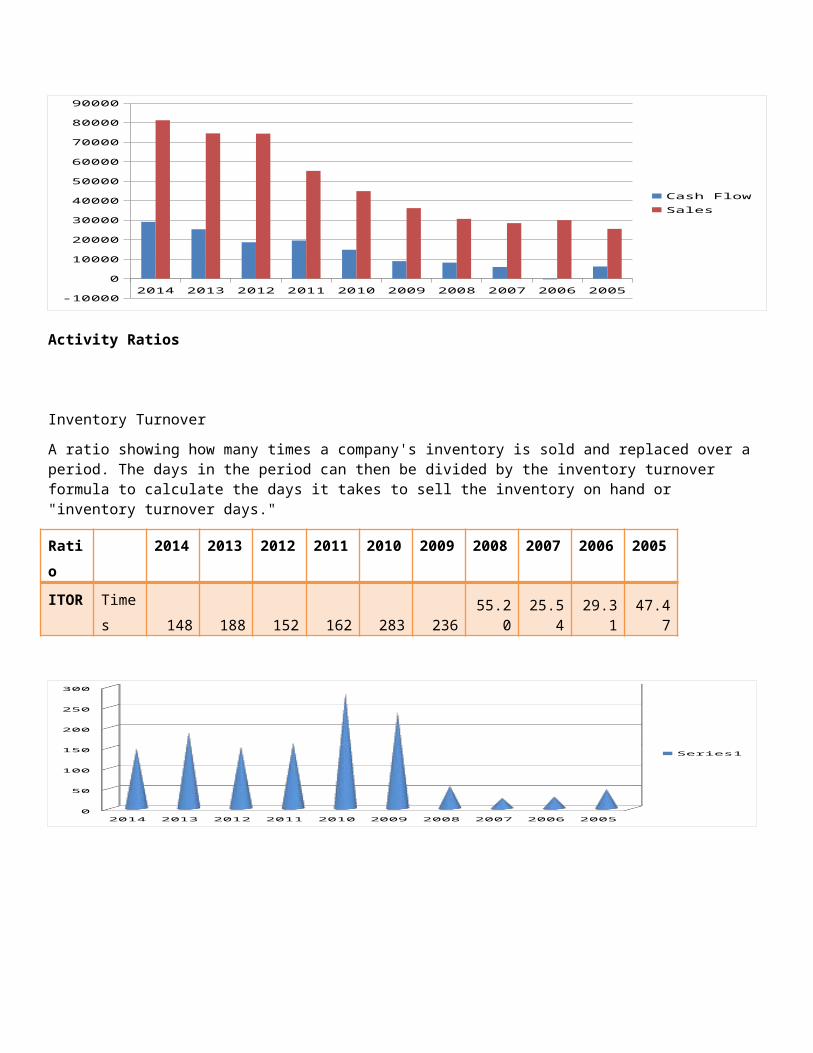
Cash flow from operation to Sales
Ratio 2014 2013 2012 2011 2010 2009 2008 2007 2006 2005
CFS % 0.36 0.34 0.25 0.35 0.33 0.25 0.27 0.21 -0.01 0.24CFFO 29090 25270 18646 19558 14769 8918 8166 5914 -396 6177Sales 81240 74481 74323 55221 44874 36163 30593 28429 29951 25481
2014 2013 2012 2011 2010 2009 2008 2007 2006 2005-10000
0
10000
20000
30000
40000
50000
60000
70000
80000
90000
Cash FlowSales
Activity Ratios
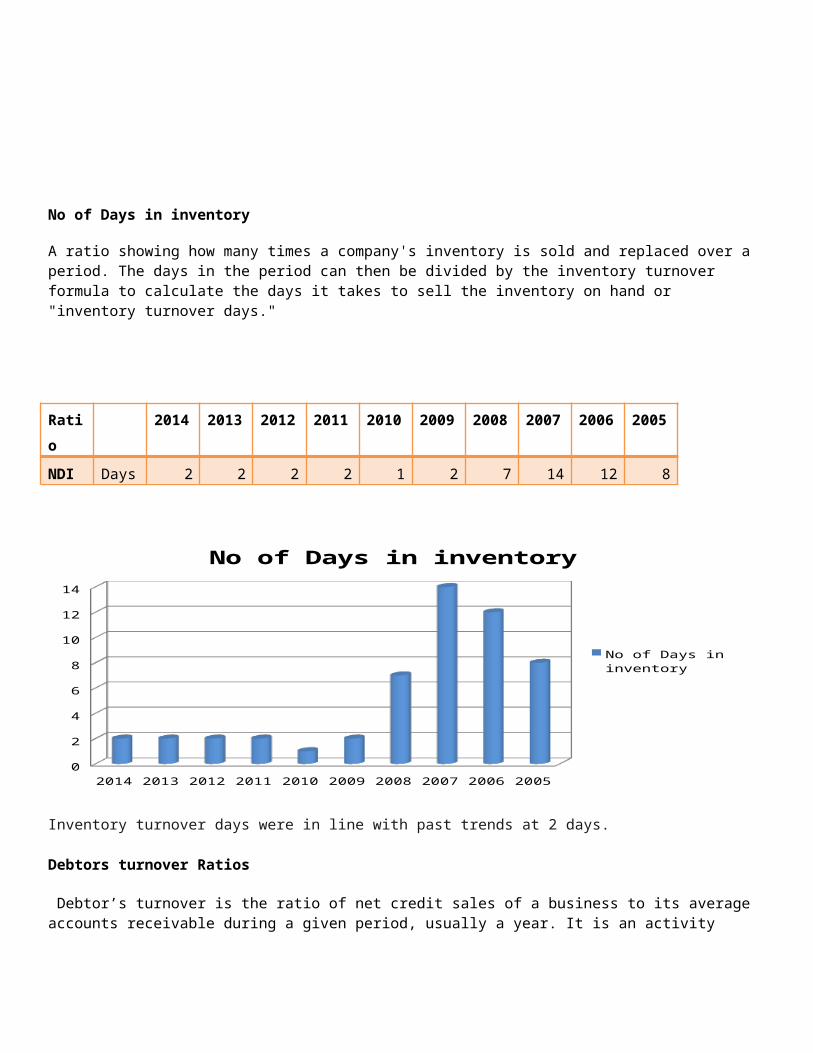
Inventory Turnover
A ratio showing how many times a company's inventory is sold and replaced over a period. The days in the period can then be divided by the inventory turnover formula to calculate the days it takes to sell the inventory on hand or "inventory turnover days."
Ratio 2014 2013 2012 2011 2010 2009 2008 2007 2006 2005
ITOR Times 148 188 152 162 283 236 55.20 25.54 29.31 47.47
2014 2013 2012 2011 2010 2009 2008 2007 2006 20050
50
100
150
200
250
300
Series1
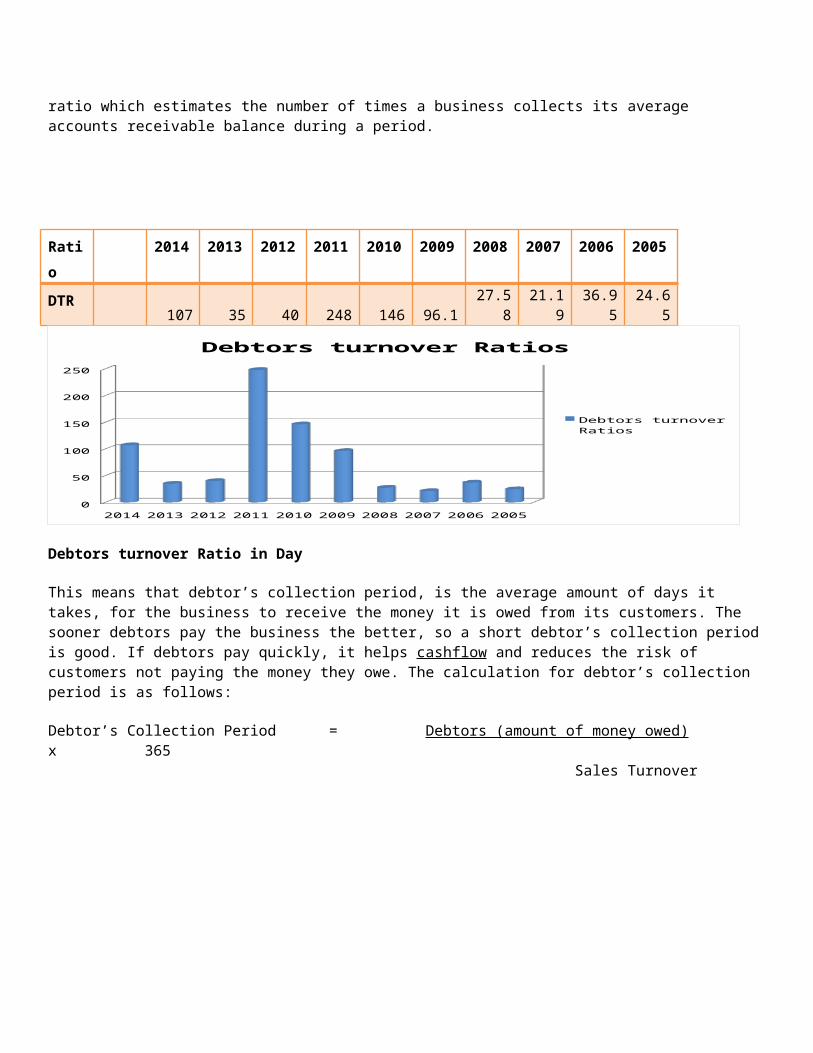
No of Days in inventory
A ratio showing how many times a company's inventory is sold and replaced over a period. The days in the period can then be divided by the inventory turnover formula to calculate the days it takes to sell the inventory on hand or "inventory turnover days."
Ratio 2014 2013 2012 2011 2010 2009 2008 2007 2006 2005
NDI Days 2 2 2 2 1 2 7 14 12 8
2014 2013 2012 2011 2010 2009 2008 2007 2006 20050
2
4
6
8
10
12
14
No of Days in inventory
No of Days in inventory
Inventory turnover days were in line with past trends at 2 days.
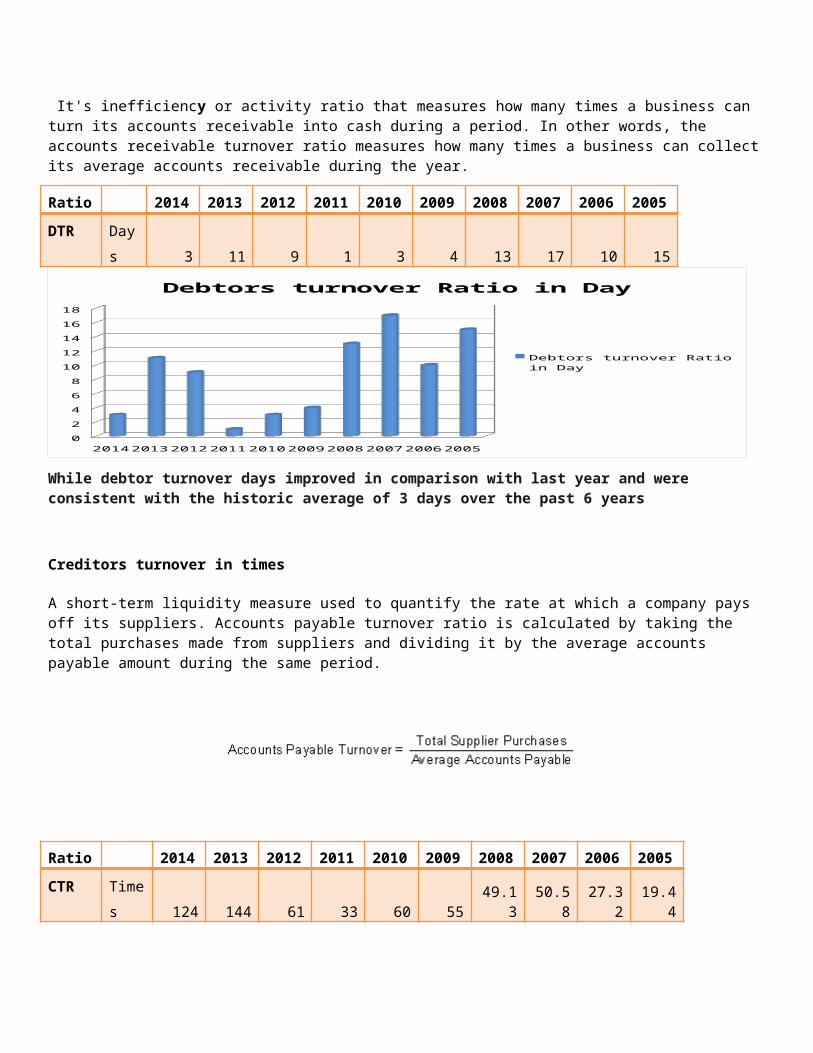
Debtors turnover Ratios
Debtor’s turnover is the ratio of net credit sales of a business to its average accounts receivable during a given period, usually a year. It is an activity ratio which estimates the number of times a business collects its average accounts receivable balance during a period.
Ratio 2014 2013 2012 2011 2010 2009 2008 2007 2006 2005
DTR 107 35 40 248 146 96.1 27.58 21.19 36.95 24.65
2014 2013 2012 2011 2010 2009 2008 2007 2006 20050
50
100
150
200
250
Debtors turnover Ratios
Debtors turnover Ratios
Debtors turnover Ratio in Day
This means that debtor’s collection period, is the average amount of days it takes, for the business to receive the money it is owed from its customers. The sooner debtors pay the business the better, so a short debtor’s collection period is good. If debtors pay quickly, it helps cashflow and reduces the risk of customers not paying the money they owe. The calculation for debtor’s collection period is as follows:
Debtor’s Collection Period = Debtors (amount of money owed) x 365 Sales Turnover
It's inefficiency or activity ratio that measures how many times a business can turn its accounts receivable into cash during a period. In other words, the accounts receivable turnover ratio measures how many times a business can collect its average accounts receivable during the year.
Ratio 2014 2013 2012 2011 2010 2009 2008 2007 2006 2005
DTR Days 3 11 9 1 3 4 13 17 10 15
2014 2013 2012 2011 2010 2009 2008 2007 2006 20050
2
4
6
8
10
12
14
16
18
Debtors turnover Ratio in Day
Debtors turnover Ratio in Day
While debtor turnover days improved in comparison with last year and were consistent with the historic average of 3 days over the past 6 years
Creditors turnover in times
A short-term liquidity measure used to quantify the rate at which a company pays off its suppliers. Accounts payable turnover ratio is calculated by taking the total purchases made from suppliers and dividing it by the average accounts payable amount during the same period.
Ratio 2014 2013 2012 2011 2010 2009 2008 2007 2006 2005
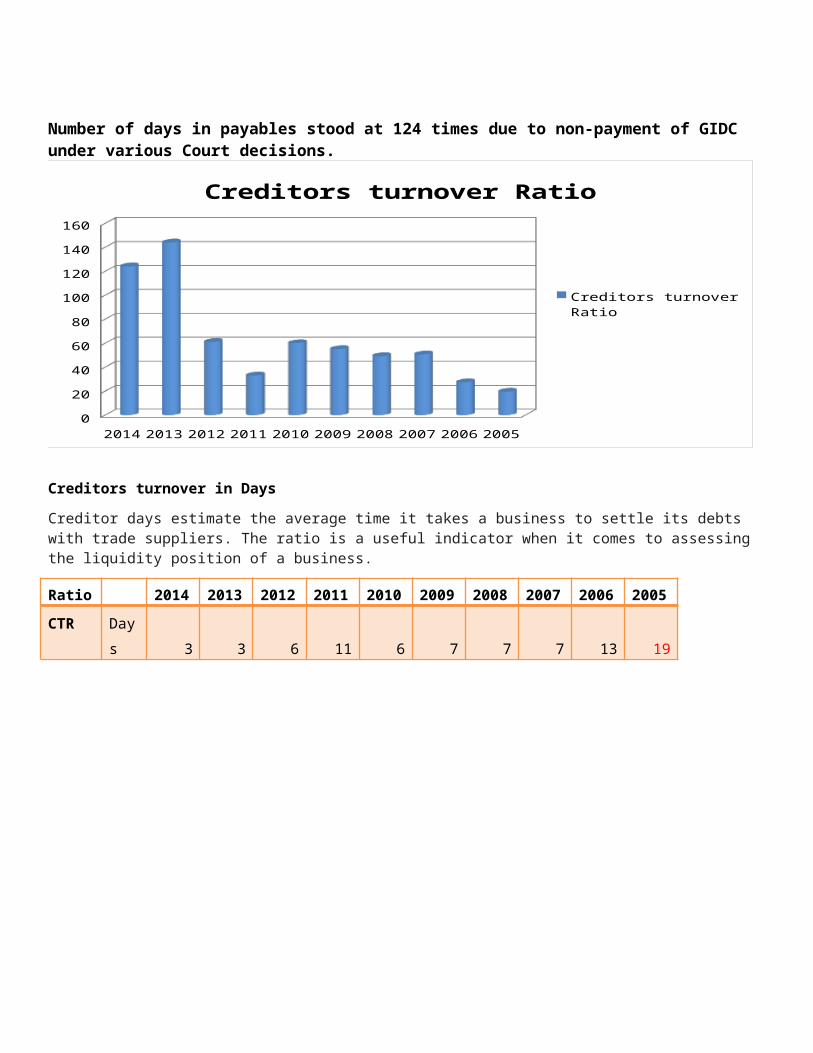
CTR Times 124 144 61 33 60 55 49.13 50.58 27.32 19.44
Number of days in payables stood at 124 times due to non-payment of GIDC under various Court decisions.
2014 2013 2012 2011 2010 2009 2008 2007 2006 20050
20
40
60
80
100
120
140
160
Creditors turnover Ratio
Creditors turnover Ratio
Creditors turnover in Days
Creditor days estimate the average time it takes a business to settle its debts with trade suppliers. The ratio is a useful indicator when it comes to assessing the liquidity position of a business.
Ratio 2014 2013 2012 2011 2010 2009 2008 2007 2006 2005
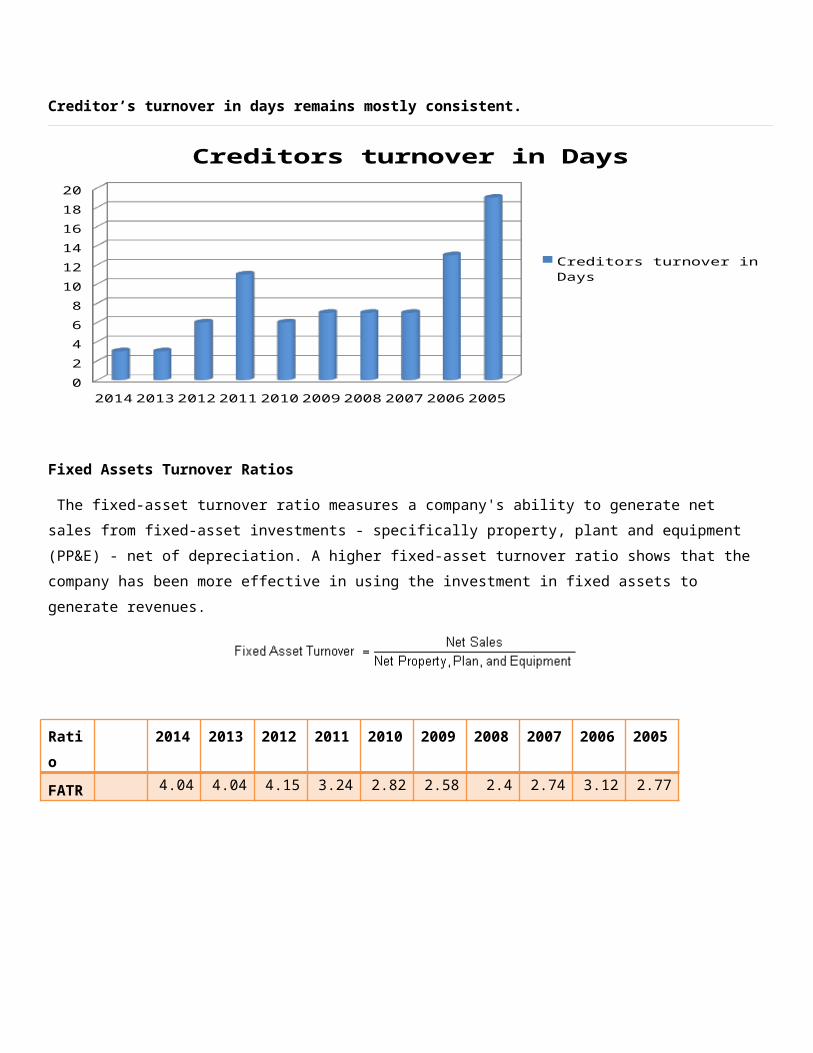
CTR Days 3 3 6 11 6 7 7 7 13 19
Creditor’s turnover in days remains mostly consistent.
2014 2013 2012 2011 2010 2009 2008 2007 2006 20050
2
4
6
8
10
12
14
16
18
20
Creditors turnover in Days
Creditors turnover in Days
Fixed Assets Turnover Ratios
The fixed-asset turnover ratio measures a company's ability to generate net sales from fixed-asset investments -
specifically property, plant and equipment (PP&E) - net of depreciation. A higher fixed-asset turnover ratio shows that the
company has been more effective in using the investment in fixed assets to generate revenues.
Ratio 2014 2013 2012 2011 2010 2009 2008 2007 2006 2005
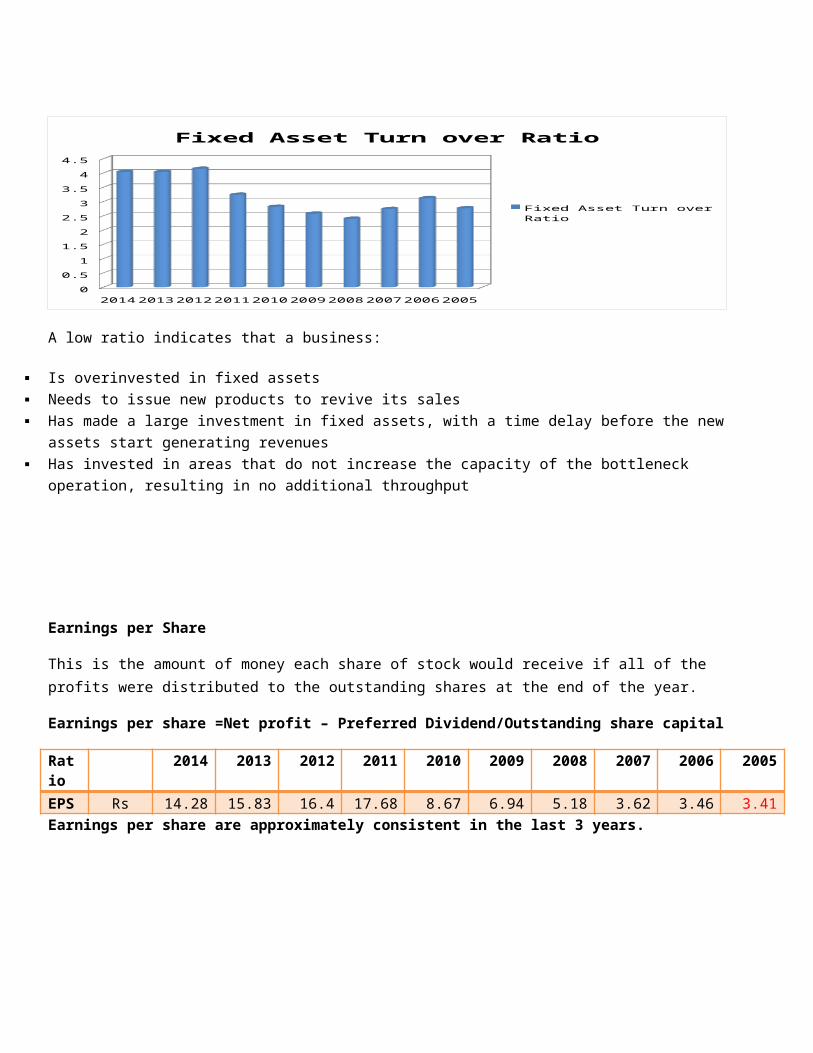
FATR4.04 4.04 4.15 3.24 2.82 2.58 2.4 2.74 3.12 2.77
2014 2013 2012 2011 2010 2009 2008 2007 2006 20050
0.5
1
1.5
2
2.5
3
3.5
4
4.5
Fixed Asset Turn over Ratio
Fixed Asset Turn over Ratio
A low ratio indicates that a business:
Is overinvested in fixed assets
Needs to issue new products to revive its sales
Has made a large investment in fixed assets, with a time delay before the new assets start generating revenues
Has invested in areas that do not increase the capacity of the bottleneck operation, resulting in no additional throughput
Earnings per Share
This is the amount of money each share of stock would receive if all of the profits were distributed to the outstanding shares at the end of the year.
Earnings per share =Net profit – Preferred Dividend/Outstanding share capital
Ratio
2014 2013 2012 2011 2010 2009 2008 2007 2006 2005
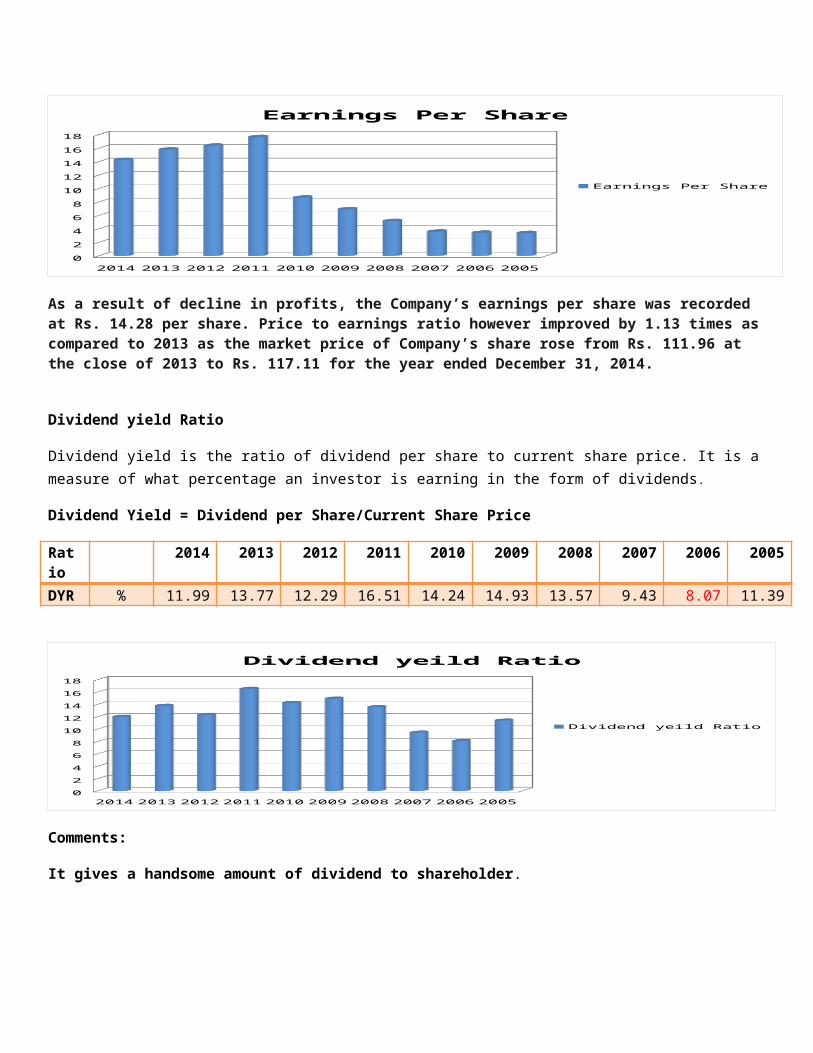
EPS Rs 14.28 15.83 16.4 17.68 8.67 6.94 5.18 3.62 3.46 3.41Earnings per share are approximately consistent in the last 3 years.
2014 2013 2012 2011 2010 2009 2008 2007 2006 20050
2
4
6
8
10
12
14
16
18
Earnings Per Share
Earnings Per Share
As a result of decline in profits, the Company’s earnings per share was recorded at Rs. 14.28 per share. Price to earnings ratio however improved by 1.13 times as compared to 2013 as the market price of Company’s share rose from Rs. 111.96 at the close of 2013 to Rs. 117.11 for the year ended December 31, 2014.
Dividend yield Ratio
Dividend yield is the ratio of dividend per share to current share price. It is a measure of what percentage an investor is earning in the form of dividends.
Dividend Yield = Dividend per Share/Current Share Price
Ratio 2014 2013 2012 2011 2010 2009 2008 2007 2006 2005
DYR % 11.99 13.77 12.29 16.51 14.24 14.93 13.57 9.43 8.07 11.39
2014 2013 2012 2011 2010 2009 2008 2007 2006 20050
2
4
6
8
10
12
14
16
18
Dividend yeild Ratio
Dividend yeild Ratio
Comments:
It gives a handsome amount of dividend to shareholder.
Market value per share
Ratio 2014 2013 2012 2011 2010 2009 2008 2007 2006 2005
MVS Rs 117.11 111.96 117.14 149.54 125.86 102.93 58.73 118.75 105.55 137
2014 2013 2012 2011 2010 2009 2008 2007 2006 20050
20
40
60
80
100
120
140
160
Market Value per Share
Market Value per Share
Cash Dividend per share
The sum of declared dividends for every ordinary share issued. Dividend per share (DPS) is the total dividends paid out over an entire year (including interim dividends but not including special dividends) divided by the number of outstanding ordinary shares issued.
Ratio 2014 2013 2012 2011 2010 2009 2008 2007 2006 2005
CDPS Rs 13.65 15.35 15.5 20 13 13.15 13.75 11 10 12
2014 2013 2012 2011 2010 2009 2008 2007 2006 20050
2
4
6
8
10
12
14
16
18
20
Cash dividedn per share
Cash dividedn per share
Bonus Share
A bonus share is a free share of stock given to current shareholders in a company, based upon the number of shares that the shareholder already owns While the issue of bonus shares increases the total number ofshares issued and owned, it does not change the value of the company.
Ratio 2014 2013 2012 2011 2010 2009 2008 2007 2006 2005
BS % - - - 50 25 10 - - 40 -
Capital Structure Ratios
Debt to Equity Ratio
The debt-to-equity ratio shows the proportion of equity and debt a firm is using to finance its assets, and the ability for
shareholder equity to fulfill obligations to creditors in the event of a business decline
Debt-to-equity ratio = total liabilities / total shareholders' equity
Ratio
2014 2013 2012 2011 2010 2009 2008 2007 2006 2005
DER % 4/9 2/3 3/5 ½ ¼ 1/3 3/7 ¾ 2/5 1/3
A low debt-to-equity ratio indicates lower risk, since debt holders have fewer claims on the company's assets. A higher
debt-to-equity ratio, on the other hand, shows that a company has been aggressive in financing its growth with debt, and
there may be a greater potential for financial distress if earnings do not exceed the cost of borrowed funds.
INTEREST COVERAGE RATIO
A ratio used to determine how easily a company can pay interest on outstanding debt. The interest coverage ratio is
calculated by dividing a company's earnings before interest and taxes (EBIT) of one period by the company's interest
expenses of the same period:
Ratio 2014 2013 2012 2011 2010 2009 2008 2007 2006 2005
EBIT 31.91 39.91 32.08 43.2 16 14.82 15.44 12.1 14.94 23.13
2014 2013 2012 2011 2010 2009 2008 2007 2006 20050
5
10
15
20
25
30
35
40
45
Interest coverage ratio
Interest coverage ratio
Comments:
Financial leverage ratio of 0.62 times for2014 is consistent with the average for the past 6 years. Debt to equity ratio improved to 9:91 indicating the lowest amount of long-term debt in the last 6 years. Company’s interest cover ratio doubled to 32 times in comparison with 15 times in 2009 as result of lower finance cost to profitability ratio.
Conclusion
So,in the light of all the details given above about the financial analysis of FFC i.e Debt to equity, Liquidity and profitability of FFC, we come to know that FFC has performed well even in shortage of Gas supply in the country. It is consistently growing and paying higher rate of return to investor.