myanmar education consortium baseline study · myanmar education consortium baseline study ......
TRANSCRIPT

DantDaLun Management and Consulting Services January 2015
Myanmar Education Consortium
BASELINE STUDY
Early Childhood Development Component
1
Acknowledgements DantDaLun would like to thank all those who have contributed to making this study possible. In
particular, the study team would like to thank the MEC partners who provided the time and effort of
their staff to work as enumerators, as well as on the ground support during the data collection
process. Thanks is also extended to the MEC team for their flexibility and willingness to provide
support when needed.
DantDaLun appreciates the hard work of the study team – Lead Consultants Steven Lanjouw and
Choo Phuah; National Consultant, U Win Aung; Team Leaders, Roi Nu, Pyone Aye Kyi and Khin
Maung U, and Data Analyst and Statistician, U Zaw Win and Nelie Janssen, as well as the data
processing team.
DantDaLun Management and Consulting Services is a Myanmar registered company providing consulting and research services to local and international organizations working in Myanmar and Southeast Asia to accelerate improvements in the lives of the people of the region.
2A/3 Thirimingalar Lane, 7 Mile Mayangone Township, Yangon, Myanmar
2
Acronyms
CESR Comprehensive Education Sector Review
ECCD Early Childhood Development
ECDI Early Children Development Index
EGRA Early Grade Reading Assessment
EGMA Early Grade Math Assessment
FGD Focus Group Discussions
MEC Myanmar Education Consortium
MICS Myanmar Indicator Cluster Survey
PTA Parent Teacher Association
3
Table of Contents
Acknowledgements ................................................................................................................................. 1
Acronyms ................................................................................................................................................ 2
Table of Contents .................................................................................................................................... 3
I. Introduction ............................................................................................................................... 5
II. Methodology .............................................................................................................................. 5
III. Overall Baseline Results ............................................................................................................. 6
i. Logframe indicator values ...................................................................................................... 6
ii. Literacy and numeracy levels ................................................................................................. 6
Literacy ............................................................................................................................ 6
Numeracy ........................................................................................................................ 7
iii. Household factors affecting children’s education .................................................................. 8
Availability of electricity .................................................................................................. 8
Access to school .............................................................................................................. 8
Parental support .............................................................................................................. 8
Working children ............................................................................................................. 9
Mother tongue instruction .............................................................................................. 9
IV. Findings on Early Childhood Development ................................................................................ 9
i. Children’s educational attainment ......................................................................................... 9
On-time enrolment in primary school ............................................................................. 9
Age appropriate competencies ..................................................................................... 10
Readiness for school ...................................................................................................... 11
ii. Education services for early childhood development .......................................................... 11
Access to services .......................................................................................................... 12
Learning environment ................................................................................................... 13
Teaching and learning approach ................................................................................... 13
Recruitment and training of caregivers ......................................................................... 14
Community involvement ............................................................................................... 15
Management ................................................................................................................. 16
iii. Household and community factors affecting early childhood development ....................... 17
V. Children with Disabilities.......................................................................................................... 17
4
i. Educational attainment for children with disabilities .......................................................... 18
ii. Education services for children with disabilities .................................................................. 18
iii. Household and community factors affecting education for children with disabilities ........ 18
VI. Conclusions .............................................................................................................................. 18
VII. Bibliography ............................................................................................................................. 21
Annexes ................................................................................................................................................. 22
Annex A: Baseline values of MEC indicators .................................................................................. 23
Annex B: Early Childhood Development Index .............................................................................. 25
List of Tables
Table 1: Attitudes to mother tongue instruction .................................................................................... 9
Table 2: Educational attainment for early childhood development .................................................... 10
Table 3: Children 3-4 Years Developmentally on Track ........................................................................ 11
Table 4: Enrolment in pre-schools by age and sex................................................................................ 12
Table 5: Scheduled Activities in the Pre-schools .................................................................................. 14
Table 6: Children Under-five who have Access to Toys ........................................................................ 17
List of Charts
Chart 1: Grade 3 Reading and Comprehension Scores ........................................................................... 7
Chart 2: Grade 5 Reading and Comprehension Scores ........................................................................... 7
Chart 3: Reading Scores by ECCD Experience ......................................................................................... 7
Chart 4: Mathematics Scores .................................................................................................................. 8
Chart 5: Educational Attainment of Mother or Caretaker ...................................................................... 8
5
I. Introduction The Myanmar Education Consortium (MEC) conducted a baseline study with 12 of its civil society
organisation partners in August 2014 to 1) provide benchmarks to assess progress and impact
resulting from the project interventions and 2) provide benchmarks to guide project implementation
and set project targets. The 12 MEC partners are each engaged in one of four programme
components -- early childhood development (ECCD), complimentary basic education in ethnic areas,
inclusive primary education for children with disabilities and non-formal education for out-of-school
children -- in 10 states and regions across Myanmar. In addition to the overall MEC logframe, a
common logframe for the partners working in each of the programme components was developed
jointly by MEC and the partners.
The study was a joint baseline for the programme as a whole and a full report of the baseline study
has been produced. For the benefit of the partners, the MEC has requested that separate
component reports be produced to enable the partners to more easily access the information that is
relevant for them. A full report of the baseline study has been produced. This report presents the
findings relevant to projects on early childhood development. Consequently, the report provides a
summary of the overall findings of the survey (Section III) but focuses on the survey findings related
to early childhood development (Section IV).
II. Methodology The baseline collected data for the programme as a whole and provides information on the
indicators for the study areas as a whole. Although not specifically addressing individual partner
projects, the study included one project township from each partner organization. For the ECCD
component, the survey was conducted in Indaw, Lashio, Kyainseikgyi and Pinlaung townships. Three
survey sites (wards or villages) were selected in each partner location (two partners are located in
Lashio township). The survey also collected qualitative data on education services available in the
village sites for each specific programme component.
The study used the following data collection methods:
1) A household survey of households with children 5-9 years
2) Visits to existing planned intervention schools in survey sites for:
i. observation and secondary data collection;
ii. key informant interviews with principals or senior teachers; and
iii. key informant interviews with caregivers or teachers.
3) A reading and mathematics assessment of students in Grades 3 and 51 in primary education
schools in the survey sites.
4) Focus Group Discussions (FGDs) with School Management Committees, Parent Teacher
Associations (PTAs) or with community members and village leaders.
A total of 879 interviews were conducted in households with children 5-9 years throughout all the
townships. Among these, 545 households also completed an under-five questionnaire on early
childhood development, and 130 completed a disability questionnaire. Key informant interviews
were conducted in 31 schools with 29 principals/senior teachers and 42 caregivers/teachers, of
1 This report uses the international school grading system. Grade 3 is equivalent to Standard 2 in the Myanmar
system and Grade 5 to Standard 4.
6
which eight principals/senior teachers and nine caregivers were from nine ECCD centers. Reading
and math assessments were conducted with 402 children in 35 primary schools including schools in
locations implementing projects for ECCD and out-of-school children. In addition, a total of 36 focus
group discussions, 15 of which were from ECCD project locations, were conducted with members of
School Management Committees, PTAs, parents, teachers and community leaders.
III. Overall Baseline Results This section presents a summary of the overall results of the baseline study for the MEC programme
as a whole.
i. Logframe indicator values
The full list of the baseline values for the MEC programme indicators and indicator definitions for all
components are shown in Annex A.
The key MEC impact indicator is Net Primary Enrolment, which is the percentage of children aged 5-
9 years who are in primary school. The Net Primary Enrolment Rate in the survey areas is 84.9%,
which is comparable to national figures. However, the Gross Primary Enrolment rate (which counts
children of all ages in primary school) is 107.8% which indicates that many children in primary school
are over-aged. There is no significant difference in the Net Primary Enrolment rates between boys
and girls but the rate is slightly lower for children with disabilities (81.9%).
The indicators relevant to the ECCD component are discussed in the Section IV.
ii. Literacy and numeracy levels
Key stage literacy and numeracy levels are a key MEC outcome indicator. Literacy and numeracy
levels of Grade 3 and Grade 5 students were determined using a modified Early Grade Reading
Assessment (EGRA) and Early Grade Math Assessment (EGMA) tool2. The details of the EGRA and
EGMA are described in the main baseline report.
Literacy
Reading ability was assessed by giving students a short passage and counting the number of correct
words the student could read within a minute. After reading the passage, students were asked to
answer 4 questions about the passage. Each question was given a score of 25 for a maximum score
of 100.
The average reading scores for all students is 92 words a minute and the average comprehension
score is 50. As expected, Grade 5 students performed better than Grade 3 students. However,
about 23% of Grade 5 students were not able to read a Grade 3 level text with desirable fluency and
only 38% of Grade 5 students were able to get a perfect score for reading comprehension of Grade 3
level.
2 EGRA is an individually administered oral assessment of foundation literacy designed as an inexpensive and
simple diagnostic of individual student progress in reading (edddata II, USAID, 2014). EGMA is an oral assessment designed to measure a student's foundation skills in numeracy in the early grades (RTI International, 2014).
7
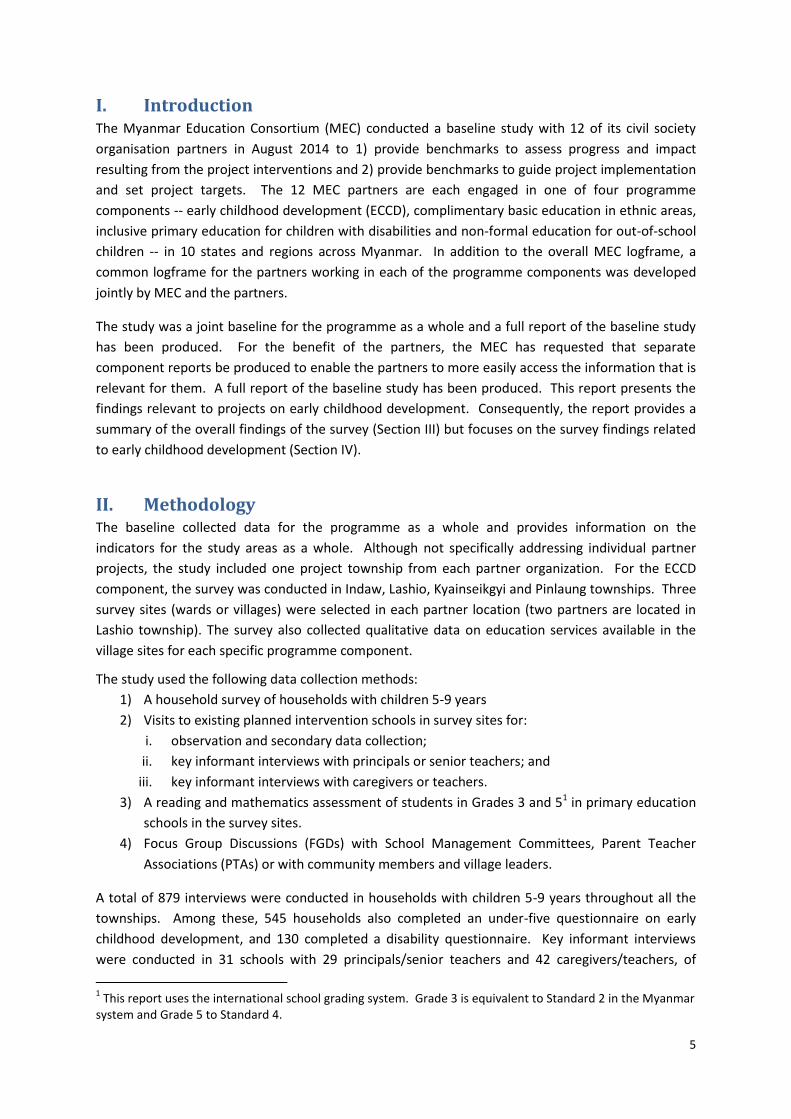
Overall, the assessment showed that although most students are able to read, many are not able to
understand what they read, even at Grade 5. The results also showed that children who do not
speak the same language at home as in school have significantly lower comprehension scores.
Chart 1: Grade 3 Reading and Comprehension Scores
Chart 2: Grade 5 Reading and Comprehension Scores
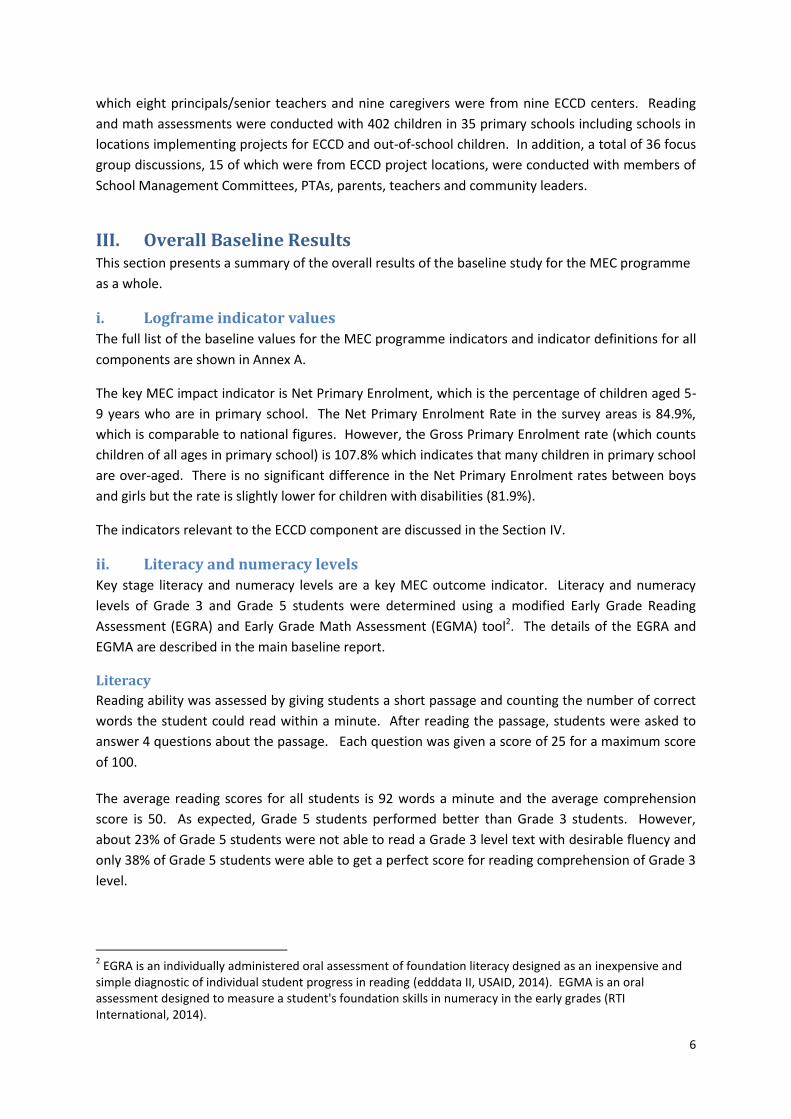
Contrary to findings from other studies, the results show that children without ECCD experience are
better at reading than those who have ECCD experience. There is no difference in comprehension
scores. As the survey did not collect any detailed information about the students or the type of
ECCD experience of these students, it is not possible to explain the difference in findings.
Chart 3: Reading Scores by ECCD Experience
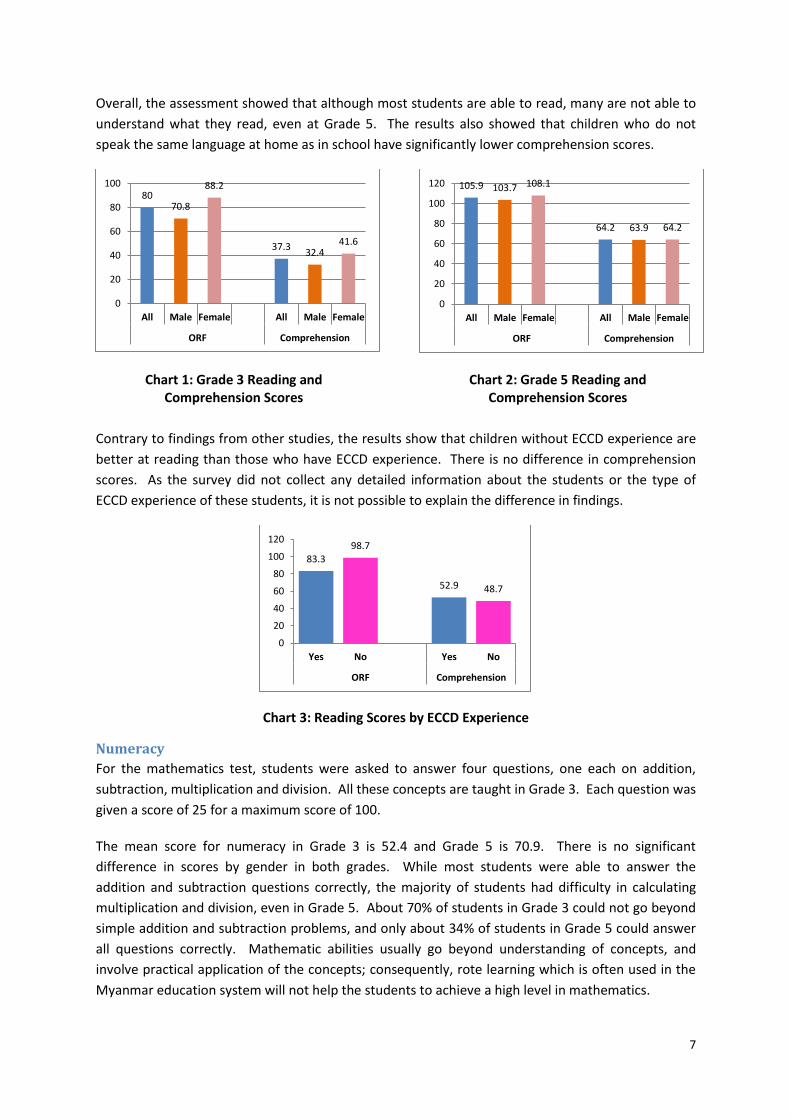
Numeracy
For the mathematics test, students were asked to answer four questions, one each on addition,
subtraction, multiplication and division. All these concepts are taught in Grade 3. Each question was
given a score of 25 for a maximum score of 100.
The mean score for numeracy in Grade 3 is 52.4 and Grade 5 is 70.9. There is no significant
difference in scores by gender in both grades. While most students were able to answer the
addition and subtraction questions correctly, the majority of students had difficulty in calculating
multiplication and division, even in Grade 5. About 70% of students in Grade 3 could not go beyond
simple addition and subtraction problems, and only about 34% of students in Grade 5 could answer
all questions correctly. Mathematic abilities usually go beyond understanding of concepts, and
involve practical application of the concepts; consequently, rote learning which is often used in the
Myanmar education system will not help the students to achieve a high level in mathematics.
80 70.8
88.2
37.3 32.4
41.6
0
20
40
60
80
100
All Male Female All Male Female
ORF Comprehension
105.9 103.7 108.1
64.2 63.9 64.2
0
20
40
60
80
100
120
All Male Female All Male Female
ORF Comprehension
83.3 98.7
52.9 48.7
0
20
40
60
80
100
120
Yes No Yes No
ORF Comprehension
8
Chart 4: Mathematics Scores
iii. Household factors affecting children’s education
Availability of electricity
More than 60% of households surveyed do not have electricity, and of those that do, many have it
for less than 5 hours a day. This hampers children’s ability to study in the night time.
Access to school
Distance from school is not a key issue in the survey sites. Most households have a pre-school and
primary school within 15 minutes from their home. The majority of students go on foot to school.
Parents or guardians pay substantial amounts for children to attend pre-school and primary school
even though primary schooling is supposed to be free. This appears to be a key factor affecting
access to school for poor families.
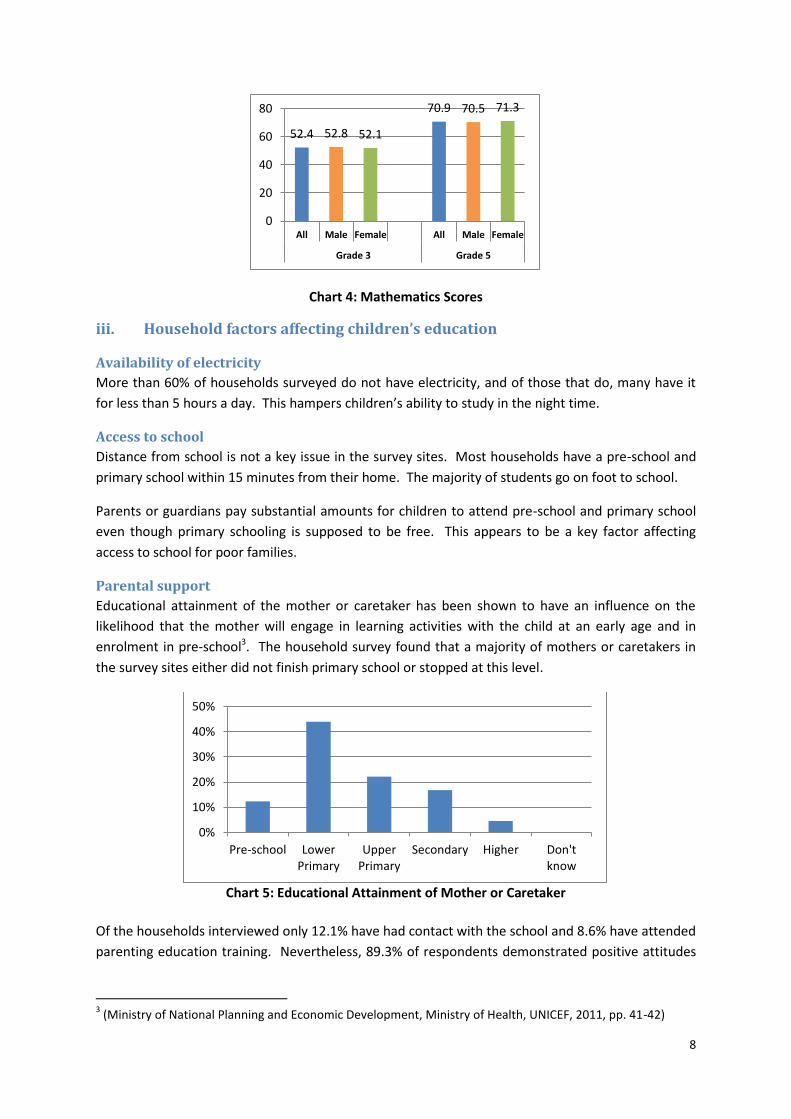
Parental support
Educational attainment of the mother or caretaker has been shown to have an influence on the
likelihood that the mother will engage in learning activities with the child at an early age and in
enrolment in pre-school3. The household survey found that a majority of mothers or caretakers in
the survey sites either did not finish primary school or stopped at this level.
Chart 5: Educational Attainment of Mother or Caretaker
Of the households interviewed only 12.1% have had contact with the school and 8.6% have attended
parenting education training. Nevertheless, 89.3% of respondents demonstrated positive attitudes
3 (Ministry of National Planning and Economic Development, Ministry of Health, UNICEF, 2011, pp. 41-42)
52.4 52.8 52.1
70.9 70.5 71.3
0
20
40
60
80
All Male Female All Male Female
Grade 3 Grade 5
0%
10%
20%
30%
40%
50%
Pre-school LowerPrimary
UpperPrimary
Secondary Higher Don'tknow
9
towards parenting including rejection of physical punishment, allowing time for play after school and
supporting equal opportunities for boys and girls4.
Working children
About 63% of children in the survey work in the home. Of these, about 20% spend two to four hours
working and 20% work for more than four hours. About 12% of children work outside the home,
about half of these for pay and half without pay.
Mother tongue instruction
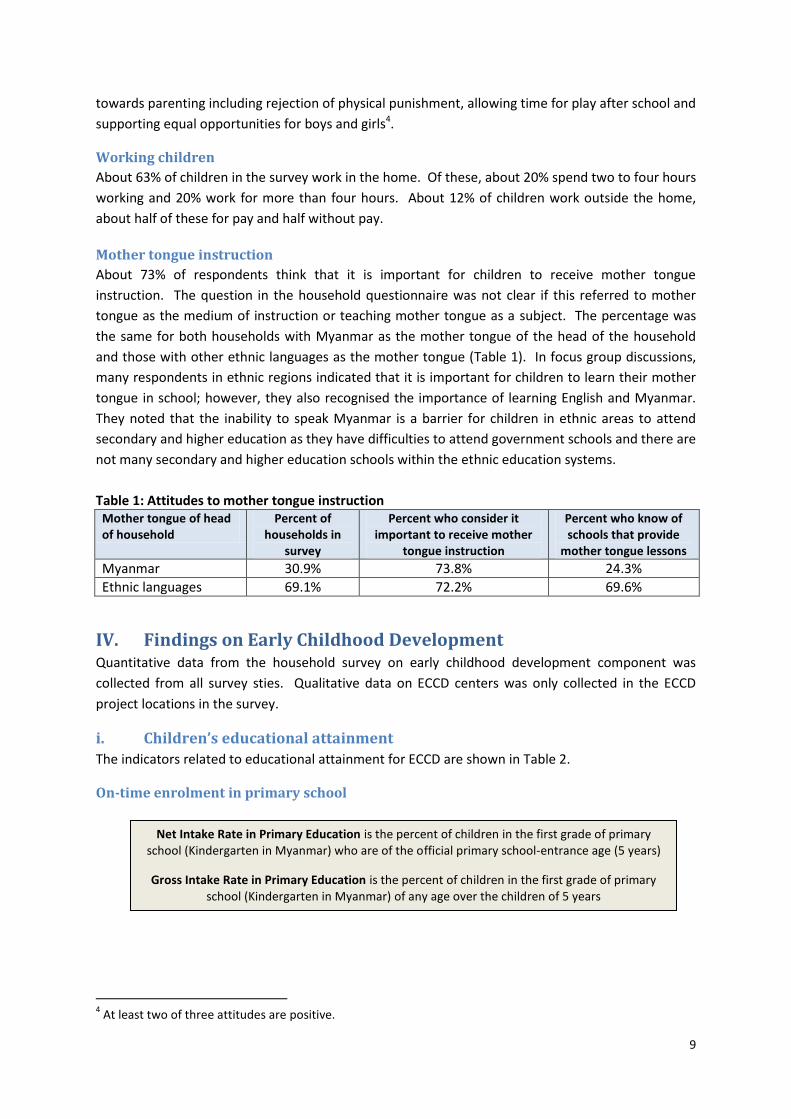
About 73% of respondents think that it is important for children to receive mother tongue
instruction. The question in the household questionnaire was not clear if this referred to mother
tongue as the medium of instruction or teaching mother tongue as a subject. The percentage was
the same for both households with Myanmar as the mother tongue of the head of the household
and those with other ethnic languages as the mother tongue (Table 1). In focus group discussions,
many respondents in ethnic regions indicated that it is important for children to learn their mother
tongue in school; however, they also recognised the importance of learning English and Myanmar.
They noted that the inability to speak Myanmar is a barrier for children in ethnic areas to attend
secondary and higher education as they have difficulties to attend government schools and there are
not many secondary and higher education schools within the ethnic education systems.
Table 1: Attitudes to mother tongue instruction Mother tongue of head of household
Percent of households in
survey
Percent who consider it important to receive mother
tongue instruction
Percent who know of schools that provide
mother tongue lessons
Myanmar 30.9% 73.8% 24.3%
Ethnic languages 69.1% 72.2% 69.6%
IV. Findings on Early Childhood Development Quantitative data from the household survey on early childhood development component was
collected from all survey sties. Qualitative data on ECCD centers was only collected in the ECCD
project locations in the survey.
i. Children’s educational attainment
The indicators related to educational attainment for ECCD are shown in Table 2.
On-time enrolment in primary school
4 At least two of three attitudes are positive.
Net Intake Rate in Primary Education is the percent of children in the first grade of primary school (Kindergarten in Myanmar) who are of the official primary school-entrance age (5 years)
Gross Intake Rate in Primary Education is the percent of children in the first grade of primary school (Kindergarten in Myanmar) of any age over the children of 5 years
10
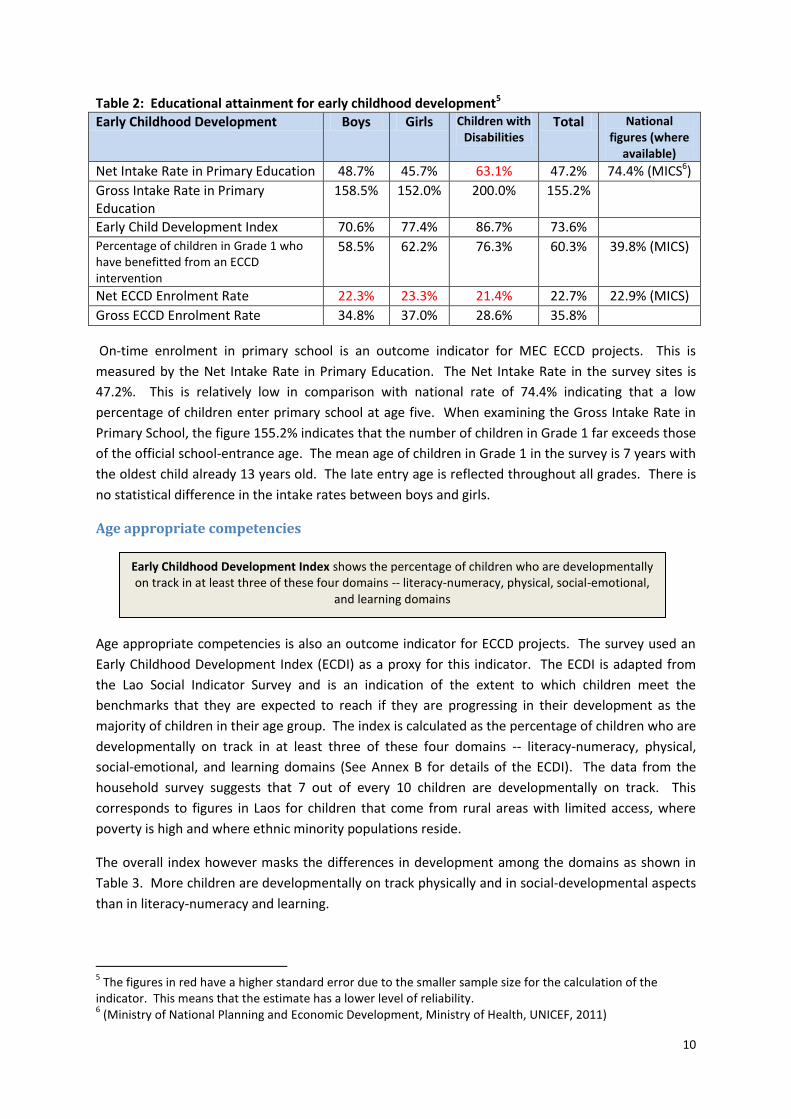
Table 2: Educational attainment for early childhood development5
Early Childhood Development Boys Girls Children with Disabilities
Total National figures (where
available) Net Intake Rate in Primary Education 48.7% 45.7% 63.1% 47.2% 74.4% (MICS6)
Gross Intake Rate in Primary Education
158.5% 152.0% 200.0% 155.2%
Early Child Development Index 70.6% 77.4% 86.7% 73.6%
Percentage of children in Grade 1 who have benefitted from an ECCD intervention
58.5%
62.2%
76.3%
60.3%
39.8% (MICS)
Net ECCD Enrolment Rate 22.3% 23.3% 21.4% 22.7% 22.9% (MICS)
Gross ECCD Enrolment Rate 34.8% 37.0% 28.6% 35.8%
On-time enrolment in primary school is an outcome indicator for MEC ECCD projects. This is
measured by the Net Intake Rate in Primary Education. The Net Intake Rate in the survey sites is
47.2%. This is relatively low in comparison with national rate of 74.4% indicating that a low
percentage of children enter primary school at age five. When examining the Gross Intake Rate in
Primary School, the figure 155.2% indicates that the number of children in Grade 1 far exceeds those
of the official school-entrance age. The mean age of children in Grade 1 in the survey is 7 years with
the oldest child already 13 years old. The late entry age is reflected throughout all grades. There is
no statistical difference in the intake rates between boys and girls.
Age appropriate competencies
Age appropriate competencies is also an outcome indicator for ECCD projects. The survey used an
Early Childhood Development Index (ECDI) as a proxy for this indicator. The ECDI is adapted from
the Lao Social Indicator Survey and is an indication of the extent to which children meet the
benchmarks that they are expected to reach if they are progressing in their development as the
majority of children in their age group. The index is calculated as the percentage of children who are
developmentally on track in at least three of these four domains -- literacy-numeracy, physical,
social-emotional, and learning domains (See Annex B for details of the ECDI). The data from the
household survey suggests that 7 out of every 10 children are developmentally on track. This
corresponds to figures in Laos for children that come from rural areas with limited access, where
poverty is high and where ethnic minority populations reside.
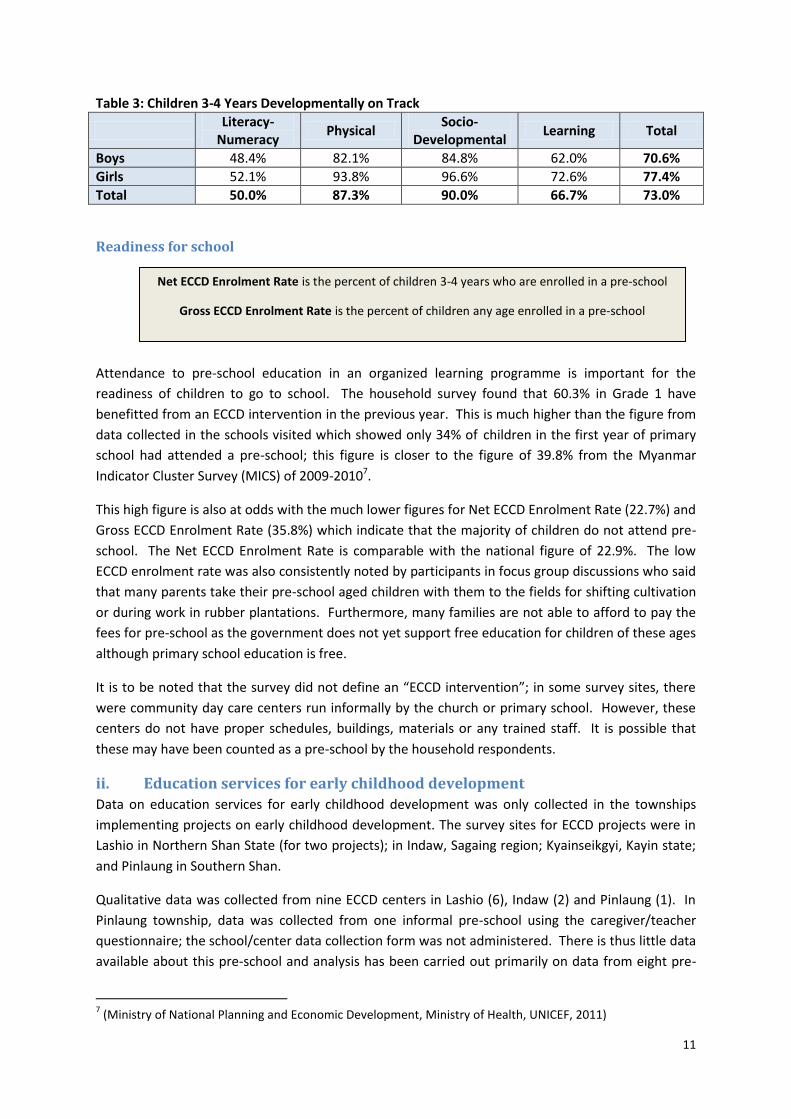
The overall index however masks the differences in development among the domains as shown in
Table 3. More children are developmentally on track physically and in social-developmental aspects
than in literacy-numeracy and learning.
5 The figures in red have a higher standard error due to the smaller sample size for the calculation of the
indicator. This means that the estimate has a lower level of reliability. 6 (Ministry of National Planning and Economic Development, Ministry of Health, UNICEF, 2011)
Early Childhood Development Index shows the percentage of children who are developmentally on track in at least three of these four domains -- literacy-numeracy, physical, social-emotional,
and learning domains
11
Table 3: Children 3-4 Years Developmentally on Track
Literacy-
Numeracy Physical
Socio-Developmental
Learning Total
Boys 48.4% 82.1% 84.8% 62.0% 70.6%
Girls 52.1% 93.8% 96.6% 72.6% 77.4%
Total 50.0% 87.3% 90.0% 66.7% 73.0%
Readiness for school
Attendance to pre-school education in an organized learning programme is important for the
readiness of children to go to school. The household survey found that 60.3% in Grade 1 have
benefitted from an ECCD intervention in the previous year. This is much higher than the figure from
data collected in the schools visited which showed only 34% of children in the first year of primary
school had attended a pre-school; this figure is closer to the figure of 39.8% from the Myanmar
Indicator Cluster Survey (MICS) of 2009-20107.
This high figure is also at odds with the much lower figures for Net ECCD Enrolment Rate (22.7%) and
Gross ECCD Enrolment Rate (35.8%) which indicate that the majority of children do not attend pre-
school. The Net ECCD Enrolment Rate is comparable with the national figure of 22.9%. The low
ECCD enrolment rate was also consistently noted by participants in focus group discussions who said
that many parents take their pre-school aged children with them to the fields for shifting cultivation
or during work in rubber plantations. Furthermore, many families are not able to afford to pay the
fees for pre-school as the government does not yet support free education for children of these ages
although primary school education is free.
It is to be noted that the survey did not define an “ECCD intervention”; in some survey sites, there
were community day care centers run informally by the church or primary school. However, these
centers do not have proper schedules, buildings, materials or any trained staff. It is possible that
these may have been counted as a pre-school by the household respondents.
ii. Education services for early childhood development
Data on education services for early childhood development was only collected in the townships
implementing projects on early childhood development. The survey sites for ECCD projects were in
Lashio in Northern Shan State (for two projects); in Indaw, Sagaing region; Kyainseikgyi, Kayin state;
and Pinlaung in Southern Shan.
Qualitative data was collected from nine ECCD centers in Lashio (6), Indaw (2) and Pinlaung (1). In
Pinlaung township, data was collected from one informal pre-school using the caregiver/teacher
questionnaire; the school/center data collection form was not administered. There is thus little data
available about this pre-school and analysis has been carried out primarily on data from eight pre-
7 (Ministry of National Planning and Economic Development, Ministry of Health, UNICEF, 2011)
Net ECCD Enrolment Rate is the percent of children 3-4 years who are enrolled in a pre-school
Gross ECCD Enrolment Rate is the percent of children any age enrolled in a pre-school
12
schools. In Kyainseikgyi township and in other Pinlaung locations, there were no ECCD centers
established yet although in some villages, there were informal community day care centers. Data
was not collected from these centers.
Of the nine pre-schools visited, four (one in Indaw and three in Lashio) are run by the government as
school-based pre-schools and the remaining are community-based pre-schools, one run by a
monastic school and four by faith-based organizations.
Most of the locations had predominantly ethnic populations. In Lashio, the communities were
primarily Lahu, Kokang and Shan but also included Palaung, Wa, Kachin, Myanmar and Indian
populations. Ethnic groups in other townships included Kayin, PaO and Kayan.
Access to services
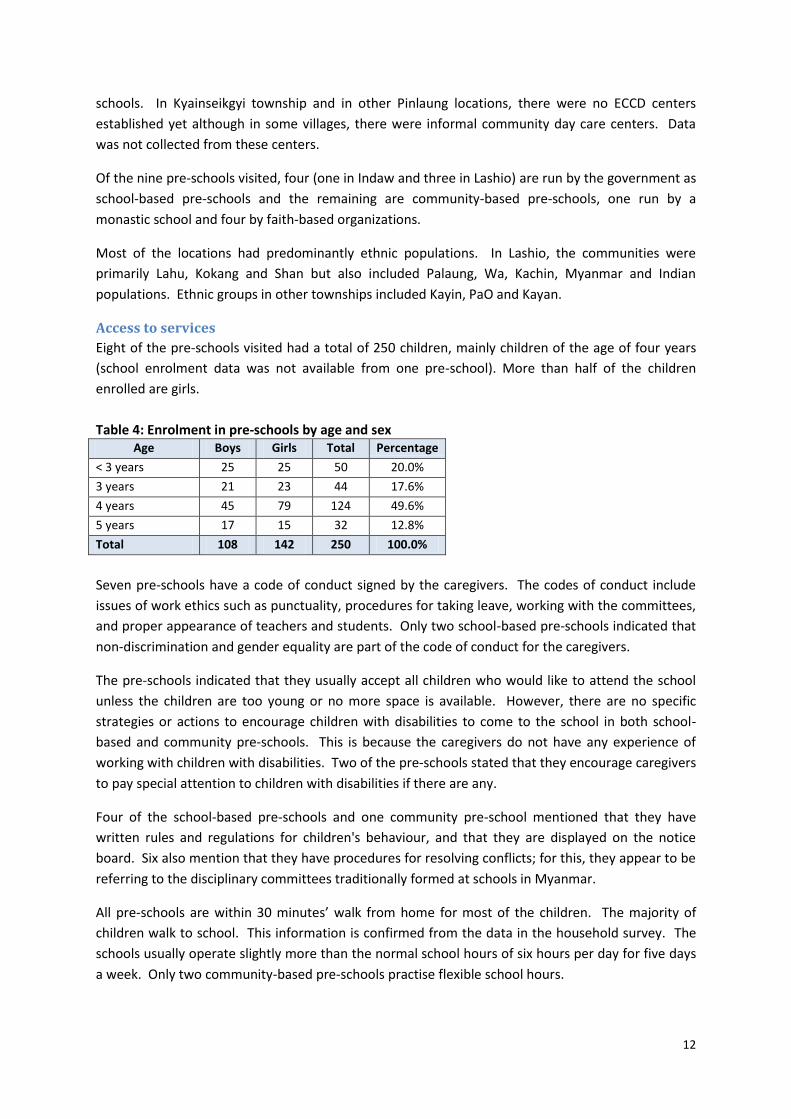
Eight of the pre-schools visited had a total of 250 children, mainly children of the age of four years
(school enrolment data was not available from one pre-school). More than half of the children
enrolled are girls.
Table 4: Enrolment in pre-schools by age and sex Age Boys Girls Total Percentage
< 3 years 25 25 50 20.0%
3 years 21 23 44 17.6%
4 years 45 79 124 49.6%
5 years 17 15 32 12.8%
Total 108 142 250 100.0%
Seven pre-schools have a code of conduct signed by the caregivers. The codes of conduct include
issues of work ethics such as punctuality, procedures for taking leave, working with the committees,
and proper appearance of teachers and students. Only two school-based pre-schools indicated that
non-discrimination and gender equality are part of the code of conduct for the caregivers.
The pre-schools indicated that they usually accept all children who would like to attend the school
unless the children are too young or no more space is available. However, there are no specific
strategies or actions to encourage children with disabilities to come to the school in both school-
based and community pre-schools. This is because the caregivers do not have any experience of
working with children with disabilities. Two of the pre-schools stated that they encourage caregivers
to pay special attention to children with disabilities if there are any.
Four of the school-based pre-schools and one community pre-school mentioned that they have
written rules and regulations for children's behaviour, and that they are displayed on the notice
board. Six also mention that they have procedures for resolving conflicts; for this, they appear to be
referring to the disciplinary committees traditionally formed at schools in Myanmar.
All pre-schools are within 30 minutes’ walk from home for most of the children. The majority of
children walk to school. This information is confirmed from the data in the household survey. The
schools usually operate slightly more than the normal school hours of six hours per day for five days
a week. Only two community-based pre-schools practise flexible school hours.
13
All of the pre-schools collect a form of fee or contribution from the families. School-based pre-
schools in Lashio collect an annual fee of Kyat 50,000 to 70,000 per year while community pre-
schools collect Kyat 1,000 to 20,000 per year. For one school-based pre-school in Indaw, the
contribution is rice not money; each household contributes about 3 baskets of rice per year which is
equivalent to about Kyat 15,000. The collection of fees is confirmed by information from focus group
discussions where the participants indicated that pre-schools collect between 1,000 and 7,000 Kyat
per month to support caregivers’ salaries and learning materials as the government does not yet
provide support for pre-schools although there appears to be an indication from the government
that it will do so. The fees are a barrier to attending pre-school for some poorer community
members. The school-based pre-schools have no policy on fee exemption: everyone has to pay.
However, three community-based preschools practice fee exemption policy for poor children and in
the 2013-14 school year, a total of eight children were exempted from fees in two of these schools.
The higher fees are charged by the three school-based pre-schools in Lashio which likely cater to
better off families in the urban/peri-urban areas. One of these pre-schools has been recently
nominated the best ECCD center in Lashio raising the question of the need for additional assistance.
Learning environment
The majority of the pre-schools have only one classroom housed in a larger building. One
community-based pre-school is in a temporary building and in the focus group discussions, the
participants noted that some parents do not send their children to the school because they feel the
building is not secure. Half of the ECCD classrooms are accessible for children with disabilities. Only
about half of the pre-schools have adequate furniture and proper bedding for the children.
Five pre-schools mentioned that children bring their own drinking water in bottles. For three school-
based pre-schools in Lashio where children do not bring water from home, the main water source is
tube-wells and wells, and water is usually treated through boiling or using a water filter. Drinking
water is properly stored but cups are not available for each child. Most of the pre-schools have no
special arrangements to provide drinking water for children with disabilities since they do not have
children with disabilities in their schools.
The data shows that the ratio of students per toilet is around 9 to 1 but in most cases, the children
have to share toilets with older children from primary grades. Only two schools have their own
toilets, separating boys and girls. Most of the pre-schools mention that they have hand-washing
facilities and while water is available most of the time, it is not clear if soap is available in the
facilities. None of the pre-schools provide for accessibility to those facilities by children with
disabilities.
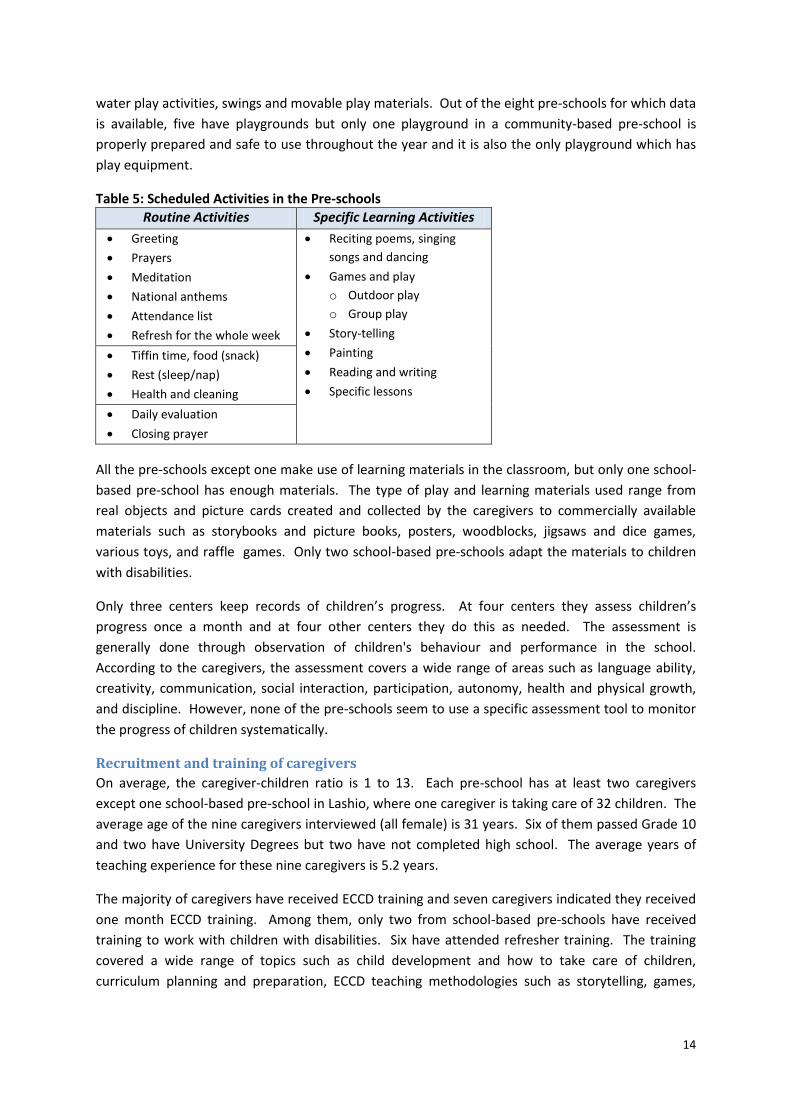
Teaching and learning approach
Almost all the pre-schools have a timetable or activity schedule and at only one school the children
do not work according to the schedule. For all these schools, the schedule balances between
different types of activities.Table 5 shows a summary of different routine and learning activities
commonly seen in those pre-schools.
Seven pre-schools have inside learning corners with creative materials, blocks and books. Six pre-
schools have learning corners with imagination and games and four centers have learning corners
with music. Five pre-schools have external learning corners with sand activities, four pre-schools
have free play and creative play and three pre-schools (which is less than half of the centers) have
14
water play activities, swings and movable play materials. Out of the eight pre-schools for which data
is available, five have playgrounds but only one playground in a community-based pre-school is
properly prepared and safe to use throughout the year and it is also the only playground which has
play equipment.
Table 5: Scheduled Activities in the Pre-schools
Routine Activities Specific Learning Activities
Greeting
Prayers
Meditation
National anthems
Attendance list
Refresh for the whole week
Reciting poems, singing
songs and dancing
Games and play
o Outdoor play
o Group play
Story-telling
Painting
Reading and writing
Specific lessons
Tiffin time, food (snack)
Rest (sleep/nap)
Health and cleaning
Daily evaluation
Closing prayer
All the pre-schools except one make use of learning materials in the classroom, but only one school-
based pre-school has enough materials. The type of play and learning materials used range from
real objects and picture cards created and collected by the caregivers to commercially available
materials such as storybooks and picture books, posters, woodblocks, jigsaws and dice games,
various toys, and raffle games. Only two school-based pre-schools adapt the materials to children
with disabilities.
Only three centers keep records of children’s progress. At four centers they assess children’s
progress once a month and at four other centers they do this as needed. The assessment is
generally done through observation of children's behaviour and performance in the school.
According to the caregivers, the assessment covers a wide range of areas such as language ability,
creativity, communication, social interaction, participation, autonomy, health and physical growth,
and discipline. However, none of the pre-schools seem to use a specific assessment tool to monitor
the progress of children systematically.
Recruitment and training of caregivers
On average, the caregiver-children ratio is 1 to 13. Each pre-school has at least two caregivers
except one school-based pre-school in Lashio, where one caregiver is taking care of 32 children. The
average age of the nine caregivers interviewed (all female) is 31 years. Six of them passed Grade 10
and two have University Degrees but two have not completed high school. The average years of
teaching experience for these nine caregivers is 5.2 years.
The majority of caregivers have received ECCD training and seven caregivers indicated they received
one month ECCD training. Among them, only two from school-based pre-schools have received
training to work with children with disabilities. Six have attended refresher training. The training
covered a wide range of topics such as child development and how to take care of children,
curriculum planning and preparation, ECCD teaching methodologies such as storytelling, games,
15
poems and songs, developing play and learning materials, getting feedback and parenting education.
The training topics were similar for school-based and community-based pre-schools.
There is a significant difference in relation to how the pre-school is organized between those who
have received ECCD training and those who have not. Two caregivers who have never been trained
on ECCD were not able to describe how ECCD activities could be properly organized and conducted.
There seems to be a lack of support for teachers to ensure that they work in accordance with the
ECCD minimum standards in Myanmar. Daily observation, monitoring and providing feedback and
guidance to the caregivers appears to be weak in all schools. The nine caregivers interviewed
indicated that eight of the pre-schools have a management committee that oversees the
management of the school. However, only five of them mentioned that the committees organize
meetings with the caregivers, but again this is not done regularly and frequently. The committees
rarely visit the schools to observe teaching and give guidance to the caregivers. There is only one
pre-school where the management committee visited the school, observed the teaching and gave
the feedback and guidance to the caregiver more than ten times in 2013-14 school year. This is
probably because these committees are not properly equipped with the necessary knowledge and
skills to assume such responsibilities.
In contrast, seven out of eight principals from the pre-schools surveyed mentioned that there are
regular caregivers’ planning meetings, varying from once a week to half yearly. All caregivers also
indicated that there is regular observation of the classroom teaching though the frequency of
observation varies from one school to another, ranging from daily to quarterly in a year. This is likely
by the school principal, not by the management committee.
Community involvement
The involvement of parents and families is crucial for all round development of children in the
communities, and there is a positive step towards this initiated by the pre-schools surveyed for this
study. Out of eight pre-schools, seven indicated that the management committees and the
principals have arranged to meet parents of the children, and all teachers were likely to have met
parents in the last school year (2013-14). However, only limited effort has been made to mobilize
parents for greater involvement in the school activities. The school management, mainly the
principal, makes occasional talks to the parents in the annual meetings and ceremonies either in the
school or at the church to encourage them to send their children to school. Apart from this, there
does not seem to be any other notable efforts to encourage parents to be involved in the school
activities. This is confirmed in focus group discussions.
Notwithstanding the limited parental involvement in the children’s learning, many of the pre-schools
are supported through community contributions and parents often contribute their time and effort
for construction (e.g. for fences, walkways etc.). Due to limited government support, most of the
pre-schools have many needs – some lack their own buildings, some lack toilets or a good water
supply, most lack adequate play and teaching materials, bedding, tables and chairs. Most
community pre-schools thus try to raise funds or obtain donations from private companies, NGOs or
religious organisations.
16
Management
As half of the pre-schools are school-based pre-schools, the management of these pre-schools is part
of the school management by the principals. For some school-based pre-schools, the caregivers
appear to be government teachers but for others, the recruitment is done in consultation with PTAs
and School Management Committees. For some community pre-schools, the local church is also
involved in the recruitment process as the school is run under the auspices of the church.
Assignment of teachers for the pre-school is mostly done by the principal, and on some occasions in
consultation with the teachers. The PTAs and Management Committees are not involved in the
teacher assignment process. For caregivers who are not government teachers, their entitlements
are usually decided by the PTA or the School Management Committee.
Most of the schools have a PTA and School Management Committee. The selection of the members
varies with some selected by the village administrator and others selected by the community.
Irrespective of how they were selected, the members usually include the village administrator, 10
Household leaders, church leaders, teachers and parents. The number of members varies widely
from about 15 to more than 30 members. Most committees consist of a Chair, Vice-Chair, Secretary,
cashier/accountant and general members. They organize regular meetings mainly facilitated by the
Chairperson of the PTA or the School Management Committee, who usually is the principal of the
school. In the 2013-14 school year, the committees met approximately 4 times, and the main topics
discussed include collection of fees and contributions, infrastructure improvement, developing toys
and learning materials and preparation for various ceremonies such as PTA annual meetings, annual
school sports and religious occasions. There is only one pre-school which has discussed the
development and implementation of the annual school plan and establishment of a fund for
development of education in the school with the communities. In most schools, meeting records are
kept although some committees indicated they do not yet do so as they are new. Decisions are
usually informed to the community by word of mouth, during church service or through the village
authorities.
Although all pre-schools collect fees, only five schools mention that they raise extra funds. There is a
wide gap in the amount each school raised in a school year. A couple of pre-schools based in
government high schools in the urban areas raised between 1,000,000 kyats to 5,000,000 kyats
while most pre-schools raised only 100,000 to 200,000 kyats. For the high schools, this fund is for
the entire school and was for specific projects (e.g. one school was fundraising for a staff house for
teachers). These funds are usually used for infrastructure maintenance, furniture and giving prizes
for outstanding students. One school uses all the funds for the caregivers’ salary. Usually the
committee oversees the management of the funds though the treasurer of the committee and the
audit team of the organization.
Three pre-schools indicate that they have received training on school management, provided by the
government and NGOs. The topics covered in the training include children's rights, protection for
children, children with disabilities, gender equality and school administration. However, none of the
School Management Committee members have received any training. There are a total of 5
caregivers who have been trained as ECCD trainers.
17
iii. Household and community factors affecting early childhood development
It is recognized that the first three to four years of life are critical in the development of a child, and
that the support and the quality of care that a child receives during this time is a major determinant
in their well-being. In this context, the activities that parents or adults engage in with their children
serve as an important indicator of the quality of home care. Furthermore, the amount of time spent
by adults on activities that support children can be important for a young child’s mental
development
The household survey showed that about 28% of children under-five in the survey get inadequate
care, defined here as the percentage of children who were left alone or in the care of another child
under-10 years of age for more than one hour at least once in the past week.
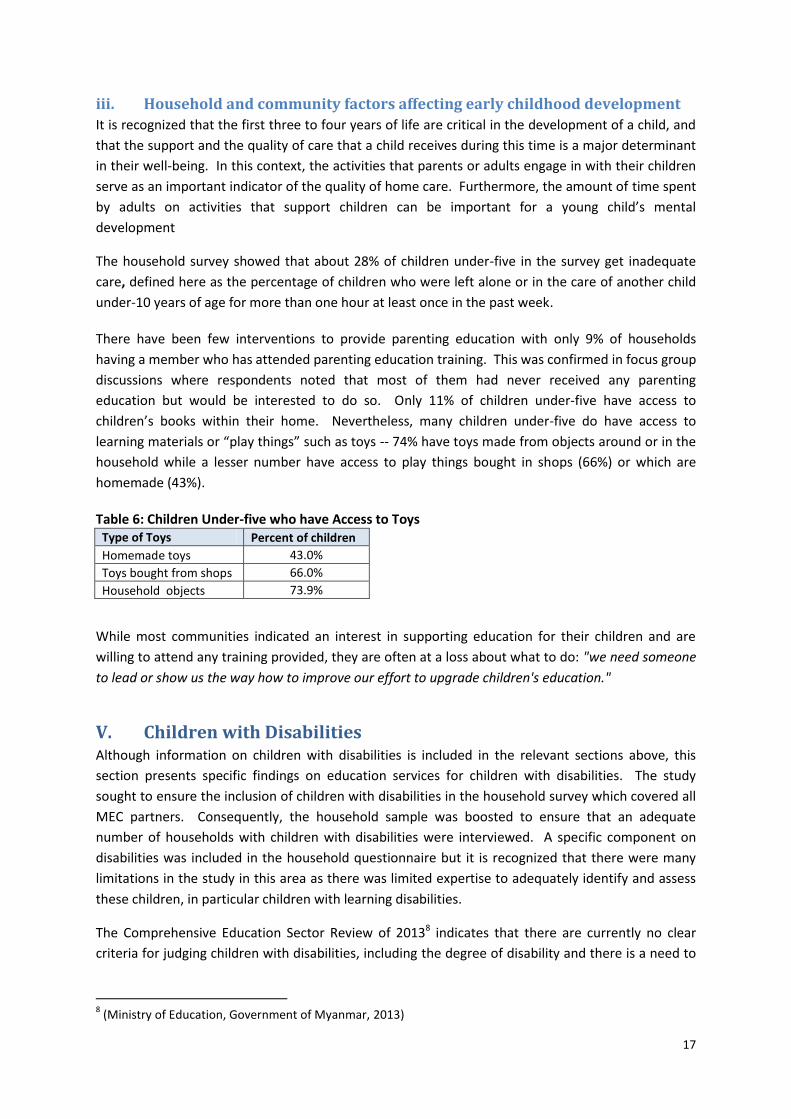
There have been few interventions to provide parenting education with only 9% of households
having a member who has attended parenting education training. This was confirmed in focus group
discussions where respondents noted that most of them had never received any parenting
education but would be interested to do so. Only 11% of children under-five have access to
children’s books within their home. Nevertheless, many children under-five do have access to
learning materials or “play things” such as toys -- 74% have toys made from objects around or in the
household while a lesser number have access to play things bought in shops (66%) or which are
homemade (43%).
Table 6: Children Under-five who have Access to Toys Type of Toys Percent of children
Homemade toys 43.0%
Toys bought from shops 66.0%
Household objects 73.9%
While most communities indicated an interest in supporting education for their children and are
willing to attend any training provided, they are often at a loss about what to do: "we need someone
to lead or show us the way how to improve our effort to upgrade children's education."
V. Children with Disabilities Although information on children with disabilities is included in the relevant sections above, this
section presents specific findings on education services for children with disabilities. The study
sought to ensure the inclusion of children with disabilities in the household survey which covered all
MEC partners. Consequently, the household sample was boosted to ensure that an adequate
number of households with children with disabilities were interviewed. A specific component on
disabilities was included in the household questionnaire but it is recognized that there were many
limitations in the study in this area as there was limited expertise to adequately identify and assess
these children, in particular children with learning disabilities.
The Comprehensive Education Sector Review of 20138 indicates that there are currently no clear
criteria for judging children with disabilities, including the degree of disability and there is a need to
8 (Ministry of Education, Government of Myanmar, 2013)
18
establish individual learning achievement/targets according to an individual’s degree of disability.
Currently, children with disabilities tend to attend public schools.
Among the children with disabilities surveyed, 16.2% had a hearing disability, 8.5% a seeing
disability, 30.0% a physical disability and 23.8% a learning disability. The higher number of children
with a physical disability may be because the survey sites included many remote and fragile
environments exposed to past conflict and instability.
i. Educational attainment for children with disabilities
The Net Primary Enrolment Rate for children with disabilities, 81.9%, is comparable with that for
other children. Apart from this indicator, it is difficult to assess educational attainment for children
with disabilities due to the lower level of reliability of the data resulting from the smaller sample
size. In general, however, the indicators for children with disabilities tend to be lower than the
overall figures for all children combined.
While the Net Primary Enrolment Rate for children with disabilities is comparable with that for all
children, the data indicates that a large percentage of these children do not attend school regularly.
The household survey showed that only 22% of children with disabilities attended school for at least
80% of the time in the previous month.
ii. Education services for children with disabilities
The household survey found that only about 18% of children with disabilities get extra help within
schools regardless of the kind of school. Most children with disabilities take the same examinations
as other students under the same conditions. As a result children with disabilities tend to do less
well when compared with regular children in school. There is lack of consideration for each disabled
student to study according to his/her degree of disability including an appropriate support system
and evaluation for these individuals.
In general, interviews in schools showed that most schools do not provide access for children with
disabilities and most teachers have not been trained to work with such children. In some areas,
some teachers noted that this is because they do not have children with disabilities in their schools
but this begs the question of why these children are not in those schools.
iii. Household and community factors affecting education for children with
disabilities
Despite the barriers noted, the study showed that a majority of people surveyed have positive
attitudes towards schooling for children with disabilities. Seventy eight percent of total households
interviewed responded positively to 2 of the 3 questions: whether children with disabilities should
go to school; whether they should be integrated in regular schools: and whether they should get
special help in regular schools. The positive attitudes were also reflected in focus group discussions
where respondents noted that there is no discrimination against children with disabilities.
VI. Conclusions The following are some of the key implications of the findings of the overall survey for consideration
by MEC for further study and in the development of its programme with its partners.
19
1. The study shows that there are positive attitudes towards schooling for children with disabilities
in the community and primary enrolment for children with disabilities is comparable with that of
other children. However, it appears that children with disabilities are not attending school
regularly and education attainment is somewhat lower than other children. This is likely
because although children with disabilities are being accepted into regular schools, most
teachers have not been trained to work with these children. Most teachers do not adapt
materials for children with disabilities and no additional assistance is provided in the classroom.
Furthermore, there are no accepted tools for assessing and thus identifying children with
disabilities, in particular those with learning disabilities. MEC should support its partners to pilot
models for inclusive education which can be promoted for wider acceptance in the government
education system.
2. The study shows that children who speak the same language as that used in school have better
comprehension rates highlighting the importance of mother tongue instruction in schools. The
majority of the households interviewed consider it important to learn mother tongue, as well as
Myanmar and English in the ethnic areas. Many of the schools supported by the MEC in the
ethnic areas are government schools with Myanmar as the medium of instruction. The MEC
should consider supporting partners to:
a. Develop methods and materials for teaching Myanmar as a second language to
students in ethnic areas. Currently, the same teaching methods and materials used
for teaching Myanmar to Myanmar students are used with ethnic children. As a
result, ethnic children may learn to read and write Myanmar but do not necessarily
understand the language.
b. Support schools to introduce and strengthen methods for teaching of ethnic
languages in schools where Myanmar is the medium of instruction.
c. Provide support for use of mother tongue in the classroom for explaining concepts
and instructions where Myanmar is the medium of instruction. This may include
supporting teacher assistants and adapting teacher recruitment policies to ensure
that there is a teacher who can speak the language of the children in each
classroom.
3. Many of the children in school are overage indicating late entry into school and high repetition
rates. In addition to tracking net enrolment rates, MEC should assess the gross enrolment rates
to better understand enrolment levels in schools. Furthermore, MEC should support partners to
better understand why children are starting school late in order to be able to better address this
issue.
4. A number of indicators from the study are not consistent with the findings from other studies, in
particular the lower reading ability of students who have attended a pre-school in comparison
with those who have not, as well as the high percentage of children in first grade who have
attended a pre-school. MEC should carry out additional studies to better understand the
reasons for the differences.
5. Most of the schools have inadequate facilities. In particular, there is a need to improve water
and sanitation facilities, particularly in non-government schools. MEC should consider providing
support for these areas to its partners.
6. Although there appears to be significant community involvement in school management bodies
and Parent Teacher Associations, these bodies have a minimal role and most of school
20
management is led by the school principal. MEC should support partners to find ways to better
promote community involvement, for example in extra-curricular activities.
7. The survey found that most schools have inadequate funds and fees are currently being
collected in pre-schools limiting accessibility by some children. In order to better understand
financial management and financing needs in non-government schools, including in community
and Ethnic Education Department schools and non-formal education centers, MEC should
support a cost and financing study in collaboration with its partners.
21
VII. Bibliography
edddata II, USAID. (2014). Early Grade Reading Assessment. Retrieved August 2014, from
www.eddataglobal.org.
Ministry of Education, Government of Myanmar. (2013). Comprehensive Education Sector Review,
Phase I Rapid Assessment Report.
Ministry of National Planning and Economic Development, Ministry of Health, UNICEF. (2011).
Myanmar Multiple Indicator Cluster Survey 2009-2010. Yangon.
RTI International. (2014). Early Grade Mathematics Assessment (EGMA) Toolkit.
22
Annexes
23
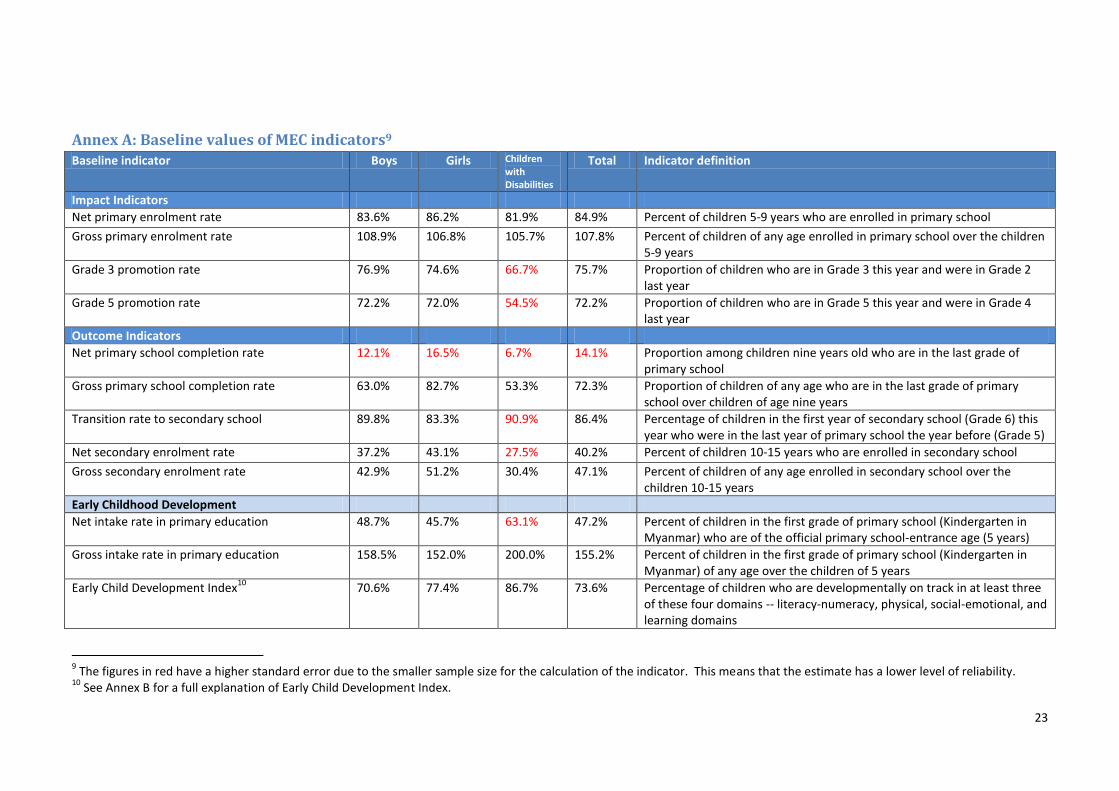
Annex A: Baseline values of MEC indicators9 Baseline indicator Boys Girls Children
with Disabilities
Total Indicator definition
Impact Indicators
Net primary enrolment rate 83.6% 86.2% 81.9% 84.9% Percent of children 5-9 years who are enrolled in primary school
Gross primary enrolment rate 108.9% 106.8% 105.7% 107.8% Percent of children of any age enrolled in primary school over the children 5-9 years
Grade 3 promotion rate 76.9% 74.6% 66.7% 75.7% Proportion of children who are in Grade 3 this year and were in Grade 2 last year
Grade 5 promotion rate 72.2% 72.0% 54.5% 72.2% Proportion of children who are in Grade 5 this year and were in Grade 4 last year
Outcome Indicators
Net primary school completion rate 12.1% 16.5% 6.7% 14.1% Proportion among children nine years old who are in the last grade of primary school
Gross primary school completion rate 63.0% 82.7% 53.3% 72.3% Proportion of children of any age who are in the last grade of primary school over children of age nine years
Transition rate to secondary school 89.8% 83.3% 90.9% 86.4% Percentage of children in the first year of secondary school (Grade 6) this year who were in the last year of primary school the year before (Grade 5)
Net secondary enrolment rate 37.2% 43.1% 27.5% 40.2% Percent of children 10-15 years who are enrolled in secondary school
Gross secondary enrolment rate 42.9% 51.2% 30.4% 47.1% Percent of children of any age enrolled in secondary school over the children 10-15 years
Early Childhood Development
Net intake rate in primary education 48.7% 45.7% 63.1% 47.2% Percent of children in the first grade of primary school (Kindergarten in Myanmar) who are of the official primary school-entrance age (5 years)
Gross intake rate in primary education 158.5% 152.0% 200.0% 155.2% Percent of children in the first grade of primary school (Kindergarten in Myanmar) of any age over the children of 5 years
Early Child Development Index10
70.6% 77.4% 86.7% 73.6% Percentage of children who are developmentally on track in at least three of these four domains -- literacy-numeracy, physical, social-emotional, and learning domains
9 The figures in red have a higher standard error due to the smaller sample size for the calculation of the indicator. This means that the estimate has a lower level of reliability.
10 See Annex B for a full explanation of Early Child Development Index.
24
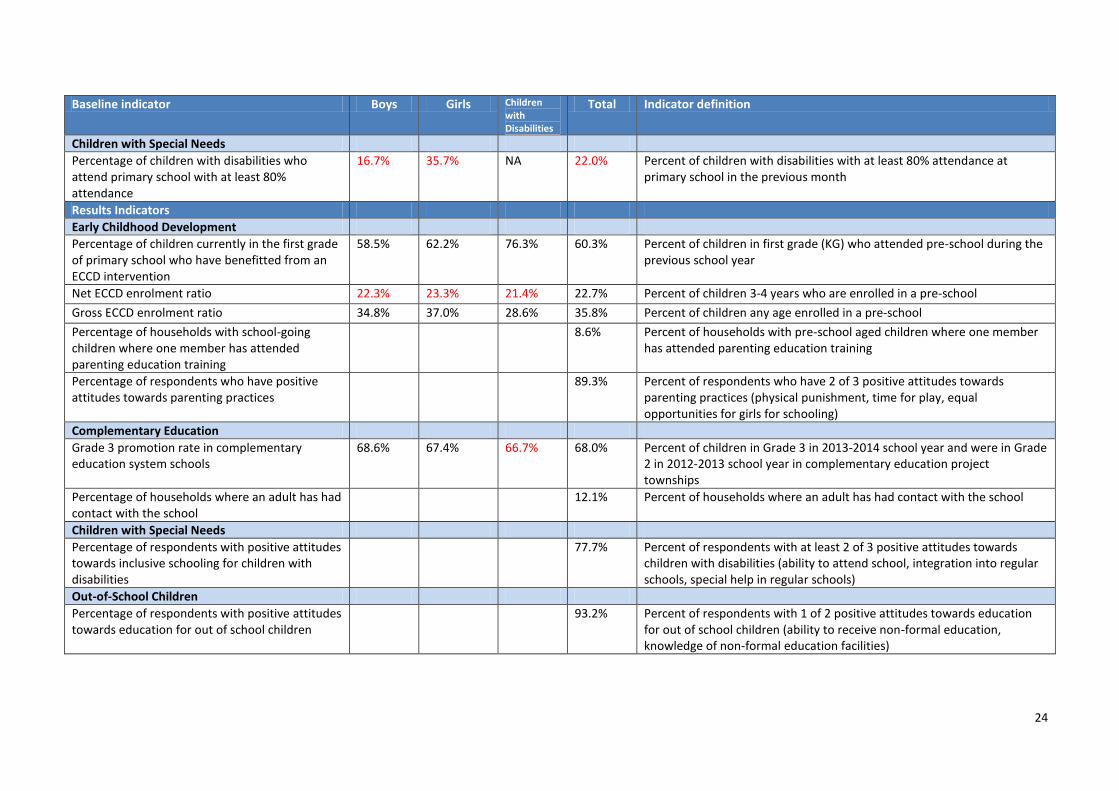
Baseline indicator Boys Girls Children with Disabilities
Total Indicator definition
Children with Special Needs
Percentage of children with disabilities who attend primary school with at least 80% attendance
16.7%
35.7%
NA 22.0% Percent of children with disabilities with at least 80% attendance at primary school in the previous month
Results Indicators
Early Childhood Development
Percentage of children currently in the first grade of primary school who have benefitted from an ECCD intervention
58.5%
62.2%
76.3%
60.3%
Percent of children in first grade (KG) who attended pre-school during the previous school year
Net ECCD enrolment ratio 22.3% 23.3% 21.4% 22.7% Percent of children 3-4 years who are enrolled in a pre-school
Gross ECCD enrolment ratio 34.8% 37.0% 28.6% 35.8% Percent of children any age enrolled in a pre-school
Percentage of households with school-going children where one member has attended parenting education training
8.6% Percent of households with pre-school aged children where one member has attended parenting education training
Percentage of respondents who have positive attitudes towards parenting practices
89.3% Percent of respondents who have 2 of 3 positive attitudes towards parenting practices (physical punishment, time for play, equal opportunities for girls for schooling)
Complementary Education
Grade 3 promotion rate in complementary education system schools
68.6% 67.4% 66.7% 68.0% Percent of children in Grade 3 in 2013-2014 school year and were in Grade 2 in 2012-2013 school year in complementary education project townships
Percentage of households where an adult has had contact with the school
12.1% Percent of households where an adult has had contact with the school
Children with Special Needs
Percentage of respondents with positive attitudes towards inclusive schooling for children with disabilities
77.7% Percent of respondents with at least 2 of 3 positive attitudes towards children with disabilities (ability to attend school, integration into regular schools, special help in regular schools)
Out-of-School Children
Percentage of respondents with positive attitudes towards education for out of school children
93.2% Percent of respondents with 1 of 2 positive attitudes towards education for out of school children (ability to receive non-formal education, knowledge of non-formal education facilities)
25
Annex B: Early Childhood Development Index
‘Early child development’ is defined as an orderly, predictable process along a continuous path, in
which a child learns to handle more complicated levels of moving, thinking, speaking, feeling and
relating to others. Physical growth, literacy and numeracy skills, socio-emotional development and
readiness to learn are vital domains of a child’s overall development, which is a basis for overall
human development.
A 10-item module is used to calculate the Early Child Development Index (ECDI). The ECDI is based
on benchmarks that children are expected to reach if they are progressing in their development as
the majority of children in their age group develop.
Each of the 10 items is used in one of four domains to determine whether children are
developmentally on track in that domain. The domains in question are:
• Literacy-numeracy: Children are identified as being developmentally on track according to
whether they can identify/name at least 10 letters of the alphabet, whether they can read at
least four simple, popular words, and whether they know the names and recognize the
symbols of all numbers from 1 to 10. If at least two of these capabilities are found, the child
is considered developmentally on track
• Physical: If the child can pick up a small object such as a stick or a rock from the ground with
two fingers, and/or the mother or caretaker does not indicate that the child is sometimes
too sick to play, then the child is regarded as being developmentally on track in the physical
domain
• Social-emotional: Children are considered to be developmentally on track if two of the
following are true: the child gets along well with other children; the child does not kick, bite
or hit other children; and the child does not get distracted easily
• Learning: If the child follows simple directions on how to do something correctly and/or
when given something to do, is able to do it independently, then the child is considered to
be developmentally on track in this domain
ECDI is calculated as the percentage of children who are developmentally on track in at least three of
these four domains.
Sources: Lao Social Indicator Survey (LSIS) 2011-2012 (Multiple Indicator Cluster Survey/Demographic
and Health Survey. December 2012. Lao PDR.