mutual funds: performance evaluation. РЭШ efm 2004/05 2 open-end mutual funds active vs passive...
TRANSCRIPT

Mutual funds: Mutual funds: performance performance evaluationevaluation
EFM 2004/05EFM 2004/05 22
РЭШ
Open-end mutual Open-end mutual fundsfunds Active vs passive (index) fundsActive vs passive (index) funds Obliged to buy/sell shares at NAVObliged to buy/sell shares at NAV
– Net Asset Value = Total Net Assets (TNA) Net Asset Value = Total Net Assets (TNA) per shareper share
Part of the fund family (run by one Part of the fund family (run by one management company)management company)
Management fee:Management fee:– Asset-based: proportional to TNAAsset-based: proportional to TNA– Performance-based: must be symmetric Performance-based: must be symmetric
around the benchmarkaround the benchmark

EFM 2004/05EFM 2004/05 33
РЭШ
MF categories MF categories (by Morningstar)(by Morningstar) Broad asset Broad asset classclass::
– Domestic: equity vs bond vs money market vs Domestic: equity vs bond vs money market vs hybridhybrid
– International: foreign, world (global), Europe, International: foreign, world (global), Europe, Pacific, etc.Pacific, etc.
(Stated) investment (Stated) investment objective objective – Equity: aggressive growth, growth, Equity: aggressive growth, growth,
growth&income, equity-income, incomegrowth&income, equity-income, income– Bond: government, municipal, corporateBond: government, municipal, corporate– Hybrid: balanced, asset allocationHybrid: balanced, asset allocation
(Estimated) investment (Estimated) investment stylestyle: 3x3 matrix: 3x3 matrix– Equity: large/mid/small-cap – value/blend/growthEquity: large/mid/small-cap – value/blend/growth– Bonds: high/medium/low credit quality – Bonds: high/medium/low credit quality –
short/intermediate/long durationshort/intermediate/long duration
EFM 2004/05EFM 2004/05 44
РЭШ
Benefits of investing Benefits of investing via MFvia MF Low transaction costsLow transaction costs
– Easy way to buy a diversified portfolioEasy way to buy a diversified portfolio Customer servicesCustomer services
– Liquidity insuranceLiquidity insurance– Easy transfer across funds within the Easy transfer across funds within the
familyfamily Professional managementProfessional management
– Selecting right stocks at right time?Selecting right stocks at right time? The objective of the research:The objective of the research:
– Check the validity of these claimsCheck the validity of these claims

EFM 2004/05EFM 2004/05 55
РЭШ
Research questionsResearch questions
Why has it become one of the largest Why has it become one of the largest financial intermediaries?financial intermediaries?
Why are there more mutual funds than Why are there more mutual funds than stocks?stocks?
How to measure fund performance adjusted How to measure fund performance adjusted for risk?for risk?
Does fund performance persist?Does fund performance persist? How do investors choose between funds?How do investors choose between funds? Which incentives does it give to fund Which incentives does it give to fund
managers?managers? How accurately do categories divide funds?How accurately do categories divide funds?
EFM 2004/05EFM 2004/05 66
РЭШ
PlanPlan
Performance evaluationPerformance evaluation– Risk-adjusted performanceRisk-adjusted performance
Absolute vs relativeAbsolute vs relative Return-based vs portfolio-basedReturn-based vs portfolio-based Selection vs timing abilitySelection vs timing ability Unconditional vs conditionalUnconditional vs conditional
– Differential performanceDifferential performance Performance persistencePerformance persistence Determinants of performanceDeterminants of performance
– Impact of survivor biasImpact of survivor bias
EFM 2004/05EFM 2004/05 77
РЭШ
PlanPlan (cont.)(cont.)
Determinants of fund flowsDeterminants of fund flows– Non-linear relation to past performance:Non-linear relation to past performance:
High and low performanceHigh and low performance Recent and distant performanceRecent and distant performance
Fund strategic behavior (to maximize Fund strategic behavior (to maximize performance and flows)performance and flows)– Risk-takingRisk-taking– Window-dressingWindow-dressing– Allocating performance within the familyAllocating performance within the family– Incubator strategiesIncubator strategies
EFM 2004/05EFM 2004/05 88
РЭШ
How to measure MF How to measure MF performance?performance? Raw returnRaw return, determined by, determined by
– Risk factorsRisk factors– Factor exposuresFactor exposures
TimingTiming ability: changing beta at right ability: changing beta at right timetime
– Selection Selection (stock-picking) ability(stock-picking) ability Choosing right stocks (for same level of Choosing right stocks (for same level of
risk)risk)
EFM 2004/05EFM 2004/05 99
РЭШ
How to measure MF How to measure MF performance?performance? Risk-adjusted returnRisk-adjusted return: :
– Difference between fund Difference between fund ii’s return and ’s return and benchmark returnbenchmark return
– Benchmark: passive portfolio with same risk as Benchmark: passive portfolio with same risk as fund fund ii
How to find a right benchmark?How to find a right benchmark?– Return-based approach: estimate based on Return-based approach: estimate based on
past returnspast returns– Portfolio-based approach: construct a portfolio Portfolio-based approach: construct a portfolio
of assets similar to those held by the fundof assets similar to those held by the fund– Relative approach: compare to performance of Relative approach: compare to performance of
other fundsother funds
EFM 2004/05EFM 2004/05 1010
РЭШ
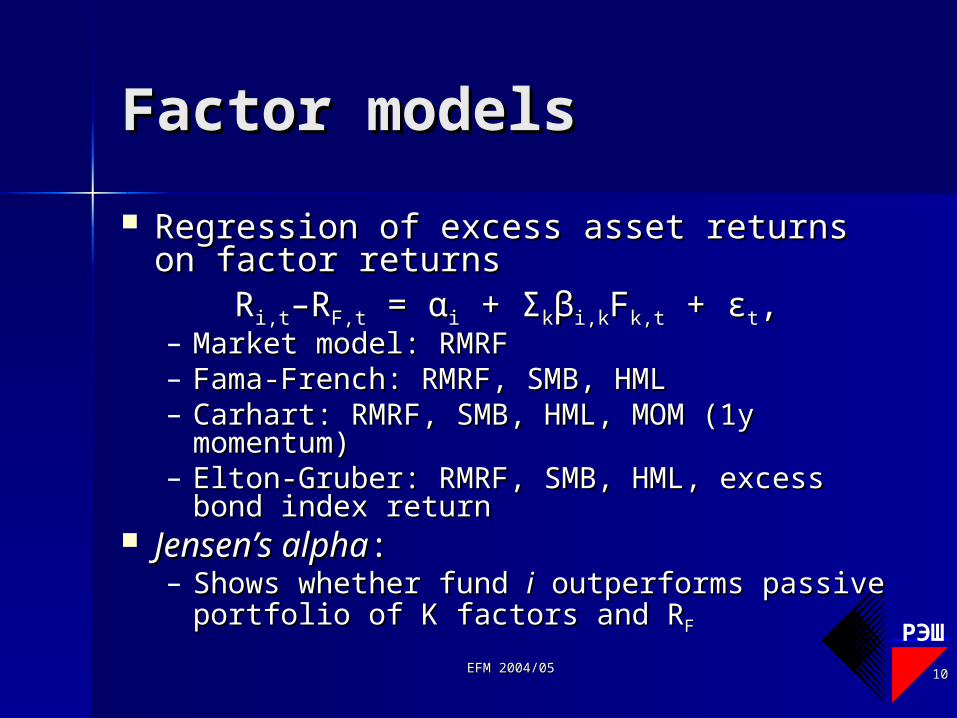
Factor modelsFactor models
Regression of excess asset returns on Regression of excess asset returns on factor returnsfactor returns
RRi,ti,t–R–RF,tF,t = α = αii + Σ + Σkkββi,ki,kFFk,tk,t + + εεtt,,– Market model: RMRFMarket model: RMRF– Fama-French: RMRF, SMB, HMLFama-French: RMRF, SMB, HML– Carhart: RMRF, SMB, HML, MOM (1y Carhart: RMRF, SMB, HML, MOM (1y
momentum)momentum)– Elton-Gruber: RMRF, SMB, HML, excess Elton-Gruber: RMRF, SMB, HML, excess
bond index returnbond index return Jensen’s alphaJensen’s alpha::
– Shows whether fund Shows whether fund ii outperforms passive outperforms passive portfolio of K factors and Rportfolio of K factors and RFF
EFM 2004/05EFM 2004/05 1111
РЭШ
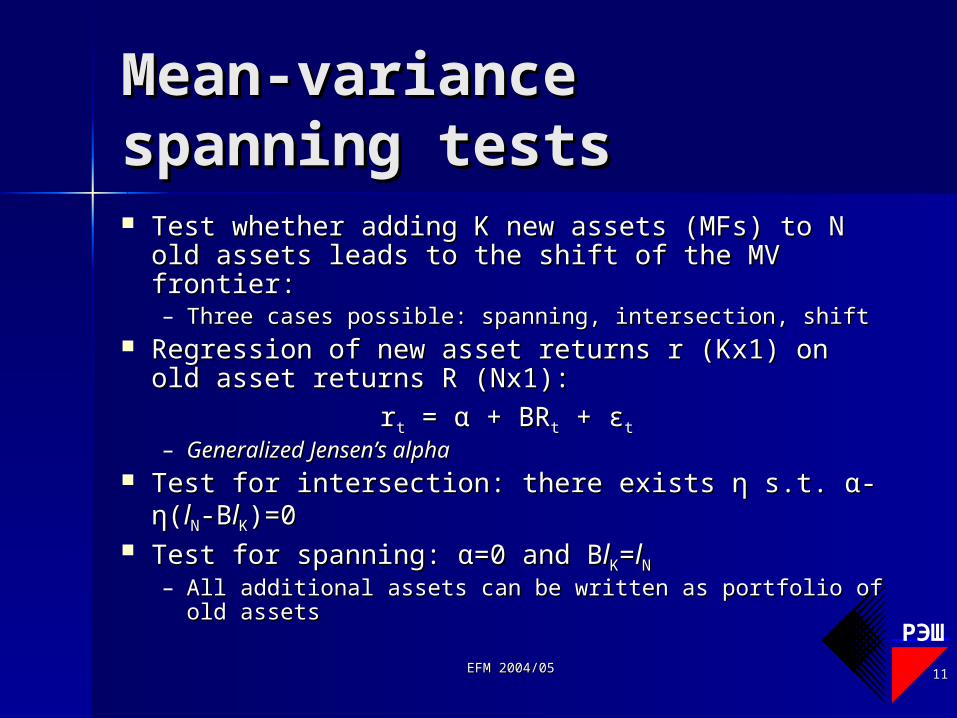
Mean-variance Mean-variance spanning testsspanning tests Test whether adding K new assets (MFs) to N Test whether adding K new assets (MFs) to N
old assets leads to the shift of the MV frontier:old assets leads to the shift of the MV frontier:– Three cases possible: spanning, intersection, shiftThree cases possible: spanning, intersection, shift
Regression of new asset returns r (Kx1) on old Regression of new asset returns r (Kx1) on old asset returns R (Nx1):asset returns R (Nx1):
rrtt = α + BR = α + BRtt + + εεtt
– Generalized Jensen’s alphaGeneralized Jensen’s alpha Test for intersection: there exists η s.t. Test for intersection: there exists η s.t. αα--ηη((llNN--
BBllKK)=0)=0 Test for spanning: Test for spanning: αα=0 =0 and and BBllKK==llNN
– All additional assets can be written as portfolio of old All additional assets can be written as portfolio of old assetsassets
EFM 2004/05EFM 2004/05 1212
РЭШ
Other absolute ordinal Other absolute ordinal measuresmeasures Sharpe ratio: (E(RSharpe ratio: (E(Rii)-R)-RFF)/σ)/σii
Treynor ratio: (E(RTreynor ratio: (E(Rii)-R)-RFF)/)/ββii
Appraisal ratio: Appraisal ratio: ααii//σσ((εε))ii
– Called Treynor-Black ratio when Called Treynor-Black ratio when alpha based on market modelalpha based on market model
EFM 2004/05EFM 2004/05 1313
РЭШ
Relative performance Relative performance measuresmeasures Use funds in the same category as a Use funds in the same category as a
benchmarkbenchmark Ordinal measures: difference with the Ordinal measures: difference with the
mean or median return in the fund’s mean or median return in the fund’s categorycategory
Cardinal measures: category ranking based Cardinal measures: category ranking based on return/on return/αα/…/…
Drawbacks:Drawbacks:– There may be substantial differences in risk There may be substantial differences in risk
within the categorywithin the category– Survivor biasSurvivor bias– Bad incentives to managers (as in a Bad incentives to managers (as in a
tournament)tournament)
EFM 2004/05EFM 2004/05 1414
РЭШ
How to measure How to measure performance performance persistence?persistence? Contingency tables:Contingency tables:
– Sort funds by past and current performanceSort funds by past and current performance E.g., 2x2 (above/below median): winner-winner, WL, E.g., 2x2 (above/below median): winner-winner, WL,
LW, LLLW, LL– Check whether actual frequencies are far from Check whether actual frequencies are far from
those under the nullthose under the null Examine zero-investment portfolios formed on Examine zero-investment portfolios formed on
the basis of the basis of past performancepast performance– Sort funds into deciles by last-year returnSort funds into deciles by last-year return– Test whether top-bottom portfolio has premium Test whether top-bottom portfolio has premium
unexplained by factor modelsunexplained by factor models Cross-sectional regressions of current Cross-sectional regressions of current
performance on past performanceperformance on past performance
EFM 2004/05EFM 2004/05 1515
РЭШ
Need to control forNeed to control for
Fund attritionFund attrition– Survivor biasSurvivor bias
Cross-correlation in fund returnsCross-correlation in fund returns– Fewer degrees of freedom will make Fewer degrees of freedom will make
s.e. largers.e. larger The measurement error (and The measurement error (and
mean reversion)mean reversion)– If measure both current and past If measure both current and past
performance in the same wayperformance in the same way
EFM 2004/05EFM 2004/05 1616
РЭШ
Brown and GoetzmannBrown and Goetzmann (1995)(1995)
"Mutual fund performance "Mutual fund performance persistencepersistence""
Explore MF performance Explore MF performance persistencepersistence– Absolute vs relative benchmarksAbsolute vs relative benchmarks– Explicitly model survivor biasExplicitly model survivor bias– Disaggregate on the annual basisDisaggregate on the annual basis
EFM 2004/05EFM 2004/05 1717
РЭШ
DataData
Common stock funds in 1976-Common stock funds in 1976-19881988– Including dead fundsIncluding dead funds– Monthly return dataMonthly return data
Table 1Table 1– # funds: 372 in 1976, 829 in 1988# funds: 372 in 1976, 829 in 1988– Total assets rose more than 4 timesTotal assets rose more than 4 times– MaxCap category became relatively MaxCap category became relatively
less popularless popular
EFM 2004/05EFM 2004/05 1818
РЭШ
Average performanceAverage performance
Table 2Table 2– VW mean MF return is below VW mean MF return is below
S&P500 return by 0.4% p.a., though S&P500 return by 0.4% p.a., though above index fundabove index fund
– Dead funds heavily underperform Dead funds heavily underperform living fundsliving funds
– EW means exceed VW meansEW means exceed VW means
EFM 2004/05EFM 2004/05 1919
РЭШ
Fund disappearanceFund disappearance
Disappearance: termination or Disappearance: termination or merging into another fundmerging into another fund
Table 3, determinants of Table 3, determinants of prob(death)prob(death)– Lagged relative return: -Lagged relative return: -– Lagged relative new money: -Lagged relative new money: -
But insignificant in presence of past But insignificant in presence of past performanceperformance
– Relative size: -Relative size: -– Expense ratio: +Expense ratio: +– Age: -Age: -
EFM 2004/05EFM 2004/05 2020
РЭШ
Performance Performance persistencepersistence Contingency tables:Contingency tables:
– Sort funds by performance over the Sort funds by performance over the last year and the current yearlast year and the current year
– Winner/loser = above/below Winner/loser = above/below median, 2x2 matrixmedian, 2x2 matrix
– Cross-product ratio: Cross-product ratio: (WW*LL)/(WL*LW)=1 under the (WW*LL)/(WL*LW)=1 under the nullnull
EFM 2004/05EFM 2004/05 2121
РЭШ
Bootstrapping Bootstrapping procedureprocedure Necessary to control for fund Necessary to control for fund
attrition and cross-correlation:attrition and cross-correlation:– Use de-meaned sample of fund Use de-meaned sample of fund
monthly returns in 1987-88monthly returns in 1987-88– For each year, select N funds without For each year, select N funds without
replacement and randomize over timereplacement and randomize over time– Assume that poorest performers after Assume that poorest performers after
the first year are eliminatedthe first year are eliminated– Repeat 100 timesRepeat 100 times
EFM 2004/05EFM 2004/05 2222
РЭШ
Results Results
Table 4, odds ratio test for raw Table 4, odds ratio test for raw returns relative to medianreturns relative to median– 7 years: significant positive 7 years: significant positive
persistencepersistence– 2 years: significant negative 2 years: significant negative
persistencepersistence
EFM 2004/05EFM 2004/05 2323
РЭШ
Controlling for Controlling for differences in systematic differences in systematic riskrisk Use several risk-adjusted Use several risk-adjusted
performance measures:performance measures:– Jensen’s alpha from the market modelJensen’s alpha from the market model– One-index / three-index appraisal ratioOne-index / three-index appraisal ratio– Style-adjusted returnStyle-adjusted return
Table 6, odds ratio test for risk-Table 6, odds ratio test for risk-adjusted returns relative to medianadjusted returns relative to median– Similar results: 5-7 years +, 2 years - Similar results: 5-7 years +, 2 years -
persistencepersistence
EFM 2004/05EFM 2004/05 2424
РЭШ
Absolute benchmarksAbsolute benchmarks
Figure 1, frequencies of repeat Figure 1, frequencies of repeat losers and winners wrt S&P500losers and winners wrt S&P500– Repeat-losers dominate in the Repeat-losers dominate in the
second half of the sample periodsecond half of the sample period Table 6, odds ratio test for Table 6, odds ratio test for
alpha relative to 0alpha relative to 0– 5 years +, 2 years - persistence5 years +, 2 years - persistence
EFM 2004/05EFM 2004/05 2525
РЭШ
Investment Investment implicationsimplications Table 7, performance of last-year Table 7, performance of last-year
return octile portfoliosreturn octile portfolios– Past winners perform better than past Past winners perform better than past
loserslosers Winner-loser portfolio generates significant Winner-loser portfolio generates significant
performanceperformance
– Idiosyncratic risk is the highest for past Idiosyncratic risk is the highest for past winnerswinners
Winner-loser portfolio return is mostly due Winner-loser portfolio return is mostly due to bad performance of persistent losersto bad performance of persistent losers
EFM 2004/05EFM 2004/05 2626
РЭШ
ConclusionsConclusions
Past performance is the strongest Past performance is the strongest predictor of fund attritionpredictor of fund attrition
Clear evidence of relative Clear evidence of relative performance persistenceperformance persistence
Performance persistence is strongly Performance persistence is strongly dependent on the time perioddependent on the time period
Need to find common mgt strategies Need to find common mgt strategies explaining persistence and reversalsexplaining persistence and reversals– Additional risk factor(s)Additional risk factor(s)– Conditional approachConditional approach
EFM 2004/05EFM 2004/05 2727
РЭШ
ConclusionsConclusions (cont.)(cont.)
Chasing the winners is a risky Chasing the winners is a risky strategystrategy
Selling the losers makes senseSelling the losers makes sense– Why don’t all shareholders of poorly Why don’t all shareholders of poorly
performing funds leave?performing funds leave? Disadvantaged clienteleDisadvantaged clientele
– Arbitrageurs can’t short-sell losing Arbitrageurs can’t short-sell losing MFs!MFs!
EFM 2004/05EFM 2004/05 2828
РЭШ
Carpenter and Lynch Carpenter and Lynch (1999(1999)) ““Survivorship bias and attrition Survivorship bias and attrition
effects in measures of effects in measures of performance persistenceperformance persistence””
Simulation analysis of survivor bias in Simulation analysis of survivor bias in presence of heteroscedasticity in presence of heteroscedasticity in performanceperformance
When attrition depends When attrition depends – only on last-year performance: spurious only on last-year performance: spurious
performance persistence magnifiedperformance persistence magnified– on performance over several years: reversal in on performance over several years: reversal in
performance performance Look-ahead biasLook-ahead bias
EFM 2004/05EFM 2004/05 2929
РЭШ
Carhart (1997)Carhart (1997)
""On persistence in mutual fund On persistence in mutual fund performanceperformance""
Survivor-bias free sampleSurvivor-bias free sample Examine portfolios ranked by lagged 1-year Examine portfolios ranked by lagged 1-year
returnreturn– The four-factor model: RMRF, SMB, HML, and 1-The four-factor model: RMRF, SMB, HML, and 1-
year momentum…year momentum…– Explains most of the return unexplained by Explains most of the return unexplained by
CAPM…CAPM…– Except for underperformance of the worst fundsExcept for underperformance of the worst funds
Fama-MacBeth cross-sectional regressions of Fama-MacBeth cross-sectional regressions of alphas on current fund characteristics:alphas on current fund characteristics:– Expense ratio, turnover, and load: negative effectExpense ratio, turnover, and load: negative effect

Conditional Conditional performance performance evaluationevaluation

EFM 2004/05EFM 2004/05 3131
РЭШ
Plan for todayPlan for today
Up to now:Up to now:– Average performanceAverage performance
Jensen’s alpha: selection abilityJensen’s alpha: selection ability
– Differential performanceDifferential performance Performance persistencePerformance persistence
Today: Today: – Conditional approach to performance Conditional approach to performance
evaluationevaluation Timing abilityTiming ability Use dynamic strategies based on public info as a Use dynamic strategies based on public info as a
benchmarkbenchmark
EFM 2004/05EFM 2004/05 3232
РЭШ
Problems with the Problems with the unconditional unconditional approachapproach The market model (with excess The market model (with excess
returns):returns):
rri,ti,t = = ααii + + ββiirrM,tM,t + + εεi,ti,t
– What if β is correlated with the What if β is correlated with the market return?market return?
– If cov(β, rIf cov(β, rMM)>0, the estimated )>0, the estimated αα is is downward-biased!downward-biased!
How to measure timing ability?How to measure timing ability?
EFM 2004/05EFM 2004/05 3333
РЭШ
Market timing testsMarket timing tests
Assume that βAssume that βtt = β = β00 + γf(R + γf(RMM-R-RFF))
– Treynor-MazuyTreynor-Mazuy: linear function, f(·)=R: linear function, f(·)=RMM-R-RFF
– Merton-HenrikssonMerton-Henriksson: step function, : step function, f(f(··)=I{)=I{RRMM-R-RFF>0}>0}
– γ shows whether fund managers can time γ shows whether fund managers can time the marketthe market
Typical results for an average fundTypical results for an average fund– Negative alpha: no selection abilityNegative alpha: no selection ability– Negative gamma: no timing abilityNegative gamma: no timing ability
EFM 2004/05EFM 2004/05 3434
РЭШ
Problems with Problems with measuring market measuring market timingtiming Benchmark assets may have option-like Benchmark assets may have option-like
characteristicscharacteristics– Gamma is positive/negative for some stocksGamma is positive/negative for some stocks
Managers may have timing ability at Managers may have timing ability at higher horizonhigher horizon– Tests using monthly data have low power of Tests using monthly data have low power of
identifying market timing on a daily basisidentifying market timing on a daily basis Positive covariance between beta and Positive covariance between beta and
market return could result from using market return could result from using public infopublic info
EFM 2004/05EFM 2004/05 3535
РЭШ
Ferson and Schadt Ferson and Schadt (1996)(1996)
"Measuring Fund Strategy and "Measuring Fund Strategy and Performance in Changing Performance in Changing Economic Conditions"Economic Conditions"
Evaluate MF performance using Evaluate MF performance using conditional approachconditional approach– Both selection and timing ability Both selection and timing ability – Use dynamic strategies based on Use dynamic strategies based on
public info as a benchmarkpublic info as a benchmark Consistent with SSFEConsistent with SSFE
EFM 2004/05EFM 2004/05 3636
РЭШ
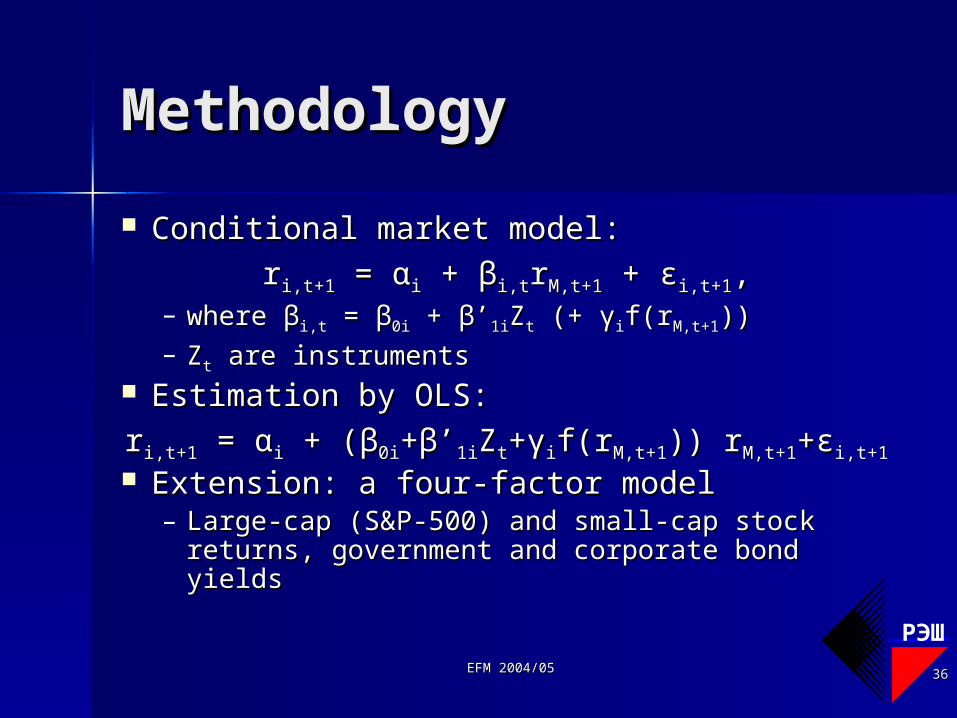
MethodologyMethodology
Conditional market model:Conditional market model:
rri,t+1i,t+1 = = ααii + + ββi,ti,trrM,t+1M,t+1 + + εεi,t+1i,t+1,,– where βwhere βi,ti,t = β = β0i0i + β’ + β’1i1iZZtt (+ γ (+ γiif(rf(rM,t+1M,t+1))))– ZZtt are instruments are instruments
Estimation by OLS: Estimation by OLS:
rri,t+1i,t+1 = = ααii + ( + (ββ0i0i++ββ’’1i1iZZtt++γγiif(rf(rM,t+1M,t+1)) r)) rM,t+1M,t+1++εεi,t+1i,t+1
Extension: a four-factor modelExtension: a four-factor model– Large-cap (S&P-500) and small-cap stock Large-cap (S&P-500) and small-cap stock
returns, government and corporate bond returns, government and corporate bond yieldsyields
EFM 2004/05EFM 2004/05 3737
РЭШ
DataData
Monthly returns of 67 (mostly equity) Monthly returns of 67 (mostly equity) funds in 1968-1990funds in 1968-1990
Instruments (lagged, mean-adjusted):Instruments (lagged, mean-adjusted):– 30-day T-bill rate30-day T-bill rate– Dividend yieldDividend yield– Term spreadTerm spread– Default spreadDefault spread– January dummyJanuary dummy
EFM 2004/05EFM 2004/05 3838
РЭШ
ResultsResults
Table 2, conditional vs Table 2, conditional vs unconditional CAPMunconditional CAPM– Market betas are related to Market betas are related to
conditional informationconditional information 30-day T-bill rate, dividend yield, 30-day T-bill rate, dividend yield,
and term spread are significantand term spread are significant– Conditional alphas are higher Conditional alphas are higher
than the unconditional onesthan the unconditional ones
EFM 2004/05EFM 2004/05 3939
РЭШ
Results (cont.)Results (cont.)
Table 3, cross-sectional distribution Table 3, cross-sectional distribution of t-stats for cond. and uncond. of t-stats for cond. and uncond. alphasalphas– Unconditional approach: there are Unconditional approach: there are
more significantly negative alphas more significantly negative alphas – Conditional approach: # significantly Conditional approach: # significantly
negative / positive alphas is similarnegative / positive alphas is similar– Very similar results for one-factor and Very similar results for one-factor and
four-factor modelsfour-factor models
EFM 2004/05EFM 2004/05 4040
РЭШ
Results (cont.)Results (cont.)
Table 4, conditional vs unconditional Table 4, conditional vs unconditional market timing model for naïve strategiesmarket timing model for naïve strategies– Naïve strategies:Naïve strategies:
Start with 65% large-cap, 13% small-cap, 20% gvt Start with 65% large-cap, 13% small-cap, 20% gvt bonds, 2% corporate bonds weightsbonds, 2% corporate bonds weights
Then: buy-and-hold / annual rebalancing / fixed Then: buy-and-hold / annual rebalancing / fixed weightsweights
– Unconditional approach: positive alpha and Unconditional approach: positive alpha and negative gamma for buy-and-hold strategynegative gamma for buy-and-hold strategy
Evidence of model misspecificationEvidence of model misspecification
– Conditional approach: insignificant alpha and Conditional approach: insignificant alpha and gammagamma
EFM 2004/05EFM 2004/05 4141
РЭШ
Results (cont.)Results (cont.)
Tables 5-6, conditional vs unconditional Tables 5-6, conditional vs unconditional market timing models for actual datamarket timing models for actual data– Conditional approach: the significance of Conditional approach: the significance of
alpha and gamma disappears for all alpha and gamma disappears for all categories but special (concentrating on intl categories but special (concentrating on intl investments)investments)
Table 7, cross-sectional distribution of Table 7, cross-sectional distribution of t-stats for cond. and uncond. gammast-stats for cond. and uncond. gammas– Fewer (significantly) negative gammas Fewer (significantly) negative gammas
under the conditional approachunder the conditional approach– More (significantly) positive gammas under More (significantly) positive gammas under
the conditional approach, esp. for TM modelthe conditional approach, esp. for TM model
EFM 2004/05EFM 2004/05 4242
РЭШ
Interpretation of the Interpretation of the resultsresults Dynamic strategies based on instruments Dynamic strategies based on instruments
contribute negatively to fund returnscontribute negatively to fund returns Is it the active policy or mechanical Is it the active policy or mechanical
effects?effects?– The underlying assets may have gammas The underlying assets may have gammas
different from zerodifferent from zero Yet, we do not observe similar (α,β,γ) patters for Yet, we do not observe similar (α,β,γ) patters for
the buy-and-hold portfoliothe buy-and-hold portfolio
– New money flows to funds increase their cash New money flows to funds increase their cash holdings and lower betasholdings and lower betas
Edelen (1999): liquidity-motivated trading lowers Edelen (1999): liquidity-motivated trading lowers both alpha and gammaboth alpha and gamma
EFM 2004/05EFM 2004/05 4343
РЭШ
ConclusionsConclusions
Conditioning on public information:Conditioning on public information:– Provides additional insights about Provides additional insights about
fund strategiesfund strategies– Allows to estimate classical Allows to estimate classical
performance measures more preciselyperformance measures more precisely The average MF performance is no The average MF performance is no
longer inferiorlonger inferior– Both selection and timing abilityBoth selection and timing ability
EFM 2004/05EFM 2004/05 4444
РЭШ
Bollen and Busse Bollen and Busse (2001)(2001)""On the timing ability of mutual fund managersOn the timing ability of mutual fund managers"" Objective: use daily returns in market timing testsObjective: use daily returns in market timing tests
– Much higher power if managers time the market on a Much higher power if managers time the market on a daily basisdaily basis
Traditional tests: Traditional tests: – 40% of funds have positive gamma, 28% have negative 40% of funds have positive gamma, 28% have negative
gammagamma Cf: 33% +, 5% - based on monthly dataCf: 33% +, 5% - based on monthly data
Compare fund gammas with those for synthetic Compare fund gammas with those for synthetic portfolios:portfolios:– 1/3 of funds have positive gamma, 1/3 – negative 1/3 of funds have positive gamma, 1/3 – negative
(relative to synthetic portfolios)(relative to synthetic portfolios)
EFM 2004/05EFM 2004/05 4545
РЭШ
Bollen and Busse Bollen and Busse (2001)(2001)""On the timing ability of mutual fund On the timing ability of mutual fund
managersmanagers"" Using daily returns in market timing testsUsing daily returns in market timing tests
– Much higher power if managers time the Much higher power if managers time the market on a daily basismarket on a daily basis
Traditional tests: Traditional tests: – 40% of funds have 40% of funds have γγ>0, 28% have >0, 28% have γγ<0<0
Cf: 33% +, 5% - based on monthly dataCf: 33% +, 5% - based on monthly data
Compare fund Compare fund γγ’s with those for synthetic ’s with those for synthetic portfolios (portfolios (γγBB):):– 1/3 of funds have 1/3 of funds have γγ>>γγBB, 1/3 have , 1/3 have γγ<<γγBB

Strategic Strategic behaviorbehavior
EFM 2004/05EFM 2004/05 4747
РЭШ
Plan for todayPlan for today
Up to now:Up to now:– Average performanceAverage performance
Selection vs timing abilitySelection vs timing ability Unconditional vs conditionalUnconditional vs conditional
– Differential performanceDifferential performance Performance persistencePerformance persistence
Today: Today: – Strategic behavior of fund managersStrategic behavior of fund managers
Choice of risk in the annual tournamentsChoice of risk in the annual tournaments
EFM 2004/05EFM 2004/05 4848
РЭШ
The objective function The objective function of MF managerof MF manager Career concernsCareer concerns
– High (low) performance leads to promotion High (low) performance leads to promotion (dismissal)(dismissal)
– High risk increases the probability of dismissalHigh risk increases the probability of dismissal CompensationCompensation
– Usually proportional to the fund’s size (and flows)Usually proportional to the fund’s size (and flows)– Convex relation between flows and performance Convex relation between flows and performance
gives strong incentives to win the MF tournamentgives strong incentives to win the MF tournament Calendar-year performance is esp importantCalendar-year performance is esp important
– Managers are usually evaluated at the end of the Managers are usually evaluated at the end of the yearyear
– Investors pay more attention to calendar yearInvestors pay more attention to calendar year performance performance
EFM 2004/05EFM 2004/05 4949
РЭШ
Chevalier and Ellison Chevalier and Ellison (1997)(1997)""Risk Taking by Mutual Funds as a Risk Taking by Mutual Funds as a
Response to IncentivesResponse to Incentives"" Estimate the shape of the flow-Estimate the shape of the flow-
performance relationshipperformance relationship– Separately for young and old fundsSeparately for young and old funds
Estimate resulting risk-taking Estimate resulting risk-taking incentivesincentives
Examine the actual change in Examine the actual change in riskiness of funds’ portfoliosriskiness of funds’ portfolios– On the basis of portfolio holdings in On the basis of portfolio holdings in
September and DecemberSeptember and December
EFM 2004/05EFM 2004/05 5050
РЭШ
DataData
449 growth and growth&income funds in 449 growth and growth&income funds in 1982-921982-92– Monthly returnsMonthly returns– Annual TNAAnnual TNA– Portfolio holdings in September and DecemberPortfolio holdings in September and December
About 92% of the portfolio matched to CRSP dataAbout 92% of the portfolio matched to CRSP data
Excluding index, closed, primarily Excluding index, closed, primarily institutional, merged in the current year, institutional, merged in the current year, high expense ratio (>4%), smallest high expense ratio (>4%), smallest (TNA<$10 mln) and youngest (age < 2y) (TNA<$10 mln) and youngest (age < 2y) fundsfunds
EFM 2004/05EFM 2004/05 5151
РЭШ
The flow-performance The flow-performance relationshiprelationship FlowFlowtt = ΔTNA = ΔTNAtt/TNA/TNAt-1t-1 – R – Rtt
– Net relative growth in fund’s assetsNet relative growth in fund’s assets Semi-parametric regression of annual flows on Semi-parametric regression of annual flows on
last-year market-adjusted returns:last-year market-adjusted returns:
FlowFlowi,t+1i,t+1=Σ=ΣkkγγkkAgeDAgeDkkf(Rf(Ri,ti,t-R-RM,tM,t)+Σ)+ΣkkδδkkAgeDAgeDkk++αα11(R(Ri,t-1i,t-1--RRM,t-1M,t-1) +) +αα22(R(Ri,t-2i,t-2-R-RM,t-M,t-
22)+)+αα44IndFlowIndFlowi,t+1i,t+1++αα55ln(TNA)ln(TNA)i,ti,t++εεi,t+1i,t+1
– f(Rf(Ri,ti,t-R-RM,tM,t) is a non-parametric function estimated ) is a non-parametric function estimated separately for young (2-5y) and old funds separately for young (2-5y) and old funds
– AgeDAgeDkk are dummy variables for various age categories are dummy variables for various age categories– Fund’s size and growth in total TNA of equity funds Fund’s size and growth in total TNA of equity funds
are controlsare controls
EFM 2004/05EFM 2004/05 5252
РЭШ
ResultsResults
Figures 1-2, Table 2: flow-Figures 1-2, Table 2: flow-performance relationship for young performance relationship for young and old fundsand old funds– Generally convex shapeGenerally convex shape
Linearity is rejected, esp for old fundsLinearity is rejected, esp for old funds
– The sensitivity of flows to performance is The sensitivity of flows to performance is higher for young fundshigher for young funds
– Flows rise with lagged performance up to Flows rise with lagged performance up to 3 years, current category flows and fall 3 years, current category flows and fall with sizewith size
EFM 2004/05EFM 2004/05 5353
РЭШ
Estimation of risk-Estimation of risk-taking incentivestaking incentives Assume:Assume:
– Fees are proportional to the fund’s assetsFees are proportional to the fund’s assets– Flows occur at the end of the yearFlows occur at the end of the year– No agency problems between MF companies and No agency problems between MF companies and
their managers their managers In September of year t+1, the increase in In September of year t+1, the increase in
expected end-of-year flow due to a change in expected end-of-year flow due to a change in nonsystematic risk in the last-quarter return:nonsystematic risk in the last-quarter return:
hhkk(r(rsepsep, , σσ, , ΔσΔσ)=E[)=E[γγkk(f(R(f(Rsepsep++uu)-f(R)-f(Rsepsep++vv))]))]– After increasing nonsystematic risk by After increasing nonsystematic risk by ΔσΔσ, the last-, the last-
quarter return distribution changes from quarter return distribution changes from uu to to vv– Take Take ΔσΔσ=0.5=0.5σσ
EFM 2004/05EFM 2004/05 5454
РЭШ
ResultsResults
Figure 3, risk incentives for 2y Figure 3, risk incentives for 2y and 11y fundsand 11y funds– Young funds with high (low) interim Young funds with high (low) interim
performance have an incentive to performance have an incentive to decrease (increase) risk to lock up decrease (increase) risk to lock up the winning position (catch up with the winning position (catch up with top funds)top funds) The risk incentives are reversed at the The risk incentives are reversed at the
extreme performanceextreme performance
– Insignificant pattern for old fundsInsignificant pattern for old funds
EFM 2004/05EFM 2004/05 5555
РЭШ
Actual risk-taking in Actual risk-taking in response to estimated response to estimated risk incentivesrisk incentives Cross-sectional regressions of Cross-sectional regressions of
within-year change in risk on risk within-year change in risk on risk incentive measureincentive measure
Focus on the equity portion of Focus on the equity portion of funds’ portfolios (on average, funds’ portfolios (on average, about 90%about 90%– Risk measures computed based on Risk measures computed based on
prior-year daily stock dataprior-year daily stock data
EFM 2004/05EFM 2004/05 5656
РЭШ
Actual risk-taking in Actual risk-taking in response to estimated response to estimated risk incentivesrisk incentives Dependent variable: change between Dependent variable: change between
September and December inSeptember and December in– St deviation of the market-adjusted return: St deviation of the market-adjusted return:
ΔΔSD(RSD(Rii-R-RMM))– Unsystematic risk: Unsystematic risk: ΔΔSD(RSD(Rii-β-βiiRRMM))– Systematic risk: Systematic risk: Δ|Δ|ββii-1|-1|
Independent variables:Independent variables:– RiskIncentive: hRiskIncentive: hkk
– Size: ln(TNA)Size: ln(TNA)– RiskIncentive*ln(TNA)RiskIncentive*ln(TNA)– September risk level: to control for mean September risk level: to control for mean
reversionreversion
EFM 2004/05EFM 2004/05 5757
РЭШ
ResultsResults
Table 4Table 4– The higher risk incentives, the The higher risk incentives, the
higher actual change in total and higher actual change in total and unsystematic riskunsystematic risk
– This effect becomes less important This effect becomes less important for larger fundsfor larger funds
– No evidence of mean reversionNo evidence of mean reversion
EFM 2004/05EFM 2004/05 5858
РЭШ
Actual risk-taking in Actual risk-taking in response to interim response to interim performanceperformance Dependent variable: change between Dependent variable: change between
September and December in total riskSeptember and December in total risk Main independent variable:Main independent variable:
– January-September market-adjusted return: January-September market-adjusted return: RRi,sepi,sep-R-RM,sepM,sep
Assume that change in risk is a piecewise Assume that change in risk is a piecewise linear function of interim performancelinear function of interim performance– 2 fitted kink points2 fitted kink points
Estimate separately for young and old Estimate separately for young and old fundsfunds
EFM 2004/05EFM 2004/05 5959
РЭШ
ResultsResults
Table 5, Figure 4Table 5, Figure 4– Generally negative relation between actual Generally negative relation between actual
change in total risk and interim performancechange in total risk and interim performance– Most slopes and kink points are not significantMost slopes and kink points are not significant
Alternative approach to measure total Alternative approach to measure total risk: risk: – Using monthly returns: Using monthly returns: σσ(Oct-Dec)-(Oct-Dec)-σσ(Jan-Sep)(Jan-Sep)
Very noisy, esp for last quarter (only 3 points!)Very noisy, esp for last quarter (only 3 points!)
Table 6, Figure 5Table 6, Figure 5– Generally positive (!) relation between actual Generally positive (!) relation between actual
change in total risk and interim performancechange in total risk and interim performance
EFM 2004/05EFM 2004/05 6060
РЭШ
ConclusionsConclusions
The flow-performance relationship is convexThe flow-performance relationship is convex This generates strategic risk-taking This generates strategic risk-taking
incentives during the yearincentives during the year Mutual funds seem to respond to these Mutual funds seem to respond to these
incentivesincentives The change in fund’s risk (measured via The change in fund’s risk (measured via
portfolio) is negatively related to its interim portfolio) is negatively related to its interim performanceperformance– Though contradictory evidence based on return-Though contradictory evidence based on return-
based approachbased approach
EFM 2004/05EFM 2004/05 6161
РЭШ
Brown, Harlow, and Brown, Harlow, and StarksStarks (1996)(1996)""Of tournaments and temptations: An Of tournaments and temptations: An
analysis if managerial incentives in the analysis if managerial incentives in the MF industryMF industry""
Contingency table approach:Contingency table approach:– Sort funds by mid-year return and within-year Sort funds by mid-year return and within-year
change in total riskchange in total risk Risk-adjustment ratio based on monthly returns: Risk-adjustment ratio based on monthly returns:
σσ(7:12)/(7:12)/σσ(1:6)(1:6)– 2x2 matrix: return/RAR above/below median2x2 matrix: return/RAR above/below median– Each cell should have 25% of funds under the nullEach cell should have 25% of funds under the null
Find 27% frequency of high-return low-RAR Find 27% frequency of high-return low-RAR funds in 1980-1991funds in 1980-1991– Support the tournament hypothesisSupport the tournament hypothesis
EFM 2004/05EFM 2004/05 6262
РЭШ
BusseBusse (2001)(2001)
""Another look at mutual fund Another look at mutual fund tournamentstournaments""
Same contingency table approach Same contingency table approach using daily and monthly datausing daily and monthly data– Disaggregate: annual tournamentsDisaggregate: annual tournaments
Control for cross-correlation and auto-Control for cross-correlation and auto-correlation in fund returnscorrelation in fund returns– Compute p-values from bootstrapCompute p-values from bootstrap
No significant evidence for the No significant evidence for the tournament hypothesis!tournament hypothesis!
EFM 2004/05EFM 2004/05 6363
РЭШ
WermersWermers (2000)(2000)
""MF MF performance: An empirical performance: An empirical decomposition into stock-picking decomposition into stock-picking talent, style, transactions costs, talent, style, transactions costs, and expensesand expenses""
Decompose fund’s return into several Decompose fund’s return into several components to analyze the value of active components to analyze the value of active fund managementfund management– Portfolio-based approach: using portfolio Portfolio-based approach: using portfolio
holdings dataholdings data– Compare to return-based approachCompare to return-based approach
EFM 2004/05EFM 2004/05 6464
РЭШ
MethodologyMethodology
Finding the benchmark: one of 125 Finding the benchmark: one of 125 portfoliosportfolios– In June of each year t, rank stocks by size In June of each year t, rank stocks by size
(current ME) and form 5 quintile portfolios (current ME) and form 5 quintile portfolios – Subdivide each of 5 size portfolios into 5 Subdivide each of 5 size portfolios into 5
portfolios based on BE/ME as of December of portfolios based on BE/ME as of December of t-1t-1
– Subdivide each of 25 size-BM portfolios into 5 Subdivide each of 25 size-BM portfolios into 5 portfolios based on past 12m returnportfolios based on past 12m return
– From July of t to June of t+1, compute monthly From July of t to June of t+1, compute monthly VW returns of 125 portfoliosVW returns of 125 portfolios
EFM 2004/05EFM 2004/05 6565
РЭШ
MethodologyMethodology (cont.)(cont.)
Decomposing fund’s return: R = CS + CT + ASDecomposing fund’s return: R = CS + CT + AS– Characteristic selectivity: CS=Characteristic selectivity: CS=ΣΣjjwwj,t-1j,t-1[R[Rj,tj,t-R-Rtt(b(bj,t-1j,t-1)])]
wwj,t-1j,t-1 is last-quarter weight of stock is last-quarter weight of stock jj in the fund’s portfolio in the fund’s portfolio RRtt(b(bj,t-1j,t-1) is current return on the benchmark ptf matched to ) is current return on the benchmark ptf matched to
stock stock jj in quarter t-1 in quarter t-1 CS measures the fund’s return adjusted for 3 CS measures the fund’s return adjusted for 3
characteristicscharacteristics– Characteristic timing: CT=ΣCharacteristic timing: CT=Σjj[w[wj,t-1j,t-1RRtt(b(bj,t-1j,t-1)-w)-wj,t-5j,t-5RRtt(b(bj,t-j,t-
55)])] CT is higher if the fund increases the factor’s exposure CT is higher if the fund increases the factor’s exposure
when its premium riseswhen its premium rises– Average style: AS=ΣAverage style: AS=Σjjwwj,t-5j,t-5RRtt(b(bj,t-5j,t-5))
AS measures tendency to hold stocks with certain AS measures tendency to hold stocks with certain characteristicscharacteristics
EFM 2004/05EFM 2004/05 6666
РЭШ
MethodologyMethodology (cont.)(cont.)
Comparing with return-based Comparing with return-based approach:approach:– Potentially higher power: no need to Potentially higher power: no need to
estimate factor loadingsestimate factor loadings– But: may be biased due to window-But: may be biased due to window-
dressingdressing– But: only equity portion of fund’s But: only equity portion of fund’s
portfolioportfolio
EFM 2004/05EFM 2004/05 6767
РЭШ
DataData
1788 diversified equity US funds 1788 diversified equity US funds in 1975-94in 1975-94– CRSP: monthly returns, annual CRSP: monthly returns, annual
turnover, expense ratios, and TNAturnover, expense ratios, and TNA– CDA: quarterly portfolio holdings CDA: quarterly portfolio holdings
(only equity portion)(only equity portion)– No survivor biasNo survivor bias
CRSP files of US stocksCRSP files of US stocks
EFM 2004/05EFM 2004/05 6868
РЭШ
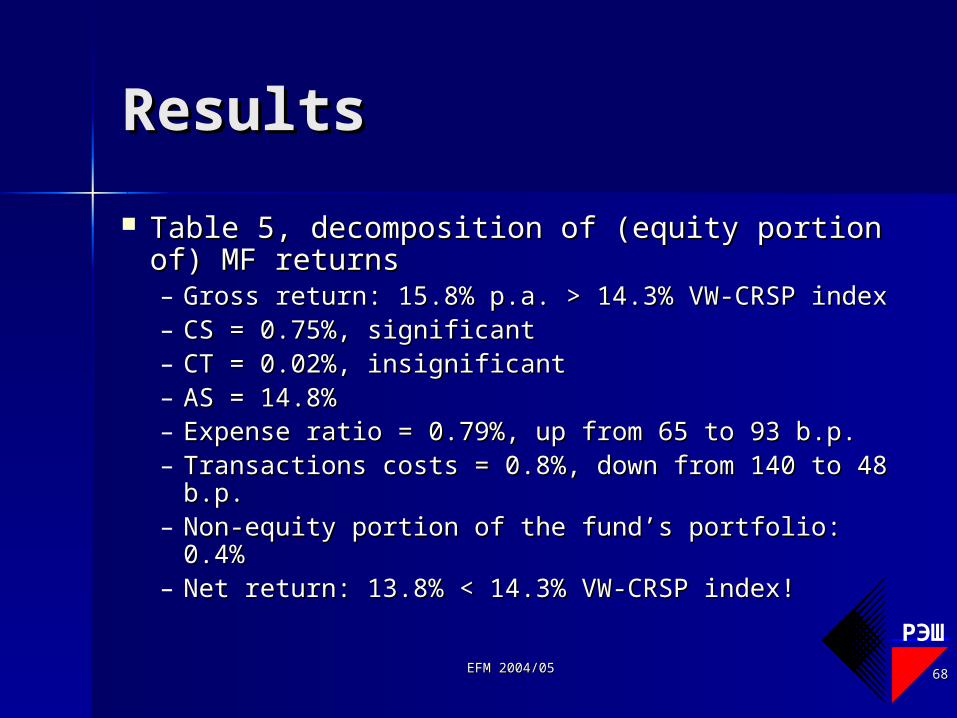
ResultsResults
Table 5, decomposition of (equity portion Table 5, decomposition of (equity portion of) MF returnsof) MF returns– Gross return: 15.8% p.a. > 14.3% VW-CRSP Gross return: 15.8% p.a. > 14.3% VW-CRSP
indexindex– CS = 0.75%, significantCS = 0.75%, significant– CT = 0.02%, insignificantCT = 0.02%, insignificant– AS = 14.8%AS = 14.8%– Expense ratio = 0.79%, up from 65 to 93 b.p.Expense ratio = 0.79%, up from 65 to 93 b.p.– Transactions costs = 0.8%, down from 140 to Transactions costs = 0.8%, down from 140 to
48 b.p.48 b.p.– Non-equity portion of the fund’s portfolio: 0.4%Non-equity portion of the fund’s portfolio: 0.4%– Net return: 13.8% < 14.3% VW-CRSP index!Net return: 13.8% < 14.3% VW-CRSP index!
EFM 2004/05EFM 2004/05 6969
РЭШ
Mutual funds: Mutual funds: summarysummary Many funds hardly follow their stated Many funds hardly follow their stated
objectivesobjectives On average, MFs do not earn positive On average, MFs do not earn positive
performance adjusted for risk and performance adjusted for risk and expensesexpenses
Bad performance persistsBad performance persists Money flows are concentrated among Money flows are concentrated among
funds with best performancefunds with best performance Poorly performing funds are not punished Poorly performing funds are not punished
with large outflowswith large outflows Funds try to win annual tournaments by Funds try to win annual tournaments by
adjusting riskadjusting risk